0 20 40 60 80 100 120 140 160 180 200 220 240 260 280 300 320 340 360 380 400 420 440 460 480 500...
TRANSCRIPT

Chapter 2 Appendices

This page intentionally left blank.

Chapter 2 Appendix A
Cuyama Valley Groundwater Basin Hydrographs

This page intentionally left blank.

020406080100120140160180200220240260280300320340360380400420440460480500520540560580600620640660680700720740
19
59
19
60
19
63
19
64
19
67
19
68
19
71
19
72
19
75
19
76
19
79
19
80
19
83
19
84
19
87
19
88
19
91
19
92
19
95
19
96
19
99
20
00
20
03
20
04
20
07
20
08
20
11
20
12
20
15
20
16
20
19
297029903010303030503070309031103130315031703190321032303250327032903310333033503370339034103430345034703490351035303550357035903610363036503670369037103730
Elev
atio
n (
ft.)
Year
Dep
th t
o W
ater
(ft
.)
OPTI Well 2 HydrographWSE & Depth-to-Water GSE
WSE Min = 3659 ft. WSE Max = 3692 ft. Well Depth = 73 ft.

020406080100120140160180200220240260280300320340360380400420440460480500520540560580600620640660680700720740
19
59
19
60
19
63
19
64
19
67
19
68
19
71
19
72
19
75
19
76
19
79
19
80
19
83
19
84
19
87
19
88
19
91
19
92
19
95
19
96
19
99
20
00
20
03
20
04
20
07
20
08
20
11
20
12
20
15
20
16
20
19
285728772897291729372957297729973017303730573077309731173137315731773197321732373257327732973317333733573377339734173437345734773497351735373557357735973617
Elev
atio
n (
ft.)
Year
Dep
th t
o W
ater
(ft
.)
OPTI Well 3 HydrographWSE & Depth-to-Water GSE
WSE Min = 3602 ft. WSE Max = 3608 ft. Well Depth = 119 ft.

020406080100120140160180200220240260280300320340360380400420440460480500520540560580600620640660680700720740
19
59
19
60
19
63
19
64
19
67
19
68
19
71
19
72
19
75
19
76
19
79
19
80
19
83
19
84
19
87
19
88
19
91
19
92
19
95
19
96
19
99
20
00
20
03
20
04
20
07
20
08
20
11
20
12
20
15
20
16
20
19
290129212941296129813001302130413061308131013121314131613181320132213241326132813301332133413361338134013421344134613481350135213541356135813601362136413661
Elev
atio
n (
ft.)
Year
Dep
th t
o W
ater
(ft
.)
OPTI Well 5 HydrographWSE & Depth-to-Water GSE
WSE Min = 3621 ft. WSE Max = 3638 ft. Well Depth = 114 ft.
020406080100120140160180200220240260280300320340360380400420440460480500520540560580600620640660680700720740
19
59
19
60
19
63
19
64
19
67
19
68
19
71
19
72
19
75
19
76
19
79
19
80
19
83
19
84
19
87
19
88
19
91
19
92
19
95
19
96
19
99
20
00
20
03
20
04
20
07
20
08
20
11
20
12
20
15
20
16
20
19
309231123132315231723192321232323252327232923312333233523372339234123432345234723492351235323552357235923612363236523672369237123732375237723792381238323852
Elev
atio
n (
ft.)
Year
Dep
th t
o W
ater
(ft
.)
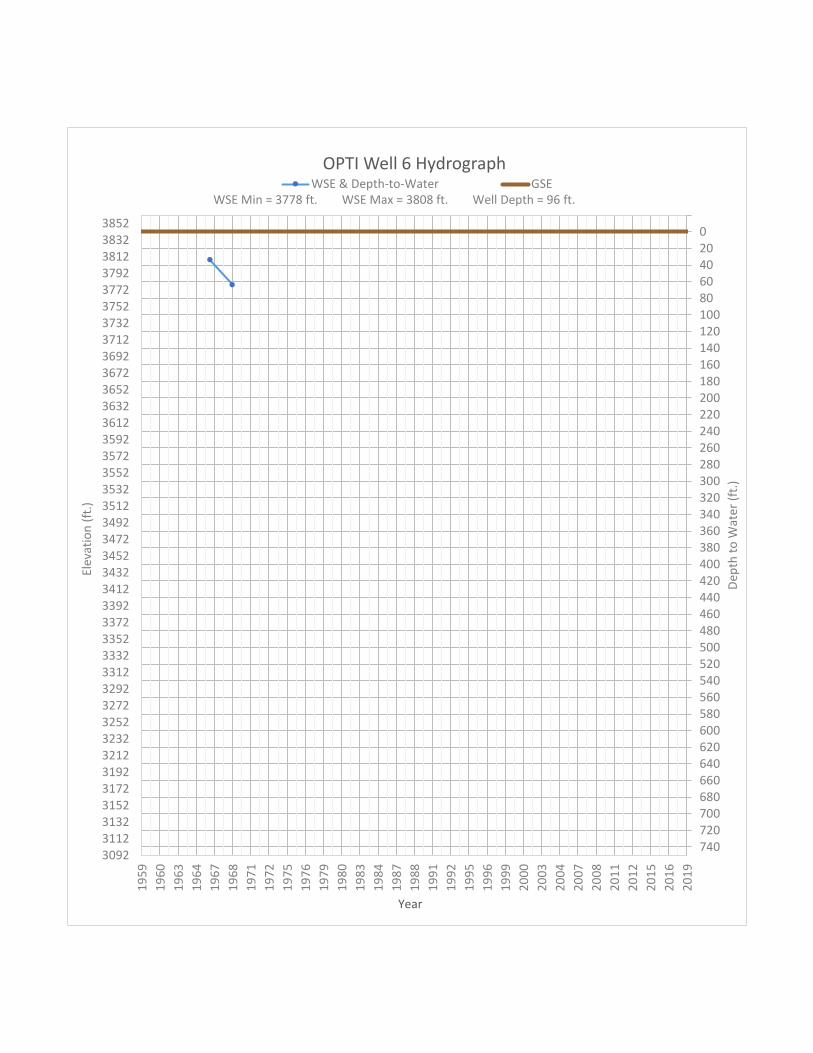
OPTI Well 6 HydrographWSE & Depth-to-Water GSE
WSE Min = 3778 ft. WSE Max = 3808 ft. Well Depth = 96 ft.

020406080100120140160180200220240260280300320340360380400420440460480500520540560580600620640660680700720740
19
59
19
60
19
63
19
64
19
67
19
68
19
71
19
72
19
75
19
76
19
79
19
80
19
83
19
84
19
87
19
88
19
91
19
92
19
95
19
96
19
99
20
00
20
03
20
04
20
07
20
08
20
11
20
12
20
15
20
16
20
19
261426342654267426942714273427542774279428142834285428742894291429342954297429943014303430543074309431143134315431743194321432343254327432943314333433543374
Elev
atio
n (
ft.)
Year
Dep
th t
o W
ater
(ft
.)
OPTI Well 7 HydrographWSE & Depth-to-Water GSE
WSE Min = 3357 ft. WSE Max = 3360 ft. Well Depth = 11 ft.

020406080100120140160180200220240260280300320340360380400420440460480500520540560580600620640660680700720740
19
59
19
60
19
63
19
64
19
67
19
68
19
71
19
72
19
75
19
76
19
79
19
80
19
83
19
84
19
87
19
88
19
91
19
92
19
95
19
96
19
99
20
00
20
03
20
04
20
07
20
08
20
11
20
12
20
15
20
16
20
19
266026802700272027402760278028002820284028602880290029202940296029803000302030403060308031003120314031603180320032203240326032803300332033403360338034003420
Elev
atio
n (
ft.)
Year
Dep
th t
o W
ater
(ft
.)
OPTI Well 8 HydrographWSE & Depth-to-Water GSE
WSE Min = 3329 ft. WSE Max = 3329 ft. Well Depth = 240 ft.

020406080100120140160180200220240260280300320340360380400420440460480500520540560580600620640660680700720740
19
59
19
60
19
63
19
64
19
67
19
68
19
71
19
72
19
75
19
76
19
79
19
80
19
83
19
84
19
87
19
88
19
91
19
92
19
95
19
96
19
99
20
00
20
03
20
04
20
07
20
08
20
11
20
12
20
15
20
16
20
19
270727272747276727872807282728472867288729072927294729672987300730273047306730873107312731473167318732073227324732673287330733273347336733873407342734473467
Elev
atio
n (
ft.)
Year
Dep
th t
o W
ater
(ft
.)
OPTI Well 9 HydrographWSE & Depth-to-Water GSE
WSE Min = 3450 ft. WSE Max = 3450 ft. Well Depth = 50 ft.

020406080100120140160180200220240260280300320340360380400420440460480500520540560580600620640660680700720740
19
59
19
60
19
63
19
64
19
67
19
68
19
71
19
72
19
75
19
76
19
79
19
80
19
83
19
84
19
87
19
88
19
91
19
92
19
95
19
96
19
99
20
00
20
03
20
04
20
07
20
08
20
11
20
12
20
15
20
16
20
19
277627962816283628562876289629162936295629762996301630363056307630963116313631563176319632163236325632763296331633363356337633963416343634563476349635163536
Elev
atio
n (
ft.)
Year
Dep
th t
o W
ater
(ft
.)
OPTI Well 10 HydrographWSE & Depth-to-Water GSE
WSE Min = 3502 ft. WSE Max = 3502 ft. Well Depth = 269 ft.

020406080100120140160180200220240260280300320340360380400420440460480500520540560580600620640660680700720740
19
59
19
60
19
63
19
64
19
67
19
68
19
71
19
72
19
75
19
76
19
79
19
80
19
83
19
84
19
87
19
88
19
91
19
92
19
95
19
96
19
99
20
00
20
03
20
04
20
07
20
08
20
11
20
12
20
15
20
16
20
19
271627362756277627962816283628562876289629162936295629762996301630363056307630963116313631563176319632163236325632763296331633363356337633963416343634563476
Elev
atio
n (
ft.)
Year
Dep
th t
o W
ater
(ft
.)
OPTI Well 11 HydrographWSE & Depth-to-Water GSE
WSE Min = 3401 ft. WSE Max = 3448 ft. Well Depth = 8 ft.

020406080100120140160180200220240260280300320340360380400420440460480500520540560580600620640660680700720740
19
59
19
60
19
63
19
64
19
67
19
68
19
71
19
72
19
75
19
76
19
79
19
80
19
83
19
84
19
87
19
88
19
91
19
92
19
95
19
96
19
99
20
00
20
03
20
04
20
07
20
08
20
11
20
12
20
15
20
16
20
19
322732473267328733073327334733673387340734273447346734873507352735473567358736073627364736673687370737273747376737873807382738473867388739073927394739673987
Elev
atio
n (
ft.)
Year
Dep
th t
o W
ater
(ft
.)
OPTI Well 13 HydrographWSE & Depth-to-Water GSE
WSE Min = 3960 ft. WSE Max = 3960 ft. Well Depth = 42 ft.
020406080100120140160180200220240260280300320340360380400420440460480500520540560580600620640660680700720740
19
59
19
60
19
63
19
64
19
67
19
68
19
71
19
72
19
75
19
76
19
79
19
80
19
83
19
84
19
87
19
88
19
91
19
92
19
95
19
96
19
99
20
00
20
03
20
04
20
07
20
08
20
11
20
12
20
15
20
16
20
19
230523252345236523852405242524452465248525052525254525652585260526252645266526852705272527452765278528052825284528652885290529252945296529853005302530453065
Elev
atio
n (
ft.)
Year
Dep
th t
o W
ater
(ft
.)
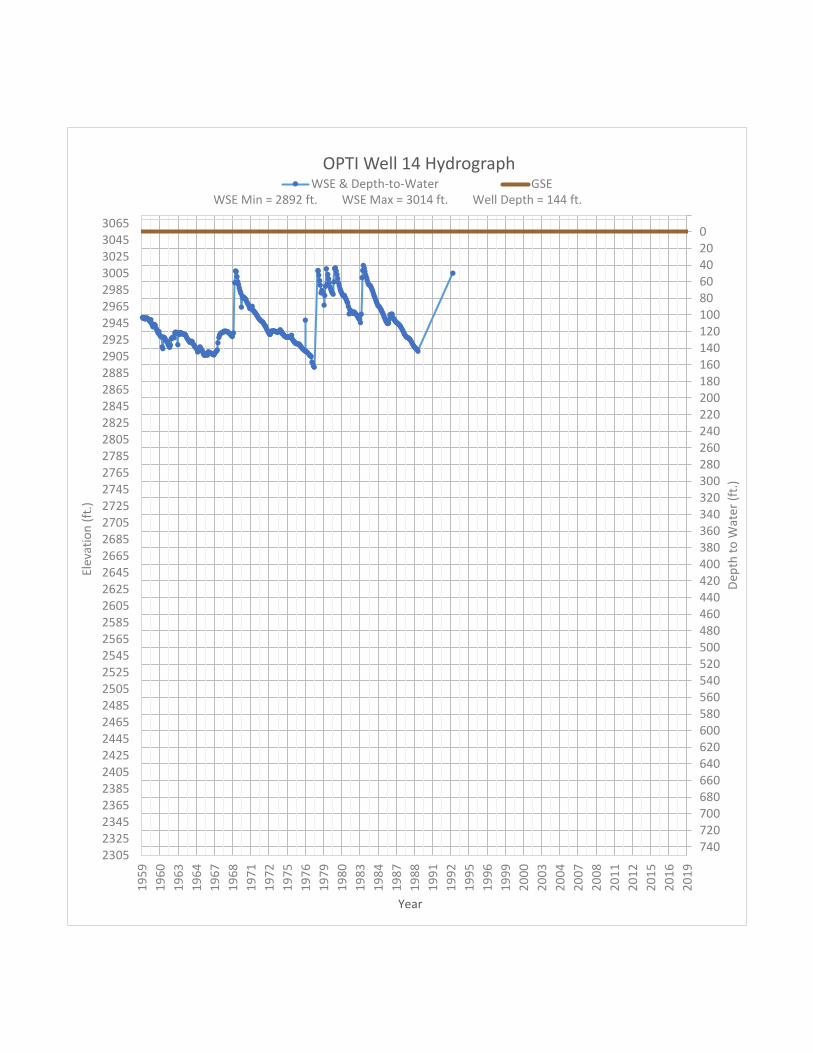
OPTI Well 14 HydrographWSE & Depth-to-Water GSE
WSE Min = 2892 ft. WSE Max = 3014 ft. Well Depth = 144 ft.

020406080100120140160180200220240260280300320340360380400420440460480500520540560580600620640660680700720740
19
59
19
60
19
63
19
64
19
67
19
68
19
71
19
72
19
75
19
76
19
79
19
80
19
83
19
84
19
87
19
88
19
91
19
92
19
95
19
96
19
99
20
00
20
03
20
04
20
07
20
08
20
11
20
12
20
15
20
16
20
19
224122612281230123212341236123812401242124412461248125012521254125612581260126212641266126812701272127412761278128012821284128612881290129212941296129813001
Elev
atio
n (
ft.)
Year
Dep
th t
o W
ater
(ft
.)
OPTI Well 17 HydrographWSE & Depth-to-Water GSE
WSE Min = 2846 ft. WSE Max = 2877 ft. Well Depth = 161 ft.

020406080100120140160180200220240260280300320340360380400420440460480500520540560580600620640660680700720740
19
59
19
60
19
63
19
64
19
67
19
68
19
71
19
72
19
75
19
76
19
79
19
80
19
83
19
84
19
87
19
88
19
91
19
92
19
95
19
96
19
99
20
00
20
03
20
04
20
07
20
08
20
11
20
12
20
15
20
16
20
19
112511451165118512051225124512651285130513251345136513851405142514451465148515051525154515651585160516251645166516851705172517451765178518051825184518651885
Elev
atio
n (
ft.)
Year
Dep
th t
o W
ater
(ft
.)
OPTI Well 18 HydrographWSE & Depth-to-Water GSE
WSE Min = 1838 ft. WSE Max = 1862 ft. Well Depth = 63 ft.

020406080100120140160180200220240260280300320340360380400420440460480500520540560580600620640660680700720740
19
59
19
60
19
63
19
64
19
67
19
68
19
71
19
72
19
75
19
76
19
79
19
80
19
83
19
84
19
87
19
88
19
91
19
92
19
95
19
96
19
99
20
00
20
03
20
04
20
07
20
08
20
11
20
12
20
15
20
16
20
19
962982
1002102210421062108211021122114211621182120212221242126212821302132213421362138214021422144214621482150215221542156215821602162216421662168217021722
Elev
atio
n (
ft.)
Year
Dep
th t
o W
ater
(ft
.)
OPTI Well 19 HydrographWSE & Depth-to-Water GSE
WSE Min = 1681 ft. WSE Max = 1682 ft. Well Depth = Unknown ft.

020406080100120140160180200220240260280300320340360380400420440460480500520540560580600620640660680700720740
19
59
19
60
19
63
19
64
19
67
19
68
19
71
19
72
19
75
19
76
19
79
19
80
19
83
19
84
19
87
19
88
19
91
19
92
19
95
19
96
19
99
20
00
20
03
20
04
20
07
20
08
20
11
20
12
20
15
20
16
20
19
100110211041106110811101112111411161118112011221124112611281130113211341136113811401142114411461148115011521154115611581160116211641166116811701172117411761
Elev
atio
n (
ft.)
Year
Dep
th t
o W
ater
(ft
.)
OPTI Well 20 HydrographWSE & Depth-to-Water GSE
WSE Min = 1711 ft. WSE Max = 1711 ft. Well Depth = 56 ft.

020406080100120140160180200220240260280300320340360380400420440460480500520540560580600620640660680700720740
19
59
19
60
19
63
19
64
19
67
19
68
19
71
19
72
19
75
19
76
19
79
19
80
19
83
19
84
19
87
19
88
19
91
19
92
19
95
19
96
19
99
20
00
20
03
20
04
20
07
20
08
20
11
20
12
20
15
20
16
20
19
214321632183220322232243226322832303232323432363238324032423244324632483250325232543256325832603262326432663268327032723274327632783280328232843286328832903
Elev
atio
n (
ft.)
Year
Dep
th t
o W
ater
(ft
.)
OPTI Well 21 HydrographWSE & Depth-to-Water GSE
WSE Min = 2795 ft. WSE Max = 2796 ft. Well Depth = 103 ft.

020406080100120140160180200220240260280300320340360380400420440460480500520540560580600620640660680700720740
19
59
19
60
19
63
19
64
19
67
19
68
19
71
19
72
19
75
19
76
19
79
19
80
19
83
19
84
19
87
19
88
19
91
19
92
19
95
19
96
19
99
20
00
20
03
20
04
20
07
20
08
20
11
20
12
20
15
20
16
20
19
209621162136215621762196221622362256227622962316233623562376239624162436245624762496251625362556257625962616263626562676269627162736275627762796281628362856
Elev
atio
n (
ft.)
Year
Dep
th t
o W
ater
(ft
.)
OPTI Well 22 HydrographWSE & Depth-to-Water GSE
WSE Min = 2796 ft. WSE Max = 2797 ft. Well Depth = 99 ft.

020406080100120140160180200220240260280300320340360380400420440460480500520540560580600620640660680700720740
19
59
19
60
19
63
19
64
19
67
19
68
19
71
19
72
19
75
19
76
19
79
19
80
19
83
19
84
19
87
19
88
19
91
19
92
19
95
19
96
19
99
20
00
20
03
20
04
20
07
20
08
20
11
20
12
20
15
20
16
20
19
168717071727174717671787180718271847186718871907192719471967198720072027204720672087210721272147216721872207222722472267228723072327234723672387240724272447
Elev
atio
n (
ft.)
Year
Dep
th t
o W
ater
(ft
.)
OPTI Well 23 HydrographWSE & Depth-to-Water GSE
WSE Min = 2214 ft. WSE Max = 2256 ft. Well Depth = 454 ft.

020406080100120140160180200220240260280300320340360380400420440460480500520540560580600620640660680700720740
19
59
19
60
19
63
19
64
19
67
19
68
19
71
19
72
19
75
19
76
19
79
19
80
19
83
19
84
19
87
19
88
19
91
19
92
19
95
19
96
19
99
20
00
20
03
20
04
20
07
20
08
20
11
20
12
20
15
20
16
20
19
161116311651167116911711173117511771179118111831185118711891191119311951197119912011203120512071209121112131215121712191221122312251227122912311233123512371
Elev
atio
n (
ft.)
Year
Dep
th t
o W
ater
(ft
.)
OPTI Well 24 HydrographWSE & Depth-to-Water GSE
WSE Min = 2191 ft. WSE Max = 2245 ft. Well Depth = 194 ft.
020406080100120140160180200220240260280300320340360380400420440460480500520540560580600620640660680700720740
19
59
19
60
19
63
19
64
19
67
19
68
19
71
19
72
19
75
19
76
19
79
19
80
19
83
19
84
19
87
19
88
19
91
19
92
19
95
19
96
19
99
20
00
20
03
20
04
20
07
20
08
20
11
20
12
20
15
20
16
20
19
155415741594161416341654167416941714173417541774179418141834185418741894191419341954197419942014203420542074209421142134215421742194221422342254227422942314
Elev
atio
n (
ft.)
Year
Dep
th t
o W
ater
(ft
.)
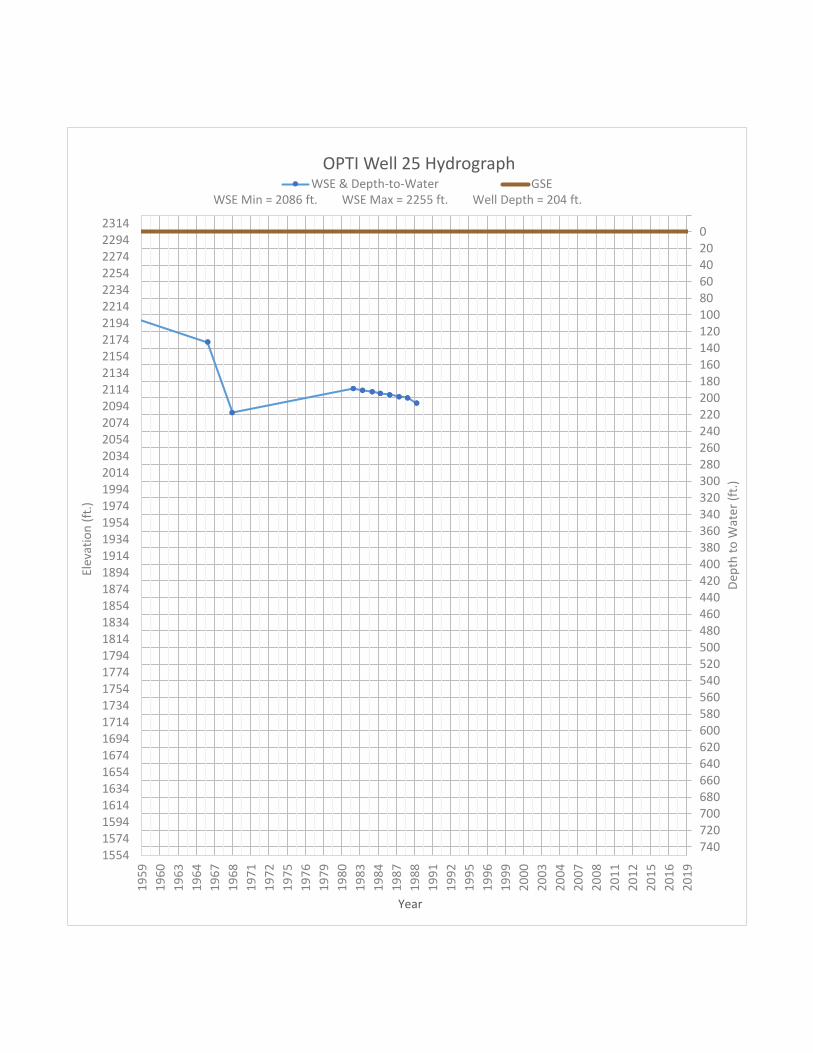
OPTI Well 25 HydrographWSE & Depth-to-Water GSE
WSE Min = 2086 ft. WSE Max = 2255 ft. Well Depth = 204 ft.

020406080100120140160180200220240260280300320340360380400420440460480500520540560580600620640660680700720740
19
59
19
60
19
63
19
64
19
67
19
68
19
71
19
72
19
75
19
76
19
79
19
80
19
83
19
84
19
87
19
88
19
91
19
92
19
95
19
96
19
99
20
00
20
03
20
04
20
07
20
08
20
11
20
12
20
15
20
16
20
19
158916091629164916691689170917291749176917891809182918491869188919091929194919691989200920292049206920892109212921492169218922092229224922692289230923292349
Elev
atio
n (
ft.)
Year
Dep
th t
o W
ater
(ft
.)
OPTI Well 26 HydrographWSE & Depth-to-Water GSE
WSE Min = 1982 ft. WSE Max = 2280 ft. Well Depth = 656 ft.

020406080100120140160180200220240260280300320340360380400420440460480500520540560580600620640660680700720740
19
59
19
60
19
63
19
64
19
67
19
68
19
71
19
72
19
75
19
76
19
79
19
80
19
83
19
84
19
87
19
88
19
91
19
92
19
95
19
96
19
99
20
00
20
03
20
04
20
07
20
08
20
11
20
12
20
15
20
16
20
19
162016401660168017001720174017601780180018201840186018801900192019401960198020002020204020602080210021202140216021802200222022402260228023002320234023602380
Elev
atio
n (
ft.)
Year
Dep
th t
o W
ater
(ft
.)
OPTI Well 27 HydrographWSE & Depth-to-Water GSE
WSE Min = 2046 ft. WSE Max = 2273 ft. Well Depth = 299 ft.

020406080100120140160180200220240260280300320340360380400420440460480500520540560580600620640660680700720740
19
59
19
60
19
63
19
64
19
67
19
68
19
71
19
72
19
75
19
76
19
79
19
80
19
83
19
84
19
87
19
88
19
91
19
92
19
95
19
96
19
99
20
00
20
03
20
04
20
07
20
08
20
11
20
12
20
15
20
16
20
19
163816581678169817181738175817781798181818381858187818981918193819581978199820182038205820782098211821382158217821982218223822582278229823182338235823782398
Elev
atio
n (
ft.)
Year
Dep
th t
o W
ater
(ft
.)
OPTI Well 28 HydrographWSE & Depth-to-Water GSE
WSE Min = 1950 ft. WSE Max = 2282 ft. Well Depth = 810 ft.

020406080100120140160180200220240260280300320340360380400420440460480500520540560580600620640660680700720740
19
59
19
60
19
63
19
64
19
67
19
68
19
71
19
72
19
75
19
76
19
79
19
80
19
83
19
84
19
87
19
88
19
91
19
92
19
95
19
96
19
99
20
00
20
03
20
04
20
07
20
08
20
11
20
12
20
15
20
16
20
19
173917591779179918191839185918791899191919391959197919992019203920592079209921192139215921792199221922392259227922992319233923592379239924192439245924792499
Elev
atio
n (
ft.)
Year
Dep
th t
o W
ater
(ft
.)
OPTI Well 29 HydrographWSE & Depth-to-Water GSE
WSE Min = 2149 ft. WSE Max = 2167 ft. Well Depth = 518 ft.

020406080100120140160180200220240260280300320340360380400420440460480500520540560580600620640660680700720740
19
59
19
60
19
63
19
64
19
67
19
68
19
71
19
72
19
75
19
76
19
79
19
80
19
83
19
84
19
87
19
88
19
91
19
92
19
95
19
96
19
99
20
00
20
03
20
04
20
07
20
08
20
11
20
12
20
15
20
16
20
19
167216921712173217521772179218121832185218721892191219321952197219922012203220522072209221122132215221722192221222322252227222922312233223522372239224122432
Elev
atio
n (
ft.)
Year
Dep
th t
o W
ater
(ft
.)
OPTI Well 30 HydrographWSE & Depth-to-Water GSE
WSE Min = 2134 ft. WSE Max = 2159 ft. Well Depth = 603 ft.

020406080100120140160180200220240260280300320340360380400420440460480500520540560580600620640660680700720740
19
59
19
60
19
63
19
64
19
67
19
68
19
71
19
72
19
75
19
76
19
79
19
80
19
83
19
84
19
87
19
88
19
91
19
92
19
95
19
96
19
99
20
00
20
03
20
04
20
07
20
08
20
11
20
12
20
15
20
16
20
19
167016901710173017501770179018101830185018701890191019301950197019902010203020502070209021102130215021702190221022302250227022902310233023502370239024102430
Elev
atio
n (
ft.)
Year
Dep
th t
o W
ater
(ft
.)
OPTI Well 31 HydrographWSE & Depth-to-Water GSE
WSE Min = 2019 ft. WSE Max = 2031 ft. Well Depth = 666 ft.

020406080100120140160180200220240260280300320340360380400420440460480500520540560580600620640660680700720740
19
59
19
60
19
63
19
64
19
67
19
68
19
71
19
72
19
75
19
76
19
79
19
80
19
83
19
84
19
87
19
88
19
91
19
92
19
95
19
96
19
99
20
00
20
03
20
04
20
07
20
08
20
11
20
12
20
15
20
16
20
19
165816781698171817381758177817981818183818581878189819181938195819781998201820382058207820982118213821582178219822182238225822782298231823382358237823982418
Elev
atio
n (
ft.)
Year
Dep
th t
o W
ater
(ft
.)
OPTI Well 32 HydrographWSE & Depth-to-Water GSE
WSE Min = 1989 ft. WSE Max = 2131 ft. Well Depth = Unknown ft.

020406080100120140160180200220240260280300320340360380400420440460480500520540560580600620640660680700720740
19
59
19
60
19
63
19
64
19
67
19
68
19
71
19
72
19
75
19
76
19
79
19
80
19
83
19
84
19
87
19
88
19
91
19
92
19
95
19
96
19
99
20
00
20
03
20
04
20
07
20
08
20
11
20
12
20
15
20
16
20
19
174517651785180518251845186518851905192519451965198520052025204520652085210521252145216521852205222522452265228523052325234523652385240524252445246524852505
Elev
atio
n (
ft.)
Year
Dep
th t
o W
ater
(ft
.)
OPTI Well 33 HydrographWSE & Depth-to-Water GSE
WSE Min = 2152 ft. WSE Max = 2242 ft. Well Depth = 348 ft.

020406080100120140160180200220240260280300320340360380400420440460480500520540560580600620640660680700720740
19
59
19
60
19
63
19
64
19
67
19
68
19
71
19
72
19
75
19
76
19
79
19
80
19
83
19
84
19
87
19
88
19
91
19
92
19
95
19
96
19
99
20
00
20
03
20
04
20
07
20
08
20
11
20
12
20
15
20
16
20
19
136413841404142414441464148415041524154415641584160416241644166416841704172417441764178418041824184418641884190419241944196419842004202420442064208421042124
Elev
atio
n (
ft.)
Year
Dep
th t
o W
ater
(ft
.)
OPTI Well 34 HydrographWSE & Depth-to-Water GSE
WSE Min = 2059 ft. WSE Max = 2062 ft. Well Depth = 61 ft.

020406080100120140160180200220240260280300320340360380400420440460480500520540560580600620640660680700720740
19
59
19
60
19
63
19
64
19
67
19
68
19
71
19
72
19
75
19
76
19
79
19
80
19
83
19
84
19
87
19
88
19
91
19
92
19
95
19
96
19
99
20
00
20
03
20
04
20
07
20
08
20
11
20
12
20
15
20
16
20
19
136813881408142814481468148815081528154815681588160816281648166816881708172817481768178818081828184818681888190819281948196819882008202820482068208821082128
Elev
atio
n (
ft.)
Year
Dep
th t
o W
ater
(ft
.)
OPTI Well 35 HydrographWSE & Depth-to-Water GSE
WSE Min = 1939 ft. WSE Max = 2099 ft. Well Depth = 238 ft.

020406080100120140160180200220240260280300320340360380400420440460480500520540560580600620640660680700720740
19
59
19
60
19
63
19
64
19
67
19
68
19
71
19
72
19
75
19
76
19
79
19
80
19
83
19
84
19
87
19
88
19
91
19
92
19
95
19
96
19
99
20
00
20
03
20
04
20
07
20
08
20
11
20
12
20
15
20
16
20
19
135613761396141614361456147614961516153615561576159616161636165616761696171617361756177617961816183618561876189619161936195619761996201620362056207620962116
Elev
atio
n (
ft.)
Year
Dep
th t
o W
ater
(ft
.)
OPTI Well 36 HydrographWSE & Depth-to-Water GSE
WSE Min = 1787 ft. WSE Max = 1907 ft. Well Depth = Unknown ft.

020406080100120140160180200220240260280300320340360380400420440460480500520540560580600620640660680700720740
19
59
19
60
19
63
19
64
19
67
19
68
19
71
19
72
19
75
19
76
19
79
19
80
19
83
19
84
19
87
19
88
19
91
19
92
19
95
19
96
19
99
20
00
20
03
20
04
20
07
20
08
20
11
20
12
20
15
20
16
20
19
161016301650167016901710173017501770179018101830185018701890191019301950197019902010203020502070209021102130215021702190221022302250227022902310233023502370
Elev
atio
n (
ft.)
Year
Dep
th t
o W
ater
(ft
.)
OPTI Well 37 HydrographWSE & Depth-to-Water GSE
WSE Min = 1921 ft. WSE Max = 2268 ft. Well Depth = 657 ft.

020406080100120140160180200220240260280300320340360380400420440460480500520540560580600620640660680700720740
19
59
19
60
19
63
19
64
19
67
19
68
19
71
19
72
19
75
19
76
19
79
19
80
19
83
19
84
19
87
19
88
19
91
19
92
19
95
19
96
19
99
20
00
20
03
20
04
20
07
20
08
20
11
20
12
20
15
20
16
20
19
161016301650167016901710173017501770179018101830185018701890191019301950197019902010203020502070209021102130215021702190221022302250227022902310233023502370
Elev
atio
n (
ft.)
Year
Dep
th t
o W
ater
(ft
.)
OPTI Well 38 HydrographWSE & Depth-to-Water GSE
WSE Min = 1917 ft. WSE Max = 2239 ft. Well Depth = 450 ft.

020406080100120140160180200220240260280300320340360380400420440460480500520540560580600620640660680700720740
19
59
19
60
19
63
19
64
19
67
19
68
19
71
19
72
19
75
19
76
19
79
19
80
19
83
19
84
19
87
19
88
19
91
19
92
19
95
19
96
19
99
20
00
20
03
20
04
20
07
20
08
20
11
20
12
20
15
20
16
20
19
157315931613163316531673169317131733175317731793181318331853187318931913193319531973199320132033205320732093211321332153217321932213223322532273229323132333
Elev
atio
n (
ft.)
Year
Dep
th t
o W
ater
(ft
.)
OPTI Well 39 HydrographWSE & Depth-to-Water GSE
WSE Min = 2140 ft. WSE Max = 2261 ft. Well Depth = 239 ft.

020406080100120140160180200220240260280300320340360380400420440460480500520540560580600620640660680700720740
19
59
19
60
19
63
19
64
19
67
19
68
19
71
19
72
19
75
19
76
19
79
19
80
19
83
19
84
19
87
19
88
19
91
19
92
19
95
19
96
19
99
20
00
20
03
20
04
20
07
20
08
20
11
20
12
20
15
20
16
20
19
193019501970199020102030205020702090211021302150217021902210223022502270229023102330235023702390241024302450247024902510253025502570259026102630265026702690
Elev
atio
n (
ft.)
Year
Dep
th t
o W
ater
(ft
.)
OPTI Well 40 HydrographWSE & Depth-to-Water GSE
WSE Min = 2557 ft. WSE Max = 2621 ft. Well Depth = 175 ft.

020406080100120140160180200220240260280300320340360380400420440460480500520540560580600620640660680700720740
19
59
19
60
19
63
19
64
19
67
19
68
19
71
19
72
19
75
19
76
19
79
19
80
19
83
19
84
19
87
19
88
19
91
19
92
19
95
19
96
19
99
20
00
20
03
20
04
20
07
20
08
20
11
20
12
20
15
20
16
20
19
207720972117213721572177219722172237225722772297231723372357237723972417243724572477249725172537255725772597261726372657267726972717273727572777279728172837
Elev
atio
n (
ft.)
Year
Dep
th t
o W
ater
(ft
.)
OPTI Well 41 HydrographWSE & Depth-to-Water GSE
WSE Min = 2743 ft. WSE Max = 2799 ft. Well Depth = 95 ft.

020406080100120140160180200220240260280300320340360380400420440460480500520540560580600620640660680700720740
19
59
19
60
19
63
19
64
19
67
19
68
19
71
19
72
19
75
19
76
19
79
19
80
19
83
19
84
19
87
19
88
19
91
19
92
19
95
19
96
19
99
20
00
20
03
20
04
20
07
20
08
20
11
20
12
20
15
20
16
20
19
153415541574159416141634165416741694171417341754177417941814183418541874189419141934195419741994201420342054207420942114213421542174219422142234225422742294
Elev
atio
n (
ft.)
Year
Dep
th t
o W
ater
(ft
.)
OPTI Well 42 HydrographWSE & Depth-to-Water GSE
WSE Min = 1988 ft. WSE Max = 2007 ft. Well Depth = Unknown ft.

020406080100120140160180200220240260280300320340360380400420440460480500520540560580600620640660680700720740
19
59
19
60
19
63
19
64
19
67
19
68
19
71
19
72
19
75
19
76
19
79
19
80
19
83
19
84
19
87
19
88
19
91
19
92
19
95
19
96
19
99
20
00
20
03
20
04
20
07
20
08
20
11
20
12
20
15
20
16
20
19
152615461566158616061626164616661686170617261746176617861806182618461866188619061926194619661986200620262046206620862106212621462166218622062226224622662286
Elev
atio
n (
ft.)
Year
Dep
th t
o W
ater
(ft
.)
OPTI Well 43 HydrographWSE & Depth-to-Water GSE
WSE Min = 2059 ft. WSE Max = 2100 ft. Well Depth = 500 ft.

020406080100120140160180200220240260280300320340360380400420440460480500520540560580600620640660680700720740
19
59
19
60
19
63
19
64
19
67
19
68
19
71
19
72
19
75
19
76
19
79
19
80
19
83
19
84
19
87
19
88
19
91
19
92
19
95
19
96
19
99
20
00
20
03
20
04
20
07
20
08
20
11
20
12
20
15
20
16
20
19
112411441164118412041224124412641284130413241344136413841404142414441464148415041524154415641584160416241644166416841704172417441764178418041824184418641884
Elev
atio
n (
ft.)
Year
Dep
th t
o W
ater
(ft
.)
OPTI Well 44 HydrographWSE & Depth-to-Water GSE
WSE Min = 1764 ft. WSE Max = 1765 ft. Well Depth = Unknown ft.

020406080100120140160180200220240260280300320340360380400420440460480500520540560580600620640660680700720740
19
59
19
60
19
63
19
64
19
67
19
68
19
71
19
72
19
75
19
76
19
79
19
80
19
83
19
84
19
87
19
88
19
91
19
92
19
95
19
96
19
99
20
00
20
03
20
04
20
07
20
08
20
11
20
12
20
15
20
16
20
19
274227622782280228222842286228822902292229422962298230023022304230623082310231223142316231823202322232423262328233023322334233623382340234223442346234823502
Elev
atio
n (
ft.)
Year
Dep
th t
o W
ater
(ft
.)
OPTI Well 46 HydrographWSE & Depth-to-Water GSE
WSE Min = 3471 ft. WSE Max = 3480 ft. Well Depth = 46 ft.

020406080100120140160180200220240260280300320340360380400420440460480500520540560580600620640660680700720740
19
59
19
60
19
63
19
64
19
67
19
68
19
71
19
72
19
75
19
76
19
79
19
80
19
83
19
84
19
87
19
88
19
91
19
92
19
95
19
96
19
99
20
00
20
03
20
04
20
07
20
08
20
11
20
12
20
15
20
16
20
19
224122612281230123212341236123812401242124412461248125012521254125612581260126212641266126812701272127412761278128012821284128612881290129212941296129813001
Elev
atio
n (
ft.)
Year
Dep
th t
o W
ater
(ft
.)
OPTI Well 48 HydrographWSE & Depth-to-Water GSE
WSE Min = 2865 ft. WSE Max = 2878 ft. Well Depth = 240 ft.

020406080100120140160180200220240260280300320340360380400420440460480500520540560580600620640660680700720740
19
59
19
60
19
63
19
64
19
67
19
68
19
71
19
72
19
75
19
76
19
79
19
80
19
83
19
84
19
87
19
88
19
91
19
92
19
95
19
96
19
99
20
00
20
03
20
04
20
07
20
08
20
11
20
12
20
15
20
16
20
19
234223622382240224222442246224822502252225422562258226022622264226622682270227222742276227822802282228422862288229022922294229622982300230223042306230823102
Elev
atio
n (
ft.)
Year
Dep
th t
o W
ater
(ft
.)
OPTI Well 49 HydrographWSE & Depth-to-Water GSE
WSE Min = 2988 ft. WSE Max = 2988 ft. Well Depth = Unknown ft.

020406080100120140160180200220240260280300320340360380400420440460480500520540560580600620640660680700720740
19
59
19
60
19
63
19
64
19
67
19
68
19
71
19
72
19
75
19
76
19
79
19
80
19
83
19
84
19
87
19
88
19
91
19
92
19
95
19
96
19
99
20
00
20
03
20
04
20
07
20
08
20
11
20
12
20
15
20
16
20
19
192819481968198820082028204820682088210821282148216821882208222822482268228823082328234823682388240824282448246824882508252825482568258826082628264826682688
Elev
atio
n (
ft.)
Year
Dep
th t
o W
ater
(ft
.)
OPTI Well 50 HydrographWSE & Depth-to-Water GSE
WSE Min = 2591 ft. WSE Max = 2593 ft. Well Depth = 811 ft.

020406080100120140160180200220240260280300320340360380400420440460480500520540560580600620640660680700720740
19
59
19
60
19
63
19
64
19
67
19
68
19
71
19
72
19
75
19
76
19
79
19
80
19
83
19
84
19
87
19
88
19
91
19
92
19
95
19
96
19
99
20
00
20
03
20
04
20
07
20
08
20
11
20
12
20
15
20
16
20
19
155215721592161216321652167216921712173217521772179218121832185218721892191219321952197219922012203220522072209221122132215221722192221222322252227222922312
Elev
atio
n (
ft.)
Year
Dep
th t
o W
ater
(ft
.)
OPTI Well 51 HydrographWSE & Depth-to-Water GSE
WSE Min = 2206 ft. WSE Max = 2271 ft. Well Depth = 95 ft.

020406080100120140160180200220240260280300320340360380400420440460480500520540560580600620640660680700720740
19
59
19
60
19
63
19
64
19
67
19
68
19
71
19
72
19
75
19
76
19
79
19
80
19
83
19
84
19
87
19
88
19
91
19
92
19
95
19
96
19
99
20
00
20
03
20
04
20
07
20
08
20
11
20
12
20
15
20
16
20
19
156815881608162816481668168817081728174817681788180818281848186818881908192819481968198820082028204820682088210821282148216821882208222822482268228823082328
Elev
atio
n (
ft.)
Year
Dep
th t
o W
ater
(ft
.)
OPTI Well 52 HydrographWSE & Depth-to-Water GSE
WSE Min = 2095 ft. WSE Max = 2214 ft. Well Depth = 288 ft.

020406080100120140160180200220240260280300320340360380400420440460480500520540560580600620640660680700720740
19
59
19
60
19
63
19
64
19
67
19
68
19
71
19
72
19
75
19
76
19
79
19
80
19
83
19
84
19
87
19
88
19
91
19
92
19
95
19
96
19
99
20
00
20
03
20
04
20
07
20
08
20
11
20
12
20
15
20
16
20
19
151715371557157715971617163716571677169717171737175717771797181718371857187718971917193719571977199720172037205720772097211721372157217721972217223722572277
Elev
atio
n (
ft.)
Year
Dep
th t
o W
ater
(ft
.)
OPTI Well 53 HydrographWSE & Depth-to-Water GSE
WSE Min = 2129 ft. WSE Max = 2215 ft. Well Depth = 316 ft.

020406080100120140160180200220240260280300320340360380400420440460480500520540560580600620640660680700720740
19
59
19
60
19
63
19
64
19
67
19
68
19
71
19
72
19
75
19
76
19
79
19
80
19
83
19
84
19
87
19
88
19
91
19
92
19
95
19
96
19
99
20
00
20
03
20
04
20
07
20
08
20
11
20
12
20
15
20
16
20
19
159716171637165716771697171717371757177717971817183718571877189719171937195719771997201720372057207720972117213721572177219722172237225722772297231723372357
Elev
atio
n (
ft.)
Year
Dep
th t
o W
ater
(ft
.)
OPTI Well 54 HydrographWSE & Depth-to-Water GSE
WSE Min = 1942 ft. WSE Max = 1991 ft. Well Depth = 924 ft.

020406080100120140160180200220240260280300320340360380400420440460480500520540560580600620640660680700720740
19
59
19
60
19
63
19
64
19
67
19
68
19
71
19
72
19
75
19
76
19
79
19
80
19
83
19
84
19
87
19
88
19
91
19
92
19
95
19
96
19
99
20
00
20
03
20
04
20
07
20
08
20
11
20
12
20
15
20
16
20
19
171917391759177917991819183918591879189919191939195919791999201920392059207920992119213921592179219922192239225922792299231923392359237923992419243924592479
Elev
atio
n (
ft.)
Year
Dep
th t
o W
ater
(ft
.)
OPTI Well 55 HydrographWSE & Depth-to-Water GSE
WSE Min = 2075 ft. WSE Max = 2271 ft. Well Depth = 419 ft.

020406080100120140160180200220240260280300320340360380400420440460480500520540560580600620640660680700720740
19
59
19
60
19
63
19
64
19
67
19
68
19
71
19
72
19
75
19
76
19
79
19
80
19
83
19
84
19
87
19
88
19
91
19
92
19
95
19
96
19
99
20
00
20
03
20
04
20
07
20
08
20
11
20
12
20
15
20
16
20
19
177517951815183518551875189519151935195519751995201520352055207520952115213521552175219522152235225522752295231523352355237523952415243524552475249525152535
Elev
atio
n (
ft.)
Year
Dep
th t
o W
ater
(ft
.)
OPTI Well 56 HydrographWSE & Depth-to-Water GSE
WSE Min = 2128 ft. WSE Max = 2160 ft. Well Depth = Unknown ft.

020406080100120140160180200220240260280300320340360380400420440460480500520540560580600620640660680700720740
19
59
19
60
19
63
19
64
19
67
19
68
19
71
19
72
19
75
19
76
19
79
19
80
19
83
19
84
19
87
19
88
19
91
19
92
19
95
19
96
19
99
20
00
20
03
20
04
20
07
20
08
20
11
20
12
20
15
20
16
20
19
166716871707172717471767178718071827184718671887190719271947196719872007202720472067208721072127214721672187220722272247226722872307232723472367238724072427
Elev
atio
n (
ft.)
Year
Dep
th t
o W
ater
(ft
.)
OPTI Well 57 HydrographWSE & Depth-to-Water GSE
WSE Min = 2134 ft. WSE Max = 2256 ft. Well Depth = 330 ft.
020406080100120140160180200220240260280300320340360380400420440460480500520540560580600620640660680700720740
19
59
19
60
19
63
19
64
19
67
19
68
19
71
19
72
19
75
19
76
19
79
19
80
19
83
19
84
19
87
19
88
19
91
19
92
19
95
19
96
19
99
20
00
20
03
20
04
20
07
20
08
20
11
20
12
20
15
20
16
20
19
169717171737175717771797181718371857187718971917193719571977199720172037205720772097211721372157217721972217223722572277229723172337235723772397241724372457
Elev
atio
n (
ft.)
Year
Dep
th t
o W
ater
(ft
.)
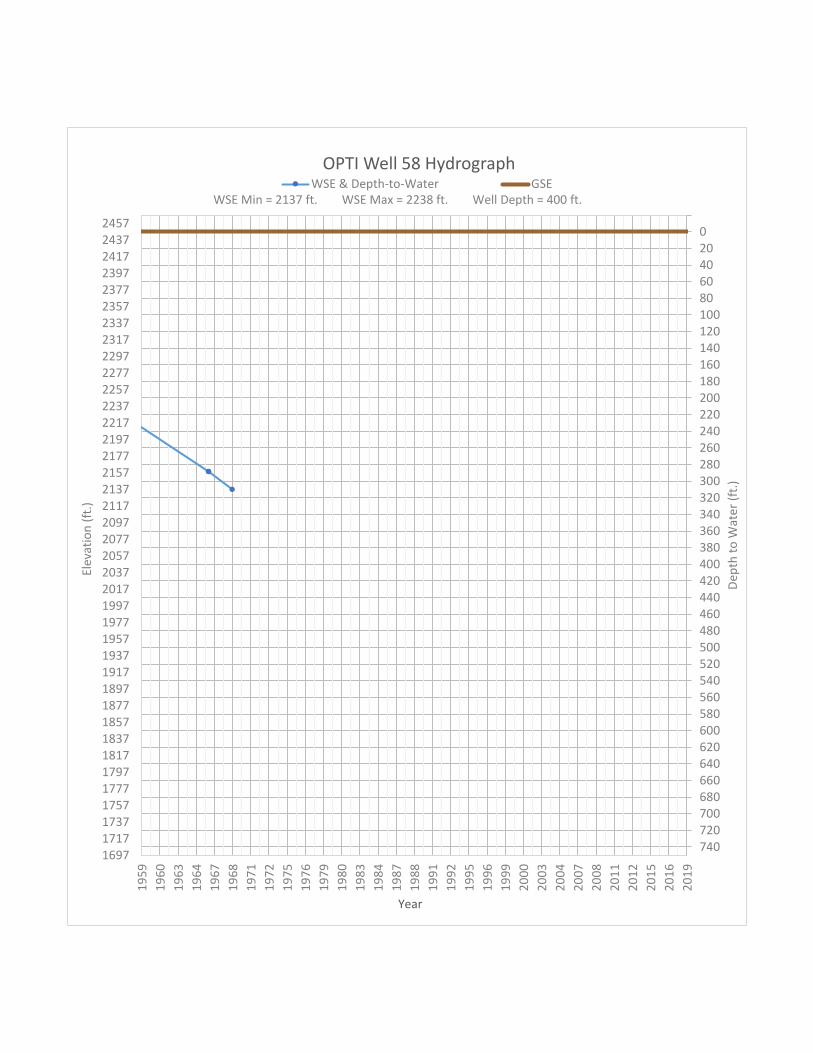
OPTI Well 58 HydrographWSE & Depth-to-Water GSE
WSE Min = 2137 ft. WSE Max = 2238 ft. Well Depth = 400 ft.

020406080100120140160180200220240260280300320340360380400420440460480500520540560580600620640660680700720740
19
59
19
60
19
63
19
64
19
67
19
68
19
71
19
72
19
75
19
76
19
79
19
80
19
83
19
84
19
87
19
88
19
91
19
92
19
95
19
96
19
99
20
00
20
03
20
04
20
07
20
08
20
11
20
12
20
15
20
16
20
19
139114111431145114711491151115311551157115911611163116511671169117111731175117711791181118311851187118911911193119511971199120112031205120712091211121312151
Elev
atio
n (
ft.)
Year
Dep
th t
o W
ater
(ft
.)
OPTI Well 59 HydrographWSE & Depth-to-Water GSE
WSE Min = 2087 ft. WSE Max = 2095 ft. Well Depth = 65 ft.

020406080100120140160180200220240260280300320340360380400420440460480500520540560580600620640660680700720740
19
59
19
60
19
63
19
64
19
67
19
68
19
71
19
72
19
75
19
76
19
79
19
80
19
83
19
84
19
87
19
88
19
91
19
92
19
95
19
96
19
99
20
00
20
03
20
04
20
07
20
08
20
11
20
12
20
15
20
16
20
19
135413741394141414341454147414941514153415541574159416141634165416741694171417341754177417941814183418541874189419141934195419741994201420342054207420942114
Elev
atio
n (
ft.)
Year
Dep
th t
o W
ater
(ft
.)
OPTI Well 60 HydrographWSE & Depth-to-Water GSE
WSE Min = 2022 ft. WSE Max = 2084 ft. Well Depth = 211 ft.
020406080100120140160180200220240260280300320340360380400420440460480500520540560580600620640660680700720740
19
59
19
60
19
63
19
64
19
67
19
68
19
71
19
72
19
75
19
76
19
79
19
80
19
83
19
84
19
87
19
88
19
91
19
92
19
95
19
96
19
99
20
00
20
03
20
04
20
07
20
08
20
11
20
12
20
15
20
16
20
19
293129512971299130113031305130713091311131313151317131913211323132513271329133113331335133713391341134313451347134913511353135513571359136113631365136713691
Elev
atio
n (
ft.)
Year
Dep
th t
o W
ater
(ft
.)
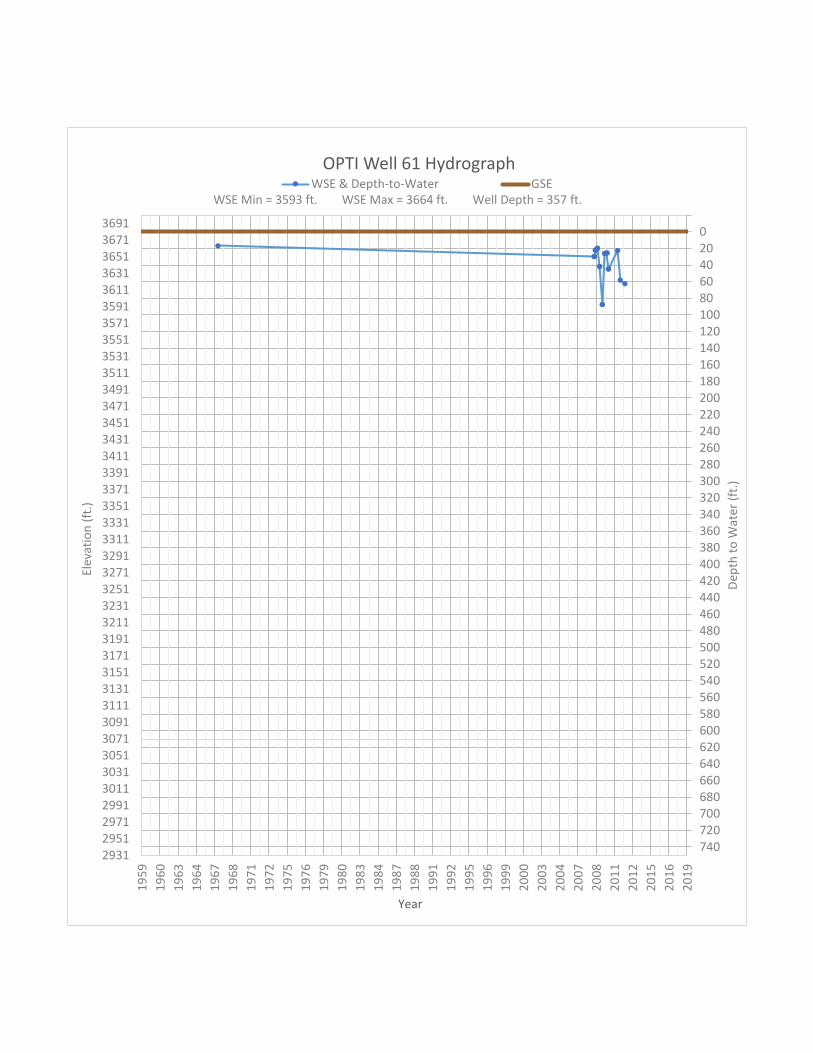
OPTI Well 61 HydrographWSE & Depth-to-Water GSE
WSE Min = 3593 ft. WSE Max = 3664 ft. Well Depth = 357 ft.

020406080100120140160180200220240260280300320340360380400420440460480500520540560580600620640660680700720740
19
59
19
60
19
63
19
64
19
67
19
68
19
71
19
72
19
75
19
76
19
79
19
80
19
83
19
84
19
87
19
88
19
91
19
92
19
95
19
96
19
99
20
00
20
03
20
04
20
07
20
08
20
11
20
12
20
15
20
16
20
19
217121912211223122512271229123112331235123712391241124312451247124912511253125512571259126112631265126712691271127312751277127912811283128512871289129112931
Elev
atio
n (
ft.)
Year
Dep
th t
o W
ater
(ft
.)
OPTI Well 62 HydrographWSE & Depth-to-Water GSE
WSE Min = 2757 ft. WSE Max = 2858 ft. Well Depth = 212 ft.

020406080100120140160180200220240260280300320340360380400420440460480500520540560580600620640660680700720740
19
59
19
60
19
63
19
64
19
67
19
68
19
71
19
72
19
75
19
76
19
79
19
80
19
83
19
84
19
87
19
88
19
91
19
92
19
95
19
96
19
99
20
00
20
03
20
04
20
07
20
08
20
11
20
12
20
15
20
16
20
19
146314831503152315431563158316031623164316631683170317231743176317831803182318431863188319031923194319631983200320232043206320832103212321432163218322032223
Elev
atio
n (
ft.)
Year
Dep
th t
o W
ater
(ft
.)
OPTI Well 63 HydrographWSE & Depth-to-Water GSE
WSE Min = 1966 ft. WSE Max = 2178 ft. Well Depth = 248 ft.

020406080100120140160180200220240260280300320340360380400420440460480500520540560580600620640660680700720740
19
59
19
60
19
63
19
64
19
67
19
68
19
71
19
72
19
75
19
76
19
79
19
80
19
83
19
84
19
87
19
88
19
91
19
92
19
95
19
96
19
99
20
00
20
03
20
04
20
07
20
08
20
11
20
12
20
15
20
16
20
19
147614961516153615561576159616161636165616761696171617361756177617961816183618561876189619161936195619761996201620362056207620962116213621562176219622162236
Elev
atio
n (
ft.)
Year
Dep
th t
o W
ater
(ft
.)
OPTI Well 64 HydrographWSE & Depth-to-Water GSE
WSE Min = 1980 ft. WSE Max = 2098 ft. Well Depth = 1004 ft.

020406080100120140160180200220240260280300320340360380400420440460480500520540560580600620640660680700720740
19
59
19
60
19
63
19
64
19
67
19
68
19
71
19
72
19
75
19
76
19
79
19
80
19
83
19
84
19
87
19
88
19
91
19
92
19
95
19
96
19
99
20
00
20
03
20
04
20
07
20
08
20
11
20
12
20
15
20
16
20
19
154715671587160716271647166716871707172717471767178718071827184718671887190719271947196719872007202720472067208721072127214721672187220722272247226722872307
Elev
atio
n (
ft.)
Year
Dep
th t
o W
ater
(ft
.)
OPTI Well 65 HydrographWSE & Depth-to-Water GSE
WSE Min = 2078 ft. WSE Max = 2194 ft. Well Depth = 993 ft.

020406080100120140160180200220240260280300320340360380400420440460480500520540560580600620640660680700720740
19
59
19
60
19
63
19
64
19
67
19
68
19
71
19
72
19
75
19
76
19
79
19
80
19
83
19
84
19
87
19
88
19
91
19
92
19
95
19
96
19
99
20
00
20
03
20
04
20
07
20
08
20
11
20
12
20
15
20
16
20
19
170117211741176117811801182118411861188119011921194119611981200120212041206120812101212121412161218122012221224122612281230123212341236123812401242124412461
Elev
atio
n (
ft.)
Year
Dep
th t
o W
ater
(ft
.)
OPTI Well 66 HydrographWSE & Depth-to-Water GSE
WSE Min = 1914 ft. WSE Max = 1924 ft. Well Depth = Unknown ft.

020406080100120140160180200220240260280300320340360380400420440460480500520540560580600620640660680700720740
19
59
19
60
19
63
19
64
19
67
19
68
19
71
19
72
19
75
19
76
19
79
19
80
19
83
19
84
19
87
19
88
19
91
19
92
19
95
19
96
19
99
20
00
20
03
20
04
20
07
20
08
20
11
20
12
20
15
20
16
20
19
224222622282230223222342236223822402242224422462248225022522254225622582260226222642266226822702272227422762278228022822284228622882290229222942296229823002
Elev
atio
n (
ft.)
Year
Dep
th t
o W
ater
(ft
.)
OPTI Well 67 HydrographWSE & Depth-to-Water GSE
WSE Min = 2854 ft. WSE Max = 2892 ft. Well Depth = 225 ft.

020406080100120140160180200220240260280300320340360380400420440460480500520540560580600620640660680700720740
19
59
19
60
19
63
19
64
19
67
19
68
19
71
19
72
19
75
19
76
19
79
19
80
19
83
19
84
19
87
19
88
19
91
19
92
19
95
19
96
19
99
20
00
20
03
20
04
20
07
20
08
20
11
20
12
20
15
20
16
20
19
145614761496151615361556157615961616163616561676169617161736175617761796181618361856187618961916193619561976199620162036205620762096211621362156217621962216
Elev
atio
n (
ft.)
Year
Dep
th t
o W
ater
(ft
.)
OPTI Well 68 HydrographWSE & Depth-to-Water GSE
WSE Min = 1961 ft. WSE Max = 2172 ft. Well Depth = 646 ft.
020406080100120140160180200220240260280300320340360380400420440460480500520540560580600620640660680700720740
19
59
19
60
19
63
19
64
19
67
19
68
19
71
19
72
19
75
19
76
19
79
19
80
19
83
19
84
19
87
19
88
19
91
19
92
19
95
19
96
19
99
20
00
20
03
20
04
20
07
20
08
20
11
20
12
20
15
20
16
20
19
285128712891291129312951297129913011303130513071309131113131315131713191321132313251327132913311333133513371339134113431345134713491351135313551357135913611
Elev
atio
n (
ft.)
Year
Dep
th t
o W
ater
(ft
.)
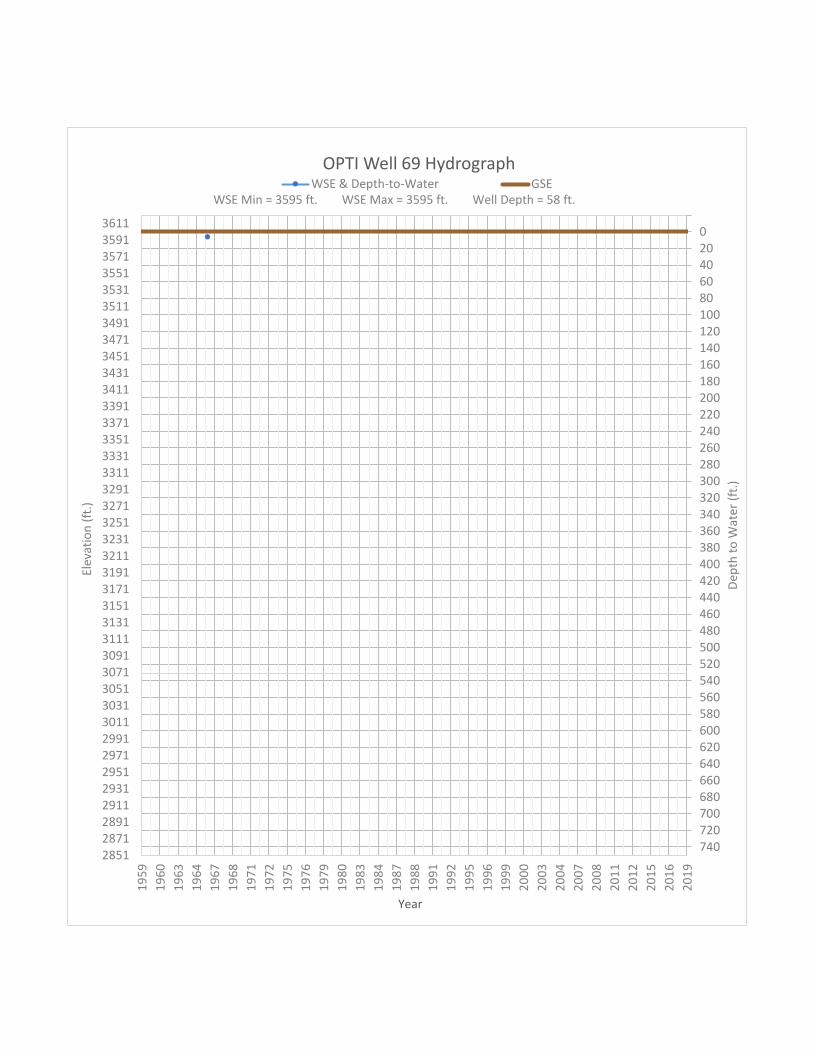
OPTI Well 69 HydrographWSE & Depth-to-Water GSE
WSE Min = 3595 ft. WSE Max = 3595 ft. Well Depth = 58 ft.

020406080100120140160180200220240260280300320340360380400420440460480500520540560580600620640660680700720740
19
59
19
60
19
63
19
64
19
67
19
68
19
71
19
72
19
75
19
76
19
79
19
80
19
83
19
84
19
87
19
88
19
91
19
92
19
95
19
96
19
99
20
00
20
03
20
04
20
07
20
08
20
11
20
12
20
15
20
16
20
19
123112511271129113111331135113711391141114311451147114911511153115511571159116111631165116711691171117311751177117911811183118511871189119111931195119711991
Elev
atio
n (
ft.)
Year
Dep
th t
o W
ater
(ft
.)
OPTI Well 70 HydrographWSE & Depth-to-Water GSE
WSE Min = 1881 ft. WSE Max = 1945 ft. Well Depth = 215 ft.

020406080100120140160180200220240260280300320340360380400420440460480500520540560580600620640660680700720740
19
59
19
60
19
63
19
64
19
67
19
68
19
71
19
72
19
75
19
76
19
79
19
80
19
83
19
84
19
87
19
88
19
91
19
92
19
95
19
96
19
99
20
00
20
03
20
04
20
07
20
08
20
11
20
12
20
15
20
16
20
19
134513651385140514251445146514851505152515451565158516051625164516651685170517251745176517851805182518451865188519051925194519651985200520252045206520852105
Elev
atio
n (
ft.)
Year
Dep
th t
o W
ater
(ft
.)
OPTI Well 71 HydrographWSE & Depth-to-Water GSE
WSE Min = 1959 ft. WSE Max = 2027 ft. Well Depth = 240 ft.

020406080100120140160180200220240260280300320340360380400420440460480500520540560580600620640660680700720740
19
59
19
60
19
63
19
64
19
67
19
68
19
71
19
72
19
75
19
76
19
79
19
80
19
83
19
84
19
87
19
88
19
91
19
92
19
95
19
96
19
99
20
00
20
03
20
04
20
07
20
08
20
11
20
12
20
15
20
16
20
19
142114411461148115011521154115611581160116211641166116811701172117411761178118011821184118611881190119211941196119812001202120412061208121012121214121612181
Elev
atio
n (
ft.)
Year
Dep
th t
o W
ater
(ft
.)
OPTI Well 72 HydrographWSE & Depth-to-Water GSE
WSE Min = 1863 ft. WSE Max = 2120 ft. Well Depth = 790 ft.

020406080100120140160180200220240260280300320340360380400420440460480500520540560580600620640660680700720740
19
59
19
60
19
63
19
64
19
67
19
68
19
71
19
72
19
75
19
76
19
79
19
80
19
83
19
84
19
87
19
88
19
91
19
92
19
95
19
96
19
99
20
00
20
03
20
04
20
07
20
08
20
11
20
12
20
15
20
16
20
19
150215221542156215821602162216421662168217021722174217621782180218221842186218821902192219421962198220022022204220622082210221222142216221822202222222422262
Elev
atio
n (
ft.)
Year
Dep
th t
o W
ater
(ft
.)
OPTI Well 73 HydrographWSE & Depth-to-Water GSE
WSE Min = 2021 ft. WSE Max = 2114 ft. Well Depth = 880 ft.

020406080100120140160180200220240260280300320340360380400420440460480500520540560580600620640660680700720740
19
59
19
60
19
63
19
64
19
67
19
68
19
71
19
72
19
75
19
76
19
79
19
80
19
83
19
84
19
87
19
88
19
91
19
92
19
95
19
96
19
99
20
00
20
03
20
04
20
07
20
08
20
11
20
12
20
15
20
16
20
19
144314631483150315231543156315831603162316431663168317031723174317631783180318231843186318831903192319431963198320032023204320632083210321232143216321832203
Elev
atio
n (
ft.)
Year
Dep
th t
o W
ater
(ft
.)
OPTI Well 74 HydrographWSE & Depth-to-Water GSE
WSE Min = 1882 ft. WSE Max = 1986 ft. Well Depth = Unknown ft.

020406080100120140160180200220240260280300320340360380400420440460480500520540560580600620640660680700720740
19
59
19
60
19
63
19
64
19
67
19
68
19
71
19
72
19
75
19
76
19
79
19
80
19
83
19
84
19
87
19
88
19
91
19
92
19
95
19
96
19
99
20
00
20
03
20
04
20
07
20
08
20
11
20
12
20
15
20
16
20
19
154515651585160516251645166516851705172517451765178518051825184518651885190519251945196519852005202520452065208521052125214521652185220522252245226522852305
Elev
atio
n (
ft.)
Year
Dep
th t
o W
ater
(ft
.)
OPTI Well 75 HydrographWSE & Depth-to-Water GSE
WSE Min = 1912 ft. WSE Max = 2089 ft. Well Depth = Unknown ft.

020406080100120140160180200220240260280300320340360380400420440460480500520540560580600620640660680700720740
19
59
19
60
19
63
19
64
19
67
19
68
19
71
19
72
19
75
19
76
19
79
19
80
19
83
19
84
19
87
19
88
19
91
19
92
19
95
19
96
19
99
20
00
20
03
20
04
20
07
20
08
20
11
20
12
20
15
20
16
20
19
152715471567158716071627164716671687170717271747176717871807182718471867188719071927194719671987200720272047206720872107212721472167218722072227224722672287
Elev
atio
n (
ft.)
Year
Dep
th t
o W
ater
(ft
.)
OPTI Well 76 HydrographWSE & Depth-to-Water GSE
WSE Min = 1851 ft. WSE Max = 2174 ft. Well Depth = 720 ft.
020406080100120140160180200220240260280300320340360380400420440460480500520540560580600620640660680700720740
19
59
19
60
19
63
19
64
19
67
19
68
19
71
19
72
19
75
19
76
19
79
19
80
19
83
19
84
19
87
19
88
19
91
19
92
19
95
19
96
19
99
20
00
20
03
20
04
20
07
20
08
20
11
20
12
20
15
20
16
20
19
153615561576159616161636165616761696171617361756177617961816183618561876189619161936195619761996201620362056207620962116213621562176219622162236225622762296
Elev
atio
n (
ft.)
Year
Dep
th t
o W
ater
(ft
.)
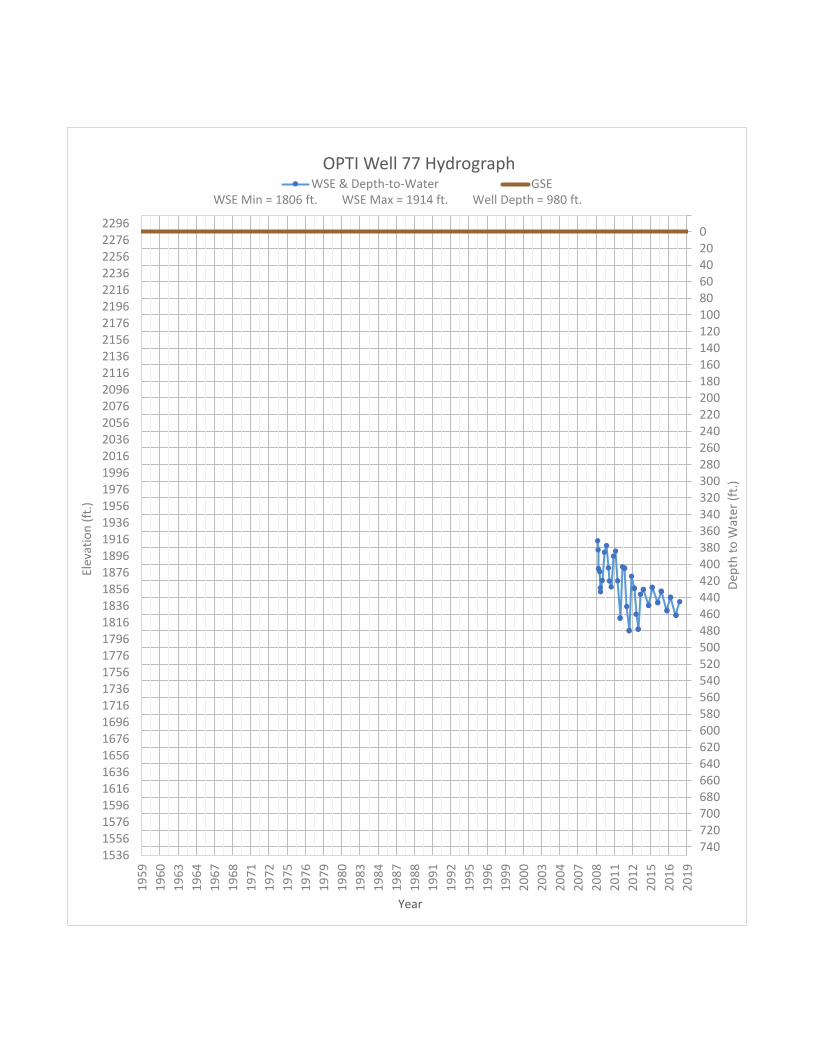
OPTI Well 77 HydrographWSE & Depth-to-Water GSE
WSE Min = 1806 ft. WSE Max = 1914 ft. Well Depth = 980 ft.

020406080100120140160180200220240260280300320340360380400420440460480500520540560580600620640660680700720740
19
59
19
60
19
63
19
64
19
67
19
68
19
71
19
72
19
75
19
76
19
79
19
80
19
83
19
84
19
87
19
88
19
91
19
92
19
95
19
96
19
99
20
00
20
03
20
04
20
07
20
08
20
11
20
12
20
15
20
16
20
19
154915691589160916291649166916891709172917491769178918091829184918691889190919291949196919892009202920492069208921092129214921692189220922292249226922892309
Elev
atio
n (
ft.)
Year
Dep
th t
o W
ater
(ft
.)
OPTI Well 78 HydrographWSE & Depth-to-Water GSE
WSE Min = 1853 ft. WSE Max = 1907 ft. Well Depth = Unknown ft.

020406080100120140160180200220240260280300320340360380400420440460480500520540560580600620640660680700720740
19
59
19
60
19
63
19
64
19
67
19
68
19
71
19
72
19
75
19
76
19
79
19
80
19
83
19
84
19
87
19
88
19
91
19
92
19
95
19
96
19
99
20
00
20
03
20
04
20
07
20
08
20
11
20
12
20
15
20
16
20
19
162416441664168417041724174417641784180418241844186418841904192419441964198420042024204420642084210421242144216421842204222422442264228423042324234423642384
Elev
atio
n (
ft.)
Year
Dep
th t
o W
ater
(ft
.)
OPTI Well 79 HydrographWSE & Depth-to-Water GSE
WSE Min = 1860 ft. WSE Max = 2002 ft. Well Depth = 600 ft.

020406080100120140160180200220240260280300320340360380400420440460480500520540560580600620640660680700720740
19
59
19
60
19
63
19
64
19
67
19
68
19
71
19
72
19
75
19
76
19
79
19
80
19
83
19
84
19
87
19
88
19
91
19
92
19
95
19
96
19
99
20
00
20
03
20
04
20
07
20
08
20
11
20
12
20
15
20
16
20
19
167216921712173217521772179218121832185218721892191219321952197219922012203220522072209221122132215221722192221222322252227222922312233223522372239224122432
Elev
atio
n (
ft.)
Year
Dep
th t
o W
ater
(ft
.)
OPTI Well 80 HydrographWSE & Depth-to-Water GSE
WSE Min = 1930 ft. WSE Max = 1957 ft. Well Depth = 800 ft.

020406080100120140160180200220240260280300320340360380400420440460480500520540560580600620640660680700720740
19
59
19
60
19
63
19
64
19
67
19
68
19
71
19
72
19
75
19
76
19
79
19
80
19
83
19
84
19
87
19
88
19
91
19
92
19
95
19
96
19
99
20
00
20
03
20
04
20
07
20
08
20
11
20
12
20
15
20
16
20
19
194819681988200820282048206820882108212821482168218822082228224822682288230823282348236823882408242824482468248825082528254825682588260826282648266826882708
Elev
atio
n (
ft.)
Year
Dep
th t
o W
ater
(ft
.)
OPTI Well 81 HydrographWSE & Depth-to-Water GSE
WSE Min = 2588 ft. WSE Max = 2602 ft. Well Depth = 155 ft.

020406080100120140160180200220240260280300320340360380400420440460480500520540560580600620640660680700720740
19
59
19
60
19
63
19
64
19
67
19
68
19
71
19
72
19
75
19
76
19
79
19
80
19
83
19
84
19
87
19
88
19
91
19
92
19
95
19
96
19
99
20
00
20
03
20
04
20
07
20
08
20
11
20
12
20
15
20
16
20
19
204820682088210821282148216821882208222822482268228823082328234823682388240824282448246824882508252825482568258826082628264826682688270827282748276827882808
Elev
atio
n (
ft.)
Year
Dep
th t
o W
ater
(ft
.)
OPTI Well 82 HydrographWSE & Depth-to-Water GSE
WSE Min = 2703 ft. WSE Max = 2733 ft. Well Depth = 200 ft.

020406080100120140160180200220240260280300320340360380400420440460480500520540560580600620640660680700720740
19
59
19
60
19
63
19
64
19
67
19
68
19
71
19
72
19
75
19
76
19
79
19
80
19
83
19
84
19
87
19
88
19
91
19
92
19
95
19
96
19
99
20
00
20
03
20
04
20
07
20
08
20
11
20
12
20
15
20
16
20
19
210821282148216821882208222822482268228823082328234823682388240824282448246824882508252825482568258826082628264826682688270827282748276827882808282828482868
Elev
atio
n (
ft.)
Year
Dep
th t
o W
ater
(ft
.)
OPTI Well 83 HydrographWSE & Depth-to-Water GSE
WSE Min = 2755 ft. WSE Max = 2784 ft. Well Depth = 198 ft.
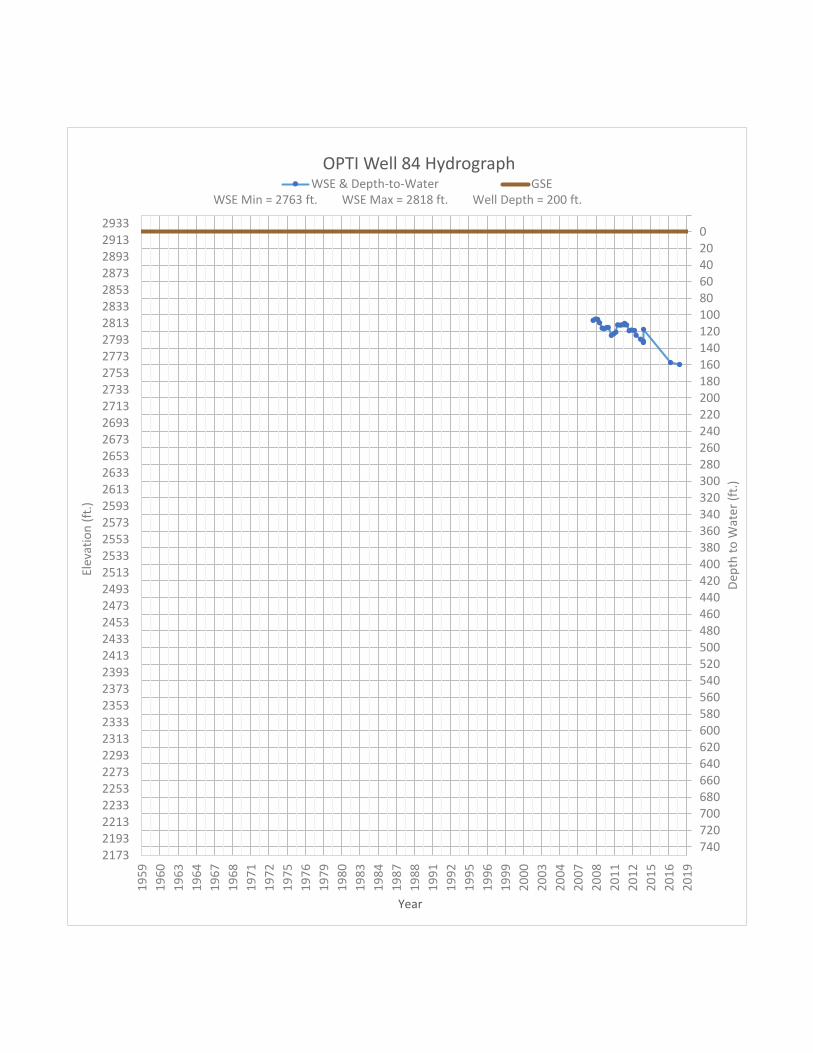
020406080100120140160180200220240260280300320340360380400420440460480500520540560580600620640660680700720740
19
59
19
60
19
63
19
64
19
67
19
68
19
71
19
72
19
75
19
76
19
79
19
80
19
83
19
84
19
87
19
88
19
91
19
92
19
95
19
96
19
99
20
00
20
03
20
04
20
07
20
08
20
11
20
12
20
15
20
16
20
19
217321932213223322532273229323132333235323732393241324332453247324932513253325532573259326132633265326732693271327332753277327932813283328532873289329132933
Elev
atio
n (
ft.)
Year
Dep
th t
o W
ater
(ft
.)
OPTI Well 84 HydrographWSE & Depth-to-Water GSE
WSE Min = 2763 ft. WSE Max = 2818 ft. Well Depth = 200 ft.
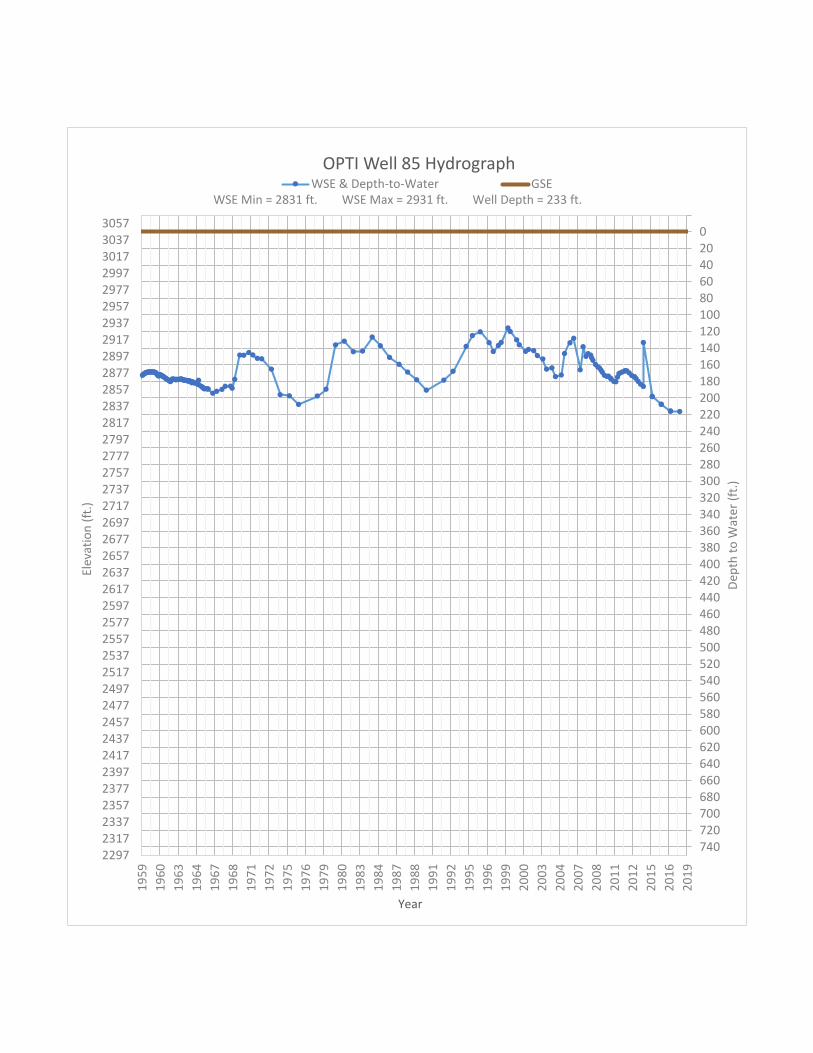
020406080100120140160180200220240260280300320340360380400420440460480500520540560580600620640660680700720740
19
59
19
60
19
63
19
64
19
67
19
68
19
71
19
72
19
75
19
76
19
79
19
80
19
83
19
84
19
87
19
88
19
91
19
92
19
95
19
96
19
99
20
00
20
03
20
04
20
07
20
08
20
11
20
12
20
15
20
16
20
19
229723172337235723772397241724372457247724972517253725572577259726172637265726772697271727372757277727972817283728572877289729172937295729772997301730373057
Elev
atio
n (
ft.)
Year
Dep
th t
o W
ater
(ft
.)
OPTI Well 85 HydrographWSE & Depth-to-Water GSE
WSE Min = 2831 ft. WSE Max = 2931 ft. Well Depth = 233 ft.

020406080100120140160180200220240260280300320340360380400420440460480500520540560580600620640660680700720740
19
59
19
60
19
63
19
64
19
67
19
68
19
71
19
72
19
75
19
76
19
79
19
80
19
83
19
84
19
87
19
88
19
91
19
92
19
95
19
96
19
99
20
00
20
03
20
04
20
07
20
08
20
11
20
12
20
15
20
16
20
19
239124112431245124712491251125312551257125912611263126512671269127112731275127712791281128312851287128912911293129512971299130113031305130713091311131313151
Elev
atio
n (
ft.)
Year
Dep
th t
o W
ater
(ft
.)
OPTI Well 86 HydrographWSE & Depth-to-Water GSE
WSE Min = 2980 ft. WSE Max = 2988 ft. Well Depth = 230 ft.

020406080100120140160180200220240260280300320340360380400420440460480500520540560580600620640660680700720740
19
59
19
60
19
63
19
64
19
67
19
68
19
71
19
72
19
75
19
76
19
79
19
80
19
83
19
84
19
87
19
88
19
91
19
92
19
95
19
96
19
99
20
00
20
03
20
04
20
07
20
08
20
11
20
12
20
15
20
16
20
19
279628162836285628762896291629362956297629963016303630563076309631163136315631763196321632363256327632963316333633563376339634163436345634763496351635363556
Elev
atio
n (
ft.)
Year
Dep
th t
o W
ater
(ft
.)
OPTI Well 87 HydrographWSE & Depth-to-Water GSE
WSE Min = 3358 ft. WSE Max = 3378 ft. Well Depth = 232 ft.

020406080100120140160180200220240260280300320340360380400420440460480500520540560580600620640660680700720740
19
59
19
60
19
63
19
64
19
67
19
68
19
71
19
72
19
75
19
76
19
79
19
80
19
83
19
84
19
87
19
88
19
91
19
92
19
95
19
96
19
99
20
00
20
03
20
04
20
07
20
08
20
11
20
12
20
15
20
16
20
19
279928192839285928792899291929392959297929993019303930593079309931193139315931793199321932393259327932993319333933593379339934193439345934793499351935393559
Elev
atio
n (
ft.)
Year
Dep
th t
o W
ater
(ft
.)
OPTI Well 88 HydrographWSE & Depth-to-Water GSE
WSE Min = 3276 ft. WSE Max = 3322 ft. Well Depth = 400 ft.

020406080100120140160180200220240260280300320340360380400420440460480500520540560580600620640660680700720740
19
59
19
60
19
63
19
64
19
67
19
68
19
71
19
72
19
75
19
76
19
79
19
80
19
83
19
84
19
87
19
88
19
91
19
92
19
95
19
96
19
99
20
00
20
03
20
04
20
07
20
08
20
11
20
12
20
15
20
16
20
19
271127312751277127912811283128512871289129112931295129712991301130313051307130913111313131513171319132113231325132713291331133313351337133913411343134513471
Elev
atio
n (
ft.)
Year
Dep
th t
o W
ater
(ft
.)
OPTI Well 89 HydrographWSE & Depth-to-Water GSE
WSE Min = 3410 ft. WSE Max = 3441 ft. Well Depth = 125 ft.

020406080100120140160180200220240260280300320340360380400420440460480500520540560580600620640660680700720740
19
59
19
60
19
63
19
64
19
67
19
68
19
71
19
72
19
75
19
76
19
79
19
80
19
83
19
84
19
87
19
88
19
91
19
92
19
95
19
96
19
99
20
00
20
03
20
04
20
07
20
08
20
11
20
12
20
15
20
16
20
19
180218221842186218821902192219421962198220022022204220622082210221222142216221822202222222422262228223022322234223622382240224222442246224822502252225422562
Elev
atio
n (
ft.)
Year
Dep
th t
o W
ater
(ft
.)
OPTI Well 90 HydrographWSE & Depth-to-Water GSE
WSE Min = 1899 ft. WSE Max = 1937 ft. Well Depth = 800 ft.

020406080100120140160180200220240260280300320340360380400420440460480500520540560580600620640660680700720740
19
59
19
60
19
63
19
64
19
67
19
68
19
71
19
72
19
75
19
76
19
79
19
80
19
83
19
84
19
87
19
88
19
91
19
92
19
95
19
96
19
99
20
00
20
03
20
04
20
07
20
08
20
11
20
12
20
15
20
16
20
19
172417441764178418041824184418641884190419241944196419842004202420442064208421042124214421642184220422242244226422842304232423442364238424042424244424642484
Elev
atio
n (
ft.)
Year
Dep
th t
o W
ater
(ft
.)
OPTI Well 91 HydrographWSE & Depth-to-Water GSE
WSE Min = 1837 ft. WSE Max = 1915 ft. Well Depth = 980 ft.

020406080100120140160180200220240260280300320340360380400420440460480500520540560580600620640660680700720740
19
59
19
60
19
63
19
64
19
67
19
68
19
71
19
72
19
75
19
76
19
79
19
80
19
83
19
84
19
87
19
88
19
91
19
92
19
95
19
96
19
99
20
00
20
03
20
04
20
07
20
08
20
11
20
12
20
15
20
16
20
19
188519051925194519651985200520252045206520852105212521452165218522052225224522652285230523252345236523852405242524452465248525052525254525652585260526252645
Elev
atio
n (
ft.)
Year
Dep
th t
o W
ater
(ft
.)
OPTI Well 92 HydrographWSE & Depth-to-Water GSE
WSE Min = 2530 ft. WSE Max = 2577 ft. Well Depth = 230 ft.

020406080100120140160180200220240260280300320340360380400420440460480500520540560580600620640660680700720740
19
59
19
60
19
63
19
64
19
67
19
68
19
71
19
72
19
75
19
76
19
79
19
80
19
83
19
84
19
87
19
88
19
91
19
92
19
95
19
96
19
99
20
00
20
03
20
04
20
07
20
08
20
11
20
12
20
15
20
16
20
19
217821982218223822582278229823182338235823782398241824382458247824982518253825582578259826182638265826782698271827382758277827982818283828582878289829182938
Elev
atio
n (
ft.)
Year
Dep
th t
o W
ater
(ft
.)
OPTI Well 93 HydrographWSE & Depth-to-Water GSE
WSE Min = 2822 ft. WSE Max = 2848 ft. Well Depth = 151 ft.

020406080100120140160180200220240260280300320340360380400420440460480500520540560580600620640660680700720740
19
59
19
60
19
63
19
64
19
67
19
68
19
71
19
72
19
75
19
76
19
79
19
80
19
83
19
84
19
87
19
88
19
91
19
92
19
95
19
96
19
99
20
00
20
03
20
04
20
07
20
08
20
11
20
12
20
15
20
16
20
19
170617261746176617861806182618461866188619061926194619661986200620262046206620862106212621462166218622062226224622662286230623262346236623862406242624462466
Elev
atio
n (
ft.)
Year
Dep
th t
o W
ater
(ft
.)
OPTI Well 94 HydrographWSE & Depth-to-Water GSE
WSE Min = 1890 ft. WSE Max = 1915 ft. Well Depth = 550 ft.

020406080100120140160180200220240260280300320340360380400420440460480500520540560580600620640660680700720740
19
59
19
60
19
63
19
64
19
67
19
68
19
71
19
72
19
75
19
76
19
79
19
80
19
83
19
84
19
87
19
88
19
91
19
92
19
95
19
96
19
99
20
00
20
03
20
04
20
07
20
08
20
11
20
12
20
15
20
16
20
19
169917191739175917791799181918391859187918991919193919591979199920192039205920792099211921392159217921992219223922592279229923192339235923792399241924392459
Elev
atio
n (
ft.)
Year
Dep
th t
o W
ater
(ft
.)
OPTI Well 95 HydrographWSE & Depth-to-Water GSE
WSE Min = 1869 ft. WSE Max = 1921 ft. Well Depth = 805 ft.

020406080100120140160180200220240260280300320340360380400420440460480500520540560580600620640660680700720740
19
59
19
60
19
63
19
64
19
67
19
68
19
71
19
72
19
75
19
76
19
79
19
80
19
83
19
84
19
87
19
88
19
91
19
92
19
95
19
96
19
99
20
00
20
03
20
04
20
07
20
08
20
11
20
12
20
15
20
16
20
19
185618761896191619361956197619962016203620562076209621162136215621762196221622362256227622962316233623562376239624162436245624762496251625362556257625962616
Elev
atio
n (
ft.)
Year
Dep
th t
o W
ater
(ft
.)
OPTI Well 96 HydrographWSE & Depth-to-Water GSE
WSE Min = 2276 ft. WSE Max = 2313 ft. Well Depth = 500 ft.

020406080100120140160180200220240260280300320340360380400420440460480500520540560580600620640660680700720740
19
59
19
60
19
63
19
64
19
67
19
68
19
71
19
72
19
75
19
76
19
79
19
80
19
83
19
84
19
87
19
88
19
91
19
92
19
95
19
96
19
99
20
00
20
03
20
04
20
07
20
08
20
11
20
12
20
15
20
16
20
19
183918591879189919191939195919791999201920392059207920992119213921592179219922192239225922792299231923392359237923992419243924592479249925192539255925792599
Elev
atio
n (
ft.)
Year
Dep
th t
o W
ater
(ft
.)
OPTI Well 97 HydrographWSE & Depth-to-Water GSE
WSE Min = 2286 ft. WSE Max = 2294 ft. Well Depth = Unknown ft.

020406080100120140160180200220240260280300320340360380400420440460480500520540560580600620640660680700720740
19
59
19
60
19
63
19
64
19
67
19
68
19
71
19
72
19
75
19
76
19
79
19
80
19
83
19
84
19
87
19
88
19
91
19
92
19
95
19
96
19
99
20
00
20
03
20
04
20
07
20
08
20
11
20
12
20
15
20
16
20
19
193819581978199820182038205820782098211821382158217821982218223822582278229823182338235823782398241824382458247824982518253825582578259826182638265826782698
Elev
atio
n (
ft.)
Year
Dep
th t
o W
ater
(ft
.)
OPTI Well 98 HydrographWSE & Depth-to-Water GSE
WSE Min = 2238 ft. WSE Max = 2255 ft. Well Depth = 750 ft.

020406080100120140160180200220240260280300320340360380400420440460480500520540560580600620640660680700720740
19
59
19
60
19
63
19
64
19
67
19
68
19
71
19
72
19
75
19
76
19
79
19
80
19
83
19
84
19
87
19
88
19
91
19
92
19
95
19
96
19
99
20
00
20
03
20
04
20
07
20
08
20
11
20
12
20
15
20
16
20
19
176317831803182318431863188319031923194319631983200320232043206320832103212321432163218322032223224322632283230323232343236323832403242324432463248325032523
Elev
atio
n (
ft.)
Year
Dep
th t
o W
ater
(ft
.)
OPTI Well 99 HydrographWSE & Depth-to-Water GSE
WSE Min = 2137 ft. WSE Max = 2235 ft. Well Depth = 750 ft.
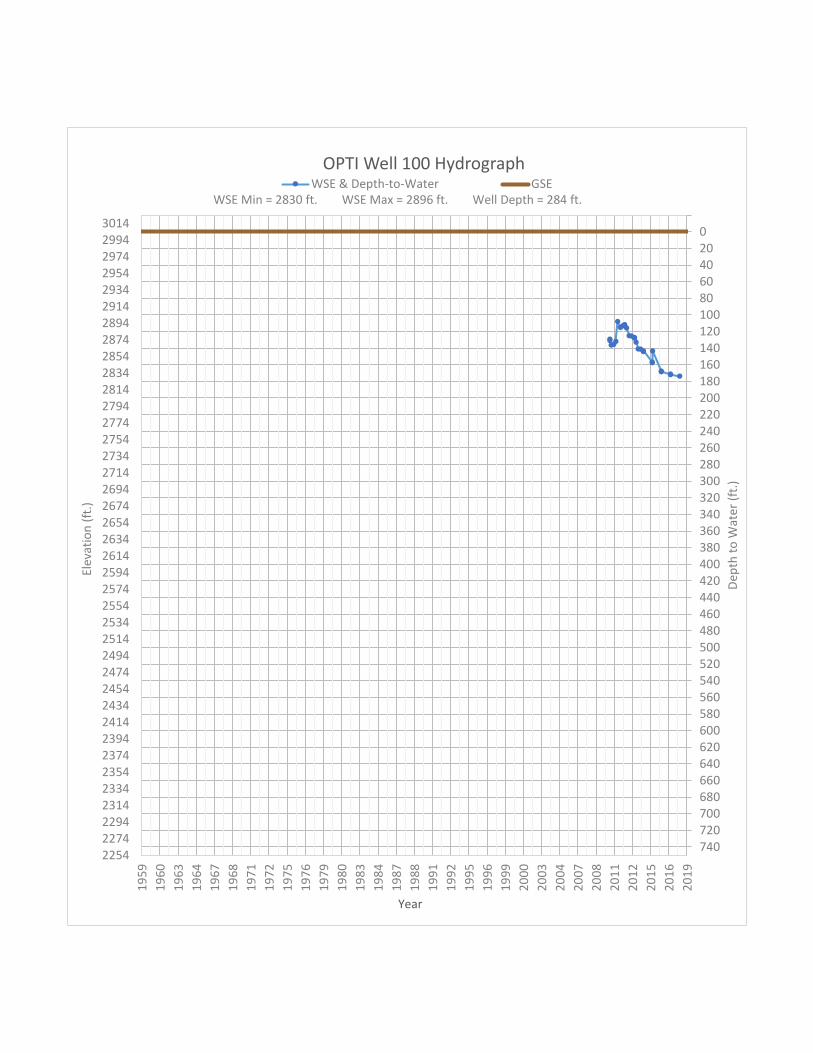
020406080100120140160180200220240260280300320340360380400420440460480500520540560580600620640660680700720740
19
59
19
60
19
63
19
64
19
67
19
68
19
71
19
72
19
75
19
76
19
79
19
80
19
83
19
84
19
87
19
88
19
91
19
92
19
95
19
96
19
99
20
00
20
03
20
04
20
07
20
08
20
11
20
12
20
15
20
16
20
19
225422742294231423342354237423942414243424542474249425142534255425742594261426342654267426942714273427542774279428142834285428742894291429342954297429943014
Elev
atio
n (
ft.)
Year
Dep
th t
o W
ater
(ft
.)
OPTI Well 100 HydrographWSE & Depth-to-Water GSE
WSE Min = 2830 ft. WSE Max = 2896 ft. Well Depth = 284 ft.

020406080100120140160180200220240260280300320340360380400420440460480500520540560580600620640660680700720740
19
59
19
60
19
63
19
64
19
67
19
68
19
71
19
72
19
75
19
76
19
79
19
80
19
83
19
84
19
87
19
88
19
91
19
92
19
95
19
96
19
99
20
00
20
03
20
04
20
07
20
08
20
11
20
12
20
15
20
16
20
19
199120112031205120712091211121312151217121912211223122512271229123112331235123712391241124312451247124912511253125512571259126112631265126712691271127312751
Elev
atio
n (
ft.)
Year
Dep
th t
o W
ater
(ft
.)
OPTI Well 101 HydrographWSE & Depth-to-Water GSE
WSE Min = 2631 ft. WSE Max = 2673 ft. Well Depth = 200 ft.

020406080100120140160180200220240260280300320340360380400420440460480500520540560580600620640660680700720740
19
59
19
60
19
63
19
64
19
67
19
68
19
71
19
72
19
75
19
76
19
79
19
80
19
83
19
84
19
87
19
88
19
91
19
92
19
95
19
96
19
99
20
00
20
03
20
04
20
07
20
08
20
11
20
12
20
15
20
16
20
19
129613161336135613761396141614361456147614961516153615561576159616161636165616761696171617361756177617961816183618561876189619161936195619761996201620362056
Elev
atio
n (
ft.)
Year
Dep
th t
o W
ater
(ft
.)
OPTI Well 102 HydrographWSE & Depth-to-Water GSE
WSE Min = 1802 ft. WSE Max = 1861 ft. Well Depth = Unknown ft.
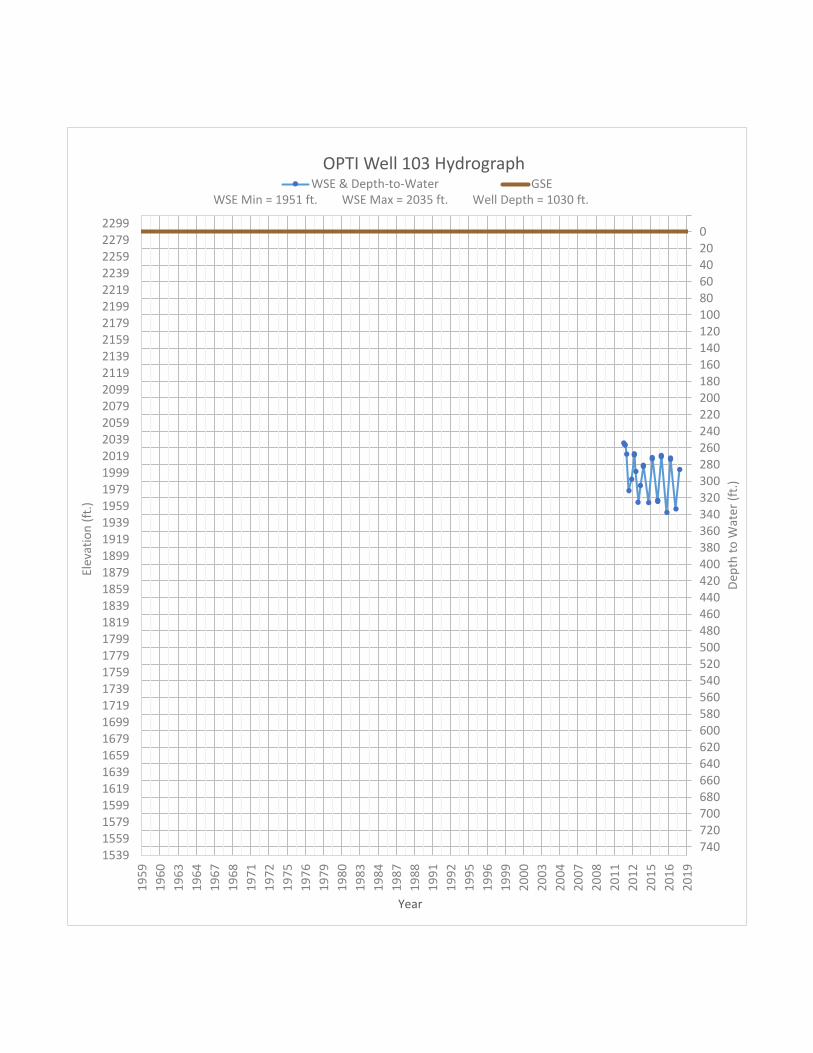
020406080100120140160180200220240260280300320340360380400420440460480500520540560580600620640660680700720740
19
59
19
60
19
63
19
64
19
67
19
68
19
71
19
72
19
75
19
76
19
79
19
80
19
83
19
84
19
87
19
88
19
91
19
92
19
95
19
96
19
99
20
00
20
03
20
04
20
07
20
08
20
11
20
12
20
15
20
16
20
19
153915591579159916191639165916791699171917391759177917991819183918591879189919191939195919791999201920392059207920992119213921592179219922192239225922792299
Elev
atio
n (
ft.)
Year
Dep
th t
o W
ater
(ft
.)
OPTI Well 103 HydrographWSE & Depth-to-Water GSE
WSE Min = 1951 ft. WSE Max = 2035 ft. Well Depth = 1030 ft.

020406080100120140160180200220240260280300320340360380400420440460480500520540560580600620640660680700720740
19
59
19
60
19
63
19
64
19
67
19
68
19
71
19
72
19
75
19
76
19
79
19
80
19
83
19
84
19
87
19
88
19
91
19
92
19
95
19
96
19
99
20
00
20
03
20
04
20
07
20
08
20
11
20
12
20
15
20
16
20
19
154915691589160916291649166916891709172917491769178918091829184918691889190919291949196919892009202920492069208921092129214921692189220922292249226922892309
Elev
atio
n (
ft.)
Year
Dep
th t
o W
ater
(ft
.)
OPTI Well 104 HydrographWSE & Depth-to-Water GSE
WSE Min = 1837 ft. WSE Max = 1907 ft. Well Depth = 640 ft.

020406080100120140160180200220240260280300320340360380400420440460480500520540560580600620640660680700720740
19
59
19
60
19
63
19
64
19
67
19
68
19
71
19
72
19
75
19
76
19
79
19
80
19
83
19
84
19
87
19
88
19
91
19
92
19
95
19
96
19
99
20
00
20
03
20
04
20
07
20
08
20
11
20
12
20
15
20
16
20
19
162416441664168417041724174417641784180418241844186418841904192419441964198420042024204420642084210421242144216421842204222422442264228423042324234423642384
Elev
atio
n (
ft.)
Year
Dep
th t
o W
ater
(ft
.)
OPTI Well 105 HydrographWSE & Depth-to-Water GSE
WSE Min = 1853 ft. WSE Max = 2002 ft. Well Depth = Unknown ft.

020406080100120140160180200220240260280300320340360380400420440460480500520540560580600620640660680700720740
19
59
19
60
19
63
19
64
19
67
19
68
19
71
19
72
19
75
19
76
19
79
19
80
19
83
19
84
19
87
19
88
19
91
19
92
19
95
19
96
19
99
20
00
20
03
20
04
20
07
20
08
20
11
20
12
20
15
20
16
20
19
157715971617163716571677169717171737175717771797181718371857187718971917193719571977199720172037205720772097211721372157217721972217223722572277229723172337
Elev
atio
n (
ft.)
Year
Dep
th t
o W
ater
(ft
.)
OPTI Well 106 HydrographWSE & Depth-to-Water GSE
WSE Min = 2185 ft. WSE Max = 2187 ft. Well Depth = 228 ft.

020406080100120140160180200220240260280300320340360380400420440460480500520540560580600620640660680700720740
19
59
19
60
19
63
19
64
19
67
19
68
19
71
19
72
19
75
19
76
19
79
19
80
19
83
19
84
19
87
19
88
19
91
19
92
19
95
19
96
19
99
20
00
20
03
20
04
20
07
20
08
20
11
20
12
20
15
20
16
20
19
173217521772179218121832185218721892191219321952197219922012203220522072209221122132215221722192221222322252227222922312233223522372239224122432245224722492
Elev
atio
n (
ft.)
Year
Dep
th t
o W
ater
(ft
.)
OPTI Well 107 HydrographWSE & Depth-to-Water GSE
WSE Min = 2350 ft. WSE Max = 2410 ft. Well Depth = 200 ft.

020406080100120140160180200220240260280300320340360380400420440460480500520540560580600620640660680700720740
19
59
19
60
19
63
19
64
19
67
19
68
19
71
19
72
19
75
19
76
19
79
19
80
19
83
19
84
19
87
19
88
19
91
19
92
19
95
19
96
19
99
20
00
20
03
20
04
20
07
20
08
20
11
20
12
20
15
20
16
20
19
187918991919193919591979199920192039205920792099211921392159217921992219223922592279229923192339235923792399241924392459247924992519253925592579259926192639
Elev
atio
n (
ft.)
Year
Dep
th t
o W
ater
(ft
.)
OPTI Well 108 HydrographWSE & Depth-to-Water GSE
WSE Min = 2490 ft. WSE Max = 2494 ft. Well Depth = 329 ft.

020406080100120140160180200220240260280300320340360380400420440460480500520540560580600620640660680700720740
19
59
19
60
19
63
19
64
19
67
19
68
19
71
19
72
19
75
19
76
19
79
19
80
19
83
19
84
19
87
19
88
19
91
19
92
19
95
19
96
19
99
20
00
20
03
20
04
20
07
20
08
20
11
20
12
20
15
20
16
20
19
129613161336135613761396141614361456147614961516153615561576159616161636165616761696171617361756177617961816183618561876189619161936195619761996201620362056
Elev
atio
n (
ft.)
Year
Dep
th t
o W
ater
(ft
.)
OPTI Well 110 HydrographWSE & Depth-to-Water GSE
WSE Min = 2016 ft. WSE Max = 2018 ft. Well Depth = 603 ft.

020406080100120140160180200220240260280300320340360380400420440460480500520540560580600620640660680700720740
19
59
19
60
19
63
19
64
19
67
19
68
19
71
19
72
19
75
19
76
19
79
19
80
19
83
19
84
19
87
19
88
19
91
19
92
19
95
19
96
19
99
20
00
20
03
20
04
20
07
20
08
20
11
20
12
20
15
20
16
20
19
128513051325134513651385140514251445146514851505152515451565158516051625164516651685170517251745176517851805182518451865188519051925194519651985200520252045
Elev
atio
n (
ft.)
Year
Dep
th t
o W
ater
(ft
.)
OPTI Well 111 HydrographWSE & Depth-to-Water GSE
WSE Min = 1956 ft. WSE Max = 1957 ft. Well Depth = 97 ft.

020406080100120140160180200220240260280300320340360380400420440460480500520540560580600620640660680700720740
19
59
19
60
19
63
19
64
19
67
19
68
19
71
19
72
19
75
19
76
19
79
19
80
19
83
19
84
19
87
19
88
19
91
19
92
19
95
19
96
19
99
20
00
20
03
20
04
20
07
20
08
20
11
20
12
20
15
20
16
20
19
138914091429144914691489150915291549156915891609162916491669168917091729174917691789180918291849186918891909192919491969198920092029204920692089210921292149
Elev
atio
n (
ft.)
Year
Dep
th t
o W
ater
(ft
.)
OPTI Well 112 HydrographWSE & Depth-to-Water GSE
WSE Min = 2029 ft. WSE Max = 2057 ft. Well Depth = 441 ft.

020406080100120140160180200220240260280300320340360380400420440460480500520540560580600620640660680700720740
19
59
19
60
19
63
19
64
19
67
19
68
19
71
19
72
19
75
19
76
19
79
19
80
19
83
19
84
19
87
19
88
19
91
19
92
19
95
19
96
19
99
20
00
20
03
20
04
20
07
20
08
20
11
20
12
20
15
20
16
20
19
117511951215123512551275129513151335135513751395141514351455147514951515153515551575159516151635165516751695171517351755177517951815183518551875189519151935
Elev
atio
n (
ft.)
Year
Dep
th t
o W
ater
(ft
.)
OPTI Well 114 HydrographWSE & Depth-to-Water GSE
WSE Min = 1882 ft. WSE Max = 1898 ft. Well Depth = 58 ft.

020406080100120140160180200220240260280300320340360380400420440460480500520540560580600620640660680700720740
19
59
19
60
19
63
19
64
19
67
19
68
19
71
19
72
19
75
19
76
19
79
19
80
19
83
19
84
19
87
19
88
19
91
19
92
19
95
19
96
19
99
20
00
20
03
20
04
20
07
20
08
20
11
20
12
20
15
20
16
20
19
152615461566158616061626164616661686170617261746176617861806182618461866188619061926194619661986200620262046206620862106212621462166218622062226224622662286
Elev
atio
n (
ft.)
Year
Dep
th t
o W
ater
(ft
.)
OPTI Well 115 HydrographWSE & Depth-to-Water GSE
WSE Min = 2173 ft. WSE Max = 2174 ft. Well Depth = 1200 ft.

020406080100120140160180200220240260280300320340360380400420440460480500520540560580600620640660680700720740
19
59
19
60
19
63
19
64
19
67
19
68
19
71
19
72
19
75
19
76
19
79
19
80
19
83
19
84
19
87
19
88
19
91
19
92
19
95
19
96
19
99
20
00
20
03
20
04
20
07
20
08
20
11
20
12
20
15
20
16
20
19
157915991619163916591679169917191739175917791799181918391859187918991919193919591979199920192039205920792099211921392159217921992219223922592279229923192339
Elev
atio
n (
ft.)
Year
Dep
th t
o W
ater
(ft
.)
OPTI Well 116 HydrographWSE & Depth-to-Water GSE
WSE Min = 2079 ft. WSE Max = 2080 ft. Well Depth = 700 ft.

020406080100120140160180200220240260280300320340360380400420440460480500520540560580600620640660680700720740
19
59
19
60
19
63
19
64
19
67
19
68
19
71
19
72
19
75
19
76
19
79
19
80
19
83
19
84
19
87
19
88
19
91
19
92
19
95
19
96
19
99
20
00
20
03
20
04
20
07
20
08
20
11
20
12
20
15
20
16
20
19
134813681388140814281448146814881508152815481568158816081628164816681688170817281748176817881808182818481868188819081928194819681988200820282048206820882108
Elev
atio
n (
ft.)
Year
Dep
th t
o W
ater
(ft
.)
OPTI Well 117 HydrographWSE & Depth-to-Water GSE
WSE Min = 1947 ft. WSE Max = 2005 ft. Well Depth = 212 ft.
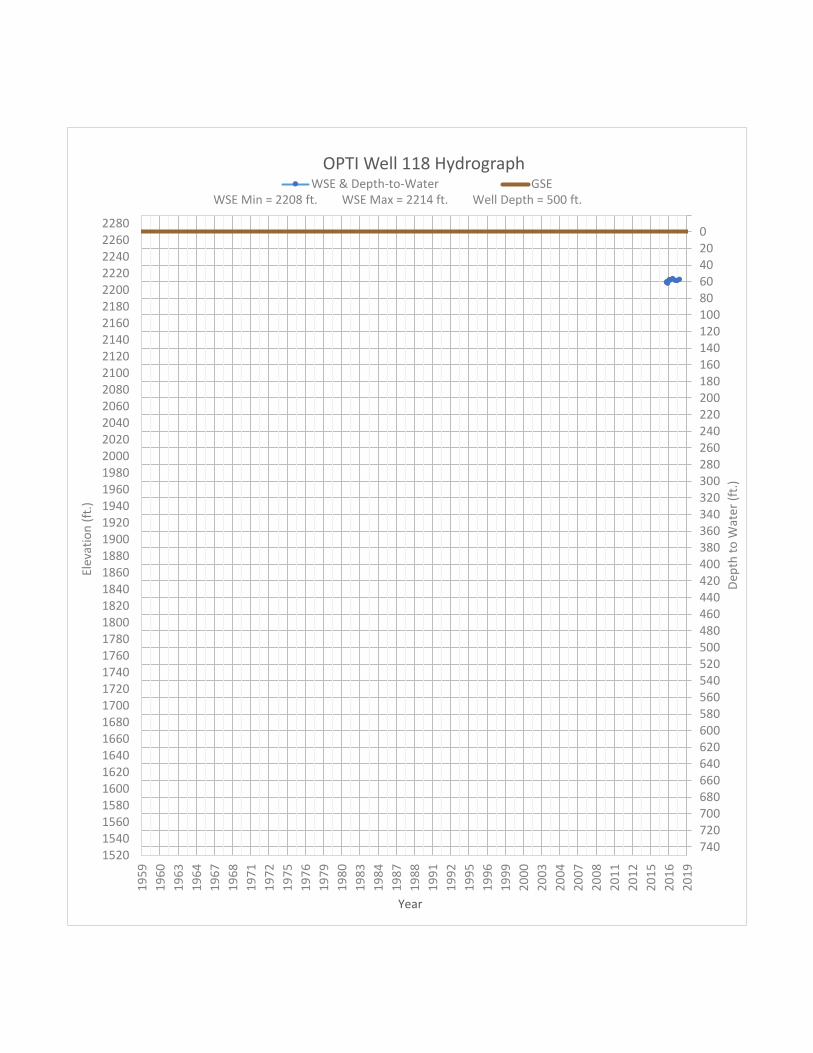
020406080100120140160180200220240260280300320340360380400420440460480500520540560580600620640660680700720740
19
59
19
60
19
63
19
64
19
67
19
68
19
71
19
72
19
75
19
76
19
79
19
80
19
83
19
84
19
87
19
88
19
91
19
92
19
95
19
96
19
99
20
00
20
03
20
04
20
07
20
08
20
11
20
12
20
15
20
16
20
19
152015401560158016001620164016601680170017201740176017801800182018401860188019001920194019601980200020202040206020802100212021402160218022002220224022602280
Elev
atio
n (
ft.)
Year
Dep
th t
o W
ater
(ft
.)
OPTI Well 118 HydrographWSE & Depth-to-Water GSE
WSE Min = 2208 ft. WSE Max = 2214 ft. Well Depth = 500 ft.

020406080100120140160180200220240260280300320340360380400420440460480500520540560580600620640660680700720740
19
59
19
60
19
63
19
64
19
67
19
68
19
71
19
72
19
75
19
76
19
79
19
80
19
83
19
84
19
87
19
88
19
91
19
92
19
95
19
96
19
99
20
00
20
03
20
04
20
07
20
08
20
11
20
12
20
15
20
16
20
19
963983
1003102310431063108311031123114311631183120312231243126312831303132313431363138314031423144314631483150315231543156315831603162316431663168317031723
Elev
atio
n (
ft.)
Year
Dep
th t
o W
ater
(ft
.)
OPTI Well 119 HydrographWSE & Depth-to-Water GSE
WSE Min = 1651 ft. WSE Max = 1657 ft. Well Depth = 92 ft.

020406080100120140160180200220240260280300320340360380400420440460480500520540560580600620640660680700720740
19
59
19
60
19
63
19
64
19
67
19
68
19
71
19
72
19
75
19
76
19
79
19
80
19
83
19
84
19
87
19
88
19
91
19
92
19
95
19
96
19
99
20
00
20
03
20
04
20
07
20
08
20
11
20
12
20
15
20
16
20
19
955975995
101510351055107510951115113511551175119512151235125512751295131513351355137513951415143514551475149515151535155515751595161516351655167516951715
Elev
atio
n (
ft.)
Year
Dep
th t
o W
ater
(ft
.)
OPTI Well 120 HydrographWSE & Depth-to-Water GSE
WSE Min = 1696 ft. WSE Max = 1696 ft. Well Depth = 15 ft.

020406080100120140160180200220240260280300320340360380400420440460480500520540560580600620640660680700720740
19
59
19
60
19
63
19
64
19
67
19
68
19
71
19
72
19
75
19
76
19
79
19
80
19
83
19
84
19
87
19
88
19
91
19
92
19
95
19
96
19
99
20
00
20
03
20
04
20
07
20
08
20
11
20
12
20
15
20
16
20
19
123412541274129413141334135413741394141414341454147414941514153415541574159416141634165416741694171417341754177417941814183418541874189419141934195419741994
Elev
atio
n (
ft.)
Year
Dep
th t
o W
ater
(ft
.)
OPTI Well 121 HydrographWSE & Depth-to-Water GSE
WSE Min = 1916 ft. WSE Max = 1927 ft. Well Depth = 98 ft.

020406080100120140160180200220240260280300320340360380400420440460480500520540560580600620640660680700720740
19
59
19
60
19
63
19
64
19
67
19
68
19
71
19
72
19
75
19
76
19
79
19
80
19
83
19
84
19
87
19
88
19
91
19
92
19
95
19
96
19
99
20
00
20
03
20
04
20
07
20
08
20
11
20
12
20
15
20
16
20
19
137913991419143914591479149915191539155915791599161916391659167916991719173917591779179918191839185918791899191919391959197919992019203920592079209921192139
Elev
atio
n (
ft.)
Year
Dep
th t
o W
ater
(ft
.)
OPTI Well 122 HydrographWSE & Depth-to-Water GSE
WSE Min = 2063 ft. WSE Max = 2101 ft. Well Depth = 63 ft.

020406080100120140160180200220240260280300320340360380400420440460480500520540560580600620640660680700720740
19
59
19
60
19
63
19
64
19
67
19
68
19
71
19
72
19
75
19
76
19
79
19
80
19
83
19
84
19
87
19
88
19
91
19
92
19
95
19
96
19
99
20
00
20
03
20
04
20
07
20
08
20
11
20
12
20
15
20
16
20
19
141514351455147514951515153515551575159516151635165516751695171517351755177517951815183518551875189519151935195519751995201520352055207520952115213521552175
Elev
atio
n (
ft.)
Year
Dep
th t
o W
ater
(ft
.)
OPTI Well 123 HydrographWSE & Depth-to-Water GSE
WSE Min = 2142 ft. WSE Max = 2163 ft. Well Depth = 138 ft.

020406080100120140160180200220240260280300320340360380400420440460480500520540560580600620640660680700720740
19
59
19
60
19
63
19
64
19
67
19
68
19
71
19
72
19
75
19
76
19
79
19
80
19
83
19
84
19
87
19
88
19
91
19
92
19
95
19
96
19
99
20
00
20
03
20
04
20
07
20
08
20
11
20
12
20
15
20
16
20
19
153715571577159716171637165716771697171717371757177717971817183718571877189719171937195719771997201720372057207720972117213721572177219722172237225722772297
Elev
atio
n (
ft.)
Year
Dep
th t
o W
ater
(ft
.)
OPTI Well 124 HydrographWSE & Depth-to-Water GSE
WSE Min = 2224 ft. WSE Max = 2267 ft. Well Depth = 161 ft.

020406080100120140160180200220240260280300320340360380400420440460480500520540560580600620640660680700720740
19
59
19
60
19
63
19
64
19
67
19
68
19
71
19
72
19
75
19
76
19
79
19
80
19
83
19
84
19
87
19
88
19
91
19
92
19
95
19
96
19
99
20
00
20
03
20
04
20
07
20
08
20
11
20
12
20
15
20
16
20
19
153315531573159316131633165316731693171317331753177317931813183318531873189319131933195319731993201320332053207320932113213321532173219322132233225322732293
Elev
atio
n (
ft.)
Year
Dep
th t
o W
ater
(ft
.)
OPTI Well 125 HydrographWSE & Depth-to-Water GSE
WSE Min = 2263 ft. WSE Max = 2280 ft. Well Depth = 26 ft.

020406080100120140160180200220240260280300320340360380400420440460480500520540560580600620640660680700720740
19
59
19
60
19
63
19
64
19
67
19
68
19
71
19
72
19
75
19
76
19
79
19
80
19
83
19
84
19
87
19
88
19
91
19
92
19
95
19
96
19
99
20
00
20
03
20
04
20
07
20
08
20
11
20
12
20
15
20
16
20
19
161416341654167416941714173417541774179418141834185418741894191419341954197419942014203420542074209421142134215421742194221422342254227422942314233423542374
Elev
atio
n (
ft.)
Year
Dep
th t
o W
ater
(ft
.)
OPTI Well 127 HydrographWSE & Depth-to-Water GSE
WSE Min = 2328 ft. WSE Max = 2345 ft. Well Depth = 100 ft.

020406080100120140160180200220240260280300320340360380400420440460480500520540560580600620640660680700720740
19
59
19
60
19
63
19
64
19
67
19
68
19
71
19
72
19
75
19
76
19
79
19
80
19
83
19
84
19
87
19
88
19
91
19
92
19
95
19
96
19
99
20
00
20
03
20
04
20
07
20
08
20
11
20
12
20
15
20
16
20
19
297129913011303130513071309131113131315131713191321132313251327132913311333133513371339134113431345134713491351135313551357135913611363136513671369137113731
Elev
atio
n (
ft.)
Year
Dep
th t
o W
ater
(ft
.)
OPTI Well 128 HydrographWSE & Depth-to-Water GSE
WSE Min = 3661 ft. WSE Max = 3721 ft. Well Depth = 140 ft.

020406080100120140160180200220240260280300320340360380400420440460480500520540560580600620640660680700720740
19
59
19
60
19
63
19
64
19
67
19
68
19
71
19
72
19
75
19
76
19
79
19
80
19
83
19
84
19
87
19
88
19
91
19
92
19
95
19
96
19
99
20
00
20
03
20
04
20
07
20
08
20
11
20
12
20
15
20
16
20
19
289929192939295929792999301930393059307930993119313931593179319932193239325932793299331933393359337933993419343934593479349935193539355935793599361936393659
Elev
atio
n (
ft.)
Year
Dep
th t
o W
ater
(ft
.)
OPTI Well 133 HydrographWSE & Depth-to-Water GSE
WSE Min = 3625 ft. WSE Max = 3625 ft. Well Depth = 84 ft.

020406080100120140160180200220240260280300320340360380400420440460480500520540560580600620640660680700720740
19
59
19
60
19
63
19
64
19
67
19
68
19
71
19
72
19
75
19
76
19
79
19
80
19
83
19
84
19
87
19
88
19
91
19
92
19
95
19
96
19
99
20
00
20
03
20
04
20
07
20
08
20
11
20
12
20
15
20
16
20
19
286428842904292429442964298430043024304430643084310431243144316431843204322432443264328433043324334433643384340434243444346434843504352435443564358436043624
Elev
atio
n (
ft.)
Year
Dep
th t
o W
ater
(ft
.)
OPTI Well 134 HydrographWSE & Depth-to-Water GSE
WSE Min = 3606 ft. WSE Max = 3606 ft. Well Depth = 100 ft.

020406080100120140160180200220240260280300320340360380400420440460480500520540560580600620640660680700720740
19
59
19
60
19
63
19
64
19
67
19
68
19
71
19
72
19
75
19
76
19
79
19
80
19
83
19
84
19
87
19
88
19
91
19
92
19
95
19
96
19
99
20
00
20
03
20
04
20
07
20
08
20
11
20
12
20
15
20
16
20
19
287828982918293829582978299830183038305830783098311831383158317831983218323832583278329833183338335833783398341834383458347834983518353835583578359836183638
Elev
atio
n (
ft.)
Year
Dep
th t
o W
ater
(ft
.)
OPTI Well 135 HydrographWSE & Depth-to-Water GSE
WSE Min = 3610 ft. WSE Max = 3610 ft. Well Depth = 18 ft.

020406080100120140160180200220240260280300320340360380400420440460480500520540560580600620640660680700720740
19
59
19
60
19
63
19
64
19
67
19
68
19
71
19
72
19
75
19
76
19
79
19
80
19
83
19
84
19
87
19
88
19
91
19
92
19
95
19
96
19
99
20
00
20
03
20
04
20
07
20
08
20
11
20
12
20
15
20
16
20
19
283128512871289129112931295129712991301130313051307130913111313131513171319132113231325132713291331133313351337133913411343134513471349135113531355135713591
Elev
atio
n (
ft.)
Year
Dep
th t
o W
ater
(ft
.)
OPTI Well 137 HydrographWSE & Depth-to-Water GSE
WSE Min = 3559 ft. WSE Max = 3561 ft. Well Depth = 125 ft.

020406080100120140160180200220240260280300320340360380400420440460480500520540560580600620640660680700720740
19
59
19
60
19
63
19
64
19
67
19
68
19
71
19
72
19
75
19
76
19
79
19
80
19
83
19
84
19
87
19
88
19
91
19
92
19
95
19
96
19
99
20
00
20
03
20
04
20
07
20
08
20
11
20
12
20
15
20
16
20
19
286128812901292129412961298130013021304130613081310131213141316131813201322132413261328133013321334133613381340134213441346134813501352135413561358136013621
Elev
atio
n (
ft.)
Year
Dep
th t
o W
ater
(ft
.)
OPTI Well 139 HydrographWSE & Depth-to-Water GSE
WSE Min = 3605 ft. WSE Max = 3605 ft. Well Depth = Unknown ft.

020406080100120140160180200220240260280300320340360380400420440460480500520540560580600620640660680700720740
19
59
19
60
19
63
19
64
19
67
19
68
19
71
19
72
19
75
19
76
19
79
19
80
19
83
19
84
19
87
19
88
19
91
19
92
19
95
19
96
19
99
20
00
20
03
20
04
20
07
20
08
20
11
20
12
20
15
20
16
20
19
300030203040306030803100312031403160318032003220324032603280330033203340336033803400342034403460348035003520354035603580360036203640366036803700372037403760
Elev
atio
n (
ft.)
Year
Dep
th t
o W
ater
(ft
.)
OPTI Well 141 HydrographWSE & Depth-to-Water GSE
WSE Min = 3658 ft. WSE Max = 3658 ft. Well Depth = Unknown ft.

020406080100120140160180200220240260280300320340360380400420440460480500520540560580600620640660680700720740
19
59
19
60
19
63
19
64
19
67
19
68
19
71
19
72
19
75
19
76
19
79
19
80
19
83
19
84
19
87
19
88
19
91
19
92
19
95
19
96
19
99
20
00
20
03
20
04
20
07
20
08
20
11
20
12
20
15
20
16
20
19
281528352855287528952915293529552975299530153035305530753095311531353155317531953215323532553275329533153335335533753395341534353455347534953515353535553575
Elev
atio
n (
ft.)
Year
Dep
th t
o W
ater
(ft
.)
OPTI Well 142 HydrographWSE & Depth-to-Water GSE
WSE Min = 3560 ft. WSE Max = 3560 ft. Well Depth = 130 ft.
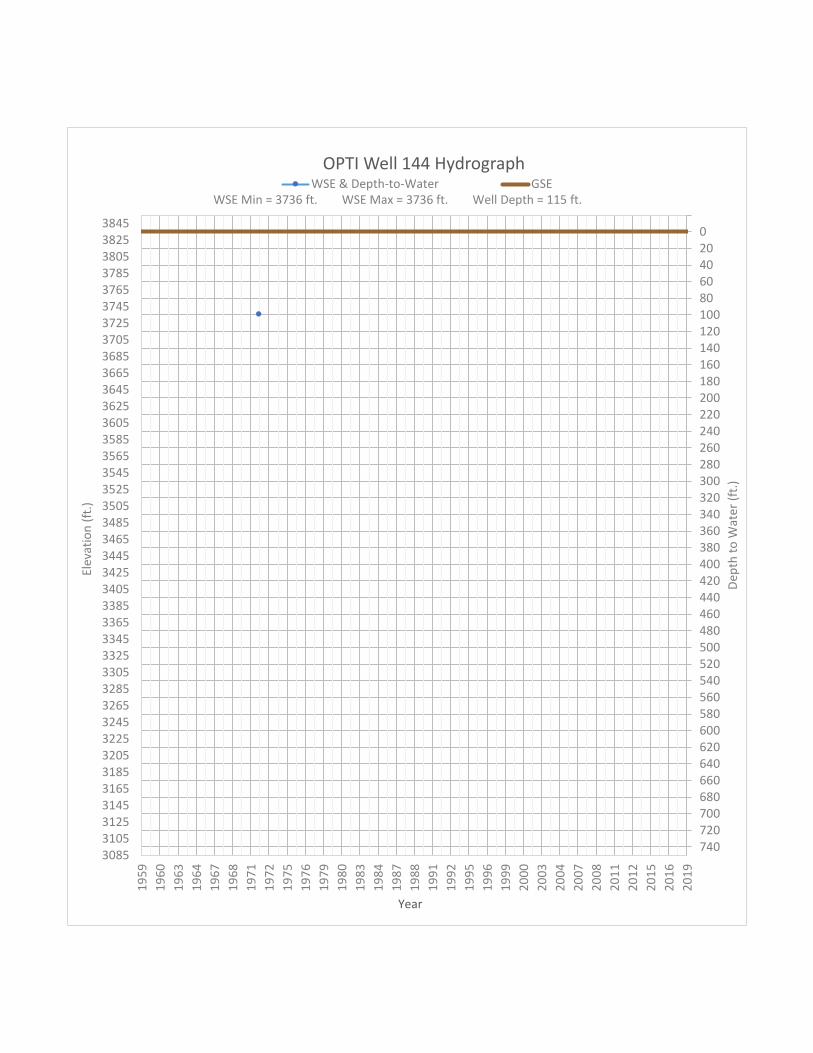
020406080100120140160180200220240260280300320340360380400420440460480500520540560580600620640660680700720740
19
59
19
60
19
63
19
64
19
67
19
68
19
71
19
72
19
75
19
76
19
79
19
80
19
83
19
84
19
87
19
88
19
91
19
92
19
95
19
96
19
99
20
00
20
03
20
04
20
07
20
08
20
11
20
12
20
15
20
16
20
19
308531053125314531653185320532253245326532853305332533453365338534053425344534653485350535253545356535853605362536453665368537053725374537653785380538253845
Elev
atio
n (
ft.)
Year
Dep
th t
o W
ater
(ft
.)
OPTI Well 144 HydrographWSE & Depth-to-Water GSE
WSE Min = 3736 ft. WSE Max = 3736 ft. Well Depth = 115 ft.
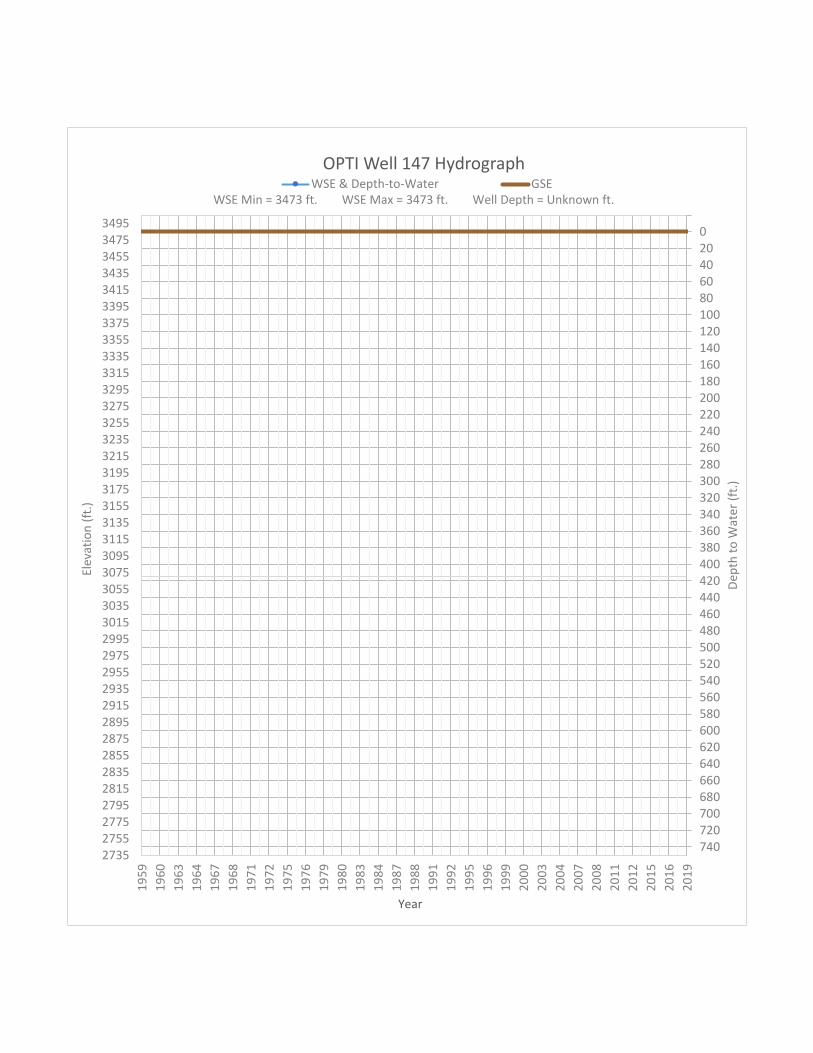
020406080100120140160180200220240260280300320340360380400420440460480500520540560580600620640660680700720740
19
59
19
60
19
63
19
64
19
67
19
68
19
71
19
72
19
75
19
76
19
79
19
80
19
83
19
84
19
87
19
88
19
91
19
92
19
95
19
96
19
99
20
00
20
03
20
04
20
07
20
08
20
11
20
12
20
15
20
16
20
19
273527552775279528152835285528752895291529352955297529953015303530553075309531153135315531753195321532353255327532953315333533553375339534153435345534753495
Elev
atio
n (
ft.)
Year
Dep
th t
o W
ater
(ft
.)
OPTI Well 147 HydrographWSE & Depth-to-Water GSE
WSE Min = 3473 ft. WSE Max = 3473 ft. Well Depth = Unknown ft.

020406080100120140160180200220240260280300320340360380400420440460480500520540560580600620640660680700720740
19
59
19
60
19
63
19
64
19
67
19
68
19
71
19
72
19
75
19
76
19
79
19
80
19
83
19
84
19
87
19
88
19
91
19
92
19
95
19
96
19
99
20
00
20
03
20
04
20
07
20
08
20
11
20
12
20
15
20
16
20
19
294529652985300530253045306530853105312531453165318532053225324532653285330533253345336533853405342534453465348535053525354535653585360536253645366536853705
Elev
atio
n (
ft.)
Year
Dep
th t
o W
ater
(ft
.)
OPTI Well 148 HydrographWSE & Depth-to-Water GSE
WSE Min = 3607 ft. WSE Max = 3607 ft. Well Depth = 414 ft.

020406080100120140160180200220240260280300320340360380400420440460480500520540560580600620640660680700720740
19
59
19
60
19
63
19
64
19
67
19
68
19
71
19
72
19
75
19
76
19
79
19
80
19
83
19
84
19
87
19
88
19
91
19
92
19
95
19
96
19
99
20
00
20
03
20
04
20
07
20
08
20
11
20
12
20
15
20
16
20
19
310931293149316931893209322932493269328933093329334933693389340934293449346934893509352935493569358936093629364936693689370937293749376937893809382938493869
Elev
atio
n (
ft.)
Year
Dep
th t
o W
ater
(ft
.)
OPTI Well 149 HydrographWSE & Depth-to-Water GSE
WSE Min = 3774 ft. WSE Max = 3775 ft. Well Depth = 119 ft.

020406080100120140160180200220240260280300320340360380400420440460480500520540560580600620640660680700720740
19
59
19
60
19
63
19
64
19
67
19
68
19
71
19
72
19
75
19
76
19
79
19
80
19
83
19
84
19
87
19
88
19
91
19
92
19
95
19
96
19
99
20
00
20
03
20
04
20
07
20
08
20
11
20
12
20
15
20
16
20
19
304430643084310431243144316431843204322432443264328433043324334433643384340434243444346434843504352435443564358436043624364436643684370437243744376437843804
Elev
atio
n (
ft.)
Year
Dep
th t
o W
ater
(ft
.)
OPTI Well 151 HydrographWSE & Depth-to-Water GSE
WSE Min = 3734 ft. WSE Max = 3734 ft. Well Depth = 80 ft.

020406080100120140160180200220240260280300320340360380400420440460480500520540560580600620640660680700720740
19
59
19
60
19
63
19
64
19
67
19
68
19
71
19
72
19
75
19
76
19
79
19
80
19
83
19
84
19
87
19
88
19
91
19
92
19
95
19
96
19
99
20
00
20
03
20
04
20
07
20
08
20
11
20
12
20
15
20
16
20
19
293029502970299030103030305030703090311031303150317031903210323032503270329033103330335033703390341034303450347034903510353035503570359036103630365036703690
Elev
atio
n (
ft.)
Year
Dep
th t
o W
ater
(ft
.)
OPTI Well 154 HydrographWSE & Depth-to-Water GSE
WSE Min = 3606 ft. WSE Max = 3606 ft. Well Depth = 370 ft.

020406080100120140160180200220240260280300320340360380400420440460480500520540560580600620640660680700720740
19
59
19
60
19
63
19
64
19
67
19
68
19
71
19
72
19
75
19
76
19
79
19
80
19
83
19
84
19
87
19
88
19
91
19
92
19
95
19
96
19
99
20
00
20
03
20
04
20
07
20
08
20
11
20
12
20
15
20
16
20
19
289229122932295229722992301230323052307230923112313231523172319232123232325232723292331233323352337233923412343234523472349235123532355235723592361236323652
Elev
atio
n (
ft.)
Year
Dep
th t
o W
ater
(ft
.)
OPTI Well 155 HydrographWSE & Depth-to-Water GSE
WSE Min = 3594 ft. WSE Max = 3594 ft. Well Depth = Unknown ft.

020406080100120140160180200220240260280300320340360380400420440460480500520540560580600620640660680700720740
19
59
19
60
19
63
19
64
19
67
19
68
19
71
19
72
19
75
19
76
19
79
19
80
19
83
19
84
19
87
19
88
19
91
19
92
19
95
19
96
19
99
20
00
20
03
20
04
20
07
20
08
20
11
20
12
20
15
20
16
20
19
300530253045306530853105312531453165318532053225324532653285330533253345336533853405342534453465348535053525354535653585360536253645366536853705372537453765
Elev
atio
n (
ft.)
Year
Dep
th t
o W
ater
(ft
.)
OPTI Well 157 HydrographWSE & Depth-to-Water GSE
WSE Min = 3700 ft. WSE Max = 3700 ft. Well Depth = 71 ft.
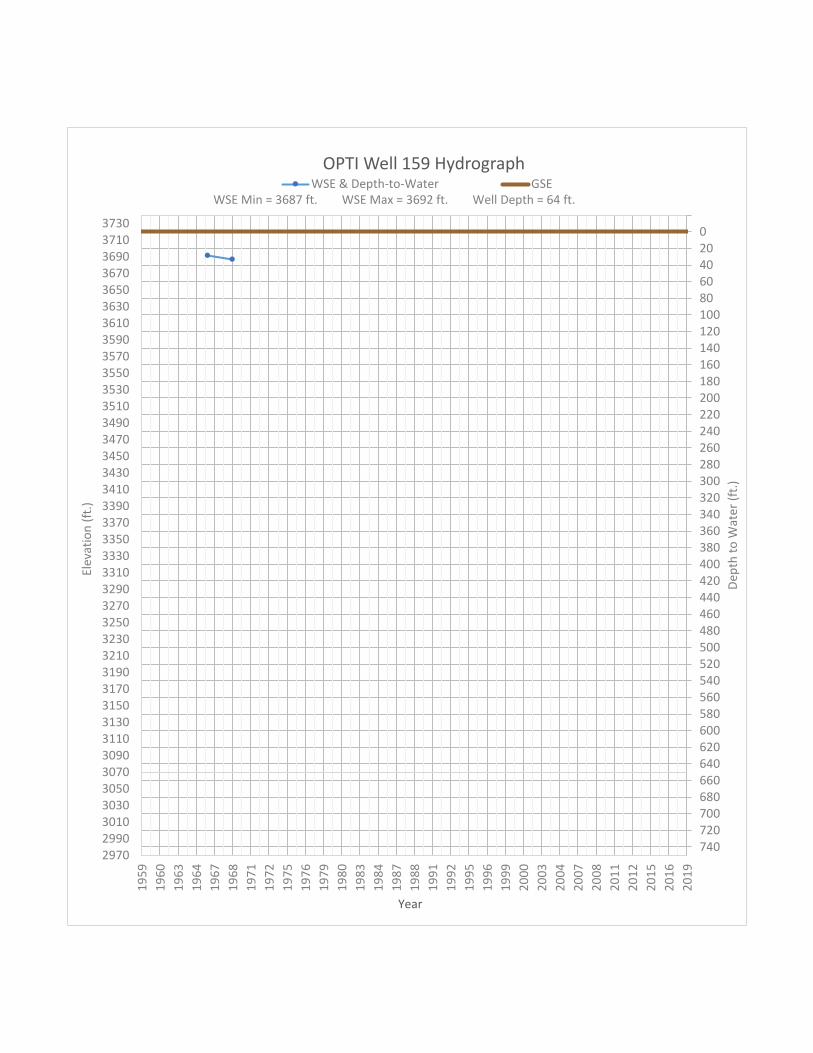
020406080100120140160180200220240260280300320340360380400420440460480500520540560580600620640660680700720740
19
59
19
60
19
63
19
64
19
67
19
68
19
71
19
72
19
75
19
76
19
79
19
80
19
83
19
84
19
87
19
88
19
91
19
92
19
95
19
96
19
99
20
00
20
03
20
04
20
07
20
08
20
11
20
12
20
15
20
16
20
19
297029903010303030503070309031103130315031703190321032303250327032903310333033503370339034103430345034703490351035303550357035903610363036503670369037103730
Elev
atio
n (
ft.)
Year
Dep
th t
o W
ater
(ft
.)
OPTI Well 159 HydrographWSE & Depth-to-Water GSE
WSE Min = 3687 ft. WSE Max = 3692 ft. Well Depth = 64 ft.

020406080100120140160180200220240260280300320340360380400420440460480500520540560580600620640660680700720740
19
59
19
60
19
63
19
64
19
67
19
68
19
71
19
72
19
75
19
76
19
79
19
80
19
83
19
84
19
87
19
88
19
91
19
92
19
95
19
96
19
99
20
00
20
03
20
04
20
07
20
08
20
11
20
12
20
15
20
16
20
19
302730473067308731073127314731673187320732273247326732873307332733473367338734073427344734673487350735273547356735873607362736473667368737073727374737673787
Elev
atio
n (
ft.)
Year
Dep
th t
o W
ater
(ft
.)
OPTI Well 162 HydrographWSE & Depth-to-Water GSE
WSE Min = 3742 ft. WSE Max = 3742 ft. Well Depth = 150 ft.

020406080100120140160180200220240260280300320340360380400420440460480500520540560580600620640660680700720740
19
59
19
60
19
63
19
64
19
67
19
68
19
71
19
72
19
75
19
76
19
79
19
80
19
83
19
84
19
87
19
88
19
91
19
92
19
95
19
96
19
99
20
00
20
03
20
04
20
07
20
08
20
11
20
12
20
15
20
16
20
19
300530253045306530853105312531453165318532053225324532653285330533253345336533853405342534453465348535053525354535653585360536253645366536853705372537453765
Elev
atio
n (
ft.)
Year
Dep
th t
o W
ater
(ft
.)
OPTI Well 163 HydrographWSE & Depth-to-Water GSE
WSE Min = 3717 ft. WSE Max = 3717 ft. Well Depth = 78 ft.

020406080100120140160180200220240260280300320340360380400420440460480500520540560580600620640660680700720740
19
59
19
60
19
63
19
64
19
67
19
68
19
71
19
72
19
75
19
76
19
79
19
80
19
83
19
84
19
87
19
88
19
91
19
92
19
95
19
96
19
99
20
00
20
03
20
04
20
07
20
08
20
11
20
12
20
15
20
16
20
19
294229622982300230223042306230823102312231423162318232023222324232623282330233223342336233823402342234423462348235023522354235623582360236223642366236823702
Elev
atio
n (
ft.)
Year
Dep
th t
o W
ater
(ft
.)
OPTI Well 164 HydrographWSE & Depth-to-Water GSE
WSE Min = 3680 ft. WSE Max = 3680 ft. Well Depth = 180 ft.

020406080100120140160180200220240260280300320340360380400420440460480500520540560580600620640660680700720740
19
59
19
60
19
63
19
64
19
67
19
68
19
71
19
72
19
75
19
76
19
79
19
80
19
83
19
84
19
87
19
88
19
91
19
92
19
95
19
96
19
99
20
00
20
03
20
04
20
07
20
08
20
11
20
12
20
15
20
16
20
19
270027202740276027802800282028402860288029002920294029602980300030203040306030803100312031403160318032003220324032603280330033203340336033803400342034403460
Elev
atio
n (
ft.)
Year
Dep
th t
o W
ater
(ft
.)
OPTI Well 166 HydrographWSE & Depth-to-Water GSE
WSE Min = 3422 ft. WSE Max = 3422 ft. Well Depth = 120 ft.

020406080100120140160180200220240260280300320340360380400420440460480500520540560580600620640660680700720740
19
59
19
60
19
63
19
64
19
67
19
68
19
71
19
72
19
75
19
76
19
79
19
80
19
83
19
84
19
87
19
88
19
91
19
92
19
95
19
96
19
99
20
00
20
03
20
04
20
07
20
08
20
11
20
12
20
15
20
16
20
19
279428142834285428742894291429342954297429943014303430543074309431143134315431743194321432343254327432943314333433543374339434143434345434743494351435343554
Elev
atio
n (
ft.)
Year
Dep
th t
o W
ater
(ft
.)
OPTI Well 170 HydrographWSE & Depth-to-Water GSE
WSE Min = 3530 ft. WSE Max = 3530 ft. Well Depth = Unknown ft.

020406080100120140160180200220240260280300320340360380400420440460480500520540560580600620640660680700720740
19
59
19
60
19
63
19
64
19
67
19
68
19
71
19
72
19
75
19
76
19
79
19
80
19
83
19
84
19
87
19
88
19
91
19
92
19
95
19
96
19
99
20
00
20
03
20
04
20
07
20
08
20
11
20
12
20
15
20
16
20
19
269727172737275727772797281728372857287728972917293729572977299730173037305730773097311731373157317731973217323732573277329733173337335733773397341734373457
Elev
atio
n (
ft.)
Year
Dep
th t
o W
ater
(ft
.)
OPTI Well 171 HydrographWSE & Depth-to-Water GSE
WSE Min = 3423 ft. WSE Max = 3423 ft. Well Depth = 84 ft.

020406080100120140160180200220240260280300320340360380400420440460480500520540560580600620640660680700720740
19
59
19
60
19
63
19
64
19
67
19
68
19
71
19
72
19
75
19
76
19
79
19
80
19
83
19
84
19
87
19
88
19
91
19
92
19
95
19
96
19
99
20
00
20
03
20
04
20
07
20
08
20
11
20
12
20
15
20
16
20
19
264926692689270927292749276927892809282928492869288929092929294929692989300930293049306930893109312931493169318932093229324932693289330933293349336933893409
Elev
atio
n (
ft.)
Year
Dep
th t
o W
ater
(ft
.)
OPTI Well 173 HydrographWSE & Depth-to-Water GSE
WSE Min = 3374 ft. WSE Max = 3387 ft. Well Depth = 60 ft.
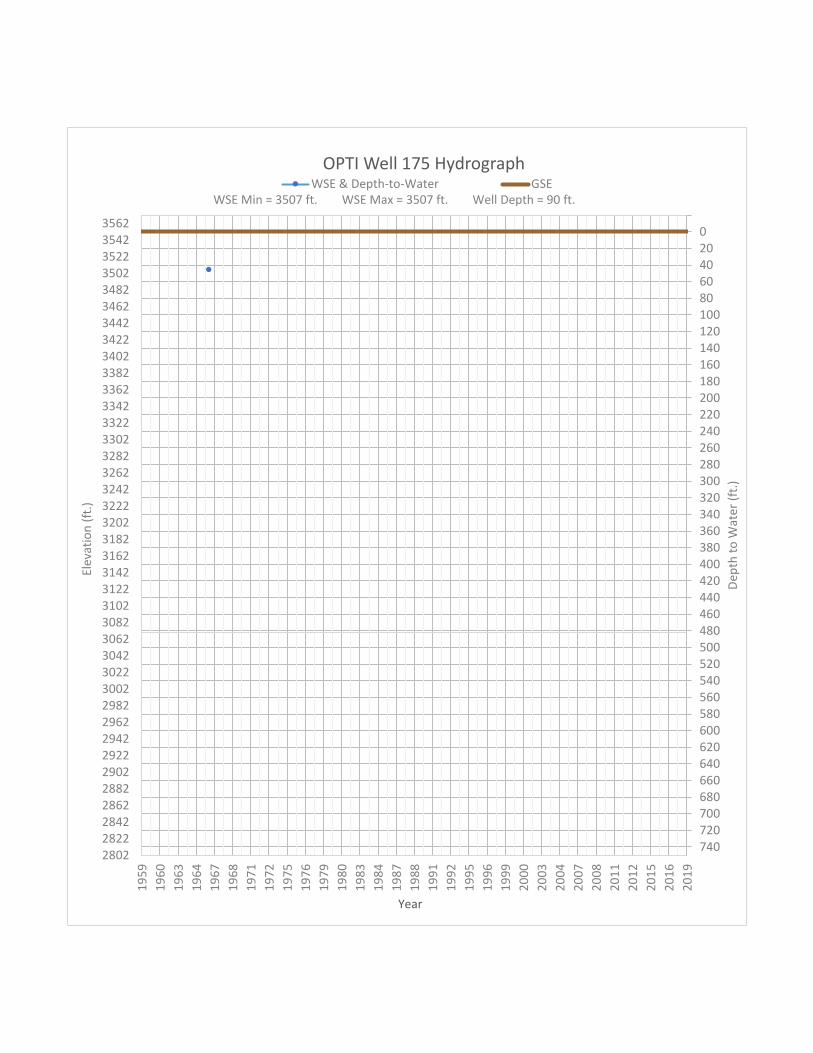
020406080100120140160180200220240260280300320340360380400420440460480500520540560580600620640660680700720740
19
59
19
60
19
63
19
64
19
67
19
68
19
71
19
72
19
75
19
76
19
79
19
80
19
83
19
84
19
87
19
88
19
91
19
92
19
95
19
96
19
99
20
00
20
03
20
04
20
07
20
08
20
11
20
12
20
15
20
16
20
19
280228222842286228822902292229422962298230023022304230623082310231223142316231823202322232423262328233023322334233623382340234223442346234823502352235423562
Elev
atio
n (
ft.)
Year
Dep
th t
o W
ater
(ft
.)
OPTI Well 175 HydrographWSE & Depth-to-Water GSE
WSE Min = 3507 ft. WSE Max = 3507 ft. Well Depth = 90 ft.

020406080100120140160180200220240260280300320340360380400420440460480500520540560580600620640660680700720740
19
59
19
60
19
63
19
64
19
67
19
68
19
71
19
72
19
75
19
76
19
79
19
80
19
83
19
84
19
87
19
88
19
91
19
92
19
95
19
96
19
99
20
00
20
03
20
04
20
07
20
08
20
11
20
12
20
15
20
16
20
19
266326832703272327432763278328032823284328632883290329232943296329833003302330433063308331033123314331633183320332233243326332833303332333433363338334033423
Elev
atio
n (
ft.)
Year
Dep
th t
o W
ater
(ft
.)
OPTI Well 179 HydrographWSE & Depth-to-Water GSE
WSE Min = 3327 ft. WSE Max = 3330 ft. Well Depth = 95 ft.

020406080100120140160180200220240260280300320340360380400420440460480500520540560580600620640660680700720740
19
59
19
60
19
63
19
64
19
67
19
68
19
71
19
72
19
75
19
76
19
79
19
80
19
83
19
84
19
87
19
88
19
91
19
92
19
95
19
96
19
99
20
00
20
03
20
04
20
07
20
08
20
11
20
12
20
15
20
16
20
19
259426142634265426742694271427342754277427942814283428542874289429142934295429742994301430343054307430943114313431543174319432143234325432743294331433343354
Elev
atio
n (
ft.)
Year
Dep
th t
o W
ater
(ft
.)
OPTI Well 180 HydrographWSE & Depth-to-Water GSE
WSE Min = 3341 ft. WSE Max = 3341 ft. Well Depth = Unknown ft.

020406080100120140160180200220240260280300320340360380400420440460480500520540560580600620640660680700720740
19
59
19
60
19
63
19
64
19
67
19
68
19
71
19
72
19
75
19
76
19
79
19
80
19
83
19
84
19
87
19
88
19
91
19
92
19
95
19
96
19
99
20
00
20
03
20
04
20
07
20
08
20
11
20
12
20
15
20
16
20
19
259726172637265726772697271727372757277727972817283728572877289729172937295729772997301730373057307730973117313731573177319732173237325732773297331733373357
Elev
atio
n (
ft.)
Year
Dep
th t
o W
ater
(ft
.)
OPTI Well 181 HydrographWSE & Depth-to-Water GSE
WSE Min = 3339 ft. WSE Max = 3344 ft. Well Depth = Unknown ft.

020406080100120140160180200220240260280300320340360380400420440460480500520540560580600620640660680700720740
19
59
19
60
19
63
19
64
19
67
19
68
19
71
19
72
19
75
19
76
19
79
19
80
19
83
19
84
19
87
19
88
19
91
19
92
19
95
19
96
19
99
20
00
20
03
20
04
20
07
20
08
20
11
20
12
20
15
20
16
20
19
276327832803282328432863288329032923294329632983300330233043306330833103312331433163318332033223324332633283330333233343336333833403342334433463348335033523
Elev
atio
n (
ft.)
Year
Dep
th t
o W
ater
(ft
.)
OPTI Well 182 HydrographWSE & Depth-to-Water GSE
WSE Min = 3384 ft. WSE Max = 3389 ft. Well Depth = Unknown ft.

020406080100120140160180200220240260280300320340360380400420440460480500520540560580600620640660680700720740
19
59
19
60
19
63
19
64
19
67
19
68
19
71
19
72
19
75
19
76
19
79
19
80
19
83
19
84
19
87
19
88
19
91
19
92
19
95
19
96
19
99
20
00
20
03
20
04
20
07
20
08
20
11
20
12
20
15
20
16
20
19
258126012621264126612681270127212741276127812801282128412861288129012921294129612981300130213041306130813101312131413161318132013221324132613281330133213341
Elev
atio
n (
ft.)
Year
Dep
th t
o W
ater
(ft
.)
OPTI Well 183 HydrographWSE & Depth-to-Water GSE
WSE Min = 3294 ft. WSE Max = 3306 ft. Well Depth = 64 ft.

020406080100120140160180200220240260280300320340360380400420440460480500520540560580600620640660680700720740
19
59
19
60
19
63
19
64
19
67
19
68
19
71
19
72
19
75
19
76
19
79
19
80
19
83
19
84
19
87
19
88
19
91
19
92
19
95
19
96
19
99
20
00
20
03
20
04
20
07
20
08
20
11
20
12
20
15
20
16
20
19
268727072727274727672787280728272847286728872907292729472967298730073027304730673087310731273147316731873207322732473267328733073327334733673387340734273447
Elev
atio
n (
ft.)
Year
Dep
th t
o W
ater
(ft
.)
OPTI Well 185 HydrographWSE & Depth-to-Water GSE
WSE Min = 3431 ft. WSE Max = 3431 ft. Well Depth = 14 ft.

020406080100120140160180200220240260280300320340360380400420440460480500520540560580600620640660680700720740
19
59
19
60
19
63
19
64
19
67
19
68
19
71
19
72
19
75
19
76
19
79
19
80
19
83
19
84
19
87
19
88
19
91
19
92
19
95
19
96
19
99
20
00
20
03
20
04
20
07
20
08
20
11
20
12
20
15
20
16
20
19
252925492569258926092629264926692689270927292749276927892809282928492869288929092929294929692989300930293049306930893109312931493169318932093229324932693289
Elev
atio
n (
ft.)
Year
Dep
th t
o W
ater
(ft
.)
OPTI Well 186 HydrographWSE & Depth-to-Water GSE
WSE Min = 3214 ft. WSE Max = 3241 ft. Well Depth = 109 ft.

020406080100120140160180200220240260280300320340360380400420440460480500520540560580600620640660680700720740
19
59
19
60
19
63
19
64
19
67
19
68
19
71
19
72
19
75
19
76
19
79
19
80
19
83
19
84
19
87
19
88
19
91
19
92
19
95
19
96
19
99
20
00
20
03
20
04
20
07
20
08
20
11
20
12
20
15
20
16
20
19
254225622582260226222642266226822702272227422762278228022822284228622882290229222942296229823002302230423062308231023122314231623182320232223242326232823302
Elev
atio
n (
ft.)
Year
Dep
th t
o W
ater
(ft
.)
OPTI Well 188 HydrographWSE & Depth-to-Water GSE
WSE Min = 3223 ft. WSE Max = 3227 ft. Well Depth = 121 ft.

020406080100120140160180200220240260280300320340360380400420440460480500520540560580600620640660680700720740
19
59
19
60
19
63
19
64
19
67
19
68
19
71
19
72
19
75
19
76
19
79
19
80
19
83
19
84
19
87
19
88
19
91
19
92
19
95
19
96
19
99
20
00
20
03
20
04
20
07
20
08
20
11
20
12
20
15
20
16
20
19
261026302650267026902710273027502770279028102830285028702890291029302950297029903010303030503070309031103130315031703190321032303250327032903310333033503370
Elev
atio
n (
ft.)
Year
Dep
th t
o W
ater
(ft
.)
OPTI Well 189 HydrographWSE & Depth-to-Water GSE
WSE Min = 3277 ft. WSE Max = 3280 ft. Well Depth = 84 ft.

020406080100120140160180200220240260280300320340360380400420440460480500520540560580600620640660680700720740
19
59
19
60
19
63
19
64
19
67
19
68
19
71
19
72
19
75
19
76
19
79
19
80
19
83
19
84
19
87
19
88
19
91
19
92
19
95
19
96
19
99
20
00
20
03
20
04
20
07
20
08
20
11
20
12
20
15
20
16
20
19
256025802600262026402660268027002720274027602780280028202840286028802900292029402960298030003020304030603080310031203140316031803200322032403260328033003320
Elev
atio
n (
ft.)
Year
Dep
th t
o W
ater
(ft
.)
OPTI Well 190 HydrographWSE & Depth-to-Water GSE
WSE Min = 3206 ft. WSE Max = 3210 ft. Well Depth = 115 ft.

020406080100120140160180200220240260280300320340360380400420440460480500520540560580600620640660680700720740
19
59
19
60
19
63
19
64
19
67
19
68
19
71
19
72
19
75
19
76
19
79
19
80
19
83
19
84
19
87
19
88
19
91
19
92
19
95
19
96
19
99
20
00
20
03
20
04
20
07
20
08
20
11
20
12
20
15
20
16
20
19
235523752395241524352455247524952515253525552575259526152635265526752695271527352755277527952815283528552875289529152935295529752995301530353055307530953115
Elev
atio
n (
ft.)
Year
Dep
th t
o W
ater
(ft
.)
OPTI Well 192 HydrographWSE & Depth-to-Water GSE
WSE Min = 3048 ft. WSE Max = 3053 ft. Well Depth = Unknown ft.

020406080100120140160180200220240260280300320340360380400420440460480500520540560580600620640660680700720740
19
59
19
60
19
63
19
64
19
67
19
68
19
71
19
72
19
75
19
76
19
79
19
80
19
83
19
84
19
87
19
88
19
91
19
92
19
95
19
96
19
99
20
00
20
03
20
04
20
07
20
08
20
11
20
12
20
15
20
16
20
19
254525652585260526252645266526852705272527452765278528052825284528652885290529252945296529853005302530453065308531053125314531653185320532253245326532853305
Elev
atio
n (
ft.)
Year
Dep
th t
o W
ater
(ft
.)
OPTI Well 198 HydrographWSE & Depth-to-Water GSE
WSE Min = 3118 ft. WSE Max = 3119 ft. Well Depth = Unknown ft.
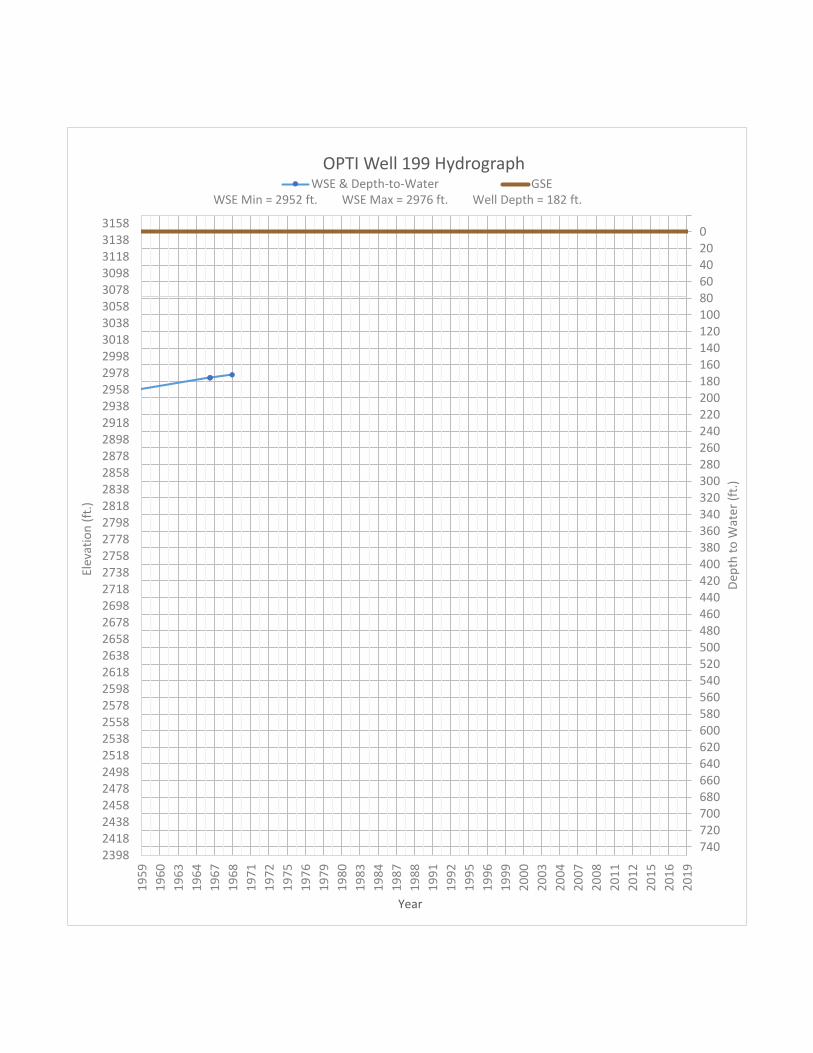
020406080100120140160180200220240260280300320340360380400420440460480500520540560580600620640660680700720740
19
59
19
60
19
63
19
64
19
67
19
68
19
71
19
72
19
75
19
76
19
79
19
80
19
83
19
84
19
87
19
88
19
91
19
92
19
95
19
96
19
99
20
00
20
03
20
04
20
07
20
08
20
11
20
12
20
15
20
16
20
19
239824182438245824782498251825382558257825982618263826582678269827182738275827782798281828382858287828982918293829582978299830183038305830783098311831383158
Elev
atio
n (
ft.)
Year
Dep
th t
o W
ater
(ft
.)
OPTI Well 199 HydrographWSE & Depth-to-Water GSE
WSE Min = 2952 ft. WSE Max = 2976 ft. Well Depth = 182 ft.

020406080100120140160180200220240260280300320340360380400420440460480500520540560580600620640660680700720740
19
59
19
60
19
63
19
64
19
67
19
68
19
71
19
72
19
75
19
76
19
79
19
80
19
83
19
84
19
87
19
88
19
91
19
92
19
95
19
96
19
99
20
00
20
03
20
04
20
07
20
08
20
11
20
12
20
15
20
16
20
19
240624262446246624862506252625462566258626062626264626662686270627262746276627862806282628462866288629062926294629662986300630263046306630863106312631463166
Elev
atio
n (
ft.)
Year
Dep
th t
o W
ater
(ft
.)
OPTI Well 201 HydrographWSE & Depth-to-Water GSE
WSE Min = 2949 ft. WSE Max = 2949 ft. Well Depth = 260 ft.
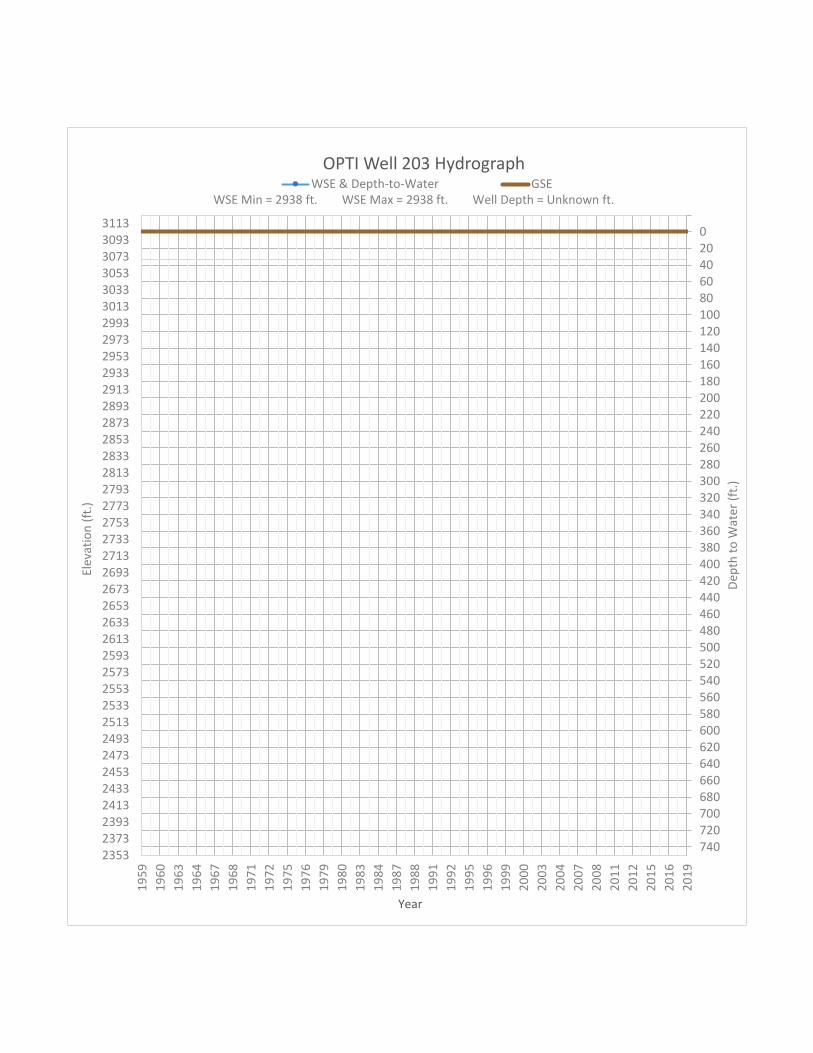
020406080100120140160180200220240260280300320340360380400420440460480500520540560580600620640660680700720740
19
59
19
60
19
63
19
64
19
67
19
68
19
71
19
72
19
75
19
76
19
79
19
80
19
83
19
84
19
87
19
88
19
91
19
92
19
95
19
96
19
99
20
00
20
03
20
04
20
07
20
08
20
11
20
12
20
15
20
16
20
19
235323732393241324332453247324932513253325532573259326132633265326732693271327332753277327932813283328532873289329132933295329732993301330333053307330933113
Elev
atio
n (
ft.)
Year
Dep
th t
o W
ater
(ft
.)
OPTI Well 203 HydrographWSE & Depth-to-Water GSE
WSE Min = 2938 ft. WSE Max = 2938 ft. Well Depth = Unknown ft.
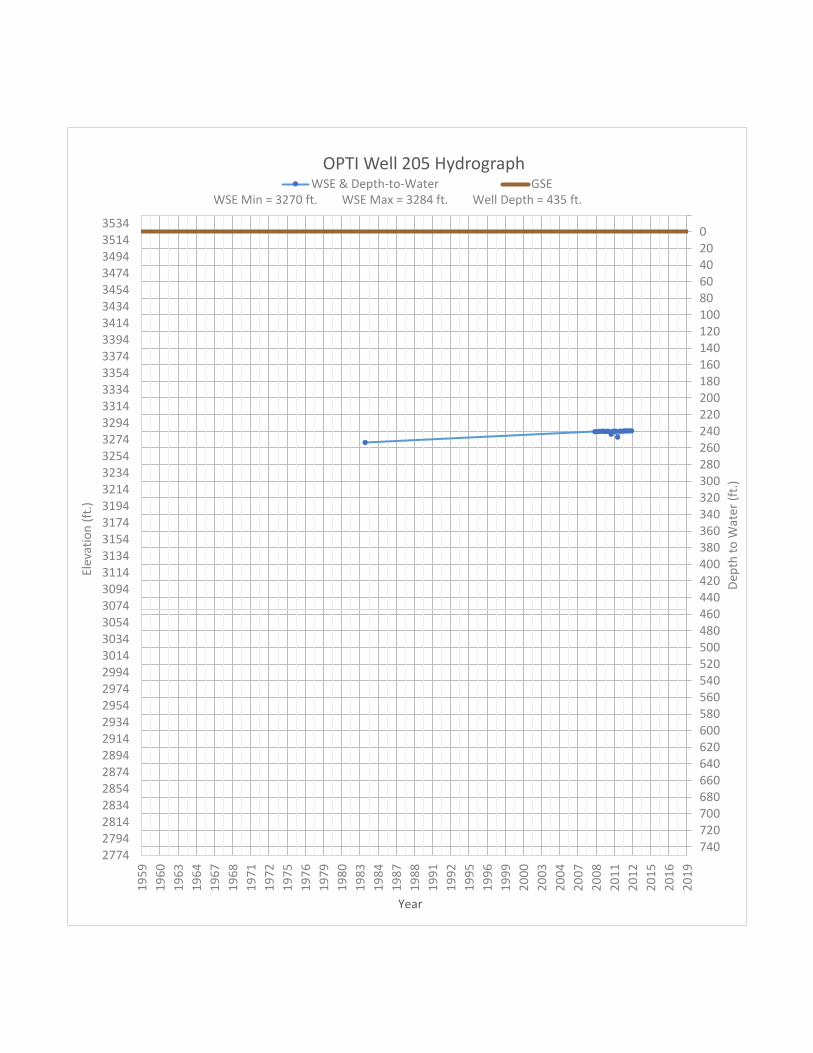
020406080100120140160180200220240260280300320340360380400420440460480500520540560580600620640660680700720740
19
59
19
60
19
63
19
64
19
67
19
68
19
71
19
72
19
75
19
76
19
79
19
80
19
83
19
84
19
87
19
88
19
91
19
92
19
95
19
96
19
99
20
00
20
03
20
04
20
07
20
08
20
11
20
12
20
15
20
16
20
19
277427942814283428542874289429142934295429742994301430343054307430943114313431543174319432143234325432743294331433343354337433943414343434543474349435143534
Elev
atio
n (
ft.)
Year
Dep
th t
o W
ater
(ft
.)
OPTI Well 205 HydrographWSE & Depth-to-Water GSE
WSE Min = 3270 ft. WSE Max = 3284 ft. Well Depth = 435 ft.

020406080100120140160180200220240260280300320340360380400420440460480500520540560580600620640660680700720740
19
59
19
60
19
63
19
64
19
67
19
68
19
71
19
72
19
75
19
76
19
79
19
80
19
83
19
84
19
87
19
88
19
91
19
92
19
95
19
96
19
99
20
00
20
03
20
04
20
07
20
08
20
11
20
12
20
15
20
16
20
19
240024202440246024802500252025402560258026002620264026602680270027202740276027802800282028402860288029002920294029602980300030203040306030803100312031403160
Elev
atio
n (
ft.)
Year
Dep
th t
o W
ater
(ft
.)
OPTI Well 206 HydrographWSE & Depth-to-Water GSE
WSE Min = 2843 ft. WSE Max = 2843 ft. Well Depth = 402 ft.

020406080100120140160180200220240260280300320340360380400420440460480500520540560580600620640660680700720740
19
59
19
60
19
63
19
64
19
67
19
68
19
71
19
72
19
75
19
76
19
79
19
80
19
83
19
84
19
87
19
88
19
91
19
92
19
95
19
96
19
99
20
00
20
03
20
04
20
07
20
08
20
11
20
12
20
15
20
16
20
19
229823182338235823782398241824382458247824982518253825582578259826182638265826782698271827382758277827982818283828582878289829182938295829782998301830383058
Elev
atio
n (
ft.)
Year
Dep
th t
o W
ater
(ft
.)
OPTI Well 208 HydrographWSE & Depth-to-Water GSE
WSE Min = 2912 ft. WSE Max = 2913 ft. Well Depth = 172 ft.

020406080100120140160180200220240260280300320340360380400420440460480500520540560580600620640660680700720740
19
59
19
60
19
63
19
64
19
67
19
68
19
71
19
72
19
75
19
76
19
79
19
80
19
83
19
84
19
87
19
88
19
91
19
92
19
95
19
96
19
99
20
00
20
03
20
04
20
07
20
08
20
11
20
12
20
15
20
16
20
19
229523152335235523752395241524352455247524952515253525552575259526152635265526752695271527352755277527952815283528552875289529152935295529752995301530353055
Elev
atio
n (
ft.)
Year
Dep
th t
o W
ater
(ft
.)
OPTI Well 209 HydrographWSE & Depth-to-Water GSE
WSE Min = 2902 ft. WSE Max = 2937 ft. Well Depth = Unknown ft.

020406080100120140160180200220240260280300320340360380400420440460480500520540560580600620640660680700720740
19
59
19
60
19
63
19
64
19
67
19
68
19
71
19
72
19
75
19
76
19
79
19
80
19
83
19
84
19
87
19
88
19
91
19
92
19
95
19
96
19
99
20
00
20
03
20
04
20
07
20
08
20
11
20
12
20
15
20
16
20
19
240424242444246424842504252425442564258426042624264426642684270427242744276427842804282428442864288429042924294429642984300430243044306430843104312431443164
Elev
atio
n (
ft.)
Year
Dep
th t
o W
ater
(ft
.)
OPTI Well 210 HydrographWSE & Depth-to-Water GSE
WSE Min = 2995 ft. WSE Max = 2995 ft. Well Depth = Unknown ft.

020406080100120140160180200220240260280300320340360380400420440460480500520540560580600620640660680700720740
19
59
19
60
19
63
19
64
19
67
19
68
19
71
19
72
19
75
19
76
19
79
19
80
19
83
19
84
19
87
19
88
19
91
19
92
19
95
19
96
19
99
20
00
20
03
20
04
20
07
20
08
20
11
20
12
20
15
20
16
20
19
225122712291231123312351237123912411243124512471249125112531255125712591261126312651267126912711273127512771279128112831285128712891291129312951297129913011
Elev
atio
n (
ft.)
Year
Dep
th t
o W
ater
(ft
.)
OPTI Well 213 HydrographWSE & Depth-to-Water GSE
WSE Min = 2872 ft. WSE Max = 2918 ft. Well Depth = 220 ft.

020406080100120140160180200220240260280300320340360380400420440460480500520540560580600620640660680700720740
19
59
19
60
19
63
19
64
19
67
19
68
19
71
19
72
19
75
19
76
19
79
19
80
19
83
19
84
19
87
19
88
19
91
19
92
19
95
19
96
19
99
20
00
20
03
20
04
20
07
20
08
20
11
20
12
20
15
20
16
20
19
227822982318233823582378239824182438245824782498251825382558257825982618263826582678269827182738275827782798281828382858287828982918293829582978299830183038
Elev
atio
n (
ft.)
Year
Dep
th t
o W
ater
(ft
.)
OPTI Well 214 HydrographWSE & Depth-to-Water GSE
WSE Min = 2873 ft. WSE Max = 2879 ft. Well Depth = 229 ft.

020406080100120140160180200220240260280300320340360380400420440460480500520540560580600620640660680700720740
19
59
19
60
19
63
19
64
19
67
19
68
19
71
19
72
19
75
19
76
19
79
19
80
19
83
19
84
19
87
19
88
19
91
19
92
19
95
19
96
19
99
20
00
20
03
20
04
20
07
20
08
20
11
20
12
20
15
20
16
20
19
229223122332235223722392241224322452247224922512253225522572259226122632265226722692271227322752277227922812283228522872289229122932295229722992301230323052
Elev
atio
n (
ft.)
Year
Dep
th t
o W
ater
(ft
.)
OPTI Well 215 HydrographWSE & Depth-to-Water GSE
WSE Min = 2899 ft. WSE Max = 2917 ft. Well Depth = 156 ft.

020406080100120140160180200220240260280300320340360380400420440460480500520540560580600620640660680700720740
19
59
19
60
19
63
19
64
19
67
19
68
19
71
19
72
19
75
19
76
19
79
19
80
19
83
19
84
19
87
19
88
19
91
19
92
19
95
19
96
19
99
20
00
20
03
20
04
20
07
20
08
20
11
20
12
20
15
20
16
20
19
227722972317233723572377239724172437245724772497251725372557257725972617263726572677269727172737275727772797281728372857287728972917293729572977299730173037
Elev
atio
n (
ft.)
Year
Dep
th t
o W
ater
(ft
.)
OPTI Well 216 HydrographWSE & Depth-to-Water GSE
WSE Min = 2895 ft. WSE Max = 2901 ft. Well Depth = 360 ft.

020406080100120140160180200220240260280300320340360380400420440460480500520540560580600620640660680700720740
19
59
19
60
19
63
19
64
19
67
19
68
19
71
19
72
19
75
19
76
19
79
19
80
19
83
19
84
19
87
19
88
19
91
19
92
19
95
19
96
19
99
20
00
20
03
20
04
20
07
20
08
20
11
20
12
20
15
20
16
20
19
224022602280230023202340236023802400242024402460248025002520254025602580260026202640266026802700272027402760278028002820284028602880290029202940296029803000
Elev
atio
n (
ft.)
Year
Dep
th t
o W
ater
(ft
.)
OPTI Well 218 HydrographWSE & Depth-to-Water GSE
WSE Min = 2852 ft. WSE Max = 2853 ft. Well Depth = 154 ft.

020406080100120140160180200220240260280300320340360380400420440460480500520540560580600620640660680700720740
19
59
19
60
19
63
19
64
19
67
19
68
19
71
19
72
19
75
19
76
19
79
19
80
19
83
19
84
19
87
19
88
19
91
19
92
19
95
19
96
19
99
20
00
20
03
20
04
20
07
20
08
20
11
20
12
20
15
20
16
20
19
235423742394241424342454247424942514253425542574259426142634265426742694271427342754277427942814283428542874289429142934295429742994301430343054307430943114
Elev
atio
n (
ft.)
Year
Dep
th t
o W
ater
(ft
.)
OPTI Well 220 HydrographWSE & Depth-to-Water GSE
WSE Min = 2942 ft. WSE Max = 2942 ft. Well Depth = 340 ft.

020406080100120140160180200220240260280300320340360380400420440460480500520540560580600620640660680700720740
19
59
19
60
19
63
19
64
19
67
19
68
19
71
19
72
19
75
19
76
19
79
19
80
19
83
19
84
19
87
19
88
19
91
19
92
19
95
19
96
19
99
20
00
20
03
20
04
20
07
20
08
20
11
20
12
20
15
20
16
20
19
225322732293231323332353237323932413243324532473249325132533255325732593261326332653267326932713273327532773279328132833285328732893291329332953297329933013
Elev
atio
n (
ft.)
Year
Dep
th t
o W
ater
(ft
.)
OPTI Well 223 HydrographWSE & Depth-to-Water GSE
WSE Min = 2858 ft. WSE Max = 2907 ft. Well Depth = Unknown ft.

020406080100120140160180200220240260280300320340360380400420440460480500520540560580600620640660680700720740
19
59
19
60
19
63
19
64
19
67
19
68
19
71
19
72
19
75
19
76
19
79
19
80
19
83
19
84
19
87
19
88
19
91
19
92
19
95
19
96
19
99
20
00
20
03
20
04
20
07
20
08
20
11
20
12
20
15
20
16
20
19
224622662286230623262346236623862406242624462466248625062526254625662586260626262646266626862706272627462766278628062826284628662886290629262946296629863006
Elev
atio
n (
ft.)
Year
Dep
th t
o W
ater
(ft
.)
OPTI Well 224 HydrographWSE & Depth-to-Water GSE
WSE Min = 2851 ft. WSE Max = 2861 ft. Well Depth = Unknown ft.
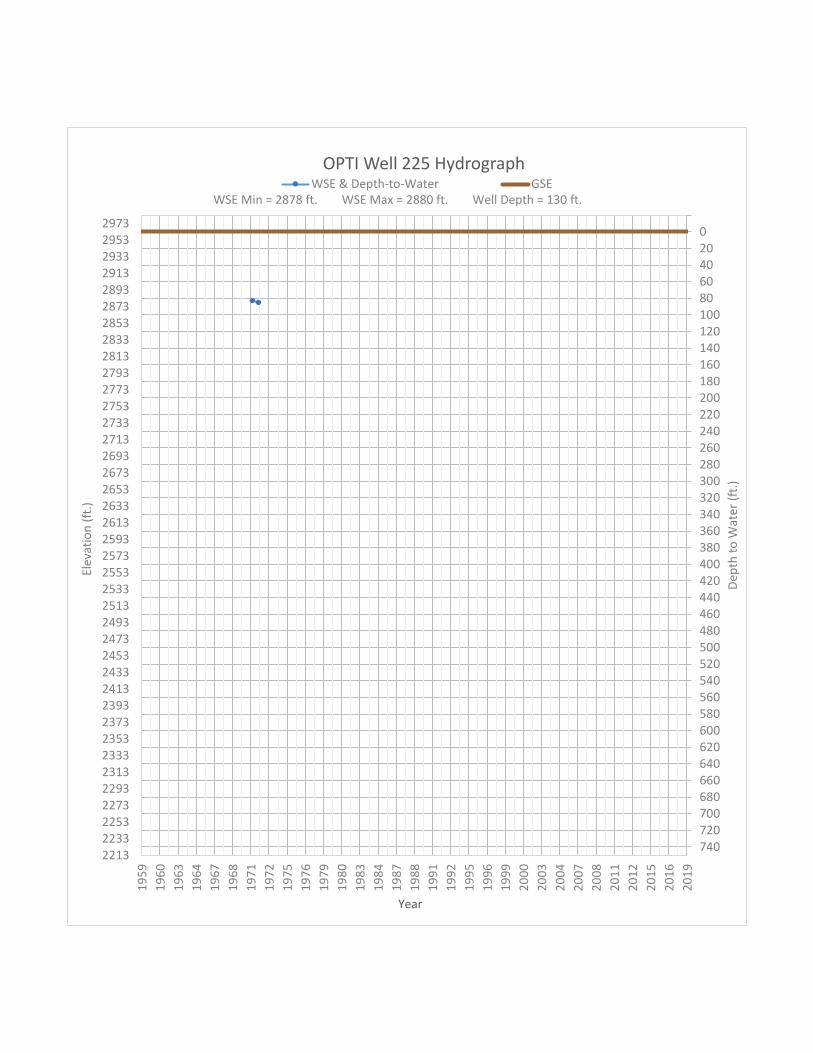
020406080100120140160180200220240260280300320340360380400420440460480500520540560580600620640660680700720740
19
59
19
60
19
63
19
64
19
67
19
68
19
71
19
72
19
75
19
76
19
79
19
80
19
83
19
84
19
87
19
88
19
91
19
92
19
95
19
96
19
99
20
00
20
03
20
04
20
07
20
08
20
11
20
12
20
15
20
16
20
19
221322332253227322932313233323532373239324132433245324732493251325332553257325932613263326532673269327132733275327732793281328332853287328932913293329532973
Elev
atio
n (
ft.)
Year
Dep
th t
o W
ater
(ft
.)
OPTI Well 225 HydrographWSE & Depth-to-Water GSE
WSE Min = 2878 ft. WSE Max = 2880 ft. Well Depth = 130 ft.

020406080100120140160180200220240260280300320340360380400420440460480500520540560580600620640660680700720740
19
59
19
60
19
63
19
64
19
67
19
68
19
71
19
72
19
75
19
76
19
79
19
80
19
83
19
84
19
87
19
88
19
91
19
92
19
95
19
96
19
99
20
00
20
03
20
04
20
07
20
08
20
11
20
12
20
15
20
16
20
19
219522152235225522752295231523352355237523952415243524552475249525152535255525752595261526352655267526952715273527552775279528152835285528752895291529352955
Elev
atio
n (
ft.)
Year
Dep
th t
o W
ater
(ft
.)
OPTI Well 226 HydrographWSE & Depth-to-Water GSE
WSE Min = 2842 ft. WSE Max = 2847 ft. Well Depth = Unknown ft.

020406080100120140160180200220240260280300320340360380400420440460480500520540560580600620640660680700720740
19
59
19
60
19
63
19
64
19
67
19
68
19
71
19
72
19
75
19
76
19
79
19
80
19
83
19
84
19
87
19
88
19
91
19
92
19
95
19
96
19
99
20
00
20
03
20
04
20
07
20
08
20
11
20
12
20
15
20
16
20
19
225222722292231223322352237223922412243224522472249225122532255225722592261226322652267226922712273227522772279228122832285228722892291229322952297229923012
Elev
atio
n (
ft.)
Year
Dep
th t
o W
ater
(ft
.)
OPTI Well 227 HydrographWSE & Depth-to-Water GSE
WSE Min = 2942 ft. WSE Max = 2942 ft. Well Depth = Unknown ft.
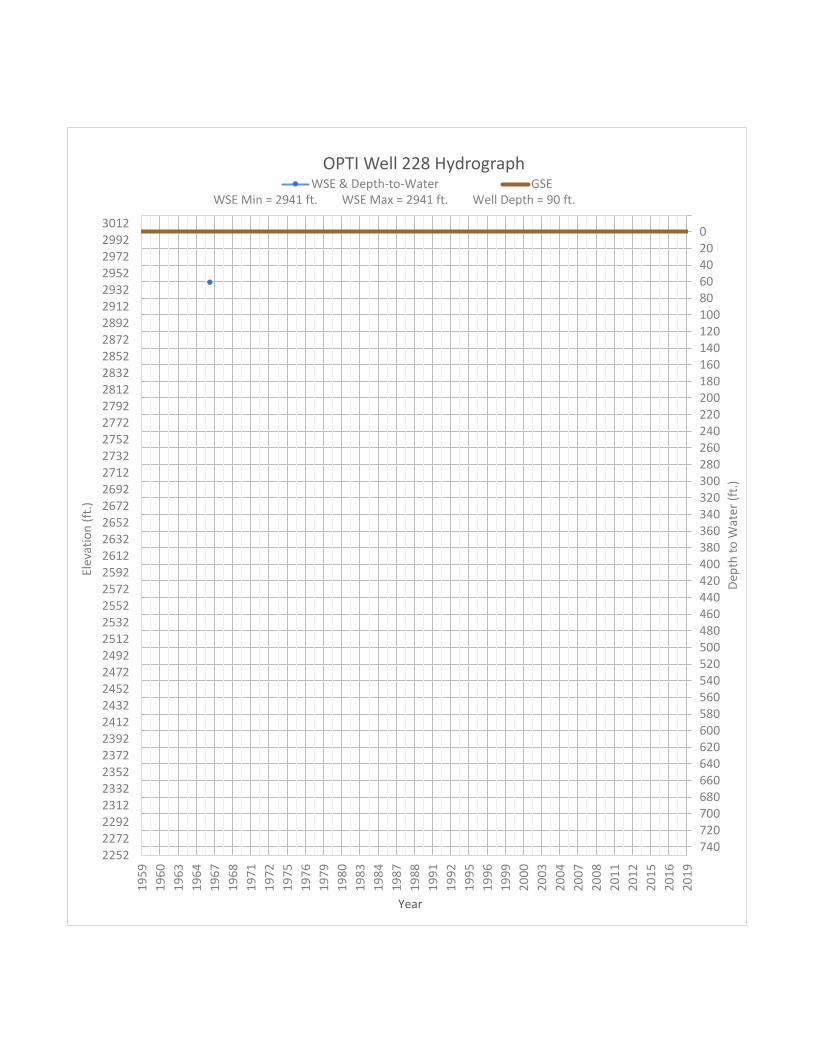
020406080100120140160180200220240260280300320340360380400420440460480500520540560580600620640660680700720740
19
59
19
60
19
63
19
64
19
67
19
68
19
71
19
72
19
75
19
76
19
79
19
80
19
83
19
84
19
87
19
88
19
91
19
92
19
95
19
96
19
99
20
00
20
03
20
04
20
07
20
08
20
11
20
12
20
15
20
16
20
19
225222722292231223322352237223922412243224522472249225122532255225722592261226322652267226922712273227522772279228122832285228722892291229322952297229923012
Elev
atio
n (
ft.)
Year
Dep
th t
o W
ater
(ft
.)
OPTI Well 228 HydrographWSE & Depth-to-Water GSE
WSE Min = 2941 ft. WSE Max = 2941 ft. Well Depth = 90 ft.
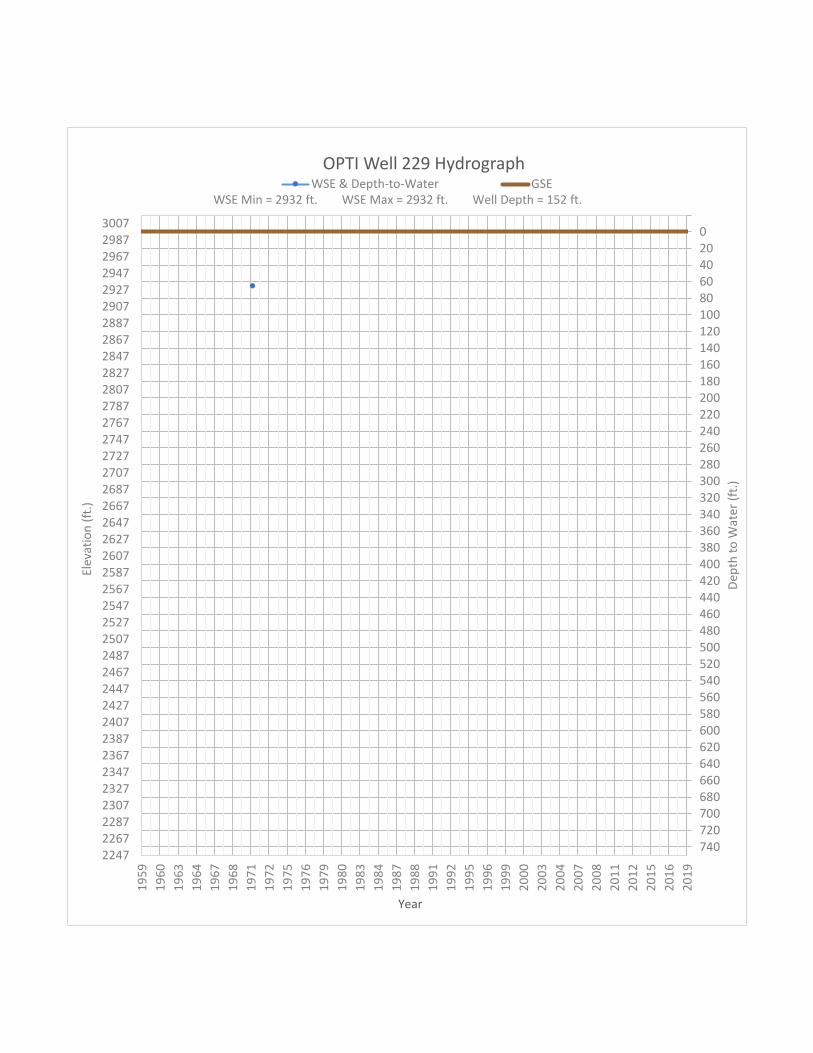
020406080100120140160180200220240260280300320340360380400420440460480500520540560580600620640660680700720740
19
59
19
60
19
63
19
64
19
67
19
68
19
71
19
72
19
75
19
76
19
79
19
80
19
83
19
84
19
87
19
88
19
91
19
92
19
95
19
96
19
99
20
00
20
03
20
04
20
07
20
08
20
11
20
12
20
15
20
16
20
19
224722672287230723272347236723872407242724472467248725072527254725672587260726272647266726872707272727472767278728072827284728672887290729272947296729873007
Elev
atio
n (
ft.)
Year
Dep
th t
o W
ater
(ft
.)
OPTI Well 229 HydrographWSE & Depth-to-Water GSE
WSE Min = 2932 ft. WSE Max = 2932 ft. Well Depth = 152 ft.

020406080100120140160180200220240260280300320340360380400420440460480500520540560580600620640660680700720740
19
59
19
60
19
63
19
64
19
67
19
68
19
71
19
72
19
75
19
76
19
79
19
80
19
83
19
84
19
87
19
88
19
91
19
92
19
95
19
96
19
99
20
00
20
03
20
04
20
07
20
08
20
11
20
12
20
15
20
16
20
19
223522552275229523152335235523752395241524352455247524952515253525552575259526152635265526752695271527352755277527952815283528552875289529152935295529752995
Elev
atio
n (
ft.)
Year
Dep
th t
o W
ater
(ft
.)
OPTI Well 230 HydrographWSE & Depth-to-Water GSE
WSE Min = 2838 ft. WSE Max = 2845 ft. Well Depth = 192 ft.

020406080100120140160180200220240260280300320340360380400420440460480500520540560580600620640660680700720740
19
59
19
60
19
63
19
64
19
67
19
68
19
71
19
72
19
75
19
76
19
79
19
80
19
83
19
84
19
87
19
88
19
91
19
92
19
95
19
96
19
99
20
00
20
03
20
04
20
07
20
08
20
11
20
12
20
15
20
16
20
19
230423242344236423842404242424442464248425042524254425642584260426242644266426842704272427442764278428042824284428642884290429242944296429843004302430443064
Elev
atio
n (
ft.)
Year
Dep
th t
o W
ater
(ft
.)
OPTI Well 233 HydrographWSE & Depth-to-Water GSE
WSE Min = 2852 ft. WSE Max = 2865 ft. Well Depth = 205 ft.

020406080100120140160180200220240260280300320340360380400420440460480500520540560580600620640660680700720740
19
59
19
60
19
63
19
64
19
67
19
68
19
71
19
72
19
75
19
76
19
79
19
80
19
83
19
84
19
87
19
88
19
91
19
92
19
95
19
96
19
99
20
00
20
03
20
04
20
07
20
08
20
11
20
12
20
15
20
16
20
19
222822482268228823082328234823682388240824282448246824882508252825482568258826082628264826682688270827282748276827882808282828482868288829082928294829682988
Elev
atio
n (
ft.)
Year
Dep
th t
o W
ater
(ft
.)
OPTI Well 235 HydrographWSE & Depth-to-Water GSE
WSE Min = 2840 ft. WSE Max = 2840 ft. Well Depth = 240 ft.

020406080100120140160180200220240260280300320340360380400420440460480500520540560580600620640660680700720740
19
59
19
60
19
63
19
64
19
67
19
68
19
71
19
72
19
75
19
76
19
79
19
80
19
83
19
84
19
87
19
88
19
91
19
92
19
95
19
96
19
99
20
00
20
03
20
04
20
07
20
08
20
11
20
12
20
15
20
16
20
19
223422542274229423142334235423742394241424342454247424942514253425542574259426142634265426742694271427342754277427942814283428542874289429142934295429742994
Elev
atio
n (
ft.)
Year
Dep
th t
o W
ater
(ft
.)
OPTI Well 237 HydrographWSE & Depth-to-Water GSE
WSE Min = 2848 ft. WSE Max = 2852 ft. Well Depth = 350 ft.

020406080100120140160180200220240260280300320340360380400420440460480500520540560580600620640660680700720740
19
59
19
60
19
63
19
64
19
67
19
68
19
71
19
72
19
75
19
76
19
79
19
80
19
83
19
84
19
87
19
88
19
91
19
92
19
95
19
96
19
99
20
00
20
03
20
04
20
07
20
08
20
11
20
12
20
15
20
16
20
19
239524152435245524752495251525352555257525952615263526552675269527152735275527752795281528352855287528952915293529552975299530153035305530753095311531353155
Elev
atio
n (
ft.)
Year
Dep
th t
o W
ater
(ft
.)
OPTI Well 239 HydrographWSE & Depth-to-Water GSE
WSE Min = 2974 ft. WSE Max = 2974 ft. Well Depth = 235 ft.

020406080100120140160180200220240260280300320340360380400420440460480500520540560580600620640660680700720740
19
59
19
60
19
63
19
64
19
67
19
68
19
71
19
72
19
75
19
76
19
79
19
80
19
83
19
84
19
87
19
88
19
91
19
92
19
95
19
96
19
99
20
00
20
03
20
04
20
07
20
08
20
11
20
12
20
15
20
16
20
19
220422242244226422842304232423442364238424042424244424642484250425242544256425842604262426442664268427042724274427642784280428242844286428842904292429442964
Elev
atio
n (
ft.)
Year
Dep
th t
o W
ater
(ft
.)
OPTI Well 240 HydrographWSE & Depth-to-Water GSE
WSE Min = 2818 ft. WSE Max = 2843 ft. Well Depth = 240 ft.

020406080100120140160180200220240260280300320340360380400420440460480500520540560580600620640660680700720740
19
59
19
60
19
63
19
64
19
67
19
68
19
71
19
72
19
75
19
76
19
79
19
80
19
83
19
84
19
87
19
88
19
91
19
92
19
95
19
96
19
99
20
00
20
03
20
04
20
07
20
08
20
11
20
12
20
15
20
16
20
19
218322032223224322632283230323232343236323832403242324432463248325032523254325632583260326232643266326832703272327432763278328032823284328632883290329232943
Elev
atio
n (
ft.)
Year
Dep
th t
o W
ater
(ft
.)
OPTI Well 242 HydrographWSE & Depth-to-Water GSE
WSE Min = 2812 ft. WSE Max = 2813 ft. Well Depth = 155 ft.

020406080100120140160180200220240260280300320340360380400420440460480500520540560580600620640660680700720740
19
59
19
60
19
63
19
64
19
67
19
68
19
71
19
72
19
75
19
76
19
79
19
80
19
83
19
84
19
87
19
88
19
91
19
92
19
95
19
96
19
99
20
00
20
03
20
04
20
07
20
08
20
11
20
12
20
15
20
16
20
19
215521752195221522352255227522952315233523552375239524152435245524752495251525352555257525952615263526552675269527152735275527752795281528352855287528952915
Elev
atio
n (
ft.)
Year
Dep
th t
o W
ater
(ft
.)
OPTI Well 245 HydrographWSE & Depth-to-Water GSE
WSE Min = 2831 ft. WSE Max = 2835 ft. Well Depth = 240 ft.

020406080100120140160180200220240260280300320340360380400420440460480500520540560580600620640660680700720740
19
59
19
60
19
63
19
64
19
67
19
68
19
71
19
72
19
75
19
76
19
79
19
80
19
83
19
84
19
87
19
88
19
91
19
92
19
95
19
96
19
99
20
00
20
03
20
04
20
07
20
08
20
11
20
12
20
15
20
16
20
19
216821882208222822482268228823082328234823682388240824282448246824882508252825482568258826082628264826682688270827282748276827882808282828482868288829082928
Elev
atio
n (
ft.)
Year
Dep
th t
o W
ater
(ft
.)
OPTI Well 247 HydrographWSE & Depth-to-Water GSE
WSE Min = 2783 ft. WSE Max = 2784 ft. Well Depth = Unknown ft.

020406080100120140160180200220240260280300320340360380400420440460480500520540560580600620640660680700720740
19
59
19
60
19
63
19
64
19
67
19
68
19
71
19
72
19
75
19
76
19
79
19
80
19
83
19
84
19
87
19
88
19
91
19
92
19
95
19
96
19
99
20
00
20
03
20
04
20
07
20
08
20
11
20
12
20
15
20
16
20
19
215421742194221422342254227422942314233423542374239424142434245424742494251425342554257425942614263426542674269427142734275427742794281428342854287428942914
Elev
atio
n (
ft.)
Year
Dep
th t
o W
ater
(ft
.)
OPTI Well 248 HydrographWSE & Depth-to-Water GSE
WSE Min = 2813 ft. WSE Max = 2813 ft. Well Depth = Unknown ft.

020406080100120140160180200220240260280300320340360380400420440460480500520540560580600620640660680700720740
19
59
19
60
19
63
19
64
19
67
19
68
19
71
19
72
19
75
19
76
19
79
19
80
19
83
19
84
19
87
19
88
19
91
19
92
19
95
19
96
19
99
20
00
20
03
20
04
20
07
20
08
20
11
20
12
20
15
20
16
20
19
214521652185220522252245226522852305232523452365238524052425244524652485250525252545256525852605262526452665268527052725274527652785280528252845286528852905
Elev
atio
n (
ft.)
Year
Dep
th t
o W
ater
(ft
.)
OPTI Well 249 HydrographWSE & Depth-to-Water GSE
WSE Min = 2772 ft. WSE Max = 2793 ft. Well Depth = 187 ft.

020406080100120140160180200220240260280300320340360380400420440460480500520540560580600620640660680700720740
19
59
19
60
19
63
19
64
19
67
19
68
19
71
19
72
19
75
19
76
19
79
19
80
19
83
19
84
19
87
19
88
19
91
19
92
19
95
19
96
19
99
20
00
20
03
20
04
20
07
20
08
20
11
20
12
20
15
20
16
20
19
293529552975299530153035305530753095311531353155317531953215323532553275329533153335335533753395341534353455347534953515353535553575359536153635365536753695
Elev
atio
n (
ft.)
Year
Dep
th t
o W
ater
(ft
.)
OPTI Well 251 HydrographWSE & Depth-to-Water GSE
WSE Min = 3622 ft. WSE Max = 3622 ft. Well Depth = 122 ft.

020406080100120140160180200220240260280300320340360380400420440460480500520540560580600620640660680700720740
19
59
19
60
19
63
19
64
19
67
19
68
19
71
19
72
19
75
19
76
19
79
19
80
19
83
19
84
19
87
19
88
19
91
19
92
19
95
19
96
19
99
20
00
20
03
20
04
20
07
20
08
20
11
20
12
20
15
20
16
20
19
210921292149216921892209222922492269228923092329234923692389240924292449246924892509252925492569258926092629264926692689270927292749276927892809282928492869
Elev
atio
n (
ft.)
Year
Dep
th t
o W
ater
(ft
.)
OPTI Well 254 HydrographWSE & Depth-to-Water GSE
WSE Min = 2750 ft. WSE Max = 2759 ft. Well Depth = Unknown ft.
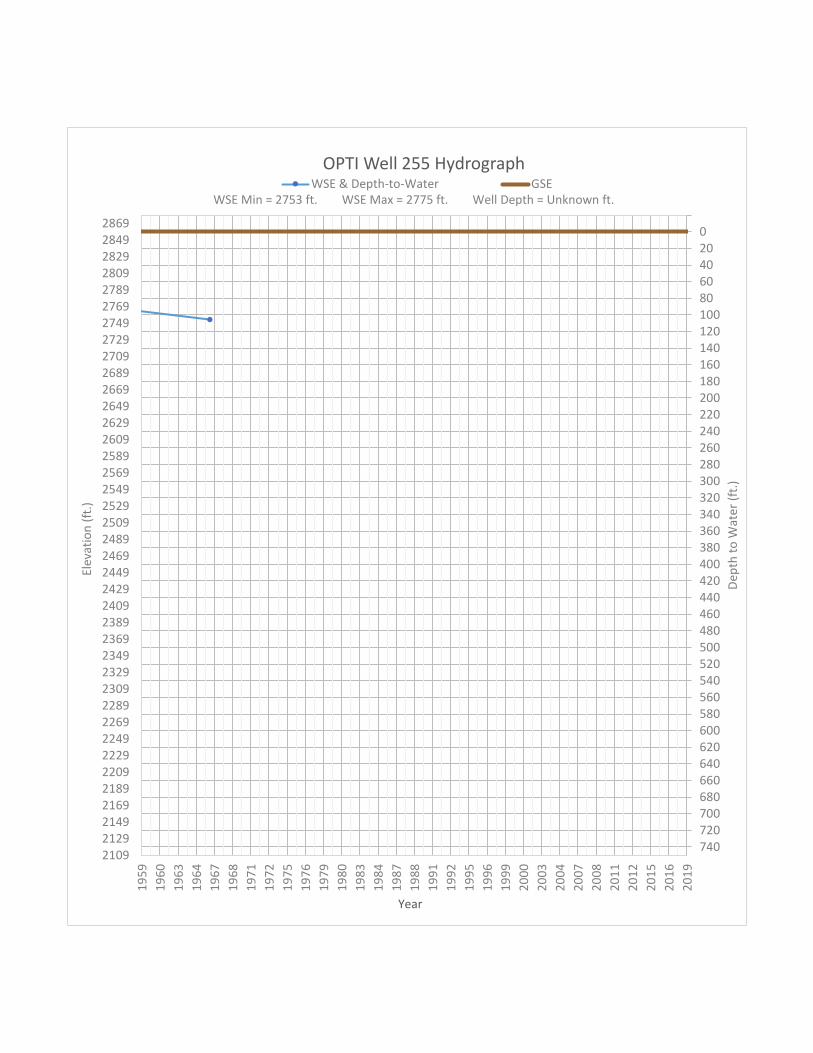
020406080100120140160180200220240260280300320340360380400420440460480500520540560580600620640660680700720740
19
59
19
60
19
63
19
64
19
67
19
68
19
71
19
72
19
75
19
76
19
79
19
80
19
83
19
84
19
87
19
88
19
91
19
92
19
95
19
96
19
99
20
00
20
03
20
04
20
07
20
08
20
11
20
12
20
15
20
16
20
19
210921292149216921892209222922492269228923092329234923692389240924292449246924892509252925492569258926092629264926692689270927292749276927892809282928492869
Elev
atio
n (
ft.)
Year
Dep
th t
o W
ater
(ft
.)
OPTI Well 255 HydrographWSE & Depth-to-Water GSE
WSE Min = 2753 ft. WSE Max = 2775 ft. Well Depth = Unknown ft.

020406080100120140160180200220240260280300320340360380400420440460480500520540560580600620640660680700720740
19
59
19
60
19
63
19
64
19
67
19
68
19
71
19
72
19
75
19
76
19
79
19
80
19
83
19
84
19
87
19
88
19
91
19
92
19
95
19
96
19
99
20
00
20
03
20
04
20
07
20
08
20
11
20
12
20
15
20
16
20
19
210821282148216821882208222822482268228823082328234823682388240824282448246824882508252825482568258826082628264826682688270827282748276827882808282828482868
Elev
atio
n (
ft.)
Year
Dep
th t
o W
ater
(ft
.)
OPTI Well 257 HydrographWSE & Depth-to-Water GSE
WSE Min = 2748 ft. WSE Max = 2753 ft. Well Depth = Unknown ft.

020406080100120140160180200220240260280300320340360380400420440460480500520540560580600620640660680700720740
19
59
19
60
19
63
19
64
19
67
19
68
19
71
19
72
19
75
19
76
19
79
19
80
19
83
19
84
19
87
19
88
19
91
19
92
19
95
19
96
19
99
20
00
20
03
20
04
20
07
20
08
20
11
20
12
20
15
20
16
20
19
210421242144216421842204222422442264228423042324234423642384240424242444246424842504252425442564258426042624264426642684270427242744276427842804282428442864
Elev
atio
n (
ft.)
Year
Dep
th t
o W
ater
(ft
.)
OPTI Well 258 HydrographWSE & Depth-to-Water GSE
WSE Min = 2746 ft. WSE Max = 2746 ft. Well Depth = 150 ft.

020406080100120140160180200220240260280300320340360380400420440460480500520540560580600620640660680700720740
19
59
19
60
19
63
19
64
19
67
19
68
19
71
19
72
19
75
19
76
19
79
19
80
19
83
19
84
19
87
19
88
19
91
19
92
19
95
19
96
19
99
20
00
20
03
20
04
20
07
20
08
20
11
20
12
20
15
20
16
20
19
291429342954297429943014303430543074309431143134315431743194321432343254327432943314333433543374339434143434345434743494351435343554357435943614363436543674
Elev
atio
n (
ft.)
Year
Dep
th t
o W
ater
(ft
.)
OPTI Well 259 HydrographWSE & Depth-to-Water GSE
WSE Min = 3476 ft. WSE Max = 3476 ft. Well Depth = 230 ft.

020406080100120140160180200220240260280300320340360380400420440460480500520540560580600620640660680700720740
19
59
19
60
19
63
19
64
19
67
19
68
19
71
19
72
19
75
19
76
19
79
19
80
19
83
19
84
19
87
19
88
19
91
19
92
19
95
19
96
19
99
20
00
20
03
20
04
20
07
20
08
20
11
20
12
20
15
20
16
20
19
207720972117213721572177219722172237225722772297231723372357237723972417243724572477249725172537255725772597261726372657267726972717273727572777279728172837
Elev
atio
n (
ft.)
Year
Dep
th t
o W
ater
(ft
.)
OPTI Well 261 HydrographWSE & Depth-to-Water GSE
WSE Min = 2731 ft. WSE Max = 2731 ft. Well Depth = 190 ft.

020406080100120140160180200220240260280300320340360380400420440460480500520540560580600620640660680700720740
19
59
19
60
19
63
19
64
19
67
19
68
19
71
19
72
19
75
19
76
19
79
19
80
19
83
19
84
19
87
19
88
19
91
19
92
19
95
19
96
19
99
20
00
20
03
20
04
20
07
20
08
20
11
20
12
20
15
20
16
20
19
206720872107212721472167218722072227224722672287230723272347236723872407242724472467248725072527254725672587260726272647266726872707272727472767278728072827
Elev
atio
n (
ft.)
Year
Dep
th t
o W
ater
(ft
.)
OPTI Well 263 HydrographWSE & Depth-to-Water GSE
WSE Min = 2724 ft. WSE Max = 2733 ft. Well Depth = 159 ft.
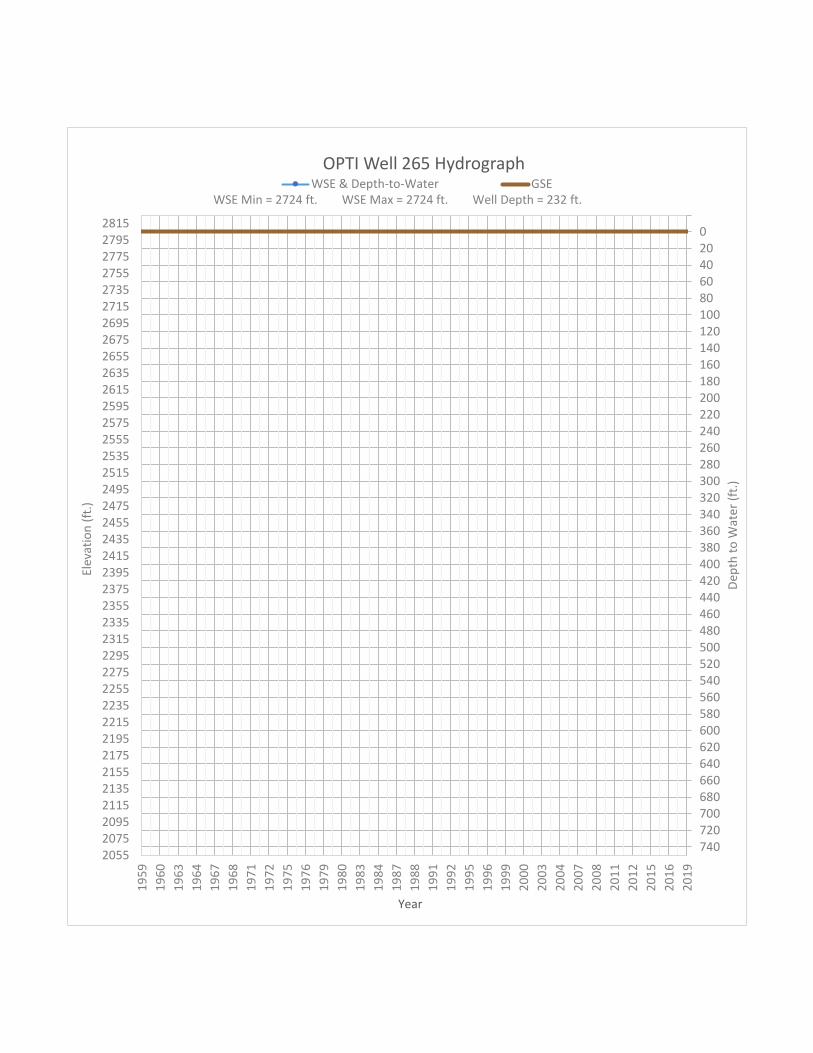
020406080100120140160180200220240260280300320340360380400420440460480500520540560580600620640660680700720740
19
59
19
60
19
63
19
64
19
67
19
68
19
71
19
72
19
75
19
76
19
79
19
80
19
83
19
84
19
87
19
88
19
91
19
92
19
95
19
96
19
99
20
00
20
03
20
04
20
07
20
08
20
11
20
12
20
15
20
16
20
19
205520752095211521352155217521952215223522552275229523152335235523752395241524352455247524952515253525552575259526152635265526752695271527352755277527952815
Elev
atio
n (
ft.)
Year
Dep
th t
o W
ater
(ft
.)
OPTI Well 265 HydrographWSE & Depth-to-Water GSE
WSE Min = 2724 ft. WSE Max = 2724 ft. Well Depth = 232 ft.

020406080100120140160180200220240260280300320340360380400420440460480500520540560580600620640660680700720740
19
59
19
60
19
63
19
64
19
67
19
68
19
71
19
72
19
75
19
76
19
79
19
80
19
83
19
84
19
87
19
88
19
91
19
92
19
95
19
96
19
99
20
00
20
03
20
04
20
07
20
08
20
11
20
12
20
15
20
16
20
19
204520652085210521252145216521852205222522452265228523052325234523652385240524252445246524852505252525452565258526052625264526652685270527252745276527852805
Elev
atio
n (
ft.)
Year
Dep
th t
o W
ater
(ft
.)
OPTI Well 267 HydrographWSE & Depth-to-Water GSE
WSE Min = 2711 ft. WSE Max = 2735 ft. Well Depth = Unknown ft.

020406080100120140160180200220240260280300320340360380400420440460480500520540560580600620640660680700720740
19
59
19
60
19
63
19
64
19
67
19
68
19
71
19
72
19
75
19
76
19
79
19
80
19
83
19
84
19
87
19
88
19
91
19
92
19
95
19
96
19
99
20
00
20
03
20
04
20
07
20
08
20
11
20
12
20
15
20
16
20
19
203820582078209821182138215821782198221822382258227822982318233823582378239824182438245824782498251825382558257825982618263826582678269827182738275827782798
Elev
atio
n (
ft.)
Year
Dep
th t
o W
ater
(ft
.)
OPTI Well 268 HydrographWSE & Depth-to-Water GSE
WSE Min = 2703 ft. WSE Max = 2714 ft. Well Depth = 125 ft.

020406080100120140160180200220240260280300320340360380400420440460480500520540560580600620640660680700720740
19
59
19
60
19
63
19
64
19
67
19
68
19
71
19
72
19
75
19
76
19
79
19
80
19
83
19
84
19
87
19
88
19
91
19
92
19
95
19
96
19
99
20
00
20
03
20
04
20
07
20
08
20
11
20
12
20
15
20
16
20
19
200620262046206620862106212621462166218622062226224622662286230623262346236623862406242624462466248625062526254625662586260626262646266626862706272627462766
Elev
atio
n (
ft.)
Year
Dep
th t
o W
ater
(ft
.)
OPTI Well 269 HydrographWSE & Depth-to-Water GSE
WSE Min = 2681 ft. WSE Max = 2697 ft. Well Depth = Unknown ft.

020406080100120140160180200220240260280300320340360380400420440460480500520540560580600620640660680700720740
19
59
19
60
19
63
19
64
19
67
19
68
19
71
19
72
19
75
19
76
19
79
19
80
19
83
19
84
19
87
19
88
19
91
19
92
19
95
19
96
19
99
20
00
20
03
20
04
20
07
20
08
20
11
20
12
20
15
20
16
20
19
200620262046206620862106212621462166218622062226224622662286230623262346236623862406242624462466248625062526254625662586260626262646266626862706272627462766
Elev
atio
n (
ft.)
Year
Dep
th t
o W
ater
(ft
.)
OPTI Well 271 HydrographWSE & Depth-to-Water GSE
WSE Min = 2683 ft. WSE Max = 2707 ft. Well Depth = 113 ft.

020406080100120140160180200220240260280300320340360380400420440460480500520540560580600620640660680700720740
19
59
19
60
19
63
19
64
19
67
19
68
19
71
19
72
19
75
19
76
19
79
19
80
19
83
19
84
19
87
19
88
19
91
19
92
19
95
19
96
19
99
20
00
20
03
20
04
20
07
20
08
20
11
20
12
20
15
20
16
20
19
197319932013203320532073209321132133215321732193221322332253227322932313233323532373239324132433245324732493251325332553257325932613263326532673269327132733
Elev
atio
n (
ft.)
Year
Dep
th t
o W
ater
(ft
.)
OPTI Well 272 HydrographWSE & Depth-to-Water GSE
WSE Min = 2631 ft. WSE Max = 2644 ft. Well Depth = Unknown ft.

020406080100120140160180200220240260280300320340360380400420440460480500520540560580600620640660680700720740
19
59
19
60
19
63
19
64
19
67
19
68
19
71
19
72
19
75
19
76
19
79
19
80
19
83
19
84
19
87
19
88
19
91
19
92
19
95
19
96
19
99
20
00
20
03
20
04
20
07
20
08
20
11
20
12
20
15
20
16
20
19
193719571977199720172037205720772097211721372157217721972217223722572277229723172337235723772397241724372457247724972517253725572577259726172637265726772697
Elev
atio
n (
ft.)
Year
Dep
th t
o W
ater
(ft
.)
OPTI Well 273 HydrographWSE & Depth-to-Water GSE
WSE Min = 2612 ft. WSE Max = 2612 ft. Well Depth = 85 ft.

020406080100120140160180200220240260280300320340360380400420440460480500520540560580600620640660680700720740
19
59
19
60
19
63
19
64
19
67
19
68
19
71
19
72
19
75
19
76
19
79
19
80
19
83
19
84
19
87
19
88
19
91
19
92
19
95
19
96
19
99
20
00
20
03
20
04
20
07
20
08
20
11
20
12
20
15
20
16
20
19
191619361956197619962016203620562076209621162136215621762196221622362256227622962316233623562376239624162436245624762496251625362556257625962616263626562676
Elev
atio
n (
ft.)
Year
Dep
th t
o W
ater
(ft
.)
OPTI Well 275 HydrographWSE & Depth-to-Water GSE
WSE Min = 2588 ft. WSE Max = 2588 ft. Well Depth = 90 ft.

020406080100120140160180200220240260280300320340360380400420440460480500520540560580600620640660680700720740
19
59
19
60
19
63
19
64
19
67
19
68
19
71
19
72
19
75
19
76
19
79
19
80
19
83
19
84
19
87
19
88
19
91
19
92
19
95
19
96
19
99
20
00
20
03
20
04
20
07
20
08
20
11
20
12
20
15
20
16
20
19
201120312051207120912111213121512171219122112231225122712291231123312351237123912411243124512471249125112531255125712591261126312651267126912711273127512771
Elev
atio
n (
ft.)
Year
Dep
th t
o W
ater
(ft
.)
OPTI Well 276 HydrographWSE & Depth-to-Water GSE
WSE Min = 2593 ft. WSE Max = 2594 ft. Well Depth = 205 ft.

020406080100120140160180200220240260280300320340360380400420440460480500520540560580600620640660680700720740
19
59
19
60
19
63
19
64
19
67
19
68
19
71
19
72
19
75
19
76
19
79
19
80
19
83
19
84
19
87
19
88
19
91
19
92
19
95
19
96
19
99
20
00
20
03
20
04
20
07
20
08
20
11
20
12
20
15
20
16
20
19
196019802000202020402060208021002120214021602180220022202240226022802300232023402360238024002420244024602480250025202540256025802600262026402660268027002720
Elev
atio
n (
ft.)
Year
Dep
th t
o W
ater
(ft
.)
OPTI Well 277 HydrographWSE & Depth-to-Water GSE
WSE Min = 2580 ft. WSE Max = 2585 ft. Well Depth = 160 ft.

020406080100120140160180200220240260280300320340360380400420440460480500520540560580600620640660680700720740
19
59
19
60
19
63
19
64
19
67
19
68
19
71
19
72
19
75
19
76
19
79
19
80
19
83
19
84
19
87
19
88
19
91
19
92
19
95
19
96
19
99
20
00
20
03
20
04
20
07
20
08
20
11
20
12
20
15
20
16
20
19
193019501970199020102030205020702090211021302150217021902210223022502270229023102330235023702390241024302450247024902510253025502570259026102630265026702690
Elev
atio
n (
ft.)
Year
Dep
th t
o W
ater
(ft
.)
OPTI Well 278 HydrographWSE & Depth-to-Water GSE
WSE Min = 2575 ft. WSE Max = 2577 ft. Well Depth = 550 ft.

020406080100120140160180200220240260280300320340360380400420440460480500520540560580600620640660680700720740
19
59
19
60
19
63
19
64
19
67
19
68
19
71
19
72
19
75
19
76
19
79
19
80
19
83
19
84
19
87
19
88
19
91
19
92
19
95
19
96
19
99
20
00
20
03
20
04
20
07
20
08
20
11
20
12
20
15
20
16
20
19
194519651985200520252045206520852105212521452165218522052225224522652285230523252345236523852405242524452465248525052525254525652585260526252645266526852705
Elev
atio
n (
ft.)
Year
Dep
th t
o W
ater
(ft
.)
OPTI Well 279 HydrographWSE & Depth-to-Water GSE
WSE Min = 2601 ft. WSE Max = 2601 ft. Well Depth = 460 ft.

020406080100120140160180200220240260280300320340360380400420440460480500520540560580600620640660680700720740
19
59
19
60
19
63
19
64
19
67
19
68
19
71
19
72
19
75
19
76
19
79
19
80
19
83
19
84
19
87
19
88
19
91
19
92
19
95
19
96
19
99
20
00
20
03
20
04
20
07
20
08
20
11
20
12
20
15
20
16
20
19
188719071927194719671987200720272047206720872107212721472167218722072227224722672287230723272347236723872407242724472467248725072527254725672587260726272647
Elev
atio
n (
ft.)
Year
Dep
th t
o W
ater
(ft
.)
OPTI Well 282 HydrographWSE & Depth-to-Water GSE
WSE Min = 2562 ft. WSE Max = 2567 ft. Well Depth = Unknown ft.

020406080100120140160180200220240260280300320340360380400420440460480500520540560580600620640660680700720740
19
59
19
60
19
63
19
64
19
67
19
68
19
71
19
72
19
75
19
76
19
79
19
80
19
83
19
84
19
87
19
88
19
91
19
92
19
95
19
96
19
99
20
00
20
03
20
04
20
07
20
08
20
11
20
12
20
15
20
16
20
19
188519051925194519651985200520252045206520852105212521452165218522052225224522652285230523252345236523852405242524452465248525052525254525652585260526252645
Elev
atio
n (
ft.)
Year
Dep
th t
o W
ater
(ft
.)
OPTI Well 284 HydrographWSE & Depth-to-Water GSE
WSE Min = 2561 ft. WSE Max = 2561 ft. Well Depth = Unknown ft.

020406080100120140160180200220240260280300320340360380400420440460480500520540560580600620640660680700720740
19
59
19
60
19
63
19
64
19
67
19
68
19
71
19
72
19
75
19
76
19
79
19
80
19
83
19
84
19
87
19
88
19
91
19
92
19
95
19
96
19
99
20
00
20
03
20
04
20
07
20
08
20
11
20
12
20
15
20
16
20
19
197619962016203620562076209621162136215621762196221622362256227622962316233623562376239624162436245624762496251625362556257625962616263626562676269627162736
Elev
atio
n (
ft.)
Year
Dep
th t
o W
ater
(ft
.)
OPTI Well 285 HydrographWSE & Depth-to-Water GSE
WSE Min = 2225 ft. WSE Max = 2225 ft. Well Depth = 504 ft.

020406080100120140160180200220240260280300320340360380400420440460480500520540560580600620640660680700720740
19
59
19
60
19
63
19
64
19
67
19
68
19
71
19
72
19
75
19
76
19
79
19
80
19
83
19
84
19
87
19
88
19
91
19
92
19
95
19
96
19
99
20
00
20
03
20
04
20
07
20
08
20
11
20
12
20
15
20
16
20
19
202220422062208221022122214221622182220222222242226222822302232223422362238224022422244224622482250225222542256225822602262226422662268227022722274227622782
Elev
atio
n (
ft.)
Year
Dep
th t
o W
ater
(ft
.)
OPTI Well 286 HydrographWSE & Depth-to-Water GSE
WSE Min = 2592 ft. WSE Max = 2592 ft. Well Depth = 280 ft.

020406080100120140160180200220240260280300320340360380400420440460480500520540560580600620640660680700720740
19
59
19
60
19
63
19
64
19
67
19
68
19
71
19
72
19
75
19
76
19
79
19
80
19
83
19
84
19
87
19
88
19
91
19
92
19
95
19
96
19
99
20
00
20
03
20
04
20
07
20
08
20
11
20
12
20
15
20
16
20
19
191519351955197519952015203520552075209521152135215521752195221522352255227522952315233523552375239524152435245524752495251525352555257525952615263526552675
Elev
atio
n (
ft.)
Year
Dep
th t
o W
ater
(ft
.)
OPTI Well 287 HydrographWSE & Depth-to-Water GSE
WSE Min = 2459 ft. WSE Max = 2466 ft. Well Depth = 345 ft.

020406080100120140160180200220240260280300320340360380400420440460480500520540560580600620640660680700720740
19
59
19
60
19
63
19
64
19
67
19
68
19
71
19
72
19
75
19
76
19
79
19
80
19
83
19
84
19
87
19
88
19
91
19
92
19
95
19
96
19
99
20
00
20
03
20
04
20
07
20
08
20
11
20
12
20
15
20
16
20
19
185018701890191019301950197019902010203020502070209021102130215021702190221022302250227022902310233023502370239024102430245024702490251025302550257025902610
Elev
atio
n (
ft.)
Year
Dep
th t
o W
ater
(ft
.)
OPTI Well 290 HydrographWSE & Depth-to-Water GSE
WSE Min = 2100 ft. WSE Max = 2100 ft. Well Depth = 800 ft.

020406080100120140160180200220240260280300320340360380400420440460480500520540560580600620640660680700720740
19
59
19
60
19
63
19
64
19
67
19
68
19
71
19
72
19
75
19
76
19
79
19
80
19
83
19
84
19
87
19
88
19
91
19
92
19
95
19
96
19
99
20
00
20
03
20
04
20
07
20
08
20
11
20
12
20
15
20
16
20
19
208721072127214721672187220722272247226722872307232723472367238724072427244724672487250725272547256725872607262726472667268727072727274727672787280728272847
Elev
atio
n (
ft.)
Year
Dep
th t
o W
ater
(ft
.)
OPTI Well 292 HydrographWSE & Depth-to-Water GSE
WSE Min = 2522 ft. WSE Max = 2522 ft. Well Depth = 330 ft.

020406080100120140160180200220240260280300320340360380400420440460480500520540560580600620640660680700720740
19
59
19
60
19
63
19
64
19
67
19
68
19
71
19
72
19
75
19
76
19
79
19
80
19
83
19
84
19
87
19
88
19
91
19
92
19
95
19
96
19
99
20
00
20
03
20
04
20
07
20
08
20
11
20
12
20
15
20
16
20
19
193719571977199720172037205720772097211721372157217721972217223722572277229723172337235723772397241724372457247724972517253725572577259726172637265726772697
Elev
atio
n (
ft.)
Year
Dep
th t
o W
ater
(ft
.)
OPTI Well 293 HydrographWSE & Depth-to-Water GSE
WSE Min = 2297 ft. WSE Max = 2297 ft. Well Depth = 500 ft.

020406080100120140160180200220240260280300320340360380400420440460480500520540560580600620640660680700720740
19
59
19
60
19
63
19
64
19
67
19
68
19
71
19
72
19
75
19
76
19
79
19
80
19
83
19
84
19
87
19
88
19
91
19
92
19
95
19
96
19
99
20
00
20
03
20
04
20
07
20
08
20
11
20
12
20
15
20
16
20
19
182718471867188719071927194719671987200720272047206720872107212721472167218722072227224722672287230723272347236723872407242724472467248725072527254725672587
Elev
atio
n (
ft.)
Year
Dep
th t
o W
ater
(ft
.)
OPTI Well 294 HydrographWSE & Depth-to-Water GSE
WSE Min = 2102 ft. WSE Max = 2102 ft. Well Depth = 805 ft.

020406080100120140160180200220240260280300320340360380400420440460480500520540560580600620640660680700720740
19
59
19
60
19
63
19
64
19
67
19
68
19
71
19
72
19
75
19
76
19
79
19
80
19
83
19
84
19
87
19
88
19
91
19
92
19
95
19
96
19
99
20
00
20
03
20
04
20
07
20
08
20
11
20
12
20
15
20
16
20
19
191419341954197419942014203420542074209421142134215421742194221422342254227422942314233423542374239424142434245424742494251425342554257425942614263426542674
Elev
atio
n (
ft.)
Year
Dep
th t
o W
ater
(ft
.)
OPTI Well 296 HydrographWSE & Depth-to-Water GSE
WSE Min = 2273 ft. WSE Max = 2317 ft. Well Depth = 382 ft.

020406080100120140160180200220240260280300320340360380400420440460480500520540560580600620640660680700720740
19
59
19
60
19
63
19
64
19
67
19
68
19
71
19
72
19
75
19
76
19
79
19
80
19
83
19
84
19
87
19
88
19
91
19
92
19
95
19
96
19
99
20
00
20
03
20
04
20
07
20
08
20
11
20
12
20
15
20
16
20
19
184418641884190419241944196419842004202420442064208421042124214421642184220422242244226422842304232423442364238424042424244424642484250425242544256425842604
Elev
atio
n (
ft.)
Year
Dep
th t
o W
ater
(ft
.)
OPTI Well 297 HydrographWSE & Depth-to-Water GSE
WSE Min = 2254 ft. WSE Max = 2267 ft. Well Depth = 380 ft.

020406080100120140160180200220240260280300320340360380400420440460480500520540560580600620640660680700720740
19
59
19
60
19
63
19
64
19
67
19
68
19
71
19
72
19
75
19
76
19
79
19
80
19
83
19
84
19
87
19
88
19
91
19
92
19
95
19
96
19
99
20
00
20
03
20
04
20
07
20
08
20
11
20
12
20
15
20
16
20
19
181218321852187218921912193219521972199220122032205220722092211221322152217221922212223222522272229223122332235223722392241224322452247224922512253225522572
Elev
atio
n (
ft.)
Year
Dep
th t
o W
ater
(ft
.)
OPTI Well 298 HydrographWSE & Depth-to-Water GSE
WSE Min = 2388 ft. WSE Max = 2423 ft. Well Depth = 254 ft.

020406080100120140160180200220240260280300320340360380400420440460480500520540560580600620640660680700720740
19
59
19
60
19
63
19
64
19
67
19
68
19
71
19
72
19
75
19
76
19
79
19
80
19
83
19
84
19
87
19
88
19
91
19
92
19
95
19
96
19
99
20
00
20
03
20
04
20
07
20
08
20
11
20
12
20
15
20
16
20
19
191219321952197219922012203220522072209221122132215221722192221222322252227222922312233223522372239224122432245224722492251225322552257225922612263226522672
Elev
atio
n (
ft.)
Year
Dep
th t
o W
ater
(ft
.)
OPTI Well 301 HydrographWSE & Depth-to-Water GSE
WSE Min = 2294 ft. WSE Max = 2294 ft. Well Depth = 382 ft.

020406080100120140160180200220240260280300320340360380400420440460480500520540560580600620640660680700720740
19
59
19
60
19
63
19
64
19
67
19
68
19
71
19
72
19
75
19
76
19
79
19
80
19
83
19
84
19
87
19
88
19
91
19
92
19
95
19
96
19
99
20
00
20
03
20
04
20
07
20
08
20
11
20
12
20
15
20
16
20
19
182118411861188119011921194119611981200120212041206120812101212121412161218122012221224122612281230123212341236123812401242124412461248125012521254125612581
Elev
atio
n (
ft.)
Year
Dep
th t
o W
ater
(ft
.)
OPTI Well 302 HydrographWSE & Depth-to-Water GSE
WSE Min = 2257 ft. WSE Max = 2285 ft. Well Depth = 327 ft.

020406080100120140160180200220240260280300320340360380400420440460480500520540560580600620640660680700720740
19
59
19
60
19
63
19
64
19
67
19
68
19
71
19
72
19
75
19
76
19
79
19
80
19
83
19
84
19
87
19
88
19
91
19
92
19
95
19
96
19
99
20
00
20
03
20
04
20
07
20
08
20
11
20
12
20
15
20
16
20
19
184818681888190819281948196819882008202820482068208821082128214821682188220822282248226822882308232823482368238824082428244824682488250825282548256825882608
Elev
atio
n (
ft.)
Year
Dep
th t
o W
ater
(ft
.)
OPTI Well 303 HydrographWSE & Depth-to-Water GSE
WSE Min = 2304 ft. WSE Max = 2306 ft. Well Depth = 425 ft.
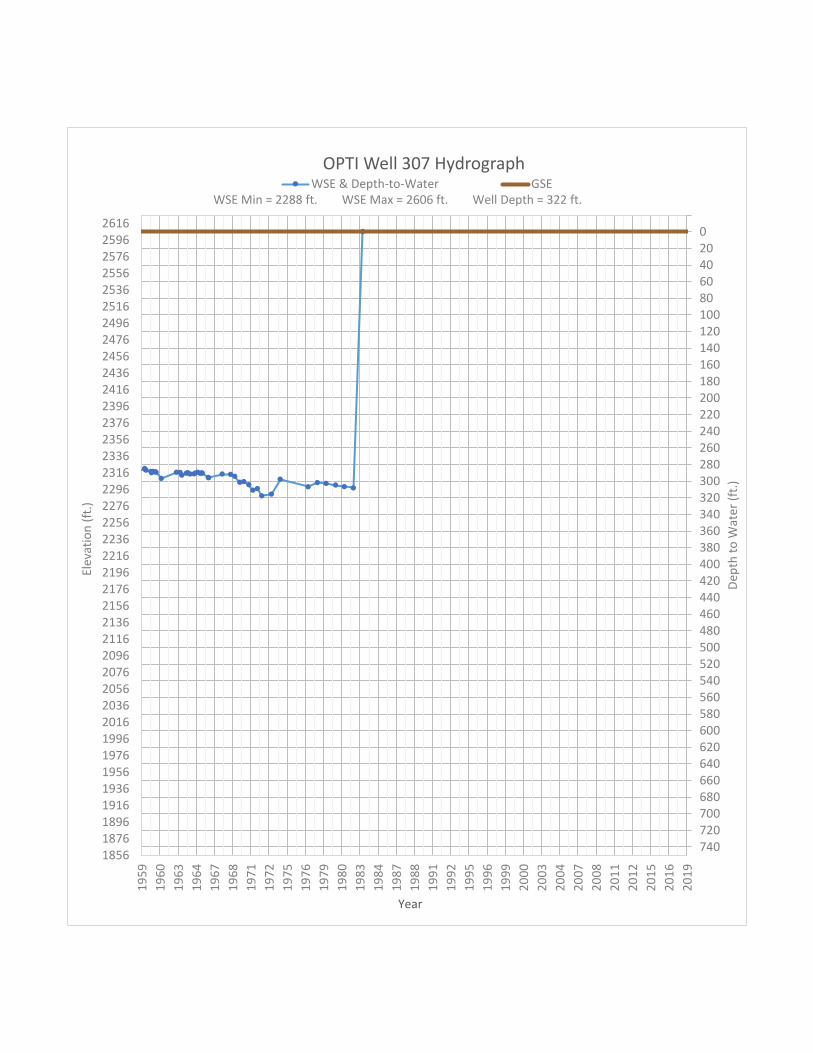
020406080100120140160180200220240260280300320340360380400420440460480500520540560580600620640660680700720740
19
59
19
60
19
63
19
64
19
67
19
68
19
71
19
72
19
75
19
76
19
79
19
80
19
83
19
84
19
87
19
88
19
91
19
92
19
95
19
96
19
99
20
00
20
03
20
04
20
07
20
08
20
11
20
12
20
15
20
16
20
19
185618761896191619361956197619962016203620562076209621162136215621762196221622362256227622962316233623562376239624162436245624762496251625362556257625962616
Elev
atio
n (
ft.)
Year
Dep
th t
o W
ater
(ft
.)
OPTI Well 307 HydrographWSE & Depth-to-Water GSE
WSE Min = 2288 ft. WSE Max = 2606 ft. Well Depth = 322 ft.

020406080100120140160180200220240260280300320340360380400420440460480500520540560580600620640660680700720740
19
59
19
60
19
63
19
64
19
67
19
68
19
71
19
72
19
75
19
76
19
79
19
80
19
83
19
84
19
87
19
88
19
91
19
92
19
95
19
96
19
99
20
00
20
03
20
04
20
07
20
08
20
11
20
12
20
15
20
16
20
19
174717671787180718271847186718871907192719471967198720072027204720672087210721272147216721872207222722472267228723072327234723672387240724272447246724872507
Elev
atio
n (
ft.)
Year
Dep
th t
o W
ater
(ft
.)
OPTI Well 310 HydrographWSE & Depth-to-Water GSE
WSE Min = 2183 ft. WSE Max = 2183 ft. Well Depth = 4045 ft.

020406080100120140160180200220240260280300320340360380400420440460480500520540560580600620640660680700720740
19
59
19
60
19
63
19
64
19
67
19
68
19
71
19
72
19
75
19
76
19
79
19
80
19
83
19
84
19
87
19
88
19
91
19
92
19
95
19
96
19
99
20
00
20
03
20
04
20
07
20
08
20
11
20
12
20
15
20
16
20
19
175017701790181018301850187018901910193019501970199020102030205020702090211021302150217021902210223022502270229023102330235023702390241024302450247024902510
Elev
atio
n (
ft.)
Year
Dep
th t
o W
ater
(ft
.)
OPTI Well 314 HydrographWSE & Depth-to-Water GSE
WSE Min = 2185 ft. WSE Max = 2199 ft. Well Depth = 820 ft.

020406080100120140160180200220240260280300320340360380400420440460480500520540560580600620640660680700720740
19
59
19
60
19
63
19
64
19
67
19
68
19
71
19
72
19
75
19
76
19
79
19
80
19
83
19
84
19
87
19
88
19
91
19
92
19
95
19
96
19
99
20
00
20
03
20
04
20
07
20
08
20
11
20
12
20
15
20
16
20
19
172417441764178418041824184418641884190419241944196419842004202420442064208421042124214421642184220422242244226422842304232423442364238424042424244424642484
Elev
atio
n (
ft.)
Year
Dep
th t
o W
ater
(ft
.)
OPTI Well 316 HydrographWSE & Depth-to-Water GSE
WSE Min = 1842 ft. WSE Max = 1914 ft. Well Depth = 830 ft.

020406080100120140160180200220240260280300320340360380400420440460480500520540560580600620640660680700720740
19
59
19
60
19
63
19
64
19
67
19
68
19
71
19
72
19
75
19
76
19
79
19
80
19
83
19
84
19
87
19
88
19
91
19
92
19
95
19
96
19
99
20
00
20
03
20
04
20
07
20
08
20
11
20
12
20
15
20
16
20
19
172417441764178418041824184418641884190419241944196419842004202420442064208421042124214421642184220422242244226422842304232423442364238424042424244424642484
Elev
atio
n (
ft.)
Year
Dep
th t
o W
ater
(ft
.)
OPTI Well 317 HydrographWSE & Depth-to-Water GSE
WSE Min = 1842 ft. WSE Max = 1915 ft. Well Depth = 700 ft.

020406080100120140160180200220240260280300320340360380400420440460480500520540560580600620640660680700720740
19
59
19
60
19
63
19
64
19
67
19
68
19
71
19
72
19
75
19
76
19
79
19
80
19
83
19
84
19
87
19
88
19
91
19
92
19
95
19
96
19
99
20
00
20
03
20
04
20
07
20
08
20
11
20
12
20
15
20
16
20
19
172417441764178418041824184418641884190419241944196419842004202420442064208421042124214421642184220422242244226422842304232423442364238424042424244424642484
Elev
atio
n (
ft.)
Year
Dep
th t
o W
ater
(ft
.)
OPTI Well 318 HydrographWSE & Depth-to-Water GSE
WSE Min = 1866 ft. WSE Max = 1914 ft. Well Depth = 610 ft.

020406080100120140160180200220240260280300320340360380400420440460480500520540560580600620640660680700720740
19
59
19
60
19
63
19
64
19
67
19
68
19
71
19
72
19
75
19
76
19
79
19
80
19
83
19
84
19
87
19
88
19
91
19
92
19
95
19
96
19
99
20
00
20
03
20
04
20
07
20
08
20
11
20
12
20
15
20
16
20
19
173817581778179818181838185818781898191819381958197819982018203820582078209821182138215821782198221822382258227822982318233823582378239824182438245824782498
Elev
atio
n (
ft.)
Year
Dep
th t
o W
ater
(ft
.)
OPTI Well 319 HydrographWSE & Depth-to-Water GSE
WSE Min = 2152 ft. WSE Max = 2251 ft. Well Depth = 390 ft.

020406080100120140160180200220240260280300320340360380400420440460480500520540560580600620640660680700720740
19
59
19
60
19
63
19
64
19
67
19
68
19
71
19
72
19
75
19
76
19
79
19
80
19
83
19
84
19
87
19
88
19
91
19
92
19
95
19
96
19
99
20
00
20
03
20
04
20
07
20
08
20
11
20
12
20
15
20
16
20
19
176917891809182918491869188919091929194919691989200920292049206920892109212921492169218922092229224922692289230923292349236923892409242924492469248925092529
Elev
atio
n (
ft.)
Year
Dep
th t
o W
ater
(ft
.)
OPTI Well 320 HydrographWSE & Depth-to-Water GSE
WSE Min = 2202 ft. WSE Max = 2208 ft. Well Depth = 750 ft.

020406080100120140160180200220240260280300320340360380400420440460480500520540560580600620640660680700720740
19
59
19
60
19
63
19
64
19
67
19
68
19
71
19
72
19
75
19
76
19
79
19
80
19
83
19
84
19
87
19
88
19
91
19
92
19
95
19
96
19
99
20
00
20
03
20
04
20
07
20
08
20
11
20
12
20
15
20
16
20
19
176317831803182318431863188319031923194319631983200320232043206320832103212321432163218322032223224322632283230323232343236323832403242324432463248325032523
Elev
atio
n (
ft.)
Year
Dep
th t
o W
ater
(ft
.)
OPTI Well 322 HydrographWSE & Depth-to-Water GSE
WSE Min = 2144 ft. WSE Max = 2236 ft. Well Depth = 850 ft.

020406080100120140160180200220240260280300320340360380400420440460480500520540560580600620640660680700720740
19
59
19
60
19
63
19
64
19
67
19
68
19
71
19
72
19
75
19
76
19
79
19
80
19
83
19
84
19
87
19
88
19
91
19
92
19
95
19
96
19
99
20
00
20
03
20
04
20
07
20
08
20
11
20
12
20
15
20
16
20
19
176317831803182318431863188319031923194319631983200320232043206320832103212321432163218322032223224322632283230323232343236323832403242324432463248325032523
Elev
atio
n (
ft.)
Year
Dep
th t
o W
ater
(ft
.)
OPTI Well 324 HydrographWSE & Depth-to-Water GSE
WSE Min = 2148 ft. WSE Max = 2233 ft. Well Depth = 560 ft.

020406080100120140160180200220240260280300320340360380400420440460480500520540560580600620640660680700720740
19
59
19
60
19
63
19
64
19
67
19
68
19
71
19
72
19
75
19
76
19
79
19
80
19
83
19
84
19
87
19
88
19
91
19
92
19
95
19
96
19
99
20
00
20
03
20
04
20
07
20
08
20
11
20
12
20
15
20
16
20
19
176317831803182318431863188319031923194319631983200320232043206320832103212321432163218322032223224322632283230323232343236323832403242324432463248325032523
Elev
atio
n (
ft.)
Year
Dep
th t
o W
ater
(ft
.)
OPTI Well 325 HydrographWSE & Depth-to-Water GSE
WSE Min = 2189 ft. WSE Max = 2232 ft. Well Depth = 380 ft.

020406080100120140160180200220240260280300320340360380400420440460480500520540560580600620640660680700720740
19
59
19
60
19
63
19
64
19
67
19
68
19
71
19
72
19
75
19
76
19
79
19
80
19
83
19
84
19
87
19
88
19
91
19
92
19
95
19
96
19
99
20
00
20
03
20
04
20
07
20
08
20
11
20
12
20
15
20
16
20
19
171417341754177417941814183418541874189419141934195419741994201420342054207420942114213421542174219422142234225422742294231423342354237423942414243424542474
Elev
atio
n (
ft.)
Year
Dep
th t
o W
ater
(ft
.)
OPTI Well 327 HydrographWSE & Depth-to-Water GSE
WSE Min = 2140 ft. WSE Max = 2159 ft. Well Depth = 600 ft.

020406080100120140160180200220240260280300320340360380400420440460480500520540560580600620640660680700720740
19
59
19
60
19
63
19
64
19
67
19
68
19
71
19
72
19
75
19
76
19
79
19
80
19
83
19
84
19
87
19
88
19
91
19
92
19
95
19
96
19
99
20
00
20
03
20
04
20
07
20
08
20
11
20
12
20
15
20
16
20
19
169317131733175317731793181318331853187318931913193319531973199320132033205320732093211321332153217321932213223322532273229323132333235323732393241324332453
Elev
atio
n (
ft.)
Year
Dep
th t
o W
ater
(ft
.)
OPTI Well 328 HydrographWSE & Depth-to-Water GSE
WSE Min = 2131 ft. WSE Max = 2243 ft. Well Depth = 1006 ft.
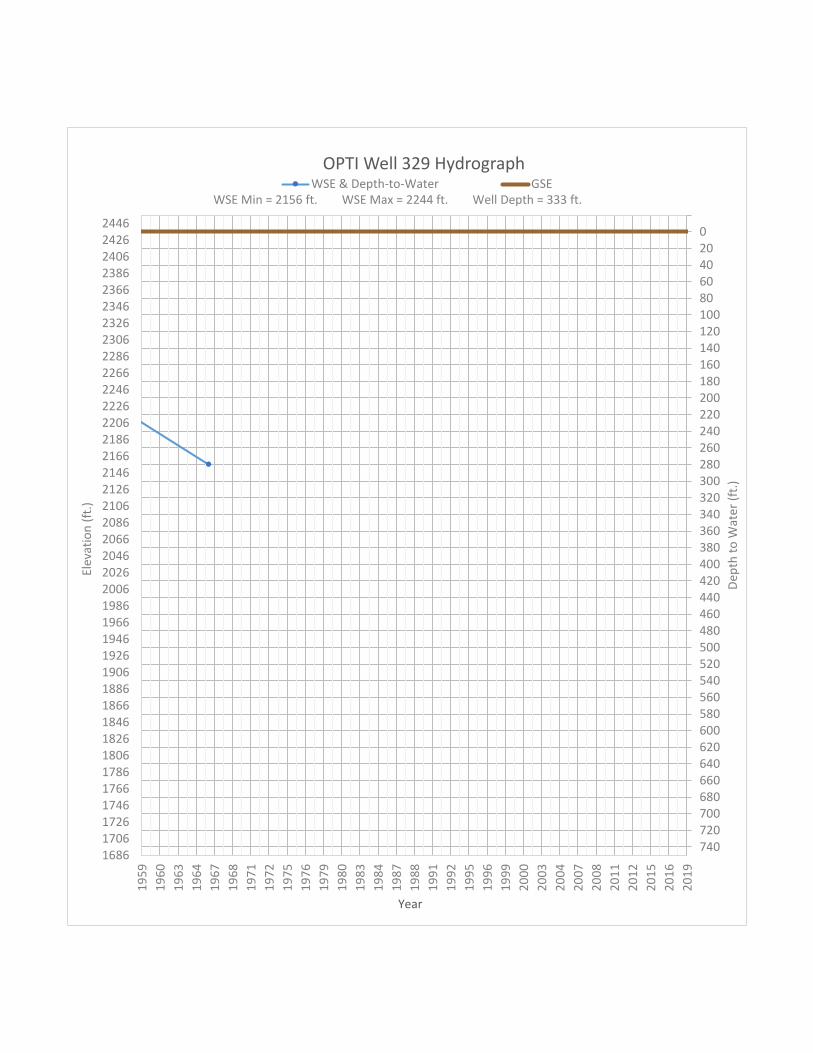
020406080100120140160180200220240260280300320340360380400420440460480500520540560580600620640660680700720740
19
59
19
60
19
63
19
64
19
67
19
68
19
71
19
72
19
75
19
76
19
79
19
80
19
83
19
84
19
87
19
88
19
91
19
92
19
95
19
96
19
99
20
00
20
03
20
04
20
07
20
08
20
11
20
12
20
15
20
16
20
19
168617061726174617661786180618261846186618861906192619461966198620062026204620662086210621262146216621862206222622462266228623062326234623662386240624262446
Elev
atio
n (
ft.)
Year
Dep
th t
o W
ater
(ft
.)
OPTI Well 329 HydrographWSE & Depth-to-Water GSE
WSE Min = 2156 ft. WSE Max = 2244 ft. Well Depth = 333 ft.

020406080100120140160180200220240260280300320340360380400420440460480500520540560580600620640660680700720740
19
59
19
60
19
63
19
64
19
67
19
68
19
71
19
72
19
75
19
76
19
79
19
80
19
83
19
84
19
87
19
88
19
91
19
92
19
95
19
96
19
99
20
00
20
03
20
04
20
07
20
08
20
11
20
12
20
15
20
16
20
19
165316731693171317331753177317931813183318531873189319131933195319731993201320332053207320932113213321532173219322132233225322732293231323332353237323932413
Elev
atio
n (
ft.)
Year
Dep
th t
o W
ater
(ft
.)
OPTI Well 331 HydrographWSE & Depth-to-Water GSE
WSE Min = 2203 ft. WSE Max = 2203 ft. Well Depth = Unknown ft.

020406080100120140160180200220240260280300320340360380400420440460480500520540560580600620640660680700720740
19
59
19
60
19
63
19
64
19
67
19
68
19
71
19
72
19
75
19
76
19
79
19
80
19
83
19
84
19
87
19
88
19
91
19
92
19
95
19
96
19
99
20
00
20
03
20
04
20
07
20
08
20
11
20
12
20
15
20
16
20
19
166716871707172717471767178718071827184718671887190719271947196719872007202720472067208721072127214721672187220722272247226722872307232723472367238724072427
Elev
atio
n (
ft.)
Year
Dep
th t
o W
ater
(ft
.)
OPTI Well 333 HydrographWSE & Depth-to-Water GSE
WSE Min = 2140 ft. WSE Max = 2140 ft. Well Depth = Unknown ft.

020406080100120140160180200220240260280300320340360380400420440460480500520540560580600620640660680700720740
19
59
19
60
19
63
19
64
19
67
19
68
19
71
19
72
19
75
19
76
19
79
19
80
19
83
19
84
19
87
19
88
19
91
19
92
19
95
19
96
19
99
20
00
20
03
20
04
20
07
20
08
20
11
20
12
20
15
20
16
20
19
166916891709172917491769178918091829184918691889190919291949196919892009202920492069208921092129214921692189220922292249226922892309232923492369238924092429
Elev
atio
n (
ft.)
Year
Dep
th t
o W
ater
(ft
.)
OPTI Well 335 HydrographWSE & Depth-to-Water GSE
WSE Min = 2133 ft. WSE Max = 2133 ft. Well Depth = 600 ft.
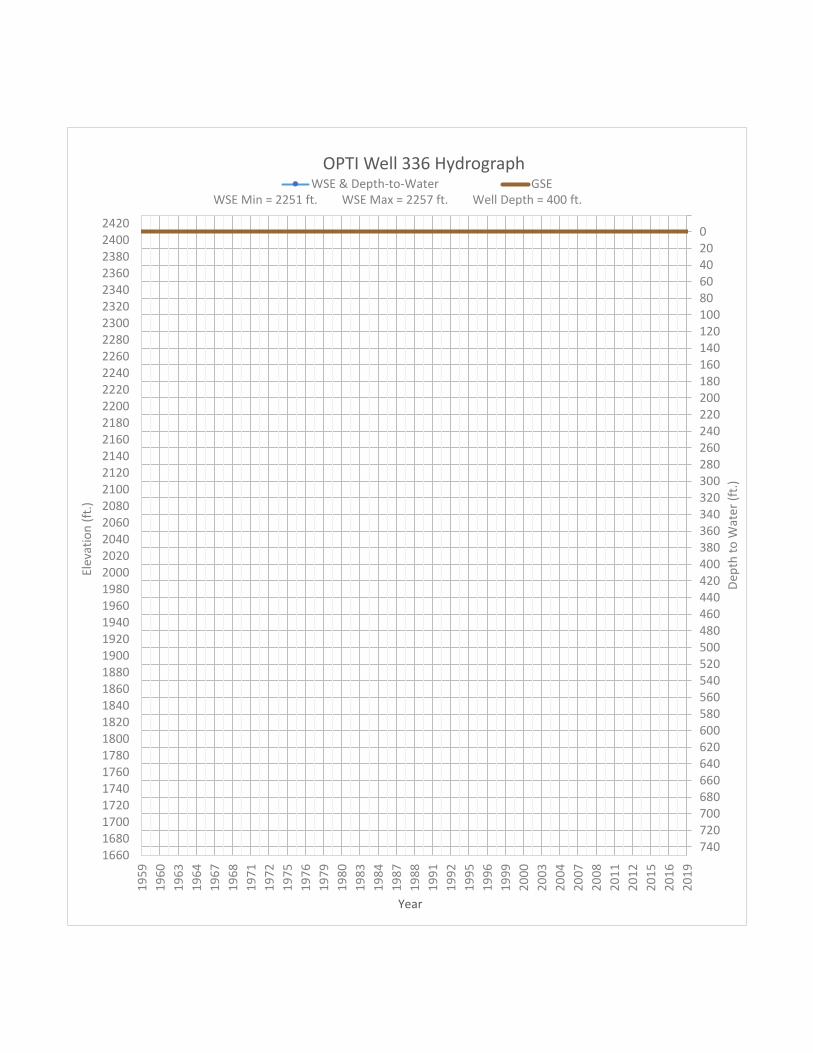
020406080100120140160180200220240260280300320340360380400420440460480500520540560580600620640660680700720740
19
59
19
60
19
63
19
64
19
67
19
68
19
71
19
72
19
75
19
76
19
79
19
80
19
83
19
84
19
87
19
88
19
91
19
92
19
95
19
96
19
99
20
00
20
03
20
04
20
07
20
08
20
11
20
12
20
15
20
16
20
19
166016801700172017401760178018001820184018601880190019201940196019802000202020402060208021002120214021602180220022202240226022802300232023402360238024002420
Elev
atio
n (
ft.)
Year
Dep
th t
o W
ater
(ft
.)
OPTI Well 336 HydrographWSE & Depth-to-Water GSE
WSE Min = 2251 ft. WSE Max = 2257 ft. Well Depth = 400 ft.

020406080100120140160180200220240260280300320340360380400420440460480500520540560580600620640660680700720740
19
59
19
60
19
63
19
64
19
67
19
68
19
71
19
72
19
75
19
76
19
79
19
80
19
83
19
84
19
87
19
88
19
91
19
92
19
95
19
96
19
99
20
00
20
03
20
04
20
07
20
08
20
11
20
12
20
15
20
16
20
19
166216821702172217421762178218021822184218621882190219221942196219822002202220422062208221022122214221622182220222222242226222822302232223422362238224022422
Elev
atio
n (
ft.)
Year
Dep
th t
o W
ater
(ft
.)
OPTI Well 337 HydrographWSE & Depth-to-Water GSE
WSE Min = 2253 ft. WSE Max = 2253 ft. Well Depth = Unknown ft.

020406080100120140160180200220240260280300320340360380400420440460480500520540560580600620640660680700720740
19
59
19
60
19
63
19
64
19
67
19
68
19
71
19
72
19
75
19
76
19
79
19
80
19
83
19
84
19
87
19
88
19
91
19
92
19
95
19
96
19
99
20
00
20
03
20
04
20
07
20
08
20
11
20
12
20
15
20
16
20
19
163916591679169917191739175917791799181918391859187918991919193919591979199920192039205920792099211921392159217921992219223922592279229923192339235923792399
Elev
atio
n (
ft.)
Year
Dep
th t
o W
ater
(ft
.)
OPTI Well 339 HydrographWSE & Depth-to-Water GSE
WSE Min = 2042 ft. WSE Max = 2246 ft. Well Depth = 370 ft.
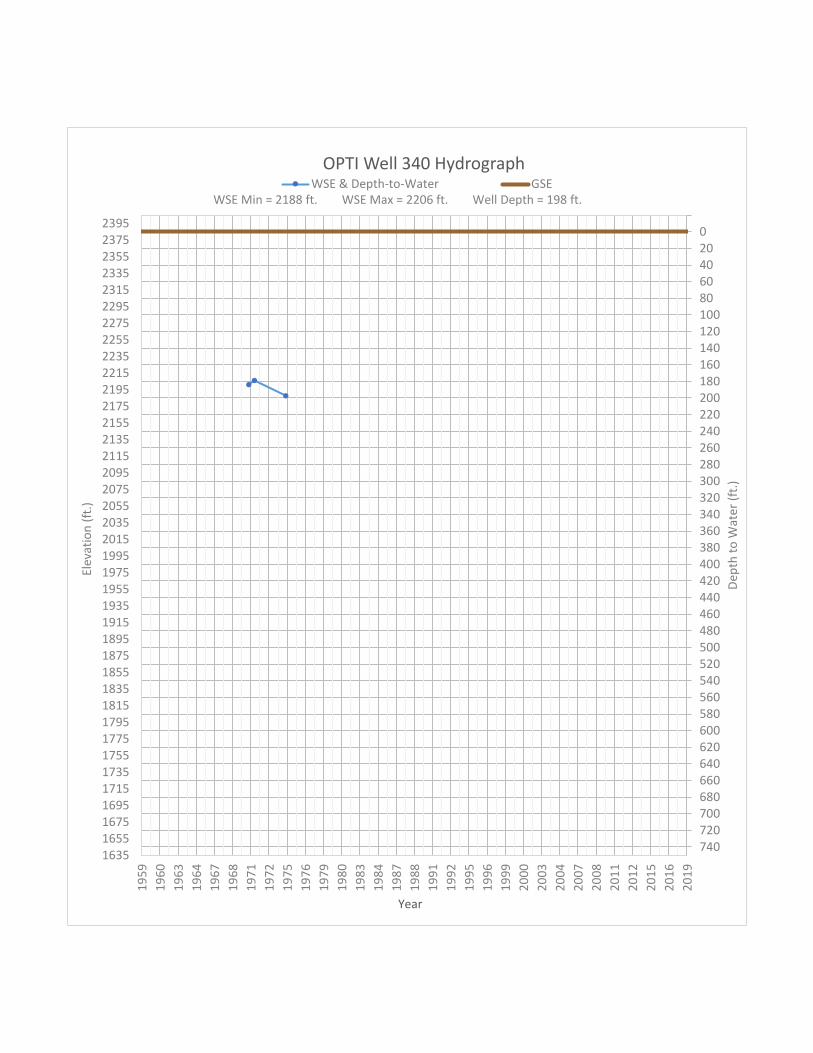
020406080100120140160180200220240260280300320340360380400420440460480500520540560580600620640660680700720740
19
59
19
60
19
63
19
64
19
67
19
68
19
71
19
72
19
75
19
76
19
79
19
80
19
83
19
84
19
87
19
88
19
91
19
92
19
95
19
96
19
99
20
00
20
03
20
04
20
07
20
08
20
11
20
12
20
15
20
16
20
19
163516551675169517151735175517751795181518351855187518951915193519551975199520152035205520752095211521352155217521952215223522552275229523152335235523752395
Elev
atio
n (
ft.)
Year
Dep
th t
o W
ater
(ft
.)
OPTI Well 340 HydrographWSE & Depth-to-Water GSE
WSE Min = 2188 ft. WSE Max = 2206 ft. Well Depth = 198 ft.

020406080100120140160180200220240260280300320340360380400420440460480500520540560580600620640660680700720740
19
59
19
60
19
63
19
64
19
67
19
68
19
71
19
72
19
75
19
76
19
79
19
80
19
83
19
84
19
87
19
88
19
91
19
92
19
95
19
96
19
99
20
00
20
03
20
04
20
07
20
08
20
11
20
12
20
15
20
16
20
19
163416541674169417141734175417741794181418341854187418941914193419541974199420142034205420742094211421342154217421942214223422542274229423142334235423742394
Elev
atio
n (
ft.)
Year
Dep
th t
o W
ater
(ft
.)
OPTI Well 341 HydrographWSE & Depth-to-Water GSE
WSE Min = 2215 ft. WSE Max = 2215 ft. Well Depth = 200 ft.

020406080100120140160180200220240260280300320340360380400420440460480500520540560580600620640660680700720740
19
59
19
60
19
63
19
64
19
67
19
68
19
71
19
72
19
75
19
76
19
79
19
80
19
83
19
84
19
87
19
88
19
91
19
92
19
95
19
96
19
99
20
00
20
03
20
04
20
07
20
08
20
11
20
12
20
15
20
16
20
19
162616461666168617061726174617661786180618261846186618861906192619461966198620062026204620662086210621262146216621862206222622462266228623062326234623662386
Elev
atio
n (
ft.)
Year
Dep
th t
o W
ater
(ft
.)
OPTI Well 342 HydrographWSE & Depth-to-Water GSE
WSE Min = 2140 ft. WSE Max = 2142 ft. Well Depth = 680 ft.

020406080100120140160180200220240260280300320340360380400420440460480500520540560580600620640660680700720740
19
59
19
60
19
63
19
64
19
67
19
68
19
71
19
72
19
75
19
76
19
79
19
80
19
83
19
84
19
87
19
88
19
91
19
92
19
95
19
96
19
99
20
00
20
03
20
04
20
07
20
08
20
11
20
12
20
15
20
16
20
19
161516351655167516951715173517551775179518151835185518751895191519351955197519952015203520552075209521152135215521752195221522352255227522952315233523552375
Elev
atio
n (
ft.)
Year
Dep
th t
o W
ater
(ft
.)
OPTI Well 346 HydrographWSE & Depth-to-Water GSE
WSE Min = 2258 ft. WSE Max = 2258 ft. Well Depth = 186 ft.

020406080100120140160180200220240260280300320340360380400420440460480500520540560580600620640660680700720740
19
59
19
60
19
63
19
64
19
67
19
68
19
71
19
72
19
75
19
76
19
79
19
80
19
83
19
84
19
87
19
88
19
91
19
92
19
95
19
96
19
99
20
00
20
03
20
04
20
07
20
08
20
11
20
12
20
15
20
16
20
19
162616461666168617061726174617661786180618261846186618861906192619461966198620062026204620662086210621262146216621862206222622462266228623062326234623662386
Elev
atio
n (
ft.)
Year
Dep
th t
o W
ater
(ft
.)
OPTI Well 347 HydrographWSE & Depth-to-Water GSE
WSE Min = 2176 ft. WSE Max = 2268 ft. Well Depth = 403 ft.

020406080100120140160180200220240260280300320340360380400420440460480500520540560580600620640660680700720740
19
59
19
60
19
63
19
64
19
67
19
68
19
71
19
72
19
75
19
76
19
79
19
80
19
83
19
84
19
87
19
88
19
91
19
92
19
95
19
96
19
99
20
00
20
03
20
04
20
07
20
08
20
11
20
12
20
15
20
16
20
19
160816281648166816881708172817481768178818081828184818681888190819281948196819882008202820482068208821082128214821682188220822282248226822882308232823482368
Elev
atio
n (
ft.)
Year
Dep
th t
o W
ater
(ft
.)
OPTI Well 348 HydrographWSE & Depth-to-Water GSE
WSE Min = 2223 ft. WSE Max = 2223 ft. Well Depth = 400 ft.

020406080100120140160180200220240260280300320340360380400420440460480500520540560580600620640660680700720740
19
59
19
60
19
63
19
64
19
67
19
68
19
71
19
72
19
75
19
76
19
79
19
80
19
83
19
84
19
87
19
88
19
91
19
92
19
95
19
96
19
99
20
00
20
03
20
04
20
07
20
08
20
11
20
12
20
15
20
16
20
19
199220122032205220722092211221322152217221922212223222522272229223122332235223722392241224322452247224922512253225522572259226122632265226722692271227322752
Elev
atio
n (
ft.)
Year
Dep
th t
o W
ater
(ft
.)
OPTI Well 351 HydrographWSE & Depth-to-Water GSE
WSE Min = 2680 ft. WSE Max = 2683 ft. Well Depth = 400 ft.

020406080100120140160180200220240260280300320340360380400420440460480500520540560580600620640660680700720740
19
59
19
60
19
63
19
64
19
67
19
68
19
71
19
72
19
75
19
76
19
79
19
80
19
83
19
84
19
87
19
88
19
91
19
92
19
95
19
96
19
99
20
00
20
03
20
04
20
07
20
08
20
11
20
12
20
15
20
16
20
19
159516151635165516751695171517351755177517951815183518551875189519151935195519751995201520352055207520952115213521552175219522152235225522752295231523352355
Elev
atio
n (
ft.)
Year
Dep
th t
o W
ater
(ft
.)
OPTI Well 352 HydrographWSE & Depth-to-Water GSE
WSE Min = 2178 ft. WSE Max = 2236 ft. Well Depth = 400 ft.

020406080100120140160180200220240260280300320340360380400420440460480500520540560580600620640660680700720740
19
59
19
60
19
63
19
64
19
67
19
68
19
71
19
72
19
75
19
76
19
79
19
80
19
83
19
84
19
87
19
88
19
91
19
92
19
95
19
96
19
99
20
00
20
03
20
04
20
07
20
08
20
11
20
12
20
15
20
16
20
19
161516351655167516951715173517551775179518151835185518751895191519351955197519952015203520552075209521152135215521752195221522352255227522952315233523552375
Elev
atio
n (
ft.)
Year
Dep
th t
o W
ater
(ft
.)
OPTI Well 353 HydrographWSE & Depth-to-Water GSE
WSE Min = 2189 ft. WSE Max = 2232 ft. Well Depth = 350 ft.

020406080100120140160180200220240260280300320340360380400420440460480500520540560580600620640660680700720740
19
59
19
60
19
63
19
64
19
67
19
68
19
71
19
72
19
75
19
76
19
79
19
80
19
83
19
84
19
87
19
88
19
91
19
92
19
95
19
96
19
99
20
00
20
03
20
04
20
07
20
08
20
11
20
12
20
15
20
16
20
19
165916791699171917391759177917991819183918591879189919191939195919791999201920392059207920992119213921592179219922192239225922792299231923392359237923992419
Elev
atio
n (
ft.)
Year
Dep
th t
o W
ater
(ft
.)
OPTI Well 354 HydrographWSE & Depth-to-Water GSE
WSE Min = 2135 ft. WSE Max = 2135 ft. Well Depth = Unknown ft.

020406080100120140160180200220240260280300320340360380400420440460480500520540560580600620640660680700720740
19
59
19
60
19
63
19
64
19
67
19
68
19
71
19
72
19
75
19
76
19
79
19
80
19
83
19
84
19
87
19
88
19
91
19
92
19
95
19
96
19
99
20
00
20
03
20
04
20
07
20
08
20
11
20
12
20
15
20
16
20
19
161116311651167116911711173117511771179118111831185118711891191119311951197119912011203120512071209121112131215121712191221122312251227122912311233123512371
Elev
atio
n (
ft.)
Year
Dep
th t
o W
ater
(ft
.)
OPTI Well 355 HydrographWSE & Depth-to-Water GSE
WSE Min = 2181 ft. WSE Max = 2205 ft. Well Depth = 252 ft.

020406080100120140160180200220240260280300320340360380400420440460480500520540560580600620640660680700720740
19
59
19
60
19
63
19
64
19
67
19
68
19
71
19
72
19
75
19
76
19
79
19
80
19
83
19
84
19
87
19
88
19
91
19
92
19
95
19
96
19
99
20
00
20
03
20
04
20
07
20
08
20
11
20
12
20
15
20
16
20
19
159716171637165716771697171717371757177717971817183718571877189719171937195719771997201720372057207720972117213721572177219722172237225722772297231723372357
Elev
atio
n (
ft.)
Year
Dep
th t
o W
ater
(ft
.)
OPTI Well 356 HydrographWSE & Depth-to-Water GSE
WSE Min = 2127 ft. WSE Max = 2243 ft. Well Depth = 417 ft.

020406080100120140160180200220240260280300320340360380400420440460480500520540560580600620640660680700720740
19
59
19
60
19
63
19
64
19
67
19
68
19
71
19
72
19
75
19
76
19
79
19
80
19
83
19
84
19
87
19
88
19
91
19
92
19
95
19
96
19
99
20
00
20
03
20
04
20
07
20
08
20
11
20
12
20
15
20
16
20
19
159116111631165116711691171117311751177117911811183118511871189119111931195119711991201120312051207120912111213121512171219122112231225122712291231123312351
Elev
atio
n (
ft.)
Year
Dep
th t
o W
ater
(ft
.)
OPTI Well 357 HydrographWSE & Depth-to-Water GSE
WSE Min = 2232 ft. WSE Max = 2232 ft. Well Depth = Unknown ft.

020406080100120140160180200220240260280300320340360380400420440460480500520540560580600620640660680700720740
19
59
19
60
19
63
19
64
19
67
19
68
19
71
19
72
19
75
19
76
19
79
19
80
19
83
19
84
19
87
19
88
19
91
19
92
19
95
19
96
19
99
20
00
20
03
20
04
20
07
20
08
20
11
20
12
20
15
20
16
20
19
170917291749176917891809182918491869188919091929194919691989200920292049206920892109212921492169218922092229224922692289230923292349236923892409242924492469
Elev
atio
n (
ft.)
Year
Dep
th t
o W
ater
(ft
.)
OPTI Well 362 HydrographWSE & Depth-to-Water GSE
WSE Min = 2243 ft. WSE Max = 2243 ft. Well Depth = 270 ft.

020406080100120140160180200220240260280300320340360380400420440460480500520540560580600620640660680700720740
19
59
19
60
19
63
19
64
19
67
19
68
19
71
19
72
19
75
19
76
19
79
19
80
19
83
19
84
19
87
19
88
19
91
19
92
19
95
19
96
19
99
20
00
20
03
20
04
20
07
20
08
20
11
20
12
20
15
20
16
20
19
166916891709172917491769178918091829184918691889190919291949196919892009202920492069208921092129214921692189220922292249226922892309232923492369238924092429
Elev
atio
n (
ft.)
Year
Dep
th t
o W
ater
(ft
.)
OPTI Well 365 HydrographWSE & Depth-to-Water GSE
WSE Min = 1879 ft. WSE Max = 1977 ft. Well Depth = 1008 ft.

020406080100120140160180200220240260280300320340360380400420440460480500520540560580600620640660680700720740
19
59
19
60
19
63
19
64
19
67
19
68
19
71
19
72
19
75
19
76
19
79
19
80
19
83
19
84
19
87
19
88
19
91
19
92
19
95
19
96
19
99
20
00
20
03
20
04
20
07
20
08
20
11
20
12
20
15
20
16
20
19
173817581778179818181838185818781898191819381958197819982018203820582078209821182138215821782198221822382258227822982318233823582378239824182438245824782498
Elev
atio
n (
ft.)
Year
Dep
th t
o W
ater
(ft
.)
OPTI Well 366 HydrographWSE & Depth-to-Water GSE
WSE Min = 2263 ft. WSE Max = 2263 ft. Well Depth = 257 ft.
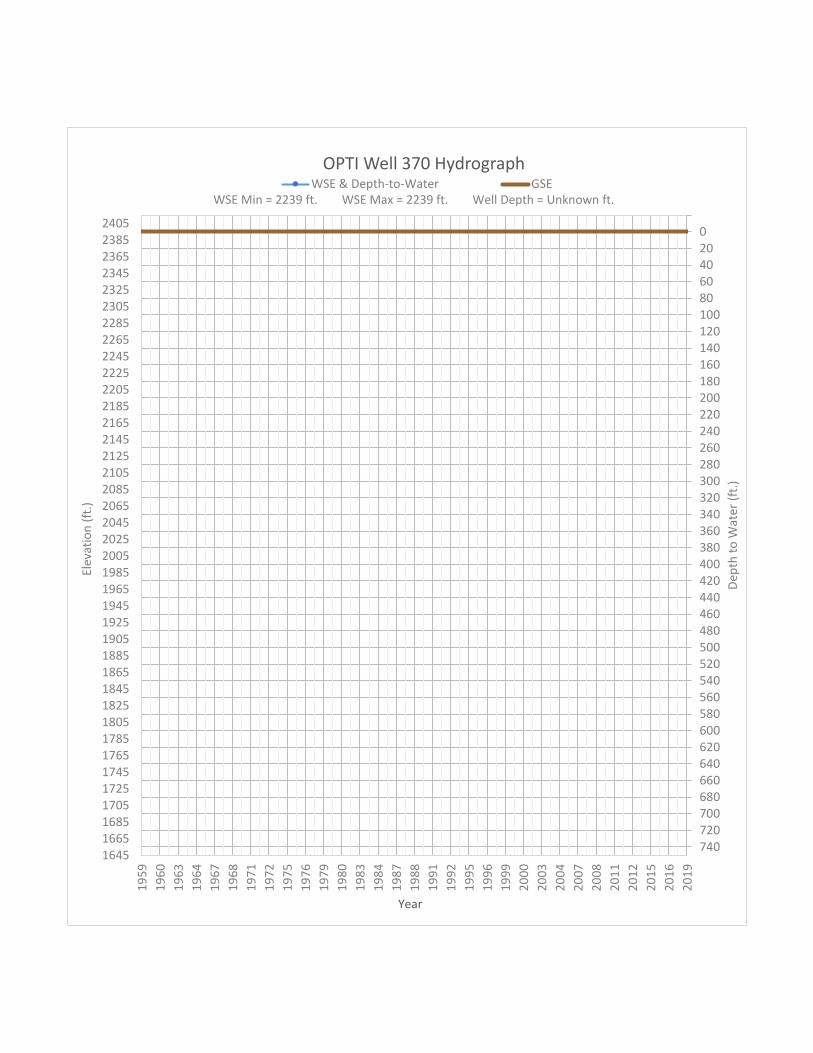
020406080100120140160180200220240260280300320340360380400420440460480500520540560580600620640660680700720740
19
59
19
60
19
63
19
64
19
67
19
68
19
71
19
72
19
75
19
76
19
79
19
80
19
83
19
84
19
87
19
88
19
91
19
92
19
95
19
96
19
99
20
00
20
03
20
04
20
07
20
08
20
11
20
12
20
15
20
16
20
19
164516651685170517251745176517851805182518451865188519051925194519651985200520252045206520852105212521452165218522052225224522652285230523252345236523852405
Elev
atio
n (
ft.)
Year
Dep
th t
o W
ater
(ft
.)
OPTI Well 370 HydrographWSE & Depth-to-Water GSE
WSE Min = 2239 ft. WSE Max = 2239 ft. Well Depth = Unknown ft.

020406080100120140160180200220240260280300320340360380400420440460480500520540560580600620640660680700720740
19
59
19
60
19
63
19
64
19
67
19
68
19
71
19
72
19
75
19
76
19
79
19
80
19
83
19
84
19
87
19
88
19
91
19
92
19
95
19
96
19
99
20
00
20
03
20
04
20
07
20
08
20
11
20
12
20
15
20
16
20
19
158816081628164816681688170817281748176817881808182818481868188819081928194819681988200820282048206820882108212821482168218822082228224822682288230823282348
Elev
atio
n (
ft.)
Year
Dep
th t
o W
ater
(ft
.)
OPTI Well 372 HydrographWSE & Depth-to-Water GSE
WSE Min = 2108 ft. WSE Max = 2108 ft. Well Depth = 803 ft.

020406080100120140160180200220240260280300320340360380400420440460480500520540560580600620640660680700720740
19
59
19
60
19
63
19
64
19
67
19
68
19
71
19
72
19
75
19
76
19
79
19
80
19
83
19
84
19
87
19
88
19
91
19
92
19
95
19
96
19
99
20
00
20
03
20
04
20
07
20
08
20
11
20
12
20
15
20
16
20
19
159516151635165516751695171517351755177517951815183518551875189519151935195519751995201520352055207520952115213521552175219522152235225522752295231523352355
Elev
atio
n (
ft.)
Year
Dep
th t
o W
ater
(ft
.)
OPTI Well 373 HydrographWSE & Depth-to-Water GSE
WSE Min = 2143 ft. WSE Max = 2228 ft. Well Depth = 382 ft.

020406080100120140160180200220240260280300320340360380400420440460480500520540560580600620640660680700720740
19
59
19
60
19
63
19
64
19
67
19
68
19
71
19
72
19
75
19
76
19
79
19
80
19
83
19
84
19
87
19
88
19
91
19
92
19
95
19
96
19
99
20
00
20
03
20
04
20
07
20
08
20
11
20
12
20
15
20
16
20
19
159716171637165716771697171717371757177717971817183718571877189719171937195719771997201720372057207720972117213721572177219722172237225722772297231723372357
Elev
atio
n (
ft.)
Year
Dep
th t
o W
ater
(ft
.)
OPTI Well 374 HydrographWSE & Depth-to-Water GSE
WSE Min = 2167 ft. WSE Max = 2178 ft. Well Depth = 300 ft.

020406080100120140160180200220240260280300320340360380400420440460480500520540560580600620640660680700720740
19
59
19
60
19
63
19
64
19
67
19
68
19
71
19
72
19
75
19
76
19
79
19
80
19
83
19
84
19
87
19
88
19
91
19
92
19
95
19
96
19
99
20
00
20
03
20
04
20
07
20
08
20
11
20
12
20
15
20
16
20
19
162016401660168017001720174017601780180018201840186018801900192019401960198020002020204020602080210021202140216021802200222022402260228023002320234023602380
Elev
atio
n (
ft.)
Year
Dep
th t
o W
ater
(ft
.)
OPTI Well 375 HydrographWSE & Depth-to-Water GSE
WSE Min = 2197 ft. WSE Max = 2233 ft. Well Depth = Unknown ft.

020406080100120140160180200220240260280300320340360380400420440460480500520540560580600620640660680700720740
19
59
19
60
19
63
19
64
19
67
19
68
19
71
19
72
19
75
19
76
19
79
19
80
19
83
19
84
19
87
19
88
19
91
19
92
19
95
19
96
19
99
20
00
20
03
20
04
20
07
20
08
20
11
20
12
20
15
20
16
20
19
163016501670169017101730175017701790181018301850187018901910193019501970199020102030205020702090211021302150217021902210223022502270229023102330235023702390
Elev
atio
n (
ft.)
Year
Dep
th t
o W
ater
(ft
.)
OPTI Well 380 HydrographWSE & Depth-to-Water GSE
WSE Min = 2138 ft. WSE Max = 2138 ft. Well Depth = 600 ft.

020406080100120140160180200220240260280300320340360380400420440460480500520540560580600620640660680700720740
19
59
19
60
19
63
19
64
19
67
19
68
19
71
19
72
19
75
19
76
19
79
19
80
19
83
19
84
19
87
19
88
19
91
19
92
19
95
19
96
19
99
20
00
20
03
20
04
20
07
20
08
20
11
20
12
20
15
20
16
20
19
159616161636165616761696171617361756177617961816183618561876189619161936195619761996201620362056207620962116213621562176219622162236225622762296231623362356
Elev
atio
n (
ft.)
Year
Dep
th t
o W
ater
(ft
.)
OPTI Well 381 HydrographWSE & Depth-to-Water GSE
WSE Min = 2236 ft. WSE Max = 2236 ft. Well Depth = Unknown ft.

020406080100120140160180200220240260280300320340360380400420440460480500520540560580600620640660680700720740
19
59
19
60
19
63
19
64
19
67
19
68
19
71
19
72
19
75
19
76
19
79
19
80
19
83
19
84
19
87
19
88
19
91
19
92
19
95
19
96
19
99
20
00
20
03
20
04
20
07
20
08
20
11
20
12
20
15
20
16
20
19
157815981618163816581678169817181738175817781798181818381858187818981918193819581978199820182038205820782098211821382158217821982218223822582278229823182338
Elev
atio
n (
ft.)
Year
Dep
th t
o W
ater
(ft
.)
OPTI Well 385 HydrographWSE & Depth-to-Water GSE
WSE Min = 1973 ft. WSE Max = 2096 ft. Well Depth = 700 ft.

020406080100120140160180200220240260280300320340360380400420440460480500520540560580600620640660680700720740
19
59
19
60
19
63
19
64
19
67
19
68
19
71
19
72
19
75
19
76
19
79
19
80
19
83
19
84
19
87
19
88
19
91
19
92
19
95
19
96
19
99
20
00
20
03
20
04
20
07
20
08
20
11
20
12
20
15
20
16
20
19
164416641684170417241744176417841804182418441864188419041924194419641984200420242044206420842104212421442164218422042224224422642284230423242344236423842404
Elev
atio
n (
ft.)
Year
Dep
th t
o W
ater
(ft
.)
OPTI Well 386 HydrographWSE & Depth-to-Water GSE
WSE Min = 2230 ft. WSE Max = 2230 ft. Well Depth = 660 ft.

020406080100120140160180200220240260280300320340360380400420440460480500520540560580600620640660680700720740
19
59
19
60
19
63
19
64
19
67
19
68
19
71
19
72
19
75
19
76
19
79
19
80
19
83
19
84
19
87
19
88
19
91
19
92
19
95
19
96
19
99
20
00
20
03
20
04
20
07
20
08
20
11
20
12
20
15
20
16
20
19
155515751595161516351655167516951715173517551775179518151835185518751895191519351955197519952015203520552075209521152135215521752195221522352255227522952315
Elev
atio
n (
ft.)
Year
Dep
th t
o W
ater
(ft
.)
OPTI Well 387 HydrographWSE & Depth-to-Water GSE
WSE Min = 2149 ft. WSE Max = 2165 ft. Well Depth = 800 ft.

020406080100120140160180200220240260280300320340360380400420440460480500520540560580600620640660680700720740
19
59
19
60
19
63
19
64
19
67
19
68
19
71
19
72
19
75
19
76
19
79
19
80
19
83
19
84
19
87
19
88
19
91
19
92
19
95
19
96
19
99
20
00
20
03
20
04
20
07
20
08
20
11
20
12
20
15
20
16
20
19
163816581678169817181738175817781798181818381858187818981918193819581978199820182038205820782098211821382158217821982218223822582278229823182338235823782398
Elev
atio
n (
ft.)
Year
Dep
th t
o W
ater
(ft
.)
OPTI Well 388 HydrographWSE & Depth-to-Water GSE
WSE Min = 2227 ft. WSE Max = 2227 ft. Well Depth = Unknown ft.

020406080100120140160180200220240260280300320340360380400420440460480500520540560580600620640660680700720740
19
59
19
60
19
63
19
64
19
67
19
68
19
71
19
72
19
75
19
76
19
79
19
80
19
83
19
84
19
87
19
88
19
91
19
92
19
95
19
96
19
99
20
00
20
03
20
04
20
07
20
08
20
11
20
12
20
15
20
16
20
19
155615761596161616361656167616961716173617561776179618161836185618761896191619361956197619962016203620562076209621162136215621762196221622362256227622962316
Elev
atio
n (
ft.)
Year
Dep
th t
o W
ater
(ft
.)
OPTI Well 392 HydrographWSE & Depth-to-Water GSE
WSE Min = 2222 ft. WSE Max = 2233 ft. Well Depth = 298 ft.

020406080100120140160180200220240260280300320340360380400420440460480500520540560580600620640660680700720740
19
59
19
60
19
63
19
64
19
67
19
68
19
71
19
72
19
75
19
76
19
79
19
80
19
83
19
84
19
87
19
88
19
91
19
92
19
95
19
96
19
99
20
00
20
03
20
04
20
07
20
08
20
11
20
12
20
15
20
16
20
19
154215621582160216221642166216821702172217421762178218021822184218621882190219221942196219822002202220422062208221022122214221622182220222222242226222822302
Elev
atio
n (
ft.)
Year
Dep
th t
o W
ater
(ft
.)
OPTI Well 393 HydrographWSE & Depth-to-Water GSE
WSE Min = 1903 ft. WSE Max = 2159 ft. Well Depth = Unknown ft.

020406080100120140160180200220240260280300320340360380400420440460480500520540560580600620640660680700720740
19
59
19
60
19
63
19
64
19
67
19
68
19
71
19
72
19
75
19
76
19
79
19
80
19
83
19
84
19
87
19
88
19
91
19
92
19
95
19
96
19
99
20
00
20
03
20
04
20
07
20
08
20
11
20
12
20
15
20
16
20
19
159216121632165216721692171217321752177217921812183218521872189219121932195219721992201220322052207220922112213221522172219222122232225222722292231223322352
Elev
atio
n (
ft.)
Year
Dep
th t
o W
ater
(ft
.)
OPTI Well 394 HydrographWSE & Depth-to-Water GSE
WSE Min = 2137 ft. WSE Max = 2137 ft. Well Depth = Unknown ft.
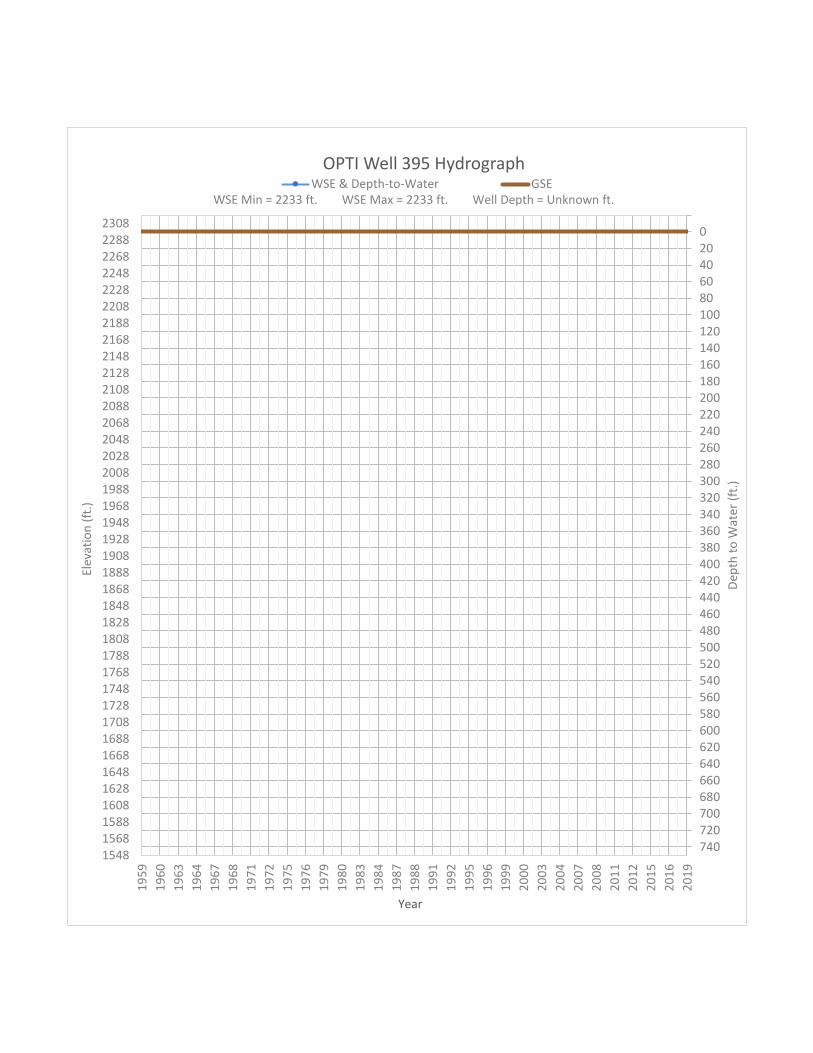
020406080100120140160180200220240260280300320340360380400420440460480500520540560580600620640660680700720740
19
59
19
60
19
63
19
64
19
67
19
68
19
71
19
72
19
75
19
76
19
79
19
80
19
83
19
84
19
87
19
88
19
91
19
92
19
95
19
96
19
99
20
00
20
03
20
04
20
07
20
08
20
11
20
12
20
15
20
16
20
19
154815681588160816281648166816881708172817481768178818081828184818681888190819281948196819882008202820482068208821082128214821682188220822282248226822882308
Elev
atio
n (
ft.)
Year
Dep
th t
o W
ater
(ft
.)
OPTI Well 395 HydrographWSE & Depth-to-Water GSE
WSE Min = 2233 ft. WSE Max = 2233 ft. Well Depth = Unknown ft.

020406080100120140160180200220240260280300320340360380400420440460480500520540560580600620640660680700720740
19
59
19
60
19
63
19
64
19
67
19
68
19
71
19
72
19
75
19
76
19
79
19
80
19
83
19
84
19
87
19
88
19
91
19
92
19
95
19
96
19
99
20
00
20
03
20
04
20
07
20
08
20
11
20
12
20
15
20
16
20
19
154815681588160816281648166816881708172817481768178818081828184818681888190819281948196819882008202820482068208821082128214821682188220822282248226822882308
Elev
atio
n (
ft.)
Year
Dep
th t
o W
ater
(ft
.)
OPTI Well 396 HydrographWSE & Depth-to-Water GSE
WSE Min = 2224 ft. WSE Max = 2224 ft. Well Depth = Unknown ft.

020406080100120140160180200220240260280300320340360380400420440460480500520540560580600620640660680700720740
19
59
19
60
19
63
19
64
19
67
19
68
19
71
19
72
19
75
19
76
19
79
19
80
19
83
19
84
19
87
19
88
19
91
19
92
19
95
19
96
19
99
20
00
20
03
20
04
20
07
20
08
20
11
20
12
20
15
20
16
20
19
154815681588160816281648166816881708172817481768178818081828184818681888190819281948196819882008202820482068208821082128214821682188220822282248226822882308
Elev
atio
n (
ft.)
Year
Dep
th t
o W
ater
(ft
.)
OPTI Well 397 HydrographWSE & Depth-to-Water GSE
WSE Min = 2161 ft. WSE Max = 2208 ft. Well Depth = 400 ft.
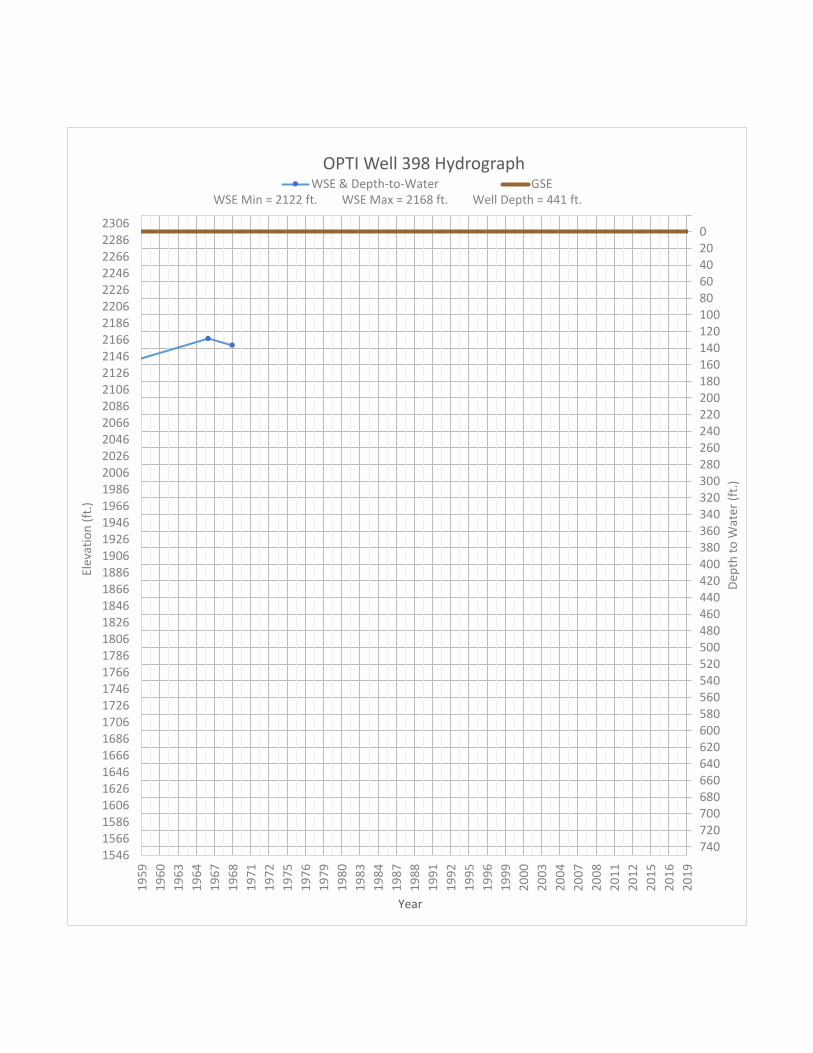
020406080100120140160180200220240260280300320340360380400420440460480500520540560580600620640660680700720740
19
59
19
60
19
63
19
64
19
67
19
68
19
71
19
72
19
75
19
76
19
79
19
80
19
83
19
84
19
87
19
88
19
91
19
92
19
95
19
96
19
99
20
00
20
03
20
04
20
07
20
08
20
11
20
12
20
15
20
16
20
19
154615661586160616261646166616861706172617461766178618061826184618661886190619261946196619862006202620462066208621062126214621662186220622262246226622862306
Elev
atio
n (
ft.)
Year
Dep
th t
o W
ater
(ft
.)
OPTI Well 398 HydrographWSE & Depth-to-Water GSE
WSE Min = 2122 ft. WSE Max = 2168 ft. Well Depth = 441 ft.

020406080100120140160180200220240260280300320340360380400420440460480500520540560580600620640660680700720740
19
59
19
60
19
63
19
64
19
67
19
68
19
71
19
72
19
75
19
76
19
79
19
80
19
83
19
84
19
87
19
88
19
91
19
92
19
95
19
96
19
99
20
00
20
03
20
04
20
07
20
08
20
11
20
12
20
15
20
16
20
19
154815681588160816281648166816881708172817481768178818081828184818681888190819281948196819882008202820482068208821082128214821682188220822282248226822882308
Elev
atio
n (
ft.)
Year
Dep
th t
o W
ater
(ft
.)
OPTI Well 399 HydrographWSE & Depth-to-Water GSE
WSE Min = 2185 ft. WSE Max = 2185 ft. Well Depth = 900 ft.

020406080100120140160180200220240260280300320340360380400420440460480500520540560580600620640660680700720740
19
59
19
60
19
63
19
64
19
67
19
68
19
71
19
72
19
75
19
76
19
79
19
80
19
83
19
84
19
87
19
88
19
91
19
92
19
95
19
96
19
99
20
00
20
03
20
04
20
07
20
08
20
11
20
12
20
15
20
16
20
19
154815681588160816281648166816881708172817481768178818081828184818681888190819281948196819882008202820482068208821082128214821682188220822282248226822882308
Elev
atio
n (
ft.)
Year
Dep
th t
o W
ater
(ft
.)
OPTI Well 400 HydrographWSE & Depth-to-Water GSE
WSE Min = 2058 ft. WSE Max = 2178 ft. Well Depth = 2120 ft.

020406080100120140160180200220240260280300320340360380400420440460480500520540560580600620640660680700720740
19
59
19
60
19
63
19
64
19
67
19
68
19
71
19
72
19
75
19
76
19
79
19
80
19
83
19
84
19
87
19
88
19
91
19
92
19
95
19
96
19
99
20
00
20
03
20
04
20
07
20
08
20
11
20
12
20
15
20
16
20
19
154415641584160416241644166416841704172417441764178418041824184418641884190419241944196419842004202420442064208421042124214421642184220422242244226422842304
Elev
atio
n (
ft.)
Year
Dep
th t
o W
ater
(ft
.)
OPTI Well 402 HydrographWSE & Depth-to-Water GSE
WSE Min = 2188 ft. WSE Max = 2189 ft. Well Depth = Unknown ft.

020406080100120140160180200220240260280300320340360380400420440460480500520540560580600620640660680700720740
19
59
19
60
19
63
19
64
19
67
19
68
19
71
19
72
19
75
19
76
19
79
19
80
19
83
19
84
19
87
19
88
19
91
19
92
19
95
19
96
19
99
20
00
20
03
20
04
20
07
20
08
20
11
20
12
20
15
20
16
20
19
155215721592161216321652167216921712173217521772179218121832185218721892191219321952197219922012203220522072209221122132215221722192221222322252227222922312
Elev
atio
n (
ft.)
Year
Dep
th t
o W
ater
(ft
.)
OPTI Well 404 HydrographWSE & Depth-to-Water GSE
WSE Min = 2120 ft. WSE Max = 2120 ft. Well Depth = 968 ft.

020406080100120140160180200220240260280300320340360380400420440460480500520540560580600620640660680700720740
19
59
19
60
19
63
19
64
19
67
19
68
19
71
19
72
19
75
19
76
19
79
19
80
19
83
19
84
19
87
19
88
19
91
19
92
19
95
19
96
19
99
20
00
20
03
20
04
20
07
20
08
20
11
20
12
20
15
20
16
20
19
152315431563158316031623164316631683170317231743176317831803182318431863188319031923194319631983200320232043206320832103212321432163218322032223224322632283
Elev
atio
n (
ft.)
Year
Dep
th t
o W
ater
(ft
.)
OPTI Well 412 HydrographWSE & Depth-to-Water GSE
WSE Min = 2177 ft. WSE Max = 2222 ft. Well Depth = 475 ft.

020406080100120140160180200220240260280300320340360380400420440460480500520540560580600620640660680700720740
19
59
19
60
19
63
19
64
19
67
19
68
19
71
19
72
19
75
19
76
19
79
19
80
19
83
19
84
19
87
19
88
19
91
19
92
19
95
19
96
19
99
20
00
20
03
20
04
20
07
20
08
20
11
20
12
20
15
20
16
20
19
153515551575159516151635165516751695171517351755177517951815183518551875189519151935195519751995201520352055207520952115213521552175219522152235225522752295
Elev
atio
n (
ft.)
Year
Dep
th t
o W
ater
(ft
.)
OPTI Well 413 HydrographWSE & Depth-to-Water GSE
WSE Min = 2175 ft. WSE Max = 2176 ft. Well Depth = Unknown ft.

020406080100120140160180200220240260280300320340360380400420440460480500520540560580600620640660680700720740
19
59
19
60
19
63
19
64
19
67
19
68
19
71
19
72
19
75
19
76
19
79
19
80
19
83
19
84
19
87
19
88
19
91
19
92
19
95
19
96
19
99
20
00
20
03
20
04
20
07
20
08
20
11
20
12
20
15
20
16
20
19
153115511571159116111631165116711691171117311751177117911811183118511871189119111931195119711991201120312051207120912111213121512171219122112231225122712291
Elev
atio
n (
ft.)
Year
Dep
th t
o W
ater
(ft
.)
OPTI Well 414 HydrographWSE & Depth-to-Water GSE
WSE Min = 2158 ft. WSE Max = 2191 ft. Well Depth = 400 ft.

020406080100120140160180200220240260280300320340360380400420440460480500520540560580600620640660680700720740
19
59
19
60
19
63
19
64
19
67
19
68
19
71
19
72
19
75
19
76
19
79
19
80
19
83
19
84
19
87
19
88
19
91
19
92
19
95
19
96
19
99
20
00
20
03
20
04
20
07
20
08
20
11
20
12
20
15
20
16
20
19
154615661586160616261646166616861706172617461766178618061826184618661886190619261946196619862006202620462066208621062126214621662186220622262246226622862306
Elev
atio
n (
ft.)
Year
Dep
th t
o W
ater
(ft
.)
OPTI Well 416 HydrographWSE & Depth-to-Water GSE
WSE Min = 2215 ft. WSE Max = 2244 ft. Well Depth = Unknown ft.

020406080100120140160180200220240260280300320340360380400420440460480500520540560580600620640660680700720740
19
59
19
60
19
63
19
64
19
67
19
68
19
71
19
72
19
75
19
76
19
79
19
80
19
83
19
84
19
87
19
88
19
91
19
92
19
95
19
96
19
99
20
00
20
03
20
04
20
07
20
08
20
11
20
12
20
15
20
16
20
19
154315631583160316231643166316831703172317431763178318031823184318631883190319231943196319832003202320432063208321032123214321632183220322232243226322832303
Elev
atio
n (
ft.)
Year
Dep
th t
o W
ater
(ft
.)
OPTI Well 417 HydrographWSE & Depth-to-Water GSE
WSE Min = 2137 ft. WSE Max = 2137 ft. Well Depth = 720 ft.

020406080100120140160180200220240260280300320340360380400420440460480500520540560580600620640660680700720740
19
59
19
60
19
63
19
64
19
67
19
68
19
71
19
72
19
75
19
76
19
79
19
80
19
83
19
84
19
87
19
88
19
91
19
92
19
95
19
96
19
99
20
00
20
03
20
04
20
07
20
08
20
11
20
12
20
15
20
16
20
19
154015601580160016201640166016801700172017401760178018001820184018601880190019201940196019802000202020402060208021002120214021602180220022202240226022802300
Elev
atio
n (
ft.)
Year
Dep
th t
o W
ater
(ft
.)
OPTI Well 418 HydrographWSE & Depth-to-Water GSE
WSE Min = 2146 ft. WSE Max = 2146 ft. Well Depth = 600 ft.

020406080100120140160180200220240260280300320340360380400420440460480500520540560580600620640660680700720740
19
59
19
60
19
63
19
64
19
67
19
68
19
71
19
72
19
75
19
76
19
79
19
80
19
83
19
84
19
87
19
88
19
91
19
92
19
95
19
96
19
99
20
00
20
03
20
04
20
07
20
08
20
11
20
12
20
15
20
16
20
19
153615561576159616161636165616761696171617361756177617961816183618561876189619161936195619761996201620362056207620962116213621562176219622162236225622762296
Elev
atio
n (
ft.)
Year
Dep
th t
o W
ater
(ft
.)
OPTI Well 420 HydrographWSE & Depth-to-Water GSE
WSE Min = 1809 ft. WSE Max = 1913 ft. Well Depth = 780 ft.

020406080100120140160180200220240260280300320340360380400420440460480500520540560580600620640660680700720740
19
59
19
60
19
63
19
64
19
67
19
68
19
71
19
72
19
75
19
76
19
79
19
80
19
83
19
84
19
87
19
88
19
91
19
92
19
95
19
96
19
99
20
00
20
03
20
04
20
07
20
08
20
11
20
12
20
15
20
16
20
19
153615561576159616161636165616761696171617361756177617961816183618561876189619161936195619761996201620362056207620962116213621562176219622162236225622762296
Elev
atio
n (
ft.)
Year
Dep
th t
o W
ater
(ft
.)
OPTI Well 421 HydrographWSE & Depth-to-Water GSE
WSE Min = 1828 ft. WSE Max = 1910 ft. Well Depth = 620 ft.

020406080100120140160180200220240260280300320340360380400420440460480500520540560580600620640660680700720740
19
59
19
60
19
63
19
64
19
67
19
68
19
71
19
72
19
75
19
76
19
79
19
80
19
83
19
84
19
87
19
88
19
91
19
92
19
95
19
96
19
99
20
00
20
03
20
04
20
07
20
08
20
11
20
12
20
15
20
16
20
19
153615561576159616161636165616761696171617361756177617961816183618561876189619161936195619761996201620362056207620962116213621562176219622162236225622762296
Elev
atio
n (
ft.)
Year
Dep
th t
o W
ater
(ft
.)
OPTI Well 422 HydrographWSE & Depth-to-Water GSE
WSE Min = 1838 ft. WSE Max = 1909 ft. Well Depth = 460 ft.

020406080100120140160180200220240260280300320340360380400420440460480500520540560580600620640660680700720740
19
59
19
60
19
63
19
64
19
67
19
68
19
71
19
72
19
75
19
76
19
79
19
80
19
83
19
84
19
87
19
88
19
91
19
92
19
95
19
96
19
99
20
00
20
03
20
04
20
07
20
08
20
11
20
12
20
15
20
16
20
19
154215621582160216221642166216821702172217421762178218021822184218621882190219221942196219822002202220422062208221022122214221622182220222222242226222822302
Elev
atio
n (
ft.)
Year
Dep
th t
o W
ater
(ft
.)
OPTI Well 423 HydrographWSE & Depth-to-Water GSE
WSE Min = 2147 ft. WSE Max = 2224 ft. Well Depth = 278 ft.

020406080100120140160180200220240260280300320340360380400420440460480500520540560580600620640660680700720740
19
59
19
60
19
63
19
64
19
67
19
68
19
71
19
72
19
75
19
76
19
79
19
80
19
83
19
84
19
87
19
88
19
91
19
92
19
95
19
96
19
99
20
00
20
03
20
04
20
07
20
08
20
11
20
12
20
15
20
16
20
19
154115611581160116211641166116811701172117411761178118011821184118611881190119211941196119812001202120412061208121012121214121612181220122212241226122812301
Elev
atio
n (
ft.)
Year
Dep
th t
o W
ater
(ft
.)
OPTI Well 424 HydrographWSE & Depth-to-Water GSE
WSE Min = 1848 ft. WSE Max = 1898 ft. Well Depth = 1000 ft.

020406080100120140160180200220240260280300320340360380400420440460480500520540560580600620640660680700720740
19
59
19
60
19
63
19
64
19
67
19
68
19
71
19
72
19
75
19
76
19
79
19
80
19
83
19
84
19
87
19
88
19
91
19
92
19
95
19
96
19
99
20
00
20
03
20
04
20
07
20
08
20
11
20
12
20
15
20
16
20
19
153415541574159416141634165416741694171417341754177417941814183418541874189419141934195419741994201420342054207420942114213421542174219422142234225422742294
Elev
atio
n (
ft.)
Year
Dep
th t
o W
ater
(ft
.)
OPTI Well 427 HydrographWSE & Depth-to-Water GSE
WSE Min = 2231 ft. WSE Max = 2231 ft. Well Depth = 28 ft.

020406080100120140160180200220240260280300320340360380400420440460480500520540560580600620640660680700720740
19
59
19
60
19
63
19
64
19
67
19
68
19
71
19
72
19
75
19
76
19
79
19
80
19
83
19
84
19
87
19
88
19
91
19
92
19
95
19
96
19
99
20
00
20
03
20
04
20
07
20
08
20
11
20
12
20
15
20
16
20
19
167816981718173817581778179818181838185818781898191819381958197819982018203820582078209821182138215821782198221822382258227822982318233823582378239824182438
Elev
atio
n (
ft.)
Year
Dep
th t
o W
ater
(ft
.)
OPTI Well 428 HydrographWSE & Depth-to-Water GSE
WSE Min = 2246 ft. WSE Max = 2268 ft. Well Depth = 282 ft.
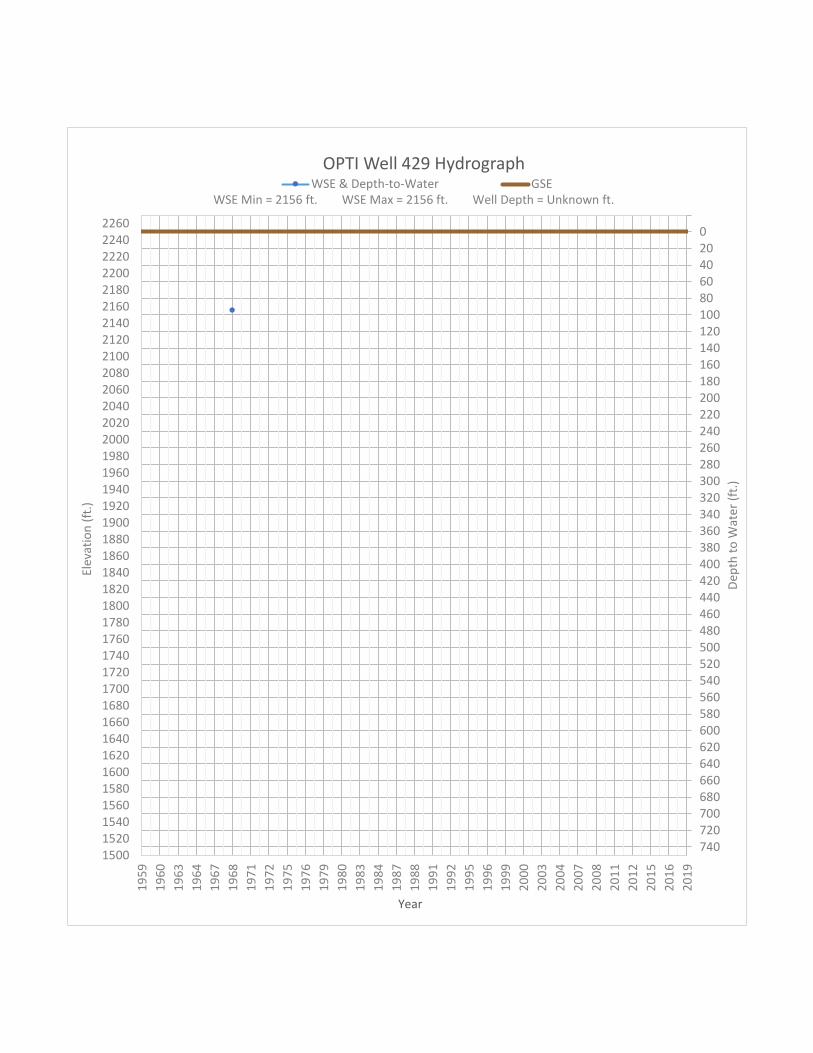
020406080100120140160180200220240260280300320340360380400420440460480500520540560580600620640660680700720740
19
59
19
60
19
63
19
64
19
67
19
68
19
71
19
72
19
75
19
76
19
79
19
80
19
83
19
84
19
87
19
88
19
91
19
92
19
95
19
96
19
99
20
00
20
03
20
04
20
07
20
08
20
11
20
12
20
15
20
16
20
19
150015201540156015801600162016401660168017001720174017601780180018201840186018801900192019401960198020002020204020602080210021202140216021802200222022402260
Elev
atio
n (
ft.)
Year
Dep
th t
o W
ater
(ft
.)
OPTI Well 429 HydrographWSE & Depth-to-Water GSE
WSE Min = 2156 ft. WSE Max = 2156 ft. Well Depth = Unknown ft.

020406080100120140160180200220240260280300320340360380400420440460480500520540560580600620640660680700720740
19
59
19
60
19
63
19
64
19
67
19
68
19
71
19
72
19
75
19
76
19
79
19
80
19
83
19
84
19
87
19
88
19
91
19
92
19
95
19
96
19
99
20
00
20
03
20
04
20
07
20
08
20
11
20
12
20
15
20
16
20
19
149715171537155715771597161716371657167716971717173717571777179718171837185718771897191719371957197719972017203720572077209721172137215721772197221722372257
Elev
atio
n (
ft.)
Year
Dep
th t
o W
ater
(ft
.)
OPTI Well 431 HydrographWSE & Depth-to-Water GSE
WSE Min = 2154 ft. WSE Max = 2154 ft. Well Depth = Unknown ft.

020406080100120140160180200220240260280300320340360380400420440460480500520540560580600620640660680700720740
19
59
19
60
19
63
19
64
19
67
19
68
19
71
19
72
19
75
19
76
19
79
19
80
19
83
19
84
19
87
19
88
19
91
19
92
19
95
19
96
19
99
20
00
20
03
20
04
20
07
20
08
20
11
20
12
20
15
20
16
20
19
149615161536155615761596161616361656167616961716173617561776179618161836185618761896191619361956197619962016203620562076209621162136215621762196221622362256
Elev
atio
n (
ft.)
Year
Dep
th t
o W
ater
(ft
.)
OPTI Well 432 HydrographWSE & Depth-to-Water GSE
WSE Min = 2160 ft. WSE Max = 2182 ft. Well Depth = 575 ft.

020406080100120140160180200220240260280300320340360380400420440460480500520540560580600620640660680700720740
19
59
19
60
19
63
19
64
19
67
19
68
19
71
19
72
19
75
19
76
19
79
19
80
19
83
19
84
19
87
19
88
19
91
19
92
19
95
19
96
19
99
20
00
20
03
20
04
20
07
20
08
20
11
20
12
20
15
20
16
20
19
152815481568158816081628164816681688170817281748176817881808182818481868188819081928194819681988200820282048206820882108212821482168218822082228224822682288
Elev
atio
n (
ft.)
Year
Dep
th t
o W
ater
(ft
.)
OPTI Well 434 HydrographWSE & Depth-to-Water GSE
WSE Min = 2173 ft. WSE Max = 2180 ft. Well Depth = Unknown ft.

020406080100120140160180200220240260280300320340360380400420440460480500520540560580600620640660680700720740
19
59
19
60
19
63
19
64
19
67
19
68
19
71
19
72
19
75
19
76
19
79
19
80
19
83
19
84
19
87
19
88
19
91
19
92
19
95
19
96
19
99
20
00
20
03
20
04
20
07
20
08
20
11
20
12
20
15
20
16
20
19
149915191539155915791599161916391659167916991719173917591779179918191839185918791899191919391959197919992019203920592079209921192139215921792199221922392259
Elev
atio
n (
ft.)
Year
Dep
th t
o W
ater
(ft
.)
OPTI Well 435 HydrographWSE & Depth-to-Water GSE
WSE Min = 2158 ft. WSE Max = 2166 ft. Well Depth = 507 ft.

020406080100120140160180200220240260280300320340360380400420440460480500520540560580600620640660680700720740
19
59
19
60
19
63
19
64
19
67
19
68
19
71
19
72
19
75
19
76
19
79
19
80
19
83
19
84
19
87
19
88
19
91
19
92
19
95
19
96
19
99
20
00
20
03
20
04
20
07
20
08
20
11
20
12
20
15
20
16
20
19
161716371657167716971717173717571777179718171837185718771897191719371957197719972017203720572077209721172137215721772197221722372257227722972317233723572377
Elev
atio
n (
ft.)
Year
Dep
th t
o W
ater
(ft
.)
OPTI Well 438 HydrographWSE & Depth-to-Water GSE
WSE Min = 2114 ft. WSE Max = 2243 ft. Well Depth = 659 ft.

020406080100120140160180200220240260280300320340360380400420440460480500520540560580600620640660680700720740
19
59
19
60
19
63
19
64
19
67
19
68
19
71
19
72
19
75
19
76
19
79
19
80
19
83
19
84
19
87
19
88
19
91
19
92
19
95
19
96
19
99
20
00
20
03
20
04
20
07
20
08
20
11
20
12
20
15
20
16
20
19
162416441664168417041724174417641784180418241844186418841904192419441964198420042024204420642084210421242144216421842204222422442264228423042324234423642384
Elev
atio
n (
ft.)
Year
Dep
th t
o W
ater
(ft
.)
OPTI Well 440 HydrographWSE & Depth-to-Water GSE
WSE Min = 2139 ft. WSE Max = 2139 ft. Well Depth = 623 ft.

020406080100120140160180200220240260280300320340360380400420440460480500520540560580600620640660680700720740
19
59
19
60
19
63
19
64
19
67
19
68
19
71
19
72
19
75
19
76
19
79
19
80
19
83
19
84
19
87
19
88
19
91
19
92
19
95
19
96
19
99
20
00
20
03
20
04
20
07
20
08
20
11
20
12
20
15
20
16
20
19
152715471567158716071627164716671687170717271747176717871807182718471867188719071927194719671987200720272047206720872107212721472167218722072227224722672287
Elev
atio
n (
ft.)
Year
Dep
th t
o W
ater
(ft
.)
OPTI Well 447 HydrographWSE & Depth-to-Water GSE
WSE Min = 2175 ft. WSE Max = 2221 ft. Well Depth = 283 ft.

020406080100120140160180200220240260280300320340360380400420440460480500520540560580600620640660680700720740
19
59
19
60
19
63
19
64
19
67
19
68
19
71
19
72
19
75
19
76
19
79
19
80
19
83
19
84
19
87
19
88
19
91
19
92
19
95
19
96
19
99
20
00
20
03
20
04
20
07
20
08
20
11
20
12
20
15
20
16
20
19
152215421562158216021622164216621682170217221742176217821802182218421862188219021922194219621982200220222042206220822102212221422162218222022222224222622282
Elev
atio
n (
ft.)
Year
Dep
th t
o W
ater
(ft
.)
OPTI Well 448 HydrographWSE & Depth-to-Water GSE
WSE Min = 2205 ft. WSE Max = 2205 ft. Well Depth = 129 ft.

020406080100120140160180200220240260280300320340360380400420440460480500520540560580600620640660680700720740
19
59
19
60
19
63
19
64
19
67
19
68
19
71
19
72
19
75
19
76
19
79
19
80
19
83
19
84
19
87
19
88
19
91
19
92
19
95
19
96
19
99
20
00
20
03
20
04
20
07
20
08
20
11
20
12
20
15
20
16
20
19
152615461566158616061626164616661686170617261746176617861806182618461866188619061926194619661986200620262046206620862106212621462166218622062226224622662286
Elev
atio
n (
ft.)
Year
Dep
th t
o W
ater
(ft
.)
OPTI Well 450 HydrographWSE & Depth-to-Water GSE
WSE Min = 2176 ft. WSE Max = 2176 ft. Well Depth = Unknown ft.

020406080100120140160180200220240260280300320340360380400420440460480500520540560580600620640660680700720740
19
59
19
60
19
63
19
64
19
67
19
68
19
71
19
72
19
75
19
76
19
79
19
80
19
83
19
84
19
87
19
88
19
91
19
92
19
95
19
96
19
99
20
00
20
03
20
04
20
07
20
08
20
11
20
12
20
15
20
16
20
19
151815381558157815981618163816581678169817181738175817781798181818381858187818981918193819581978199820182038205820782098211821382158217821982218223822582278
Elev
atio
n (
ft.)
Year
Dep
th t
o W
ater
(ft
.)
OPTI Well 451 HydrographWSE & Depth-to-Water GSE
WSE Min = 2197 ft. WSE Max = 2200 ft. Well Depth = Unknown ft.
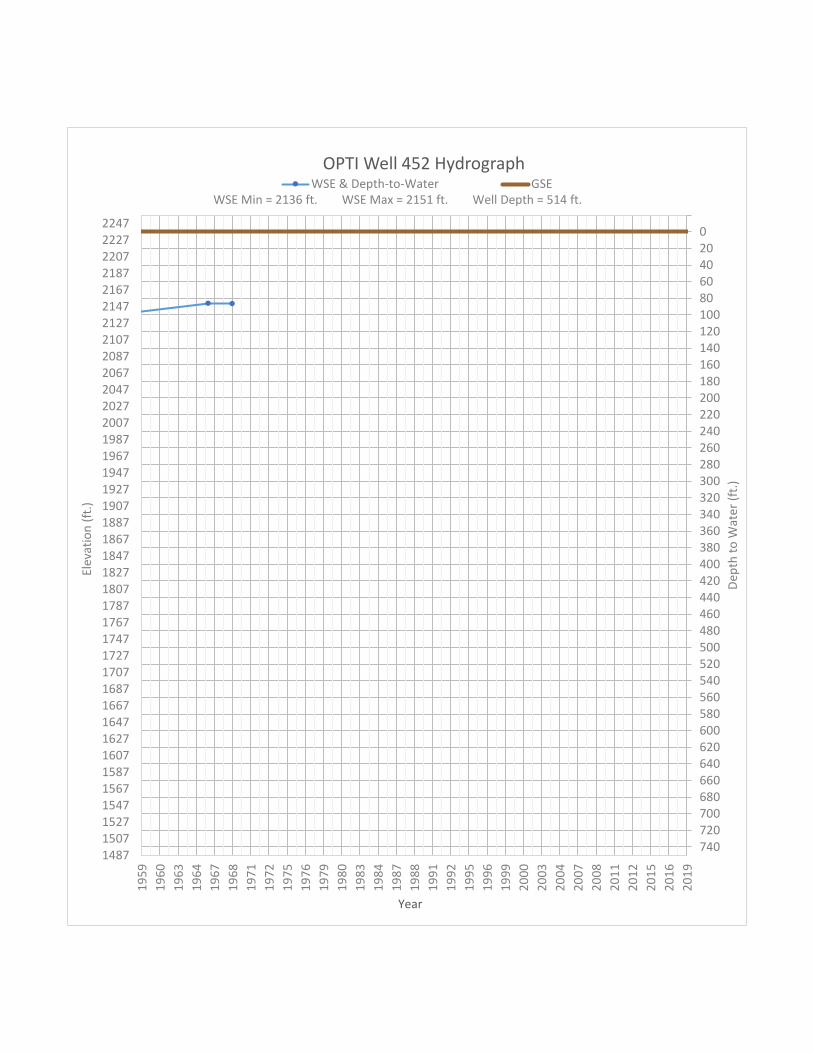
020406080100120140160180200220240260280300320340360380400420440460480500520540560580600620640660680700720740
19
59
19
60
19
63
19
64
19
67
19
68
19
71
19
72
19
75
19
76
19
79
19
80
19
83
19
84
19
87
19
88
19
91
19
92
19
95
19
96
19
99
20
00
20
03
20
04
20
07
20
08
20
11
20
12
20
15
20
16
20
19
148715071527154715671587160716271647166716871707172717471767178718071827184718671887190719271947196719872007202720472067208721072127214721672187220722272247
Elev
atio
n (
ft.)
Year
Dep
th t
o W
ater
(ft
.)
OPTI Well 452 HydrographWSE & Depth-to-Water GSE
WSE Min = 2136 ft. WSE Max = 2151 ft. Well Depth = 514 ft.

020406080100120140160180200220240260280300320340360380400420440460480500520540560580600620640660680700720740
19
59
19
60
19
63
19
64
19
67
19
68
19
71
19
72
19
75
19
76
19
79
19
80
19
83
19
84
19
87
19
88
19
91
19
92
19
95
19
96
19
99
20
00
20
03
20
04
20
07
20
08
20
11
20
12
20
15
20
16
20
19
151015301550157015901610163016501670169017101730175017701790181018301850187018901910193019501970199020102030205020702090211021302150217021902210223022502270
Elev
atio
n (
ft.)
Year
Dep
th t
o W
ater
(ft
.)
OPTI Well 454 HydrographWSE & Depth-to-Water GSE
WSE Min = 2171 ft. WSE Max = 2178 ft. Well Depth = Unknown ft.

020406080100120140160180200220240260280300320340360380400420440460480500520540560580600620640660680700720740
19
59
19
60
19
63
19
64
19
67
19
68
19
71
19
72
19
75
19
76
19
79
19
80
19
83
19
84
19
87
19
88
19
91
19
92
19
95
19
96
19
99
20
00
20
03
20
04
20
07
20
08
20
11
20
12
20
15
20
16
20
19
148615061526154615661586160616261646166616861706172617461766178618061826184618661886190619261946196619862006202620462066208621062126214621662186220622262246
Elev
atio
n (
ft.)
Year
Dep
th t
o W
ater
(ft
.)
OPTI Well 455 HydrographWSE & Depth-to-Water GSE
WSE Min = 2148 ft. WSE Max = 2156 ft. Well Depth = Unknown ft.

020406080100120140160180200220240260280300320340360380400420440460480500520540560580600620640660680700720740
19
59
19
60
19
63
19
64
19
67
19
68
19
71
19
72
19
75
19
76
19
79
19
80
19
83
19
84
19
87
19
88
19
91
19
92
19
95
19
96
19
99
20
00
20
03
20
04
20
07
20
08
20
11
20
12
20
15
20
16
20
19
155715771597161716371657167716971717173717571777179718171837185718771897191719371957197719972017203720572077209721172137215721772197221722372257227722972317
Elev
atio
n (
ft.)
Year
Dep
th t
o W
ater
(ft
.)
OPTI Well 461 HydrographWSE & Depth-to-Water GSE
WSE Min = 2154 ft. WSE Max = 2154 ft. Well Depth = 342 ft.

020406080100120140160180200220240260280300320340360380400420440460480500520540560580600620640660680700720740
19
59
19
60
19
63
19
64
19
67
19
68
19
71
19
72
19
75
19
76
19
79
19
80
19
83
19
84
19
87
19
88
19
91
19
92
19
95
19
96
19
99
20
00
20
03
20
04
20
07
20
08
20
11
20
12
20
15
20
16
20
19
148115011521154115611581160116211641166116811701172117411761178118011821184118611881190119211941196119812001202120412061208121012121214121612181220122212241
Elev
atio
n (
ft.)
Year
Dep
th t
o W
ater
(ft
.)
OPTI Well 462 HydrographWSE & Depth-to-Water GSE
WSE Min = 2148 ft. WSE Max = 2158 ft. Well Depth = 775 ft.

020406080100120140160180200220240260280300320340360380400420440460480500520540560580600620640660680700720740
19
59
19
60
19
63
19
64
19
67
19
68
19
71
19
72
19
75
19
76
19
79
19
80
19
83
19
84
19
87
19
88
19
91
19
92
19
95
19
96
19
99
20
00
20
03
20
04
20
07
20
08
20
11
20
12
20
15
20
16
20
19
161316331653167316931713173317531773179318131833185318731893191319331953197319932013203320532073209321132133215321732193221322332253227322932313233323532373
Elev
atio
n (
ft.)
Year
Dep
th t
o W
ater
(ft
.)
OPTI Well 463 HydrographWSE & Depth-to-Water GSE
WSE Min = 2178 ft. WSE Max = 2178 ft. Well Depth = 500 ft.

020406080100120140160180200220240260280300320340360380400420440460480500520540560580600620640660680700720740
19
59
19
60
19
63
19
64
19
67
19
68
19
71
19
72
19
75
19
76
19
79
19
80
19
83
19
84
19
87
19
88
19
91
19
92
19
95
19
96
19
99
20
00
20
03
20
04
20
07
20
08
20
11
20
12
20
15
20
16
20
19
147614961516153615561576159616161636165616761696171617361756177617961816183618561876189619161936195619761996201620362056207620962116213621562176219622162236
Elev
atio
n (
ft.)
Year
Dep
th t
o W
ater
(ft
.)
OPTI Well 464 HydrographWSE & Depth-to-Water GSE
WSE Min = 2169 ft. WSE Max = 2216 ft. Well Depth = 399 ft.

020406080100120140160180200220240260280300320340360380400420440460480500520540560580600620640660680700720740
19
59
19
60
19
63
19
64
19
67
19
68
19
71
19
72
19
75
19
76
19
79
19
80
19
83
19
84
19
87
19
88
19
91
19
92
19
95
19
96
19
99
20
00
20
03
20
04
20
07
20
08
20
11
20
12
20
15
20
16
20
19
147914991519153915591579159916191639165916791699171917391759177917991819183918591879189919191939195919791999201920392059207920992119213921592179219922192239
Elev
atio
n (
ft.)
Year
Dep
th t
o W
ater
(ft
.)
OPTI Well 465 HydrographWSE & Depth-to-Water GSE
WSE Min = 2143 ft. WSE Max = 2150 ft. Well Depth = 372 ft.
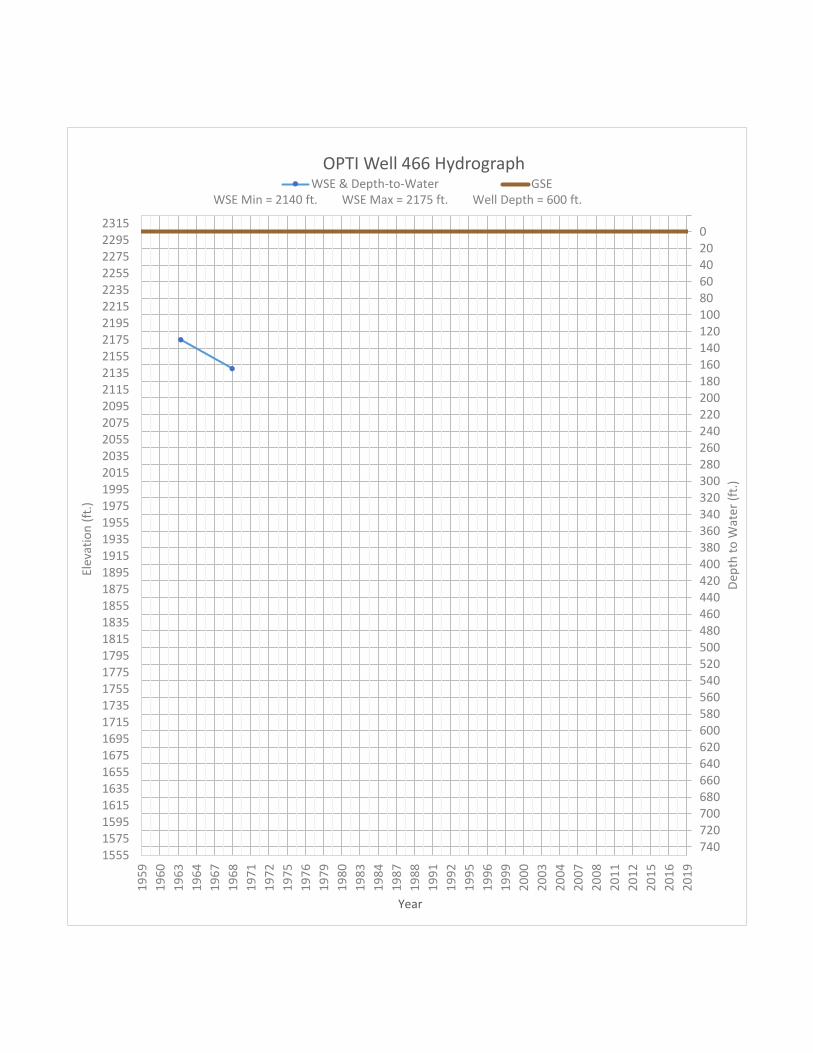
020406080100120140160180200220240260280300320340360380400420440460480500520540560580600620640660680700720740
19
59
19
60
19
63
19
64
19
67
19
68
19
71
19
72
19
75
19
76
19
79
19
80
19
83
19
84
19
87
19
88
19
91
19
92
19
95
19
96
19
99
20
00
20
03
20
04
20
07
20
08
20
11
20
12
20
15
20
16
20
19
155515751595161516351655167516951715173517551775179518151835185518751895191519351955197519952015203520552075209521152135215521752195221522352255227522952315
Elev
atio
n (
ft.)
Year
Dep
th t
o W
ater
(ft
.)
OPTI Well 466 HydrographWSE & Depth-to-Water GSE
WSE Min = 2140 ft. WSE Max = 2175 ft. Well Depth = 600 ft.

020406080100120140160180200220240260280300320340360380400420440460480500520540560580600620640660680700720740
19
59
19
60
19
63
19
64
19
67
19
68
19
71
19
72
19
75
19
76
19
79
19
80
19
83
19
84
19
87
19
88
19
91
19
92
19
95
19
96
19
99
20
00
20
03
20
04
20
07
20
08
20
11
20
12
20
15
20
16
20
19
147114911511153115511571159116111631165116711691171117311751177117911811183118511871189119111931195119711991201120312051207120912111213121512171219122112231
Elev
atio
n (
ft.)
Year
Dep
th t
o W
ater
(ft
.)
OPTI Well 469 HydrographWSE & Depth-to-Water GSE
WSE Min = 2026 ft. WSE Max = 2088 ft. Well Depth = 910 ft.

020406080100120140160180200220240260280300320340360380400420440460480500520540560580600620640660680700720740
19
59
19
60
19
63
19
64
19
67
19
68
19
71
19
72
19
75
19
76
19
79
19
80
19
83
19
84
19
87
19
88
19
91
19
92
19
95
19
96
19
99
20
00
20
03
20
04
20
07
20
08
20
11
20
12
20
15
20
16
20
19
194019601980200020202040206020802100212021402160218022002220224022602280230023202340236023802400242024402460248025002520254025602580260026202640266026802700
Elev
atio
n (
ft.)
Year
Dep
th t
o W
ater
(ft
.)
OPTI Well 470 HydrographWSE & Depth-to-Water GSE
WSE Min = 2564 ft. WSE Max = 2564 ft. Well Depth = 274 ft.
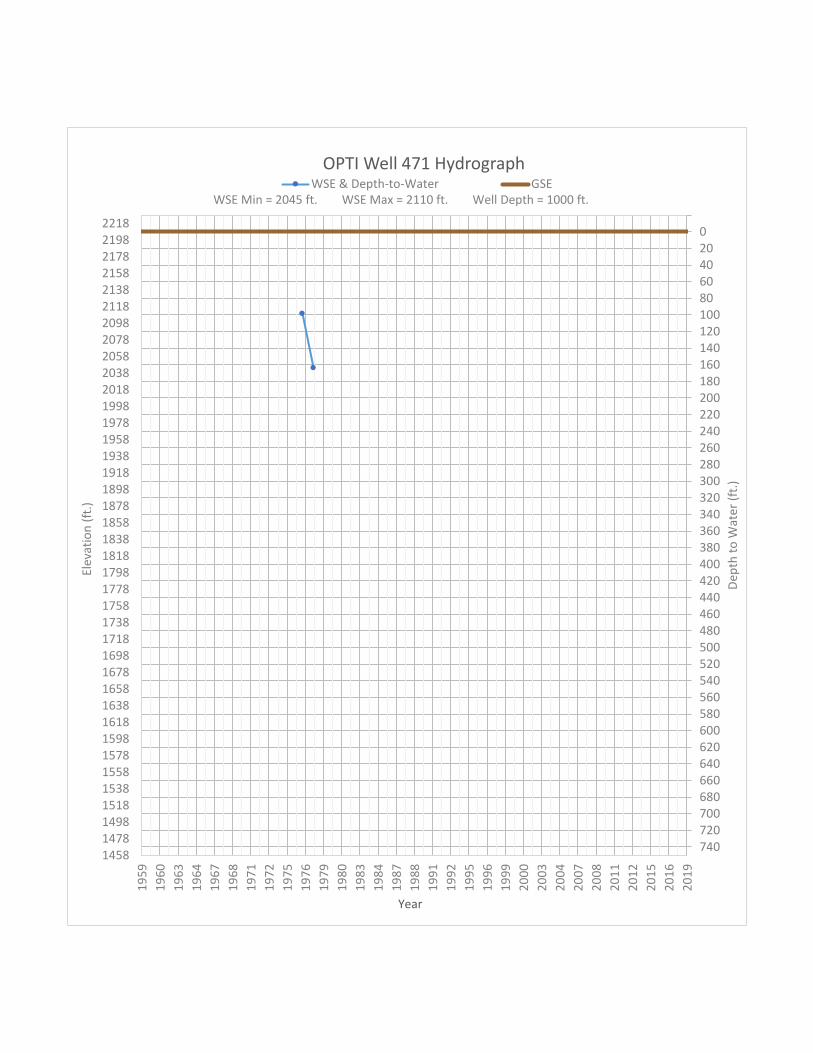
020406080100120140160180200220240260280300320340360380400420440460480500520540560580600620640660680700720740
19
59
19
60
19
63
19
64
19
67
19
68
19
71
19
72
19
75
19
76
19
79
19
80
19
83
19
84
19
87
19
88
19
91
19
92
19
95
19
96
19
99
20
00
20
03
20
04
20
07
20
08
20
11
20
12
20
15
20
16
20
19
145814781498151815381558157815981618163816581678169817181738175817781798181818381858187818981918193819581978199820182038205820782098211821382158217821982218
Elev
atio
n (
ft.)
Year
Dep
th t
o W
ater
(ft
.)
OPTI Well 471 HydrographWSE & Depth-to-Water GSE
WSE Min = 2045 ft. WSE Max = 2110 ft. Well Depth = 1000 ft.

020406080100120140160180200220240260280300320340360380400420440460480500520540560580600620640660680700720740
19
59
19
60
19
63
19
64
19
67
19
68
19
71
19
72
19
75
19
76
19
79
19
80
19
83
19
84
19
87
19
88
19
91
19
92
19
95
19
96
19
99
20
00
20
03
20
04
20
07
20
08
20
11
20
12
20
15
20
16
20
19
147214921512153215521572159216121632165216721692171217321752177217921812183218521872189219121932195219721992201220322052207220922112213221522172219222122232
Elev
atio
n (
ft.)
Year
Dep
th t
o W
ater
(ft
.)
OPTI Well 472 HydrographWSE & Depth-to-Water GSE
WSE Min = 2137 ft. WSE Max = 2217 ft. Well Depth = 240 ft.

020406080100120140160180200220240260280300320340360380400420440460480500520540560580600620640660680700720740
19
59
19
60
19
63
19
64
19
67
19
68
19
71
19
72
19
75
19
76
19
79
19
80
19
83
19
84
19
87
19
88
19
91
19
92
19
95
19
96
19
99
20
00
20
03
20
04
20
07
20
08
20
11
20
12
20
15
20
16
20
19
161916391659167916991719173917591779179918191839185918791899191919391959197919992019203920592079209921192139215921792199221922392259227922992319233923592379
Elev
atio
n (
ft.)
Year
Dep
th t
o W
ater
(ft
.)
OPTI Well 474 HydrographWSE & Depth-to-Water GSE
WSE Min = 2179 ft. WSE Max = 2200 ft. Well Depth = 213 ft.

020406080100120140160180200220240260280300320340360380400420440460480500520540560580600620640660680700720740
19
59
19
60
19
63
19
64
19
67
19
68
19
71
19
72
19
75
19
76
19
79
19
80
19
83
19
84
19
87
19
88
19
91
19
92
19
95
19
96
19
99
20
00
20
03
20
04
20
07
20
08
20
11
20
12
20
15
20
16
20
19
146614861506152615461566158616061626164616661686170617261746176617861806182618461866188619061926194619661986200620262046206620862106212621462166218622062226
Elev
atio
n (
ft.)
Year
Dep
th t
o W
ater
(ft
.)
OPTI Well 476 HydrographWSE & Depth-to-Water GSE
WSE Min = 2182 ft. WSE Max = 2182 ft. Well Depth = 407 ft.
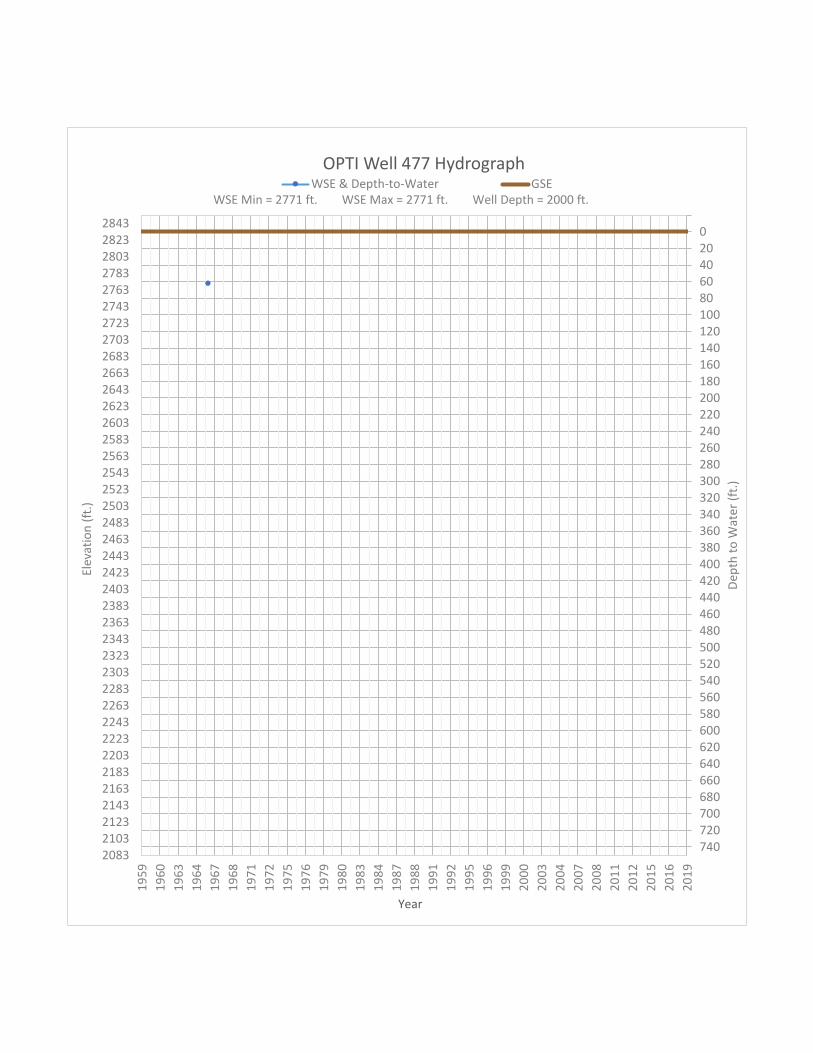
020406080100120140160180200220240260280300320340360380400420440460480500520540560580600620640660680700720740
19
59
19
60
19
63
19
64
19
67
19
68
19
71
19
72
19
75
19
76
19
79
19
80
19
83
19
84
19
87
19
88
19
91
19
92
19
95
19
96
19
99
20
00
20
03
20
04
20
07
20
08
20
11
20
12
20
15
20
16
20
19
208321032123214321632183220322232243226322832303232323432363238324032423244324632483250325232543256325832603262326432663268327032723274327632783280328232843
Elev
atio
n (
ft.)
Year
Dep
th t
o W
ater
(ft
.)
OPTI Well 477 HydrographWSE & Depth-to-Water GSE
WSE Min = 2771 ft. WSE Max = 2771 ft. Well Depth = 2000 ft.

020406080100120140160180200220240260280300320340360380400420440460480500520540560580600620640660680700720740
19
59
19
60
19
63
19
64
19
67
19
68
19
71
19
72
19
75
19
76
19
79
19
80
19
83
19
84
19
87
19
88
19
91
19
92
19
95
19
96
19
99
20
00
20
03
20
04
20
07
20
08
20
11
20
12
20
15
20
16
20
19
141814381458147814981518153815581578159816181638165816781698171817381758177817981818183818581878189819181938195819781998201820382058207820982118213821582178
Elev
atio
n (
ft.)
Year
Dep
th t
o W
ater
(ft
.)
OPTI Well 478 HydrographWSE & Depth-to-Water GSE
WSE Min = 2046 ft. WSE Max = 2100 ft. Well Depth = 350 ft.

020406080100120140160180200220240260280300320340360380400420440460480500520540560580600620640660680700720740
19
59
19
60
19
63
19
64
19
67
19
68
19
71
19
72
19
75
19
76
19
79
19
80
19
83
19
84
19
87
19
88
19
91
19
92
19
95
19
96
19
99
20
00
20
03
20
04
20
07
20
08
20
11
20
12
20
15
20
16
20
19
160216221642166216821702172217421762178218021822184218621882190219221942196219822002202220422062208221022122214221622182220222222242226222822302232223422362
Elev
atio
n (
ft.)
Year
Dep
th t
o W
ater
(ft
.)
OPTI Well 480 HydrographWSE & Depth-to-Water GSE
WSE Min = 2177 ft. WSE Max = 2240 ft. Well Depth = 392 ft.

020406080100120140160180200220240260280300320340360380400420440460480500520540560580600620640660680700720740
19
59
19
60
19
63
19
64
19
67
19
68
19
71
19
72
19
75
19
76
19
79
19
80
19
83
19
84
19
87
19
88
19
91
19
92
19
95
19
96
19
99
20
00
20
03
20
04
20
07
20
08
20
11
20
12
20
15
20
16
20
19
144914691489150915291549156915891609162916491669168917091729174917691789180918291849186918891909192919491969198920092029204920692089210921292149216921892209
Elev
atio
n (
ft.)
Year
Dep
th t
o W
ater
(ft
.)
OPTI Well 482 HydrographWSE & Depth-to-Water GSE
WSE Min = 2037 ft. WSE Max = 2123 ft. Well Depth = 508 ft.

020406080100120140160180200220240260280300320340360380400420440460480500520540560580600620640660680700720740
19
59
19
60
19
63
19
64
19
67
19
68
19
71
19
72
19
75
19
76
19
79
19
80
19
83
19
84
19
87
19
88
19
91
19
92
19
95
19
96
19
99
20
00
20
03
20
04
20
07
20
08
20
11
20
12
20
15
20
16
20
19
144214621482150215221542156215821602162216421662168217021722174217621782180218221842186218821902192219421962198220022022204220622082210221222142216221822202
Elev
atio
n (
ft.)
Year
Dep
th t
o W
ater
(ft
.)
OPTI Well 483 HydrographWSE & Depth-to-Water GSE
WSE Min = 1993 ft. WSE Max = 2107 ft. Well Depth = 425 ft.

020406080100120140160180200220240260280300320340360380400420440460480500520540560580600620640660680700720740
19
59
19
60
19
63
19
64
19
67
19
68
19
71
19
72
19
75
19
76
19
79
19
80
19
83
19
84
19
87
19
88
19
91
19
92
19
95
19
96
19
99
20
00
20
03
20
04
20
07
20
08
20
11
20
12
20
15
20
16
20
19
143514551475149515151535155515751595161516351655167516951715173517551775179518151835185518751895191519351955197519952015203520552075209521152135215521752195
Elev
atio
n (
ft.)
Year
Dep
th t
o W
ater
(ft
.)
OPTI Well 484 HydrographWSE & Depth-to-Water GSE
WSE Min = 2027 ft. WSE Max = 2122 ft. Well Depth = 465 ft.
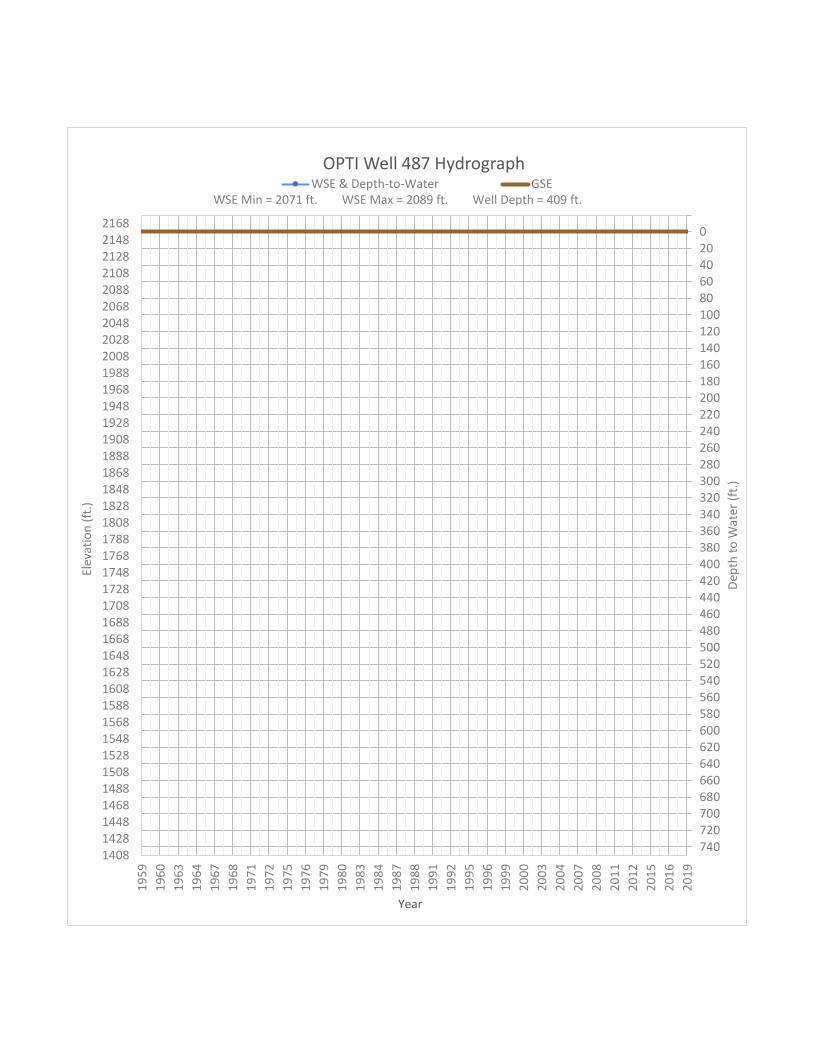
020406080100120140160180200220240260280300320340360380400420440460480500520540560580600620640660680700720740
19
59
19
60
19
63
19
64
19
67
19
68
19
71
19
72
19
75
19
76
19
79
19
80
19
83
19
84
19
87
19
88
19
91
19
92
19
95
19
96
19
99
20
00
20
03
20
04
20
07
20
08
20
11
20
12
20
15
20
16
20
19
140814281448146814881508152815481568158816081628164816681688170817281748176817881808182818481868188819081928194819681988200820282048206820882108212821482168
Elev
atio
n (
ft.)
Year
Dep
th t
o W
ater
(ft
.)
OPTI Well 487 HydrographWSE & Depth-to-Water GSE
WSE Min = 2071 ft. WSE Max = 2089 ft. Well Depth = 409 ft.

020406080100120140160180200220240260280300320340360380400420440460480500520540560580600620640660680700720740
19
59
19
60
19
63
19
64
19
67
19
68
19
71
19
72
19
75
19
76
19
79
19
80
19
83
19
84
19
87
19
88
19
91
19
92
19
95
19
96
19
99
20
00
20
03
20
04
20
07
20
08
20
11
20
12
20
15
20
16
20
19
186118811901192119411961198120012021204120612081210121212141216121812201222122412261228123012321234123612381240124212441246124812501252125412561258126012621
Elev
atio
n (
ft.)
Year
Dep
th t
o W
ater
(ft
.)
OPTI Well 488 HydrographWSE & Depth-to-Water GSE
WSE Min = 2448 ft. WSE Max = 2448 ft. Well Depth = Unknown ft.

020406080100120140160180200220240260280300320340360380400420440460480500520540560580600620640660680700720740
19
59
19
60
19
63
19
64
19
67
19
68
19
71
19
72
19
75
19
76
19
79
19
80
19
83
19
84
19
87
19
88
19
91
19
92
19
95
19
96
19
99
20
00
20
03
20
04
20
07
20
08
20
11
20
12
20
15
20
16
20
19
184918691889190919291949196919892009202920492069208921092129214921692189220922292249226922892309232923492369238924092429244924692489250925292549256925892609
Elev
atio
n (
ft.)
Year
Dep
th t
o W
ater
(ft
.)
OPTI Well 490 HydrographWSE & Depth-to-Water GSE
WSE Min = 2515 ft. WSE Max = 2515 ft. Well Depth = 173 ft.

020406080100120140160180200220240260280300320340360380400420440460480500520540560580600620640660680700720740
19
59
19
60
19
63
19
64
19
67
19
68
19
71
19
72
19
75
19
76
19
79
19
80
19
83
19
84
19
87
19
88
19
91
19
92
19
95
19
96
19
99
20
00
20
03
20
04
20
07
20
08
20
11
20
12
20
15
20
16
20
19
150415241544156415841604162416441664168417041724174417641784180418241844186418841904192419441964198420042024204420642084210421242144216421842204222422442264
Elev
atio
n (
ft.)
Year
Dep
th t
o W
ater
(ft
.)
OPTI Well 491 HydrographWSE & Depth-to-Water GSE
WSE Min = 2083 ft. WSE Max = 2083 ft. Well Depth = 219 ft.

020406080100120140160180200220240260280300320340360380400420440460480500520540560580600620640660680700720740
19
59
19
60
19
63
19
64
19
67
19
68
19
71
19
72
19
75
19
76
19
79
19
80
19
83
19
84
19
87
19
88
19
91
19
92
19
95
19
96
19
99
20
00
20
03
20
04
20
07
20
08
20
11
20
12
20
15
20
16
20
19
158716071627164716671687170717271747176717871807182718471867188719071927194719671987200720272047206720872107212721472167218722072227224722672287230723272347
Elev
atio
n (
ft.)
Year
Dep
th t
o W
ater
(ft
.)
OPTI Well 495 HydrographWSE & Depth-to-Water GSE
WSE Min = 2225 ft. WSE Max = 2238 ft. Well Depth = 346 ft.

020406080100120140160180200220240260280300320340360380400420440460480500520540560580600620640660680700720740
19
59
19
60
19
63
19
64
19
67
19
68
19
71
19
72
19
75
19
76
19
79
19
80
19
83
19
84
19
87
19
88
19
91
19
92
19
95
19
96
19
99
20
00
20
03
20
04
20
07
20
08
20
11
20
12
20
15
20
16
20
19
156115811601162116411661168117011721174117611781180118211841186118811901192119411961198120012021204120612081210121212141216121812201222122412261228123012321
Elev
atio
n (
ft.)
Year
Dep
th t
o W
ater
(ft
.)
OPTI Well 500 HydrographWSE & Depth-to-Water GSE
WSE Min = 1973 ft. WSE Max = 2137 ft. Well Depth = 550 ft.

020406080100120140160180200220240260280300320340360380400420440460480500520540560580600620640660680700720740
19
59
19
60
19
63
19
64
19
67
19
68
19
71
19
72
19
75
19
76
19
79
19
80
19
83
19
84
19
87
19
88
19
91
19
92
19
95
19
96
19
99
20
00
20
03
20
04
20
07
20
08
20
11
20
12
20
15
20
16
20
19
178518051825184518651885190519251945196519852005202520452065208521052125214521652185220522252245226522852305232523452365238524052425244524652485250525252545
Elev
atio
n (
ft.)
Year
Dep
th t
o W
ater
(ft
.)
OPTI Well 502 HydrographWSE & Depth-to-Water GSE
WSE Min = 2415 ft. WSE Max = 2415 ft. Well Depth = 160 ft.

020406080100120140160180200220240260280300320340360380400420440460480500520540560580600620640660680700720740
19
59
19
60
19
63
19
64
19
67
19
68
19
71
19
72
19
75
19
76
19
79
19
80
19
83
19
84
19
87
19
88
19
91
19
92
19
95
19
96
19
99
20
00
20
03
20
04
20
07
20
08
20
11
20
12
20
15
20
16
20
19
153615561576159616161636165616761696171617361756177617961816183618561876189619161936195619761996201620362056207620962116213621562176219622162236225622762296
Elev
atio
n (
ft.)
Year
Dep
th t
o W
ater
(ft
.)
OPTI Well 504 HydrographWSE & Depth-to-Water GSE
WSE Min = 2146 ft. WSE Max = 2146 ft. Well Depth = 302 ft.

020406080100120140160180200220240260280300320340360380400420440460480500520540560580600620640660680700720740
19
59
19
60
19
63
19
64
19
67
19
68
19
71
19
72
19
75
19
76
19
79
19
80
19
83
19
84
19
87
19
88
19
91
19
92
19
95
19
96
19
99
20
00
20
03
20
04
20
07
20
08
20
11
20
12
20
15
20
16
20
19
153315531573159316131633165316731693171317331753177317931813183318531873189319131933195319731993201320332053207320932113213321532173219322132233225322732293
Elev
atio
n (
ft.)
Year
Dep
th t
o W
ater
(ft
.)
OPTI Well 505 HydrographWSE & Depth-to-Water GSE
WSE Min = 2206 ft. WSE Max = 2206 ft. Well Depth = 306 ft.

020406080100120140160180200220240260280300320340360380400420440460480500520540560580600620640660680700720740
19
59
19
60
19
63
19
64
19
67
19
68
19
71
19
72
19
75
19
76
19
79
19
80
19
83
19
84
19
87
19
88
19
91
19
92
19
95
19
96
19
99
20
00
20
03
20
04
20
07
20
08
20
11
20
12
20
15
20
16
20
19
149515151535155515751595161516351655167516951715173517551775179518151835185518751895191519351955197519952015203520552075209521152135215521752195221522352255
Elev
atio
n (
ft.)
Year
Dep
th t
o W
ater
(ft
.)
OPTI Well 506 HydrographWSE & Depth-to-Water GSE
WSE Min = 2155 ft. WSE Max = 2185 ft. Well Depth = 678 ft.

020406080100120140160180200220240260280300320340360380400420440460480500520540560580600620640660680700720740
19
59
19
60
19
63
19
64
19
67
19
68
19
71
19
72
19
75
19
76
19
79
19
80
19
83
19
84
19
87
19
88
19
91
19
92
19
95
19
96
19
99
20
00
20
03
20
04
20
07
20
08
20
11
20
12
20
15
20
16
20
19
135713771397141714371457147714971517153715571577159716171637165716771697171717371757177717971817183718571877189719171937195719771997201720372057207720972117
Elev
atio
n (
ft.)
Year
Dep
th t
o W
ater
(ft
.)
OPTI Well 508 HydrographWSE & Depth-to-Water GSE
WSE Min = 2036 ft. WSE Max = 2040 ft. Well Depth = Unknown ft.

020406080100120140160180200220240260280300320340360380400420440460480500520540560580600620640660680700720740
19
59
19
60
19
63
19
64
19
67
19
68
19
71
19
72
19
75
19
76
19
79
19
80
19
83
19
84
19
87
19
88
19
91
19
92
19
95
19
96
19
99
20
00
20
03
20
04
20
07
20
08
20
11
20
12
20
15
20
16
20
19
169017101730175017701790181018301850187018901910193019501970199020102030205020702090211021302150217021902210223022502270229023102330235023702390241024302450
Elev
atio
n (
ft.)
Year
Dep
th t
o W
ater
(ft
.)
OPTI Well 509 HydrographWSE & Depth-to-Water GSE
WSE Min = 2245 ft. WSE Max = 2245 ft. Well Depth = 322 ft.

020406080100120140160180200220240260280300320340360380400420440460480500520540560580600620640660680700720740
19
59
19
60
19
63
19
64
19
67
19
68
19
71
19
72
19
75
19
76
19
79
19
80
19
83
19
84
19
87
19
88
19
91
19
92
19
95
19
96
19
99
20
00
20
03
20
04
20
07
20
08
20
11
20
12
20
15
20
16
20
19
135113711391141114311451147114911511153115511571159116111631165116711691171117311751177117911811183118511871189119111931195119711991201120312051207120912111
Elev
atio
n (
ft.)
Year
Dep
th t
o W
ater
(ft
.)
OPTI Well 511 HydrographWSE & Depth-to-Water GSE
WSE Min = 2021 ft. WSE Max = 2038 ft. Well Depth = 315 ft.

020406080100120140160180200220240260280300320340360380400420440460480500520540560580600620640660680700720740
19
59
19
60
19
63
19
64
19
67
19
68
19
71
19
72
19
75
19
76
19
79
19
80
19
83
19
84
19
87
19
88
19
91
19
92
19
95
19
96
19
99
20
00
20
03
20
04
20
07
20
08
20
11
20
12
20
15
20
16
20
19
174317631783180318231843186318831903192319431963198320032023204320632083210321232143216321832203222322432263228323032323234323632383240324232443246324832503
Elev
atio
n (
ft.)
Year
Dep
th t
o W
ater
(ft
.)
OPTI Well 512 HydrographWSE & Depth-to-Water GSE
WSE Min = 2470 ft. WSE Max = 2470 ft. Well Depth = 25 ft.

020406080100120140160180200220240260280300320340360380400420440460480500520540560580600620640660680700720740
19
59
19
60
19
63
19
64
19
67
19
68
19
71
19
72
19
75
19
76
19
79
19
80
19
83
19
84
19
87
19
88
19
91
19
92
19
95
19
96
19
99
20
00
20
03
20
04
20
07
20
08
20
11
20
12
20
15
20
16
20
19
141914391459147914991519153915591579159916191639165916791699171917391759177917991819183918591879189919191939195919791999201920392059207920992119213921592179
Elev
atio
n (
ft.)
Year
Dep
th t
o W
ater
(ft
.)
OPTI Well 514 HydrographWSE & Depth-to-Water GSE
WSE Min = 2146 ft. WSE Max = 2151 ft. Well Depth = 82 ft.

020406080100120140160180200220240260280300320340360380400420440460480500520540560580600620640660680700720740
19
59
19
60
19
63
19
64
19
67
19
68
19
71
19
72
19
75
19
76
19
79
19
80
19
83
19
84
19
87
19
88
19
91
19
92
19
95
19
96
19
99
20
00
20
03
20
04
20
07
20
08
20
11
20
12
20
15
20
16
20
19
141014301450147014901510153015501570159016101630165016701690171017301750177017901810183018501870189019101930195019701990201020302050207020902110213021502170
Elev
atio
n (
ft.)
Year
Dep
th t
o W
ater
(ft
.)
OPTI Well 520 HydrographWSE & Depth-to-Water GSE
WSE Min = 1986 ft. WSE Max = 2047 ft. Well Depth = 634 ft.

020406080100120140160180200220240260280300320340360380400420440460480500520540560580600620640660680700720740
19
59
19
60
19
63
19
64
19
67
19
68
19
71
19
72
19
75
19
76
19
79
19
80
19
83
19
84
19
87
19
88
19
91
19
92
19
95
19
96
19
99
20
00
20
03
20
04
20
07
20
08
20
11
20
12
20
15
20
16
20
19
139414141434145414741494151415341554157415941614163416541674169417141734175417741794181418341854187418941914193419541974199420142034205420742094211421342154
Elev
atio
n (
ft.)
Year
Dep
th t
o W
ater
(ft
.)
OPTI Well 521 HydrographWSE & Depth-to-Water GSE
WSE Min = 1967 ft. WSE Max = 1987 ft. Well Depth = 300 ft.

020406080100120140160180200220240260280300320340360380400420440460480500520540560580600620640660680700720740
19
59
19
60
19
63
19
64
19
67
19
68
19
71
19
72
19
75
19
76
19
79
19
80
19
83
19
84
19
87
19
88
19
91
19
92
19
95
19
96
19
99
20
00
20
03
20
04
20
07
20
08
20
11
20
12
20
15
20
16
20
19
138914091429144914691489150915291549156915891609162916491669168917091729174917691789180918291849186918891909192919491969198920092029204920692089210921292149
Elev
atio
n (
ft.)
Year
Dep
th t
o W
ater
(ft
.)
OPTI Well 522 HydrographWSE & Depth-to-Water GSE
WSE Min = 2001 ft. WSE Max = 2001 ft. Well Depth = 648 ft.
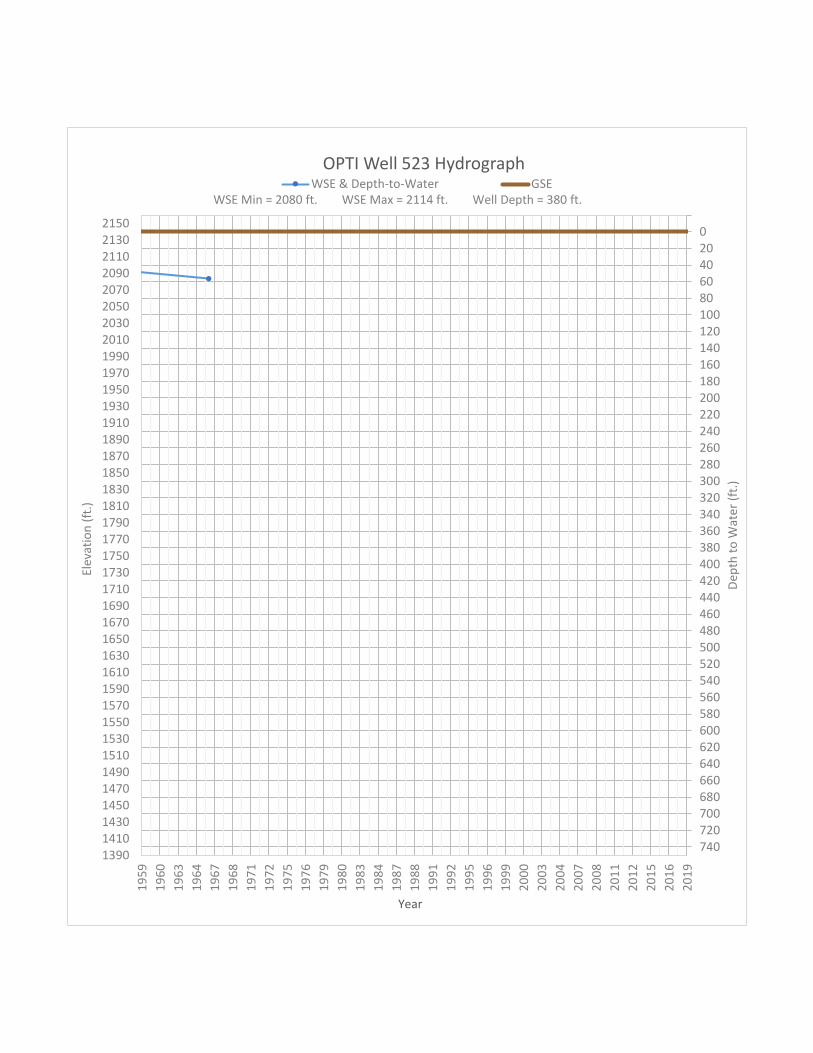
020406080100120140160180200220240260280300320340360380400420440460480500520540560580600620640660680700720740
19
59
19
60
19
63
19
64
19
67
19
68
19
71
19
72
19
75
19
76
19
79
19
80
19
83
19
84
19
87
19
88
19
91
19
92
19
95
19
96
19
99
20
00
20
03
20
04
20
07
20
08
20
11
20
12
20
15
20
16
20
19
139014101430145014701490151015301550157015901610163016501670169017101730175017701790181018301850187018901910193019501970199020102030205020702090211021302150
Elev
atio
n (
ft.)
Year
Dep
th t
o W
ater
(ft
.)
OPTI Well 523 HydrographWSE & Depth-to-Water GSE
WSE Min = 2080 ft. WSE Max = 2114 ft. Well Depth = 380 ft.

020406080100120140160180200220240260280300320340360380400420440460480500520540560580600620640660680700720740
19
59
19
60
19
63
19
64
19
67
19
68
19
71
19
72
19
75
19
76
19
79
19
80
19
83
19
84
19
87
19
88
19
91
19
92
19
95
19
96
19
99
20
00
20
03
20
04
20
07
20
08
20
11
20
12
20
15
20
16
20
19
138814081428144814681488150815281548156815881608162816481668168817081728174817681788180818281848186818881908192819481968198820082028204820682088210821282148
Elev
atio
n (
ft.)
Year
Dep
th t
o W
ater
(ft
.)
OPTI Well 524 HydrographWSE & Depth-to-Water GSE
WSE Min = 2071 ft. WSE Max = 2095 ft. Well Depth = 222 ft.

020406080100120140160180200220240260280300320340360380400420440460480500520540560580600620640660680700720740
19
59
19
60
19
63
19
64
19
67
19
68
19
71
19
72
19
75
19
76
19
79
19
80
19
83
19
84
19
87
19
88
19
91
19
92
19
95
19
96
19
99
20
00
20
03
20
04
20
07
20
08
20
11
20
12
20
15
20
16
20
19
130113211341136113811401142114411461148115011521154115611581160116211641166116811701172117411761178118011821184118611881190119211941196119812001202120412061
Elev
atio
n (
ft.)
Year
Dep
th t
o W
ater
(ft
.)
OPTI Well 525 HydrographWSE & Depth-to-Water GSE
WSE Min = 1957 ft. WSE Max = 1961 ft. Well Depth = 155 ft.

020406080100120140160180200220240260280300320340360380400420440460480500520540560580600620640660680700720740
19
59
19
60
19
63
19
64
19
67
19
68
19
71
19
72
19
75
19
76
19
79
19
80
19
83
19
84
19
87
19
88
19
91
19
92
19
95
19
96
19
99
20
00
20
03
20
04
20
07
20
08
20
11
20
12
20
15
20
16
20
19
130013201340136013801400142014401460148015001520154015601580160016201640166016801700172017401760178018001820184018601880190019201940196019802000202020402060
Elev
atio
n (
ft.)
Year
Dep
th t
o W
ater
(ft
.)
OPTI Well 527 HydrographWSE & Depth-to-Water GSE
WSE Min = 1971 ft. WSE Max = 1978 ft. Well Depth = 150 ft.
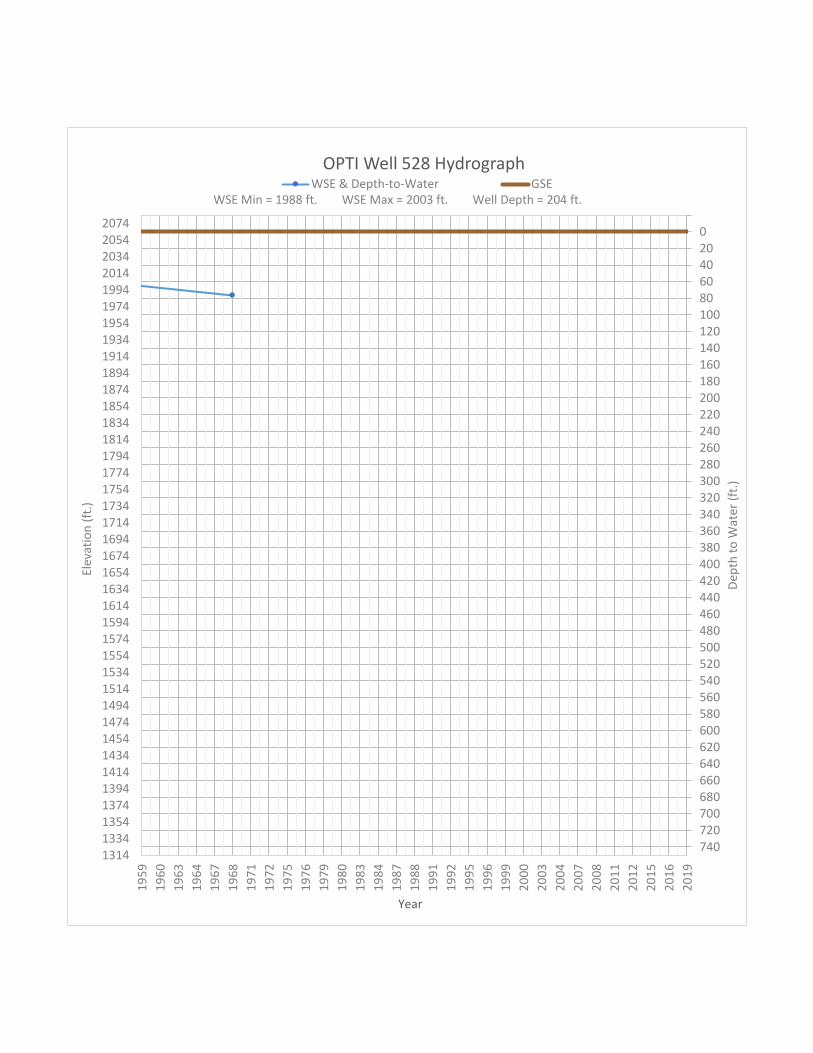
020406080100120140160180200220240260280300320340360380400420440460480500520540560580600620640660680700720740
19
59
19
60
19
63
19
64
19
67
19
68
19
71
19
72
19
75
19
76
19
79
19
80
19
83
19
84
19
87
19
88
19
91
19
92
19
95
19
96
19
99
20
00
20
03
20
04
20
07
20
08
20
11
20
12
20
15
20
16
20
19
131413341354137413941414143414541474149415141534155415741594161416341654167416941714173417541774179418141834185418741894191419341954197419942014203420542074
Elev
atio
n (
ft.)
Year
Dep
th t
o W
ater
(ft
.)
OPTI Well 528 HydrographWSE & Depth-to-Water GSE
WSE Min = 1988 ft. WSE Max = 2003 ft. Well Depth = 204 ft.
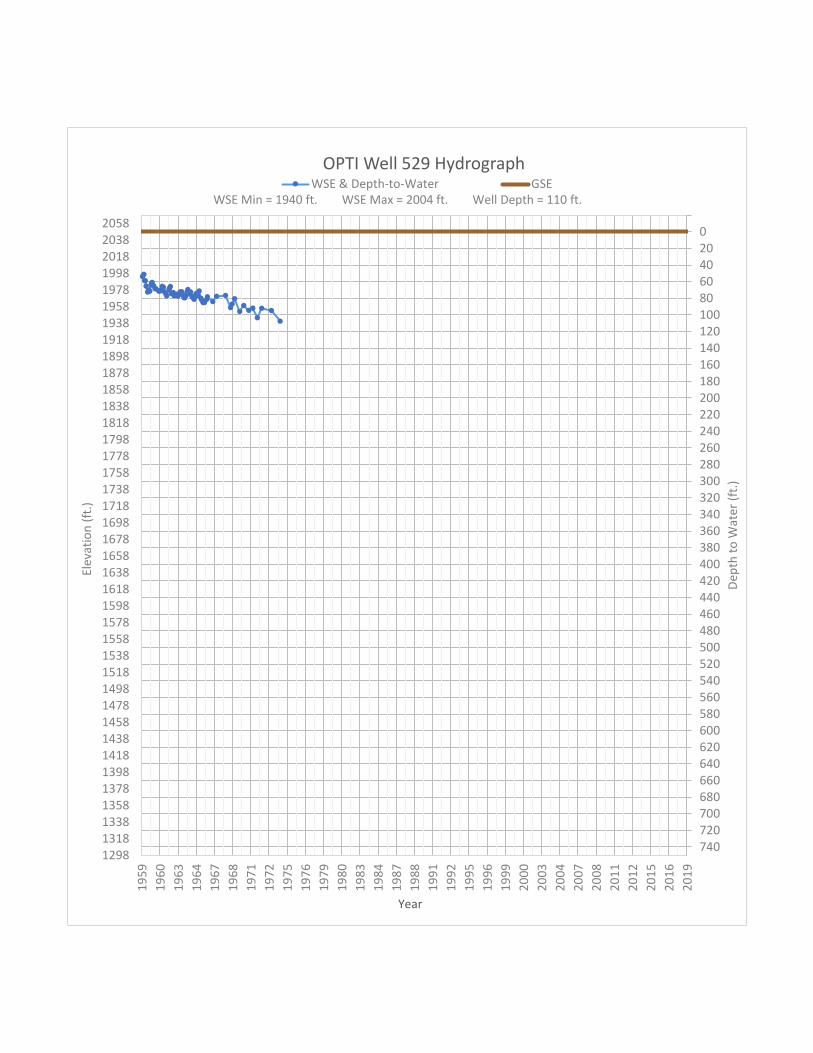
020406080100120140160180200220240260280300320340360380400420440460480500520540560580600620640660680700720740
19
59
19
60
19
63
19
64
19
67
19
68
19
71
19
72
19
75
19
76
19
79
19
80
19
83
19
84
19
87
19
88
19
91
19
92
19
95
19
96
19
99
20
00
20
03
20
04
20
07
20
08
20
11
20
12
20
15
20
16
20
19
129813181338135813781398141814381458147814981518153815581578159816181638165816781698171817381758177817981818183818581878189819181938195819781998201820382058
Elev
atio
n (
ft.)
Year
Dep
th t
o W
ater
(ft
.)
OPTI Well 529 HydrographWSE & Depth-to-Water GSE
WSE Min = 1940 ft. WSE Max = 2004 ft. Well Depth = 110 ft.

020406080100120140160180200220240260280300320340360380400420440460480500520540560580600620640660680700720740
19
59
19
60
19
63
19
64
19
67
19
68
19
71
19
72
19
75
19
76
19
79
19
80
19
83
19
84
19
87
19
88
19
91
19
92
19
95
19
96
19
99
20
00
20
03
20
04
20
07
20
08
20
11
20
12
20
15
20
16
20
19
137813981418143814581478149815181538155815781598161816381658167816981718173817581778179818181838185818781898191819381958197819982018203820582078209821182138
Elev
atio
n (
ft.)
Year
Dep
th t
o W
ater
(ft
.)
OPTI Well 530 HydrographWSE & Depth-to-Water GSE
WSE Min = 1819 ft. WSE Max = 1819 ft. Well Depth = 974 ft.

020406080100120140160180200220240260280300320340360380400420440460480500520540560580600620640660680700720740
19
59
19
60
19
63
19
64
19
67
19
68
19
71
19
72
19
75
19
76
19
79
19
80
19
83
19
84
19
87
19
88
19
91
19
92
19
95
19
96
19
99
20
00
20
03
20
04
20
07
20
08
20
11
20
12
20
15
20
16
20
19
130213221342136213821402142214421462148215021522154215621582160216221642166216821702172217421762178218021822184218621882190219221942196219822002202220422062
Elev
atio
n (
ft.)
Year
Dep
th t
o W
ater
(ft
.)
OPTI Well 531 HydrographWSE & Depth-to-Water GSE
WSE Min = 1968 ft. WSE Max = 2050 ft. Well Depth = 365 ft.

020406080100120140160180200220240260280300320340360380400420440460480500520540560580600620640660680700720740
19
59
19
60
19
63
19
64
19
67
19
68
19
71
19
72
19
75
19
76
19
79
19
80
19
83
19
84
19
87
19
88
19
91
19
92
19
95
19
96
19
99
20
00
20
03
20
04
20
07
20
08
20
11
20
12
20
15
20
16
20
19
129313131333135313731393141314331453147314931513153315531573159316131633165316731693171317331753177317931813183318531873189319131933195319731993201320332053
Elev
atio
n (
ft.)
Year
Dep
th t
o W
ater
(ft
.)
OPTI Well 536 HydrographWSE & Depth-to-Water GSE
WSE Min = 1961 ft. WSE Max = 1974 ft. Well Depth = Unknown ft.

020406080100120140160180200220240260280300320340360380400420440460480500520540560580600620640660680700720740
19
59
19
60
19
63
19
64
19
67
19
68
19
71
19
72
19
75
19
76
19
79
19
80
19
83
19
84
19
87
19
88
19
91
19
92
19
95
19
96
19
99
20
00
20
03
20
04
20
07
20
08
20
11
20
12
20
15
20
16
20
19
128513051325134513651385140514251445146514851505152515451565158516051625164516651685170517251745176517851805182518451865188519051925194519651985200520252045
Elev
atio
n (
ft.)
Year
Dep
th t
o W
ater
(ft
.)
OPTI Well 539 HydrographWSE & Depth-to-Water GSE
WSE Min = 1965 ft. WSE Max = 1965 ft. Well Depth = 138 ft.

020406080100120140160180200220240260280300320340360380400420440460480500520540560580600620640660680700720740
19
59
19
60
19
63
19
64
19
67
19
68
19
71
19
72
19
75
19
76
19
79
19
80
19
83
19
84
19
87
19
88
19
91
19
92
19
95
19
96
19
99
20
00
20
03
20
04
20
07
20
08
20
11
20
12
20
15
20
16
20
19
161016301650167016901710173017501770179018101830185018701890191019301950197019902010203020502070209021102130215021702190221022302250227022902310233023502370
Elev
atio
n (
ft.)
Year
Dep
th t
o W
ater
(ft
.)
OPTI Well 540 HydrographWSE & Depth-to-Water GSE
WSE Min = 2286 ft. WSE Max = 2286 ft. Well Depth = 600 ft.

020406080100120140160180200220240260280300320340360380400420440460480500520540560580600620640660680700720740
19
59
19
60
19
63
19
64
19
67
19
68
19
71
19
72
19
75
19
76
19
79
19
80
19
83
19
84
19
87
19
88
19
91
19
92
19
95
19
96
19
99
20
00
20
03
20
04
20
07
20
08
20
11
20
12
20
15
20
16
20
19
127112911311133113511371139114111431145114711491151115311551157115911611163116511671169117111731175117711791181118311851187118911911193119511971199120112031
Elev
atio
n (
ft.)
Year
Dep
th t
o W
ater
(ft
.)
OPTI Well 544 HydrographWSE & Depth-to-Water GSE
WSE Min = 1956 ft. WSE Max = 1956 ft. Well Depth = 300 ft.

020406080100120140160180200220240260280300320340360380400420440460480500520540560580600620640660680700720740
19
59
19
60
19
63
19
64
19
67
19
68
19
71
19
72
19
75
19
76
19
79
19
80
19
83
19
84
19
87
19
88
19
91
19
92
19
95
19
96
19
99
20
00
20
03
20
04
20
07
20
08
20
11
20
12
20
15
20
16
20
19
123212521272129213121332135213721392141214321452147214921512153215521572159216121632165216721692171217321752177217921812183218521872189219121932195219721992
Elev
atio
n (
ft.)
Year
Dep
th t
o W
ater
(ft
.)
OPTI Well 545 HydrographWSE & Depth-to-Water GSE
WSE Min = 1925 ft. WSE Max = 1962 ft. Well Depth = Unknown ft.

020406080100120140160180200220240260280300320340360380400420440460480500520540560580600620640660680700720740
19
59
19
60
19
63
19
64
19
67
19
68
19
71
19
72
19
75
19
76
19
79
19
80
19
83
19
84
19
87
19
88
19
91
19
92
19
95
19
96
19
99
20
00
20
03
20
04
20
07
20
08
20
11
20
12
20
15
20
16
20
19
156715871607162716471667168717071727174717671787180718271847186718871907192719471967198720072027204720672087210721272147216721872207222722472267228723072327
Elev
atio
n (
ft.)
Year
Dep
th t
o W
ater
(ft
.)
OPTI Well 548 HydrographWSE & Depth-to-Water GSE
WSE Min = 2267 ft. WSE Max = 2267 ft. Well Depth = 200 ft.

020406080100120140160180200220240260280300320340360380400420440460480500520540560580600620640660680700720740
19
59
19
60
19
63
19
64
19
67
19
68
19
71
19
72
19
75
19
76
19
79
19
80
19
83
19
84
19
87
19
88
19
91
19
92
19
95
19
96
19
99
20
00
20
03
20
04
20
07
20
08
20
11
20
12
20
15
20
16
20
19
124612661286130613261346136613861406142614461466148615061526154615661586160616261646166616861706172617461766178618061826184618661886190619261946196619862006
Elev
atio
n (
ft.)
Year
Dep
th t
o W
ater
(ft
.)
OPTI Well 550 HydrographWSE & Depth-to-Water GSE
WSE Min = 1943 ft. WSE Max = 1945 ft. Well Depth = 300 ft.

020406080100120140160180200220240260280300320340360380400420440460480500520540560580600620640660680700720740
19
59
19
60
19
63
19
64
19
67
19
68
19
71
19
72
19
75
19
76
19
79
19
80
19
83
19
84
19
87
19
88
19
91
19
92
19
95
19
96
19
99
20
00
20
03
20
04
20
07
20
08
20
11
20
12
20
15
20
16
20
19
123112511271129113111331135113711391141114311451147114911511153115511571159116111631165116711691171117311751177117911811183118511871189119111931195119711991
Elev
atio
n (
ft.)
Year
Dep
th t
o W
ater
(ft
.)
OPTI Well 551 HydrographWSE & Depth-to-Water GSE
WSE Min = 1903 ft. WSE Max = 1959 ft. Well Depth = 70 ft.

020406080100120140160180200220240260280300320340360380400420440460480500520540560580600620640660680700720740
19
59
19
60
19
63
19
64
19
67
19
68
19
71
19
72
19
75
19
76
19
79
19
80
19
83
19
84
19
87
19
88
19
91
19
92
19
95
19
96
19
99
20
00
20
03
20
04
20
07
20
08
20
11
20
12
20
15
20
16
20
19
153515551575159516151635165516751695171517351755177517951815183518551875189519151935195519751995201520352055207520952115213521552175219522152235225522752295
Elev
atio
n (
ft.)
Year
Dep
th t
o W
ater
(ft
.)
OPTI Well 552 HydrographWSE & Depth-to-Water GSE
WSE Min = 2260 ft. WSE Max = 2260 ft. Well Depth = 105 ft.
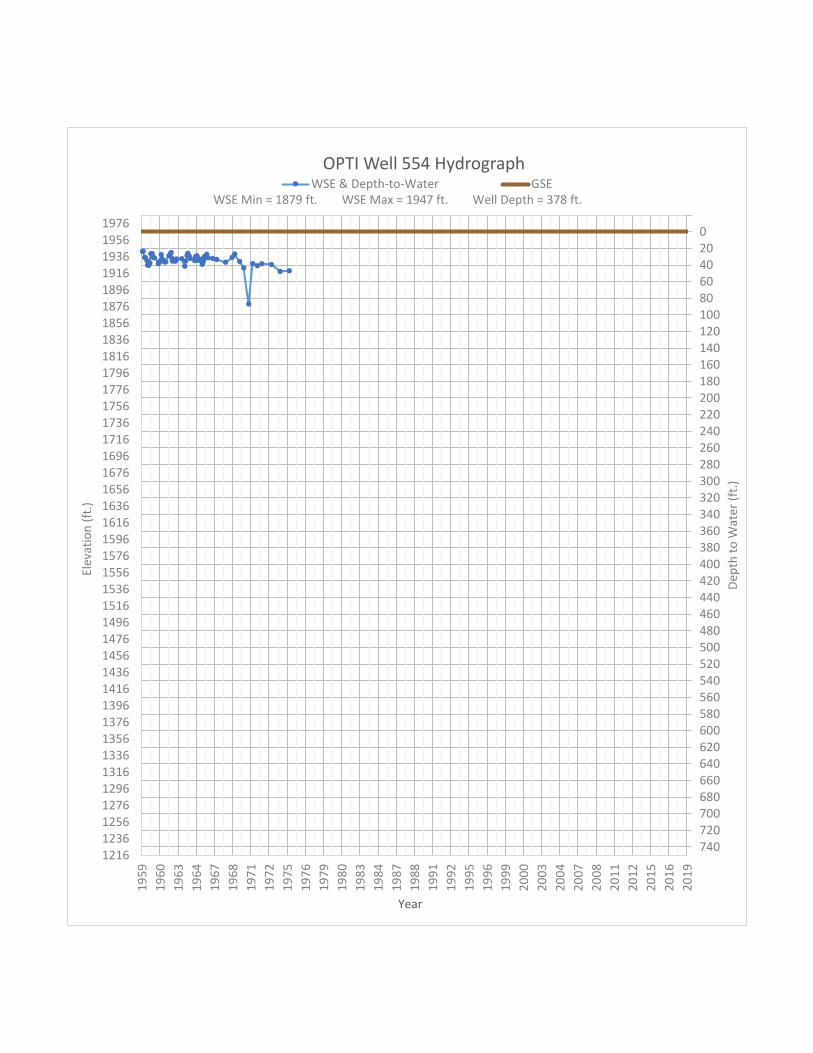
020406080100120140160180200220240260280300320340360380400420440460480500520540560580600620640660680700720740
19
59
19
60
19
63
19
64
19
67
19
68
19
71
19
72
19
75
19
76
19
79
19
80
19
83
19
84
19
87
19
88
19
91
19
92
19
95
19
96
19
99
20
00
20
03
20
04
20
07
20
08
20
11
20
12
20
15
20
16
20
19
121612361256127612961316133613561376139614161436145614761496151615361556157615961616163616561676169617161736175617761796181618361856187618961916193619561976
Elev
atio
n (
ft.)
Year
Dep
th t
o W
ater
(ft
.)
OPTI Well 554 HydrographWSE & Depth-to-Water GSE
WSE Min = 1879 ft. WSE Max = 1947 ft. Well Depth = 378 ft.

020406080100120140160180200220240260280300320340360380400420440460480500520540560580600620640660680700720740
19
59
19
60
19
63
19
64
19
67
19
68
19
71
19
72
19
75
19
76
19
79
19
80
19
83
19
84
19
87
19
88
19
91
19
92
19
95
19
96
19
99
20
00
20
03
20
04
20
07
20
08
20
11
20
12
20
15
20
16
20
19
123612561276129613161336135613761396141614361456147614961516153615561576159616161636165616761696171617361756177617961816183618561876189619161936195619761996
Elev
atio
n (
ft.)
Year
Dep
th t
o W
ater
(ft
.)
OPTI Well 557 HydrographWSE & Depth-to-Water GSE
WSE Min = 1939 ft. WSE Max = 1942 ft. Well Depth = 300 ft.

020406080100120140160180200220240260280300320340360380400420440460480500520540560580600620640660680700720740
19
59
19
60
19
63
19
64
19
67
19
68
19
71
19
72
19
75
19
76
19
79
19
80
19
83
19
84
19
87
19
88
19
91
19
92
19
95
19
96
19
99
20
00
20
03
20
04
20
07
20
08
20
11
20
12
20
15
20
16
20
19
136613861406142614461466148615061526154615661586160616261646166616861706172617461766178618061826184618661886190619261946196619862006202620462066208621062126
Elev
atio
n (
ft.)
Year
Dep
th t
o W
ater
(ft
.)
OPTI Well 558 HydrographWSE & Depth-to-Water GSE
WSE Min = 1966 ft. WSE Max = 1966 ft. Well Depth = 800 ft.

020406080100120140160180200220240260280300320340360380400420440460480500520540560580600620640660680700720740
19
59
19
60
19
63
19
64
19
67
19
68
19
71
19
72
19
75
19
76
19
79
19
80
19
83
19
84
19
87
19
88
19
91
19
92
19
95
19
96
19
99
20
00
20
03
20
04
20
07
20
08
20
11
20
12
20
15
20
16
20
19
164816681688170817281748176817881808182818481868188819081928194819681988200820282048206820882108212821482168218822082228224822682288230823282348236823882408
Elev
atio
n (
ft.)
Year
Dep
th t
o W
ater
(ft
.)
OPTI Well 561 HydrographWSE & Depth-to-Water GSE
WSE Min = 2152 ft. WSE Max = 2152 ft. Well Depth = 300 ft.

020406080100120140160180200220240260280300320340360380400420440460480500520540560580600620640660680700720740
19
59
19
60
19
63
19
64
19
67
19
68
19
71
19
72
19
75
19
76
19
79
19
80
19
83
19
84
19
87
19
88
19
91
19
92
19
95
19
96
19
99
20
00
20
03
20
04
20
07
20
08
20
11
20
12
20
15
20
16
20
19
164816681688170817281748176817881808182818481868188819081928194819681988200820282048206820882108212821482168218822082228224822682288230823282348236823882408
Elev
atio
n (
ft.)
Year
Dep
th t
o W
ater
(ft
.)
OPTI Well 562 HydrographWSE & Depth-to-Water GSE
WSE Min = 2167 ft. WSE Max = 2173 ft. Well Depth = 309 ft.

020406080100120140160180200220240260280300320340360380400420440460480500520540560580600620640660680700720740
19
59
19
60
19
63
19
64
19
67
19
68
19
71
19
72
19
75
19
76
19
79
19
80
19
83
19
84
19
87
19
88
19
91
19
92
19
95
19
96
19
99
20
00
20
03
20
04
20
07
20
08
20
11
20
12
20
15
20
16
20
19
145114711491151115311551157115911611163116511671169117111731175117711791181118311851187118911911193119511971199120112031205120712091211121312151217121912211
Elev
atio
n (
ft.)
Year
Dep
th t
o W
ater
(ft
.)
OPTI Well 563 HydrographWSE & Depth-to-Water GSE
WSE Min = 2197 ft. WSE Max = 2197 ft. Well Depth = 8 ft.

020406080100120140160180200220240260280300320340360380400420440460480500520540560580600620640660680700720740
19
59
19
60
19
63
19
64
19
67
19
68
19
71
19
72
19
75
19
76
19
79
19
80
19
83
19
84
19
87
19
88
19
91
19
92
19
95
19
96
19
99
20
00
20
03
20
04
20
07
20
08
20
11
20
12
20
15
20
16
20
19
142214421462148215021522154215621582160216221642166216821702172217421762178218021822184218621882190219221942196219822002202220422062208221022122214221622182
Elev
atio
n (
ft.)
Year
Dep
th t
o W
ater
(ft
.)
OPTI Well 564 HydrographWSE & Depth-to-Water GSE
WSE Min = 2171 ft. WSE Max = 2171 ft. Well Depth = Unknown ft.

020406080100120140160180200220240260280300320340360380400420440460480500520540560580600620640660680700720740
19
59
19
60
19
63
19
64
19
67
19
68
19
71
19
72
19
75
19
76
19
79
19
80
19
83
19
84
19
87
19
88
19
91
19
92
19
95
19
96
19
99
20
00
20
03
20
04
20
07
20
08
20
11
20
12
20
15
20
16
20
19
150815281548156815881608162816481668168817081728174817681788180818281848186818881908192819481968198820082028204820682088210821282148216821882208222822482268
Elev
atio
n (
ft.)
Year
Dep
th t
o W
ater
(ft
.)
OPTI Well 565 HydrographWSE & Depth-to-Water GSE
WSE Min = 2182 ft. WSE Max = 2182 ft. Well Depth = 127 ft.

020406080100120140160180200220240260280300320340360380400420440460480500520540560580600620640660680700720740
19
59
19
60
19
63
19
64
19
67
19
68
19
71
19
72
19
75
19
76
19
79
19
80
19
83
19
84
19
87
19
88
19
91
19
92
19
95
19
96
19
99
20
00
20
03
20
04
20
07
20
08
20
11
20
12
20
15
20
16
20
19
115511751195121512351255127512951315133513551375139514151435145514751495151515351555157515951615163516551675169517151735175517751795181518351855187518951915
Elev
atio
n (
ft.)
Year
Dep
th t
o W
ater
(ft
.)
OPTI Well 568 HydrographWSE & Depth-to-Water GSE
WSE Min = 1872 ft. WSE Max = 1885 ft. Well Depth = 188 ft.

020406080100120140160180200220240260280300320340360380400420440460480500520540560580600620640660680700720740
19
59
19
60
19
63
19
64
19
67
19
68
19
71
19
72
19
75
19
76
19
79
19
80
19
83
19
84
19
87
19
88
19
91
19
92
19
95
19
96
19
99
20
00
20
03
20
04
20
07
20
08
20
11
20
12
20
15
20
16
20
19
155715771597161716371657167716971717173717571777179718171837185718771897191719371957197719972017203720572077209721172137215721772197221722372257227722972317
Elev
atio
n (
ft.)
Year
Dep
th t
o W
ater
(ft
.)
OPTI Well 571 HydrographWSE & Depth-to-Water GSE
WSE Min = 2183 ft. WSE Max = 2188 ft. Well Depth = Unknown ft.

020406080100120140160180200220240260280300320340360380400420440460480500520540560580600620640660680700720740
19
59
19
60
19
63
19
64
19
67
19
68
19
71
19
72
19
75
19
76
19
79
19
80
19
83
19
84
19
87
19
88
19
91
19
92
19
95
19
96
19
99
20
00
20
03
20
04
20
07
20
08
20
11
20
12
20
15
20
16
20
19
133413541374139414141434145414741494151415341554157415941614163416541674169417141734175417741794181418341854187418941914193419541974199420142034205420742094
Elev
atio
n (
ft.)
Year
Dep
th t
o W
ater
(ft
.)
OPTI Well 573 HydrographWSE & Depth-to-Water GSE
WSE Min = 2008 ft. WSE Max = 2017 ft. Well Depth = 404 ft.
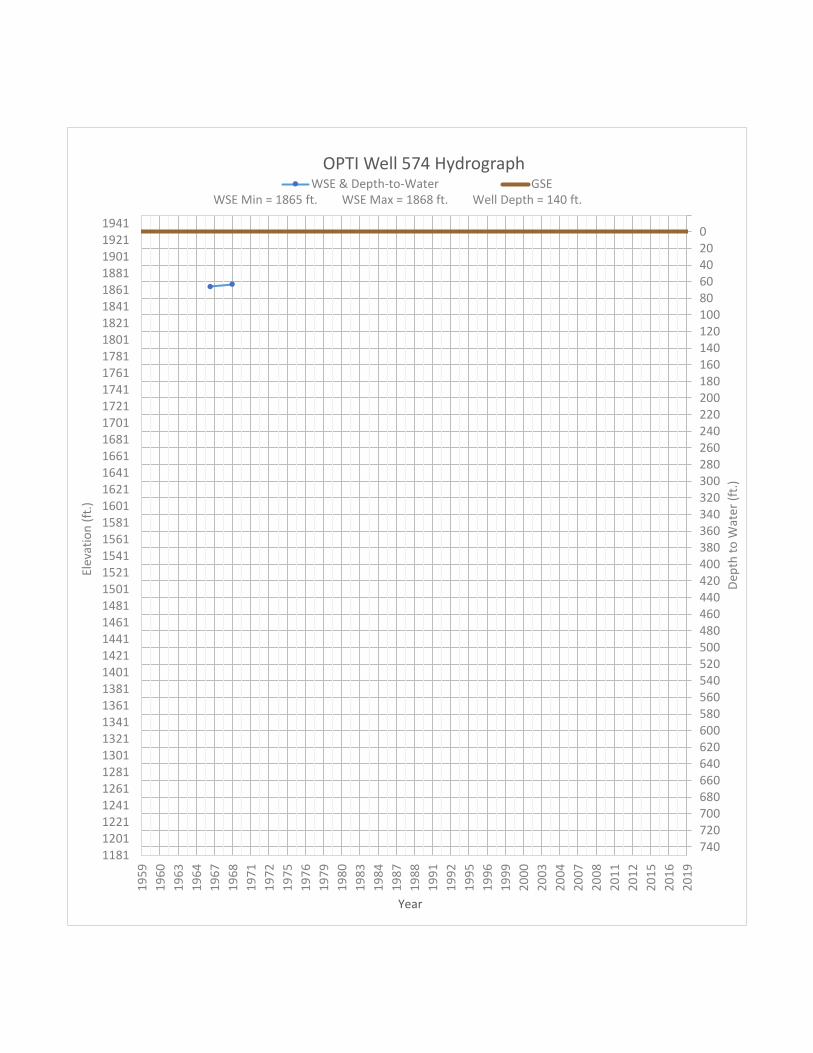
020406080100120140160180200220240260280300320340360380400420440460480500520540560580600620640660680700720740
19
59
19
60
19
63
19
64
19
67
19
68
19
71
19
72
19
75
19
76
19
79
19
80
19
83
19
84
19
87
19
88
19
91
19
92
19
95
19
96
19
99
20
00
20
03
20
04
20
07
20
08
20
11
20
12
20
15
20
16
20
19
118112011221124112611281130113211341136113811401142114411461148115011521154115611581160116211641166116811701172117411761178118011821184118611881190119211941
Elev
atio
n (
ft.)
Year
Dep
th t
o W
ater
(ft
.)
OPTI Well 574 HydrographWSE & Depth-to-Water GSE
WSE Min = 1865 ft. WSE Max = 1868 ft. Well Depth = 140 ft.

020406080100120140160180200220240260280300320340360380400420440460480500520540560580600620640660680700720740
19
59
19
60
19
63
19
64
19
67
19
68
19
71
19
72
19
75
19
76
19
79
19
80
19
83
19
84
19
87
19
88
19
91
19
92
19
95
19
96
19
99
20
00
20
03
20
04
20
07
20
08
20
11
20
12
20
15
20
16
20
19
108811081128114811681188120812281248126812881308132813481368138814081428144814681488150815281548156815881608162816481668168817081728174817681788180818281848
Elev
atio
n (
ft.)
Year
Dep
th t
o W
ater
(ft
.)
OPTI Well 578 HydrographWSE & Depth-to-Water GSE
WSE Min = 1824 ft. WSE Max = 1825 ft. Well Depth = 699 ft.

020406080100120140160180200220240260280300320340360380400420440460480500520540560580600620640660680700720740
19
59
19
60
19
63
19
64
19
67
19
68
19
71
19
72
19
75
19
76
19
79
19
80
19
83
19
84
19
87
19
88
19
91
19
92
19
95
19
96
19
99
20
00
20
03
20
04
20
07
20
08
20
11
20
12
20
15
20
16
20
19
129613161336135613761396141614361456147614961516153615561576159616161636165616761696171617361756177617961816183618561876189619161936195619761996201620362056
Elev
atio
n (
ft.)
Year
Dep
th t
o W
ater
(ft
.)
OPTI Well 579 HydrographWSE & Depth-to-Water GSE
WSE Min = 1895 ft. WSE Max = 1895 ft. Well Depth = 191 ft.

020406080100120140160180200220240260280300320340360380400420440460480500520540560580600620640660680700720740
19
59
19
60
19
63
19
64
19
67
19
68
19
71
19
72
19
75
19
76
19
79
19
80
19
83
19
84
19
87
19
88
19
91
19
92
19
95
19
96
19
99
20
00
20
03
20
04
20
07
20
08
20
11
20
12
20
15
20
16
20
19
129213121332135213721392141214321452147214921512153215521572159216121632165216721692171217321752177217921812183218521872189219121932195219721992201220322052
Elev
atio
n (
ft.)
Year
Dep
th t
o W
ater
(ft
.)
OPTI Well 580 HydrographWSE & Depth-to-Water GSE
WSE Min = 1884 ft. WSE Max = 1892 ft. Well Depth = 250 ft.

020406080100120140160180200220240260280300320340360380400420440460480500520540560580600620640660680700720740
19
59
19
60
19
63
19
64
19
67
19
68
19
71
19
72
19
75
19
76
19
79
19
80
19
83
19
84
19
87
19
88
19
91
19
92
19
95
19
96
19
99
20
00
20
03
20
04
20
07
20
08
20
11
20
12
20
15
20
16
20
19
103610561076109611161136115611761196121612361256127612961316133613561376139614161436145614761496151615361556157615961616163616561676169617161736175617761796
Elev
atio
n (
ft.)
Year
Dep
th t
o W
ater
(ft
.)
OPTI Well 582 HydrographWSE & Depth-to-Water GSE
WSE Min = 1477 ft. WSE Max = 1477 ft. Well Depth = Unknown ft.

020406080100120140160180200220240260280300320340360380400420440460480500520540560580600620640660680700720740
19
59
19
60
19
63
19
64
19
67
19
68
19
71
19
72
19
75
19
76
19
79
19
80
19
83
19
84
19
87
19
88
19
91
19
92
19
95
19
96
19
99
20
00
20
03
20
04
20
07
20
08
20
11
20
12
20
15
20
16
20
19
100310231043106310831103112311431163118312031223124312631283130313231343136313831403142314431463148315031523154315631583160316231643166316831703172317431763
Elev
atio
n (
ft.)
Year
Dep
th t
o W
ater
(ft
.)
OPTI Well 584 HydrographWSE & Depth-to-Water GSE
WSE Min = 1703 ft. WSE Max = 1703 ft. Well Depth = 450 ft.

020406080100120140160180200220240260280300320340360380400420440460480500520540560580600620640660680700720740
19
59
19
60
19
63
19
64
19
67
19
68
19
71
19
72
19
75
19
76
19
79
19
80
19
83
19
84
19
87
19
88
19
91
19
92
19
95
19
96
19
99
20
00
20
03
20
04
20
07
20
08
20
11
20
12
20
15
20
16
20
19
963983
1003102310431063108311031123114311631183120312231243126312831303132313431363138314031423144314631483150315231543156315831603162316431663168317031723
Elev
atio
n (
ft.)
Year
Dep
th t
o W
ater
(ft
.)
OPTI Well 587 HydrographWSE & Depth-to-Water GSE
WSE Min = 1670 ft. WSE Max = 1670 ft. Well Depth = 900 ft.

020406080100120140160180200220240260280300320340360380400420440460480500520540560580600620640660680700720740
19
59
19
60
19
63
19
64
19
67
19
68
19
71
19
72
19
75
19
76
19
79
19
80
19
83
19
84
19
87
19
88
19
91
19
92
19
95
19
96
19
99
20
00
20
03
20
04
20
07
20
08
20
11
20
12
20
15
20
16
20
19
99610161036105610761096111611361156117611961216123612561276129613161336135613761396141614361456147614961516153615561576159616161636165616761696171617361756
Elev
atio
n (
ft.)
Year
Dep
th t
o W
ater
(ft
.)
OPTI Well 589 HydrographWSE & Depth-to-Water GSE
WSE Min = 1708 ft. WSE Max = 1710 ft. Well Depth = 73 ft.

020406080100120140160180200220240260280300320340360380400420440460480500520540560580600620640660680700720740
19
59
19
60
19
63
19
64
19
67
19
68
19
71
19
72
19
75
19
76
19
79
19
80
19
83
19
84
19
87
19
88
19
91
19
92
19
95
19
96
19
99
20
00
20
03
20
04
20
07
20
08
20
11
20
12
20
15
20
16
20
19
963983
1003102310431063108311031123114311631183120312231243126312831303132313431363138314031423144314631483150315231543156315831603162316431663168317031723
Elev
atio
n (
ft.)
Year
Dep
th t
o W
ater
(ft
.)
OPTI Well 590 HydrographWSE & Depth-to-Water GSE
WSE Min = 1683 ft. WSE Max = 1683 ft. Well Depth = 63 ft.

020406080100120140160180200220240260280300320340360380400420440460480500520540560580600620640660680700720740
19
59
19
60
19
63
19
64
19
67
19
68
19
71
19
72
19
75
19
76
19
79
19
80
19
83
19
84
19
87
19
88
19
91
19
92
19
95
19
96
19
99
20
00
20
03
20
04
20
07
20
08
20
11
20
12
20
15
20
16
20
19
965985
1005102510451065108511051125114511651185120512251245126512851305132513451365138514051425144514651485150515251545156515851605162516451665168517051725
Elev
atio
n (
ft.)
Year
Dep
th t
o W
ater
(ft
.)
OPTI Well 591 HydrographWSE & Depth-to-Water GSE
WSE Min = 1663 ft. WSE Max = 1675 ft. Well Depth = 720 ft.

020406080100120140160180200220240260280300320340360380400420440460480500520540560580600620640660680700720740
19
59
19
60
19
63
19
64
19
67
19
68
19
71
19
72
19
75
19
76
19
79
19
80
19
83
19
84
19
87
19
88
19
91
19
92
19
95
19
96
19
99
20
00
20
03
20
04
20
07
20
08
20
11
20
12
20
15
20
16
20
19
979999
1019103910591079109911191139115911791199121912391259127912991319133913591379139914191439145914791499151915391559157915991619163916591679169917191739
Elev
atio
n (
ft.)
Year
Dep
th t
o W
ater
(ft
.)
OPTI Well 592 HydrographWSE & Depth-to-Water GSE
WSE Min = 1680 ft. WSE Max = 1683 ft. Well Depth = 158 ft.

020406080100120140160180200220240260280300320340360380400420440460480500520540560580600620640660680700720740
19
59
19
60
19
63
19
64
19
67
19
68
19
71
19
72
19
75
19
76
19
79
19
80
19
83
19
84
19
87
19
88
19
91
19
92
19
95
19
96
19
99
20
00
20
03
20
04
20
07
20
08
20
11
20
12
20
15
20
16
20
19
954974994
101410341054107410941114113411541174119412141234125412741294131413341354137413941414143414541474149415141534155415741594161416341654167416941714
Elev
atio
n (
ft.)
Year
Dep
th t
o W
ater
(ft
.)
OPTI Well 593 HydrographWSE & Depth-to-Water GSE
WSE Min = 1680 ft. WSE Max = 1681 ft. Well Depth = 97 ft.

020406080100120140160180200220240260280300320340360380400420440460480500520540560580600620640660680700720740
19
59
19
60
19
63
19
64
19
67
19
68
19
71
19
72
19
75
19
76
19
79
19
80
19
83
19
84
19
87
19
88
19
91
19
92
19
95
19
96
19
99
20
00
20
03
20
04
20
07
20
08
20
11
20
12
20
15
20
16
20
19
953973993
101310331053107310931113113311531173119312131233125312731293131313331353137313931413143314531473149315131533155315731593161316331653167316931713
Elev
atio
n (
ft.)
Year
Dep
th t
o W
ater
(ft
.)
OPTI Well 594 HydrographWSE & Depth-to-Water GSE
WSE Min = 1679 ft. WSE Max = 1679 ft. Well Depth = 25 ft.
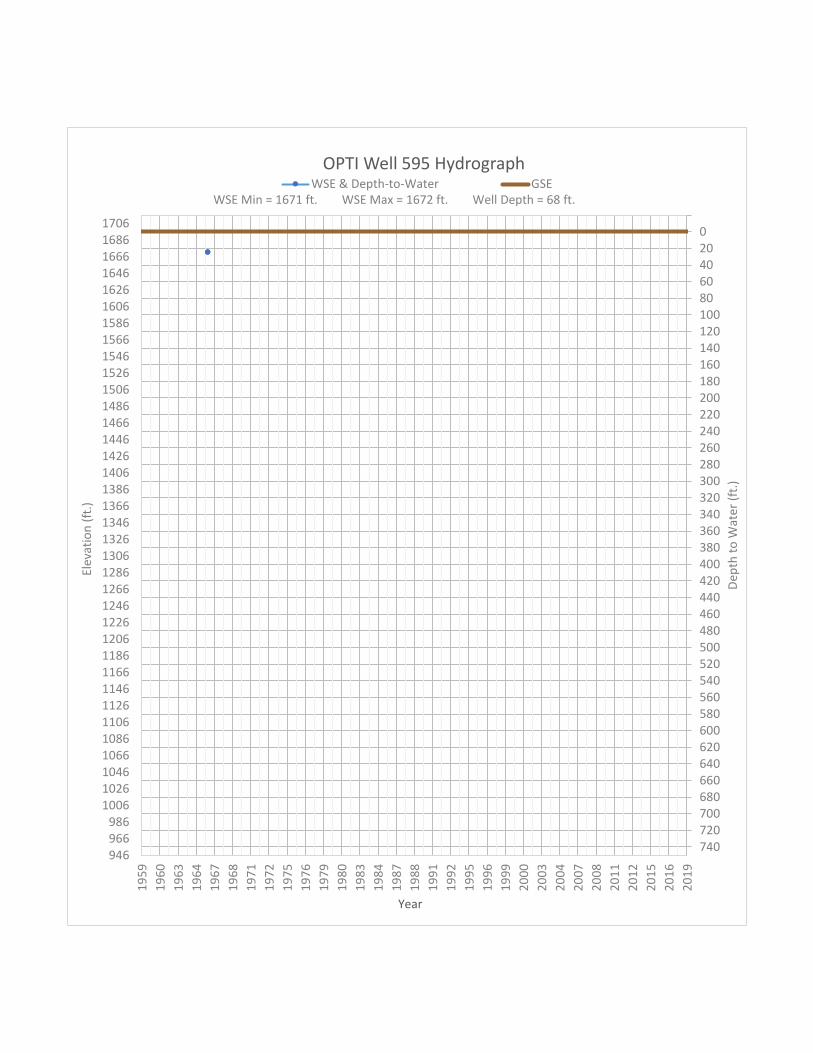
020406080100120140160180200220240260280300320340360380400420440460480500520540560580600620640660680700720740
19
59
19
60
19
63
19
64
19
67
19
68
19
71
19
72
19
75
19
76
19
79
19
80
19
83
19
84
19
87
19
88
19
91
19
92
19
95
19
96
19
99
20
00
20
03
20
04
20
07
20
08
20
11
20
12
20
15
20
16
20
19
946966986
100610261046106610861106112611461166118612061226124612661286130613261346136613861406142614461466148615061526154615661586160616261646166616861706
Elev
atio
n (
ft.)
Year
Dep
th t
o W
ater
(ft
.)
OPTI Well 595 HydrographWSE & Depth-to-Water GSE
WSE Min = 1671 ft. WSE Max = 1672 ft. Well Depth = 68 ft.

020406080100120140160180200220240260280300320340360380400420440460480500520540560580600620640660680700720740
19
59
19
60
19
63
19
64
19
67
19
68
19
71
19
72
19
75
19
76
19
79
19
80
19
83
19
84
19
87
19
88
19
91
19
92
19
95
19
96
19
99
20
00
20
03
20
04
20
07
20
08
20
11
20
12
20
15
20
16
20
19
941961981
100110211041106110811101112111411161118112011221124112611281130113211341136113811401142114411461148115011521154115611581160116211641166116811701
Elev
atio
n (
ft.)
Year
Dep
th t
o W
ater
(ft
.)
OPTI Well 596 HydrographWSE & Depth-to-Water GSE
WSE Min = 1666 ft. WSE Max = 1667 ft. Well Depth = 25 ft.

020406080100120140160180200220240260280300320340360380400420440460480500520540560580600620640660680700720740
19
59
19
60
19
63
19
64
19
67
19
68
19
71
19
72
19
75
19
76
19
79
19
80
19
83
19
84
19
87
19
88
19
91
19
92
19
95
19
96
19
99
20
00
20
03
20
04
20
07
20
08
20
11
20
12
20
15
20
16
20
19
944964984
100410241044106410841104112411441164118412041224124412641284130413241344136413841404142414441464148415041524154415641584160416241644166416841704
Elev
atio
n (
ft.)
Year
Dep
th t
o W
ater
(ft
.)
OPTI Well 597 HydrographWSE & Depth-to-Water GSE
WSE Min = 1655 ft. WSE Max = 1661 ft. Well Depth = 390 ft.

020406080100120140160180200220240260280300320340360380400420440460480500520540560580600620640660680700720740
19
59
19
60
19
63
19
64
19
67
19
68
19
71
19
72
19
75
19
76
19
79
19
80
19
83
19
84
19
87
19
88
19
91
19
92
19
95
19
96
19
99
20
00
20
03
20
04
20
07
20
08
20
11
20
12
20
15
20
16
20
19
132413441364138414041424144414641484150415241544156415841604162416441664168417041724174417641784180418241844186418841904192419441964198420042024204420642084
Elev
atio
n (
ft.)
Year
Dep
th t
o W
ater
(ft
.)
OPTI Well 601 HydrographWSE & Depth-to-Water GSE
WSE Min = 1640 ft. WSE Max = 2056 ft. Well Depth = 723 ft.

020406080100120140160180200220240260280300320340360380400420440460480500520540560580600620640660680700720740
19
59
19
60
19
63
19
64
19
67
19
68
19
71
19
72
19
75
19
76
19
79
19
80
19
83
19
84
19
87
19
88
19
91
19
92
19
95
19
96
19
99
20
00
20
03
20
04
20
07
20
08
20
11
20
12
20
15
20
16
20
19
136413841404142414441464148415041524154415641584160416241644166416841704172417441764178418041824184418641884190419241944196419842004202420442064208421042124
Elev
atio
n (
ft.)
Year
Dep
th t
o W
ater
(ft
.)
OPTI Well 602 HydrographWSE & Depth-to-Water GSE
WSE Min = 1627 ft. WSE Max = 1884 ft. Well Depth = 725 ft.

020406080100120140160180200220240260280300320340360380400420440460480500520540560580600620640660680700720740
19
59
19
60
19
63
19
64
19
67
19
68
19
71
19
72
19
75
19
76
19
79
19
80
19
83
19
84
19
87
19
88
19
91
19
92
19
95
19
96
19
99
20
00
20
03
20
04
20
07
20
08
20
11
20
12
20
15
20
16
20
19
134713671387140714271447146714871507152715471567158716071627164716671687170717271747176717871807182718471867188719071927194719671987200720272047206720872107
Elev
atio
n (
ft.)
Year
Dep
th t
o W
ater
(ft
.)
OPTI Well 603 HydrographWSE & Depth-to-Water GSE
WSE Min = 1638 ft. WSE Max = 1897 ft. Well Depth = 800 ft.

020406080100120140160180200220240260280300320340360380400420440460480500520540560580600620640660680700720740
19
59
19
60
19
63
19
64
19
67
19
68
19
71
19
72
19
75
19
76
19
79
19
80
19
83
19
84
19
87
19
88
19
91
19
92
19
95
19
96
19
99
20
00
20
03
20
04
20
07
20
08
20
11
20
12
20
15
20
16
20
19
137513951415143514551475149515151535155515751595161516351655167516951715173517551775179518151835185518751895191519351955197519952015203520552075209521152135
Elev
atio
n (
ft.)
Year
Dep
th t
o W
ater
(ft
.)
OPTI Well 604 HydrographWSE & Depth-to-Water GSE
WSE Min = 1607 ft. WSE Max = 1844 ft. Well Depth = 924 ft.

020406080100120140160180200220240260280300320340360380400420440460480500520540560580600620640660680700720740
19
59
19
60
19
63
19
64
19
67
19
68
19
71
19
72
19
75
19
76
19
79
19
80
19
83
19
84
19
87
19
88
19
91
19
92
19
95
19
96
19
99
20
00
20
03
20
04
20
07
20
08
20
11
20
12
20
15
20
16
20
19
138914091429144914691489150915291549156915891609162916491669168917091729174917691789180918291849186918891909192919491969198920092029204920692089210921292149
Elev
atio
n (
ft.)
Year
Dep
th t
o W
ater
(ft
.)
OPTI Well 605 HydrographWSE & Depth-to-Water GSE
WSE Min = 1708 ft. WSE Max = 1834 ft. Well Depth = 597 ft.

020406080100120140160180200220240260280300320340360380400420440460480500520540560580600620640660680700720740
19
59
19
60
19
63
19
64
19
67
19
68
19
71
19
72
19
75
19
76
19
79
19
80
19
83
19
84
19
87
19
88
19
91
19
92
19
95
19
96
19
99
20
00
20
03
20
04
20
07
20
08
20
11
20
12
20
15
20
16
20
19
143814581478149815181538155815781598161816381658167816981718173817581778179818181838185818781898191819381958197819982018203820582078209821182138215821782198
Elev
atio
n (
ft.)
Year
Dep
th t
o W
ater
(ft
.)
OPTI Well 606 HydrographWSE & Depth-to-Water GSE
WSE Min = 1812 ft. WSE Max = 1925 ft. Well Depth = 804 ft.

020406080100120140160180200220240260280300320340360380400420440460480500520540560580600620640660680700720740
19
59
19
60
19
63
19
64
19
67
19
68
19
71
19
72
19
75
19
76
19
79
19
80
19
83
19
84
19
87
19
88
19
91
19
92
19
95
19
96
19
99
20
00
20
03
20
04
20
07
20
08
20
11
20
12
20
15
20
16
20
19
147314931513153315531573159316131633165316731693171317331753177317931813183318531873189319131933195319731993201320332053207320932113213321532173219322132233
Elev
atio
n (
ft.)
Year
Dep
th t
o W
ater
(ft
.)
OPTI Well 607 HydrographWSE & Depth-to-Water GSE
WSE Min = 1751 ft. WSE Max = 1925 ft. Well Depth = 775 ft.

020406080100120140160180200220240260280300320340360380400420440460480500520540560580600620640660680700720740
19
59
19
60
19
63
19
64
19
67
19
68
19
71
19
72
19
75
19
76
19
79
19
80
19
83
19
84
19
87
19
88
19
91
19
92
19
95
19
96
19
99
20
00
20
03
20
04
20
07
20
08
20
11
20
12
20
15
20
16
20
19
147414941514153415541574159416141634165416741694171417341754177417941814183418541874189419141934195419741994201420342054207420942114213421542174219422142234
Elev
atio
n (
ft.)
Year
Dep
th t
o W
ater
(ft
.)
OPTI Well 608 HydrographWSE & Depth-to-Water GSE
WSE Min = 1789 ft. WSE Max = 1954 ft. Well Depth = 745 ft.

020406080100120140160180200220240260280300320340360380400420440460480500520540560580600620640660680700720740
19
59
19
60
19
63
19
64
19
67
19
68
19
71
19
72
19
75
19
76
19
79
19
80
19
83
19
84
19
87
19
88
19
91
19
92
19
95
19
96
19
99
20
00
20
03
20
04
20
07
20
08
20
11
20
12
20
15
20
16
20
19
141714371457147714971517153715571577159716171637165716771697171717371757177717971817183718571877189719171937195719771997201720372057207720972117213721572177
Elev
atio
n (
ft.)
Year
Dep
th t
o W
ater
(ft
.)
OPTI Well 609 HydrographWSE & Depth-to-Water GSE
WSE Min = 1721 ft. WSE Max = 1937 ft. Well Depth = 970 ft.

020406080100120140160180200220240260280300320340360380400420440460480500520540560580600620640660680700720740
19
59
19
60
19
63
19
64
19
67
19
68
19
71
19
72
19
75
19
76
19
79
19
80
19
83
19
84
19
87
19
88
19
91
19
92
19
95
19
96
19
99
20
00
20
03
20
04
20
07
20
08
20
11
20
12
20
15
20
16
20
19
169217121732175217721792181218321852187218921912193219521972199220122032205220722092211221322152217221922212223222522272229223122332235223722392241224322452
Elev
atio
n (
ft.)
Year
Dep
th t
o W
ater
(ft
.)
OPTI Well 610 HydrographWSE & Depth-to-Water GSE
WSE Min = 1837 ft. WSE Max = 1987 ft. Well Depth = 780 ft.

020406080100120140160180200220240260280300320340360380400420440460480500520540560580600620640660680700720740
19
59
19
60
19
63
19
64
19
67
19
68
19
71
19
72
19
75
19
76
19
79
19
80
19
83
19
84
19
87
19
88
19
91
19
92
19
95
19
96
19
99
20
00
20
03
20
04
20
07
20
08
20
11
20
12
20
15
20
16
20
19
149515151535155515751595161516351655167516951715173517551775179518151835185518751895191519351955197519952015203520552075209521152135215521752195221522352255
Elev
atio
n (
ft.)
Year
Dep
th t
o W
ater
(ft
.)
OPTI Well 611 HydrographWSE & Depth-to-Water GSE
WSE Min = 1871 ft. WSE Max = 1956 ft. Well Depth = 550 ft.

020406080100120140160180200220240260280300320340360380400420440460480500520540560580600620640660680700720740
19
59
19
60
19
63
19
64
19
67
19
68
19
71
19
72
19
75
19
76
19
79
19
80
19
83
19
84
19
87
19
88
19
91
19
92
19
95
19
96
19
99
20
00
20
03
20
04
20
07
20
08
20
11
20
12
20
15
20
16
20
19
151615361556157615961616163616561676169617161736175617761796181618361856187618961916193619561976199620162036205620762096211621362156217621962216223622562276
Elev
atio
n (
ft.)
Year
Dep
th t
o W
ater
(ft
.)
OPTI Well 612 HydrographWSE & Depth-to-Water GSE
WSE Min = 1812 ft. WSE Max = 1938 ft. Well Depth = 1070 ft.

020406080100120140160180200220240260280300320340360380400420440460480500520540560580600620640660680700720740
19
59
19
60
19
63
19
64
19
67
19
68
19
71
19
72
19
75
19
76
19
79
19
80
19
83
19
84
19
87
19
88
19
91
19
92
19
95
19
96
19
99
20
00
20
03
20
04
20
07
20
08
20
11
20
12
20
15
20
16
20
19
158016001620164016601680170017201740176017801800182018401860188019001920194019601980200020202040206020802100212021402160218022002220224022602280230023202340
Elev
atio
n (
ft.)
Year
Dep
th t
o W
ater
(ft
.)
OPTI Well 613 HydrographWSE & Depth-to-Water GSE
WSE Min = 1832 ft. WSE Max = 1954 ft. Well Depth = 830 ft.

020406080100120140160180200220240260280300320340360380400420440460480500520540560580600620640660680700720740
19
59
19
60
19
63
19
64
19
67
19
68
19
71
19
72
19
75
19
76
19
79
19
80
19
83
19
84
19
87
19
88
19
91
19
92
19
95
19
96
19
99
20
00
20
03
20
04
20
07
20
08
20
11
20
12
20
15
20
16
20
19
158716071627164716671687170717271747176717871807182718471867188719071927194719671987200720272047206720872107212721472167218722072227224722672287230723272347
Elev
atio
n (
ft.)
Year
Dep
th t
o W
ater
(ft
.)
OPTI Well 614 HydrographWSE & Depth-to-Water GSE
WSE Min = 1838 ft. WSE Max = 1957 ft. Well Depth = 745 ft.

020406080100120140160180200220240260280300320340360380400420440460480500520540560580600620640660680700720740
19
59
19
60
19
63
19
64
19
67
19
68
19
71
19
72
19
75
19
76
19
79
19
80
19
83
19
84
19
87
19
88
19
91
19
92
19
95
19
96
19
99
20
00
20
03
20
04
20
07
20
08
20
11
20
12
20
15
20
16
20
19
157715971617163716571677169717171737175717771797181718371857187718971917193719571977199720172037205720772097211721372157217721972217223722572277229723172337
Elev
atio
n (
ft.)
Year
Dep
th t
o W
ater
(ft
.)
OPTI Well 615 HydrographWSE & Depth-to-Water GSE
WSE Min = 1843 ft. WSE Max = 1969 ft. Well Depth = 865 ft.

020406080100120140160180200220240260280300320340360380400420440460480500520540560580600620640660680700720740
19
59
19
60
19
63
19
64
19
67
19
68
19
71
19
72
19
75
19
76
19
79
19
80
19
83
19
84
19
87
19
88
19
91
19
92
19
95
19
96
19
99
20
00
20
03
20
04
20
07
20
08
20
11
20
12
20
15
20
16
20
19
184018601880190019201940196019802000202020402060208021002120214021602180220022202240226022802300232023402360238024002420244024602480250025202540256025802600
Elev
atio
n (
ft.)
Year
Dep
th t
o W
ater
(ft
.)
OPTI Well 616 HydrographWSE & Depth-to-Water GSE
WSE Min = 1929 ft. WSE Max = 2139 ft. Well Depth = 780 ft.

020406080100120140160180200220240260280300320340360380400420440460480500520540560580600620640660680700720740
19
59
19
60
19
63
19
64
19
67
19
68
19
71
19
72
19
75
19
76
19
79
19
80
19
83
19
84
19
87
19
88
19
91
19
92
19
95
19
96
19
99
20
00
20
03
20
04
20
07
20
08
20
11
20
12
20
15
20
16
20
19
214221622182220222222242226222822302232223422362238224022422244224622482250225222542256225822602262226422662268227022722274227622782280228222842286228822902
Elev
atio
n (
ft.)
Year
Dep
th t
o W
ater
(ft
.)
OPTI Well 617 HydrographWSE & Depth-to-Water GSE
WSE Min = 2760 ft. WSE Max = 2852 ft. Well Depth = 240 ft.

020406080100120140160180200220240260280300320340360380400420440460480500520540560580600620640660680700720740
19
59
19
60
19
63
19
64
19
67
19
68
19
71
19
72
19
75
19
76
19
79
19
80
19
83
19
84
19
87
19
88
19
91
19
92
19
95
19
96
19
99
20
00
20
03
20
04
20
07
20
08
20
11
20
12
20
15
20
16
20
19
141314331453147314931513153315531573159316131633165316731693171317331753177317931813183318531873189319131933195319731993201320332053207320932113213321532173
Elev
atio
n (
ft.)
Year
Dep
th t
o W
ater
(ft
.)
OPTI Well 618 HydrographWSE & Depth-to-Water GSE
WSE Min = 1613 ft. WSE Max = 1894 ft. Well Depth = 927 ft.

020406080100120140160180200220240260280300320340360380400420440460480500520540560580600620640660680700720740
19
59
19
60
19
63
19
64
19
67
19
68
19
71
19
72
19
75
19
76
19
79
19
80
19
83
19
84
19
87
19
88
19
91
19
92
19
95
19
96
19
99
20
00
20
03
20
04
20
07
20
08
20
11
20
12
20
15
20
16
20
19
155715771597161716371657167716971717173717571777179718171837185718771897191719371957197719972017203720572077209721172137215721772197221722372257227722972317
Elev
atio
n (
ft.)
Year
Dep
th t
o W
ater
(ft
.)
OPTI Well 619 HydrographWSE & Depth-to-Water GSE
WSE Min = 1826 ft. WSE Max = 1977 ft. Well Depth = 1040 ft.
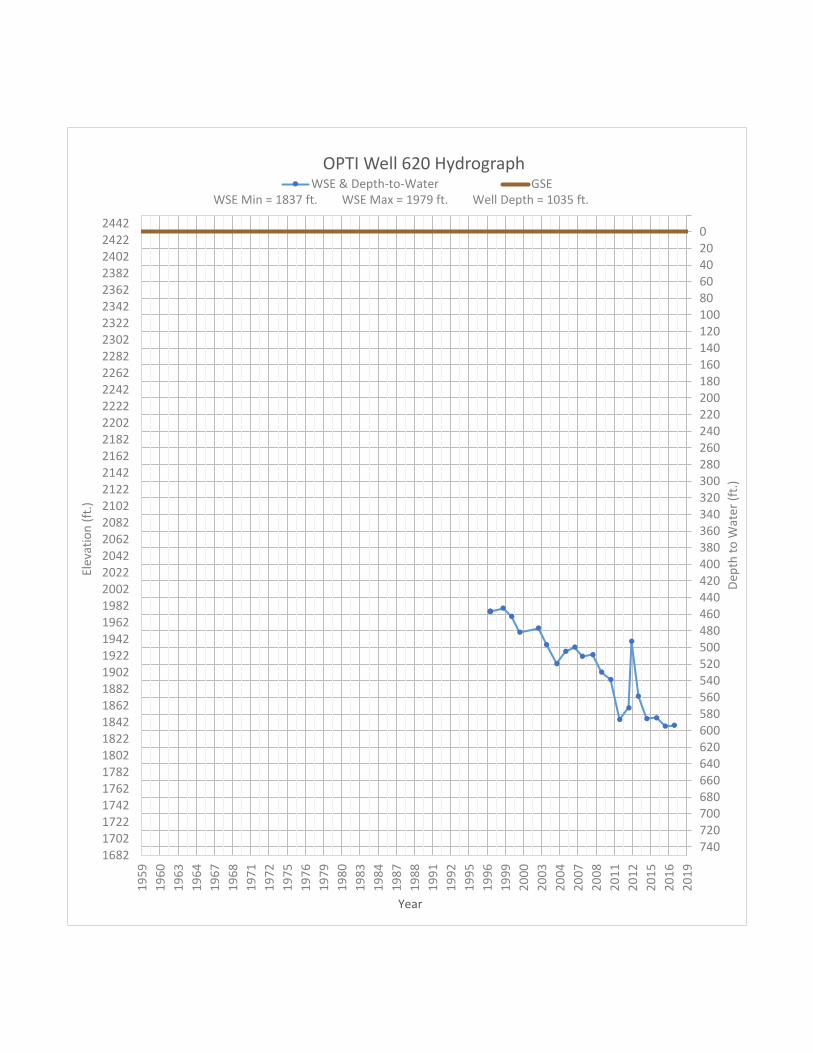
020406080100120140160180200220240260280300320340360380400420440460480500520540560580600620640660680700720740
19
59
19
60
19
63
19
64
19
67
19
68
19
71
19
72
19
75
19
76
19
79
19
80
19
83
19
84
19
87
19
88
19
91
19
92
19
95
19
96
19
99
20
00
20
03
20
04
20
07
20
08
20
11
20
12
20
15
20
16
20
19
168217021722174217621782180218221842186218821902192219421962198220022022204220622082210221222142216221822202222222422262228223022322234223622382240224222442
Elev
atio
n (
ft.)
Year
Dep
th t
o W
ater
(ft
.)
OPTI Well 620 HydrographWSE & Depth-to-Water GSE
WSE Min = 1837 ft. WSE Max = 1979 ft. Well Depth = 1035 ft.

020406080100120140160180200220240260280300320340360380400420440460480500520540560580600620640660680700720740
19
59
19
60
19
63
19
64
19
67
19
68
19
71
19
72
19
75
19
76
19
79
19
80
19
83
19
84
19
87
19
88
19
91
19
92
19
95
19
96
19
99
20
00
20
03
20
04
20
07
20
08
20
11
20
12
20
15
20
16
20
19
137613961416143614561476149615161536155615761596161616361656167616961716173617561776179618161836185618761896191619361956197619962016203620562076209621162136
Elev
atio
n (
ft.)
Year
Dep
th t
o W
ater
(ft
.)
OPTI Well 621 HydrographWSE & Depth-to-Water GSE
WSE Min = 1583 ft. WSE Max = 1817 ft. Well Depth = 974 ft.

020406080100120140160180200220240260280300320340360380400420440460480500520540560580600620640660680700720740
19
59
19
60
19
63
19
64
19
67
19
68
19
71
19
72
19
75
19
76
19
79
19
80
19
83
19
84
19
87
19
88
19
91
19
92
19
95
19
96
19
99
20
00
20
03
20
04
20
07
20
08
20
11
20
12
20
15
20
16
20
19
146914891509152915491569158916091629164916691689170917291749176917891809182918491869188919091929194919691989200920292049206920892109212921492169218922092229
Elev
atio
n (
ft.)
Year
Dep
th t
o W
ater
(ft
.)
OPTI Well 622 HydrographWSE & Depth-to-Water GSE
WSE Min = 1794 ft. WSE Max = 1952 ft. Well Depth = 1200 ft.

020406080100120140160180200220240260280300320340360380400420440460480500520540560580600620640660680700720740
19
59
19
60
19
63
19
64
19
67
19
68
19
71
19
72
19
75
19
76
19
79
19
80
19
83
19
84
19
87
19
88
19
91
19
92
19
95
19
96
19
99
20
00
20
03
20
04
20
07
20
08
20
11
20
12
20
15
20
16
20
19
153815581578159816181638165816781698171817381758177817981818183818581878189819181938195819781998201820382058207820982118213821582178219822182238225822782298
Elev
atio
n (
ft.)
Year
Dep
th t
o W
ater
(ft
.)
OPTI Well 623 HydrographWSE & Depth-to-Water GSE
WSE Min = 1797 ft. WSE Max = 1954 ft. Well Depth = 1040 ft.

020406080100120140160180200220240260280300320340360380400420440460480500520540560580600620640660680700720740
19
59
19
60
19
63
19
64
19
67
19
68
19
71
19
72
19
75
19
76
19
79
19
80
19
83
19
84
19
87
19
88
19
91
19
92
19
95
19
96
19
99
20
00
20
03
20
04
20
07
20
08
20
11
20
12
20
15
20
16
20
19
153215521572159216121632165216721692171217321752177217921812183218521872189219121932195219721992201220322052207220922112213221522172219222122232225222722292
Elev
atio
n (
ft.)
Year
Dep
th t
o W
ater
(ft
.)
OPTI Well 624 HydrographWSE & Depth-to-Water GSE
WSE Min = 1962 ft. WSE Max = 2002 ft. Well Depth = 420 ft.
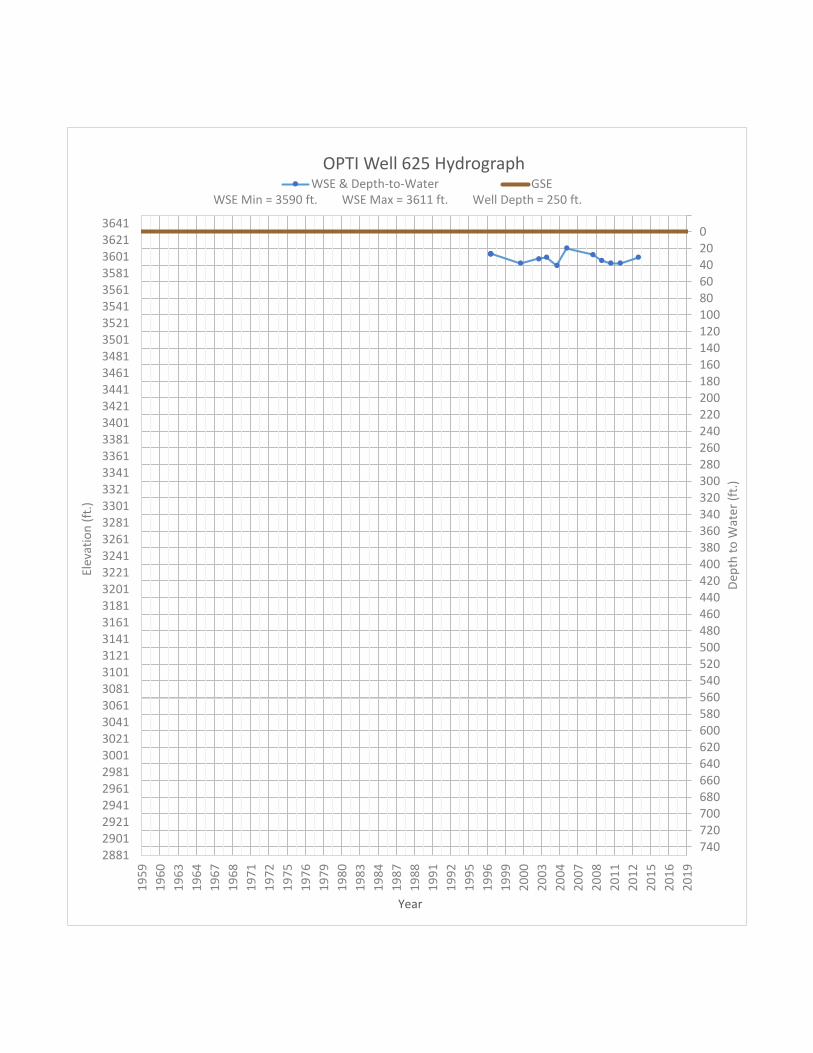
020406080100120140160180200220240260280300320340360380400420440460480500520540560580600620640660680700720740
19
59
19
60
19
63
19
64
19
67
19
68
19
71
19
72
19
75
19
76
19
79
19
80
19
83
19
84
19
87
19
88
19
91
19
92
19
95
19
96
19
99
20
00
20
03
20
04
20
07
20
08
20
11
20
12
20
15
20
16
20
19
288129012921294129612981300130213041306130813101312131413161318132013221324132613281330133213341336133813401342134413461348135013521354135613581360136213641
Elev
atio
n (
ft.)
Year
Dep
th t
o W
ater
(ft
.)
OPTI Well 625 HydrographWSE & Depth-to-Water GSE
WSE Min = 3590 ft. WSE Max = 3611 ft. Well Depth = 250 ft.

020406080100120140160180200220240260280300320340360380400420440460480500520540560580600620640660680700720740
19
59
19
60
19
63
19
64
19
67
19
68
19
71
19
72
19
75
19
76
19
79
19
80
19
83
19
84
19
87
19
88
19
91
19
92
19
95
19
96
19
99
20
00
20
03
20
04
20
07
20
08
20
11
20
12
20
15
20
16
20
19
292529452965298530053025304530653085310531253145316531853205322532453265328533053325334533653385340534253445346534853505352535453565358536053625364536653685
Elev
atio
n (
ft.)
Year
Dep
th t
o W
ater
(ft
.)
OPTI Well 626 HydrographWSE & Depth-to-Water GSE
WSE Min = 3636 ft. WSE Max = 3652 ft. Well Depth = 120 ft.

020406080100120140160180200220240260280300320340360380400420440460480500520540560580600620640660680700720740
19
59
19
60
19
63
19
64
19
67
19
68
19
71
19
72
19
75
19
76
19
79
19
80
19
83
19
84
19
87
19
88
19
91
19
92
19
95
19
96
19
99
20
00
20
03
20
04
20
07
20
08
20
11
20
12
20
15
20
16
20
19
152915491569158916091629164916691689170917291749176917891809182918491869188919091929194919691989200920292049206920892109212921492169218922092229224922692289
Elev
atio
n (
ft.)
Year
Dep
th t
o W
ater
(ft
.)
OPTI Well 627 HydrographWSE & Depth-to-Water GSE
WSE Min = 1730 ft. WSE Max = 2076 ft. Well Depth = 960 ft.

020406080100120140160180200220240260280300320340360380400420440460480500520540560580600620640660680700720740
19
59
19
60
19
63
19
64
19
67
19
68
19
71
19
72
19
75
19
76
19
79
19
80
19
83
19
84
19
87
19
88
19
91
19
92
19
95
19
96
19
99
20
00
20
03
20
04
20
07
20
08
20
11
20
12
20
15
20
16
20
19
163816581678169817181738175817781798181818381858187818981918193819581978199820182038205820782098211821382158217821982218223822582278229823182338235823782398
Elev
atio
n (
ft.)
Year
Dep
th t
o W
ater
(ft
.)
OPTI Well 628 HydrographWSE & Depth-to-Water GSE
WSE Min = 1792 ft. WSE Max = 2078 ft. Well Depth = 941 ft.

020406080100120140160180200220240260280300320340360380400420440460480500520540560580600620640660680700720740
19
59
19
60
19
63
19
64
19
67
19
68
19
71
19
72
19
75
19
76
19
79
19
80
19
83
19
84
19
87
19
88
19
91
19
92
19
95
19
96
19
99
20
00
20
03
20
04
20
07
20
08
20
11
20
12
20
15
20
16
20
19
162916491669168917091729174917691789180918291849186918891909192919491969198920092029204920692089210921292149216921892209222922492269228923092329234923692389
Elev
atio
n (
ft.)
Year
Dep
th t
o W
ater
(ft
.)
OPTI Well 629 HydrographWSE & Depth-to-Water GSE
WSE Min = 1826 ft. WSE Max = 1970 ft. Well Depth = 1000 ft.

020406080100120140160180200220240260280300320340360380400420440460480500520540560580600620640660680700720740
19
59
19
60
19
63
19
64
19
67
19
68
19
71
19
72
19
75
19
76
19
79
19
80
19
83
19
84
19
87
19
88
19
91
19
92
19
95
19
96
19
99
20
00
20
03
20
04
20
07
20
08
20
11
20
12
20
15
20
16
20
19
162116411661168117011721174117611781180118211841186118811901192119411961198120012021204120612081210121212141216121812201222122412261228123012321234123612381
Elev
atio
n (
ft.)
Year
Dep
th t
o W
ater
(ft
.)
OPTI Well 630 HydrographWSE & Depth-to-Water GSE
WSE Min = 1823 ft. WSE Max = 1987 ft. Well Depth = 900 ft.

020406080100120140160180200220240260280300320340360380400420440460480500520540560580600620640660680700720740
19
59
19
60
19
63
19
64
19
67
19
68
19
71
19
72
19
75
19
76
19
79
19
80
19
83
19
84
19
87
19
88
19
91
19
92
19
95
19
96
19
99
20
00
20
03
20
04
20
07
20
08
20
11
20
12
20
15
20
16
20
19
161716371657167716971717173717571777179718171837185718771897191719371957197719972017203720572077209721172137215721772197221722372257227722972317233723572377
Elev
atio
n (
ft.)
Year
Dep
th t
o W
ater
(ft
.)
OPTI Well 631 HydrographWSE & Depth-to-Water GSE
WSE Min = 1830 ft. WSE Max = 2033 ft. Well Depth = 960 ft.

020406080100120140160180200220240260280300320340360380400420440460480500520540560580600620640660680700720740
19
59
19
60
19
63
19
64
19
67
19
68
19
71
19
72
19
75
19
76
19
79
19
80
19
83
19
84
19
87
19
88
19
91
19
92
19
95
19
96
19
99
20
00
20
03
20
04
20
07
20
08
20
11
20
12
20
15
20
16
20
19
161116311651167116911711173117511771179118111831185118711891191119311951197119912011203120512071209121112131215121712191221122312251227122912311233123512371
Elev
atio
n (
ft.)
Year
Dep
th t
o W
ater
(ft
.)
OPTI Well 632 HydrographWSE & Depth-to-Water GSE
WSE Min = 1837 ft. WSE Max = 2252 ft. Well Depth = 960 ft.

020406080100120140160180200220240260280300320340360380400420440460480500520540560580600620640660680700720740
19
59
19
60
19
63
19
64
19
67
19
68
19
71
19
72
19
75
19
76
19
79
19
80
19
83
19
84
19
87
19
88
19
91
19
92
19
95
19
96
19
99
20
00
20
03
20
04
20
07
20
08
20
11
20
12
20
15
20
16
20
19
161416341654167416941714173417541774179418141834185418741894191419341954197419942014203420542074209421142134215421742194221422342254227422942314233423542374
Elev
atio
n (
ft.)
Year
Dep
th t
o W
ater
(ft
.)
OPTI Well 633 HydrographWSE & Depth-to-Water GSE
WSE Min = 1813 ft. WSE Max = 1958 ft. Well Depth = 1000 ft.

020406080100120140160180200220240260280300320340360380400420440460480500520540560580600620640660680700720740
19
59
19
60
19
63
19
64
19
67
19
68
19
71
19
72
19
75
19
76
19
79
19
80
19
83
19
84
19
87
19
88
19
91
19
92
19
95
19
96
19
99
20
00
20
03
20
04
20
07
20
08
20
11
20
12
20
15
20
16
20
19
174817681788180818281848186818881908192819481968198820082028204820682088210821282148216821882208222822482268228823082328234823682388240824282448246824882508
Elev
atio
n (
ft.)
Year
Dep
th t
o W
ater
(ft
.)
OPTI Well 634 HydrographWSE & Depth-to-Water GSE
WSE Min = 1873 ft. WSE Max = 1990 ft. Well Depth = 673 ft.

020406080100120140160180200220240260280300320340360380400420440460480500520540560580600620640660680700720740
19
59
19
60
19
63
19
64
19
67
19
68
19
71
19
72
19
75
19
76
19
79
19
80
19
83
19
84
19
87
19
88
19
91
19
92
19
95
19
96
19
99
20
00
20
03
20
04
20
07
20
08
20
11
20
12
20
15
20
16
20
19
160616261646166616861706172617461766178618061826184618661886190619261946196619862006202620462066208621062126214621662186220622262246226622862306232623462366
Elev
atio
n (
ft.)
Year
Dep
th t
o W
ater
(ft
.)
OPTI Well 635 HydrographWSE & Depth-to-Water GSE
WSE Min = 1841 ft. WSE Max = 1949 ft. Well Depth = 1050 ft.

020406080100120140160180200220240260280300320340360380400420440460480500520540560580600620640660680700720740
19
59
19
60
19
63
19
64
19
67
19
68
19
71
19
72
19
75
19
76
19
79
19
80
19
83
19
84
19
87
19
88
19
91
19
92
19
95
19
96
19
99
20
00
20
03
20
04
20
07
20
08
20
11
20
12
20
15
20
16
20
19
159816181638165816781698171817381758177817981818183818581878189819181938195819781998201820382058207820982118213821582178219822182238225822782298231823382358
Elev
atio
n (
ft.)
Year
Dep
th t
o W
ater
(ft
.)
OPTI Well 636 HydrographWSE & Depth-to-Water GSE
WSE Min = 1838 ft. WSE Max = 2040 ft. Well Depth = 924 ft.

020406080100120140160180200220240260280300320340360380400420440460480500520540560580600620640660680700720740
19
59
19
60
19
63
19
64
19
67
19
68
19
71
19
72
19
75
19
76
19
79
19
80
19
83
19
84
19
87
19
88
19
91
19
92
19
95
19
96
19
99
20
00
20
03
20
04
20
07
20
08
20
11
20
12
20
15
20
16
20
19
136013801400142014401460148015001520154015601580160016201640166016801700172017401760178018001820184018601880190019201940196019802000202020402060208021002120
Elev
atio
n (
ft.)
Year
Dep
th t
o W
ater
(ft
.)
OPTI Well 637 HydrographWSE & Depth-to-Water GSE
WSE Min = 1703 ft. WSE Max = 1841 ft. Well Depth = 980 ft.

020406080100120140160180200220240260280300320340360380400420440460480500520540560580600620640660680700720740
19
59
19
60
19
63
19
64
19
67
19
68
19
71
19
72
19
75
19
76
19
79
19
80
19
83
19
84
19
87
19
88
19
91
19
92
19
95
19
96
19
99
20
00
20
03
20
04
20
07
20
08
20
11
20
12
20
15
20
16
20
19
168717071727174717671787180718271847186718871907192719471967198720072027204720672087210721272147216721872207222722472267228723072327234723672387240724272447
Elev
atio
n (
ft.)
Year
Dep
th t
o W
ater
(ft
.)
OPTI Well 638 HydrographWSE & Depth-to-Water GSE
WSE Min = 1833 ft. WSE Max = 1929 ft. Well Depth = 1006 ft.

020406080100120140160180200220240260280300320340360380400420440460480500520540560580600620640660680700720740
19
59
19
60
19
63
19
64
19
67
19
68
19
71
19
72
19
75
19
76
19
79
19
80
19
83
19
84
19
87
19
88
19
91
19
92
19
95
19
96
19
99
20
00
20
03
20
04
20
07
20
08
20
11
20
12
20
15
20
16
20
19
185918791899191919391959197919992019203920592079209921192139215921792199221922392259227922992319233923592379239924192439245924792499251925392559257925992619
Elev
atio
n (
ft.)
Year
Dep
th t
o W
ater
(ft
.)
OPTI Well 639 HydrographWSE & Depth-to-Water GSE
WSE Min = 1894 ft. WSE Max = 2068 ft. Well Depth = 776 ft.

020406080100120140160180200220240260280300320340360380400420440460480500520540560580600620640660680700720740
19
59
19
60
19
63
19
64
19
67
19
68
19
71
19
72
19
75
19
76
19
79
19
80
19
83
19
84
19
87
19
88
19
91
19
92
19
95
19
96
19
99
20
00
20
03
20
04
20
07
20
08
20
11
20
12
20
15
20
16
20
19
148915091529154915691589160916291649166916891709172917491769178918091829184918691889190919291949196919892009202920492069208921092129214921692189220922292249
Elev
atio
n (
ft.)
Year
Dep
th t
o W
ater
(ft
.)
OPTI Well 640 HydrographWSE & Depth-to-Water GSE
WSE Min = 1708 ft. WSE Max = 1897 ft. Well Depth = 840 ft.

020406080100120140160180200220240260280300320340360380400420440460480500520540560580600620640660680700720740
19
59
19
60
19
63
19
64
19
67
19
68
19
71
19
72
19
75
19
76
19
79
19
80
19
83
19
84
19
87
19
88
19
91
19
92
19
95
19
96
19
99
20
00
20
03
20
04
20
07
20
08
20
11
20
12
20
15
20
16
20
19
145414741494151415341554157415941614163416541674169417141734175417741794181418341854187418941914193419541974199420142034205420742094211421342154217421942214
Elev
atio
n (
ft.)
Year
Dep
th t
o W
ater
(ft
.)
OPTI Well 641 HydrographWSE & Depth-to-Water GSE
WSE Min = 1762 ft. WSE Max = 1864 ft. Well Depth = 800 ft.
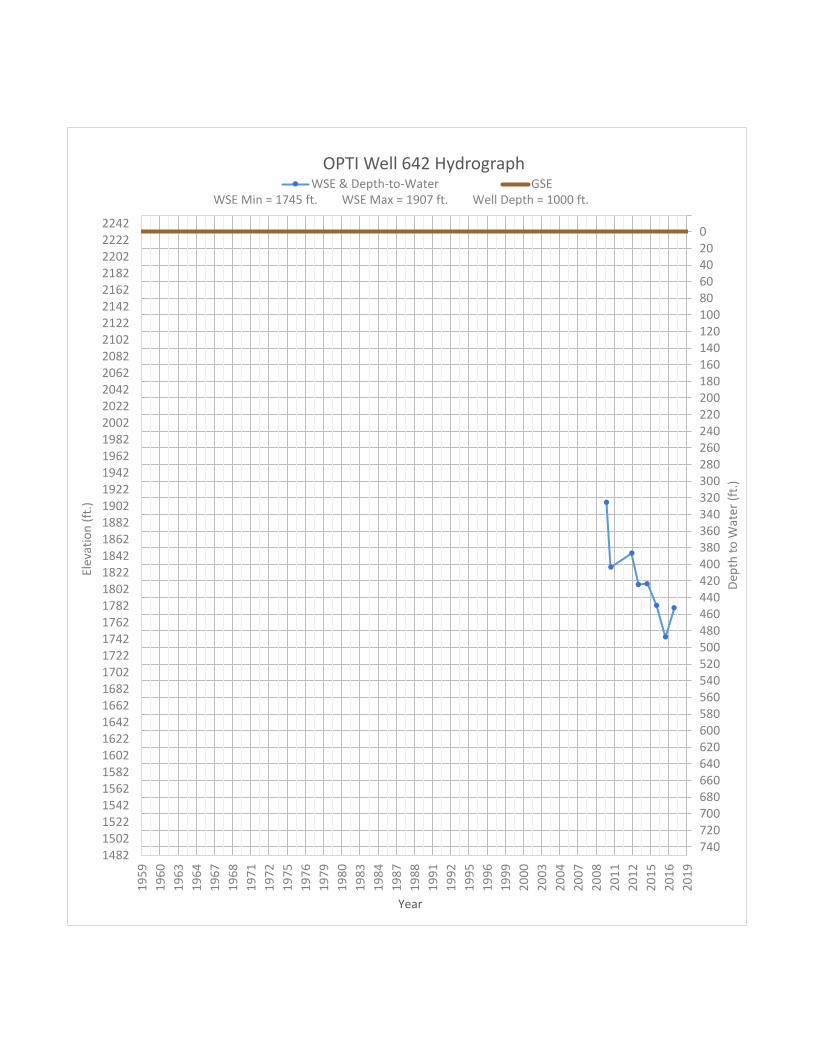
020406080100120140160180200220240260280300320340360380400420440460480500520540560580600620640660680700720740
19
59
19
60
19
63
19
64
19
67
19
68
19
71
19
72
19
75
19
76
19
79
19
80
19
83
19
84
19
87
19
88
19
91
19
92
19
95
19
96
19
99
20
00
20
03
20
04
20
07
20
08
20
11
20
12
20
15
20
16
20
19
148215021522154215621582160216221642166216821702172217421762178218021822184218621882190219221942196219822002202220422062208221022122214221622182220222222242
Elev
atio
n (
ft.)
Year
Dep
th t
o W
ater
(ft
.)
OPTI Well 642 HydrographWSE & Depth-to-Water GSE
WSE Min = 1745 ft. WSE Max = 1907 ft. Well Depth = 1000 ft.

020406080100120140160180200220240260280300320340360380400420440460480500520540560580600620640660680700720740
19
59
19
60
19
63
19
64
19
67
19
68
19
71
19
72
19
75
19
76
19
79
19
80
19
83
19
84
19
87
19
88
19
91
19
92
19
95
19
96
19
99
20
00
20
03
20
04
20
07
20
08
20
11
20
12
20
15
20
16
20
19
139314131433145314731493151315331553157315931613163316531673169317131733175317731793181318331853187318931913193319531973199320132033205320732093211321332153
Elev
atio
n (
ft.)
Year
Dep
th t
o W
ater
(ft
.)
OPTI Well 644 HydrographWSE & Depth-to-Water GSE
WSE Min = 1591 ft. WSE Max = 1673 ft. Well Depth = 950 ft.
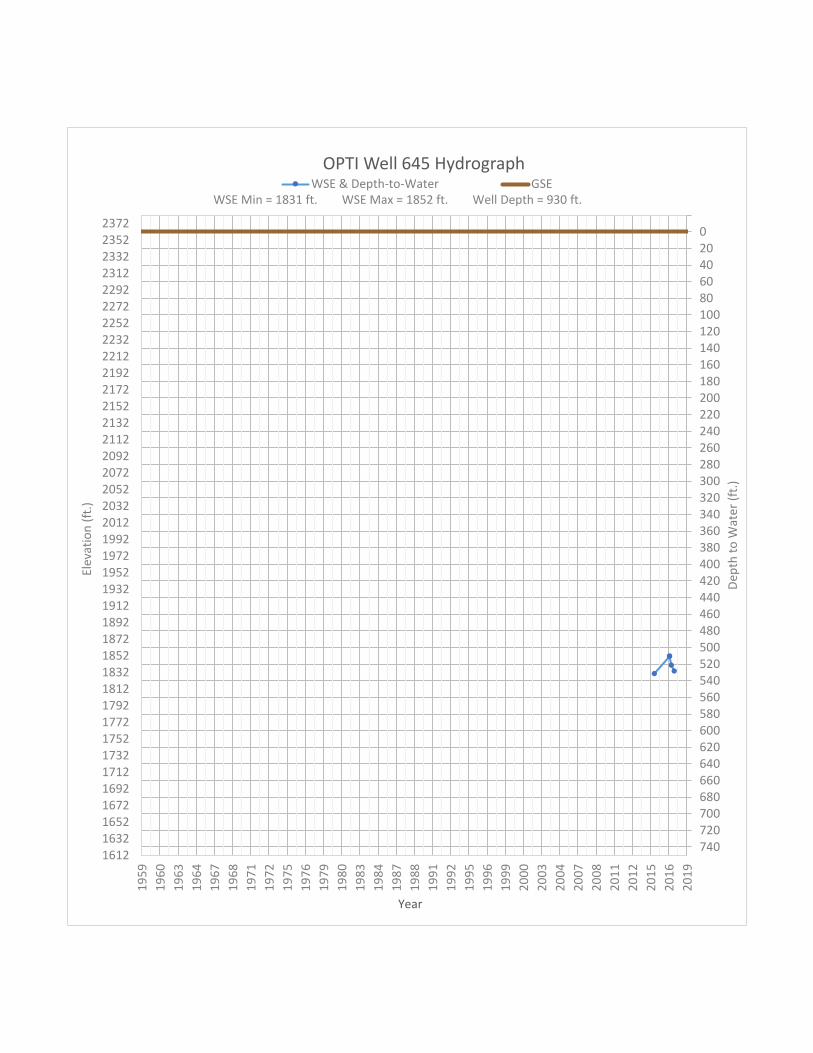
020406080100120140160180200220240260280300320340360380400420440460480500520540560580600620640660680700720740
19
59
19
60
19
63
19
64
19
67
19
68
19
71
19
72
19
75
19
76
19
79
19
80
19
83
19
84
19
87
19
88
19
91
19
92
19
95
19
96
19
99
20
00
20
03
20
04
20
07
20
08
20
11
20
12
20
15
20
16
20
19
161216321652167216921712173217521772179218121832185218721892191219321952197219922012203220522072209221122132215221722192221222322252227222922312233223522372
Elev
atio
n (
ft.)
Year
Dep
th t
o W
ater
(ft
.)
OPTI Well 645 HydrographWSE & Depth-to-Water GSE
WSE Min = 1831 ft. WSE Max = 1852 ft. Well Depth = 930 ft.

020406080100120140160180200220240260280300320340360380400420440460480500520540560580600620640660680700720740
19
59
19
60
19
63
19
64
19
67
19
68
19
71
19
72
19
75
19
76
19
79
19
80
19
83
19
84
19
87
19
88
19
91
19
92
19
95
19
96
19
99
20
00
20
03
20
04
20
07
20
08
20
11
20
12
20
15
20
16
20
19
143814581478149815181538155815781598161816381658167816981718173817581778179818181838185818781898191819381958197819982018203820582078209821182138215821782198
Elev
atio
n (
ft.)
Year
Dep
th t
o W
ater
(ft
.)
OPTI Well 646 HydrographWSE & Depth-to-Water GSE
WSE Min = 1737 ft. WSE Max = 1819 ft. Well Depth = 900 ft.

020406080100120140160180200220240260280300320340360380400420440460480500520540560580600620640660680700720740
19
59
19
60
19
63
19
64
19
67
19
68
19
71
19
72
19
75
19
76
19
79
19
80
19
83
19
84
19
87
19
88
19
91
19
92
19
95
19
96
19
99
20
00
20
03
20
04
20
07
20
08
20
11
20
12
20
15
20
16
20
19
162616461666168617061726174617661786180618261846186618861906192619461966198620062026204620662086210621262146216621862206222622462266228623062326234623662386
Elev
atio
n (
ft.)
Year
Dep
th t
o W
ater
(ft
.)
OPTI Well 651 HydrographWSE & Depth-to-Water GSE
WSE Min = 1867 ft. WSE Max = 1998 ft. Well Depth = 1113 ft.

020406080100120140160180200220240260280300320340360380400420440460480500520540560580600620640660680700720740
19
59
19
60
19
63
19
64
19
67
19
68
19
71
19
72
19
75
19
76
19
79
19
80
19
83
19
84
19
87
19
88
19
91
19
92
19
95
19
96
19
99
20
00
20
03
20
04
20
07
20
08
20
11
20
12
20
15
20
16
20
19
167816981718173817581778179818181838185818781898191819381958197819982018203820582078209821182138215821782198221822382258227822982318233823582378239824182438
Elev
atio
n (
ft.)
Year
Dep
th t
o W
ater
(ft
.)
OPTI Well 653 HydrographWSE & Depth-to-Water GSE
WSE Min = 1896 ft. WSE Max = 1976 ft. Well Depth = 1002 ft.

020406080100120140160180200220240260280300320340360380400420440460480500520540560580600620640660680700720740
19
59
19
60
19
63
19
64
19
67
19
68
19
71
19
72
19
75
19
76
19
79
19
80
19
83
19
84
19
87
19
88
19
91
19
92
19
95
19
96
19
99
20
00
20
03
20
04
20
07
20
08
20
11
20
12
20
15
20
16
20
19
164416641684170417241744176417841804182418441864188419041924194419641984200420242044206420842104212421442164218422042224224422642284230423242344236423842404
Elev
atio
n (
ft.)
Year
Dep
th t
o W
ater
(ft
.)
OPTI Well 654 HydrographWSE & Depth-to-Water GSE
WSE Min = 1836 ft. WSE Max = 1964 ft. Well Depth = 1006 ft.

020406080100120140160180200220240260280300320340360380400420440460480500520540560580600620640660680700720740
19
59
19
60
19
63
19
64
19
67
19
68
19
71
19
72
19
75
19
76
19
79
19
80
19
83
19
84
19
87
19
88
19
91
19
92
19
95
19
96
19
99
20
00
20
03
20
04
20
07
20
08
20
11
20
12
20
15
20
16
20
19
165916791699171917391759177917991819183918591879189919191939195919791999201920392059207920992119213921592179219922192239225922792299231923392359237923992419
Elev
atio
n (
ft.)
Year
Dep
th t
o W
ater
(ft
.)
OPTI Well 655 HydrographWSE & Depth-to-Water GSE
WSE Min = 1900 ft. WSE Max = 1975 ft. Well Depth = 629 ft.

020406080100120140160180200220240260280300320340360380400420440460480500520540560580600620640660680700720740
19
59
19
60
19
63
19
64
19
67
19
68
19
71
19
72
19
75
19
76
19
79
19
80
19
83
19
84
19
87
19
88
19
91
19
92
19
95
19
96
19
99
20
00
20
03
20
04
20
07
20
08
20
11
20
12
20
15
20
16
20
19
166916891709172917491769178918091829184918691889190919291949196919892009202920492069208921092129214921692189220922292249226922892309232923492369238924092429
Elev
atio
n (
ft.)
Year
Dep
th t
o W
ater
(ft
.)
OPTI Well 656 HydrographWSE & Depth-to-Water GSE
WSE Min = 1916 ft. WSE Max = 1979 ft. Well Depth = 930 ft.

020406080100120140160180200220240260280300320340360380400420440460480500520540560580600620640660680700720740
19
59
19
60
19
63
19
64
19
67
19
68
19
71
19
72
19
75
19
76
19
79
19
80
19
83
19
84
19
87
19
88
19
91
19
92
19
95
19
96
19
99
20
00
20
03
20
04
20
07
20
08
20
11
20
12
20
15
20
16
20
19
159516151635165516751695171517351755177517951815183518551875189519151935195519751995201520352055207520952115213521552175219522152235225522752295231523352355
Elev
atio
n (
ft.)
Year
Dep
th t
o W
ater
(ft
.)
OPTI Well 657 HydrographWSE & Depth-to-Water GSE
WSE Min = 1804 ft. WSE Max = 2000 ft. Well Depth = 932 ft.

020406080100120140160180200220240260280300320340360380400420440460480500520540560580600620640660680700720740
19
59
19
60
19
63
19
64
19
67
19
68
19
71
19
72
19
75
19
76
19
79
19
80
19
83
19
84
19
87
19
88
19
91
19
92
19
95
19
96
19
99
20
00
20
03
20
04
20
07
20
08
20
11
20
12
20
15
20
16
20
19
174017601780180018201840186018801900192019401960198020002020204020602080210021202140216021802200222022402260228023002320234023602380240024202440246024802500
Elev
atio
n (
ft.)
Year
Dep
th t
o W
ater
(ft
.)
OPTI Well 659 HydrographWSE & Depth-to-Water GSE
WSE Min = 1861 ft. WSE Max = 1962 ft. Well Depth = 869 ft.

020406080100120140160180200220240260280300320340360380400420440460480500520540560580600620640660680700720740
19
59
19
60
19
63
19
64
19
67
19
68
19
71
19
72
19
75
19
76
19
79
19
80
19
83
19
84
19
87
19
88
19
91
19
92
19
95
19
96
19
99
20
00
20
03
20
04
20
07
20
08
20
11
20
12
20
15
20
16
20
19
174217621782180218221842186218821902192219421962198220022022204220622082210221222142216221822202222222422262228223022322234223622382240224222442246224822502
Elev
atio
n (
ft.)
Year
Dep
th t
o W
ater
(ft
.)
OPTI Well 660 HydrographWSE & Depth-to-Water GSE
WSE Min = 1871 ft. WSE Max = 2072 ft. Well Depth = 976 ft.

020406080100120140160180200220240260280300320340360380400420440460480500520540560580600620640660680700720740
19
59
19
60
19
63
19
64
19
67
19
68
19
71
19
72
19
75
19
76
19
79
19
80
19
83
19
84
19
87
19
88
19
91
19
92
19
95
19
96
19
99
20
00
20
03
20
04
20
07
20
08
20
11
20
12
20
15
20
16
20
19
169417141734175417741794181418341854187418941914193419541974199420142034205420742094211421342154217421942214223422542274229423142334235423742394241424342454
Elev
atio
n (
ft.)
Year
Dep
th t
o W
ater
(ft
.)
OPTI Well 661 HydrographWSE & Depth-to-Water GSE
WSE Min = 1875 ft. WSE Max = 2002 ft. Well Depth = 1000 ft.

020406080100120140160180200220240260280300320340360380400420440460480500520540560580600620640660680700720740
19
59
19
60
19
63
19
64
19
67
19
68
19
71
19
72
19
75
19
76
19
79
19
80
19
83
19
84
19
87
19
88
19
91
19
92
19
95
19
96
19
99
20
00
20
03
20
04
20
07
20
08
20
11
20
12
20
15
20
16
20
19
163016501670169017101730175017701790181018301850187018901910193019501970199020102030205020702090211021302150217021902210223022502270229023102330235023702390
Elev
atio
n (
ft.)
Year
Dep
th t
o W
ater
(ft
.)
OPTI Well 662 HydrographWSE & Depth-to-Water GSE
WSE Min = 1828 ft. WSE Max = 1941 ft. Well Depth = 740 ft.

020406080100120140160180200220240260280300320340360380400420440460480500520540560580600620640660680700720740
19
59
19
60
19
63
19
64
19
67
19
68
19
71
19
72
19
75
19
76
19
79
19
80
19
83
19
84
19
87
19
88
19
91
19
92
19
95
19
96
19
99
20
00
20
03
20
04
20
07
20
08
20
11
20
12
20
15
20
16
20
19
164316631683170317231743176317831803182318431863188319031923194319631983200320232043206320832103212321432163218322032223224322632283230323232343236323832403
Elev
atio
n (
ft.)
Year
Dep
th t
o W
ater
(ft
.)
OPTI Well 663 HydrographWSE & Depth-to-Water GSE
WSE Min = 1855 ft. WSE Max = 1958 ft. Well Depth = 0 ft.

020406080100120140160180200220240260280300320340360380400420440460480500520540560580600620640660680700720740
19
59
19
60
19
63
19
64
19
67
19
68
19
71
19
72
19
75
19
76
19
79
19
80
19
83
19
84
19
87
19
88
19
91
19
92
19
95
19
96
19
99
20
00
20
03
20
04
20
07
20
08
20
11
20
12
20
15
20
16
20
19
164016601680170017201740176017801800182018401860188019001920194019601980200020202040206020802100212021402160218022002220224022602280230023202340236023802400
Elev
atio
n (
ft.)
Year
Dep
th t
o W
ater
(ft
.)
OPTI Well 664 HydrographWSE & Depth-to-Water GSE
WSE Min = 1873 ft. WSE Max = 1873 ft. Well Depth = 572 ft.

020406080100120140160180200220240260280300320340360380400420440460480500520540560580600620640660680700720740
19
59
19
60
19
63
19
64
19
67
19
68
19
71
19
72
19
75
19
76
19
79
19
80
19
83
19
84
19
87
19
88
19
91
19
92
19
95
19
96
19
99
20
00
20
03
20
04
20
07
20
08
20
11
20
12
20
15
20
16
20
19
161116311651167116911711173117511771179118111831185118711891191119311951197119912011203120512071209121112131215121712191221122312251227122912311233123512371
Elev
atio
n (
ft.)
Year
Dep
th t
o W
ater
(ft
.)
OPTI Well 665 HydrographWSE & Depth-to-Water GSE
WSE Min = 1821 ft. WSE Max = 1975 ft. Well Depth = 1200 ft.

020406080100120140160180200220240260280300320340360380400420440460480500520540560580600620640660680700720740
19
59
19
60
19
63
19
64
19
67
19
68
19
71
19
72
19
75
19
76
19
79
19
80
19
83
19
84
19
87
19
88
19
91
19
92
19
95
19
96
19
99
20
00
20
03
20
04
20
07
20
08
20
11
20
12
20
15
20
16
20
19
158416041624164416641684170417241744176417841804182418441864188419041924194419641984200420242044206420842104212421442164218422042224224422642284230423242344
Elev
atio
n (
ft.)
Year
Dep
th t
o W
ater
(ft
.)
OPTI Well 666 HydrographWSE & Depth-to-Water GSE
WSE Min = 1910 ft. WSE Max = 1972 ft. Well Depth = 1157 ft.

020406080100120140160180200220240260280300320340360380400420440460480500520540560580600620640660680700720740
19
59
19
60
19
63
19
64
19
67
19
68
19
71
19
72
19
75
19
76
19
79
19
80
19
83
19
84
19
87
19
88
19
91
19
92
19
95
19
96
19
99
20
00
20
03
20
04
20
07
20
08
20
11
20
12
20
15
20
16
20
19
156615861606162616461666168617061726174617661786180618261846186618861906192619461966198620062026204620662086210621262146216621862206222622462266228623062326
Elev
atio
n (
ft.)
Year
Dep
th t
o W
ater
(ft
.)
OPTI Well 667 HydrographWSE & Depth-to-Water GSE
WSE Min = 1829 ft. WSE Max = 2219 ft. Well Depth = 1083 ft.

020406080100120140160180200220240260280300320340360380400420440460480500520540560580600620640660680700720740
19
59
19
60
19
63
19
64
19
67
19
68
19
71
19
72
19
75
19
76
19
79
19
80
19
83
19
84
19
87
19
88
19
91
19
92
19
95
19
96
19
99
20
00
20
03
20
04
20
07
20
08
20
11
20
12
20
15
20
16
20
19
156315831603162316431663168317031723174317631783180318231843186318831903192319431963198320032023204320632083210321232143216321832203222322432263228323032323
Elev
atio
n (
ft.)
Year
Dep
th t
o W
ater
(ft
.)
OPTI Well 668 HydrographWSE & Depth-to-Water GSE
WSE Min = 1764 ft. WSE Max = 1925 ft. Well Depth = 1002 ft.

020406080100120140160180200220240260280300320340360380400420440460480500520540560580600620640660680700720740
19
59
19
60
19
63
19
64
19
67
19
68
19
71
19
72
19
75
19
76
19
79
19
80
19
83
19
84
19
87
19
88
19
91
19
92
19
95
19
96
19
99
20
00
20
03
20
04
20
07
20
08
20
11
20
12
20
15
20
16
20
19
156315831603162316431663168317031723174317631783180318231843186318831903192319431963198320032023204320632083210321232143216321832203222322432263228323032323
Elev
atio
n (
ft.)
Year
Dep
th t
o W
ater
(ft
.)
OPTI Well 669 HydrographWSE & Depth-to-Water GSE
WSE Min = 1881 ft. WSE Max = 1961 ft. Well Depth = 1000 ft.

020406080100120140160180200220240260280300320340360380400420440460480500520540560580600620640660680700720740
19
59
19
60
19
63
19
64
19
67
19
68
19
71
19
72
19
75
19
76
19
79
19
80
19
83
19
84
19
87
19
88
19
91
19
92
19
95
19
96
19
99
20
00
20
03
20
04
20
07
20
08
20
11
20
12
20
15
20
16
20
19
159816181638165816781698171817381758177817981818183818581878189819181938195819781998201820382058207820982118213821582178219822182238225822782298231823382358
Elev
atio
n (
ft.)
Year
Dep
th t
o W
ater
(ft
.)
OPTI Well 670 HydrographWSE & Depth-to-Water GSE
WSE Min = 1673 ft. WSE Max = 1934 ft. Well Depth = 1000 ft.

020406080100120140160180200220240260280300320340360380400420440460480500520540560580600620640660680700720740
19
59
19
60
19
63
19
64
19
67
19
68
19
71
19
72
19
75
19
76
19
79
19
80
19
83
19
84
19
87
19
88
19
91
19
92
19
95
19
96
19
99
20
00
20
03
20
04
20
07
20
08
20
11
20
12
20
15
20
16
20
19
152915491569158916091629164916691689170917291749176917891809182918491869188919091929194919691989200920292049206920892109212921492169218922092229224922692289
Elev
atio
n (
ft.)
Year
Dep
th t
o W
ater
(ft
.)
OPTI Well 671 HydrographWSE & Depth-to-Water GSE
WSE Min = 1852 ft. WSE Max = 1992 ft. Well Depth = 1002 ft.

020406080100120140160180200220240260280300320340360380400420440460480500520540560580600620640660680700720740
19
59
19
60
19
63
19
64
19
67
19
68
19
71
19
72
19
75
19
76
19
79
19
80
19
83
19
84
19
87
19
88
19
91
19
92
19
95
19
96
19
99
20
00
20
03
20
04
20
07
20
08
20
11
20
12
20
15
20
16
20
19
154215621582160216221642166216821702172217421762178218021822184218621882190219221942196219822002202220422062208221022122214221622182220222222242226222822302
Elev
atio
n (
ft.)
Year
Dep
th t
o W
ater
(ft
.)
OPTI Well 672 HydrographWSE & Depth-to-Water GSE
WSE Min = 1845 ft. WSE Max = 1914 ft. Well Depth = 998 ft.

020406080100120140160180200220240260280300320340360380400420440460480500520540560580600620640660680700720740
19
59
19
60
19
63
19
64
19
67
19
68
19
71
19
72
19
75
19
76
19
79
19
80
19
83
19
84
19
87
19
88
19
91
19
92
19
95
19
96
19
99
20
00
20
03
20
04
20
07
20
08
20
11
20
12
20
15
20
16
20
19
153615561576159616161636165616761696171617361756177617961816183618561876189619161936195619761996201620362056207620962116213621562176219622162236225622762296
Elev
atio
n (
ft.)
Year
Dep
th t
o W
ater
(ft
.)
OPTI Well 673 HydrographWSE & Depth-to-Water GSE
WSE Min = 1852 ft. WSE Max = 1939 ft. Well Depth = 1180 ft.

020406080100120140160180200220240260280300320340360380400420440460480500520540560580600620640660680700720740
19
59
19
60
19
63
19
64
19
67
19
68
19
71
19
72
19
75
19
76
19
79
19
80
19
83
19
84
19
87
19
88
19
91
19
92
19
95
19
96
19
99
20
00
20
03
20
04
20
07
20
08
20
11
20
12
20
15
20
16
20
19
152915491569158916091629164916691689170917291749176917891809182918491869188919091929194919691989200920292049206920892109212921492169218922092229224922692289
Elev
atio
n (
ft.)
Year
Dep
th t
o W
ater
(ft
.)
OPTI Well 674 HydrographWSE & Depth-to-Water GSE
WSE Min = 1809 ft. WSE Max = 1960 ft. Well Depth = 1100 ft.

020406080100120140160180200220240260280300320340360380400420440460480500520540560580600620640660680700720740
19
59
19
60
19
63
19
64
19
67
19
68
19
71
19
72
19
75
19
76
19
79
19
80
19
83
19
84
19
87
19
88
19
91
19
92
19
95
19
96
19
99
20
00
20
03
20
04
20
07
20
08
20
11
20
12
20
15
20
16
20
19
154915691589160916291649166916891709172917491769178918091829184918691889190919291949196919892009202920492069208921092129214921692189220922292249226922892309
Elev
atio
n (
ft.)
Year
Dep
th t
o W
ater
(ft
.)
OPTI Well 675 HydrographWSE & Depth-to-Water GSE
WSE Min = 1859 ft. WSE Max = 1951 ft. Well Depth = 1203 ft.

020406080100120140160180200220240260280300320340360380400420440460480500520540560580600620640660680700720740
19
59
19
60
19
63
19
64
19
67
19
68
19
71
19
72
19
75
19
76
19
79
19
80
19
83
19
84
19
87
19
88
19
91
19
92
19
95
19
96
19
99
20
00
20
03
20
04
20
07
20
08
20
11
20
12
20
15
20
16
20
19
155215721592161216321652167216921712173217521772179218121832185218721892191219321952197219922012203220522072209221122132215221722192221222322252227222922312
Elev
atio
n (
ft.)
Year
Dep
th t
o W
ater
(ft
.)
OPTI Well 676 HydrographWSE & Depth-to-Water GSE
WSE Min = 1740 ft. WSE Max = 1960 ft. Well Depth = 735 ft.

020406080100120140160180200220240260280300320340360380400420440460480500520540560580600620640660680700720740
19
59
19
60
19
63
19
64
19
67
19
68
19
71
19
72
19
75
19
76
19
79
19
80
19
83
19
84
19
87
19
88
19
91
19
92
19
95
19
96
19
99
20
00
20
03
20
04
20
07
20
08
20
11
20
12
20
15
20
16
20
19
154915691589160916291649166916891709172917491769178918091829184918691889190919291949196919892009202920492069208921092129214921692189220922292249226922892309
Elev
atio
n (
ft.)
Year
Dep
th t
o W
ater
(ft
.)
OPTI Well 677 HydrographWSE & Depth-to-Water GSE
WSE Min = 1890 ft. WSE Max = 1949 ft. Well Depth = 941 ft.

020406080100120140160180200220240260280300320340360380400420440460480500520540560580600620640660680700720740
19
59
19
60
19
63
19
64
19
67
19
68
19
71
19
72
19
75
19
76
19
79
19
80
19
83
19
84
19
87
19
88
19
91
19
92
19
95
19
96
19
99
20
00
20
03
20
04
20
07
20
08
20
11
20
12
20
15
20
16
20
19
161916391659167916991719173917591779179918191839185918791899191919391959197919992019203920592079209921192139215921792199221922392259227922992319233923592379
Elev
atio
n (
ft.)
Year
Dep
th t
o W
ater
(ft
.)
OPTI Well 678 HydrographWSE & Depth-to-Water GSE
WSE Min = 1881 ft. WSE Max = 2167 ft. Well Depth = 881 ft.

020406080100120140160180200220240260280300320340360380400420440460480500520540560580600620640660680700720740
19
59
19
60
19
63
19
64
19
67
19
68
19
71
19
72
19
75
19
76
19
79
19
80
19
83
19
84
19
87
19
88
19
91
19
92
19
95
19
96
19
99
20
00
20
03
20
04
20
07
20
08
20
11
20
12
20
15
20
16
20
19
161716371657167716971717173717571777179718171837185718771897191719371957197719972017203720572077209721172137215721772197221722372257227722972317233723572377
Elev
atio
n (
ft.)
Year
Dep
th t
o W
ater
(ft
.)
OPTI Well 679 HydrographWSE & Depth-to-Water GSE
WSE Min = 1824 ft. WSE Max = 1960 ft. Well Depth = 1018 ft.

020406080100120140160180200220240260280300320340360380400420440460480500520540560580600620640660680700720740
19
59
19
60
19
63
19
64
19
67
19
68
19
71
19
72
19
75
19
76
19
79
19
80
19
83
19
84
19
87
19
88
19
91
19
92
19
95
19
96
19
99
20
00
20
03
20
04
20
07
20
08
20
11
20
12
20
15
20
16
20
19
159216121632165216721692171217321752177217921812183218521872189219121932195219721992201220322052207220922112213221522172219222122232225222722292231223322352
Elev
atio
n (
ft.)
Year
Dep
th t
o W
ater
(ft
.)
OPTI Well 681 HydrographWSE & Depth-to-Water GSE
WSE Min = 1851 ft. WSE Max = 1909 ft. Well Depth = 614 ft.

020406080100120140160180200220240260280300320340360380400420440460480500520540560580600620640660680700720740
19
59
19
60
19
63
19
64
19
67
19
68
19
71
19
72
19
75
19
76
19
79
19
80
19
83
19
84
19
87
19
88
19
91
19
92
19
95
19
96
19
99
20
00
20
03
20
04
20
07
20
08
20
11
20
12
20
15
20
16
20
19
158016001620164016601680170017201740176017801800182018401860188019001920194019601980200020202040206020802100212021402160218022002220224022602280230023202340
Elev
atio
n (
ft.)
Year
Dep
th t
o W
ater
(ft
.)
OPTI Well 682 HydrographWSE & Depth-to-Water GSE
WSE Min = 1934 ft. WSE Max = 1993 ft. Well Depth = 1300 ft.

020406080100120140160180200220240260280300320340360380400420440460480500520540560580600620640660680700720740
19
59
19
60
19
63
19
64
19
67
19
68
19
71
19
72
19
75
19
76
19
79
19
80
19
83
19
84
19
87
19
88
19
91
19
92
19
95
19
96
19
99
20
00
20
03
20
04
20
07
20
08
20
11
20
12
20
15
20
16
20
19
163416541674169417141734175417741794181418341854187418941914193419541974199420142034205420742094211421342154217421942214223422542274229423142334235423742394
Elev
atio
n (
ft.)
Year
Dep
th t
o W
ater
(ft
.)
OPTI Well 683 HydrographWSE & Depth-to-Water GSE
WSE Min = 1918 ft. WSE Max = 1990 ft. Well Depth = 1045 ft.

020406080100120140160180200220240260280300320340360380400420440460480500520540560580600620640660680700720740
19
59
19
60
19
63
19
64
19
67
19
68
19
71
19
72
19
75
19
76
19
79
19
80
19
83
19
84
19
87
19
88
19
91
19
92
19
95
19
96
19
99
20
00
20
03
20
04
20
07
20
08
20
11
20
12
20
15
20
16
20
19
169117111731175117711791181118311851187118911911193119511971199120112031205120712091211121312151217121912211223122512271229123112331235123712391241124312451
Elev
atio
n (
ft.)
Year
Dep
th t
o W
ater
(ft
.)
OPTI Well 684 HydrographWSE & Depth-to-Water GSE
WSE Min = 1850 ft. WSE Max = 1992 ft. Well Depth = 790 ft.

020406080100120140160180200220240260280300320340360380400420440460480500520540560580600620640660680700720740
19
59
19
60
19
63
19
64
19
67
19
68
19
71
19
72
19
75
19
76
19
79
19
80
19
83
19
84
19
87
19
88
19
91
19
92
19
95
19
96
19
99
20
00
20
03
20
04
20
07
20
08
20
11
20
12
20
15
20
16
20
19
168317031723174317631783180318231843186318831903192319431963198320032023204320632083210321232143216321832203222322432263228323032323234323632383240324232443
Elev
atio
n (
ft.)
Year
Dep
th t
o W
ater
(ft
.)
OPTI Well 685 HydrographWSE & Depth-to-Water GSE
WSE Min = 1912 ft. WSE Max = 1995 ft. Well Depth = 658 ft.

020406080100120140160180200220240260280300320340360380400420440460480500520540560580600620640660680700720740
19
59
19
60
19
63
19
64
19
67
19
68
19
71
19
72
19
75
19
76
19
79
19
80
19
83
19
84
19
87
19
88
19
91
19
92
19
95
19
96
19
99
20
00
20
03
20
04
20
07
20
08
20
11
20
12
20
15
20
16
20
19
170117211741176117811801182118411861188119011921194119611981200120212041206120812101212121412161218122012221224122612281230123212341236123812401242124412461
Elev
atio
n (
ft.)
Year
Dep
th t
o W
ater
(ft
.)
OPTI Well 686 HydrographWSE & Depth-to-Water GSE
WSE Min = 1866 ft. WSE Max = 2020 ft. Well Depth = 0 ft.

020406080100120140160180200220240260280300320340360380400420440460480500520540560580600620640660680700720740
19
59
19
60
19
63
19
64
19
67
19
68
19
71
19
72
19
75
19
76
19
79
19
80
19
83
19
84
19
87
19
88
19
91
19
92
19
95
19
96
19
99
20
00
20
03
20
04
20
07
20
08
20
11
20
12
20
15
20
16
20
19
154815681588160816281648166816881708172817481768178818081828184818681888190819281948196819882008202820482068208821082128214821682188220822282248226822882308
Elev
atio
n (
ft.)
Year
Dep
th t
o W
ater
(ft
.)
OPTI Well 687 HydrographWSE & Depth-to-Water GSE
WSE Min = 1781 ft. WSE Max = 2101 ft. Well Depth = 1195 ft.

020406080100120140160180200220240260280300320340360380400420440460480500520540560580600620640660680700720740
19
59
19
60
19
63
19
64
19
67
19
68
19
71
19
72
19
75
19
76
19
79
19
80
19
83
19
84
19
87
19
88
19
91
19
92
19
95
19
96
19
99
20
00
20
03
20
04
20
07
20
08
20
11
20
12
20
15
20
16
20
19
162316431663168317031723174317631783180318231843186318831903192319431963198320032023204320632083210321232143216321832203222322432263228323032323234323632383
Elev
atio
n (
ft.)
Year
Dep
th t
o W
ater
(ft
.)
OPTI Well 688 HydrographWSE & Depth-to-Water GSE
WSE Min = 2067 ft. WSE Max = 2349 ft. Well Depth = 1204 ft.

020406080100120140160180200220240260280300320340360380400420440460480500520540560580600620640660680700720740
19
59
19
60
19
63
19
64
19
67
19
68
19
71
19
72
19
75
19
76
19
79
19
80
19
83
19
84
19
87
19
88
19
91
19
92
19
95
19
96
19
99
20
00
20
03
20
04
20
07
20
08
20
11
20
12
20
15
20
16
20
19
176017801800182018401860188019001920194019601980200020202040206020802100212021402160218022002220224022602280230023202340236023802400242024402460248025002520
Elev
atio
n (
ft.)
Year
Dep
th t
o W
ater
(ft
.)
OPTI Well 689 HydrographWSE & Depth-to-Water GSE
WSE Min = 2069 ft. WSE Max = 2261 ft. Well Depth = 1204 ft.

020406080100120140160180200220240260280300320340360380400420440460480500520540560580600620640660680700720740
19
59
19
60
19
63
19
64
19
67
19
68
19
71
19
72
19
75
19
76
19
79
19
80
19
83
19
84
19
87
19
88
19
91
19
92
19
95
19
96
19
99
20
00
20
03
20
04
20
07
20
08
20
11
20
12
20
15
20
16
20
19
821841861881901921941961981
100110211041106110811101112111411161118112011221124112611281130113211341136113811401142114411461148115011521154115611581
Elev
atio
n (
ft.)
Year
Dep
th t
o W
ater
(ft
.)
OPTI Well 830 HydrographWSE & Depth-to-Water GSE
WSE Min = 1513 ft. WSE Max = 1516 ft. Well Depth = Unknown ft.

020406080100120140160180200220240260280300320340360380400420440460480500520540560580600620640660680700720740
19
59
19
60
19
63
19
64
19
67
19
68
19
71
19
72
19
75
19
76
19
79
19
80
19
83
19
84
19
87
19
88
19
91
19
92
19
95
19
96
19
99
20
00
20
03
20
04
20
07
20
08
20
11
20
12
20
15
20
16
20
19
807827847867887907927947967987
10071027104710671087110711271147116711871207122712471267128713071327134713671387140714271447146714871507152715471567
Elev
atio
n (
ft.)
Year
Dep
th t
o W
ater
(ft
.)
OPTI Well 831 HydrographWSE & Depth-to-Water GSE
WSE Min = 1504 ft. WSE Max = 1510 ft. Well Depth = Unknown ft.

020406080100120140160180200220240260280300320340360380400420440460480500520540560580600620640660680700720740
19
59
19
60
19
63
19
64
19
67
19
68
19
71
19
72
19
75
19
76
19
79
19
80
19
83
19
84
19
87
19
88
19
91
19
92
19
95
19
96
19
99
20
00
20
03
20
04
20
07
20
08
20
11
20
12
20
15
20
16
20
19
880900920940960980
100010201040106010801100112011401160118012001220124012601280130013201340136013801400142014401460148015001520154015601580160016201640
Elev
atio
n (
ft.)
Year
Dep
th t
o W
ater
(ft
.)
OPTI Well 832 HydrographWSE & Depth-to-Water GSE
WSE Min = 1587 ft. WSE Max = 1600 ft. Well Depth = Unknown ft.

020406080100120140160180200220240260280300320340360380400420440460480500520540560580600620640660680700720740
19
59
19
60
19
63
19
64
19
67
19
68
19
71
19
72
19
75
19
76
19
79
19
80
19
83
19
84
19
87
19
88
19
91
19
92
19
95
19
96
19
99
20
00
20
03
20
04
20
07
20
08
20
11
20
12
20
15
20
16
20
19
707727747767787807827847867887907927947967987
100710271047106710871107112711471167118712071227124712671287130713271347136713871407142714471467
Elev
atio
n (
ft.)
Year
Dep
th t
o W
ater
(ft
.)
OPTI Well 833 HydrographWSE & Depth-to-Water GSE
WSE Min = 1426 ft. WSE Max = 1434 ft. Well Depth = Unknown ft.

020406080100120140160180200220240260280300320340360380400420440460480500520540560580600620640660680700720740
19
59
19
60
19
63
19
64
19
67
19
68
19
71
19
72
19
75
19
76
19
79
19
80
19
83
19
84
19
87
19
88
19
91
19
92
19
95
19
96
19
99
20
00
20
03
20
04
20
07
20
08
20
11
20
12
20
15
20
16
20
19
758778798818838858878898918938958978998
10181038105810781098111811381158117811981218123812581278129813181338135813781398141814381458147814981518
Elev
atio
n (
ft.)
Year
Dep
th t
o W
ater
(ft
.)
OPTI Well 834 HydrographWSE & Depth-to-Water GSE
WSE Min = 1466 ft. WSE Max = 1467 ft. Well Depth = Unknown ft.

020406080100120140160180200220240260280300320340360380400420440460480500520540560580600620640660680700720740
19
59
19
60
19
63
19
64
19
67
19
68
19
71
19
72
19
75
19
76
19
79
19
80
19
83
19
84
19
87
19
88
19
91
19
92
19
95
19
96
19
99
20
00
20
03
20
04
20
07
20
08
20
11
20
12
20
15
20
16
20
19
805825845865885905925945965985
10051025104510651085110511251145116511851205122512451265128513051325134513651385140514251445146514851505152515451565
Elev
atio
n (
ft.)
Year
Dep
th t
o W
ater
(ft
.)
OPTI Well 835 HydrographWSE & Depth-to-Water GSE
WSE Min = 1518 ft. WSE Max = 1533 ft. Well Depth = Unknown ft.

020406080100120140160180200220240260280300320340360380400420440460480500520540560580600620640660680700720740
19
59
19
60
19
63
19
64
19
67
19
68
19
71
19
72
19
75
19
76
19
79
19
80
19
83
19
84
19
87
19
88
19
91
19
92
19
95
19
96
19
99
20
00
20
03
20
04
20
07
20
08
20
11
20
12
20
15
20
16
20
19
736756776796816836856876896916936956976996
1016103610561076109611161136115611761196121612361256127612961316133613561376139614161436145614761496
Elev
atio
n (
ft.)
Year
Dep
th t
o W
ater
(ft
.)
OPTI Well 836 HydrographWSE & Depth-to-Water GSE
WSE Min = 1449 ft. WSE Max = 1450 ft. Well Depth = Unknown ft.

020406080100120140160180200220240260280300320340360380400420440460480500520540560580600620640660680700720740
19
59
19
60
19
63
19
64
19
67
19
68
19
71
19
72
19
75
19
76
19
79
19
80
19
83
19
84
19
87
19
88
19
91
19
92
19
95
19
96
19
99
20
00
20
03
20
04
20
07
20
08
20
11
20
12
20
15
20
16
20
19
963983
1003102310431063108311031123114311631183120312231243126312831303132313431363138314031423144314631483150315231543156315831603162316431663168317031723
Elev
atio
n (
ft.)
Year
Dep
th t
o W
ater
(ft
.)
OPTI Well 840 HydrographWSE & Depth-to-Water GSE
WSE Min = 1657 ft. WSE Max = 1712 ft. Well Depth = Unknown ft.

020406080100120140160180200220240260280300320340360380400420440460480500520540560580600620640660680700720740
19
59
19
60
19
63
19
64
19
67
19
68
19
71
19
72
19
75
19
76
19
79
19
80
19
83
19
84
19
87
19
88
19
91
19
92
19
95
19
96
19
99
20
00
20
03
20
04
20
07
20
08
20
11
20
12
20
15
20
16
20
19
101110311051107110911111113111511171119112111231125112711291131113311351137113911411143114511471149115111531155115711591161116311651167116911711173117511771
Elev
atio
n (
ft.)
Year
Dep
th t
o W
ater
(ft
.)
OPTI Well 841 HydrographWSE & Depth-to-Water GSE
WSE Min = 1701 ft. WSE Max = 1740 ft. Well Depth = Unknown ft.

020406080100120140160180200220240260280300320340360380400420440460480500520540560580600620640660680700720740
19
59
19
60
19
63
19
64
19
67
19
68
19
71
19
72
19
75
19
76
19
79
19
80
19
83
19
84
19
87
19
88
19
91
19
92
19
95
19
96
19
99
20
00
20
03
20
04
20
07
20
08
20
11
20
12
20
15
20
16
20
19
100910291049106910891109112911491169118912091229124912691289130913291349136913891409142914491469148915091529154915691589160916291649166916891709172917491769
Elev
atio
n (
ft.)
Year
Dep
th t
o W
ater
(ft
.)
OPTI Well 842 HydrographWSE & Depth-to-Water GSE
WSE Min = 1698 ft. WSE Max = 1751 ft. Well Depth = Unknown ft.

020406080100120140160180200220240260280300320340360380400420440460480500520540560580600620640660680700720740
19
59
19
60
19
63
19
64
19
67
19
68
19
71
19
72
19
75
19
76
19
79
19
80
19
83
19
84
19
87
19
88
19
91
19
92
19
95
19
96
19
99
20
00
20
03
20
04
20
07
20
08
20
11
20
12
20
15
20
16
20
19
101110311051107110911111113111511171119112111231125112711291131113311351137113911411143114511471149115111531155115711591161116311651167116911711173117511771
Elev
atio
n (
ft.)
Year
Dep
th t
o W
ater
(ft
.)
OPTI Well 843 HydrographWSE & Depth-to-Water GSE
WSE Min = 1678 ft. WSE Max = 1746 ft. Well Depth = Unknown ft.

020406080100120140160180200220240260280300320340360380400420440460480500520540560580600620640660680700720740
19
59
19
60
19
63
19
64
19
67
19
68
19
71
19
72
19
75
19
76
19
79
19
80
19
83
19
84
19
87
19
88
19
91
19
92
19
95
19
96
19
99
20
00
20
03
20
04
20
07
20
08
20
11
20
12
20
15
20
16
20
19
963983
1003102310431063108311031123114311631183120312231243126312831303132313431363138314031423144314631483150315231543156315831603162316431663168317031723
Elev
atio
n (
ft.)
Year
Dep
th t
o W
ater
(ft
.)
OPTI Well 844 HydrographWSE & Depth-to-Water GSE
WSE Min = 1663 ft. WSE Max = 1700 ft. Well Depth = Unknown ft.

020406080100120140160180200220240260280300320340360380400420440460480500520540560580600620640660680700720740
19
59
19
60
19
63
19
64
19
67
19
68
19
71
19
72
19
75
19
76
19
79
19
80
19
83
19
84
19
87
19
88
19
91
19
92
19
95
19
96
19
99
20
00
20
03
20
04
20
07
20
08
20
11
20
12
20
15
20
16
20
19
962982
1002102210421062108211021122114211621182120212221242126212821302132213421362138214021422144214621482150215221542156215821602162216421662168217021722
Elev
atio
n (
ft.)
Year
Dep
th t
o W
ater
(ft
.)
OPTI Well 845 HydrographWSE & Depth-to-Water GSE
WSE Min = 1658 ft. WSE Max = 1666 ft. Well Depth = Unknown ft.

020406080100120140160180200220240260280300320340360380400420440460480500520540560580600620640660680700720740
19
59
19
60
19
63
19
64
19
67
19
68
19
71
19
72
19
75
19
76
19
79
19
80
19
83
19
84
19
87
19
88
19
91
19
92
19
95
19
96
19
99
20
00
20
03
20
04
20
07
20
08
20
11
20
12
20
15
20
16
20
19
965985
1005102510451065108511051125114511651185120512251245126512851305132513451365138514051425144514651485150515251545156515851605162516451665168517051725
Elev
atio
n (
ft.)
Year
Dep
th t
o W
ater
(ft
.)
OPTI Well 846 HydrographWSE & Depth-to-Water GSE
WSE Min = 1663 ft. WSE Max = 1682 ft. Well Depth = Unknown ft.

020406080100120140160180200220240260280300320340360380400420440460480500520540560580600620640660680700720740
19
59
19
60
19
63
19
64
19
67
19
68
19
71
19
72
19
75
19
76
19
79
19
80
19
83
19
84
19
87
19
88
19
91
19
92
19
95
19
96
19
99
20
00
20
03
20
04
20
07
20
08
20
11
20
12
20
15
20
16
20
19
98310031023104310631083110311231143116311831203122312431263128313031323134313631383140314231443146314831503152315431563158316031623164316631683170317231743
Elev
atio
n (
ft.)
Year
Dep
th t
o W
ater
(ft
.)
OPTI Well 847 HydrographWSE & Depth-to-Water GSE
WSE Min = 1644 ft. WSE Max = 1658 ft. Well Depth = Unknown ft.

020406080100120140160180200220240260280300320340360380400420440460480500520540560580600620640660680700720740
19
59
19
60
19
63
19
64
19
67
19
68
19
71
19
72
19
75
19
76
19
79
19
80
19
83
19
84
19
87
19
88
19
91
19
92
19
95
19
96
19
99
20
00
20
03
20
04
20
07
20
08
20
11
20
12
20
15
20
16
20
19
944964984
100410241044106410841104112411441164118412041224124412641284130413241344136413841404142414441464148415041524154415641584160416241644166416841704
Elev
atio
n (
ft.)
Year
Dep
th t
o W
ater
(ft
.)
OPTI Well 848 HydrographWSE & Depth-to-Water GSE
WSE Min = 1656 ft. WSE Max = 1665 ft. Well Depth = Unknown ft.

020406080100120140160180200220240260280300320340360380400420440460480500520540560580600620640660680700720740
19
59
19
60
19
63
19
64
19
67
19
68
19
71
19
72
19
75
19
76
19
79
19
80
19
83
19
84
19
87
19
88
19
91
19
92
19
95
19
96
19
99
20
00
20
03
20
04
20
07
20
08
20
11
20
12
20
15
20
16
20
19
963983
1003102310431063108311031123114311631183120312231243126312831303132313431363138314031423144314631483150315231543156315831603162316431663168317031723
Elev
atio
n (
ft.)
Year
Dep
th t
o W
ater
(ft
.)
OPTI Well 849 HydrographWSE & Depth-to-Water GSE
WSE Min = 1633 ft. WSE Max = 1695 ft. Well Depth = Unknown ft.

020406080100120140160180200220240260280300320340360380400420440460480500520540560580600620640660680700720740
19
59
19
60
19
63
19
64
19
67
19
68
19
71
19
72
19
75
19
76
19
79
19
80
19
83
19
84
19
87
19
88
19
91
19
92
19
95
19
96
19
99
20
00
20
03
20
04
20
07
20
08
20
11
20
12
20
15
20
16
20
19
100910291049106910891109112911491169118912091229124912691289130913291349136913891409142914491469148915091529154915691589160916291649166916891709172917491769
Elev
atio
n (
ft.)
Year
Dep
th t
o W
ater
(ft
.)
OPTI Well 850 HydrographWSE & Depth-to-Water GSE
WSE Min = 1654 ft. WSE Max = 1701 ft. Well Depth = Unknown ft.


Chapter 2 Appendix B
White Paper: Subsidence and Subsidence Monitoring Techniques

This page intentionally left blank.

1
Subsidence White Paper Author: C. Micah Eggleton - Environmental Planner at Woodard & Curran, September 19, 2017. [email protected] What is Subsidence?
Land subsidence is the sinking or downward settling of the earth’s surface, not restricted in rate, magnitude, or area involved. Subsidence is often a result of over-extraction of subsurface water. In these cases, subsidence generally occurs over a large to very large area (10’s to 100’s of km2) and may happen over several years.
How Subsidence Occurs
Groundwater saturates the sediments in the subsurface where groundwater is present. Sediments in water bearing units are commonly made up of sands, gravels, silts, and clays. Aquitards are composed of clay materials, and may have multiple thin layers or larger extensive, and/or thicker layers. Groundwater in these materials fills the pore spaces and supports the material’s structure. As groundwater levels decline, the sands, gravels, silts, and clays in water bearing units are dewatered, and the water’s support of the structure of the materials is removed. Clays in particular rearrange when dewatered and clay grains orient in a similar direction, which reduces the amount of pore space and thus, the clay compacts. As the clays compact, ground surface elevation begins to drop.
Figure 1: Subsidence and Compaction Process
Source: USGS, Ladn Subsidence: Cause and Effect. 9/17/2017. https://ca.water.usgs.gov/land_subsidence/california-subsidence-cause-effect.html#pumping
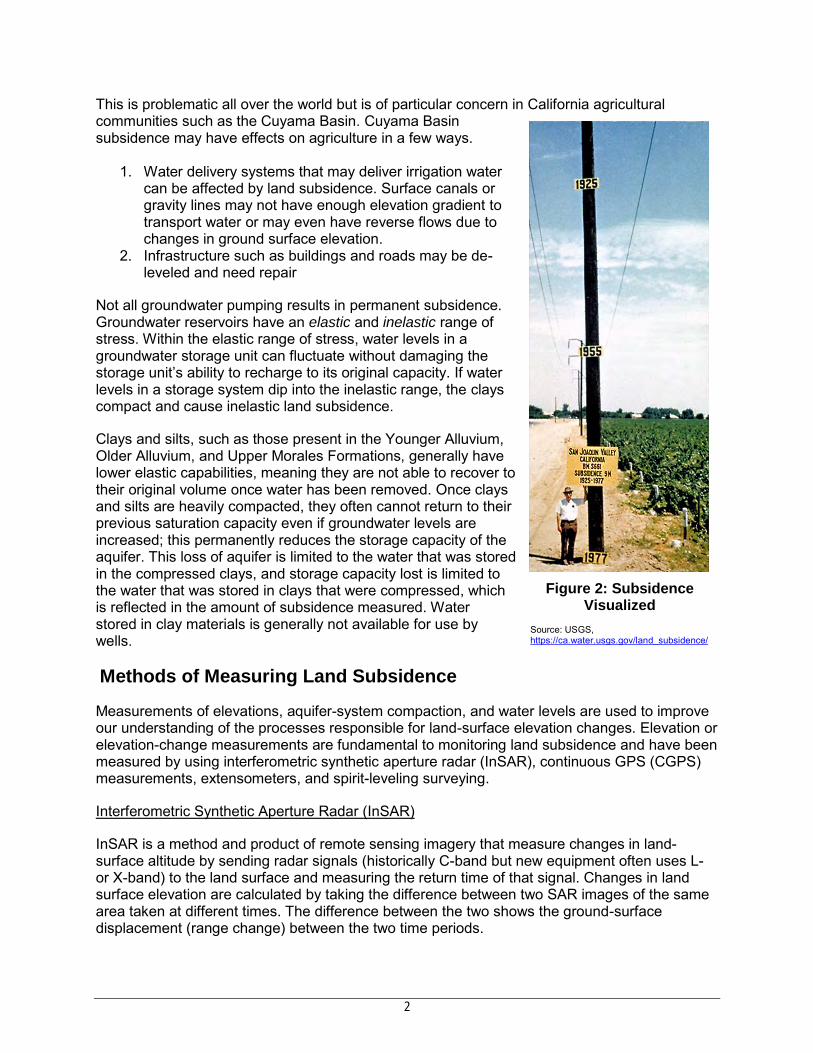
2
This is problematic all over the world but is of particular concern in California agricultural communities such as the Cuyama Basin. Cuyama Basin subsidence may have effects on agriculture in a few ways.
1. Water delivery systems that may deliver irrigation water can be affected by land subsidence. Surface canals or gravity lines may not have enough elevation gradient to transport water or may even have reverse flows due to changes in ground surface elevation.
2. Infrastructure such as buildings and roads may be de-leveled and need repair
Not all groundwater pumping results in permanent subsidence. Groundwater reservoirs have an elastic and inelastic range of stress. Within the elastic range of stress, water levels in a groundwater storage unit can fluctuate without damaging the storage unit’s ability to recharge to its original capacity. If water levels in a storage system dip into the inelastic range, the clays compact and cause inelastic land subsidence.
Clays and silts, such as those present in the Younger Alluvium, Older Alluvium, and Upper Morales Formations, generally have lower elastic capabilities, meaning they are not able to recover to their original volume once water has been removed. Once clays and silts are heavily compacted, they often cannot return to their previous saturation capacity even if groundwater levels are increased; this permanently reduces the storage capacity of the aquifer. This loss of aquifer is limited to the water that was stored in the compressed clays, and storage capacity lost is limited to the water that was stored in clays that were compressed, which is reflected in the amount of subsidence measured. Water stored in clay materials is generally not available for use by wells.
Methods of Measuring Land Subsidence
Measurements of elevations, aquifer-system compaction, and water levels are used to improve our understanding of the processes responsible for land-surface elevation changes. Elevation or elevation-change measurements are fundamental to monitoring land subsidence and have been measured by using interferometric synthetic aperture radar (InSAR), continuous GPS (CGPS) measurements, extensometers, and spirit-leveling surveying.
Interferometric Synthetic Aperture Radar (InSAR)
InSAR is a method and product of remote sensing imagery that measure changes in land-surface altitude by sending radar signals (historically C-band but new equipment often uses L- or X-band) to the land surface and measuring the return time of that signal. Changes in land surface elevation are calculated by taking the difference between two SAR images of the same area taken at different times. The difference between the two shows the ground-surface displacement (range change) between the two time periods.
Figure 2: Subsidence Visualized
Source: USGS, https://ca.water.usgs.gov/land_subsidence/

3
The spatial resolution of InSAR is dependent on the location and resolution of the remote imagery, and whether it is taken from a plane or by orbiting satellite. At its finest resolution, InSAR has a sampling pixel of approximately 25’ by 25’ from satellites. The resolution of vertical displacement is dependent upon meteorological, observational, and other conditions, but is typically within a few centimeters to millimeters.
Raw InSAR data requires specialized computer programs to process and view. Some agencies and organizations, such as the California Water Science Center, provide InSAR imagery online. Direct data downloads are possible, but require registration approved with UNAVCO as an affiliate with an institution engaged in SAR research to download data. Data is available for anyone to browse online, and there are several agencies/institutes that publish data for specific regions.
Currently, InSAR imagery is obtained via specialized radar equipment on an aircraft and managed by NASA’s Jet Propulsion Laboratory (JPL). In December 2021, the satellite NISAR is scheduled to launch; NISAR will provide coverage every 12 days and all NASA data will be free.
Continuous Global Positing System (CGPS)
CGPS stations continuously measure the three-dimensional position of a sensor. There are more than 1,000 sensors in Western North America, with hundreds in California. Most sensors are managed by the Plate Boundary Observatory/UNAVCO and by Scripps Orbit and Permanent Arrary Center (SOPAC), but other groups such as Caltrans also operate sensors. These monitoring stations help measure tectonic movements as well as subsidence, which means data is taken in the X, Y, and Z axis.
Measurements are typically taken every 15 seconds and are processed to produce a daily position. The CGPS system has data/information published online, however, some use is limited and registration is required for certain data access.
Currently, subsidence measurements in and immediately around the Cuyama Basin are taken through CGPS instrumentation.
Spirit Leveling
This is the oldest method of measuring subsidence and was used long before electronic aids such as GPS. The primary tool is a Spirit Level in combination with a telescope and graduated vertical rods. Measurements are based on one reference point. This technique is best used for smaller survey areas (5 miles or less) and areas where high spatial density is desired. This is a good option for localized surveying and where cost is a priority.

4
Extensometers
Extensometers are one dimensional indicators of change in a specified depth. In regards to land subsidence, they often measure the change in an aquifer system within a specific depth range – that is to say, if the extensometer extends 20 meters into the ground, it can only measure the change in compaction (or expansion) within those 20m. It is also important to understand that extensometers measure compaction/expansion, not elevation.
Between the 1950s and 1970s, more than two dozen extensometers were installed in California’s Central Valley by the USGS, with additional units installed since then.
Most extensometers are constructed as cable or pipe borehole extensometers (see the figure to the right above). They function by having a cable or pipe extend to the bottom of a drilled hole to the measuring depth at a specific reference point. At the top of this cable or pipe is a reference point, and attached to the reference point is another cable that extends to the top of a platform near the ground surface, around a wheel, and to a counter weight which maintains tension on all cables. As the ground elevation and bottom reference point change in relation to one another, the wheel turns as the counter weight either drops or rises. This change in the position of the counter weight is equal to the amount of compaction between the two reference points.
Although simple in theory, extensometers can be costly to install due to the drilling that is required and robust equipment needed. In addition, multiple extensometers are often needed to measure compaction across a range of depths and to determine which portion of the subsurface is compacting.
Piezometers
Piezometers measure the hydraulic pressure in a groundwater system. Piezometers are paired with extensometers or CGPS data to analyze stress-strain characteristics of a groundwater system. These systems allow for the calculation of the skeletal storage coefficient, which is the standard measure of an aquifer’s storage directly related to the compressibility of the soil/storage system. This is what largely controls how “recoverable” an aquifer system is when it is recharged with water.
If water levels continue to decline into the inelastic range of stress, it can become possible to compute the inelastic storage coefficient that governs the permanent compaction of the aquifer system. If water levels fluctuate into both of these ranges seasonally or annually, it may be possible to calculate both.
Chapter 2 Appendix C
Cuyama Basin Water Resources Model Documentation

This page intentionally left blank.

C-1Groundwater Sustainability Plan
Chapter 2, Appendix C December 2019
Table of Contents
Appendix C — Cuyama Basin Water Resources Model Documentation ............................... 3 Introduction .......................................................................................................................... 3
Goals of Model Development ..................................................................................... 3 Basin Overview .......................................................................................................... 3 CBRWM Platform ....................................................................................................... 3
CBWRM Development ......................................................................................................... 4 Model Input Data ........................................................................................................ 4 CBWRM Grid ............................................................................................................. 7 Stream Configuration and Watersheds ...................................................................... 7 Precipitation ............................................................................................................... 8 Root Zone Soil Parameters ...................................................................................... 13 Land Use and Cropping Patterns ............................................................................. 13 Evapotranspiration ................................................................................................... 17 CBWRM Layering .................................................................................................... 18 Boundary Conditions ................................................................................................ 25 Initial Conditions ....................................................................................................... 25
Water Supply and Demand Data ....................................................................................... 25 Agricultural Water Demand ...................................................................................... 25 Domestic Water Use ................................................................................................ 25
CBRWM Calibration ........................................................................................................... 26 Calibration of IDC and Root-Zone Parameters ........................................................ 26 Calibration of Surface Water Features ..................................................................... 27 Calibration of Water Budgets ................................................................................... 28 Groundwater Level Calibration ................................................................................ 31 Uncertainty and Sensitivity Assessment .................................................................. 34
Conclusions and Recommendations .................................................................................. 37 References ......................................................................................................................... 38
Tables
Table C-1: CBWRM Major Model Data ......................................................................................... 6 Table C-2: Land Use Categories ................................................................................................ 14 Table C-3: Range of Aquifer Parameters in CBWRM as Compared to Reported Values .......... 35 Table C-4: Sensitivity of Basin-wide Storage Change to Different Parameters .......................... 36

C-2Groundwater Sustainability Plan
Chapter 2, Appendix C December 2019
Figures
Figure C-1: Cuyama Valley Groundwater Basin and Key Geographic Features .......................... 5 Figure C-2: CBWRM Grid Network and Features ......................................................................... 9 Figure C-3: Upper Watershed Areas in the CBWRM .................................................................. 10 Figure C-4: Average Annual Precipitation in the Basin ............................................................... 11 Figure C-5: 50-Year Historical Precipitation and Cumulative Departure from Mean Precipitation
............................................................................................................................................ 12 Figure C-6: Year 2016 Land Use ................................................................................................ 16 Figure C-7: Historical and Projected Land Use in the Basin ....................................................... 17 Figure C-8: Annual Evapotranspiration for Each Land Use Type ............................................... 18 Figure C-9: Location of USGS 2015 Cross Sections .................................................................. 19 Figure C-10: USGS Cross Section A-A' ...................................................................................... 20 Figure C-11: USGS Cross Section B-B' ...................................................................................... 21 Figure C-12: CBWRM Layer 1 Extent and Thickness ................................................................. 22 Figure C-13: CBWRM Layer 2 Extent and Thickness ................................................................. 23 Figure C-14: CBWRM Layer 3 Extent and Thickness ................................................................. 24 Figure C-15: Annual Agricultural Water Demand ........................................................................ 27 Figure C-16: Land Surface Water Budget Annual Time Series in the Calibration Period ........... 29 Figure C-17: Groundwater Budget Annual Time Series in the Calibration Period ...................... 30 Figure C-18: Location of Calibration Wells ................................................................................. 31 Figure C-19: Comparison of Simulated and Observed Groundwater Levels .............................. 33 Figure C-20: Histogram of Divergence of Simulated Groundwater Levels from Observed Data 34 Figure C-21: Lower and Upper Bounds for the Groundwater Storage Change .......................... 37
Attachments
Attachment C-1 Land Use and Consumptive Water Use of Cuyama Groundwater Basin for Water Years 1996 Through 2016
Attachment C-2 Climate Change Scenario Data Development
Attachment C-3 Groundwater Level Hydrographs for Calibration Wells
Attachment C-4 Evapotranspiration and Applied Water Estimates

C-3Groundwater Sustainability Plan
Chapter 2, Appendix C December 2019
Appendix C — Cuyama Basin Water Resources Model Documentation
Introduction Goals of Model Development The Cuyama Basin Water Resources Model (CBWRM) was developed to evaluate the recent historical, current, and projected surface water and groundwater conditions in the Cuyama Groundwater Basin (Basin), and simulate various scenarios as part of the Basin’s Groundwater Sustainability Plan (GSP). The fine temporal and spatial scale of the CBRWM allows the Cuyama Basin Groundwater Sustainability Agency (CBGSA) and its stakeholders to evaluate the effect of changing groundwater conditions in different parts of the Basin.
The CBWRM was developed in consultation with members of the Technical Forum, which includes technical staff and consultants representing a range of public and private entities in the Basin. Technical Forum members are listed in Chapter 1, Section 1.3. The Technical Forum held 14 monthly conference calls over the course of CBWRM development, and model data and outputs were provided to Technical Forum members to facilitate review and feedback on model development. This allowed Technical Forum members to review and comment on all major aspects of CBWRM development.
Basin Overview The Basin encompasses an area of approximately 378 square miles, and includes the communities of New Cuyama and Cuyama, which are located along State Route (SR) 166 and Ventucopa, which is located along SR 33. Figure C-1 shows the Cuyama Basin and its key geographic features. The Basin encompasses an approximately 55-mile stretch of the Cuyama River, which runs through the Basin for much of its extent before leaving the Basin to the northwest and flowing toward the Pacific Ocean. The Basin also encompasses reaches of Wells Creek in its north-central area, Santa Barbara Creek in the south-central area, and the Quatal Canyon drainage and Cuyama Creek in the southern area of the Basin. Primary land use and development in the Basin is agricultural use, which mostly occurs in the central portion east of New Cuyama, and along the Cuyama River near SR 33 through Ventucopa. Additionally, there has recently been new agricultural development in the western part of the Basin.
CBRWM Platform The CBWRM was developed based on the Integrated Water Flow Model (IWFM) software platform. The IWFM is an open-source, finite element simulation code that supports triangular and quadrilateral elements (Dogrul et al., 2017b). IWFM was specifically designated in the Sustainable Groundwater Management Act (SGMA) regulations as a model supported by the California Department of Water Resources (DWR) for evaluation of the integrated surface water and groundwater resources a basin, including detailed water budget development that meets SGMA requirements. IWFM has been used throughout California for planning and management of water resources, including GSP development. IWFM is also used for DWR’s California Central Valley Groundwater-Surface Water Simulation Model

C-4Groundwater Sustainability Plan
Chapter 2, Appendix C December 2019
(C2VSim), which is the fine-grid version that is being refined and enhanced by DWR to support SGMA activities throughout the Central Valley at the regional scale (DWR, 2018).
The IWFM Demand Calculator (IDC) is the stand-alone root zone component of IWFM that simulates land surface and root zone flow processes (Dogrul et al., 2017b). It calculates agricultural and urban water demands using inputs including climatic conditions, soil hydrologic conditions, and land use types and cropping patterns. The IDC can be used as a stand-alone model, or it can be combined with IWFM. When combined, the full IWFM model simulates the integrated system of land surface processes and groundwater system and the stream system, as well as interaction among these systems.
CBWRM Development Model Input Data The CBWRM historical model simulates Basin hydrologic conditions on a daily time step from water year 1995 through water year 2017 (i.e., October 1, 1994 through September 30, 2017). Table C-1 lists CBWRM files and corresponding major data sources.

!(
!(
!(
Ca
li
en
t eR a n g e
Si e
r r aM
a d r eM
o u n t a i n s
Aliso
Cany
on Cr
eek
Apache Canyon Creek
Quatal Canyon Creek
Cotto
nwoo
d Cree
k
Cuyama CreekSan
ta Barb
ara Cree
k
Cuy ama Rive r
Cuyama
Ventucopa
New CuyamaUV166
UV33
Lege
nd
Figu
re E
xpor
ted:
4/1
5/20
19 B
y: c
eggl
eton
Usi
ng: C
:\Use
rs\c
eggl
eton
\One
Driv
e - W
ooda
rd &
Cur
ran\
_PC
Fold
ers\
Des
ktop
\Cur
rent
Pro
ject
s\01
1078
-003
- C
uyam
a\01
_Loc
al C
uyam
a G
IS_2
0180
803\
MX
Ds\
Text
\Mod
elin
gDoc
umen
tatio
n\Fi
g A
-1_C
uyam
a G
W B
asin
_V1.
m
!( TownsCuyama BasinHighways
Local RoadsCuyama RiverStreams/Creeks
Figure C-1 - Cuyama Valley Groundwater Basin
± 0 7 143.5Miles
April 2019
Cuyama Valley Groundwater Basin Groundwater Sustainability Plan
Cuyama Basin Groundwater Sustainability Agency

C-6Groundwater Sustainability Plan
Chapter 2, Appendix C December 2019
Table C-1: CBWRM Major Model Data
Major Data Category
Minor Data Category Data Source
Hydrogeological Data
Geologic Stratification
Diblee Maps and Cuyama Valley Hydrologic Model (CUVHM)
Stream Data Stream Configuration
National Hydrography Dataset (NHD)
Streamflow Records United States Geological Survey (USGS) and California Data Exchange Center (CDEC) Stream Gages
Hydrological Data Precipitation Parameter-Elevation Relationships on Independent Slopes Model (PRISM)
Agricultural Water Demand
Land Use and Cropping Patterns
• DWR• Private Landowners• CBGSA-developed data
Evapotranspiration California Irrigation Management Information System (CIMIS)
Soil Properties Natural Resources Conservation Service (NRCS) Soil Survey Geographic Database (SSURGO)
Urban Water Demand
Population United States Census Bureau
Per Capita Water Use
Cuyama Community Services District (CCSD) Local Information
Water Supply Groundwater Pumping
CCSD
Other Initial GW Level Conditions
• DWR Water Data Library• Private landowners
Small Watersheds NHD
GW Level Records for Calibration Wells
• DWR Water Data Library• Private landowners
Analysts developed the 50-year hydrologic period of water years 1968 through 2017 for use in CBWRM to meet SGMA requirements for long-term water budget representation for current and projected Basin conditions.

C-7Groundwater Sustainability Plan
Chapter 2, Appendix C December 2019
CBWRM Grid Analysts developed the finite element grid using the Groundwater Modeling System (GMS) software’ the grid development module. The model grid network is composed of a combination of quadrilateral and triangular elements, which allows a detailed representation of various hydrologic, geologic, and jurisdictional features required for development of information about land and water use, water supply, groundwater conditions, and water budget. The CBWRM grid and the specific features used in grid development are shown in Figure C-2. These features include the following:
• The Basin boundary as defined in DWR’s Bulletin 118 (DWR, 2004)• Hydrologic and hydrogeologic features (i.e., Cuyama River and minor streams, faults, and
outcroppings)• The Cuyama Community Services District (CCSD) boundary• Cuyama Water District boundaryThe CBWRM grid contains 6,582 elements with an average element area of 36.8 acres. Primary objectives during grid development were to maintain a manageable number of elements and nodes for model computational performance, to optimize resolution for data analysis, and to contain relatively finer resolution along rivers, which allows for better simulation of stream-aquifer interaction to optimize the model run time and to streamline model output.
Stream Configuration and Watersheds The CBWRM surface hydrology is represented by nine model stream reaches, representing the Cuyama River. The USGS has two active gages that record flows in the Cuyama River watershed upstream of Lake Twitchell. These include one gage on the Cuyama River downstream of the Basin (ID 11136800), which is located just upstream of Lake Twitchell. This gage has 58 recorded years of streamflow measurements from 1959 to 2017. The other active gage is south of the city of Ventucopa along Santa Barbara Canyon Creek (ID 11136600), and this partial record is limited to seven years (i.e., from 2010 to 2017). In addition, limited data are available from four deactivated gages, as shown in Chapter 1.
The inflow from upper watershed areas originates from ungaged watersheds. Figure C-3 shows the upper watershed areas included in the model. Flows from ungaged watersheds surrounding the Basin are estimated using a simplified rainfall runoff module incorporated in the small watersheds module of the CBWRM. This module simulates the surface water and groundwater contributions from the small watersheds using daily precipitation rates and runoff and infiltration characteristics assigned to each ungaged watershed. The portion of flow from the small watershed that enters the model domain as surface runoff is directed to drain into simulated streams. The portion of flow from small watersheds that infiltrates to ground contributes to the main groundwater system as boundary flows.
All subsurface inflows from these small watersheds are routed to the top model layer in each watershed (Layer 3 in most watersheds) along specified groundwater nodes, with a user-defined maximum percolation rate at each node. Excess flows that do not infiltrate to groundwater enter the simulated streams at user-specified locations. The hydrologic conditions of these small watersheds used to estimate the subsurface and surface flows are represented using parameters (e.g., precipitation, surface layer soil

C-8Groundwater Sustainability Plan
Chapter 2, Appendix C December 2019
parameters, runoff coefficient) for each watershed. The soil parameters and runoff coefficients were estimated using data from SSURGO (USDA, 2017a).
Precipitation Rainfall data for the CBWRM area are derived from the PRISM database (PRISM Climate Group, 2018). The database contains monthly precipitation data starting from 1895 and daily precipitation data from December 1, 1981 on a 4-kilometer grid throughout the model area. To develop data for the daily time step of the CBWRM, monthly precipitation data for the 1968 to 1981 time period was downscaled to daily temporal resolution with a similar water year type analysis using the recorded Cuyama River flows. Each of the model elements was mapped to the nearest PRISM reference node, which are uniformly distributed across the model domain. The resulting average annual precipitation is shown in Figure C-4.
Figure C-5 shows the Basin averaged annual rainfall in the model area and the cumulative departure from mean, which is an indication of long-term rainfall trends in the area. The average annual precipitation during the 50-year hydrologic sequence from October 1967 to September 2017 was 13.1 inches, which ranges from an annual average of 11.4 inches in the valley floor to 14.8 inches in the upper watershed areas.
Attachment C-2 describes the climate change scenarios analyzed for projected future conditions, and the modifications made to the precipitation data to reflect the effects of climate change.

TTRF
SBCF
GRF
Russell
Rehoboth
Quatal Canyon Creek
Cuyama Creek
Cuyama River
Lege
nd
Figu
re E
xpor
ted:
6/2
0/20
19 B
y: m
ceyh
an U
sing
: \\w
ooda
rdcu
rran
.net
\sha
red\
Pro
ject
s\R
MC
\SA
C\0
0110
78.0
0 - C
uyam
a B
asin
GSP
\C. G
IS\M
XD
s\Te
xt\M
odel
Doc
\Fig
ureC
-2_M
odel
Grid
Dev
elop
men
t_v2
.mxd
Cuyama BasinModel GridFaults in CBWRMCuyama RiverStreams/Creeks
Figure C-2 - Cuyama Valley Groundwater BasinIWFM Grid Development Features
± 0 7 143.5Miles
April 2019
Cuyama Valley Groundwater Basin Groundwater Sustainability Plan
Cuyama Basin Groundwater Sustainability Agency

Aliso
Cany
on Cr
eek
Apache Canyon Creek
Quatal Canyon Creek
Cotto
nwoo
d Cree
k
Cuyama CreekSan
ta Barb
ara Cree
k
Cuy ama Rive r
2
635
5
1 9
18
8
28
3
4
2524
22
11
7
29
34
36
14
37
39
27
26
13
30
21
16
20
12
40
15
19
32
17
10
23
33
31
38
Lege
nd
Figu
re E
xpor
ted:
4/1
5/20
19 B
y: c
eggl
eton
Usi
ng: C
:\Use
rs\c
eggl
eton
\One
Driv
e - W
ooda
rd &
Cur
ran\
_PC
Fold
ers\
Des
ktop
\Cur
rent
Pro
ject
s\01
1078
-003
- C
uyam
a\01
_Loc
al C
uyam
a G
IS_2
0180
803\
MX
Ds\
Text
\Mod
elin
gDoc
umen
tatio
n\Fi
g A
-3_U
pper
Wat
ersh
ed A
reas
in
Cuyama BasinCuyama RiverStreams/Creeks
Contributes to Cuyama GW BasinDoes Not Contribute to Cuyama GW BasinWatershedSmall Watersheds (HUC 12)
Figure C-3 - Cuyama Valley Groundwater BasinUpper Watershed Areas in the IWFM Model
± 0 7 143.5Miles
April 2019
Cuyama Valley Groundwater Basin Groundwater Sustainability Plan
Cuyama Basin Groundwater Sustainability Agency
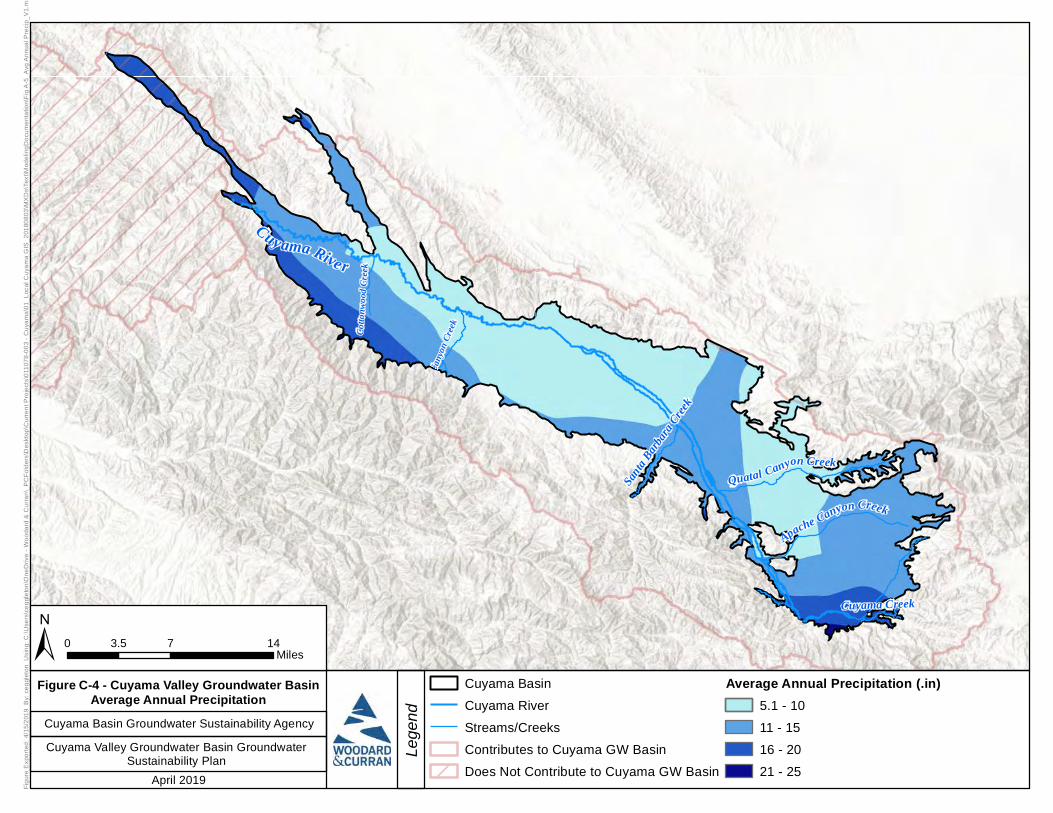
Aliso
Cany
on Cr
eek
Apache Canyon Creek
Quatal Canyon Creek
Cotto
nwoo
d Cree
k
Cuyama CreekSan
ta Barb
ara Cree
k
Cuy ama Rive r
Lege
nd
Figu
re E
xpor
ted:
4/1
5/20
19 B
y: c
eggl
eton
Usi
ng: C
:\Use
rs\c
eggl
eton
\One
Driv
e - W
ooda
rd &
Cur
ran\
_PC
Fold
ers\
Des
ktop
\Cur
rent
Pro
ject
s\01
1078
-003
- C
uyam
a\01
_Loc
al C
uyam
a G
IS_2
0180
803\
MX
Ds\
Text
\Mod
elin
gDoc
umen
tatio
n\Fi
g A
-5_A
vg A
nnua
l Pre
cip_
V1.
mx
Cuyama BasinCuyama RiverStreams/CreeksContributes to Cuyama GW BasinDoes Not Contribute to Cuyama GW Basin
Average Annual Precipitation (.in)5.1 - 1011 - 1516 - 2021 - 25
Figure C-4 - Cuyama Valley Groundwater BasinAverage Annual Precipitation
± 0 7 143.5Miles
April 2019
Cuyama Valley Groundwater Basin Groundwater Sustainability Plan
Cuyama Basin Groundwater Sustainability Agency

C-12Groundwater Sustainability Plan
Chapter 2, Appendix C December 2019
Figure C-5: 50-Year Historical Precipitation and Cumulative Departure from Mean Precipitation

C-13Groundwater Sustainability Plan
Chapter 2, Appendix C December 2019
Root Zone Soil Parameters Soil properties specified in the CBWRM are field capacity, wilting point, total porosity, saturated hydraulic conductivity, and pore size distribution index. These soil properties are specified for each model element, and were used to calculate runoff and infiltration from both rainfall and applied water at each model time step.
DWR’s IWFM Soil Data Builder (DWR, 2017) was used in conjunction with the SSURGO (USDA, 2017a) soil data to determine the five soil parameters for each model element. The IWFM Soil Data Builder extracts the SSURGO data relevant to the model area and associates it with each model grid element. For the elements where SSURGO data was incomplete, analysts used the USDA’s Digital General Soil Map of the United States (STATSGO2) data (USDA, 2017b) to complement SSURGO parameters.
CBRWM elements are associated with the four hydrologic soil groups according to their runoff potential and infiltration characteristics. NRCS defines these hydrological soil groups as follows (NRCS, 2009):
• Group A – Soils in this group have low runoff potential when thoroughly wet. Water is transmittedfreely through the soil. Group A soils typically have less than 10 percent clay and more than90 percent sand or gravel and have gravel or sand textures. Some soils having loamy sand, sandyloam, loam or silt loam textures may be placed in this group if they are well aggregated, of low bulkdensity, or contain greater than 35 percent rock fragments.
• Group B – Soils in this group have moderately low runoff potential when thoroughly wet. Watertransmission through the soil is unimpeded. Group B soils typically have between 10 and 20 percentclay and 50 to 90 percent sand and have loamy sand or sandy loam textures. Some soils having loam,silt loam, silt, or sandy clay loam textures may be placed in this group if they are well aggregated, oflow bulk density, or contain greater than 35 percent rock fragments.
• Group C – Soils in this group have moderately high runoff potential when thoroughly wet. Watertransmission through the soil is somewhat restricted. Group C soils typically have between 20 and40 percent clay and less than 50 percent sand and have loam, silt loam, sandy clay loam, clay loam,and silty clay loam textures. Some soils having clay, silty clay, or sandy clay textures may be placedin this group if they are well aggregated, of low bulk density, or contain greater than 35 percent rockfragments.
• Group D – Soils in this group have high runoff potential when thoroughly wet. Water movementthrough the soil is restricted or very restricted. Group D soils typically have greater than 40 percentclay, less than 50 percent sand, and have clayey textures. In some areas, they also have high shrink-swell potential.
Land Use and Cropping Patterns Land use and cropping patterns are key data sets that support estimation of monthly agricultural water requirements over the period of model simulation. Consistent with the DWR’s C2VSim, the CBWRM includes 23 irrigated crop categories and four general land use categories. The general land use categories include urban landscape (e.g., residential areas, school fields, roads, etc.), water surface (e.g., streams,

C-14Groundwater Sustainability Plan
Chapter 2, Appendix C December 2019
lakes, and reservoirs), riparian vegetation (e.g., native vegetation in the vicinity of surface water), and native vegetation. The 23 irrigated crop categories are combined into six summary-level crop group with similar water use and/or irrigation practices, which also provides a simpler representation of crop group types for planning and policy purposes. Table C-2 lists the land use categories.
Table C-2: Land Use Categories
Land Use Type Model Category Grouped Categories Irrigated Crops • Apple
• Berry• Citrus• Olive• Pistachio• Misc. Deciduous• Misc. Subtropical Fruits
Fruit and Nut Trees
Vineyards Vineyards
• Alfalfa• Mixed Pasture
Alfalfa and Irrigated Pasture
• Misc. Grain• Misc. Grass• Wheat
Grain
• Dry Beans• Corn• Misc. Field Crops• Safflowers
Field Crops
• Carrot• Cole• Mixed Greens• Lettuce• Melons• Onion• Potatoes• Misc. Truck Crops
Truck Crops
Idle and Fallow Lands Idle
Other Land Use • Urban Landscape• Water Surface• Riparian Vegetation• Native Vegetation

C-15Groundwater Sustainability Plan
Chapter 2, Appendix C December 2019
Spatial land use data were used to specify land use types and crop acreages for each model element for each year of simulation. The following data sources were used:
• 1996 data from historical DWR county land use surveys1
• 2014 and 2016 data that were developed for DWR using remote sensing data by LandIQ2
• 2000, 2003, 2006, 2009, 2012 data that were developed for the CBGSA using remote sensing data;development of these datasets is documented in Attachment C-1.
• Data provided by private landowners for portions of the Basin between 1992 and 2017
Figure C-6 shows the spatial distribution of the major land use categories in the Basin for 2016.3 Estimated land use in 2016 includes approximately 36,500 acres of irrigated land use. Figure C-7 shows the historical trend of land use categories in the Basin and the projected assumed annual land use pattern for the 50-year hydrologic period used for the projected condition model scenario. The projected annual land use categories are developed based on the 2017 crop categories and acreage values as the basis, with adjustments made for known acreage changes in 2018. Permanent crop acreages were assumed to remain unchanged from 2017-18 values, while annual crop acreages reflect annual variability that was developed based on an autoregressive moving average model that uses the historical land use data sets. The autoregressive moving average was developed such that long-term average acreage for each annual crop type remained unchanged from 2017 values.
1 https://www.water.ca.gov/Programs/Water-Use-And-Efficiency/Land-And-Water-Use/Land-Use-Surveys 2 https://gis.water.ca.gov/app/CADWRLandUseViewer/ 3 Figures for other years can be found in Chapter 1
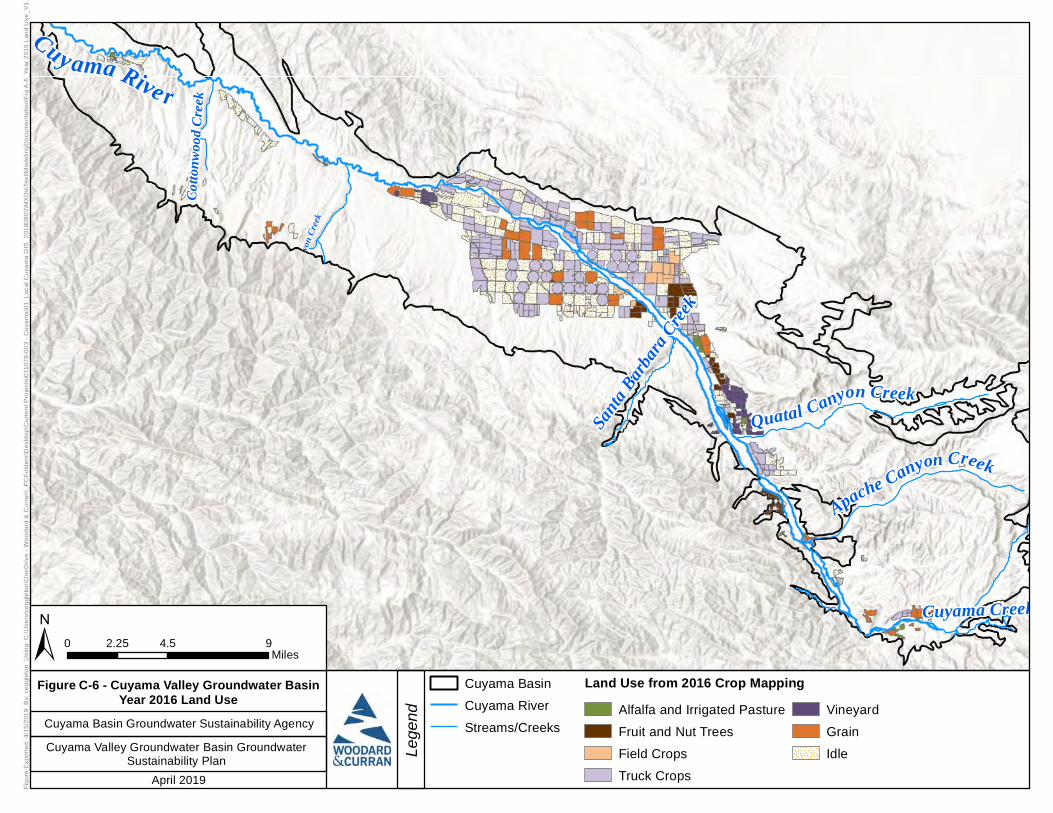
Aliso
Cany
on Cr
eek
Apache Canyon Creek
Quatal Canyon Creek
Cotto
nwoo
d Cree
k
Cuyama CreekSan
ta Barb
ara Cree
k
Cuy ama Rive r
Lege
nd
Figu
re E
xpor
ted:
4/1
5/20
19 B
y: c
eggl
eton
Usi
ng: C
:\Use
rs\c
eggl
eton
\One
Driv
e - W
ooda
rd &
Cur
ran\
_PC
Fold
ers\
Des
ktop
\Cur
rent
Pro
ject
s\01
1078
-003
- C
uyam
a\01
_Loc
al C
uyam
a G
IS_2
0180
803\
MX
Ds\
Text
\Mod
elin
gDoc
umen
tatio
n\Fi
g A
-6_Y
ear 2
016
Land
Use
_V1.
m
Cuyama BasinCuyama RiverStreams/Creeks
Figure C-6 - Cuyama Valley Groundwater BasinYear 2016 Land Use
± 0 4.5 92.25Miles
April 2019
Cuyama Valley Groundwater Basin Groundwater Sustainability Plan
Cuyama Basin Groundwater Sustainability Agency
Land Use from 2016 Crop MappingAlfalfa and Irrigated PastureFruit and Nut TreesField CropsTruck Crops
VineyardGrainIdle

C-17Groundwater Sustainability Plan
Chapter 2, Appendix C December 2019
Figure C-7: Historical and Projected Land Use in the Basin
Evapotranspiration The crop evapotranspiration (ET) requirement is an important factor in agricultural demand estimation. Every land use category must have evapotranspiration assigned for the simulation period. Due to changes in cropping patterns and irrigation practices over time during the historical calibration period, the ET data are specified as a time series during the entire calibration period. ET values are based on the reference evapotranspiration data from Cuyama CIMIS Station. The reference evapotranspiration was converted to crop evapotranspiration using crop coefficients, supplemented by information developed using the Mapping EvapoTranspiration at High Resolution with Internalized Calibration (METRIC) methodology (as described in Attachment C-3). Crop coefficients for each land use category were developed using a daily root zone water balance model (as described in Attachment C-4). This model is driven by the Landsat Normalized Difference Vegetation Index (NDVI) data set, which was originally developed for the Kaweah Delta Water Conservation District in Tulare and Kings counties. The model simulates the rootzone processes on a daily time step, and using remote sensing data, it can capture changes in the timing and intensity of cropping over time.
In the CBWRM, ET represents the net vertical water flux from the land surface and root zone through the upper model layer. Figure C-8 shows the range in annual evapotranspiration rates for each crop category. For climate change scenarios analyzed for projected future conditions, evapotranspiration rates were modified to reflect the effects of anticipated temperature change (Attachment C-2).

C-18Groundwater Sustainability Plan
Chapter 2, Appendix C December 2019
Figure C-8: Annual Evapotranspiration for Each Land Use Type
CBWRM Layering The CBWRM subsurface zone is characterized by the following three model layers, representing geologic stratification from ground surface to bedrock (listed from top to bottom below) as follows:
• Layer 1: Recent Alluvial aquifer• Layer 2: Older Alluvial aquifer• Layer 3: Morales Formation aquifer
These layers are primarily based on geologic stratification as defined by the USGS (USGS, 2015). They were refined using additional data sets as described in Chapter 2, Section 2.1 of the GSP. Figure C-9 shows the locations of cross sections across the central portion of the Basin as prepared by the USGS in 2013 (USGS, 2013). Figure C-10 shows a west-east cross section that runs near the towns of New Cuyama and Cuyama labeled A-A’, and Figure C-11 shows a south-north cross section labeled B-B’. Figures C-12 through C-14 show the extents and thicknesses of layers 1, 2 and 3 in the CBWRM model.

C-19Groundwater Sustainability Plan
Chapter 2, Appendix C December 2019
Source: USGS, 2015. Figure C-9: Location of USGS 2015 Cross Sections

C-20Groundwater Sustainability Plan
Chapter 2, Appendix C December 2019
Source: USGS, 2015 Figure C-10: USGS Cross Section A-A'

C-21Groundwater Sustainability Plan
Chapter 2, Appendix C December 2019
Source: USGS, 2015 Figure C-11: USGS Cross Section B-B'

!!!
!
!
!
!
!!!
!
! !!
!
!
!
! ! !
!
!
!!
!
!
!
!!
!
!!
!
!!
!!
!
!!
!
!!
!
!
!
!!
!
!
!!
!!
!
!!!
!!
!!
!
!
!
!
!!
!
!
!
!
!!
!
!!
!
!
!
!!!
!
! !!
!
!
! !
!!
!!
!
!
!!!
!
!!! !!
!
!
!!
!!!
!
!!
!!
! ! !
!
!
!!
!!
!
!!!!!!!
!!
! !!
!
!!!!!!!!!!!
! !
!!
!
!
! !
!!
!!
!!!!
!!
!!
!!!!!
!
! !!!!
!!!!!!
!!!!!!!!!!!!!!!!!!!
!
!!!!
!!!!
!!!!!!!!!!!!!! !!
!!!!!
!!!!
!!!
!!
!!!!!
!!!!!!!!!
!!!!!!!!!!!!!!!!!!!!
!!!
!
!!!
!!!!!!!!!
!!!!!!!
!!
!!!!!!!!!!!
!!
!!!
!!!! !
!
!!
!!
! !!!
!
!!!!
!!! !!!!!!!!!
!
!
!!!!!
!!!!!!!
!!!!!!!!!!!!
!!!
!!
!!!!!!!!!!!
!
!!!!
!
! !!!!! ! !
! !
!! !
!!!!!!!!!!!
!!
!
!!
!!!!
!!!!!!
!!!
!!!
! !
!!!
!!!!
!!!!!!
!
!!!!!!!!!!!!!!!!!!
!!! !
!
!
!!
!!!!!!!!!!!!!!!!!!!!
!!!!!!
!!!!!!!!!!!!!!!!!!!
!
!!
!!!
!!!!!!!
!!!
!!!!!!!!!!!!!!!!!!!
!
!!!
!
!!!!
!!!!!
!!!!!!
!!!!
!!!!!!!!!
!!
!!!!
!!!
!!!!!
!!!
!!!!!!!!!!!
!!!!!!
!!
!!!!!
!!!
!!!!!!!!!!!
!!
! !!!!
!!
!!!!
!!!!!!
!!!!!!!!
!!!
!!!!!
!!!!
!!!!!!!!!!!!!!
!! !!!
!!!!
!!!!!!
!!!!!!
!!!!
!!!
!!!!!!
!!!!
!!!!!!!!!!!
!
! !!!!!!!!
!!!!
!!!!!!!!!!!!
!!!!
!!!!!
!!!!!
!!
!!!!!!!!!!
!!!!!!!!!!!!!!!!!
!!!!!!!
!!!!
!!!!!!!!
!!!!!!!!
!!!!!!!!!!
!!!!!!
!!!!!!!!!!!!!!!
!!!
!!!!!
!!!
!!!!!!!!!!!!!!!!
!!!!!!!!!
!!!!!!!!!!!!!!!!!!!
!!!!!
!!
!!!!!!!!!!!!!!!!!!!!!!
!!!!!!!!
!!!!!!!!!!!!!!!!!!!
!!!!
!!!!
!!!!!
!!!!
!
!!!!!!!!!!!!!!!!!!!!!!!!
!!
!!!
!!!!!!!!!!
!!
!
!!!!!!!!!!!!!!!!!!!!!!!!!!!
!!!!!!!!!!
!!
!!!!!!!!!!!!!!!!!!!!!!!!!!!!!!!!
!!!!!!
!!!!!
!!!!
!!!!!!!!!!!!!!!!!!!!!!!!!!!!
!!!!!!!!
!!
!!!!!
!
!!!!!
!!!!!!!!!!!!!!!!!!!!!!!!!!!!!
!!!!!!!!!!
!!!!!!
!!!
!
!!
!!
!
!!!!!!!!!!!!!!!!!!!!!!!!!
!!!!!!
!!!!
!!!!
!!!!!!
!!!!!!!
!
!!!!!!!!!!!!!!!!!!!!!!!
!!!!!!!!!!!!
!!!!!!!!!
!!!!!
!!!!!!!!!!!!!!!!!!!!!!!!!!!!!!!!!!!!!!
!!!!
!!!!!!!!!!!!
!!
!!!!!!!!!!!!!!!!!!!!!!!!!!!
!!!!!!!!!!!!
!!!!!!
!!!
!!!!!!!
!!!
!!!!!!!!!!!!!!!!!!!!!!!!!
!!!!!!!!!!!!!!!
!!!!!!
!!
!!!! !!!!!!!!!!!!!!!
!!!!!!!!!!!!!!!!
!!!!!!!
!!!!!!
!!
! !!!!!!!!!!!!!!!!!!!!
!!!!!!!!!!!!!!!!
!!!!!!!!!
!!!!
!!
!!!!!!!!!!!!!!!!!!!!!!!!!!!!!!!!!!!!
!!!!!!!!!!
!!!
!!!
!!
!!!
!!!!!!!!!!!!!!!!!!!!!!!!!!!!!!!!
!!!!!!!!!!!!!!!
!!!!!
!!!!!!!!!!!!!!!!!!!!!!!!!!!!!!!!!!!!!!!!!!!!!!!!
!!!!!!!!!
!!!!!!!!!!!!!!!!!!!!!!!!!!!!!!!!!!!!!!!!!
!!!!!!!!!!!!!!!!!!!!!!!!!!!!!!!!!!!!!!!!!!
!!!!!!!!!
!!!
!!!!!!!!!!!!!!!!!!!!!!!!!!!!!!!!!!!!!!!!!
!
!!!!!!!!!!!!!!!!!!!!!!!!!!!!!!
!!!!!!!!!!!!
!!!!!
!!!!!!!!!!!!!!!!!!!!!!!!!!!!
!!!!!!!!!!!!!!!!!
!!!!!!!!!!!!!!!!!!!!!!!!!!
!
!!!!!!!!!!!!!!!!!!!!
!!
!!!!!!
!!!!!!!!!!
!!!!!!!!!!!!!
!!!! !
!!!!
!!!!!!
!!!!!
! !!!!
!!!!!!
!!!!!!!!
!
!!!!
!!!
!!
!!!!!!!
!!!!!!!!!
!!
!!!!!!!!
! !!!
!!!!!!!!!!!!
!!!
!!!!!!!!!!!!!!!!!!!!!!
!!!!!!!!!!!!!!!
!
!!!!!!!!!!!!!!!!!!
!
!!!!
!!!
!!!!!!!!!!
!!
!!
!!!!!!!!!
!!
!
!!!!!!!!!!
!!!!!!!!!!!
!!
!!!
!
!!!!!!!!
!!
!!!
!!!
! !!
!!!!!!
!!!!!!!
!!!
!!!!
!!!!
! !!!
!!!!!!!
!!!!!!
!!!!!!!!!!!!
!!!!!!
!!!!!!!
!!!!!!!! !!
!!!!!
!!!!!!!!
!!!
!!!
!!!!!
!!
!!!!!
!!!!!!
!!!
!!!
!!!
!!!!
!!!
!!!!!
!!!!
!!!!
Lege
nd
Figu
re E
xpor
ted:
6/2
0/20
19 B
y: m
ceyh
an U
sing
: \\w
ooda
rdcu
rran
.net
\sha
red\
Pro
ject
s\R
MC
\SA
C\0
0110
78.0
0 - C
uyam
a B
asin
GSP
\C. G
IS\M
XD
s\Te
xt\M
odel
Doc
\Fig
ureC
-XX
-XX
_Mod
elLa
yerE
xten
ts.m
xd
Layer 1 Thickness (ft)! 10 - 100! 101 - 200! 201 - 300! 301 - 400
! 401 - 500! 501 - 600! 601 - 700! 701 - 800! 801 - 900
! 901 - 1000! 1001 - 1100! 1101 - 1200
Figure C-12 - CBWRM Layer 1Extent and Thickness
± 0 7 143.5Miles
December 2019
Cuyama Valley Groundwater Basin Groundwater Sustainability Plan
Cuyama Basin Groundwater Sustainability Agency

!
!
!
!!
!
!
!
!
!!
!!
!
!!
!!!!
!
!!
!
!
! !!!!
!!!!
!
!
!
!!!!!!
!!
!!!!!!
!!!!!!!!!
!!!
! !
!!
!!!!
!!
!!
!!!!
!
! !!!!
!!!!!!
!!!!!!!!!!!!!!!!!!!
!!!
!
!!!!!!!!!!!! !!
!!!!!
!!!!
!!
!!!!!
!!!!!!!!!
!!!!!!!!!!!!!!!!!!
!!!!!
!!
!!
!!
!!!!!!!!
!!!!!!!
!!
!!!!!!!!!!!
!
!
!!!!
!!
!
! !!!
!!
!!!! !!!
!!!!!!!!!!!!!!!!!
!!
!!!!
!!!!!!
!!!!!!!!!!!!
!!!
!!!!!!!!!!!
!!!
!!
! !!!!!
! !
!!!!!
!!!!
!!!!!!!
!!
!!
!
!!!!!!!!!!!
!!
!
!!
!!!!
!!!!!!
!!!
!!!!
!!!
!
!!
!!!!
!!!!!! !!
!!!
!!!
!!
!!!
!!
!
!
!!!!!!!!!!!!!!!!!!
!!!!!
!!!!
!! !!
!!
!
!!!
!!!
!!
!!
!
!
!!!
!
!!!!!!!!!!!!!!!!!!!!
!!!!!!!
!!!!
!!!
!!
!!
!!!
!!!!
!!!!!!!!!!!!!!!!!!!
!!!!!!!
!!
!!!!
!
!!!!!
!!!!
!!!
!!!!!!!!!!!!!!!!!!!
!
!!!!!
!!
!
!!!!
!!!!!!!!
!!!!!!
!!!!
!!!!!!!!!!!!!!!
!!!!
!!
!!!!
!!!
!!!!!!
!!!
!!!!!!!!!!!
!!!!!!!!!!!!!!!!!!!!!!
!!
!!!!!
!!!!!
!!!!!!!!!!!
!!!
!!!!!!!!!!!!!!!!!!
!!!!
!!
!!!!
!!!!!!
!!!!!!!!
!!!
!!!!!!!!!!!!!!!!!!!!!
!!!!!!
!!!!!
!!!!
!!!!!!!!!!!!!!!
!!!!!
!!!!!!!!!!!!!!!!!!!
!!!!
!! !!!
!!!!
!!!!!!
!!!!!!
!!!!!
!!!!!!!
!!!!!!!!!!!!!!!!!!!
!
!!!
!!!!!!
!!!!
!!!!!!!!!!!
!!!!!!!!!!
!!!!!!!!!!!!!!!!!!!
! !!!!!!!!
!!!!
!!!!!!!!!!!!!!!!!!!!!!!
!!!!!!!!!!!!!!
!!!!!!
!!!!
!!!!!
!!!!!
!!
!!!!!!!!!!!!!!!!!
!!!!!!!!!!!!!!!!!!!!!!!
!!!!!!!!
!!!!!!!!!!
!!!!!!!
!!!!!!!!!!!
!!!!!!!!
!!
!!!!!!!!!!
!!!!!!!!
!!!!!!!!!!!!!!!
!!!!
!!!!!
!!!!!!
!!!!!!!!!!!!!!!
!!!
!!!!!!!!!!!!!
!!!!!
!!
!!!
!!!!!!!!!!!!!!!!
!!!!!!!!!!!!!!
!!!!!!
!!!!
!
!!!!!!!!!!!!!!!!!!!
!!!!!
!!!!!!!
!!!!!
!!
!!!
!!!!!!!!!!!!!!!!!!!!!!!
!!!!!!!!
!!!!
!!!!!!!
!!!!
!!!
!!!!!!!!!!!!!!!!!!!
!!!!
!!!!
!!!!!
!!!!
!!!!!!!
!!!!!
!!!
!
!!!!!!!!!!!!!!!!!!!!!!!!
!!
!!!
!!!!!!!!!!
!!!!!
!!!!!
!!!
!!
!
!!!!!!!!!!!!!!!!!!!!!!!!!!!
!!!!!!!!!!!
!!!!!
!!!!!
!!
!
!!
!!!!!!!!!!!!!!!!!!!!!!!!!!!!!!!!
!!!!!!!!!!!!
!!!
!!!!
!
!
!
!!!!
!!!!!!!!!!!!!!!!!!!!!!!!!!!!
!!!!!!!!!!!!
!!!
!!!!! !!!
!
!!
!
!!!!!
!!!!!!!!!!!!!!!!!!!!!!!!!!!!!
!!!!!!!!!!
!!!!!!
!!!!
!
!!
!!
!
!!!!!!!!!!!!!!!!!!!!!!!!!
!!!!!!
!!!!
!!!!
!!!!!!
!!!!!!!!
!
!!!
!
!
!!!!!!!!!!!!!!!!!!!!!!!
!!!!!!!!!!!!
!!!!!!!!!!!!!!!!
!
!!!!!
!
!!!!!!!!!!!!!!!!!!!!!!!!!!!!!!!!!!!!!!
!!!!
!!!!!!!!!!!!
!!!!
!!
!!!!
!!!!!!!!!!!!!!!!!!!!!!!!!!!
!!!!!!!!!!!!
!!!!!!
!!!
!!!!!!!
!!
!!!!!
!!!
!!!!!!!!!!!!!!!!!!!!!!!!!
!!!!!!!!!!!!!!!
!!!!!!!!!!
!!!
!!!!
!!!! !!!!!!!!!!!!!!!
!!!!!!!!!!!!!!!!
!!!!!!!
!!!!!!!!!!!!!!!!!
!! !!
! !!!!!!!!!!!!!!!!!!!!
!!!!!!!!!!!!!!!!
!!!!!!!!!
!!!!
!!!
!!!!!!!!
!!!!
!!!!!!!!!!!!!!!!!!!!!!!!!!!!!!!!!!!!!!
!!!!!!!!!!
!!!
!!!!!!
!!!!!!!!!
!!!
!!
!!!
!!!!!!!!!!!!!!!!!!!!!!!!!!!!!!!!
!!!!!!!!!!!!!!!!!
!!!
!!!!!!!!!!!!!
!!!!!
!!!!!!!!!!!!!!!!!!!!!!!!!!!!!!!!!!!!!!!!!!!!!!!!!
!!!
!!!!!!!!!!!!!!!!!!!
!!!!!!!!!
!!!!!!!!!!!!!!!!!!!!!!!!!!!!!!!!!!!!!!!!!!
!!!
!!!!!!!!!!!!!!!!!!
!
!!!!!!!!!!!!!!!!!!!!!!!!!!!!!!!!!!!!!!!!!!
!!!!!!!!!!!
!!!!!!!!!
!!!!!!!!!!!!
!!!
!!!!!!!!!!!!!!!!!!!!!!!!!!!!!!!!!!!!!!!!!
!!!!!
!!
!!!!!!!
!!!!!!!!!!!
!!!!!!!!!!!!!!!!!!!!!!!!!!!!!!
!!!!!!!!!!!!
!!!!!!
!!!!
!!!!!!!
!!!!!!!!!!!!!
!!!!!!!!!!!!!!!!!!!!!!!!!!!!
!!!!!!!!!!!!!!!!!!!
!!!!!!!!!
!!!!!!!!!!!!!!!!!
!!!!!!!!!!!!!!!!!!!!!!!!!!!
!!!!!!!!!!!!!!!!!!!!!!!!!!!!!!!!!!!
!!!!!!!!!!!!!!!!!!!!!
!!!!!!!!!!!
!!!!!!!!!!!!!!!!!!!!!!!!
!!!
!!!!!
!!!!!!!!!!!!!!!!!!!!!
!!
!!!!!!!!!!!!!!!!!!!!!!!!!!!!!
!!
!
!!!!!!!!!!!!!!
!!!!!!!!!!!!!!
!
!!!!!!!!!!!!!!!!!!!!!!!!!!!
!!
!!!!! !
!!!!!!!!!!!!!!!!!!
!!!
!!!!!!!!!!!!!!!!!!!!!
!!!!
!!
!!!!!!!!!!!!!!!!!!
!!!!!!!!!!!!!!!!!!!!!!!!!
!!!!
!!!!!
!!
!!!!!!!!!!!!!!!!!!!!!!
!!
!!!!!!!!!!!!!!!!!!!!!!!
!!
!!
!!
!!! !
!!!!!!!!!!!!!!!!!!
!!!!!!!!!!!!!!!!!!!!!!!!!!!
!!!
!
!!
!!!
!!
!!!!!!!!!!!
!!!!!!!!!!!!!!!!!!!!!!!!!!!!!!!!!!!
!!!!!
!!!!!
!!!
!!!
!!!!!!!!!!!
!!!!!!!!!!!!!!!!!!
!!!!!!!!!!!!
!!!!!!!!!!!
!!!!!
!
!!!!
!!!!!!!!!!!!!!!!!!!!!!!!!!!!!
!!!!!!!!!!!!!!!!!!!!
!!!!!!!!!!
!!!
!!!!!!!!!!!
!!!!!!!!!!!!!!!!!!!!!!!!!!!!!!!!!!!!!!!
!!!!!!!!!!
!!!!!
!!
! !!!!!!!!!!!!!!!!!!!!!!!!!!!!!!!!!!!!!!!!!!!!!!!!
!!!!!!!
!!!!!!!!!!
!
!
!!!
!
!
!
!!!!!!!!!!!!!!!!!!!!!!!!!!!!!!!!!!!!!!!!!!!!!!!!!!!!!!!
!!!!!!!!!!!!!
!!!!
!!
!!!
!!
!
!
!
!!!!!!!!!!!!!!!!!!!!!!!!!!!!!!!!!!!!!!!!!!!!!!!!!!!!!!
!!!!!!!!!!!
!!!!!!!
!!!
!!
!!!!
!!!
!!
!
!!!!!!!!!!!!!!!!!!!!!!!!!!!!!!!!!!!!!!!!!!!!!!!!!!!!!!!!!
!!!!!!!!!
!!!!!!!!!!!
!!!
!
!!!
!
!
!
!!!!
!!!!
!!!!!!!!!!!!!!!!!!!!!!!!!!!!!!!!!!!!!!!!!!!!!!!!!!
!!!!!!!!
!!!!!!!!
!!!!
!!!
!!
!!
!
!!
!!!!!!!!!
!!!!!!!!!!!!!!!!!!!!!!!!!!!!!!!!!!!!!!!!!!!!!!
!!!!!
!!!!!!!!!!!!!!!!
!!!!!!
!
!!
!
!!!!!!!!!!
!!!!!!!!!!!!!!!!!!!!!!!!!!!!!!!!!!!!!!
!!!!!
!!!!!!!!!!!!!!
!!!!!!
!!
!!!!!!!!!
!!!!!!!!!!!!!!!!!!!!!
!!!!!!
!!!!!!!!!
!!!
!!
!!!!
!
!!!!!!!
!!!!!!!!!
!!!
!!!!!
!!!
! !!
!!!!!!!
!!!!!!!!!!
!!!
! !!!
!!!!!!
!!!!!
!!!!!!!!!!!!
!!!!!!!!!!
!!!!!!
!!!! !!!!!!
!!!!!!
!!!!
!!!
!!!
!!!!!!
!!
!!!!!
!!!!! !!
Lege
nd
Figu
re E
xpor
ted:
6/2
0/20
19 B
y: m
ceyh
an U
sing
: \\w
ooda
rdcu
rran
.net
\sha
red\
Pro
ject
s\R
MC
\SA
C\0
0110
78.0
0 - C
uyam
a B
asin
GSP
\C. G
IS\M
XD
s\Te
xt\M
odel
Doc
\Fig
ureC
-XX
-XX
_Mod
elLa
yerE
xten
ts.m
xd
Layer 2 Thickness (ft)! 10 - 100! 101 - 200! 201 - 300! 301 - 400
! 401 - 500! 501 - 600! 601 - 700! 701 - 800! 801 - 900
! 901 - 1000! 1001 - 1100! 1101 - 1200
Figure C-13 - CBWRM Layer 2 Extent and Thickness
± 0 7 143.5Miles
December 2019
Cuyama Valley Groundwater Basin Groundwater Sustainability Plan
Cuyama Basin Groundwater Sustainability Agency

!!
!
!
!!!
! !
!
!
!!
! !
!
!!
!
!
!
!!
!!
!
!
!!
!
!
!
!!
!
!
!
!
!
!
!! !
! !
!
!
!
!
!!
!! !
!
!!
!
!
! ! !
!
!
!
!!!
!
!
!
! !!
!
!
!!
!
!
!
!
!!
!!
!!
!
!
!
! ! !
!
! !!
!
! !!
!
!!
!
!
!
!!
!
!!
!!
! !
! ! !
!
!
!
!!
!
!!
!
!!
!
!!!
!
!
! !!
!!
!
!
! !
! !!
!
!
!!
!!
!
! ! ! !!
!!
!
!!
!
!!
!
!
!
! ! !
!!
!!
!
! ! !
!
!!
!!
!!!
!!
!!!
!!
!
!!!
!! ! !
!
! !
!
!
!
!!!
!
!
! !
!!!
!
! !
!!!
! !
!
! !! !
!
!!!
!!
!
!
!!
!!!
!!
! !
!!
!!
!!!
!!
!
!!
!
!
! !
!
! !!!! !
!
!!
!
!! !! !
!!
!!
!
!
! !
!
!!!
!!!!
!!
!!
!
! !
!
!!!
!!
!!
!
!!
!!
! !
!!!! !
! !! ! !
!!!!
!
!!
!!
!
!
!!
!
!
!!!!
!
!
! !!
! !!!
!!
!
!!
!!
!
!
!!
!!
!!
!!!
!
!!! !
!!
! !! ! ! !
! ! ! !!
!
!!!
!
!!
!
!
!
!
! !
!!!
!
!!!! !
!!! !!
! !
!
!
!
! !! !!! !
! !!!
!!
!!! !
!!!!!!!!
!!
!
!
!
!!
!
!!
!
!
!!!
!!!!
!
!!!!!!!
!!!
!
!
!
!!!
!
!!!!!! ! !
!!! !
!!!!!!!!!!
!!!!!
!!!
!
!!
!!
!!!
!!
! !!!
!!!!!
!!!!!!!!!!!
!!
!
!!!
!
!
! !!!!!! ! !
!!! !!!
!!!!!!!!!!!!!
!!!!
!
!!
!
!!
!
!!! !
!!!!!!!!!
!!
!!!!
!!!!!!!
!
!
!!!!!!!
!! !
!!!!!!!!
!!!!! !
!!!!!!!!
!!!!!!!!!!!!!!!!!
!
!!
!
!!
!!
!!!!!!!!!!!!!!!!! !
!!!!
!!
!!!!
!!
!!
!!!!!
!
! !!!!
!!!!!!!!
!!!!!!
!!!!!!!! !!!
!
!!
!
!!!!
!!!!!
! !!!!
!!!!!!!!!!!!!! !!
!!!!!
!!!!
!!!
!!
!!!!!!
!!!!!!!!!!! !
!!!!!!!!
!!!
!
!!!
!!!
!!!!!!!
!
!!!!!!!!!
!!!!!!!
!!
!!!!!!!!!!!
!!
!!!
!!!! !
!
!!
!!
! !!!
!!! ! !!
!!!
!!!
!!
!!
!
!!!!
!!!!!
!!!!!
!!!!!!!!!!!!
!!!
!!
!!!!!!!!!!!
!
!
!!!!
!
!!
! !!!!!!! !
!
!!!
!!!
!!
!
!!!!!!!!!!!
!!
!
!!
!!!!
!!!!!!
!!!
!!!!!!
!
! !
!
!!!
!
!
!!
!!!
!!
!
!!!!!
!!
!!!!!!!!!!!!!!!!!!
!!!!!
!!!!
!! !!
!!!!!!!
!
!
!
!!!!
!
!
!!!
!
!!!!!!!!!!!!!!!!!!!!
!!!!!!!!!!!!!!!!
!
!!!!
!!!
!!!!!!!
!!!!
!!!!!!!!!!!!!!!!!!!
!!!!!!!!!!!
!!!!!!!!!
!!
!!
!!!!
!!!
!!
!!!!!
!!!!
!!!
!!!!!!!!!!!!!!!!!!!
!
!!!!!!!!!
!! !!
!
!
!!!!!!
!!!!!!!!
!!!!!!
!!!!
!!!!!!!!!!!!!!!
!!!!!!!!
!
!
!
!
!!!!
!!
!!!!!!
!!!
!!!!!!!!!!!
!!!!!!!!!!!!!!!!!!!!!!!!!
!!
!!
!!
!!!!!
!!!!!
!!!!!!!!!!!
!!!
!!!!!!!!!!!!!!!!!!
!!!!!
! !!!!!
!!!
!!
!
!!
!!!!
!!!!!!
!!!!!!!!
!!!
!!!!!!!!!!!!!!!!!!!!!
!!!!!!!!!!! !
!!
!
!!!!!
!!!!
!!!!!!!!!!!!!!!
!!!!!
!!!!!!!!!!!!!!!!!!!
!!!!
!!
!!!!!
!
!! !!!
!!!!
!!!!!!
!!!!!!
!!!!!
!!!!!!!
!!!!!!!!!!!!!!!!!!!
!!!!
!
!!
!
!!!
!!!!!!
!!!!
!!!!!!!!!!!
!!!!!!!!!!
!!!!!!!!!!!!!!!!!!!!!
!
!
! !!
!! !!!!!!!!
!!!!
!!!!!!!!!!!!!!!!!!!!!!!
!!!!!!!!!!!!!!
!!!!!!!!!
!
!
!
!!!!!
!!!!!
!!!!!
!!
!!!!!!!!!!!!!!!!!
!!!!!!!!!!!!!!!!!!!!!!!!!!!!!!!
!
!!!!!!!!!
!!!!!!!!!!
!!!!!!!
!!!!!!!!!!!
!!!!!!!!
!!!!!!!
!!!!!!!!!!!
!!!!!!!!
!!!!!!!!!!!!!!!
!!!!
!!!!!
!
!
!!!!!!
!!!!!!!!!!!!!!!
!!!
!!!!!!!!!!!!!
!!!!!
!!
!
!!!!
!!!!!!!!!!!!!!!!
!!!!!!!!!!!!!!
!!!!!!
!!!!
!!
!!!!!!!!!!!!!!!!!!!!
!!!!!
!!!!!!!
!!!!!
!!
!!!!!
!!!!
!!!!!!!!!!!!!!!!!!!!
!!!!!!!!
!!!!
!!!!!!!
!!!!
!!!
!
!!!!!!!!!!!!!!!!!!!!
!!!!
!!!!
!!!!!
!!!!
!!!!!!!
!!!!!
!!!
!!
!
!!!!!!!!!!!!!!!!!!!!!!!!
!!
!!!
!!!!!!!!!!
!!!!!
!!!!!
!!!
!!!
!!
!!!!!!!!!!!!!!!!!!!!!!!!!!!
!!!!!!!!!!!
!!!!!
!!!!!
!!
!
!!
!!
!
!!!!!!!!!!!!!!!!!!!!!!!!!!!!!!!!
!!!!!!!!!!!!
!!!
!!!!
!
!
!!
!!
!!!!
!!!!!!!!!!!!!!!!!!!!!!!!!!!!
!!!!!!!!!!!!
!!!
!!!!! !!!
!
!!!
!
!
!!!!!
!!!!!!!!!!!!!!!!!!!!!!!!!!!!!
!!!!!!!!!!
!!!!!!
!!!!
!
!!
!!!
!
!
!!!!!!!!!!!!!!!!!!!!!!!!!
!!!!!!
!!!!
!!!!
!!!!!!
!!!!!!!!
!
!!!
!
!
!
!
!!!!!!!!!!!!!!!!!!!!!!!
!!!!!!!!!!!!
!!!!!!!!!!!!!!!!
!
!!!!!
!
!
!
!!!!!!!!!!!!!!!!!!!!!!!!!!!!!!!!!!!!!!
!!!!
!!!!!!!!!!!!
!!!!
!!
!!!!!
!
!!!!!!!!!!!!!!!!!!!!!!!!!!!
!!!!!!!!!!!!
!!!!!!
!!!
!!!!!!!
!!
!!!!!
!
!
!!!
!!!!!!!!!!!!!!!!!!!!!!!!!
!!!!!!!!!!!!!!!
!!!!!!!!!!
!!!
!
!!!!!
!!!! !!!!!!!!!!!!!!!
!!!!!!!!!!!!!!!!
!!!!!!!
!!!!!!!!!!!!!!!!!
!
!!!
! !!
! !!!!!!!!!!!!!!!!!!!!
!!!!!!!!!!!!!!!!
!!!!!!!!!
!!!!
!!!
!!!!!!!!
!!!!!!
!
!!!
!!!!!!!!!!!!!!!!!!!!!!!!!!!!!!!!!!!!!
!!!!!!!!!!
!!!
!!!!!!
!!!!!!!!!
!!!
!!!!
!!
!!
!!!
!!!!!!!!!!!!!!!!!!!!!!!!!!!!!!!!
!!!!!!!!!!!!!!!!!
!!!
!!!!!!!!!!!!!!
!!!
!
!!!!!!
!!!!!!!!!!!!!!!!!!!!!!!!!!!!!!!!!!!!!!!!!!!!!!!!!
!!!
!!!!!!!!!!!!!!!!!!!!
!!!
!!!!!!!!!!!
!!!!!!!!!!!!!!!!!!!!!!!!!!!!!!!!!!!!!!!!!!
!!!
!!!!!!!!!!!!!!!!!!
!!!!
!!!
!!!!!!!!!!!!!!!!!!!!!!!!!!!!!!!!!!!!!!!!
!!!!!!!!!!!
!!!!!!!!!
!!!!!!!!!!!!
!!
!!!!
!!!!!!!!!!!!!!!!!!!!!!!!!!!!!!!!!!!!!!!!!
!!!!!
!!
!!!!!!!
!!!!!!!!!!!
!
!!!!!!!!!!!!!!!!!!!!!!!!!!!!!!!
!!!!!!!!!!!!
!!!!!!
!!!!
!!!!!!!
!!!!!!!!!!!!!!
!
!!!!!!!!!!!!!!!!!!!!!!!!!!!!!
!!!!!!!!!!!!!!!!!!!
!!!!!!!!!
!!!!!!!!!!!!!!!!!!!!!
!
!!!!!!!!!!!!!!!!!!!!!!!!!!!!
!!!!!!!!!!!!!!!!!!!!!!!!!!!!!!!!!!!!!
!
!!!!!!!!!!!!!!!!!!!!!!
!!!!!!!!!!!!!!
!!!!!!!!!!!!!!!!!!!!!!!!
!!!
!
!!!!!!!
!!!!!!!!!!!!!!!!!!!!!
!!!!!!!!!!!!!!!!!!!!!!!!!!!!!!!!!!!
!!
!
!
!
!!!!!!!!!!!!!!!
!!!!!!!!!!!!!!
!!!!!!!!!!!!!!!!!!!!!!!!!!!!!!!!
!!!!
!!!
!!!!!! !
!!!!!!!!!!!!!!!!!!
!!!!!!!!!!!!!!!!!!!!!!!!
!!!!!!!!
!!!!
!!
!!!
!!!!!!!!!!!!!!!!!!!!!!!
!!!!!!!!!!!!!!!!!!!
!!!!!!!!
!!!!!!
!
!
!!!
!!!!!!!!!!!!!!!!!!!!!!
!!!!!!!!!!!!!!!!!!!!!!!!!!!!!!!!
!!
!!!
!!
!
!
!!!! !
!!!!!!!!!!!!!!!!!!
!!!!!!!!!!!!!!!!!!!!!!!!!!!
!!!!!!
!!!
!!
!!!
!!
!
!!!!!!!!!!!!
!!!!!!!!!!!!!!!!!!!!!!!!!!!!!!!!!!!
!!!!!!!
!!!!
!!!!!
!!!
!!
!
!
!!
!!!
!!!!!!!!!!!
!!!!!!!!!!!!!!!!!!
!!!!!!!!!!!
!!!!!!!!!!!!!!!
!!!!!
!!
!!
!!
!
!
!
!!!
!
!
!!!!!
!!!!!!!!!!!!!!!!!!!!!!!!!!!!!
!!!!!!!!!!!!!!!!!!!!
!!!!!!!!!!
!!
!!!!!!!
!!!
!
!
!
!! !!!!!!!!!!!
!!!!!!!!!!!!!!!!!!!!!!!!!!!!!!!!!!!!!!!
!!!!!!!!!!
!!!!!!!
!!
!!
!!!
!!
!
!
!
!
!
!
!
!
! !!!!!!!!!!!!!!!!!!!!!!!!!!!!!!!!!!!!!!!!!!!!!!!!
!!!!!!!
!!!!!!!!!!
!!!!!!
!!!!!
!!!
!!
!!
!
!
!
!!
!!
!!!!!!!
!!!!!!!!!!!!!!!!!!!!!!!!!!!!!!!!!!!!!!!!!!!!!!!!!!!!!!!!!!!!!!
!!!!!!!!
!!
!!
!!!!
!
!!
!!
!
!
!!
!
!
!!
!!!!!!!!!!!!!!!!!!!!!!!!!!!!!!!!!!!!!!!!!!!!!!!!!!!!!!
!!!!!!!!!!!!
!!!!!!
!!!!!!
!!
!!
!!!!!!
!!!
!!!
!!!
!!
!!
!!
!
!!!!!!!!!!!!!!!!!!!!!!!!!!!!!!!!!!!!!!!!!!!!!!!!!!!!!!!!!!
!!!!!!!!!
!!!!!!!!!!!
!!!
!
!!!!!
!!
!!
!!
!
!
!
!
!
!
!
!
!!
!!
!!!
!!!!
!!!!!!!!!!!!!!!!!!!!!!!!!!!!!!!!!!!!!!!!!!!!!!!!!!
!!!!!!!!
!!!!!!!!
!!!!
!!!
!!!!
!!
!!!
!!
!
!
!!
!!
!
!!
!!
!
!
!!
!!!!!!!!!
!!!!!!!!!!!!!!!!!!!!!!!!!!!!!!!!!!!!!!!!!!!!!!
!!!!!
!!!!!!!!!!!!!!!!
!!!!!!
!!!!!
!!!!!!
!!
!!!!
!!
!!
!
!!
!!
!
!
!!!!!!!!!!!
!!!!!!!!!!!!!!!!!!!!!!!!!!!!!!!!!!!!!!
!!!!!
!!!!!!!!!!!!!!
!!!!!!
!!!
!!!!
!!!!!!!
!!!!
!!!
!!
!!
!
!
!
!
!!!!!!!!!
!!!!!!!!!!!!!!!!!!!!!
!!!!!!
!!!!!!!!!
!!!
!!
!!!!!!!!!!!!
!!!
!
!!
!
!
!
!
!
!
!
!!!!!!!
!!!!!!!!!
!!!
!!!!!!!!!!!!
!!!
!!
!
!!
!!
!
!
!
!
!
! !!!!
! !!
!!!!!!!!!!!!!!!
!!!!!
!!!!
!!
!!
!
!
!
!
!
!!!!!!!!!!!
!!!!!!!
!!!!!
!!!
!!!!
!!!!!
!!
!
!!
!
!
!
! !!!!!
!!!!
!!!!!!!!!!!!!!
!!!!
!
!
!
!!
!!
!!!!
!!!!!!!!!!!!!!!!!
!!!!!!!
!!!!
!
!!
!!
!!!!!!!
!!!!!!!!!!
!!!!!!!!
!!!!
!
!
!
!!!!!!!!
!!!!!!!!!!!!
!!!!!!!!!
!!!
!!!
!
!!
!!!!
!!!!!!
!!!!!!!!
!!!
!!!
!!!!!!
!!
!!
!!!!!!!
!!
!
!!!!!
!!!!!!
!
!!
!!!!
!!
!!!
!
!
!
!
!!
!
!!!!
!
!
!!
!!!!!!
!
!
!!!!!!!
!
!
!
!!!!!
!
!
!
!!!!
!!
!
!
!!
!
!
!
!!
!
!
!!!!
!
!
!! !!!
!
!
!
!
!
!
!
!
!
!
!
!
Lege
nd
Figu
re E
xpor
ted:
6/2
0/20
19 B
y: m
ceyh
an U
sing
: \\w
ooda
rdcu
rran
.net
\sha
red\
Pro
ject
s\R
MC
\SA
C\0
0110
78.0
0 - C
uyam
a B
asin
GSP
\C. G
IS\M
XD
s\Te
xt\M
odel
Doc
\Fig
ureC
-XX
-XX
_Mod
elLa
yerE
xten
ts.m
xd
Layer 3 Thickness (ft)! 10 - 100! 101 - 200! 201 - 300! 301 - 400
! 401 - 500! 501 - 600! 601 - 700! 701 - 800! 801 - 900
! 901 - 1000! 1001 - 1100! 1101 - 1200
Figure C-14 - CBWRM Layer 3Extent and Thickness
± 0 7 143.5Miles
December 2019
Cuyama Valley Groundwater Basin Groundwater Sustainability Plan
Cuyama Basin Groundwater Sustainability Agency

C-25Groundwater Sustainability Plan
Chapter 2, Appendix C December 2019
Boundary Conditions As discussed in the previous section, both surface and subsurface inflows within the ungaged watershed areas tributary to the main Basin are simulated using small watersheds module of the CBWRM. No flow boundary conditions were assumed for the rest of the domain boundary.
Initial Conditions Groundwater heads for each model node and each layer at the beginning of the historical simulation (i.e., October 1, 1994) were developed using groundwater level data described in Chapter 2, Section 2.2. Due to the lack of information on well depth and/or perforation for many of the wells used, groundwater heads for each model layer are assumed to be the same. During the calibration process, some refinements were made by layer, as needed. This assumption, however, results in the use of first few years of simulation for start-up period to stabilize the simulated groundwater levels. Therefore, the model calibration period effectively ends up to be the 20-year period of water years 1996 through 2015.
Water Supply and Demand Data The following sections describe the data and methodology for the CBWRM water demand and supply calculations. Agricultural water demands were calculated in the IDC portion of IWFM. Agricultural and domestic supplies are specified in the CBWRM’s groundwater pumping data.
Agricultural Water Demand Agricultural water demand is the amount of irrigation water that is required to satisfy the crops’ evapotranspiration requirement after rainfall. The IDC is designed to estimate the agricultural water demand for each model element through consumptive use methodology. The IDC calculations rely on model input data for historical crop acreage, irrigation practices, soil moisture requirements, effective rainfall (the portion of rainfall available for crop consumptive use), crop evapotranspiration, and localized soil parameters. This data was compiled, analyzed, synthesized, and processed for input into CBWRM.
Domestic Water Use IDC calculates urban water demand based on population and per capita water use, and the breakdown of indoor versus outdoor water use by month. For the Basin, the per capita water use was estimated using historical pumping estimates provided by the CCSD (CCSD 2010 to 2017) and population records published for the CCSD service area. Domestic water use during the historical period ranges between 100 and 200 acre-feet per year (AFY).

C-26Groundwater Sustainability Plan
Chapter 2, Appendix C December 2019
CBRWM Calibration The goals of CBRWM calibration were as follows:
• Achieve a reasonable water budget for each component of the hydrologic cycle modeled (i.e., landand water use, soil moisture, stream flow, and groundwater) that is acceptable by the stakeholders tosupport the development of the GSP
• Maximize the agreement between simulated and observed groundwater levels at select well locations,and simulated and observed streamflow hydrographs at select gaging stations
These objectives are achieved through verification of model input data and adjustment of model parameters.
CBRWM calibration begins after data analysis and input data file development are completed. The calibration effort can be broken down into subsets that align with packages within the IWFM platform. As an integrated surface water and groundwater model, the results of each part of the simulation are dependent on one another. The model calibration can be considered a systematic process that includes the following activities:
• Calibrate water demand estimates for agricultural and urban sectors• Calibrate surface water features, including the small watershed runoff, boundary flows, and
streamflows• Calibrate overall water budgets for the model area, and model subregions• Calibrate simulated groundwater levels to observed groundwater levels• Compare calibration performance with the calibration targets• Conduct additional refinements to model as necessary
The CBWRM was calibrated to historical groundwater elevation data, with the calibration informed by local data provided by private landowners and other stakeholders.
Due to uncertainty in the initial conditions, a one-year warm-up period was included to allow groundwater levels to stabilize. Thus, the model calibration period for the CBWRM is October 1995 through September 2015, or water years 1996 through 2015 (i.e., 20 years).
Calibration of IDC and Root-Zone Parameters The goal of IDC calibration is to estimate a reasonable urban and agricultural demand and develop the components of a balanced root zone budget. IDC calibration serves as the foundation of IWFM calibration as demand estimates directly affect the estimates of groundwater pumping. This part of the calibration effort focused primarily on refining individual budget items, while maintaining reasonable root zone parameters.

C-27Groundwater Sustainability Plan
Chapter 2, Appendix C December 2019
The calibrated IDC was used to estimate monthly agricultural water demand at each model element during the model hydrologic period. To adjust agricultural demand, elemental root zone parameters were adjusted in accordance with the hydrologic soil group. Figure C-15 shows estimates of annual agricultural water demand in the Basin from water year 1998 to water year 2017. The average annual agricultural water demand during these years is estimated to be approximately 59,000 AFY. The year-to-year variability in estimated agricultural demand reflects the variabilities in land use, precipitation, and temperature experienced historically in the Basin.
Figure C-15: Annual Agricultural Water Demand
Calibration of Surface Water Features As discussed above, small watersheds were used to simulate inflows into the model from ungaged watersheds. The small watershed were split between surface water runoff that enters the stream system, percolation that occurs during transport to the streams, and baseflow entering the groundwater system at the model boundary.
In addition to the surface water flows coming from small watersheds, surface water runoff generated over the groundwater basin is collected in the stream network to simulate streamflows and stream-aquifer interaction. Stream-aquifer interaction is calculated based on stream stage, groundwater levels, and channel properties such as streambed hydraulic conductance.

C-28Groundwater Sustainability Plan
Chapter 2, Appendix C December 2019
As discussed above, limited streamflow data are available to perform calibration on surface water flows in the model. One USGS gage is available on the Cuyama River downstream of the Basin (ID 11136800), which is located just upstream of Lake Twitchell. The flows from this gage were adjusted to estimate flows at the downstream boundary of the Basin. These adjusted flows as well as available streamflow data from deactivated and active gages on small watersheds were then compared to the flows resulting from the model calibration process.
Calibration of Water Budgets The aim of the calibration process is to ensure an accurate representation of the hydrologic characteristics of the Basin, confirmed through the analysis of the resulting water budgets. A water budget balances all supplies, demands, and any subsequent change in storage occurring within that specific portion of the hydrologic cycle. IWFM automatically outputs budgets at the subregion scale for processes involving groundwater, the surface layer, streams, the root zone, and small watersheds. IWFM can output select budget information down to a single element or any specific grouping of elements. This feature was used during the calibration process to prepare water budget information by certain geographic areas for planning and comparison purposes.
During this step of the calibration process, CBRWM results are reviewed and summarized into monthly and annual (by water year) budgets. Two key hydrologic components that were reviewed most frequently during the calibration process were the groundwater budget and the land and water use budget. During extensive analysis of water budgets, key model datasets and parameters were adjusted (including parameters related to soil and root zone, small watershed and boundary flows, stream system, and aquifer system), to better match the conceptual understanding of the Basin. CBWRM water budget results are summarized in the following sections.
Land Surface Water Budget The following components are included in the land surface water budget:
• Inflows:— Precipitation
— Applied Water
• Outflows:— Evapotranspiration (Agricultural and Native Vegetation)— Domestic Water Use— Deep Percolation— Runoff
Figure C-16 shows the annual time series of historical land surface inflows and outflows during the calibration period. The Basin experienced about 282,000 AF of inflows each year, of which 223,000 AF is from precipitation and the remainder is from applied water. About 223,000 AFY was consumed as

C-29Groundwater Sustainability Plan
Chapter 2, Appendix C December 2019
evapotranspiration and domestic use, with the remainder either recharging the groundwater aquifer as deep percolation, stream seepage or leaving the Basin as river flow.
Figure C-16: Land Surface Water Budget Annual Time Series in the Calibration Period
Groundwater Budget The following components are included in the groundwater water budget:
• Inflows:— Deep percolation— Gain from stream— Subsurface inflow
• Outflows:— Groundwater pumping

C-30Groundwater Sustainability Plan
Chapter 2, Appendix C December 2019
Figure C-17 shows the annual time series of groundwater inflows and outflows during the calibration period. The Basin average annual historical groundwater budget has greater outflows than inflows, leading to an average annual deficit in groundwater storage of 24,000 AF. The groundwater storage decreases consistently over time, despite year-to-year variability in groundwater inflows.
Figure C-17: Groundwater Budget Annual Time Series in the Calibration Period

C-31Groundwater Sustainability Plan
Chapter 2, Appendix C December 2019
Groundwater Level Calibration The goal of groundwater level calibration is to achieve reasonable agreement between the simulated and observed values (in this case, groundwater levels at the calibration wells). Within the CBWRM, 65 wells were used to evaluate the model calibration at both a regional and local scale. These wells are included in the CBGSA’s Opti data management system. The calibration wells were selected based on their period of record and availability of observation data, spatial distribution across the model, and trends of nearby wells. These calibration wells are shown in Figure C-18.
Figure C-18: Location of Calibration Wells

C-32Groundwater Sustainability Plan
Chapter 2, Appendix C December 2019
Simulated groundwater levels were calibrated to observed levels through systematic adjustments to aquifer parameters including hydraulic conductivity, specific storage, and specific yield. The goal of groundwater level calibration is to achieve the maximum agreement between simulated and observed groundwater elevations at calibration wells while maintaining aquifer parameters within reasonable range. The groundwater level calibration is performed in two stages as follows:
• The initial calibration effort is focused on the regional scale to verify hydrogeological assumptionsmade during model data development and confirm the accuracy of general groundwater flowdirections. During this stage, simulated groundwater elevation trends, flow directions, andgroundwater gradients are compared to those that can be synthesized form the reported data.
• The second stage of calibration of groundwater levels is to compare the simulated and observedgroundwater levels at each calibration well. This comparison provides information on the overallmodel performance during the simulation period. The simulated groundwater elevations at thecalibration wells were compared with corresponding observed values for concurrence in long-termtrends as well as seasonal fluctuations.
The results of the groundwater level calibration indicate that CBWRM reasonably simulates long-term hydrologic responses under various hydrologic conditions, and the short-term monthly or seasonal fluctuations. Attachment 3 shows a selection of calibration wells with their resulting groundwater level hydrographs.
Figures C-19 and C-20 show a statistical comparison of the final simulated and observed groundwater levels across the entire Basin. As shown in these figures, the model results show a strong correlation with the observed data.

C-33Groundwater Sustainability Plan
Chapter 2, Appendix C December 2019
Figure C-19: Comparison of Simulated and Observed Groundwater Levels

C-34Groundwater Sustainability Plan
Chapter 2, Appendix C December 2019
Figure C-20: Histogram of Divergence of Simulated Groundwater Levels from Observed Data
Uncertainty and Sensitivity Assessment To incorporate the uncertainty that originates from various model inputs such as hydraulic parameters, land use, irrigation practices and agricultural demand, an ensemble of perturbed simulation results were analyzed to quantify the overall effect on the groundwater storage change over the historical simulation period.

C-35Groundwater Sustainability Plan
Chapter 2, Appendix C December 2019
Table C-3 shows the range of aquifer hydraulic parameters used in CBWRM as compared to reported values from historical USGS studies. The ranges of horizontal hydraulic conductivity used in CBWRM for layers 1 and 2 is similar to the USGS values. In layer 3, it was necessary to set CBWRM values lower than the reported USGS values in order to provide a good match with historical groundwater levels. The specific yield and specific storage values used in CBWRM are consistent with typical values used for similar geologic formations.
Table C-3: Range of Aquifer Parameters in CBWRM as Compared to Reported Values
Study Horizontal Hydraulic Conductivity (feet/day)
Specific Yield
Specific Storage
Layer 1 Layer 2 Layer 3 CBWRM 3.0x10⁻¹ to
2.4x101 1.0x10⁻² to 1.0x101
1.1x10⁻⁴ to 3.5x10⁻²
0.08 to 0.25 10-6 to 10-4
USGS Pumping Testsa
1.9x10⁻¹ to 5.3x101
5.3x10⁻² to 2.6x101
6.6x10⁻² to 2.7x10⁻¹
N/A N/A
USGS Slug Testsa
N/A 1.5x100 to 2.8x101
1.6x100 to 9.9x100
N/A N/A
aUSGS, 2013b
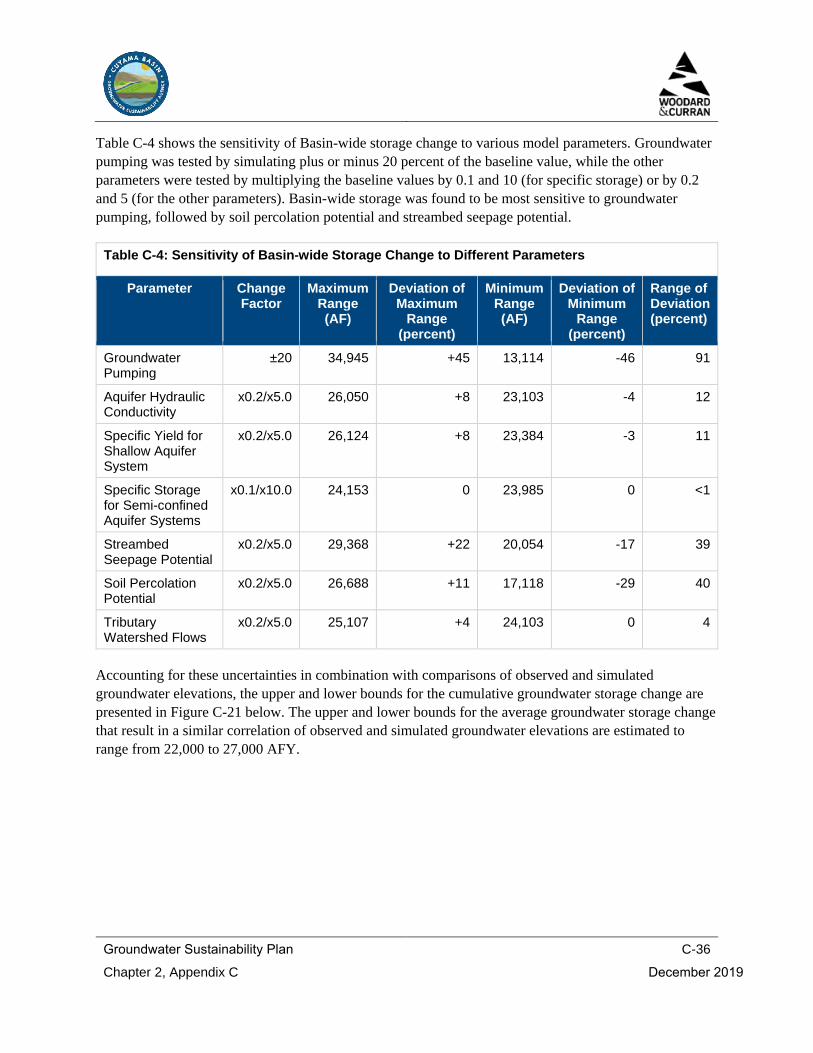
C-36Groundwater Sustainability Plan
Chapter 2, Appendix C December 2019
Table C-4 shows the sensitivity of Basin-wide storage change to various model parameters. Groundwater pumping was tested by simulating plus or minus 20 percent of the baseline value, while the other parameters were tested by multiplying the baseline values by 0.1 and 10 (for specific storage) or by 0.2 and 5 (for the other parameters). Basin-wide storage was found to be most sensitive to groundwater pumping, followed by soil percolation potential and streambed seepage potential.
Table C-4: Sensitivity of Basin-wide Storage Change to Different Parameters
Parameter Change Factor
Maximum Range (AF)
Deviation of Maximum
Range (percent)
Minimum Range (AF)
Deviation of Minimum
Range (percent)
Range of Deviation (percent)
Groundwater Pumping
±20 34,945 +45 13,114 -46 91
Aquifer Hydraulic Conductivity
x0.2/x5.0 26,050 +8 23,103 -4 12
Specific Yield for Shallow Aquifer System
x0.2/x5.0 26,124 +8 23,384 -3 11
Specific Storage for Semi-confined Aquifer Systems
x0.1/x10.0 24,153 0 23,985 0 <1
Streambed Seepage Potential
x0.2/x5.0 29,368 +22 20,054 -17 39
Soil Percolation Potential
x0.2/x5.0 26,688 +11 17,118 -29 40
Tributary Watershed Flows
x0.2/x5.0 25,107 +4 24,103 0 4
Accounting for these uncertainties in combination with comparisons of observed and simulated groundwater elevations, the upper and lower bounds for the cumulative groundwater storage change are presented in Figure C-21 below. The upper and lower bounds for the average groundwater storage change that result in a similar correlation of observed and simulated groundwater elevations are estimated to range from 22,000 to 27,000 AFY.

C-37Groundwater Sustainability Plan
Chapter 2, Appendix C December 2019
Figure C-21: Lower and Upper Bounds for the Groundwater Storage Change
Conclusions and Recommendations The CBWRM is the latest analytical model based on DWR’s state-of-the science modeling platform, IWFM. The CBWRM has relied on data sets from various sources, and was developed to support GSP development with the primary purpose of assessing hydrologic and groundwater conditions in the Basin during the recent historical period from water 1998 to water year 2017. CBWRM also assesses hydrologic and groundwater conditions under the Basin’s current level of development and under projected conditions.
Based on analysis, the following conclusions are made:
1- CBRWM is reasonably calibrated, and reflects a reasonable representation of the Basin’s hydrologicand hydrogeologic conditions
2- CBRWM calibration meets the intended need to support GSP development3- GSP stakeholders and the Technical Forum have reviewed model development and calibration results,
and have agreed that the CBWRM, as it stands, is an appropriate tool to be used for assessment of andplanning for sustainable groundwater conditions in the Basin.

C-38Groundwater Sustainability Plan
Chapter 2, Appendix C December 2019
The following recommended actions would support future model updates:
• Continue engagement with local stakeholders. Continue working with local agencies andgroundwater users in the Basin to further understand the local operations of the groundwater systemand improve representation of groundwater users in the model by collecting additional data. Specificdata to be considered are irrigation practices outside the main District areas, groundwater level data,information on the well profiles and characteristics.
• Perform additional hydrogeological conceptualization. Specific areas can benefit from additionalhydrogeologic investigations. These include eastern part of the basin in the vicinity of the Ventucopaarea, as well as the western part of the model, downgradient from the Russel Fault. In addition, dataabout effectiveness of the fault system in the area are very sparse. Additional targeted groundwaterexploration and/or groundwater level monitoring should focus on the areas near the fault systems.
• Improve streamflow record collection. Currently, there are no long-term streamflow gaging stationswithin the CBWRM. As part of GSP implementation, at least two streamflow gaging stations shouldbe installed and monitored regularly, so that Basin inflows and outflows are properly monitored.
• Improve representation of small watersheds. Surface water flow from and evapotranspirationlosses in the ungaged watersheds represent a relatively large portion of the Basin water budgets.Additional investigations on the native vegetation ET, and runoff conditions in the ungagedwatersheds can improve model representation of this feature.
• Develop groundwater pumping estimates. As groundwater pumping is the primary outflow fromthe groundwater system, an accurate representation of outflow significantly improve CBWRMperformance. A pilot project is recommended to monitor and measure groundwater use and welldischarge for select parcels based on cropping patterns and geographic location relative to the riverand relative to other hydrologic features, such as faults.Incorporate future data into model calibration. Data will be collected using the CBGSA’sgroundwater monitoring network, and should be used to re-assess and improve the HCM, CBWRMparameter values and CBWRM calibration, especially in areas of the Basin where little or no dataexist currently. In addition, model predictions should be compared to actual future climate and wateravailability conditions to provide insights into model performance.
References Brush, Charles F. 2013. Historical Rim Inflows, Surface Water Diversions and Bypass Flows for the
California Central Valley Groundwater-Surface Water Simulation Model (C2VSim), Version 3.02-CG. http://baydeltaoffice.water.ca.gov/modeling/hydrology/C2VSim/download/C2VSim_ Historical_Flows_Diversions_Final.pdf.
California Department of Water Resources (DWR), 2004. Bulletin 118 – California’s Groundwater. Cuyama Valley Groundwater Basin. https://water.ca.gov/LegacyFiles/groundwater/bulletin118/basindescriptions/3-13.pdf.
C-39Groundwater Sustainability Plan
Chapter 2, Appendix C December 2019
California Department of Water Resources (DWR), 2017. IWFM Soil Data Builder with GIS User’s Manual. Version 1.0.41. http://baydeltaoffice.water.ca.gov/modeling/hydrology/ IWFM/SupportTools/index_ Support Tools .cfm.
California Department of Water Resources (DWR), 2018. Fine Grid C2VSim Beta Model. https://data.cnra.ca.gov/dataset/c2vsimfg-beta-model
Cuyama Community Services District (CCSD). 2010-2017. Public Water System Statistics. Provided by the CCSD on May 1, 2018.
Dogrul, Emin C., Tariq N. Kadir, and Charles F. Brush. 2017b. DWR Technical Memorandum: Theoretical Documentation and User’s Manual for IWFM Demand Calculator (IDC-2015), Revision 63. Bay-Delta Office, California Department of Water Resources. http://baydeltaoffice. water.ca.gov/modeling/hydrology/IDC/IDC-2015/v2015_0_63/index_ IDCv2015_0_63.cfm.
United States Department of Agriculture (USDA) Natural Resources Conservation Service (NRCS), 2009. National Engineering Handbook Part 630. Chapter 7: Hydrologic Soil Groups.
PRISM Climate Group, Oregon State University. 2018. http://prism.oregonstate.edu, created July 1, 2018.
United States Department of Agriculture (USDA), 2017a. Natural Resources Conservation Service (NRCS) Web Soil Survey SSURGO Database. https://websoilsurvey.nrcs.usda.gov/.
United States Department of Agriculture (USDA), 2017b. Natural Resources Conservation Service (NRCS) Web Soil Survey United States General Soil Map. https://websoilsurvey.nrcs.usda.gov/.
United States Geological Survey (USGS). 2013. Construction of 3-D Geologic Framework and Textural Models for Cuyama Valley Groundwater Basin, California. https://pubs.usgs.gov/sir/2013/5127/pdf/sir2013-5127.pdf. Accessed January 19, 2018.
United States Geological Survey (USGS). 2013b. Geology, water-quality, hydrology, and geomechanics of the Cuyama Valley groundwater basin, California, 2008–12. https://pubs.usgs.gov/sir/2013/5108/pdf/sir2013-5108.pdf. Accessed January 19, 2018.
United States Geological Survey (USGS). 2015. Hydrologic Models and Analysis of Water Availability in Cuyama Valley, California. https://pubs.usgs.gov/sir/2014/5150/pdf/sir2014-5150.pdf. Accessed June 4, 2018.

C-40Groundwater Sustainability Plan
Chapter 2, Appendix C December 2019

Attachment C-1
Land Use and Consumptive Water Use of Cuyama Groundwater Basin
for Water Years 1996 Through 2016

This page intentionally left blank.

1
TECHNICAL MEMORANDUM – DRAFT
LAND USE AND CONSUMPTIVE WATER USE OF CUYAMA GROUNDWATER
BASIN FOR WATER YEARS 1996 THROUGH 2016
To: Woodard & Curran
From: Land IQ
Date: June 19, 2018
INTRODUCTION
Accurate and current information on constantly changing consumptive water use for crops is critical not only to water rights administration, but also to sustainable groundwater management, agricultural irrigation management, and to environmental and water quality protection. Land IQ has been contracted by Woodard & Curran to analyze consumptive water use in the Cuyama Groundwater Basin for these purposes and overall Groundwater Sustainability Plan (GSP) development data resources.
This memorandum provides methods and results of crop type identification for selected water years (1996, 2000, 2003, 2006, 2009, 2012, 2014 & 2016) during the 20 year time period. Multiple sources of data are used in the identification of each field. These sources include aerial imagery, satellite photography, DWR land use surveys and ground survey information.
This documentation also provides estimates of crop evapotranspiration (ET) for the 1996 and 2016 water years (10/1/1995 – 9/30/1996, 10/1/2015 – 9/30/2016). The surface energy balance model, METRIC (Mapping Evapotranspiration with high Resolution and Internalized Calibration), is applied to estimate monthly and annual evapotranspiration. The input data include CIMIS weather station data and USGS Landsat 5 & 8 satellite images.
DETERMINING LAND USE
Land use is one of the most influential inputs to a consumptive use or groundwater model. This analysis was used to develop estimates of land uses associated with agricultural production in the Cuyama Groundwater Basin. Crop type information optimizes estimations of evapotranspiration, applied water, deep percolation return flows and other water balance input data requirements.
LAND USE DATA SOURCES
Available resources for crop mapping in recent years are more refined and accurate and in past years. Table 1 shows the types of aerial/satellite imagery as well as data availability for each year. Taking this into account, the accuracy and specifity of crop identification is greatest in the most recent mapping years (2014 & 2016). In more recent years, data allows individual crop types to be identified, instead of a more general category (e.g. Miscellaneous Truck Crops).

2
TABLE 1. SUMMARY OF DATA SOURCES AVAILABLE FOR EACH ANALYSIS YEAR
Year Land Use Survey Data
Google Earth NAIP Imagery Landsat
2016
2014
2012 -
2009 -
2006 -
2003 - -
2000 - - -
1996 - -
LAND USE SURVEY DATA
The California Department of Water Resources (DWR) publishes land use data for regions on a rotating schedule for all or portions of each California County (DWR, 2018). The Cuyama Valley was last surveyed by DWR in 1996, including >90% of the fields in the Valley. Since then, Land IQ has completed statewide crop mapping for DWR in 2014 and 2016, encompassing the entire Cuyama Valley. In these three years, this data was used as a base layer and updated as needed.
GOOGLE EARTH
Google Earth provides high resolution satellite imagery with some temporal variation. Currently, most Google Earth data is provided by DigitalGlobe’s WorldView-3 satellite, providing sub-meter resolution (Digital Globe, 2010). The street view function is also very helpful when identifying past years’ crops. The street view in this area is very limited, however, and only available in 2008.
NAIP AERIAL IMAGERY
The National Agriculture Imagery Program (NAIP) captures aerial imagery during the growing season for public use (USDA, 2017). The imagery for the Cuyama Valley was available starting in 2003. NAIP imagery has a fairly high resolution of one meter. This imagery is used to update the field boundary layer for each year because the high resolution allows for the identification of fields that have split or have a different footprint. The drawback to NAIP imagery is that it is only a snapshot in time, with no temporal variation. Figure 1 shows 2009 NAIP imagery of the Cuyama Valley at two different scales to show detail.

3
FIGURE 1. NATURAL COLOR COMPOSITE OF NAIP IMAGE, FOR 05/05/2012; 1:300,000 SCALE ON LEFT; 1:9,000 SCALE ON RIGHT.
LANDSAT SATELLITE IMAGERY
Landsat satellite imagery is a joint project between the USGS and NASA that collects imagery for public use. Landsat provides lower resolution imagery (30 x 30 meter pixels) but at a much higher frequency than NAIP (USGS, 2007). Depending on year and cloud cover, imagery for an area could be as frequent as every 8 days. This frequency allows for the observation of the crop in all stages of development. All imagery dates during the growing season are used to identify the color and texture changes, to support the crop type identification.
The Cuyama Valley is within Landsat reference system path 42 and row 36. Landsat 5, 7, and 8 were used for appropriate years. All available growing season images were utilized, except those that had cloud contamination. Figure 2 is an example of the agriculture area in Landsat 5 on June 26, 2009.

4
FIGURE 2. FALSE COLOR COMPOSITE OF LANDSAT 5 IMAGE, PATH 42 ROW 36, FOR 06/26/2009. AGRICULTURE IS IN THE MIDDLE OF THE IMAGE.
LAND USE RESULTS
Classification and field boundary updates were completed for each year, using the data sources available. Table 2 summarizes the results of the classification and boundaries. The top 5 crop classes during the 20 year period (excluding idle) were miscellaneous truck, miscellaneous grain and hay, carrots, alfalfa and alfalfa mixtures, and apples.

5
TABLE 2. SUMMARY OF CROP MAPPING RESULTS
DWR Crop 1996 2000 2003 2006 2009 2012 2014 2016
Alfalfa & alfalfa mixtures
3,574 2,586 1,950 2,201 935 1,356 168 235
Apples 2,475 2,478 1,417 773 518 282 307 331
Beans (dry) - 259 - - - - 1,064 -
Bush berries - - - - - - - 21
Carrots 4,698 843 307 566 5,582 6,654 2,302 5,572
Citrus - 2 2 2 4 4 2 2
Cole crops - - 107 137 292 236 182 383
Corn, sorghum and sudan
- 185 209 - 74 - 32 173
Grapes 357 794 768 768 765 853 1,303 1,241
Greenhouses - - - - - - - 5
Idle - 8,286 9,971 12,247 9,139 8,449 15,352 13,572
Lettuce/leafy greens - - - 271 212 171 - 612
Melons, squash, and cucumbers
12 - - - - - 562 50
Miscellaneous deciduous
12 10 10 16 41 35 10 6
Miscellaneous field crops
114 - - - - - - -
Miscellaneous grain and hay
7,462 5,756 5,580 4,712 8,767 6,367 851 3,198
Miscellaneous grasses - 192 485 192 111 14 22 -
Miscellaneous subtropical fruit and nut
- - - - - - - 7
Miscellaneous truck 3,723 6,842 8,083 9,380 3,451 4,078 6,100 3,322
Mixed pasture 737 104 91 398 273 392 97 142
Native - - - - - 166 - -
Olives - 4 4 4 4 4 4 517
Onions and garlic 313 10 315 527 983 1,231 615 2,190
Peaches/nectarines 413 348 284 213 75 - - -
Pistachios 676 604 604 757 757 722 802 722

6
DETERMINING CONSUMPTIVE USE Traditional methods of calculating evapotranspiration can be done quite accurately using weighing lysimeters and eddy correlation monitoring techniques. These methods are limited, however, because they provide point values of ET for a specific location and fail to provide the ET on a regional scale. This limitation has motivated the development of using remotely sensed (RS) data from satellites to evaluate ET over vast areas. Satellite data are ideally suited for deriving spatially continuous ET surfaces that can be pared down to the field scale because of their temporal and spatial characteristics. However, the most accurate use of RS models require calibration to surface measurements.
SURFACE ENERGY BALANCE CONSUMPTIVE USE ANALYSIS – METRIC MODEL
METRIC estimates surface evapotranspiration (ET) based on the evaluation of the energy balance at the earth’s surface. METRIC model processes instantaneous remotely-sensed images and weather data, and estimates the partitioning of energy into net incoming radiation (Rn), heat flux into the ground (G), sensible heat flux to the air (H), and latent heat flux (LE). The latent heat flux is computed as a residual in the energy balance, representing the energy consumed by ET. The main advantage of using the energy balance is that the actual ET is computed, rather than a potential ET. A disadvantage of the energy balance approach is in the complexity of calculations and the need for human oversight during calibration. Figure 3 shows a general workflow of the METRIC process.
FIGURE 3. GENERAL WORKFLOW OF THE METRIC PROCESS

7
For the Cuyama Groundwater Basin METRIC application, the Cuyama station (CIMIS station #88) was selected to produce the reference ET (ETo) during calibration. During the internal calibration of sensible heat flux in METRIC, multiple pairs of hot and cold pixels are selected for the model, the one with relative stable result is selected for final calibration. A detailed description of METRIC can be found in Allen et al. (2007a, b; 2008).
METRIC INPUT DATA – SATELLITE IMAGES
The Cuyama Groundwater Basin is within Landsat reference system path 42 and row 36. For the 1996 water year, Landsat 5 images were used, and for the 2016 water year, Landsat 8 images were used. All available images were utilized, except those that had cloud contamination.
Tables 3 and 4 provide a list of the images used for each water year. A total of 14 Landsat 5 images were modeled by METRIC for the 1996 water year, and a total of 17 Landsat 8 images were modeled for the 2016 water year. For each image, the METRIC model was used to estimate actual daily ET. Linear interpolation was then used to calculate monthly and annual ET.
TABLE 3. DATES OF THE LANDSAT 5 SATELLITE IMAGES USED FOR METRIC PROCESSING IN 1996 WATER YEAR
# Date of Landsat Image Type
1 9/24/1995 Landsat 5
2 10/10/1995 Landsat 5
3 11/11/1995 Landsat 5
4 11/27/1995 Landsat 5
5 1/14/1996 Landsat 5
6 5/21/1996 Landsat 5
7 6/6/1996 Landsat 5
8 6/22/1996 Landsat 5
9 7/8/1996 Landsat 5
10 7/24/1996 Landsat 5
11 8/9/1996 Landsat 5
12 8/25/1996 Landsat 5
13 9/10/1996 Landsat 5
14 9/26/1996 Landsat 5

8
TABLE 4. DATES OF THE LANDSAT 8 SATELLITE IMAGES USED FOR METRIC PROCESSING IN 2016 WATER YEAR
# Date of Landsat Image Type
1 10/1/2015 Landsat 8
2 11/18/2015 Landsat 8
3 1/21/2016 Landsat 8
4 2/6/2016 Landsat 8
5 3/9/2016 Landsat 8
6 3/25/2016 Landsat 8
7 4/26/2016 Landsat 8
8 5/12/2016 Landsat 8
9 5/28/2016 Landsat 8
10 6/13/2016 Landsat 8
11 6/29/2016 Landsat 8
12 7/15/2016 Landsat 8
13 7/31/2016 Landsat 8
14 8/16/2016 Landsat 8
15 9/1/2016 Landsat 8
16 9/17/2016 Landsat 8
17 10/3/2016 Landsat 8
METRIC INPUT DATA – WEATHER DATA
METRIC utilizes reference ET as calculated by the ASCE standardized Penman-Monteith equation (ASCE-EWRI 2005) for calibration of the energy balance process. For our study, grass reference ET (ETo) is used in the modeling process. Hourly weather data time steps are needed to represent ETo at the time of the Landsat overpass for calibration of the METRIC energy balance estimation process. ETo was calculated using the RefET software from the University of Idaho (Allen, 2013). California Irrigation Management Information System (CIMIS) weather station #88 at Cuyama was used to provide hourly weather data for ETo calculation. Figure 4 is an example of weather data for May 21st, 1996. Figure 5 shows the annual reference ETo for 1996 and 2016 water years calculated from the CIMIS Cuyama weather station using RefET software.

9
FIGURE 4. CIMIS CUYAMA #88 STATION WEATHER DATA ON MAY 21ST, 1996.
FIGURE 5. REFERENCE EVAPOTRANSPIRATION FOR 1996 AND 2016 WATER YEARS.
0
1
2
3
4
5
6
7
8
9
10
10/1 11/1 12/1 1/1 2/1 3/1 4/1 5/1 6/1 7/1 8/1 9/1
Dai
ly E
To (
mm
)
Month/Day
Reference ET for 1996 and 2016 water years
Eto of 2016 water year Eto of 1996 water year

10
CONSUMPTIVE USE RESULTS
The annual ET data for the 1996 and 2016 water years are summarized by major crop types within each year. Tables 5 and 6 show the results of average crop actual ET. Major crops, such as alfalfa, apples, and carrots, have relative higher annual ET in 2016 than 1996, and these could be attributed to a number of factors:
2016 total annual ETo is higher than 1996 total annual ETo. As shown in Figure 5, during the month of June and July, ETo is consistently higher in 2016.
The underlying crop layers used for generating the statistics are created differently. 2016 crop layer is created by Land IQ while 1996 crop layer is created by DWR.
The field boundary of 2016 is more accurate, compared with 1996 field boundary. And this could cause differences in ET stats.
Crop variety and irrigation methods are different in those 2 years, making crops evaporate more water in 2016.
Figure 6 shows the overview of 2016 water year ET over the whole Cuyama Basin. The focus and calibration area for METRIC ET evaluations was the agricultural growing region (valley floor) itself. The surrounding mountains with different elevations and aspects may have differing results.
TABLE 5. SUMMARY OF CROP EVAPOTRANSPIRATION OF 1996 WATER YEAR
Crop Types 1996 Water Year ET (mm) 1996 Crop Acres
Alfalfa and Alfalfa Mixtures 1163 3579
Apples 905 2478
Carrots 800 4705
Grapes 846 357
Miscellaneous Grain and Hay 590 7474
Miscellaneous Truck Crops 618 3729
Mixed Pasture 807 738
Onions and Garlic 591 313
Peaches/nectarines 819 414
Pistachios 683 677

11
TABLE 6. SUMMARY OF CROP EVAPOTRANSPIRATION OF 2016 WATER YEAR
Crop Types 2016 Water Year ET (mm) 2016 Crop Acres
Alfalfa and Alfalfa Mixtures 1365 235
Apples 1204 331
Carrots 1077 5576
Grapes 822 1242
Miscellaneous Grain and Hay 824 3201
Miscellaneous Truck Crops 818 3324
Mixed Pasture 633 142
Onions and Garlic 986 2192
Pistachios 1266 722
Lettuce/Leafy Greens 789 613
Olives 737 517
Safflower 714 810
FIGURE 6. 2016 WATER YEAR EVAPOTRANSPIRATION OF THE CUYMA BASIN.

12
DATA DELIVERABLES
Data delivered as part of the consumptive water analysis efforts are summarized in Table 7.
TABLE 7. SUMMARY OF CROP MAPPING DATA DELIVERABLES
# File Name Description 1 CuyamaValley_2016_LandUse_Classification.shp Crop classification for 2016 water year
(attribute: Crop2016)
2 CuyamaValley_2014_LandUse_Classification.shp Crop classification for 2014 water year (attribute: Crop2014)
3 CuyamaValley_2012_LandUse_Classification.shp Crop classification for 2012 water year (attribute: Crop2012)
4 CuyamaValley_2009_LandUse.shp Crop classification for 2009 water year (attribute: Crop2009)
5 CuyamaValley_2006_LandUse.shp Crop classification for 2006 water year (attribute: Crop2006)
6 CuyamaValley_2003_LandUse.shp Crop classification for 2003 water year (attribute: Crop2003)
7 CuyamaValley_2000_LandUse.shp Crop classification for 2000 water year (attribute: Crop2000)
8 CuyamaValley_1996_LandUse.shp Crop classification for 1996 water year (attribute: Crop1996)
9 1995-10_ETa.tif Raster image of total evapotranspiration (unit: mm) for October 1995
10 1995-11_ETa.tif Raster image of total evapotranspiration (unit: mm) for November 1995
11 1995-12_ETa.tif Raster image of total evapotranspiration (unit: mm) for December 1995
12 1996-01_ETa.tif Raster image of total evapotranspiration (unit: mm) for January 1996
13 1996-02_ETa.tif Raster image of total evapotranspiration (unit: mm) for February 1996
14 1996-03_ETa.tif Raster image of total evapotranspiration (unit: mm) for March 1996
15 1996-04_ETa.tif Raster image of total evapotranspiration (unit: mm) for April 1996
16 1996-05_ETa.tif Raster image of total evapotranspiration (unit: mm) for May 1996
17 1996-06_ETa.tif Raster image of total evapotranspiration (unit: mm) for June 1996
18 1996-07_ETa.tif Raster image of total evapotranspiration (unit: mm) for July 1996
19 1996-08_ETa.tif Raster image of total evapotranspiration (unit: mm) for August 1996
20 1996-09_ETa.tif Raster image of total evapotranspiration (unit: mm) for September 1996
21 1996_total_ETa_mm.tif Raster image of total evapotranspiration (unit: mm) for 1996 water year

13
22 2015-10_ETa.tif Raster image of total evapotranspiration (unit: mm) for October 2015
23 2015-11_ETa.tif Raster image of total evapotranspiration (unit: mm) for November 2015
24 2015-12_ETa.tif Raster image of total evapotranspiration (unit: mm) for December 2015
25 2016-01_ETa.tif Raster image of total evapotranspiration (unit: mm) for January 2016
26 2016-02_ETa.tif Raster image of total evapotranspiration (unit: mm) for February 2016
27 2016-03_ETa.tif Raster image of total evapotranspiration (unit: mm) for March 2016
28 2016-04_ETa.tif Raster image of total evapotranspiration (unit: mm) for April 2016
29 2016-05_ETa.tif Raster image of total evapotranspiration (unit: mm) for May 2016
30 2016-06_ETa.tif Raster image of total evapotranspiration (unit: mm) for June 2016
31 2016-07_ETa.tif Raster image of total evapotranspiration (unit: mm) for July 2016
32 2016-08_ETa.tif Raster image of total evapotranspiration (unit: mm) for August 2016
33 2016-09_ETa.tif Raster image of total evapotranspiration (unit: mm) for September 2016
34 2016_total_ETa_mm.tif Raster image of total evapotranspiration (unit: mm) for 2016 water year
35 Reference_ETo Reference ET for 1996 and 2016 water years
36 Cuyama Consumptive Use Report Memorandum summarizing consumptive use efforts (this document)

14
REFERENCES
Allen, R.G., 2008. REF-ET: Reference Evapotranspiration Calculation Software for FAO and ASCE Standardized Equations (https://www.webpages.uidaho.edu/ce325/references/manual_prn.pdf). Allen, R.G., Tasumi, M., Morse, A., Trezza, R., Wright, J.L., Bastiaanssen, W., Kramber, W., Lorite, I., Robison, C.W., 2007a. Satellite-Based Energy Balance for Mapping Evapotranspiration with Internalized Calibration (METRIC) – Applications. J. Irrig. Drain Engr., 133(4), 395-406. Allen, R.G., Tasumi, M., Trezza, R., 2007b. Satellite-Based Energy Balance for Mapping Evapotranspiration with Internalized Calibration (METRIC) – Model. J. Irrig. Drain Engr., 133(4), 380-394. DWR, 2018. “Land Use Surveys” https://www.water.ca.gov/Programs/Water-Use-And-Efficiency/Land-And-Water-Use/Land-Use-Surveys. Accessed on 05/30/2018 DigitalGlobe, 2010. "DigitalGlobe Secures $3.55 Billion EnhancedView Agreement with National Geospatial Intelligence Agency (NGA)," http://www.marketwired.com/press-release/digitalglobe-secures-355-billion-enhancedview-agreement-with-national-geospatial-intelligence-nyse-dgi-1301595.htm Accessed on 05/30/2018 USDA, 2017. “NAIP Imagery.” www.fsa.usda.gov/programs-and-services/aerial-photography/imagery-programs/naip-imagery/. Accessed on 05/30/2018 USGS, 2007. “The U.S. Geological Survey Land Remote Sensing Program.” https://pubs.usgs.gov/fs/2007/3021/fs2007-3021.pdf. Accessed on 05/30/2018

Attachment C-2
Climate Change Scenario Development

This page intentionally left blank.

Groundwater Sustainability Plan
Chapter 2, Appendix C, Attachment C-2
Attachment C-2, Page 1
December 2019
1. CLIMATE CHANGE SCENARIO DEVELOPMENT
1.1 Regulatory Background As prescribed in Section 354.18(d)(3) and Section 354.18(e) of the SGMA regulations, climate change conditions were incorporated into the projected water budgets for the Cuyama Valley Groundwater Basin Groundwater Sustainability Plan.
Section 354.18(d)(3) of the SGMA regulations state:
“(d) The Agency shall utilize the following information provided, as available, by the Department pursuant to Section 353.2, or other data of comparable quality, to develop the water budget:
(1) Historical water budget information for mean annual temperature,mean annual precipitation, water year type, and land use.
(2) Current water budget information for temperature, water year type,evapotranspiration, and land use.
(3) Projected water budget information for population, population growth,climate change, and sea level rise.”
Section 354.18(e) of the SGMA regulations state:
“(e) Each Plan shall rely on the best available information and best available science to quantify the water budget for the basin in order to provide an understanding of historical and projected hydrology, water demand, water supply, land use, population, climate change, sea level rise, groundwater and surface water interaction, and subsurface groundwater flow. If a numerical groundwater and surface water model is not used to quantify and evaluate the projected water budget conditions and the potential impacts to beneficial uses and users of groundwater, the Plan shall identify and describe an equally effective method, tool, or analytical model to evaluate projected water budget conditions.”
Climate change analysis is an area with continued evolution in terms of methods, tools, forecasted datasets, and the predictions of actual greenhouse gas concentrations in the atmosphere. There is a large number of available combinations of these elements that result in many potential ways to evaluate climate change impacts. For the purposes of this GSP, the method proposed by the California Department of Water Resources (DWR) as a valid method of evaluation in its guidance document was considered adequate (DWR, 2018). Similarly, the “best available information” was deemed the information provided by DWR, customized for the method proposed.
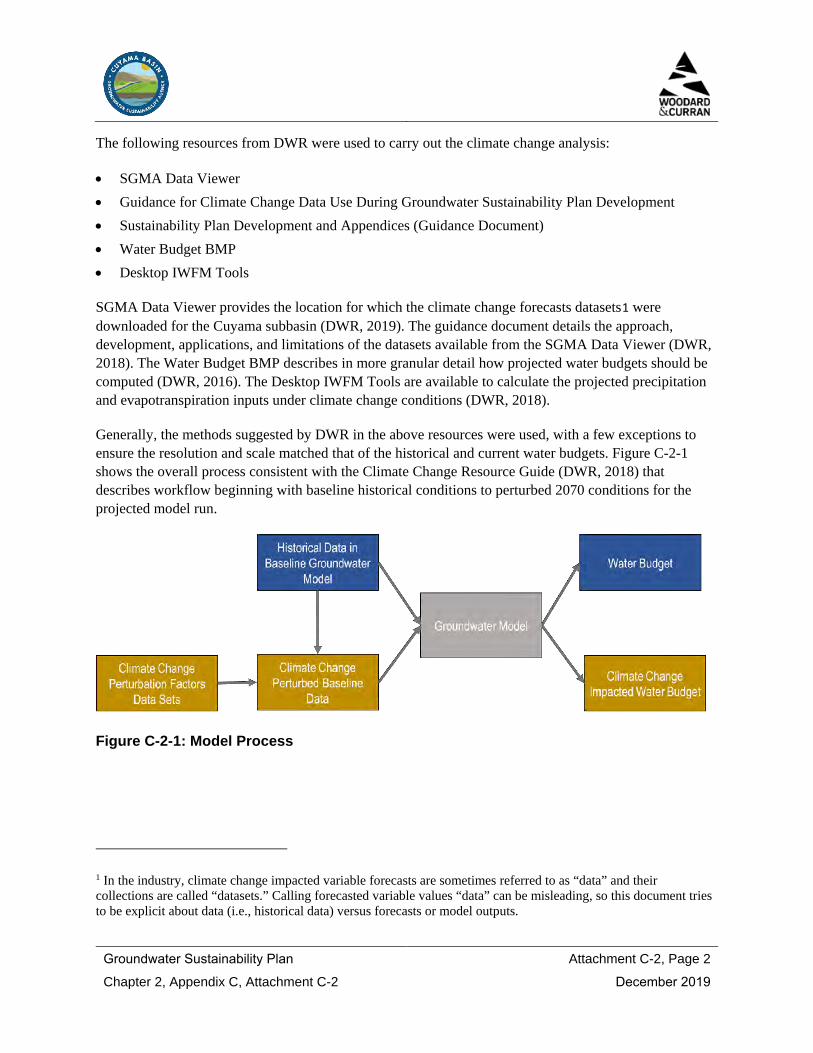
Groundwater Sustainability Plan
Chapter 2, Appendix C, Attachment C-2
Attachment C-2, Page 2
December 2019
The following resources from DWR were used to carry out the climate change analysis:
• SGMA Data Viewer• Guidance for Climate Change Data Use During Groundwater Sustainability Plan Development• Sustainability Plan Development and Appendices (Guidance Document)• Water Budget BMP• Desktop IWFM Tools
SGMA Data Viewer provides the location for which the climate change forecasts datasets1 were downloaded for the Cuyama subbasin (DWR, 2019). The guidance document details the approach, development, applications, and limitations of the datasets available from the SGMA Data Viewer (DWR, 2018). The Water Budget BMP describes in more granular detail how projected water budgets should be computed (DWR, 2016). The Desktop IWFM Tools are available to calculate the projected precipitation and evapotranspiration inputs under climate change conditions (DWR, 2018).
Generally, the methods suggested by DWR in the above resources were used, with a few exceptions to ensure the resolution and scale matched that of the historical and current water budgets. Figure C-2-1 shows the overall process consistent with the Climate Change Resource Guide (DWR, 2018) that describes workflow beginning with baseline historical conditions to perturbed 2070 conditions for the projected model run.
Figure C-2-1: Model Process
1 In the industry, climate change impacted variable forecasts are sometimes referred to as “data” and their collections are called “datasets.” Calling forecasted variable values “data” can be misleading, so this document tries to be explicit about data (i.e., historical data) versus forecasts or model outputs.

Groundwater Sustainability Plan
Chapter 2, Appendix C, Attachment C-2
Attachment C-2, Page 3
December 2019
Table C-2-1 below summarizes the forecasted variable datasets provided by DWR that were used to carry out the climate change analysis (DWR, 2019).
Table C-2-1. DWR Forecasted Datasets
Input Variable DWR-provided dataset
Precipitation Change factors: VIC model-generated GIS grid with associated change factor time series for each cell
Reference ET Change factors: VIC model-generated GIS grid with associated change factor time series for each cell
1.2 Climate Change Analysis Methodology For climate change impacts on groundwater, accepted methods include the assessment of the impacts on the individual water resource system elements that are impacted and directly link to groundwater. These elements include precipitation, streamflow, evapotranspiration and, for coastal aquifers, sea level rise as a boundary condition. For Cuyama, sea level is not relevant. Additionally, in the Cuyama model does not have any stream inflows. For this reason, streamflow under climate change was not perturbed in this analysis.
The methods for perturbing the precipitation and evapotranspiration input files is described in the following sections. Two future scenarios were evaluated in this analysis, according to DWR guidance (DWR, 2018):
• Water Budget under 2030 central tendency conditions to assess near-future impacts of climatechange.
• Water Budget under 2070 central tendency conditions to assess impacts of climate change over thelong-term planning and implementation period.
1.2.1 Perturbed Precipitation under Climate Change Projected precipitation change (perturbation) factors are provided by DWR, calculated using a climate period analysis based on historical precipitation from January 1915 to December 2011 (DWR, 2018). Change factors provided by DWR were calculated as a ratio of the value of a variable under a “future scenario” divided by a baseline. DWR used a macroscale hydrologic model that solves the full water and balance in a watershed, called the Variable Infiltration Capacity (VIC) Model. The baseline data corresponds to the 1995 historical template detrended scenario by the VIC model through global circulation model (GCM) downscaling. The “future scenario” corresponds to VIC outputs of the simulation of future conditions using GCM forecasted hydroclimatic variables as inputs. These change factors are thus a simple perturbation factor that corresponds to the ratio of a future with climate change divided by the past without it. Change factors are available on a monthly time step and spatially defined by the VIC model grid. Supplemental tables with the time series of perturbation factors are available by DWR for each grid cell.

Groundwater Sustainability Plan
Chapter 2, Appendix C, Attachment C-2
Attachment C-2, Page 4
December 2019
Because the Cuyama model has a daily time step, the historical baseline time series (water year 1960 to water year 2017) was aggregated monthly. DWR change factors, or perturbation factors, were then multiplied by historical baseline precipitation to generate projected precipitation under 2030 and 2070 central tendency future scenarios using the Desktop IWFM GIS tool (DWR, 2018). The tool calculates an area weighted precipitation change factor for each model grid geometry. This model grid geometry was generated based on polygons generated around the PRISM nodes that are within the model region.
However, the DWR tool only includes change factors through 2011. The remaining five years of the time series were synthesized according to historically comparable water years. The perturbation factor from the corresponding month of the comparable year was applied to the baseline of the missing years (i.e., 2012 to 2017) to generate projected values. Months with no precipitation in the baseline were assumed a monthly precipitation of 1 millimeter under climate change to account for increased precipitation that cannot be calculated from a baseline of 0 millimeter for these synthesized years. Table C-2-2 below shows the comparable water years assigned for each missing year.
Table C-2-2. Water Years Assigned for Missing Years Water Year
with Missing Change Factors Comparable Water Year on Record
April to September October to March 2012 1987 2009
2013 1990 1990
2014 1990 1989
2015 2001 1990
2016 1990 1989
2017 1990 1990
Applying Change Factors to Precipitation and ET DWR datasets include scenarios for 2030 and 2070 timeframes and for conditions similar to historical in terms of precipitation forecasted (central tendency) and conditions wetter and drier. All scenarios available present higher future temperatures. The team selected the 2070 central tendency forecasted conditions for the analysis.
After applying the change factor to the model simulation period (baseline) analysts obtained the precipitation and evapotranspiration under climate change. The resulting perturbed precipitation values and the baseline precipitation values can be found in Figure C-2-2 below. The exceedance plot for these two times series can be found in Figure C-2-3.

Groundwater Sustainability Plan
Chapter 2, Appendix C, Attachment C-2
Attachment C-2, Page 5
December 2019
Figure C-2-2. Precipitation Perturbation Factors as Compared to Baseline Values
Figure C-2-3. Exceedance of Precipitation Perturbation Factors as Compared to Baseline Values

Groundwater Sustainability Plan
Chapter 2, Appendix C, Attachment C-2
Attachment C-2, Page 6
December 2019
Figure C-2-4 shows the difference between the regional average under 2070 climate change conditions and the regional average under historical baseline conditions plotted against different amounts of projected monthly precipitation.
Figure C-2-4. Difference in Monthly Precipitation Estimates as Compared to Baseline Values This plot demonstrates that in 2070 with climate change added, in low precipitation months, there is approximately equal probability that the month will be wetter or drier than historical conditions. However, under climate change, the 2070 conditions will be always wetter on average in months with precipitation above approximately 100mm. Therefore, under climate change conditions, the occurrence of low precipitation months will likely not change, but the higher precipitation months will be wetter overall than the baseline.
It is important to note that, while the central tendency scenario shows limited changes in future precipitation compared to historical record, the drier and wetter scenarios do show more variability. Figure C-2-5 shows the exceedance curve for the wet scenario and it shows a larger difference to baseline compared to the central tendency. The use of other scenarios can be explored in future GSP updates.
Future Drier than Baseline
Future Wetter than Baseline

Groundwater Sustainability Plan
Chapter 2, Appendix C, Attachment C-2
Attachment C-2, Page 7
December 2019
Figure C-2- 5. Exceedance of Wet Scemario Precipitation Estimates as Compared to Baseline Values
Perturbed Evapotranspiration under Climate Change Reference evapotranspiration (ET) is differentiated only by crop in the Cuyama model. However, because there is no spatial component to ET, the same crop in a different part of the basin is modeled with the same ET. Change factors for ET are available in the same spatially distributed manner as precipitation, as described above. However, to match the level of discretization with the Cuyama model, an average ET change factor was calculated across all VIC grid cells within the Cuyama Subbasin boundary. Therefore, the tool to process ET provided by DWR was not needed or used. Change factors provided by DWR for water year 1964 through December 1, 2011 were averaged. This average ET change factor was then applied to the baseline ET time series for each crop type. Because the same ET change factor was applied over the entire baseline time series, no synthesis was required in this analysis.
• For 2030, average change factor is: 1.03• For 2070, average change factor is: 1.07
To better show the impact of climate change, a sample of years (1994 and 1995) for one crop (melons) is included in Figure C-2-6. Figure C-2-7 shows the exceedance curve for these estimates.

Groundwater Sustainability Plan
Chapter 2, Appendix C, Attachment C-2
Attachment C-2, Page 8
December 2019
Figure C-2-6. Changes in Melon Evapotranspiration in 1994 and 1995 as Compared to Baseline Values
Figure C-2-7. Exceedance of Melon Evapotranspiration in 1994 and 1995 as Compared to Baseline Values

Groundwater Sustainability Plan
Chapter 2, Appendix C, Attachment C-2
Attachment C-2, Page 9
December 2019
Considerations for this Analysis By using DWR’s climate change datasets, this GSP has chosen to use a climate period analysis. A “period of analysis” method is what DWR proposes since it provides an intuitive way to compare the past and future conditions, preserving historical temporal trends. Under a period of analysis (sometimes referred to as the “delta method”) precipitation and Crop ET patterns from the past are mirrored into the future and shifted either higher or lower in magnitude (DWR, 2018). When using a period of analysis method, any difference between the baseline historical conditions and the projected conditions can be attributed only to climate change.
Using a climate period analysis in contrast to a transient analysis, however, brings also some disadvantages. While a significant advantage of this method is that the climate change signal can be isolated from signals of other impacts, temporal changes in the water resources system are ignored in favor of adopting the temporal trends of the past. In a continuously changing and variable climate in California, this approach incurs significant disadvantages. Inter-annual variability in the climate period analysis follows the exact patterns of the historical period it references. Shifting seasonality of precipitation, peak snowmelt, and temperature, are important climate impacts expected through the GSP planning horizon that are not captured in the projected water budget (Langridge, Sepaniak, Fencl, & Mendez, 2018) (PPIC, 2019). Longer drought period than have been recorded historically are also expected according to many climate experts (PPIC, 2019). These changes are also not captured.
Opportunities for Future Refinement The regulations dictate that GSPs reflect the best available science to make climate change projections. For future GSP updates, climate change analysis incorporation should build off of this baseline work to continually improve projections into the future. Some refinements or modifications may include:
• Use other scenarios (dry and wet) in addition to the central tendency scenario• Use a transient method as opposed to a period of record method• Incorporate paleohydrology observations and make inferences about the impacts of longer droughts
captured in the paleorecord

Groundwater Sustainability Plan
Chapter 2, Appendix C, Attachment C-2
Attachment C-2, Page 10
December 2019
1.3 References DWR. (2016). Best Management Practices for the Sustainable Management of Groundwater Water
Budget.
DWR. (2018). DWR-Provided Climate Change Data and Guidance for Use During Groundwater Sustainability Plan Development.
DWR. (2018). Guidance for Climate Change Data Use During Groundwater Sustainability Plan Development.
DWR. (2018, December 13). SGMA Climate Change Resources. Retrieved from https://data.cnra.ca.gov/dataset/sgma-climate-change-resources
DWR. (2019). SGMA Data Viewer. Retrieved from https://sgma.water.ca.gov/webgis/?appid=SGMADataViewer
Langridge, R., Sepaniak, S., Fencl, A., and Mendez, L.-E. (2018). Adapting to Climate Change and Drought in Selected California Groundwater Basins: Local Achievements and Challenges. California's Fourth Climate Change Assessment.
PPIC. (2019). Climate Change. Public Policy Institute of California. Retrieved from https://www.ppic.org/wp-content/uploads/californias-future-climate-change-january-2019.pdf
Attachment C-3
Groundwater Level Hydrographs for Calibration Wells

This page intentionally left blank.
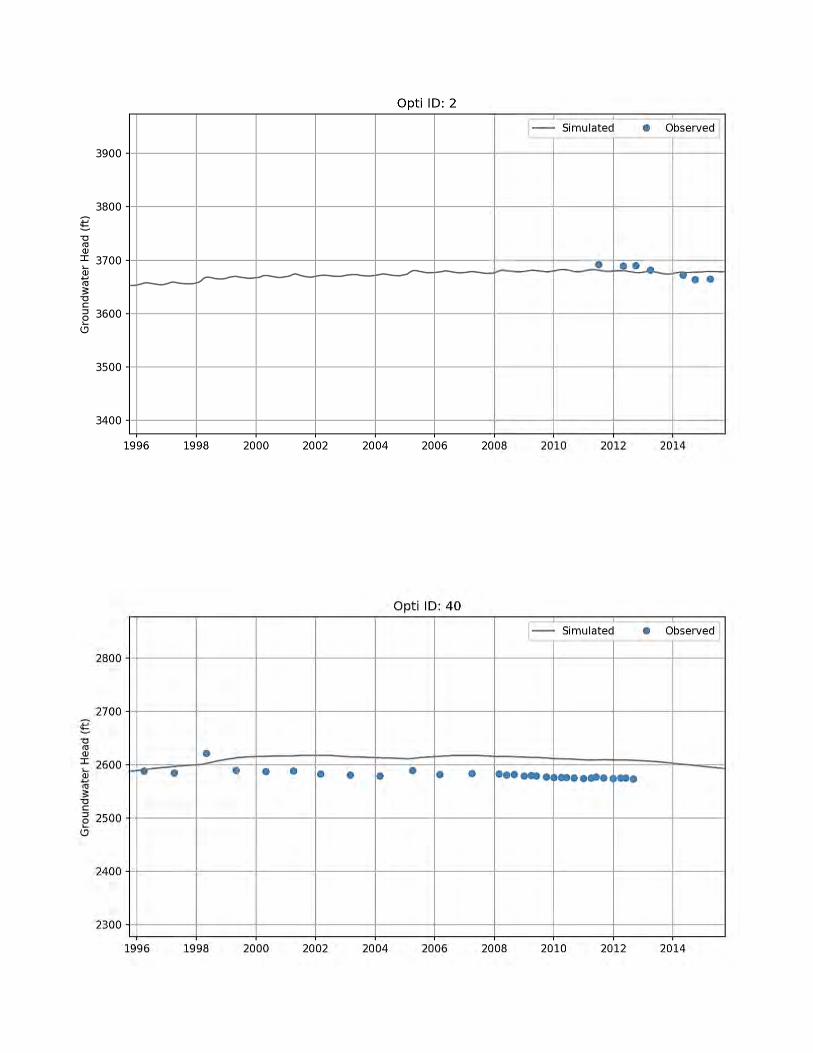


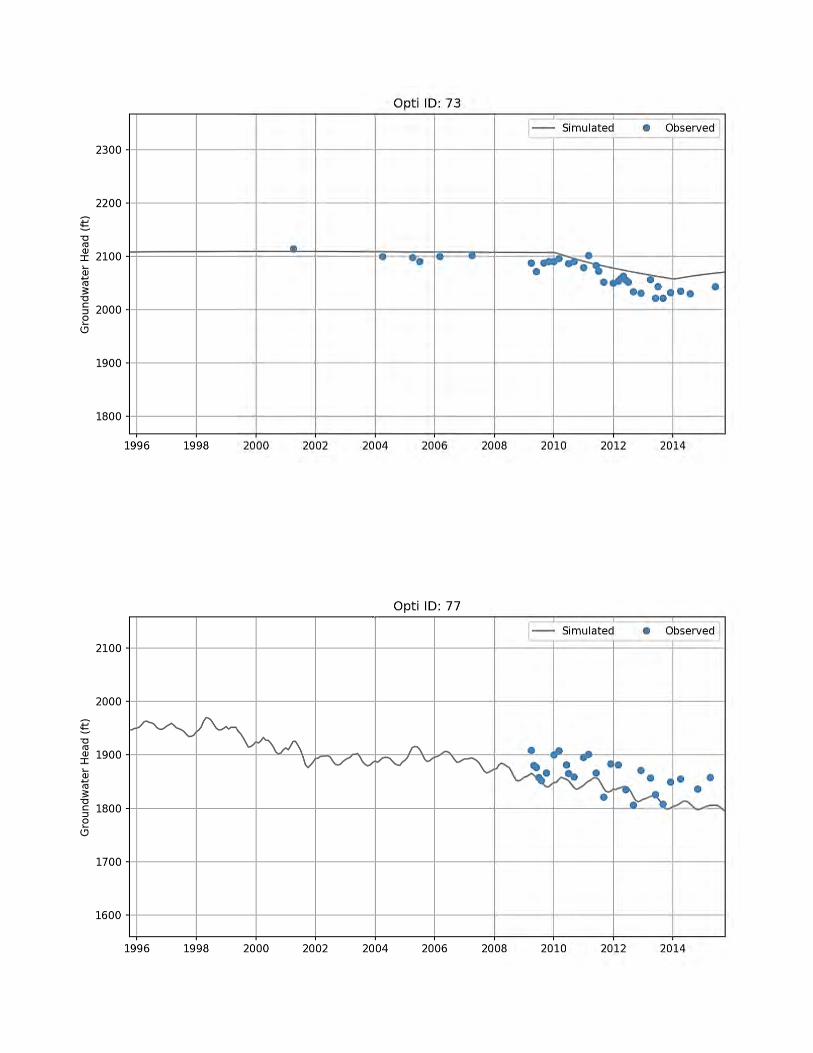


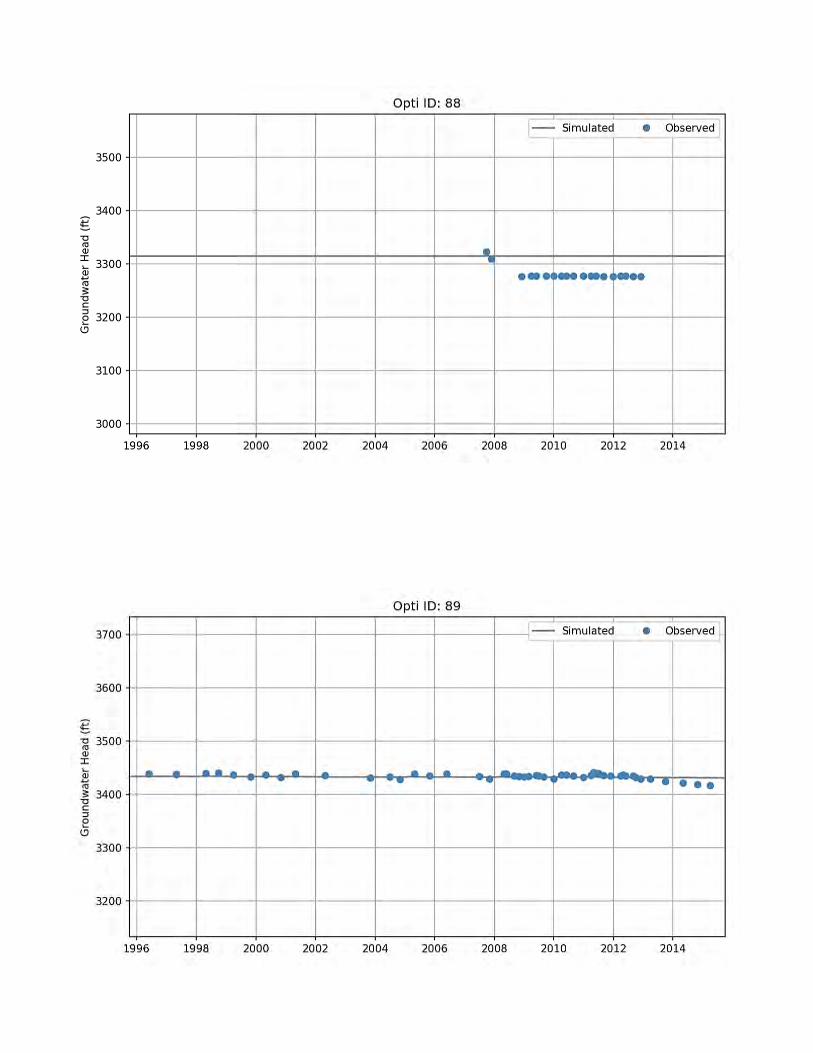

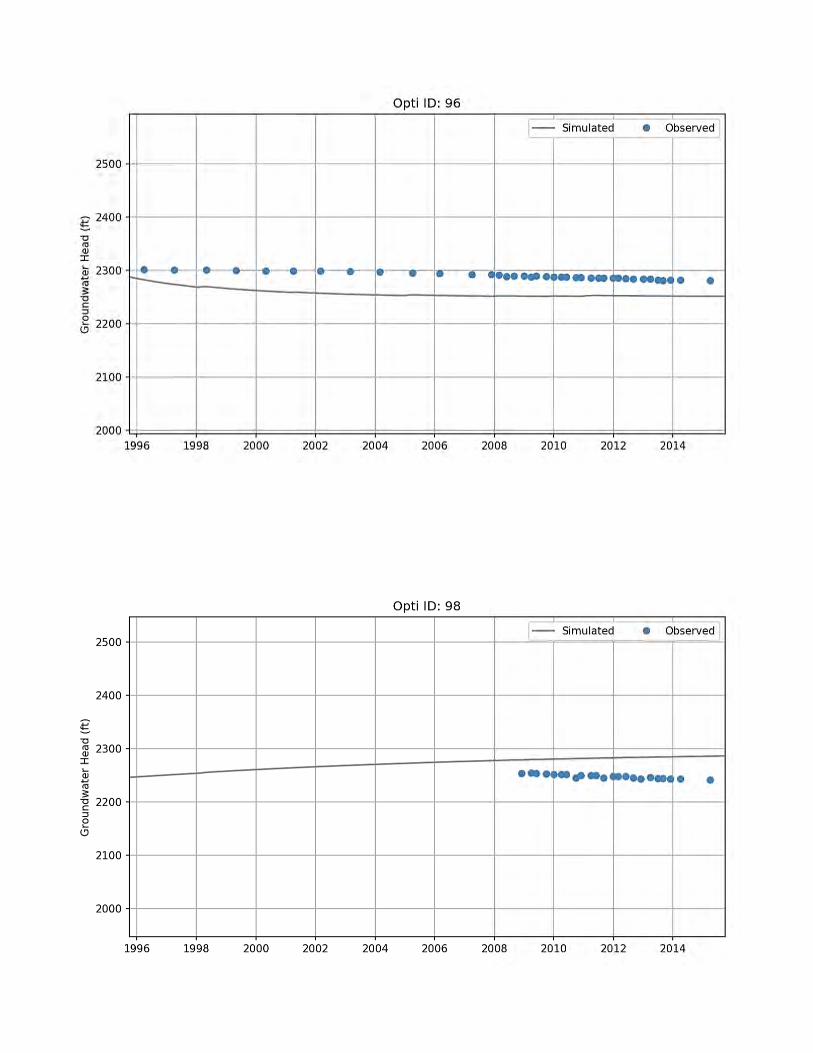


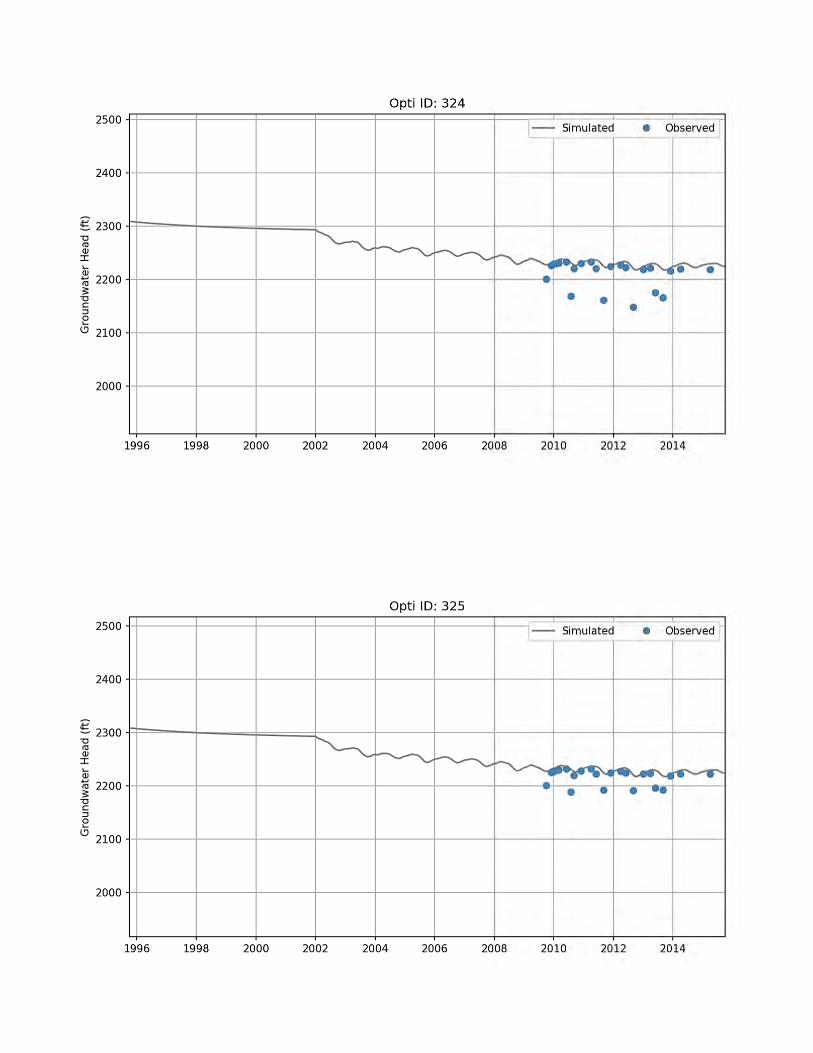


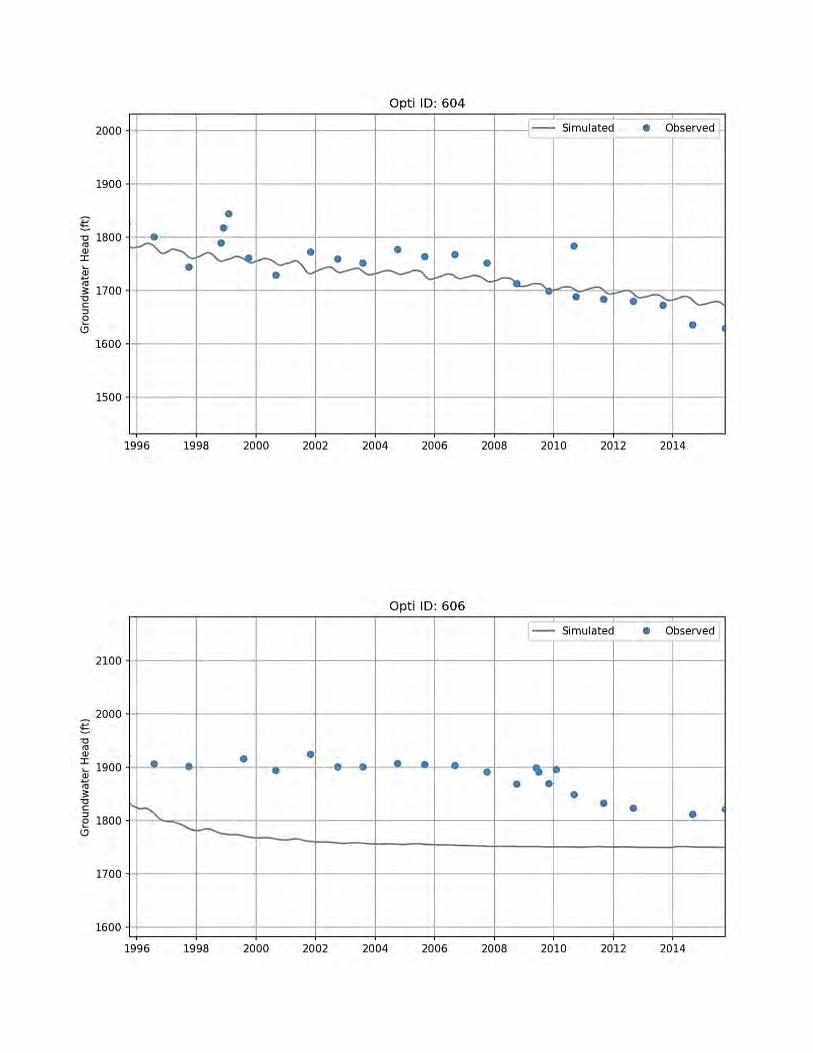


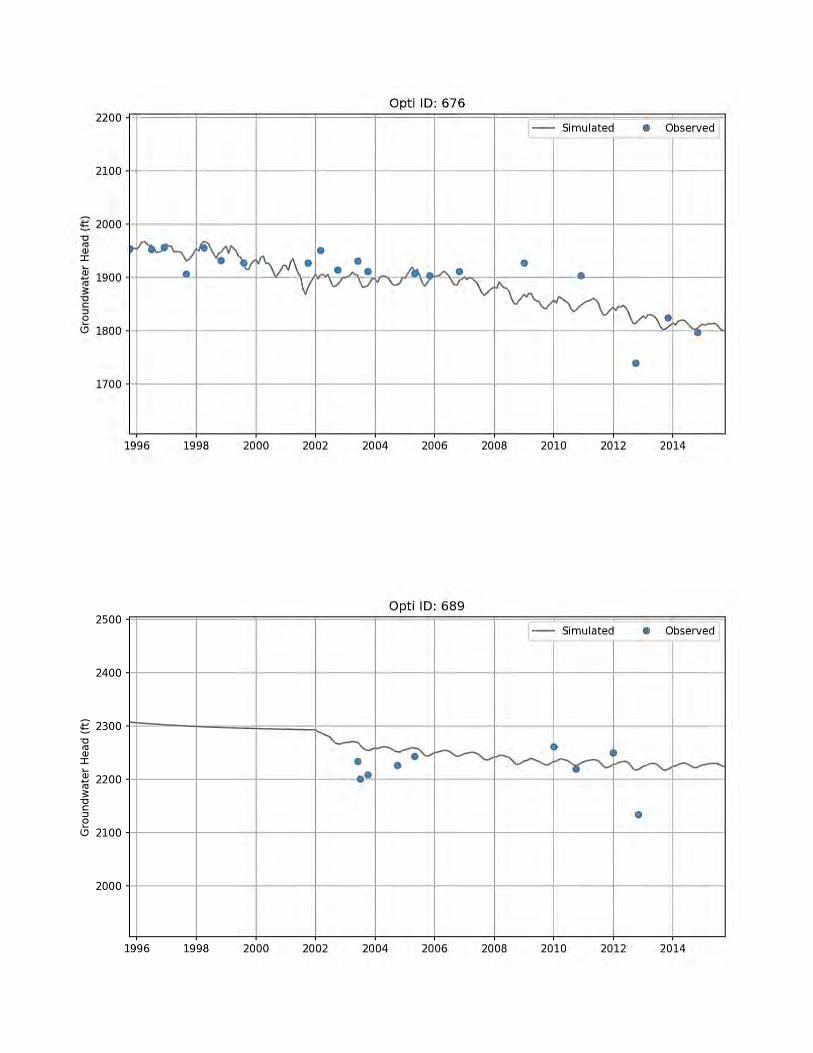


Attachment C-4
Evapotranspiration and Applied Water Estimates

This page intentionally left blank.

1772 Picasso Ave, Suite A 1 phone 530.757.6107 Davis, CA 95618-0550 www.davidsengineering.com
Specialists in Agricultural Water Management Serving Stewards of Western Water since 1993
Technical Memorandum To: Woodard & Curran
From: Davids Engineering
Date: January 7, 2018
Subject: Cuyama Basin Development of Evapotranspiration and Applied Water Estimates Using Remote Sensing
1 Summary The purpose of this effort is to develop time series estimates of agricultural water use for the Cuyama Basin from October 1994 through December 2017. The approach builds upon estimates of actual evapotranspiration (ETa) developed using remotely sensed information from the Landsat satellite.
The consumptive use of water (i.e., evapotranspiration) is the primary destination of infiltrated precipitation and applied irrigation water within the Cuyama Basin. Quantification of consumptive use was achieved by performing daily calculations of evapotranspiration (ET) for individual fields from October 1996 through December 2017. ET was separated into its evaporation (E) and transpiration (T) components. Transpiration was quantified using a remote sensing approach where Landsat satellite images acquired from USGS were used to calculate the Normalized Difference Vegetation Index (NDVI), which was subsequently translated to a basal crop coefficient and combined with reference ET to calculate transpiration over time.
A spatial coverage of field boundaries was developed for the Cuyama Basin, and individual field polygons were assigned cropping and irrigation method information over time based on available data. Field boundaries were delineated by combining polygon coverages in GIS format from Bolthouse Farms, Grimmway Farms, LandIQ, and the California Department of Water Resources (DWR). The area encompassed by the field boundary GIS coverage includes only the Cuyama Basin.
Crop ET was calculated based on a combination of remote sensing data and simulation of irrigation events in a daily root zone water balance model. Due to the remote sensing approach crop ET estimates are relatively insensitive to crop type and irrigation method so detailed, accurate assignment of crop types and irrigation methods to each field is not critical to developing relatively reliable estimates of crop ET. The amount of green vegetation present over time was estimated for each field polygon based on NDVI, which is calculated using a combination of red and near infrared reflectances as measured using multispectral satellite sensors onboard Landsat satellites. Following the preparation of NDVI imagery spanning the analysis period all images were quality controlled to remove pixels affected by clouds.
Mean daily NDVI values for each field were converted to basal crop coefficients. Daily precipitation was estimated based on assembly and review of data from the PRISM Climate Group at Oregon State

1772 Picasso Ave, Suite A 2 phone 530.757.6107 Davis, CA 95618-0550 www.davidsengineering.com
University1. Daily reference evapotranspiration (ETo) was estimated based on information from California Irrigation Management Information System (CIMIS) weather stations. Root zone parameters that influence the amount of available soil moisture storage were estimated based on crops and soils present in the Cuyama Basin.
A summary for the 1994 to 2017 analysis period of the annual ET of applied water (ETAW), ETc (synonymous with ETa), applied water (AW), deep percolation of applied water (DPAW) and deep percolation of precipitation (DPpr) estimates based on the root zone water balance model is given in the Results section.
Application of remote sensing combined with daily root zone water balance modeling (RS-RZ model) provides an improved methodology for estimation of surface interactions with the groundwater system including net groundwater depletion through estimation of ET of applied water and other fluxes.
2 Introduction The purpose of this effort is to develop time series estimates of agricultural, urban, and native vegetation water use for the Cuyama Basin from 1996 through 2017. Demand has been quantified at the field scale using a remote-sensing based daily root zone water balance model. Results from this model were used to parameterize an IWFM Demand Calculator (IDC) application that will be incorporated into an IWFM application for the Basin to support GSP development.
3 Methodology 3.1 Daily Root Zone Simulation Model A conceptual diagram of the various surface layer fluxes of water into and out of the crop root zone is provided in Figure 3.1. The consumptive use of water (i.e., evapotranspiration or ET) is the primary destination of infiltrated precipitation and applied irrigation water within the Cuyama Basin. Quantification of consumptive use was achieved by performing daily calculations of ET for individual fields from October 1994 through December 2017. Evapotranspiration was separated into its evaporation (E) and transpiration (T) components. Additionally, each component was separated into the amount of E or T derived from precipitation or applied water.
1 PRISM website: http://prism.oregonstate.edu/

1772 Picasso Ave, Suite A 3 phone 530.757.6107 Davis, CA 95618-0550 www.davidsengineering.com
Figure 3.1. Conceptualization of Fluxes of Water Into and Out of the Crop Root Zone
Transpiration was quantified using a remote sensing approach whereby Landsat satellite images acquired from USGS were used to calculate the Normalized Difference Vegetation Index (NDVI), a measure of the amount of green vegetation present. NDVI values were calculated and interpolated for each field over time. NDVI values were then converted to transpiration coefficients that were used to calculate transpiration over time by multiplying daily NDVI by daily reference evapotranspiration (ETo). Evaporation was quantified by performing a surface layer water balance for the soil based on the dual crop coefficient approach described in FAO Irrigation and Drainage Paper 56 (Allen et al. 1998). On a daily basis, evaporation was calculated based on the most recent wetting event (precipitation or irrigation) and the evaporative demand for the day (ETo). This methodology is described in greater detail in the Davids Engineering report for the Kaweah Delta Water Conservation District (Davids Engineering 2013).
3.2 Development of Field Boundaries A spatial coverage of field boundaries was developed for the Cuyama Basin, and individual field polygons were assigned cropping and irrigation method information. For each field polygon, daily water balance calculations were performed for the 1994 to 2017 analysis period, and irrigation events were simulated to estimate the amount of water applied to meet crop irrigation demands. This section describes the development of the field polygon coverage and assignment of cropping and irrigation method attributes.
3.2.1 Development of Field Boundaries
Field boundaries were delineated by combining polygon coverages in GIS format from Bolthouse Farms, Grimmway Farms, LandIQ, and the California Department of Water Resources (DWR). The area encompassed by the field boundary GIS coverage includes only the Cuyama Basin.
3.3 Assignment of Cropping and Irrigation Method As described previously, crop evapotranspiration (ET) was calculated based on a combination of remote sensing data and simulation of irrigation events in a daily root zone water balance model. A result of the remote sensing approach is that crop transpiration was estimated with little influence from the assigned

1772 Picasso Ave, Suite A 4 phone 530.757.6107 Davis, CA 95618-0550 www.davidsengineering.com
crop type for each field. Additionally, crop transpiration is the dominant component of ET, meaning that ET estimates are likewise largely independent of the assigned crop type.
Crop evapotranspiration is driven to some extent by the characteristics of the irrigation method and its management, including the area wetted during each irrigation event and the frequency of irrigation. Surface irrigation methods typically wet more of the soil surface than micro-irrigation methods; however, surface irrigated fields are typically irrigated less frequently than their micro-irrigated counterparts. As a result, evaporation rates can be similar among surface and micro-irrigated fields and estimates of evaporation are likewise somewhat independent of the assigned irrigation method. Parameters related to irrigation method were assigned based the predominant irrigation method for each crop, as described by recent historical DWR land and water use surveys.
A key result of the relative insensitivity of the crop ET estimates to crop type or irrigation method (due to the remote sensing approach), is that detailed, accurate assignment of crop types and irrigation methods to each field is not critical to developing reliable estimates of crop ET at the field scale and, more importantly, at coarser scales due to the cancellation of errors in individual field estimates as they are aggregated.
Crop types were assigned to each field based on a combination of data from Bolthouse Farms, Grimmway Farms, LandIQ, and DWR. For fields farmed by Bolthouse or Grimmway, the local data were used. For other fields, available data from LandIQ and DWR were used.
3.4 NDVI Analysis The amount of green vegetation present over time was estimated for each field polygon based on the Normalized Difference Vegetation Index (NDVI), which is calculated using a combination of red and near infrared reflectances, as measured using multispectral satellite sensors onboard Landsat satellites. NDVI can vary from -1 to 1 and typically varies from approximately 0.15 to 0.2 for bare soil to 0.8 for green vegetation with full cover. Negative NDVI values typically represent water surfaces.
3.4.1 Image Selection
Landsat images are preferred due to their relatively high spatial resolution (30-meter pixels, approx. 0.2 acres in size). A total of 671 raw satellite images were selected and converted to NDVI spanning the period from July 1994 to April 2018. Of the images selected, 207 were from the Landsat 5 satellite, 364 were from the Landsat 7 satellite (first available in 2001), and 100 were from the Landsat 8 satellite (first available in 2013). These images were used to process and download surface reflectance (SR) NDVI from the USGS Earth Resources Observation and Science (EROS) Center Science Processing Architecture (ESPA)2.
There was sufficient cloud-free Landsat imagery available that no cloud gap filling was necessary. The number of days between image dates ranged from 8 to 96, with an average of 13 days. Generally, there was at least one image selected for each month.
3.4.2 Extraction of NDVI Values by Field and Development of Time Series NDVI Results
Following the preparation of NDVI imagery spanning the analysis period, all images were masked using the Quality Assessment Band (BQA) provided by ESPA to remove pixels affected by clouds and cloud shadows. Then, mean NDVI was extracted from the imagery for each field for each image date. These NDVI values were interpolated across the full analysis period from October 1, 1994 to December 31, 2017 to provide a daily time series of mean NDVI values for each field. 2 USGS ESPA website: https://espa.cr.usgs.gov/
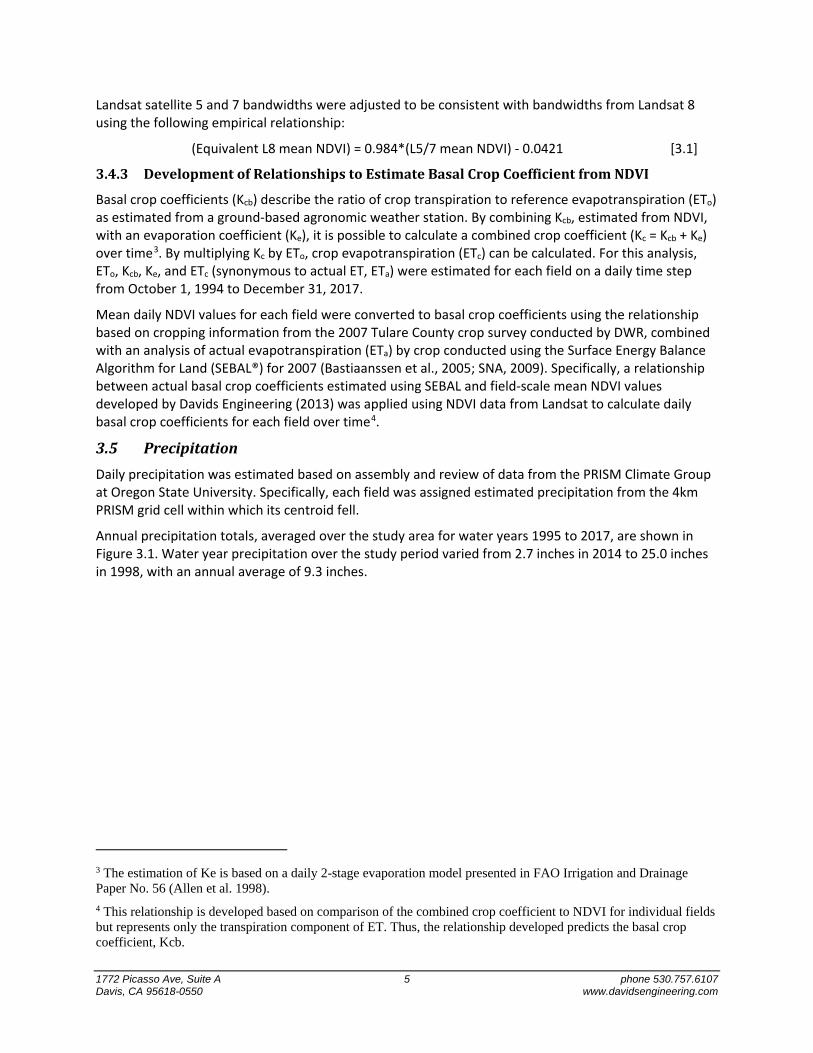
1772 Picasso Ave, Suite A 5 phone 530.757.6107 Davis, CA 95618-0550 www.davidsengineering.com
Landsat satellite 5 and 7 bandwidths were adjusted to be consistent with bandwidths from Landsat 8 using the following empirical relationship:
(Equivalent L8 mean NDVI) = 0.984*(L5/7 mean NDVI) - 0.0421 [3.1]
3.4.3 Development of Relationships to Estimate Basal Crop Coefficient from NDVI
Basal crop coefficients (Kcb) describe the ratio of crop transpiration to reference evapotranspiration (ETo) as estimated from a ground-based agronomic weather station. By combining Kcb, estimated from NDVI, with an evaporation coefficient (Ke), it is possible to calculate a combined crop coefficient (Kc = Kcb + Ke) over time3. By multiplying Kc by ETo, crop evapotranspiration (ETc) can be calculated. For this analysis, ETo, Kcb, Ke, and ETc (synonymous to actual ET, ETa) were estimated for each field on a daily time step from October 1, 1994 to December 31, 2017.
Mean daily NDVI values for each field were converted to basal crop coefficients using the relationship based on cropping information from the 2007 Tulare County crop survey conducted by DWR, combined with an analysis of actual evapotranspiration (ETa) by crop conducted using the Surface Energy Balance Algorithm for Land (SEBAL®) for 2007 (Bastiaanssen et al., 2005; SNA, 2009). Specifically, a relationship between actual basal crop coefficients estimated using SEBAL and field-scale mean NDVI values developed by Davids Engineering (2013) was applied using NDVI data from Landsat to calculate daily basal crop coefficients for each field over time4.
3.5 Precipitation Daily precipitation was estimated based on assembly and review of data from the PRISM Climate Group at Oregon State University. Specifically, each field was assigned estimated precipitation from the 4km PRISM grid cell within which its centroid fell.
Annual precipitation totals, averaged over the study area for water years 1995 to 2017, are shown in Figure 3.1. Water year precipitation over the study period varied from 2.7 inches in 2014 to 25.0 inches in 1998, with an annual average of 9.3 inches.
3 The estimation of Ke is based on a daily 2-stage evaporation model presented in FAO Irrigation and Drainage Paper No. 56 (Allen et al. 1998). 4 This relationship is developed based on comparison of the combined crop coefficient to NDVI for individual fields but represents only the transpiration component of ET. Thus, the relationship developed predicts the basal crop coefficient, Kcb.

1772 Picasso Ave, Suite A 6 phone 530.757.6107 Davis, CA 95618-0550 www.davidsengineering.com
Figure 3.2. Annual Precipitation Totals
3.6 Estimation of Daily Reference Evapotranspiration Daily reference evapotranspiration (ETo) was estimated based on information from the California Irrigation Management Information System (CIMIS) weather station at Cuyama. ETo provides a means of estimating actual crop evapotranspiration over time for each field. Based on review of nearby weather stations with data available during the period of analysis, the Cuyama station (88) was selected based on it being located within the Cuyama Basin, having relatively good fetch, and having available data during the analysis period.
Individual parameters from the available data including incoming solar radiation, air temperature, relative humidity, and wind speed were quality-controlled according to the procedures of Allen et al. (2005). The quality-controlled data were then used to calculate daily ETo for the available period of record.
3.7 Estimation of Root Zone Water Balance Parameters Root zone parameters that influence the amount of available soil moisture storage were estimated based on crops and soils present in the Cuyama Basin. Crop parameters of interest include root depth, NRCS curve number5, and management allowable depletion (MAD). Root depth was estimated by crop group based on published values and a representative mix of individual crops within each crop group for the Cuyama Basin. Curve numbers were estimated based on values published in the NRCS National Engineering Handbook, which provides estimates based on crop type and condition. MAD values by crop were estimated based on values published in FAO Irrigation and Drainage Paper No. 56 (Allen et al., 1998).
5 The curve number runoff estimation method developed the Natural Resources Conservation Service (NRCS) was used to estimate runoff from precipitation in the model. For additional information, see NRCS NEH Chapter 2 (NRCS, 1993).
0
5
10
15
20
25
30
19951996199719981999200020012002200320042005200620072008200920102011201220132014201520162017
Prec
ipita
tion
(in)
Water Year

1772 Picasso Ave, Suite A 7 phone 530.757.6107 Davis, CA 95618-0550 www.davidsengineering.com
Soil hydraulic parameters of interest include field capacity (% by vol.), wilting point (% by vol.), saturated hydraulic conductivity (ft/day), total porosity (% by vol.), and the pore size distribution index (λ, dimensionless). These parameters were estimated by first determining the depth-weighted average soil texture (sand, silt, clay, etc.) based on available NRCS soil surveys. Then, the hydraulic parameters were estimated using hydraulic pedotransfer functions developed by Saxton and Rawls (2006). Next, hydraulic parameters were adjusted within reasonable physical ranges for each soil texture so that the modeled time required for water to drain by gravity from saturation to field capacity agreed with typically accepted agronomic values. Unsaturated hydraulic conductivity (e.g. deep percolation) within the root zone was modeled based on the equation developed by Campbell (1974) for unsaturated flow.
4 Results 4.1 Crop Evapotranspiration Estimated annual crop evapotranspiration volumes for fields with their centroid within the Cuyama Basin are shown in Figure 4.1. Estimated volumes of ET derived from applied water (ETaw) and precipitation (ETpr) are shown in thousands of acre-feet (taf). Annual ETaw ranged from 38 taf to 53 taf, with an average of 44 taf. Annual ETpr ranged from 4 taf to 33 taf, with an average of 15 taf. Total crop ET ranged from 43 taf to 76 taf, with an average of 58 taf.
Figure 4.1. Cuyama Basin Crop ET by Water Year
4.2 Irrigation Demands Annual estimated irrigation demands for fields with their centroid within the Cuyama Basin are shown in Figure 4.2 in thousands of acre feet. Annual demands ranged from 52 taf to 73 taf, with an average of 60 taf.
46 38
47 43 43
46
53
43
44 39
45 41
44
49 46 42
45
46 43 39
40
43 40
25
12
16
33
17
13
18
8
17
9
21
18 7
11 14 17
20 12
7
4
10
13 13
0
10
20
30
40
50
60
70
80
1995
1996
1997
1998
1999
2000
2001
2002
2003
2004
2005
2006
2007
2008
2009
2010
2011
2012
2013
2014
2015
2016
2017Ev
apot
rans
pira
tion
(taf
)
Water Year
ET of Applied Water ET of Precipitation

1772 Picasso Ave, Suite A 8 phone 530.757.6107 Davis, CA 95618-0550 www.davidsengineering.com
Figure 4.2. Cuyama Basin Irrigation Demands by Water Year
4.3 Deep Percolation Estimated annual deep percolation volumes for fields with their centroid within the Cuyama Basin are shown in Figure 4.3. Estimated volumes of deep percolation derived from applied water (DPaw) and precipitation (DPpr) are shown in thousands of acre-feet. Annual DPaw ranged from 15 taf to 19 taf, with an average of 17 taf. Annual DPpr ranged from 4 taf to 28 taf, with an average of 10 taf. Total deep percolation ranged from 20 taf to 47 taf, with an average of 27 taf.
59 5267 59
6164
7358
62 5663 5663
68 62 576062 60 54 5359 56
0
10
20
30
40
50
60
70
80
19951996199719981999200020012002200320042005200620072008200920102011201220132014201520162017
Irrig
atio
n De
man
ds (t
af)
Water Year

1772 Picasso Ave, Suite A 9 phone 530.757.6107 Davis, CA 95618-0550 www.davidsengineering.com
Figure 4.3. Cuyama Basin Deep Percolation by Water Year
4.4 Annual Evapotranspiration by Crop for 2014 Estimated annual evapotranspiration by crop is shown in Figure 4.4, along with the estimated acreage for each crop. Figure 4.4 shows the estimated total ET by crop in inches in 2014. Annual ET ranges from 5 inches for young perennials to 59 inches for alfalfa. The primary crops are carrots, representing 5,500 acres. Grapes, miscellaneous truck crops, pistachios, potatoes and onions and garlic are also significant, representing 948, 838, 761, 668 and 646 acres, respectively.
18 15
18
19 18 18
19 17
18 16
19 17
18
19 17 16
18 15 16 16 15
16 16
16
8
8
28
8 8
14
4
10
6
20
12
4
11
8 11
16
7 4 4 5
8 7
0
5
10
15
20
25
30
35
40
45
50
1995
1996
1997
1998
1999
2000
2001
2002
2003
2004
2005
2006
2007
2008
2009
2010
2011
2012
2013
2014
2015
2016
2017De
ep P
erco
latio
n (t
af)
Water Year
DP of Applied Water DP of Precipitation

1772 Picasso Ave, Suite A 10 phone 530.757.6107 Davis, CA 95618-0550 www.davidsengineering.com
Figure 4.4. Cuyama Basin 2014 ET by Crop and Crop Acreage
Additional monthly plots of the “fraction of reference ET” (EToF), ETa and AW by crop for 2014 can be found in the appendix.
5 References Allen, R.G, L.S. Pereira, D. Raes, and M. Smith. 1998. Crop Evapotranspiration - Guidelines for Computing Crop Water Requirements. FAO Irrigation and Drainage Paper 56. FAO. Rome, Italy.
Allen, R.G., Walter, I.A., Elliott, R.L., Howell, T.A., Itenfisu, D., Jensen, M.E., and R.L. Snyder. 2005. The ASCE Standardized Reference Evapotranspiration Equation. Technical Committee on Standardization of Reference Evapotranspiration. American Society of Civil Engineers. Reston, VA.
Campbell, G.S. 1974 A simple method for determining unsaturated conductivity from moisture retention data. Soil Science. 117:6. Pp 311-314.
Davids Engineering. 2013. Time Series Evapotranspiration and Applied Water Estimates from Remote Sensing. Kaweah Delta Water Conservation District. http://www.kdwcd.com/wp-content/uploads/2018/07/KDWCD-NDVI-ET-Analysis-FINAL-REPORT-March-2013.pdf
NRCS. 1993. Chapter 2 - Watershed Project Evaluation Procedures. National Engineering Handbook Part 630, Hydrology.
Saxton, K.E. and W.J. Rawls. 2006. Soil Water Characteristic Estimates by Texture and Organic Matter for Hydrologic Solutions. Soil Sci. Soc. Am. J. 70:1569–1578.
0
1,000
2,000
3,000
4,000
5,000
6,000
0
10
20
30
40
50
60
Acre
s
Crop
ET
(inch
es)
Crop ET Acreage

1772 Picasso Ave, Suite A 11 phone 530.757.6107 Davis, CA 95618-0550 www.davidsengineering.com
6 Appendix This appendix includes the following figures:
• Average monthly crop water use coefficients or “fraction of reference ET” (EToF) by crop, along with error bars depicting the standard deviation among fields.
• Average monthly crop ET by crop, along with error bars depicting the standard deviation among fields. • Average monthly applied water by crop, along with error bars depicting the standard deviation among fields.

1772 Picasso Ave, Suite A 12 phone 530.757.6107 Davis, CA 95618-0550 www.davidsengineering.com
EToF 2014
Alfalfa Apples Beans
Carrots Grapes Idle
0.0
0.2
0.4
0.6
0.8
1.0
1.2
1.4
1 2 3 4 5 6 7 8 9 10 11 12
EToF
0.0
0.2
0.4
0.6
0.8
1.0
1.2
1.4
1 2 3 4 5 6 7 8 9 10 11 12
EToF
0.0
0.2
0.4
0.6
0.8
1.0
1.2
1.4
1 2 3 4 5 6 7 8 9 10 11 12
EToF
0.0
0.2
0.4
0.6
0.8
1.0
1.2
1.4
1 2 3 4 5 6 7 8 9 10 11 12
EToF
0.0
0.2
0.4
0.6
0.8
1.0
1.2
1.4
1 2 3 4 5 6 7 8 9 10 11 12
EToF
0.0
0.2
0.4
0.6
0.8
1.0
1.2
1.4
1 2 3 4 5 6 7 8 9 10 11 12
EToF

1772 Picasso Ave, Suite A 13 phone 530.757.6107 Davis, CA 95618-0550 www.davidsengineering.com
Misc. Grain and Hay Misc. Truck Mixed Pasture
Onions and Garlic Pistachios Potatoes
0.0
0.2
0.4
0.6
0.8
1.0
1.2
1.4
1 2 3 4 5 6 7 8 9 10 11 12
EToF
0.0
0.2
0.4
0.6
0.8
1.0
1.2
1.4
1 2 3 4 5 6 7 8 9 10 11 12
EToF
0.0
0.2
0.4
0.6
0.8
1.0
1.2
1.4
1 2 3 4 5 6 7 8 9 10 11 12
EToF
0.0
0.2
0.4
0.6
0.8
1.0
1.2
1.4
1 2 3 4 5 6 7 8 9 10 11 12
EToF
0.0
0.2
0.4
0.6
0.8
1.0
1.2
1.4
1 2 3 4 5 6 7 8 9 10 11 12
EToF
0.0
0.2
0.4
0.6
0.8
1.0
1.2
1.4
1 2 3 4 5 6 7 8 9 10 11 12
EToF

1772 Picasso Ave, Suite A 14 phone 530.757.6107 Davis, CA 95618-0550 www.davidsengineering.com
ETc 2014
Alfalfa Apples Beans
Carrots Grapes Idle
0
1
2
3
4
5
6
7
8
9
10
1 2 3 4 5 6 7 8 9 10 11 12
ETa
(in)
0
1
2
3
4
5
6
7
8
9
10
1 2 3 4 5 6 7 8 9 10 11 12
ETa
(in)
0
1
2
3
4
5
6
7
8
9
10
1 2 3 4 5 6 7 8 9 10 11 12
ETa
(in)
0
1
2
3
4
5
6
7
8
9
10
1 2 3 4 5 6 7 8 9 10 11 12
ETa
(in)
0
1
2
3
4
5
6
7
8
9
10
1 2 3 4 5 6 7 8 9 10 11 12
ETa
(in)
0
1
2
3
4
5
6
7
8
9
10
1 2 3 4 5 6 7 8 9 10 11 12
ETa
(in)

1772 Picasso Ave, Suite A 15 phone 530.757.6107 Davis, CA 95618-0550 www.davidsengineering.com
Misc. Grain and Hay Misc. Truck Mixed Pasture
Onions and Garlic Pistachios Potatoes
0
1
2
3
4
5
6
7
8
9
10
1 2 3 4 5 6 7 8 9 10 11 12
ETa
(in)
0
1
2
3
4
5
6
7
8
9
10
1 2 3 4 5 6 7 8 9 10 11 12
ETa
(in)
0
1
2
3
4
5
6
7
8
9
10
1 2 3 4 5 6 7 8 9 10 11 12
ETa
(in)
0
2
4
6
8
10
12
1 2 3 4 5 6 7 8 9 10 11 12
ETa
(in)
0
1
2
3
4
5
6
7
8
9
10
1 2 3 4 5 6 7 8 9 10 11 12
ETa
(in)
0
2
4
6
8
10
12
1 2 3 4 5 6 7 8 9 10 11 12
ETa
(in)

1772 Picasso Ave, Suite A 16 phone 530.757.6107 Davis, CA 95618-0550 www.davidsengineering.com
AW 2014
Alfalfa Apples Beans
Carrots Grapes Idle
0
2
4
6
8
10
12
1 2 3 4 5 6 7 8 9 10 11 12
AW (i
n)
0
2
4
6
8
10
12
1 2 3 4 5 6 7 8 9 10 11 12
AW (i
n)
0
2
4
6
8
10
12
1 2 3 4 5 6 7 8 9 10 11 12
AW (i
n)
0
2
4
6
8
10
12
1 2 3 4 5 6 7 8 9 10 11 12
AW (i
n)
0
2
4
6
8
10
12
1 2 3 4 5 6 7 8 9 10 11 12
AW (i
n)
0
2
4
6
8
10
12
1 2 3 4 5 6 7 8 9 10 11 12
AW (i
n)

1772 Picasso Ave, Suite A 17 phone 530.757.6107 Davis, CA 95618-0550 www.davidsengineering.com
Misc. Grain and Hay Misc. Truck Mixed Pasture
Onions and Garlic Pistachios Potatoes
0
2
4
6
8
10
12
1 2 3 4 5 6 7 8 9 10 11 12
AW (i
n)
0
2
4
6
8
10
12
1 2 3 4 5 6 7 8 9 10 11 12
AW (i
n)
0
2
4
6
8
10
12
1 2 3 4 5 6 7 8 9 10 11 12
AW (i
n)
0
2
4
6
8
10
12
1 2 3 4 5 6 7 8 9 10 11 12
AW (i
n)
0
2
4
6
8
10
12
1 2 3 4 5 6 7 8 9 10 11 12
AW (i
n)
0
2
4
6
8
10
12
1 2 3 4 5 6 7 8 9 10 11 12
AW (i
n)


Chapter 2 Appendix D
Technical Memorandum: Verification of NCCAG-Identified Locations

This page intentionally left blank.

Cuyama GSP Groundwater Dependent Ecosystems 1 Woodard & Curran (0011078.00) February 2019
TECHNICAL MEMORANDUM TO: Cuyama Groundwater Sustainability Agency
CC: Brian Van Lienden, Woodard & Curran PM
PREPARED BY: William L. Medlin, PWS, ENV SP
REVIEWED BY: John Ayres and Micah Eggleton
DATE: February 15, 2019
RE: Cuyama GSP Groundwater Dependent Ecosystems Study
As part of the California Sustainable Groundwater Management Act (SGMA), Groundwater Sustainability Agencies (GSAs) are required to develop a Groundwater Sustainability Plan (GSP) to help ensure that groundwater is available for long-term, reliable water supply uses. SGMA was put into place and is enforced by the California Department of Water Resources (DWR). Once implemented, each GSP must address certain key elements such as a baseline groundwater assessment, monitoring, establishing best management practices (BMPs), and setting new regulations with the goal of defining a pathway to achieve sustainable groundwater management within 20 years (DWR 2018).
Within the GSP, a baseline assessment of groundwater conditions must be completed, and part of that assessment includes identification of groundwater dependent ecosystems (GDEs) and an assessment of potential impacts on GDEs. SGMA defines GDEs as “ecological communities or species that depend on groundwater emerging from aquifers or on groundwater occurring near the ground surface.” The identification and determination of GDEs within a groundwater basin is the responsibility of the GSA that governs the basin. This study specifically focuses on GDEs identified within the Cuyama Valley groundwater basin.
1. CUYAMA VALLEY GROUNDWATER BASIN ECOLOGICAL SETTING
The Cuyama Valley groundwater basin encompasses multiple California ecoregions (Griffith et al. 2016). In terms of land area, the dominant ecoregion is the Central California Foothills and Coastal Mountains (6), sub-ecoregion Cuyama Valley (6am). This ecoregion is characterized by its Mediterranean climate with hot, dry summers and cool, moist winters. Typical vegetative communities consist of chaparral and oak woodlands; grasslands are present at some lower elevations and pine forests are observed at high elevations. Most of the region is comprised of open, low mountains and foothills with some irregular plains and narrow valleys in certain locations. More specifically, the Cuyama Valley is a narrow valley with significant agricultural production. The mainstem Cuyama River flows through the center of the valley from southeast to northwest.
A minor part of the Cuyama Valley ground water basin is in the Southern California Mountains (8) ecoregion, in the Northern Transverse Range (8g) sub-ecoregion. This ecoregion, like other California ecoregions, is characterized by a Mediterranean climate of hot, dry summers and cool, moist winters. Chaparral and oak woodland vegetative communities are still ever-present, however the elevations in this ecoregion are higher generally leading to cooler summers and greater rainfall which result in denser vegetation and large areas of coniferous forests. There is a slope effect that causes some significant ecological differences in the Transverse Range. South-facing slopes receive more annual precipitation (30-40 inches) than the northern-facing slopes (15-20 inches), yet evaporation rates contribute to the development of chaparral communities. While on the northern-facing side of parts of the ecoregion, lower temperatures and evaporation coupled with slow snow melt allow for a coniferous forest that transitions to desert montane habitat. Some areas of severe erosion are common where vegetation has been removed via fire, overgrazing,

Cuyama GSP Groundwater Dependent Ecosystems 2 Woodard & Curran (0011078.00) February 2019
or other land clearing practices. Many areas in this ecoregion are National Forest public land (Griffith et al. 2016). The Cuyama River headwaters (Quatal Canyon Creek, Apache Canyon Creek, and Cuyama Creek) flow through this ecoregion. Figure 1 (Attachment A) illustrates the general location of the Cuyama Valley groundwater basin in the context of the Ecoregions of California.
2. GDE ASSESSMENT AND FIELD VALIDATION
Using Geographic Information Systems (GIS), Woodard & Curran completed a preliminary desktop analysis of the California DWR Natural Communities Commonly Associated with Groundwater (NCCAG) geospatial data set. Woodard & Curran attempted to identify NCCAG polygons that appeared to be “probable GDEs” based on the following observations:
Presence of a mapped USGS spring or seep
Inundation visible on aerial imagery
Saturation visible on aerial imagery
Dense riparian and/or wetland vegetation visible on aerial imagery
Areas that did not exhibit the above characteristics (or similar) were considered “probable non-GDEs” for purposes of this study. Reference Figure 2 (Attachment A) for geospatial representation of our basin-wide GDE desktop assessment.
In addition to the preliminary desktop analysis of the NCCAG data set, Woodard & Curran also completed a preliminary GDE field validation study throughout portions of the Cuyama Valley groundwater basin. The field study was conducted only on publicly accessible lands (including the Los Padres National Forest) where the NCCAG data set indicated potential presence of GDEs. Field observations were made at NCCAG-mapped seeps, springs, and at other riparian habitats to document plant communities, aquatic or semi-aquatic wildlife, indicators of surface and subsurface hydrology, presence of hydric soils, and other relevant ecological and hydrological data. Photographs were taken in the four cardinal directions (north, east, south, west) at each field validation assessment location, and additional photographs were taken of plant species and other relevant ecological data. Global Positioning System (GPS) points were also collected using a sub-meter Trimble Geo 7x GPS unit at the field validation assessment locations. Preliminary determinations were made at these field assessment locations as to whether an area would be classified as a GDE. Figure 3 (Attachment A) shows the locations of GDE field validation assessment data collection points.
3. RESULTS
Out of 486 NCCAG-mapped polygons (128 GDE_wetland and 358 GDE_vegetation), the preliminary desktop analysis yielded 123 “probable GDEs” and 275 “probable non-GDEs” based on the above-described methodology. Individual polygons were not assessed due to time constraints, but rather groupings of similarly-situated riparian areas or clusters of polygons were assessed via GIS for probability of GDE classification.
The preliminary GDE field validation study assessed six (6) locations in the field on publicly accessible lands. All field assessment sites were in the Los Padres National Forest public lands. One (1) location was along the upper mainstem of the Cuyama River, and the other five (5) locations were in the Apache Canyon Creek watershed. Table 1 below describes each of the field assessment sites in more detail.

Cuyama GSP Groundwater Dependent Ecosystems 3 Woodard & Curran (0011078.00) February 2019
Table 1: GDE Field Validation Data Collection Sites
GPS Data Point Name
Latitude / Longitude
NCCAG-Mapped
Polygon?
NCCAG Vegetation / Wetland Type
Dominant Plant Species Observed
Other Notes
probable Non-GDE 1
34.760116 N, 119.419661 W
Yes Vegetation -
Riversidean Alluvial Scrub
Hesperoyucca whipplei, Arctostaphylos glauca,
Lepidospartum squamatum,
Ericameria nauseosa, Eriogonum fasiculatum,
Bromus carinatus
Soils at data point are sandy, dry and friable; would not stay in soil
auger. This location does not appear to be a GDE.
probable Non-GDE 2
34.761994 N 119.375711 W
Yes Vegetation - Scalebroom
Lepidospartum squamatum,
Ericameria nauseosa, Eriogonum fasiculatum
Soils at data point are dry and friable; Some pines and junipers are growing in the riparian zone adjacent to river bed; no evidence of
hydrology that persists beyond flashy storm events. This location
does not appear to be a GDE.
GDE 1 34.778902 N
119.341961 W No N/A
Juncus xiphoides, Juncus patens,
Typha domingensis, Scirpus microcarpus,
Salix exigua, Salix laevigata, Castilleja sp.,
Isoetes howellii
A small stream is flowing at this location and
hydrophytic vegetation is present throughout the channel; brown algae observed in flowing
stream; crystallized salt or other calcic material
observed on stream channel sediments; soils
are saturated to the surface in this area. This location appears to be a
GDE.
GDE 2 34.801748 N
119.293979 W Yes
Wetland - Palustrine, Scrub-Shrub,
Seasonally Saturated
Clematis ligusticifolia, Juncus effusus, Salix laevigata,
Urtica dioica
Data point is located at US Forest Service Nettle
Springs Campground; USGS mapped spring indicated at data point; groundwater is seeping out of the hillside at this data point; soils sampled
on hillslope are hydric and saturated at the
surface; water flows in a small channel for
approximately 300-500 feet downstream of the spring before drying up. This location appears to
be a GDE.
GDE 3 34.772312 N
119.346965 W No N/A
Salix lasiolepis, Baccharis salicifolia, Baccharis pilularis Distichlis spicata,
Artemisia californica,
Data point is located within a small floodplain
depression willow thicket. Hydrophytes are present and soils are saturated at

Cuyama GSP Groundwater Dependent Ecosystems 4 Woodard & Curran (0011078.00) February 2019
Juncus patens, Anemopsis californica,
Leymus triticoides
the surface by what appears to be
groundwater. Soils are hydric. This location
appears to be a GDE.
GDE 4 34.773548 N
119.346732 W Yes
Vegetation - Riparian Mixed Shrub
Salix laevigata, Juncus patens,
Leymus triticoides, Anemopsis californica,
Melilotus sp., Isoetes howellii
A small stream is flowing at this location and
hydrophytic vegetation is present throughout the
channel; crystallized salt or other calcic material
observed on stream channel sediments; soils
are saturated to the surface in this area. This location appears to be a
GDE.
4. CONCLUSIONS
The Cuyama Valley groundwater basin is a significantly stressed aquifer due to several factors including climate, industrial-scale agriculture, oil and gas exploration and production, ranching, and other land uses. The combination of these factors has drawn the groundwater down to greater than 600 feet below the ground surface in some locations, and this affects GDEs by limiting the amount of groundwater available to ecological communities living at the surface. Especially affected is the Cuyama River mainstem which was observed to be dry throughout much of its reach that was visible during our preliminary GDE field validation study.
However, there do appear to be some GDEs present within the Cuyama Valley groundwater basin as indicated in Table 1. All these areas (GDE 1 – 4) were located within the headwaters of the Cuyama River along Apache Canyon Creek and its floodplain. Areas mapped by the NCCAG data set as seeps and/or springs and the immediately downstream riparian corridors were among the GDEs that were assessed in the field. These locations had hydrophytic vegetation and other near-surface hydrologic indicators that would suggest that the ecological community is dependent on groundwater being present for significant durations during the growing season each year.
Due to access limitations because of private property restrictions, further study should be done along the mainstem of the Cuyama River (and other select tributaries) to determine if GDEs are present within the channel or riparian area.

Cuyama GSP Groundwater Dependent Ecosystems 5 Woodard & Curran (0011078.00) February 2019
5. REFERENCES
Calflora. 2018. Information on Wild California Plants. https://www.calflora.org/ California Department of Water Resources. 2018. Summary of the “Natural Communities Commonly Associated with
Groundwater” Dataset and Online Web Viewer. California Native Plant Society. 2018. A Manual of California Vegetation Online. http://vegetation.cnps.org/ Cowardin, L. M., V. Carter, F.C. Golet, and E.T. LaRoe. 1979. Classification of wetlands and deepwater habitats of
the United States. U.S. Department of the Interior, Fish and Wildlife Service, Washington, D.C. 131pp. Griffith, G.E., Omernik, J.M., Smith, D.W., Cook, T.D., Tallyn, E., Moseley, K., and Johnson, C.B., 2016, Ecoregions
of California (poster): U.S. Geological Survey Open-File Report 2016–1021, with map, scale 1:1,100,000, http://dx.doi.org/10.3133/ofr20161021.
Ritter, Matt. 2018. California Plants: A Guide to Our Iconic Flora. Rhode, M. M., Matsumoto, J. Howard, S. Liu, L. Riege, and E. J. Remson. 2018. Groundwater Dependent
Ecosystems under the Sustainable Groundwater Management Act: Guidance for Preparing Groundwater Sustainability Plans. The Nature Conservancy, San Francisco, California.
United States Department of Agriculture, Natural Resources Conservation Service. 2018. PLANTS Database
website. http://plants.usda.gov/java/ Ventura County (CA) Planning Division. 2006. Guide to Native and Invasive Streamside Plants: Restoring Riparian
Habitats in Ventura County & along the Santa Clarita River in Los Angeles County.


Cuyama GSP Groundwater Dependent Ecosystems 6 Woodard & Curran (0011078.00) February 2019
ATTACHMENT A: FIGURES


Southern California Mountains
Central California Foothills and Coastal Mountains
Central California Valley
Cuyama River
Cuyama River
Source s: Esri, HERE, De Lorm e , Inte rm a p, incre m e nt P Corp., GEBCO, USGS, FAO, NP S, NRCAN, Ge oBa se , IGN, Kada ste r NL, Ordna nce Surve y, Esri Ja pa n,METI, Esri Ch ina (Hong Kong ), swisstopo, Ma pm yIndia , © Ope nStre e tMa p contributors, a nd th e GIS Use r Com m unity
Lege
nd ±Figure 1:
California EcoregionsCuyama Valley Groundwater Basin
Figure Exported: 02/14/2019 By: jbaldwin Using: C:\Users\jbaldwin\Desktop\Eco Stuff\Cuyama_GSP\Cuyama_GSP_eco.mxd
P roje ct #: 0011078.01Ma p Cre a te d: Fe b rua ry 2019
0 2.5 51.25Mile s
Kern, San Luis Obispo, Santa Monica, and Ventura Counties, CA
Th ird P a rty GIS Discla im e r: Th is m a p is for re fe re nce a nd g ra ph ical purpose s only a nd sh ould not b e re lie d upon by th ird pa rtie s for a ny le g a l de cisions. Any re lia nce upon th e m a p or da ta conta ine d h e re in sh a ll b e a t th e use rs’ sole risk. Data Sources: USEPA Level III Ecoregions of California(2016), USGS NHD
NCCAG Groundwa te r De pe nde nt Ecosyste mUSGS NHD Stre a m sCuya m a Valle y Groundwa te r Ba sin
Ce ntra l California Footh ills a nd Coa sta l Mounta insCe ntra l California Valle ySouth e rn California Mounta ins
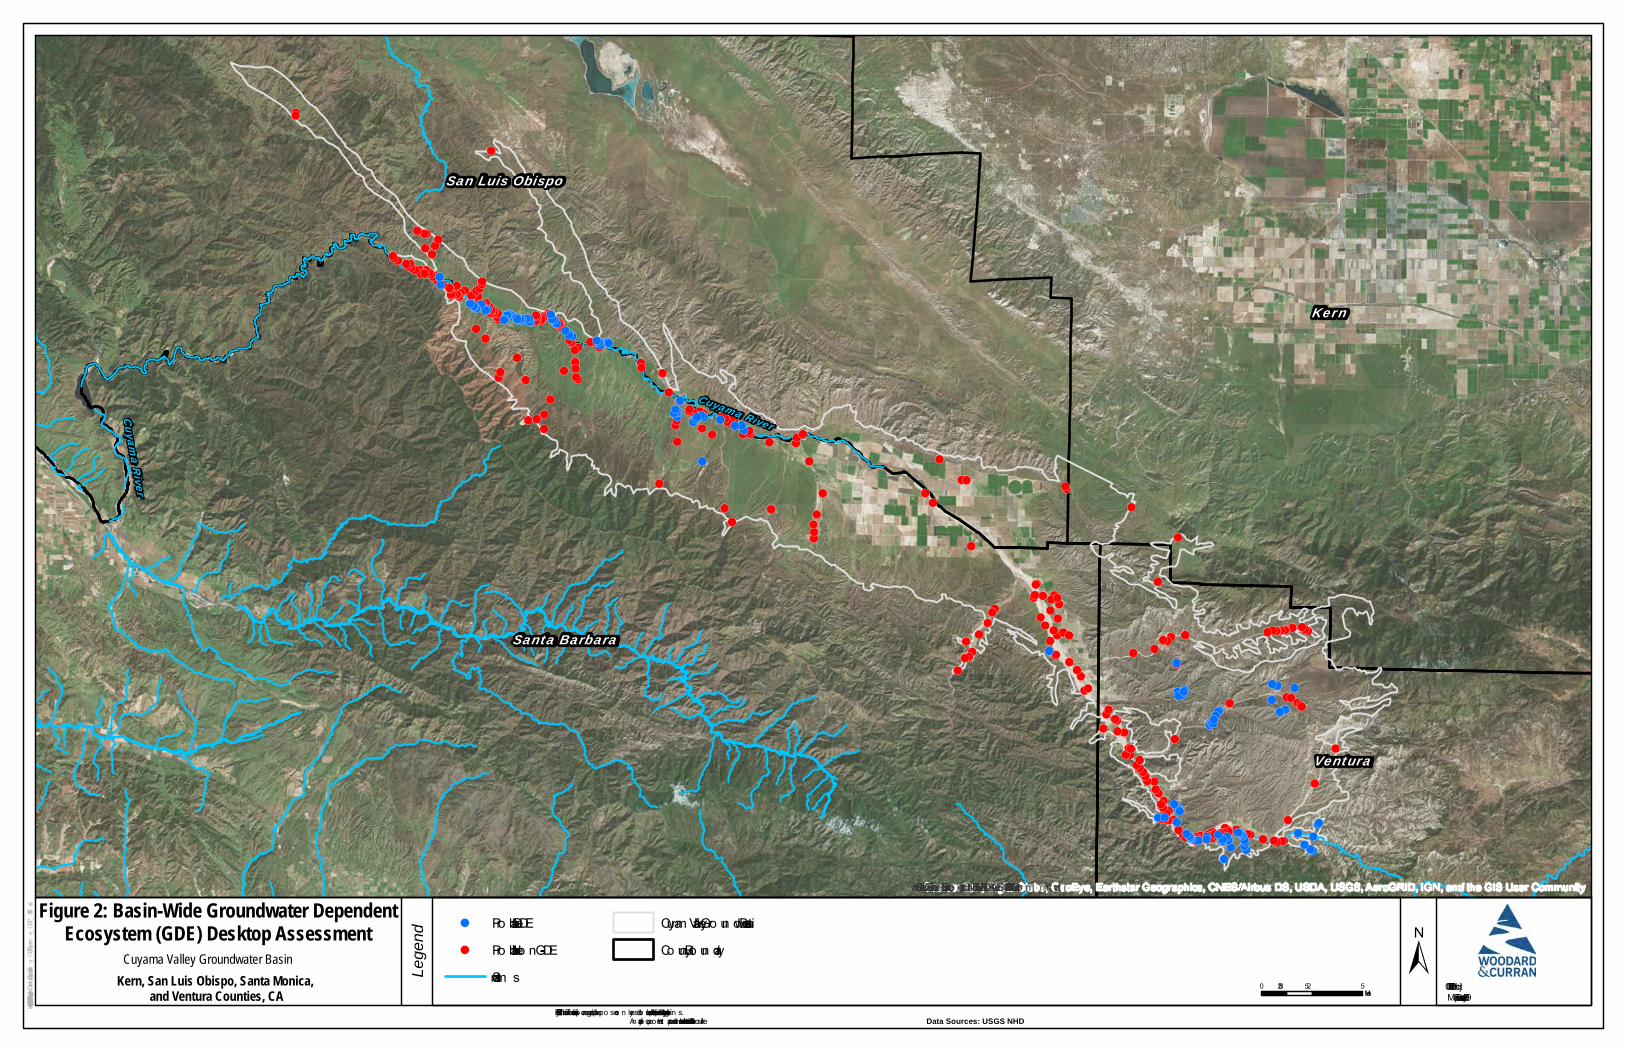
!(!(!(!(!(
!(
!(
!(!(
!(!(!(!(!(
!(!( !(!(!(!(!(!(!(!(!(!(!(!(!(!(!(!(!(!(!(!(!(!(!(!(
!(!(!(!(!(!(
!(!(!(
!(
!(
!(!(!(!(!(
!(!(!(!(!(!(!(!(
!(!(!(!(!(
!(!(
!(!(!(!(
!(
!(!(!(!(!(!(!(!(!(!(!(
!(
!(!(!(!(!(!(
!(!(!(!(!(
!(!(
!(!(
!(
!(!(!(!(!(!(!(
!(!(
!(
!(!(
!(
!(!(!(!(
!(
!(!(
!(!(!(!(!(
!(
!(
!(!(!(!(!(!(
!(
!(!(!(
!(
!(
!(!(!(!(!(
!(!(!(!(!(!(!(!(
!(!(!(!(!(!(
!(
!(!(
!(
!(!(!(
!(!(!(
!(!(!(!(!(!(!(
!(
!(!(!(!(!(!(!(!(
!(!(!(!(!(!(!(!(!(!(!(!(!(!(!(!(!(!(!(!(
!(!(!(!(!(!(!(!(
!(!(!(!(!(!(!(!(!(!( !(!(
!(!(!(!(!(!(!(!(!(
!(!(!(!(!(!(!(!(!(!(
!(!(!(!(!(
!(!(
!(!(!(
!(!(
!(
!(!(
!(!(
!(
!(
!(
!(!(!(
!(
!(
!(
!(
!(
!(!(!(!(!(!(
!(
!(!(!(
!(!(!(
!(!(!(!(!(!(!(!(!(
!(!(
!(!(!(!(!(!(!(!(!(!(!(!(!(!(
!(!(!(!(!(!(!(!(!(
!(!(!(!(!(!(!(!(
!(!(!(!(!(
!(!(
!(!(!(!(!(!(!(!(!(!(!(
!(!(!(!(!(
!(!(!(!(!(!(!(!(!(!(!(!(
!(!(!(!(!(
!(!(!(!(!(!(!(!(!(!(!(!(!(!(!(!(!(
!(!(!(!(!(!(!(!(
!(!(
!(
Cuyama River
Cuyama River
Kern
Santa Barbara
San Luis Obispo
Ventura
So urce: Esri, DigitalGlo be, Geo Eye, Earthstar Geo graphics, CNES/Airbus DS, USDA, USGS, Aero GRID, IGN, an d the GIS User Co m m un ity
Lege
nd ±Figure 2: Basin-Wide Groundwater Dependent
Ecosystem (GDE) Desktop AssessmentCuyama Valley Groundwater Basin
Figure Exported: 02/15/2019 By: jbaldwin Using: C:\Users\jbaldwin\Desktop\Eco Stuff\Cuyama_GSP\Cuyama_GSP_11x17.mxd
Pro ject #: 0011078.01Map Created: February 2019
0 2.5 51.25Miles
Kern, San Luis Obispo, Santa Monica, and Ventura Counties, CA
Third Party GIS Disclaim er: This m ap is fo r referen ce an d graphical purpo ses o n ly an d sho uld n o t be relied upo n by third parties fo r an y legal decisio n s. An y relian ce upo n the m ap o r data co n tain ed herein shall be at the users’ so le risk. Data Sources: USGS NHD
!( Pro bable GDE!( Pro bable No n -GDE
Stream s
Cuyam a Valley Gro un dwater BasinCo un ty Bo un dary
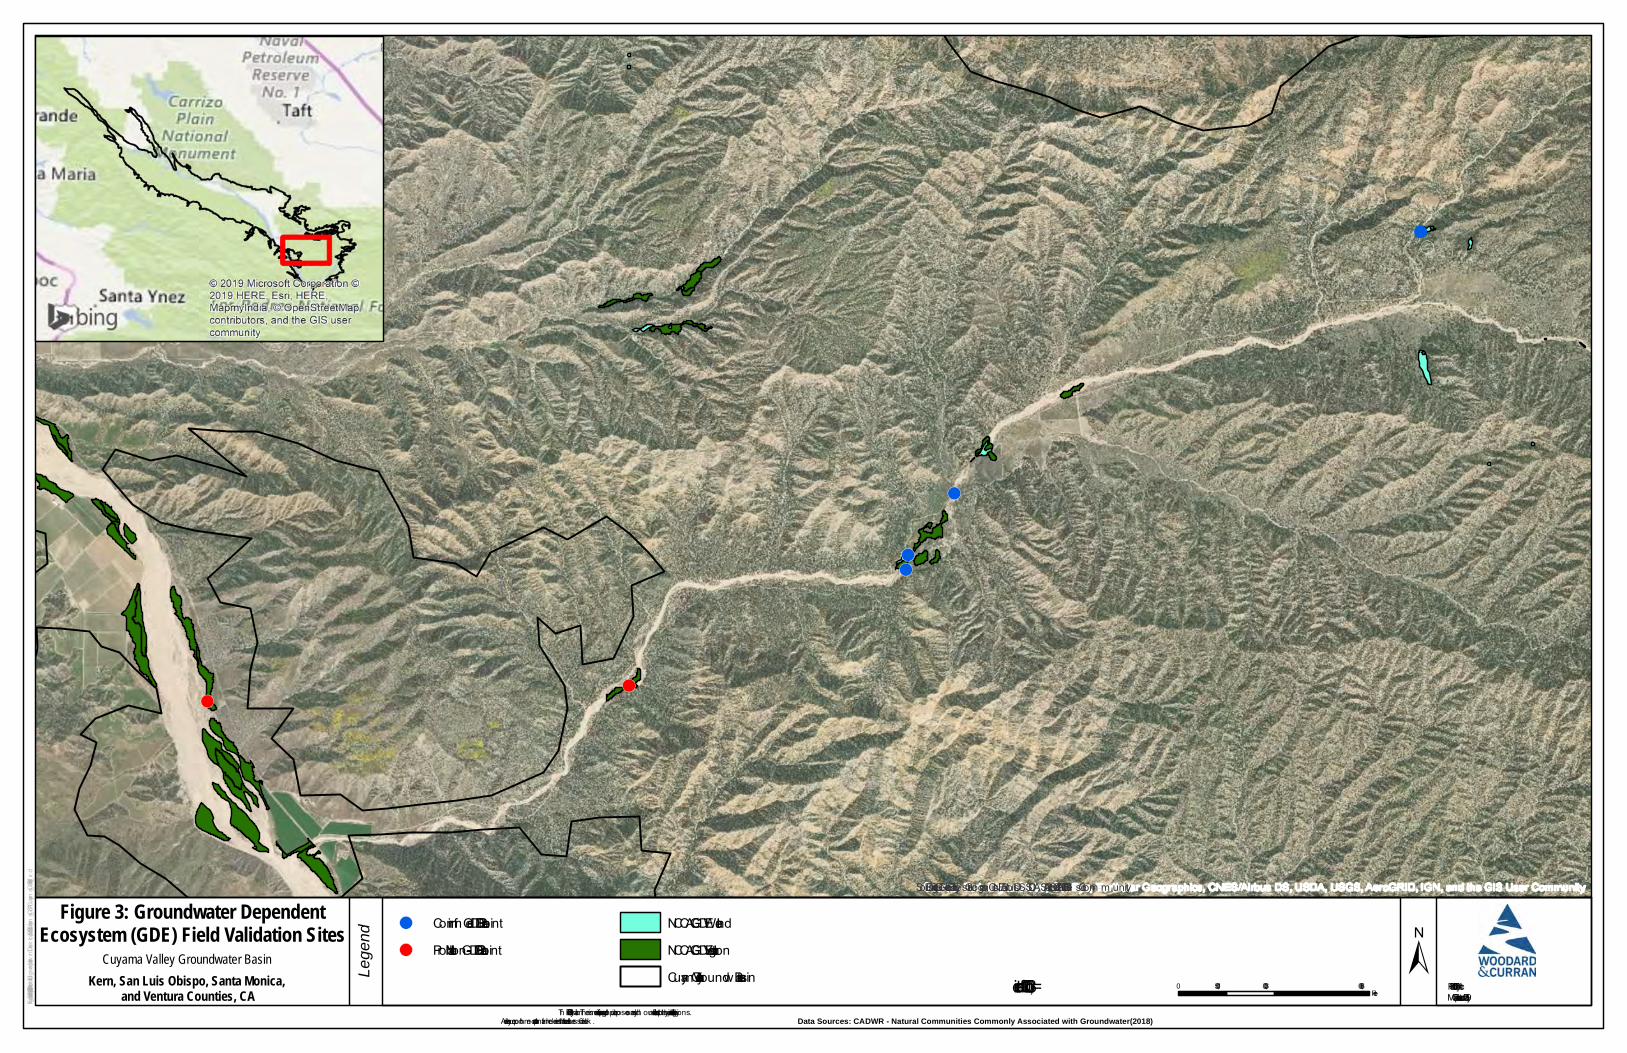
!(!(
!(
!(
!(!(
Source: Esri, DigitalGlobe, GeoEye, Earth star Geograph ics, CNES/Airbus DS, U SDA, U SGS, AeroGRID, IGN, and th e GIS U ser Com m unity
Lege
nd ±Figure 3: Groundwater Dependent
Ecosystem (GDE) Field Validation SitesCuyama Valley Groundwater Basin
Figure Exported: 02/15/2019 By: jbaldwin Using: C:\Users\jbaldwin\Desktop\Eco Stuff\Cuyama_GSP\Cuyama_GSP_field.mxd
Project #: 0011078.01Map Created: February 2019
0 3,000 6,0001,500Feet
Kern, San Luis Obispo, Santa Monica, and Ventura Counties, CA
Th ird Party GIS Disclaim er: Th is m ap is for reference and graph ical purposes only and sh ould not be relied upon by th ird parties for any legal decisions. Any reliance upon th e m ap or data contained h erein sh all be at th e users’ sole risk. Data Sources: CADWR - Natural Communities Commonly Associated with Groundwater(2018)
!( Confirm ed GDE Data Point!( Probable Non-GDE Data Point
NCCAG GDE WetlandNCCAG GDE VegetationCuyam a Valley Groundwater Basin 1 inch = 3,000 feet


Cuyama GSP Groundwater Dependent Ecosystems 7 Woodard & Curran (0011078.00) February 2019
ATTACHMENT B: PHOTOGRAPHS


Cuyama Groundwater Sustainability Plan (0011078.00) 1 Woodard & Curran Groundwater Dependent Ecosystem (GDE) Analysis February 2019
Photo Number: 1 View Direction: North Date: October 23, 2018 Description: Representative photograph taken of potential incorrectly mapped groundwater dependent ecosystem (CA
DWR NCAG dataset 2018). Photo taken a GPS point “probable non-GDE 1”.
Photo Number: 2 View Direction: South Date: October 23, 2018 Description: Representative photograph taken of potential incorrectly mapped groundwater dependent ecosystem (CA
DWR NCAG dataset 2018). Photo taken a GPS point “probable non-GDE 1”.

Cuyama Groundwater Sustainability Plan (0011078.00) 2 Woodard & Curran Groundwater Dependent Ecosystem (GDE) Analysis February 2019
Photo Number: 3 View Direction: North Date: October 23, 2018 Description: Representative photograph taken of potential incorrectly mapped groundwater dependent ecosystem (CA
DWR NCAG dataset 2018). Photo taken a GPS point “probable non-GDE 2”.
Photo Number: 4 View Direction: South Date: October 23, 2018 Description: Representative photograph taken of potential incorrectly mapped groundwater dependent ecosystem (CA
DWR NCAG dataset 2018). Photo taken a GPS point “probable non-GDE 2”.

Cuyama Groundwater Sustainability Plan (0011078.00) 3 Woodard & Curran Groundwater Dependent Ecosystem (GDE) Analysis February 2019
Photo Number: 5 View Direction: North Date: October 23, 2018 Description: Representative photograph taken of unmapped groundwater dependent ecosystem (CA DWR NCAG
dataset 2018). Photo taken a GPS point “GDE 1”.
Photo Number: 6 View Direction: South Date: July 26, 2018 Description: Representative photograph taken of unmapped groundwater dependent ecosystem (CA DWR NCAG
dataset 2018). Photo taken a GPS point “GDE 1”.

Cuyama Groundwater Sustainability Plan (0011078.00) 4 Woodard & Curran Groundwater Dependent Ecosystem (GDE) Analysis February 2019
Photo Number: 7 View Direction: North Date: October 23, 2018 Description: Representative photograph taken of field-verified mapped groundwater dependent ecosystem (CA DWR
NCAG dataset 2018). Photo taken a GPS point “GDE 2”.
Photo Number: 8 View Direction: South Date: July 26, 2018 Description: Representative photograph taken of field-verified mapped groundwater dependent ecosystem (CA DWR
NCAG dataset 2018). Photo taken a GPS point “GDE 2”.
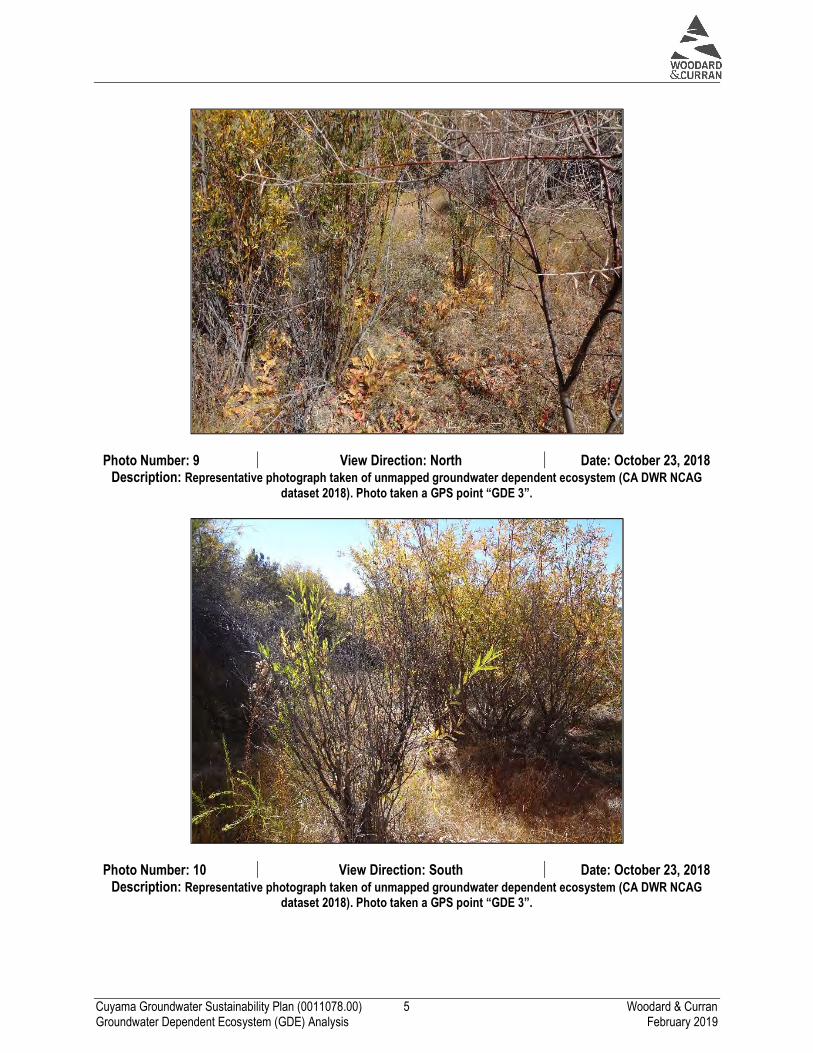
Cuyama Groundwater Sustainability Plan (0011078.00) 5 Woodard & Curran Groundwater Dependent Ecosystem (GDE) Analysis February 2019
Photo Number: 9 View Direction: North Date: October 23, 2018 Description: Representative photograph taken of unmapped groundwater dependent ecosystem (CA DWR NCAG
dataset 2018). Photo taken a GPS point “GDE 3”.
Photo Number: 10 View Direction: South Date: October 23, 2018 Description: Representative photograph taken of unmapped groundwater dependent ecosystem (CA DWR NCAG
dataset 2018). Photo taken a GPS point “GDE 3”.
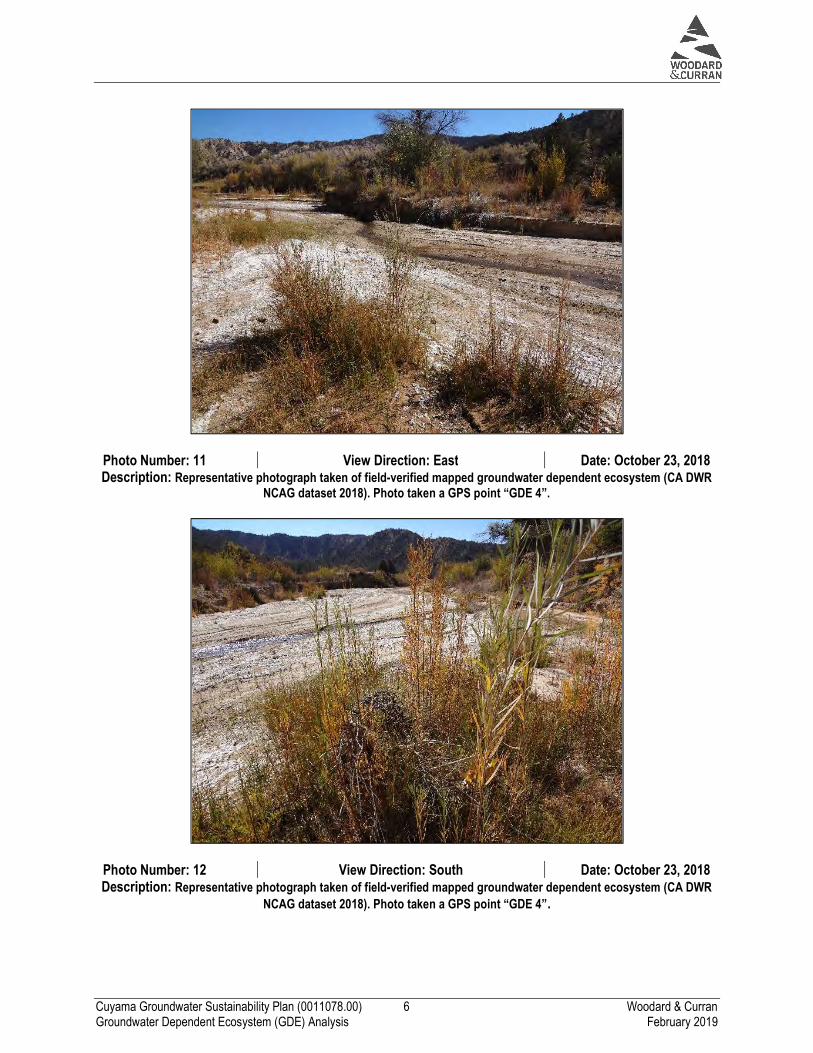
Cuyama Groundwater Sustainability Plan (0011078.00) 6 Woodard & Curran Groundwater Dependent Ecosystem (GDE) Analysis February 2019
Photo Number: 11 View Direction: East Date: October 23, 2018 Description: Representative photograph taken of field-verified mapped groundwater dependent ecosystem (CA DWR
NCAG dataset 2018). Photo taken a GPS point “GDE 4”.
Photo Number: 12 View Direction: South Date: October 23, 2018 Description: Representative photograph taken of field-verified mapped groundwater dependent ecosystem (CA DWR
NCAG dataset 2018). Photo taken a GPS point “GDE 4”.