® 1 vlsi design challenges for gigascale integration shekhar borkar intel corp. october 25, 2005
TRANSCRIPT
RR
®® 1
VLSI Design Challenges VLSI Design Challenges for for
Gigascale IntegrationGigascale Integration
Shekhar BorkarShekhar Borkar
Intel Corp.Intel Corp.
October 25, 2005October 25, 2005

2
OutlineOutline
Technology scaling challengesTechnology scaling challengesCircuit and design solutionsCircuit and design solutionsMicroarchitecture advancesMicroarchitecture advancesMulti-everywhereMulti-everywhereSummarySummary
3
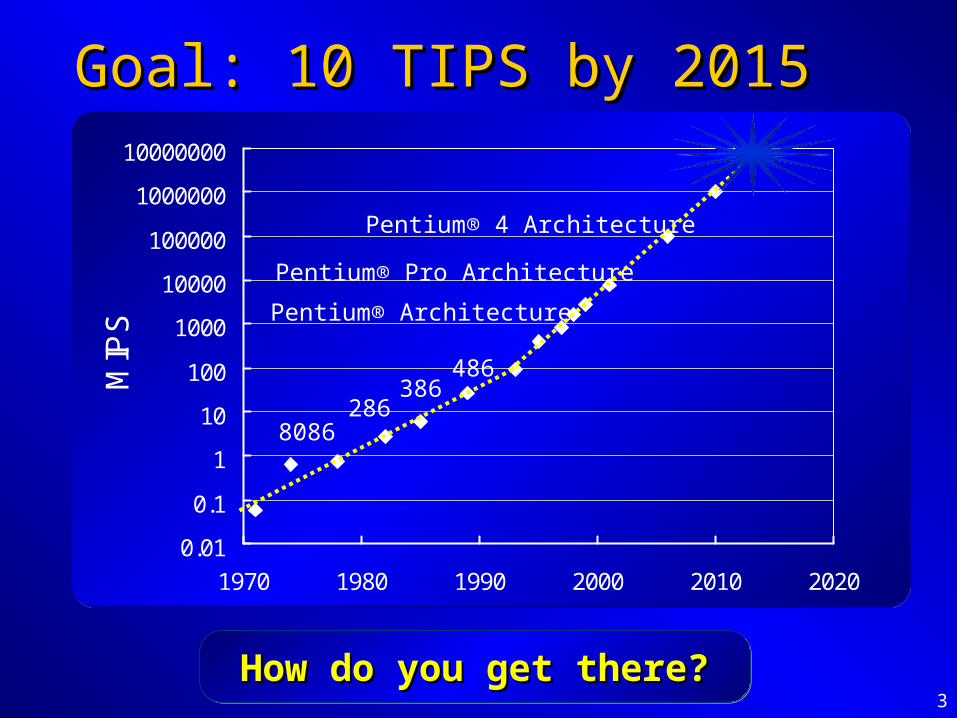
Goal: 10 TIPS by 2015Goal: 10 TIPS by 2015
0.01
0.1
1
10
100
1000
10000
100000
1000000
10000000
1970 1980 1990 2000 2010 2020
MIP
S
Pentium® Pro Architecture
Pentium® 4 Architecture
Pentium® Architecture
486386
2868086
How do you get there?How do you get there?How do you get there?How do you get there?

4
Technology ScalingTechnology ScalingGATE
SOURCE
BODY
DRAIN
Xj
ToxD
GATE
SOURCE DRAIN
Leff
BODY
Dimensions scale Dimensions scale down by 30%down by 30%
Doubles transistor Doubles transistor densitydensity
Oxide thickness Oxide thickness scales downscales down
Faster transistor, Faster transistor, higher performancehigher performance
Vdd & Vt scalingVdd & Vt scaling Lower active powerLower active power
Scaling will continue, but with challenges!Scaling will continue, but with challenges!Scaling will continue, but with challenges!Scaling will continue, but with challenges!

5
Technology OutlookTechnology OutlookHigh Volume High Volume ManufacturingManufacturing
20042004 20062006 20082008 20102010 20122012 20142014 20162016 20182018
Technology Node Technology Node (nm)(nm)
9090 6565 4545 3232 2222 1616 1111 88
Integration Integration Capacity (BT)Capacity (BT)
2 4 8 16 32 64 128 256
Delay = CV/I Delay = CV/I scalingscaling
0.70.7 ~0.7~0.7 >0.7>0.7 Delay scaling will slow downDelay scaling will slow down
Energy/Logic Op Energy/Logic Op scalingscaling
>0.35>0.35 >0.5>0.5 >0.5>0.5 Energy scaling will slow downEnergy scaling will slow down
Bulk Planar CMOSBulk Planar CMOS High Probability Low ProbabilityHigh Probability Low Probability
Alternate, 3G etcAlternate, 3G etc Low Probability High ProbabilityLow Probability High Probability
VariabilityVariability Medium High Very HighMedium High Very High
ILD (K)ILD (K) ~3~3 <3<3 Reduce slowly towards 2-2.5Reduce slowly towards 2-2.5
RC DelayRC Delay 11 11 11 11 11 11 11 11
Metal LayersMetal Layers 6-76-7 7-87-8 8-98-9 0.5 to 1 layer per generation0.5 to 1 layer per generation
6
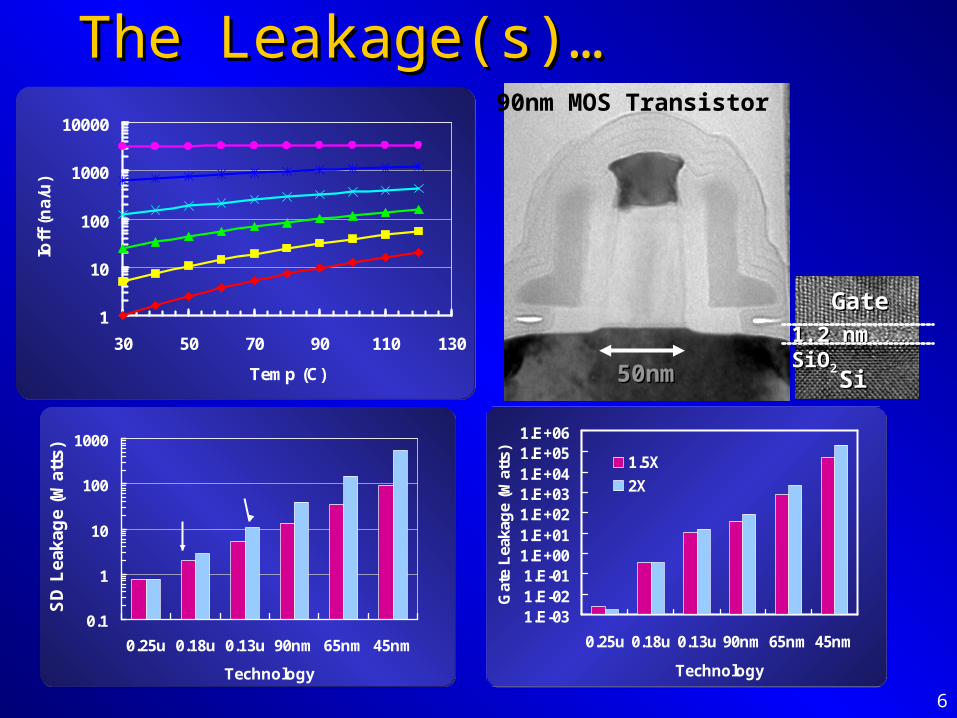
The Leakage(s)…The Leakage(s)…
1
10
100
1000
10000
30 50 70 90 110 130
Temp (C)
Ioff
(n
a/u
)
0.25
90
45
0.1
1
10
100
1000
0.25u 0.18u 0.13u 90nm 65nm 45nm
Technology
SD
Lea
kag
e (W
atts
)
2X Tr Growth1.5X Tr Growth
90nm MOS Transistor
50nm50nm SiSi
1.2 nm SiO1.2 nm SiO22
GateGate
1.E-031.E-021.E-011.E+001.E+011.E+021.E+031.E+041.E+051.E+06
0.25u 0.18u 0.13u 90nm 65nm 45nm
Technology
Gat
e L
eaka
ge
(Wat
ts)
1.5X
2X
During Burn-in1.4X Vdd

7
Must Fit in Power EnvelopeMust Fit in Power Envelope
0
200
400
600
800
1000
1200
1400
90nm 65nm 45nm 32nm 22nm 16nm
Po
wer
(W
), P
ow
er D
ensi
ty (
W/c
m2)
SiO2 Lkg
SD Lkg
Active
10 mm Die
Technology, Circuits, and Technology, Circuits, and Architecture to constrain the power Architecture to constrain the power
Technology, Circuits, and Technology, Circuits, and Architecture to constrain the power Architecture to constrain the power
8
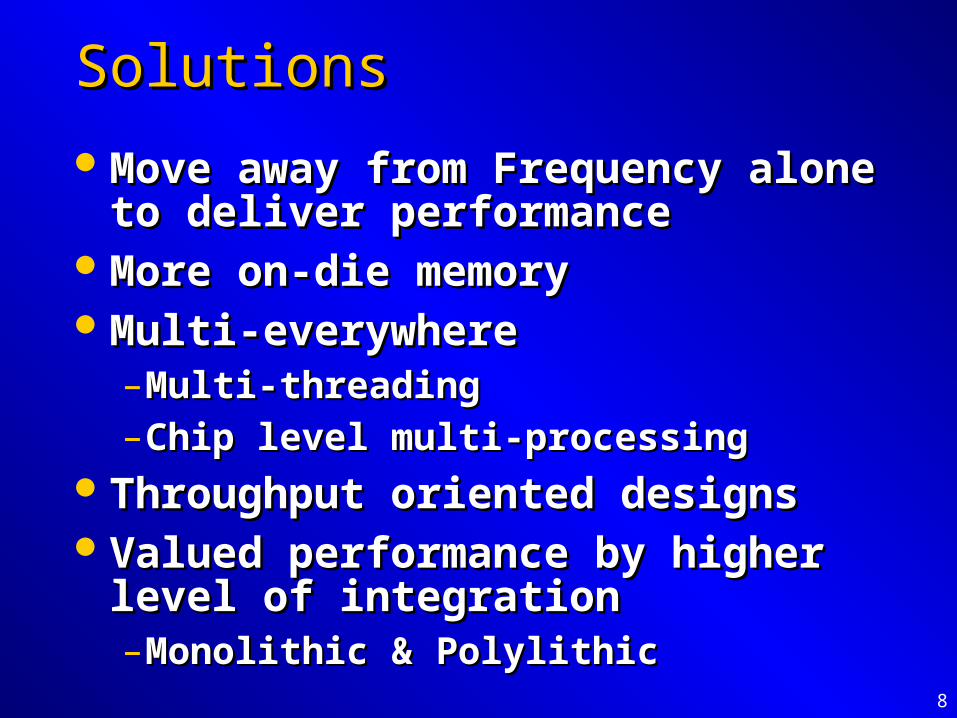
SolutionsSolutions
Move away from Frequency alone to Move away from Frequency alone to deliver performancedeliver performance
More on-die memoryMore on-die memoryMulti-everywhereMulti-everywhere
–Multi-threadingMulti-threading–Chip level multi-processingChip level multi-processing
Throughput oriented designsThroughput oriented designsValued performance by higher level of Valued performance by higher level of
integrationintegration–Monolithic & PolylithicMonolithic & Polylithic

9
Leakage SolutionsLeakage Solutions
Tri-gate Transistor
Silicon substrateSilicon substrate
1.2 nm SiO1.2 nm SiO22
GateGate
Planar Transistor
SiGeSiGe
Silicon substrate
Gate electrode
3.0nm High-k
For a few generations, then what?
For a few generations, then what?
10
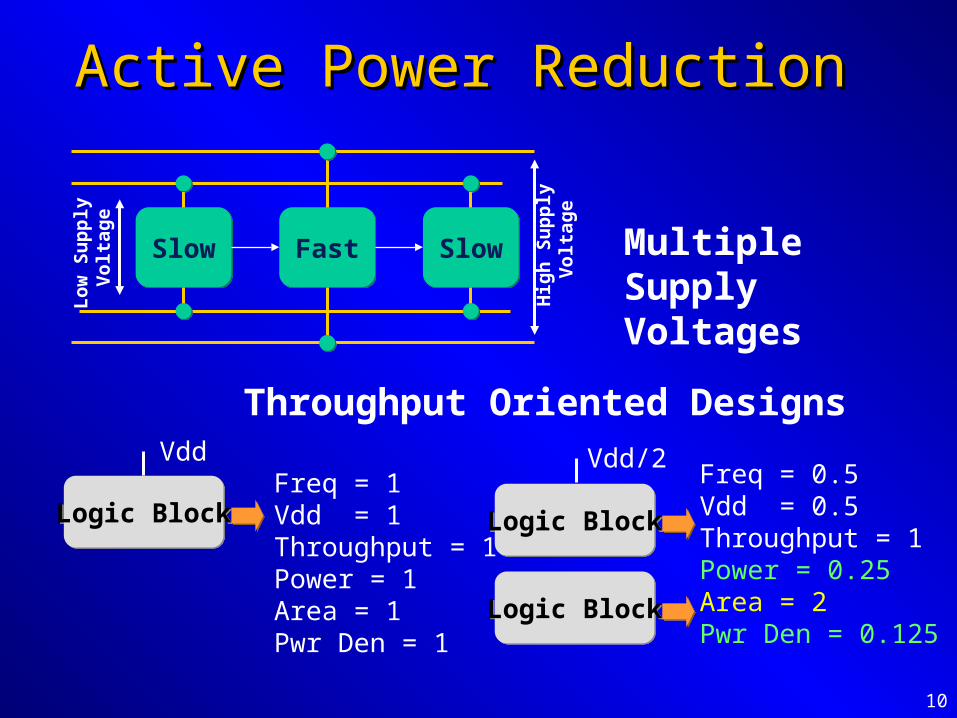
Active Power ReductionActive Power Reduction
SlowSlow FastFast SlowSlow
Lo
w S
up
ply
V
olt
age
Hig
h S
up
ply
V
olt
age
Multiple Supply Voltages
Logic BlockLogic BlockFreq = 1Vdd = 1Throughput = 1Power = 1Area = 1 Pwr Den = 1
Vdd
Logic BlockLogic Block
Freq = 0.5Vdd = 0.5Throughput = 1Power = 0.25Area = 2Pwr Den = 0.125
Vdd/2
Logic BlockLogic Block
Throughput Oriented Designs
11
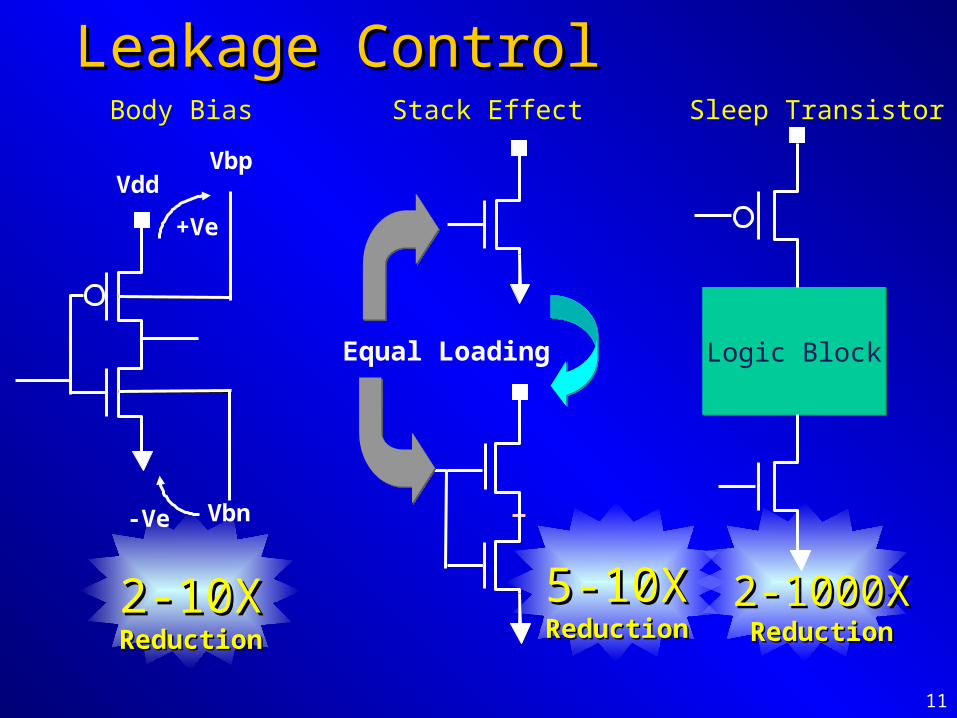
Leakage ControlLeakage ControlBody Bias
VddVbp
Vbn-Ve
+Ve
2-10X2-10XReductionReduction
Sleep Transistor
Logic BlockLogic Block
2-1000X2-1000XReductionReduction
Stack Effect
Equal Loading
5-10X5-10XReductionReduction
12
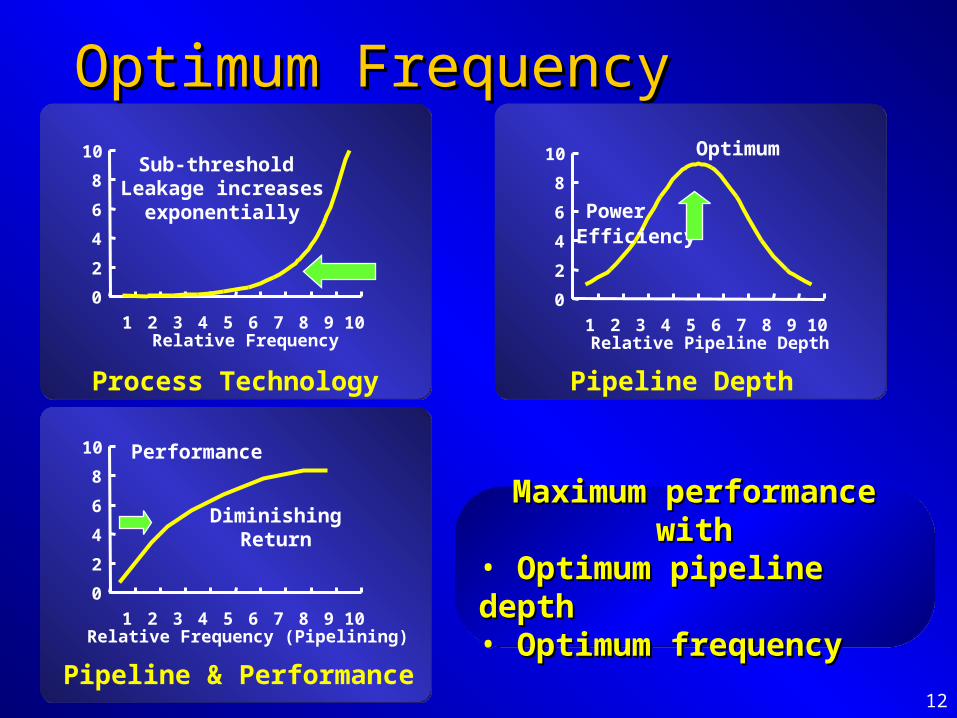
Optimum FrequencyOptimum Frequency
Maximum performance withMaximum performance with• Optimum pipeline depth Optimum pipeline depth • Optimum frequencyOptimum frequency
Maximum performance withMaximum performance with• Optimum pipeline depth Optimum pipeline depth • Optimum frequencyOptimum frequency
Process Technology
0
2
4
6
8
10
1 2 3 4 5 6 7 8 9 10Relative Frequency
Sub-threshold Leakage increases
exponentially
Pipeline Depth
0
2
4
6
8
10
1 2 3 4 5 6 7 8 9 10Relative Pipeline Depth
Power Efficiency
Optimum
Pipeline & Performance
0
2
4
6
8
10
1 2 3 4 5 6 7 8 9 10Relative Frequency (Pipelining)
Performance
DiminishingReturn
13
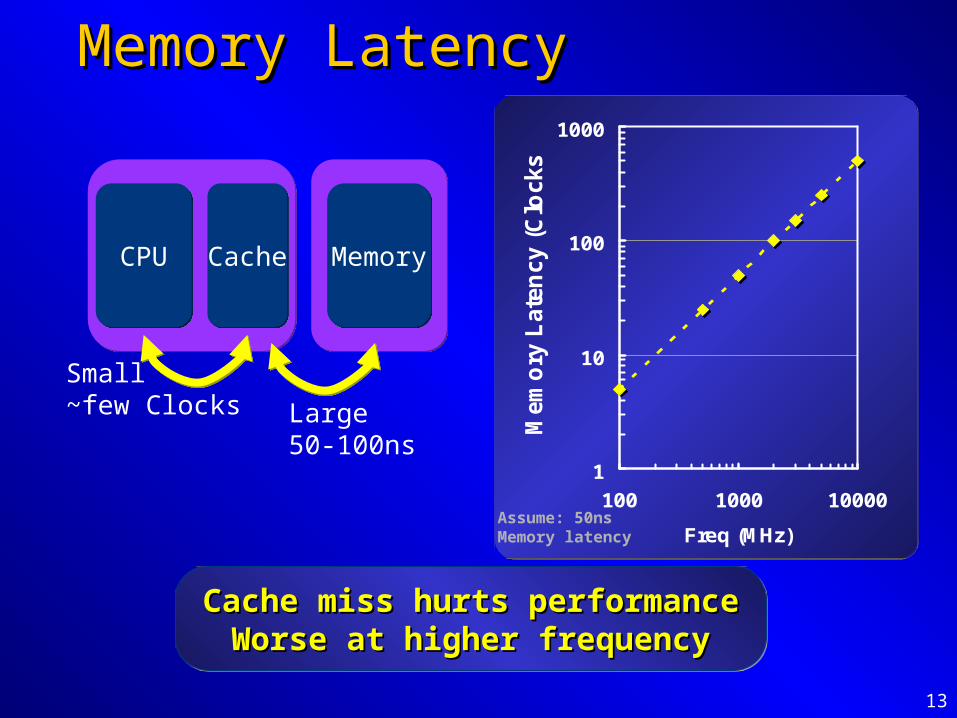
Memory LatencyMemory Latency
MemoryMemoryCPUCPU CacheCache
Small~few Clocks Large
50-100ns1
10
100
1000
100 1000 10000
Freq (MHz)M
em
ory
Late
ncy (
Clo
cks)
Assume: 50ns Memory latency
Cache miss hurts performanceCache miss hurts performanceWorse at higher frequencyWorse at higher frequency
Cache miss hurts performanceCache miss hurts performanceWorse at higher frequencyWorse at higher frequency
14
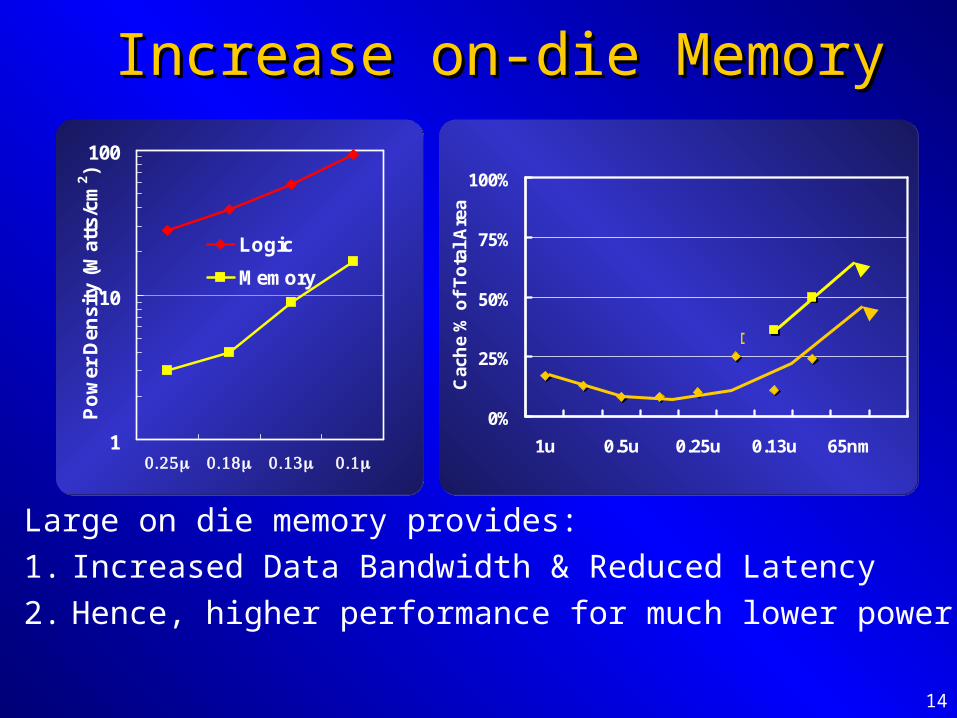
Increase on-die MemoryIncrease on-die Memory
Large on die memory provides:
1. Increased Data Bandwidth & Reduced Latency
2. Hence, higher performance for much lower power
1
10
100
Po
wer
Den
sity
(W
atts
/cm
2)
Logic
Memory
0%
25%
50%
75%
100%
1u 0.5u 0.25u 0.13u 65nmC
ach
e %
of
To
tal
Are
a
486Pentium®
Pentium® III
Pentium® 4
Pentium® M

15
Multi-threadingMulti-threading
0%
20%
40%
60%
80%
100%
100% 98% 96%
Cache Hit %
Per
form
ance
1 GHz
2 GHz
3 GHz
STST Wait for MemWait for Mem
MT1MT1 Wait for MemWait for Mem
MT2MT2 WaitWait
MT3MT3
Single ThreadSingle Thread
Multi-ThreadingMulti-Threading
Full HW UtilizationFull HW Utilization
Multi-threading improves performance without Multi-threading improves performance without impacting thermals & power deliveryimpacting thermals & power delivery
Multi-threading improves performance without Multi-threading improves performance without impacting thermals & power deliveryimpacting thermals & power delivery
Thermals & Power Delivery Thermals & Power Delivery designed for full HW utilizationdesigned for full HW utilizationThermals & Power Delivery Thermals & Power Delivery designed for full HW utilizationdesigned for full HW utilization
16
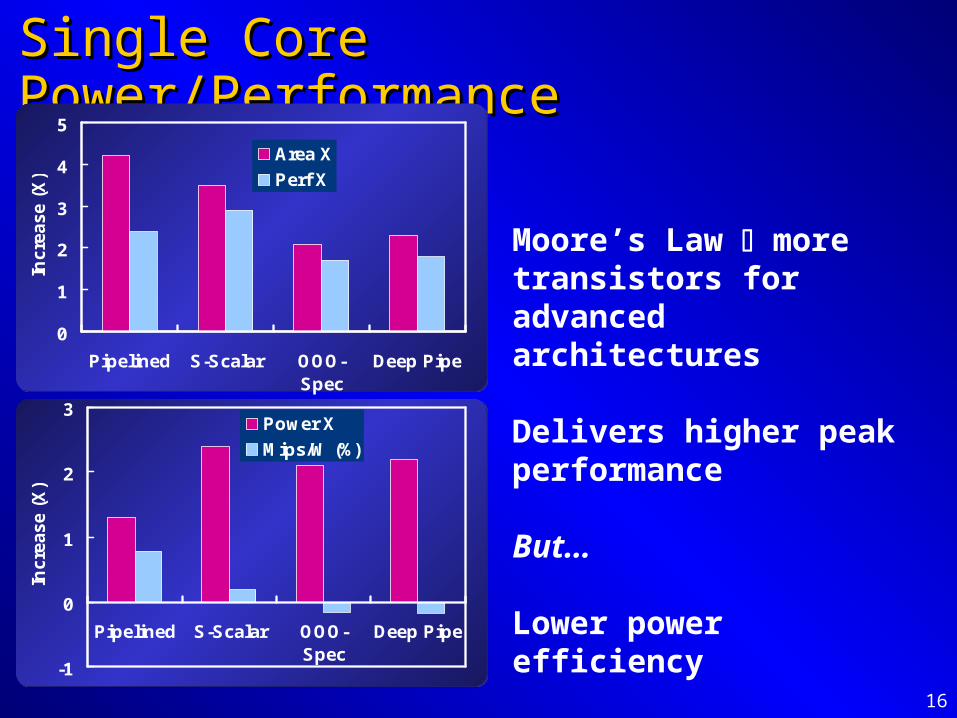
Single Core Power/PerformanceSingle Core Power/Performance
0
1
2
3
4
5
Pipelined S-Scalar OOO-Spec
Deep Pipe
Incre
ase
(X)
Area X
Perf X
-1
0
1
2
3
Pipelined S-Scalar OOO-Spec
Deep Pipe
Incre
ase
(X)
Power X
Mips/W (%)
Moore’s Law more transistors for advanced architectures
Delivers higher peak performance
But…
Lower power efficiency
17
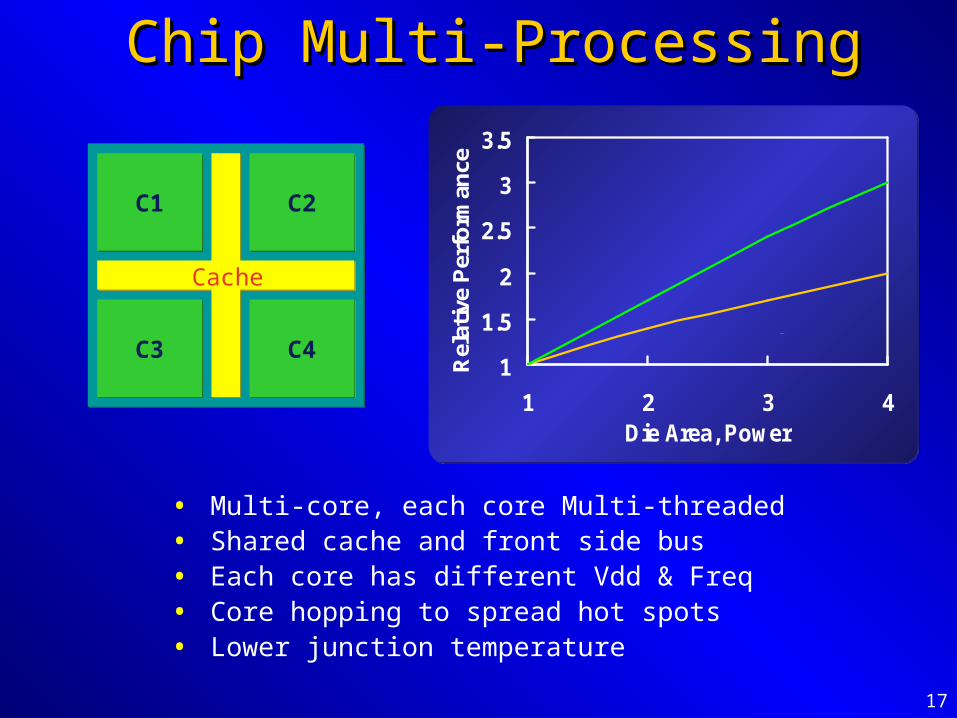
Chip Multi-ProcessingChip Multi-Processing
1
1.5
2
2.5
3
3.5
1 2 3 4Die Area, Power
Rel
ativ
e P
erfo
rman
ce
Multi Core
Single Core
C1C1 C2C2
C3C3 C4C4
Cache
• Multi-core, each core Multi-threaded• Shared cache and front side bus• Each core has different Vdd & Freq• Core hopping to spread hot spots• Lower junction temperature
18
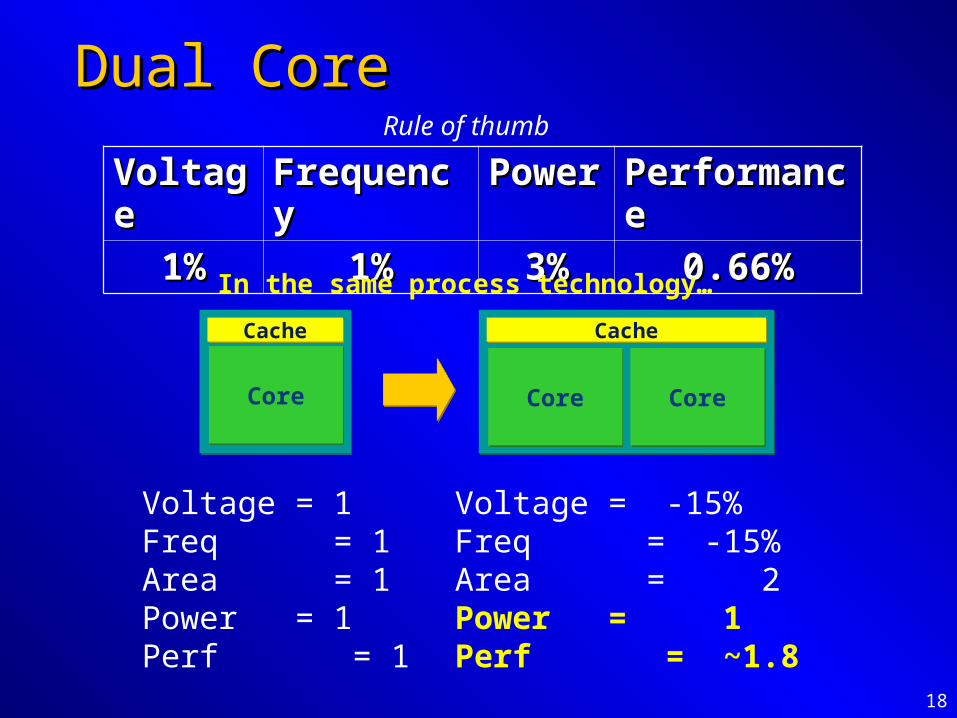
Dual CoreDual Core
VoltageVoltage FrequencyFrequency PowerPower PerformancePerformance
1%1% 1%1% 3%3% 0.66%0.66%
Rule of thumb
CoreCore
CacheCache
CoreCore
CacheCache
CoreCore
Voltage = 1Freq = 1Area = 1Power = 1Perf = 1
Voltage = -15%Freq = -15%Area = 2Power = 1Perf = ~1.8
In the same process technology…
19
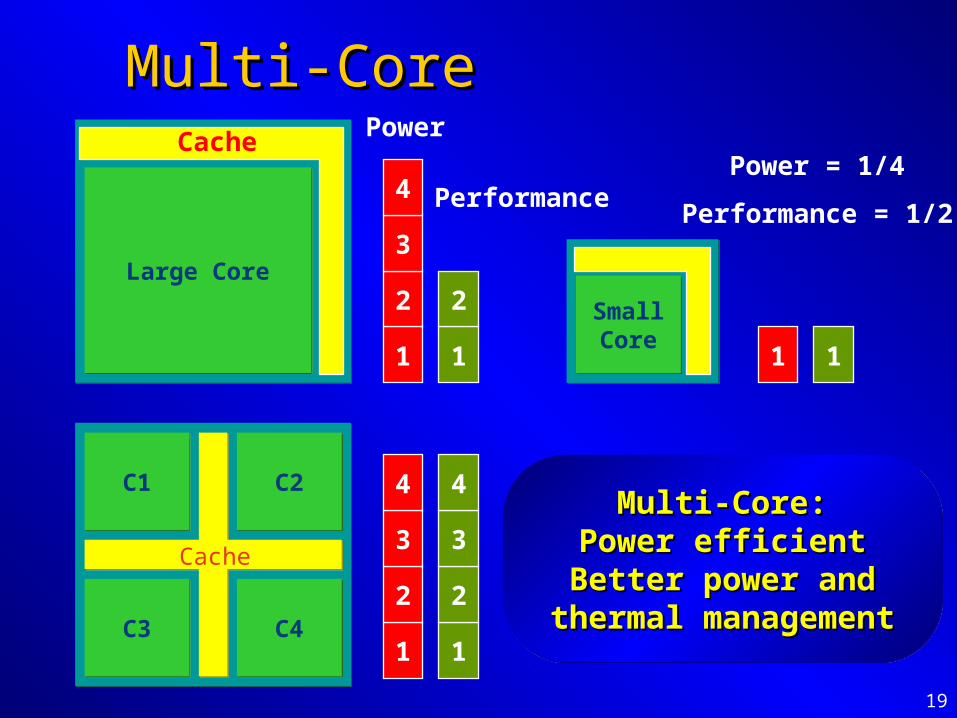
Multi-CoreMulti-Core
C1C1 C2C2
C3C3 C4C4
Cache
Large CoreLarge Core
Cache
1
2
3
4
1
2 SmallCoreSmallCore
1 1
1
2
3
4
1
2
3
4
Power
PerformancePower = 1/4
Performance = 1/2
Multi-Core:Multi-Core:Power efficientPower efficient
Better power and Better power and thermal managementthermal management
Multi-Core:Multi-Core:Power efficientPower efficient
Better power and Better power and thermal managementthermal management
20
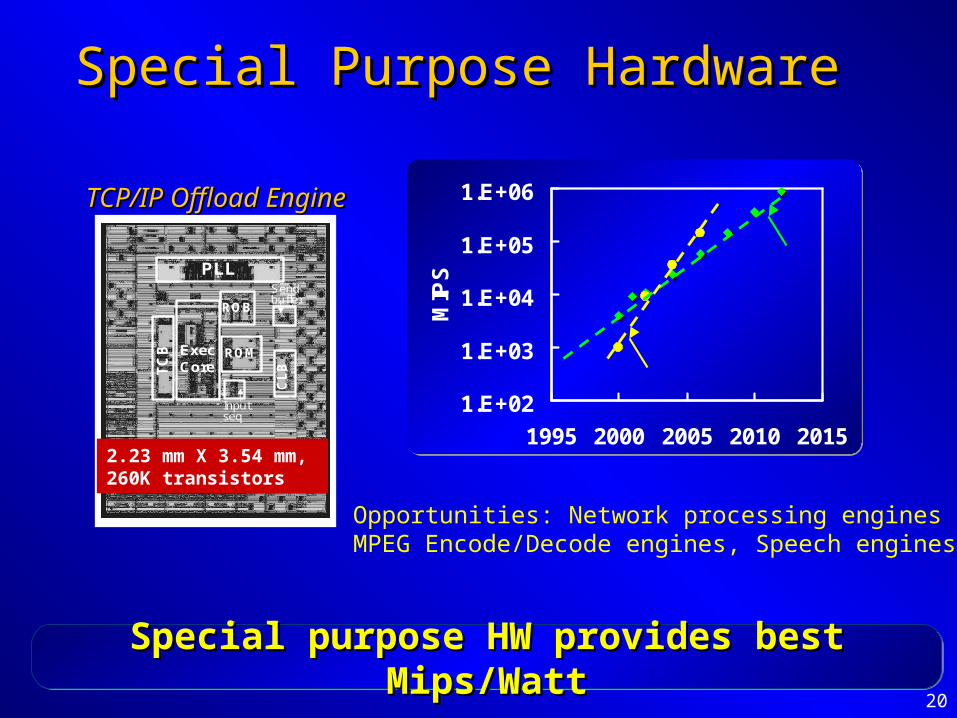
Special Purpose HardwareSpecial Purpose HardwareT
CB Exec
Core
PLL
OOO
ROM
CA
M1
TC
B ExecCore
PLL
ROB
ROM
CL
B
Inputseq
Sendbuffer
2.23 mm X 3.54 mm, 260K transistors
Opportunities: Network processing enginesMPEG Encode/Decode engines, Speech engines
1.E+02
1.E+03
1.E+04
1.E+05
1.E+06
1995 2000 2005 2010 2015M
IPS
GP MIPS@75W
TOE MIPS@~2W
TCP/IP Offload EngineTCP/IP Offload Engine
Special purpose HW provides best Mips/WattSpecial purpose HW provides best Mips/WattSpecial purpose HW provides best Mips/WattSpecial purpose HW provides best Mips/Watt
21
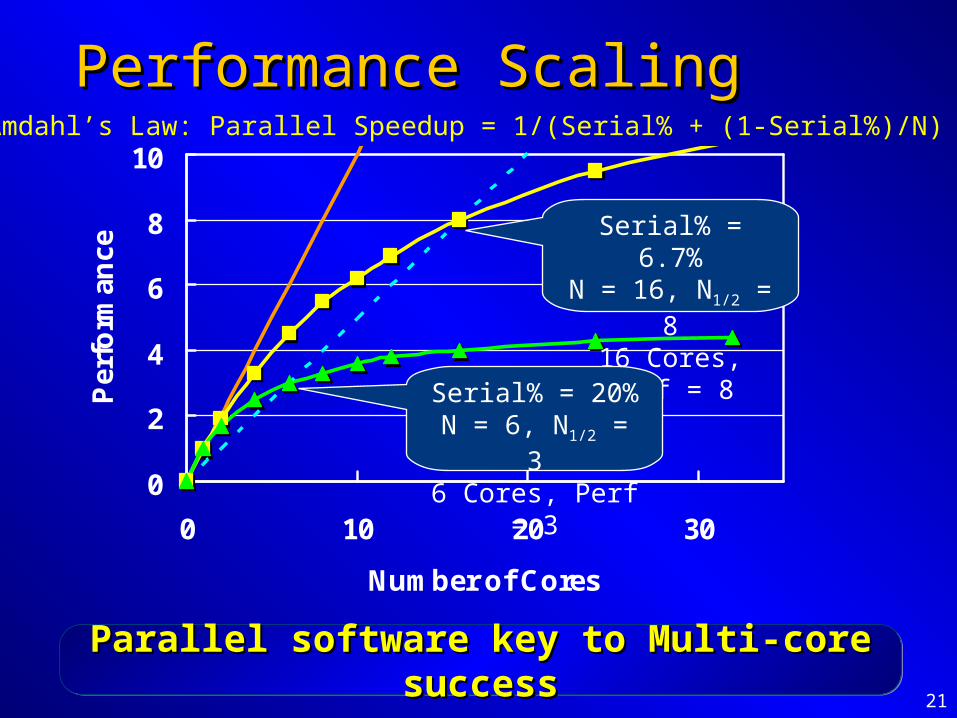
Performance ScalingPerformance Scaling
0
2
4
6
8
10
0 10 20 30
Number of Cores
Per
form
ance
Amdahl’s Law: Parallel Speedup = 1/(Serial% + (1-Serial%)/N)
Serial% = 6.7%N = 16, N1/2 = 8
16 Cores, Perf = 8
Serial% = 20%N = 6, N1/2 = 3
6 Cores, Perf = 3
Parallel software key to Multi-core successParallel software key to Multi-core successParallel software key to Multi-core successParallel software key to Multi-core success

22
From Multi to Many…From Multi to Many…
0
5
10
15
20
25
30
TPT OneApp
TwoApp
FourApp
EightApp
Sys
tem
Per
form
ance
Large
Med
Small
Single Core Performance
1
0.5
0.3
0
0.2
0.4
0.6
0.8
1
1.2
La
rge
Me
d
Sm
all
Re
lati
ve
Pe
rfo
rma
nc
e
13mm, 100W, 48MB Cache, 4B Transistors, in 22nm12 Cores 24 Cores 144 Cores
23
GPGP GPGP
GPGP
GPGP GPGP
GPGP
GPGP
GPGP GPGP
GPGP
GPGP GPGP
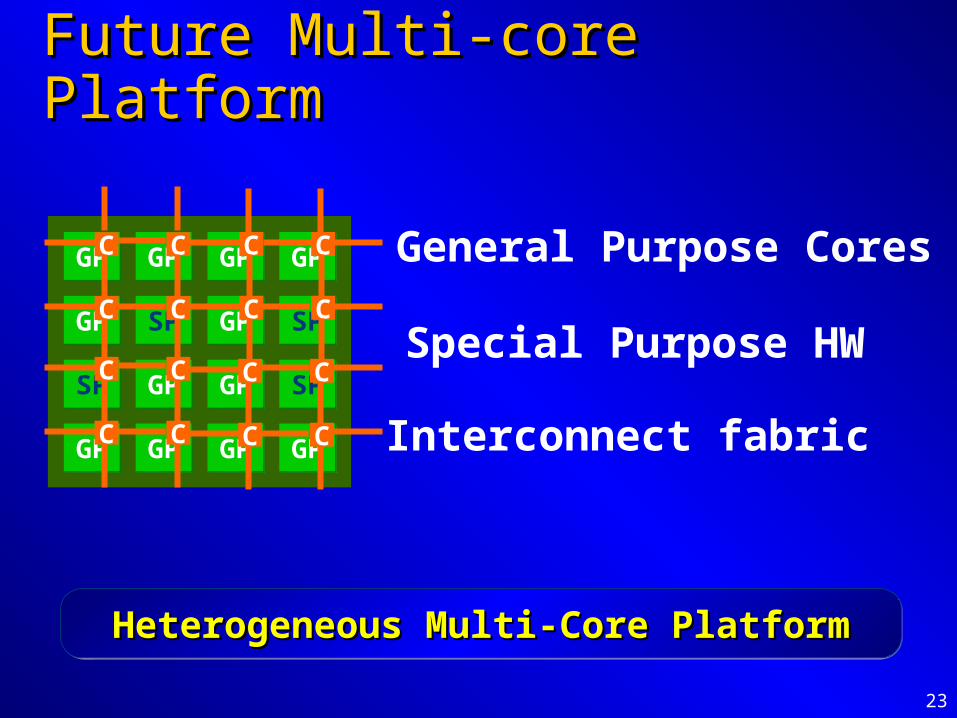
General Purpose Cores
Future Multi-core PlatformFuture Multi-core Platform
SPSP SPSP
SPSP SPSPSpecial Purpose HW
CC
CC
CC
CC
CC
CC
CC
CC Interconnect fabric
Heterogeneous Multi-Core PlatformHeterogeneous Multi-Core PlatformHeterogeneous Multi-Core PlatformHeterogeneous Multi-Core Platform
24
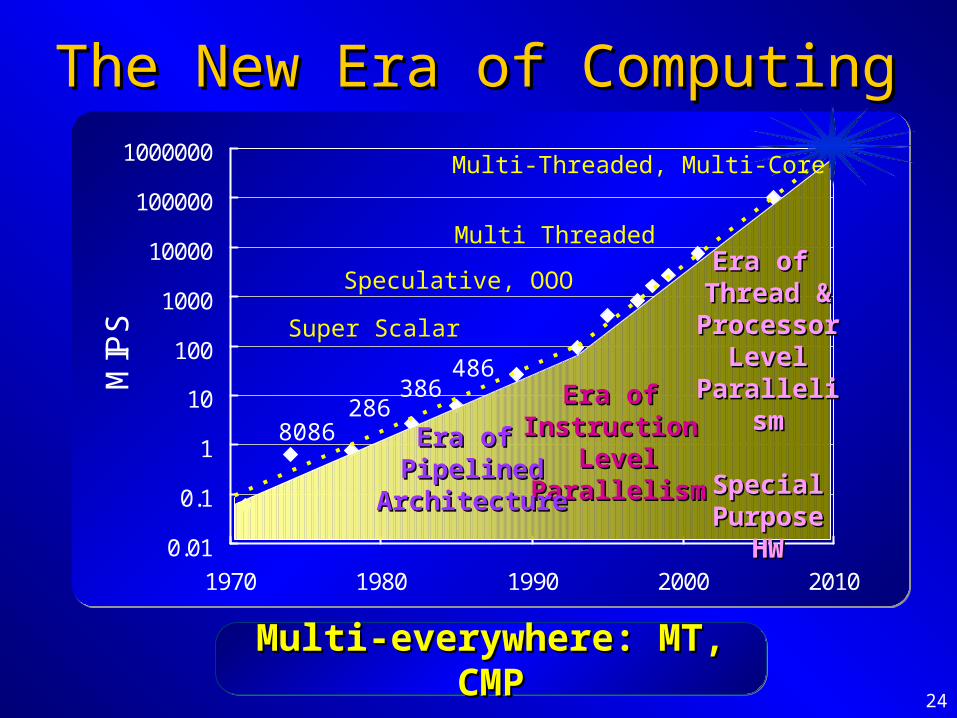
The New Era of ComputingThe New Era of Computing
0.01
0.1
1
10
100
1000
10000
100000
1000000
1970 1980 1990 2000 2010
MIP
S
Multi-everywhere: MT, CMPMulti-everywhere: MT, CMPMulti-everywhere: MT, CMPMulti-everywhere: MT, CMP
Speculative, OOO
Era of Era of Instruction Instruction
LevelLevelParallelismParallelism
Super Scalar
486386
2868086 Era of Era of
PipelinedPipelinedArchitectureArchitecture
Multi ThreadedEra of Era of
Thread &Thread &ProcessorProcessor
LevelLevelParallelismParallelism
Special Special Purpose HWPurpose HW
Multi-Threaded, Multi-Core

25
SummarySummaryBusiness as usualBusiness as usual is not an option is not an option
–Performance at any cost is historyPerformance at any cost is historyMust make a Must make a Right Hand Turn (RHT)Right Hand Turn (RHT)
–Move away from frequency aloneMove away from frequency aloneFuture Future Architectures and designsArchitectures and designs
–More memory (larger caches)More memory (larger caches)–Multi-threadingMulti-threading–Multi-processingMulti-processing–Special purpose hardwareSpecial purpose hardware–Valued performance with higher integrationValued performance with higher integration