corporate.evonik.comcorporate.evonik.com/downloads/evonik-annual-report-2011-en.pdf · 13 32 15 6...
TRANSCRIPT

Company report
AnnuAl RepoRt 2011
Success means responsibilityHow we meet our responsibility as a global player in a growing world
Evonik Industries AG Rellinghauser Straße 1–1145128 EssenGermany www. evonik.com
Annu
Al R
epoR
t 20
11


Company report


13
32
156
55
33
39
1716
25
3947
2339391325
32
1516
Creating a unique profi le. 10Safeguarding global nutrition.Our amino acids improve the environmental compatibility of livestock farming.
Accessing growth markets. 18Improving health.Pharmaceutical polymers and highly potent active ingredients from Evonik improve drug delivery.
Gaining a technological edge. 26Reducing waste.Our superabsorbents make diapers thinner and more absorbent.
Speeding up growth. 34Slowing climate change.Our products help make vehicles more economical.
Raising sales. 42Reducing emissions.Evonik’s crosslinkers are used to produce robust wind turbines.
Entering new markets. 50Saving resources.High-performance polymers from Evonik are used around the world.
Ready for the future—the new six-member Executive Board of Evonik Industries AG.
From left:Dr. Thomas Haeberle Thomas Wessel (Chief Human Resources Officer)Patrik Wohlhauser Dr. Klaus Engel (Chairman)Dr. Dahai Yu Dr. Wolfgang Colberg (Chief Financial Officer)


Dr. Klaus EngelDr. Klaus Engel was born in Duisburg (Germany) in 1956. He studied chemistry at the Ruhr University Bochum, where he obtained his doctorate before starting his career at Chemische Werke Hüls AG in 1984. In 1994 he was placed in charge of Corporate Development and subsequently became man-aging director of Creanova Spezialchemie AG, before transferring to Stinnes AG.
From 1999 to 2006 he was first a member and subsequently Chairman of the Executive Board of Brenntag AG. In addition, from 2004 he was Chief Executive Director of Brenntag Management GmbH.
From 2006 until 2007 Dr. Engel was a member of the Board of Management of RAG Aktien-gesellschaft and from 2006 until 2008 he was a member and subsequently Chairman of the Board of Management of Degussa AG. From 2007 he was Chairman of the Board of Management of Evonik Degussa GmbH. In 2006 he was appointed to the Executive Board of Evonik Industries AG (at that time RAG Beteiligungs-AG) and has been its Chairman since January 2009.
Dr. Wolfgang Colberg Dr. Wolfgang Colberg was born in Kiel (Germany) in 1959. He studied business administration and commercial information technology in Kiel, where he was awarded his doctorate (Dr. sc. pol.). In 1986 Dr. Colberg joined Robert Bosch GmbH, where he held a variety of management positions up to 2000. His areas of responsibility in the Bosch Group included Corporate Strategy, Controlling and M&A, head of Business Administration, General Manager for Turkey and Central Asia, and head of Central Purchasing and Logistics.
In 2001 Dr. Colberg joined the Board of Man-agement of Bosch and Siemens Hausgeräte GmbH (BSH) in Munich. In April 2009 he moved to Evonik Industries AG as a member of the Executive Board and CFO.
Dr. Thomas HaeberleDr. Thomas Haeberle was born in Nuremberg (Germany) in 1956. He studied process technology at the University of Erlangen-Nuremberg where he was awarded a doctor-ate in engineering. Dr. Haeberle started his career at Röhm GmbH in Darmstadt, where he was subsequently entrusted with a number of management roles. These included respon-sibility for the monomers business and PLEXIGLAS molding compounds. From 2000 until 2003 he was a member of the Board of Management. In 2003 he moved from Röhm GmbH to take up a post on the Board of Management of Infracor GmbH, becoming its Chairman from 2004 until 2006.
In 2006 he joined Degussa AG, initially as head of the Building Blocks Business Unit. In 2008 he became head of the Industrial Chemicals Business Unit at Evonik Degussa GmbH, a position he held until he was appointed to the Board of Management of Evonik Degussa GmbH in 2009. Dr. Haeberle has been a member of the Executive Board of Evonik Industries AG since April 2011.

Thomas Wessel Thomas Wessel was born in Herten (Germany) in 1963. Having qualified as an industrial clerk at Bergbau AG Lippe, he trained as a personnel officer and subse-quently studied human resources manage-ment. Thomas Wessel began his career in the human resources department at Bergbau AG, Lippe, and subsequently moved to the Person-nel Policy Issues Department at RAG Aktien-gesellschaft, which he headed from 1997. From 2001 until 2002 his roles also included Deputy Head of the Human Resources Division and the Head of the Human Resources Policy/Controlling Department at RAG Aktiengesell-schaft.
From 2002 until 2006 he headed the Human Resources Division at RAG Aktiengesellschaft. During this time he was also a member of the Board of Management of RAG Beteiligungs-GmbH. In 2006 he was appointed Chairman of the Board of Management of RAG BILDUNG GmbH. In 2009 he joined Evonik Degussa AG as Chief Human Resources Officer and a member of the Board of Management. Thomas Wessel has been Chief Human Resources Officer of Evonik Industries AG since September 2011.
Patrik Wohlhauser Patrik Wohlhauser was born in Tafers/ Fribourg (Switzerland) in 1964. He took a business administration degree at the University of Fribourg followed by the Accelerated Management Development Programme at London Business School. At the start of his career Patrik Wohlhauser was employed in Operational Auditing at SANDOZ INTERNATIONAL AG. He was Operations Manager at MBT SCHWEIZ AG from 1993, and Director Sales at this company from 1995. In 1997 he was appointed CEO of MBT FRANCE.
In 2002 he moved to Degussa AG, initially as head of the Construction Systems Europe Business Unit and from 2005 as head of the Exclusive Synthesis & Catalysts Business Unit. From 2007 he was a member of the Board of Management of Evonik Degussa GmbH, becoming Chairman in 2009. Patrik Wohlhauser has been a member of the Executive Board of Evonik Industries AG since April 2011.
Dr. Dahai YuDr. Dahai Yu was born in Shanghai (China) in 1961. He studied chemistry at the University of Hamburg, where he obtained his doctorate in 1989. Following a research scholarship, he joined Degussa AG as a laboratory manager in Central Research in 1990. His long career at Degussa included posts as product man-ager, director of the Corporate Development and Strategy Planning department, head of controlling for the Fine & Industrial Chemicals Business Unit and head of the Agrochemicals & Intermediates Business Line.
In 2006 Dr. Yu returned to his home city Shanghai as President of Evonik’s Greater China Region and Chairman of Evonik Degussa (China) Co., Ltd. He has been a member of the Executive Board of Evonik Industries AG since April 2011.


2011 was a very successful year for the Evonik Group. Buoyed by high global demand, we were once again able to raise earnings significantly. At the same time, we systematically drove forward the repositioning of Evonik as a specialty chemi-cals corporation and further improved our financial profile. That has made Evonik even more attractive for our customers, employees, shareholders and the market.
Operationally, 2011 was Evonik‘s best year to date. Group sales grew 9 percent to around €14.5 billion, driven mainly by an increase in both volumes and selling prices. The operating result before interest, taxes, depreciation, amortization and the non-operating result (EBITDA) rose 17 percent to around €2.8 billion. That lifted our EBITDA margin to an impressive 19.0 percent, placing us in a very good position relative to the sector. Net income advanced by more than 38 percent to over €1.0 billion.
The cash flow from operating activities in our continuing operations remained good at over €1.4 billion. Capital expenditures rose by around 27 percent to €830 mil-lion. Compared with year-end 2010, net financial debt halved to just €0.8 billion. In 2011 we allocated a further €400 million to the contractual trust arrangement (CTA) established in 2010 to shift funding of pension commitments outside the company. We plan to increase the CTA‘s assets stepwise in the future.
To strengthen the trust placed in the Evonik Group still further, our plans for the future include raising efficiency and profitable growth. A major driver behind this has been the On Track efficiency enhancement program introduced at the start of 2009, which has now been successfully completed. Improvements to all major processes in the Group enabled us to achieve our savings target of €500 million a year for the first time at the end of 2011, one year ahead of schedule. To maintain our competitiveness, we will continue to work on a sustained improvement in the company‘s efficiency.

Evonik has a whole range of organic growth options and intends to continue to invest in promising future markets. Last year alone, we initiated projects totaling over €900 million to expand our production capacity in Asia. The biggest invest-ment is the planned construction of a new production facility for methionine in Singapore to enable us to serve the Asian market for this amino acid for animal feed even more effectively in the future. Investment has also been allocated to raise capacity for isophorone and isophorone diamine, hydrogen peroxide and organic specialty surfactants. All of these plants are expected to come on stream in the next couple of years and should strengthen Evonik‘s market position in one of the world‘s fastest growing regions.
Overall, an investment budget of more than €6 billion has been earmarked for the period up to 2016. In Argentina we are pressing ahead with the construction of a new facility for catalysts for the production of biodiesel and in Brazil we are planning a new plant for cosmetic ingredients. Moreover, there are plans to build a new production plant for superabsorbents with partners in Saudi Arabia. While these regions are very different, our strategic goal is consistent: We aim to utilize our strong technology platforms to grow our market leadership further. We want to be even nearer to the market and work even more closely with our customers around the world.
Innovative capability is one of Evonik‘s strengths—and a key driver of profitable growth. Last year we spent €365 million on research and development, 8 percent more than in 2010. We have some 450 projects geared to new or improved prod-ucts, production processes and applications. More than half of these should be realized or brought to market maturity in the next two years. One example is the successful commercialization of our lithium-ion technology, which Daimler AG will be using in serial production of the new E-Smart from this year.
Over the past twelve months we have made enormous progress in positioning Evonik as a specialty chemicals company. In March 2011 we divested the majority of our energy business to a consortium of municipal utilities in Germany‘s Rhine-Ruhr region. We also made binding arrangements to sell our remaining shares to this consortium between 2014 and 2017.
Important agreements have been concluded with the German Mining, Chemicals and Energy union (IG BCE) on implementing the model for the future of the real estate operations. From today‘s perspective, the residential real estate company created by the planned merger of our real estate business with THS, in which Evonik and IG BCE each have a 50 percent stake, would be the third largest in Germany. As a first step towards this, on January 1, 2012, Evonik and THS bundled the management of their residential properties in a newly formed joint venture, Vivawest Wohnen GmbH.
To ensure stable long-term ownership structures, Evonik intends to transfer some of its investment in the real estate activities to the contractual trust arrangement that secures employees‘ pension entitlements. RAG-Stiftung also intends to take a stake in this real estate company. That is a clear signal to the roughly 300,000 tenants that the goals are continuity and quality. In the mid term, Evonik aims to completely divest its real estate activities, preferably to investors with a long-term horizon.
Turning to our core business, as announced we have divested the carbon black business, which had sales of around €1 billion in 2010. We have also made a number of acquisitions that are a good fit with our growth profile. Consequently, Evonik now has a sharper focus on economically significant megatrends with high growth potential.
The rating agencies Moody‘s and Standard & Poor‘s are positive about Evonik‘s strategic and operational development and both have given us an investment grade rating for the first time—evidence that our successful development is accompanied by rising confidence in Evonik. That is also reflected in the highest ever participation by employees in our in-house participation rights program.

Evonik is on course and is looking ahead confidently. Our strategic alignment to global economic and social megatrends is proving correct. At the same time, our goals are to raise efficiency and concentrate on profitable growth. Together they give us the strength we need to remain successful in the long term as well. Our employees have played a big part in that. The development of the Evonik Group has made it clear that close and trustful collaboration with representatives of the workforce is essential for our success. We will be tackling the upcoming challenges in collaboration with them and with our shareholders. Even though economic conditions are becoming tougher, we therefore have a sound basis for continued success in the future.
Dr. Klaus Engel, Chairman of the Executive Board of Evonik Industries AG


Industrial value creation
Naturally we measure our success by sales and profits, new products, patents and research achievements. And
of course we strive for continuous improvement in all of these fields. Yet we are not guided solely by business
figures; we also want to create value for society.

Responsible conduct and business success are not mutually exclusive in our view. On the contrary, they are interlinked. We define success as balancing the interests of our business with those of society.
Social value creation

Creating a unique profile.

Safeguarding global nutrition.

12 13Alleinstellung festigen.
Optimized animal nutrition is becoming more and more important in industrial livestock farming: It plays a vital role in meeting rising global demand for meat without putting greater pressure on the environment.
As the world’s only supplier of all four essential amino acids for animal nutrition, Evonik will help feed the world’s growing population in the future.

12 13 Safeguarding global nutrition.
The bagging line rotates continuously: Every two seconds, 25 kilograms of white powder pour into a sack. “We have the capacity to produce 260,000 metric tons of DL-methionine a year. That is the highest world-wide,” says Tom De Bruycker (39), plant manager at Evonik’s site in Antwerp (Belgium). Here, at Europe’s second-largest port, Evonik has been producing the essential amino acid methionine for decades. This product plays an important role in helping to satisfy rising demand for high-quality meat while preserving the Earth’s resources.
As components of proteins, amino acids are the building blocks of life. They are added to conventional animal feeds such as corn and soymeal to enhance their effect. Just two grams of MetAMINO can optimize a whole kilogram of feed. As a result, pigs, hens, turkeys and fish need less feed to grow. “Using methionine reduces the use of soil and water and also cuts CO2 emissions—and that is an important response to one of the major challenges facing society in the future,” says De Bruycker.
Rising demand in AsiaOur planet already has more than seven billion inhabitants and the United Nations estimates that the global population is growing by more than 80 million a year. At the same time, the middle class in emerging markets like China and Brazil is increasing. That means demand for meat is rising—and that is increasing demand for animal feed. Since the amount of agricultural land remains virtually constant, more effi-cient production methods are needed. “That’s why we assume that demand for methionine will rise in the long term, especially in Asia,” explains De Bruycker as he inspects the warehouse. Here, pallets of 40 sacks are being prepared for shipping. Each pallet weighs one metric ton and is labeled with its destination: Buenos Aires, Busan, Shibushi, Kingston. The “Cosco China” is docked at Gateway 33. Thou-sands of containers will be loaded into the hold of this 300-meter cargo ship at daybreak. Destined for Asia.
Antwerp (Belgium)
11 Evonik production facilities1,000 Evonik employees
Tom De Bruycker in Antwerp, at Evonik’s largest production facility for methionine.
14 15Creating a unique profile.
Jakarta, Indonesia. About 40 kilometers from the city’s port, a red-and-white rooster on the roof of a complex of buildings draws attention to a busy workplace. A handful of young men are standing on the loading ramp at Sinta Prima Feedmill, stacking sacks onto a fleet of yellow trucks. Feed for Indonesia’s countless poultry farms. And every sack includes some MetAMINO, Evonik’s brand of DL-methionine.
The mill opened in 1974. “At first, most of the work was done manually. Automation only came in 1988,” explains sales manager Frengky Ang. Sinta Prima now operates two mills. “We want to start up a third one in 2012. We are growing because so far the economic upswing in Indonesia has led to increasing demand for chicken,” he says. “More and more people can afford poultry as a source of protein.”
A presence in more than 100 countriesUnder the massive corrugated iron roof, a forklift truck picks up a heavy sack of methionine and places it on the dosing unit. Watched by Ang, Candra Yanuartin, Vice President of Sinta Prima, and Dr. Torben Madsen and Mercyawati Subianto from Evonik. The two Evonik employees regularly visit customers. “We maintain a very good rela-tionship with our customers. That enables us to understand what they need, where there could be problems and where the challenges are,” explains Subianto. Sinta Prima’s Vice President nods in agreement:
“There were several reasons why we chose to use DL-methionine from Evonik,” says Yanuartin: “Evonik is a reliable supplier and product qual-ity is consistently high. And their service and technical support meet our needs.”
60 percent more capacity by 2014Evonik is the only company in the world that offers all four key essen-tial amino acids used by the animal feed industry, including Biolys (L-lysine), ThreAMINO (L-threonine) and TrypAMINO (L-trypto-phan). But its flagship product is still MetAMINO. Here, Evonik considers itself to be the world market and technology leader with three global production sites and a market presence in more than 100 countries. Production bottlenecks are avoided by integrated production processes—alongside methionine, Evonik produces the three starting products required for it in the same plant—and that also reduces exposure to raw material prices. It is estimated that every year DL-methionine from Evonik is consumed by some 45 billion chickens around the world.
The company is raising capacity to meet demand, especially in the Asian region, where it is investing around €500 million in a new production facility in Singapore. Located on Jurong Island, the new plant is sched-uled to produce 150,000 metric tons a year from 2014. That will increase Evonik’s global methionine capacity by around 60 percent compared with 2010, to a total of 580,000 metric tons a year.
“We use methionine from Evonik because of Evonik’s global presence and its power in the international supply chain.”
Otto Seijler, General Manager Trouw Nutrition Nederland BV (Netherlands)
A presence in more than 100 countries around the world
A new methionine facility in Singapore will increase capacity by 150,000 metric tons p.a. from 2014

14 15 Safeguarding global nutrition.
1 Talking to customers at the Sinta Prima Feedmill in Indonesia.2 Global demand for poultry is rising.3 Kitchen scene in China.
1
3
2

16 17Creating a unique profile.
One of Evonik’s largest amino acid customers is headquartered in the Netherlands. “We use methionine from Evonik because of Evonik’s global presence and its power in the international supply chain,” says Otto Seijler, General Manager of the feed producer Trouw Nutrition Nederland BV, which is part of the publicly listed Nutreco Group, which reported sales of around €5 billion in 2010. Food production needs to double in the next few years, but at the same time the carbon footprint of the production chain, in other words, direct and indirect greenhouse gas emissions, need to be halved. That is a challenge for Evonik as a supplier as well as for Trouw Nutrition. However, Seijler is optimistic: “Evonik’s expertise enables us to produce the best possible feed for our customers.”
New applications mean new opportunities Florø, Norway. Located right on the coast north of Bergen, this is the country’s most westerly town. Here a company called EWOS produces feed pellets for aquaculture. The tiny brown pellets are only a few millimeters in size. Several metric tons are currently being loaded into the “Arctic Lady”, bound for aquaculture facilities a few kilometers off the coast. In our age of overfishing, industrial fish farming is a growing business. The Norwegian company Leroy has several large coley farms along the Norwegian coast. Just under 200 kilometers from Florø, Björn Helge Hjartaker, who is responsible for a number of Leroy’s fish farms around Bergen, tells us that at this site the company has six seawater basins, each of which contains around 150,000 coley. “Good feed is vital to ensure we minimize waste by reducing the amount of feed we require and cut costs at the same time.” Methionine from Evonik plays an important role in that. Another reason why the bagging lines in Antwerp and other sites are operating at full capacity.
“Using methionine reduces the use of soil and water and also cuts CO2 emissions—and that is an important response to one of the major challenges facing society in the future.”
Tom De Bruycker, Plant Manager at Evonik’s site in Antwerp
Norway
Fish production in aquaculture farms has doubled to around 1 million metric tons in recent years

16 17 Text.
1950
1960
1970
1980
1990
2000
2010
2020
1995
2005
2015
Aquaculture Wild stock
80
68
54
20
32
46
Beef
Poultry Lamb/goat
Year
Major investment in Singapore:
Evonik is investing about
€500million
in a new methionine complex
Start-upscheduled for
2014
From 2014 Evonik‘s total
annual capacity will be
580,000metric tons
An increase of a good
60percent
compared with 2010 (360,000 metric tons)
NewDL-methionine plant
with annual production
capacity of
150,000metric tons
0 02 100 200 300468Peoplein billions
Global population growth Global demand for meat Fish in %
millionmetric tons
Pork
Fish
Growing global population—Rising demand for animal protein
Expansion of production capacity for DL-methionine
Sources: Department of Economic and Social Aff airs of the United Nations, World Population Prospects: The 2010 Revision | FAO of the United Nations: FAO STATS 2009 | International Food Policy Research Institute (IFPRI): 2020 Global food outlook (2001).

Accessing growth markets.

Improving health.

20 21Wachstumsmärkte besetzen.
Prosperity is rising steadily in the emerging markets, leading to the development of a middle class that wants increasingly good medical care. And in the industrialized world, people are living longer.
Evonik is benefiting from the trend to outsourcing in the pharmaceutical sector: It produces active ingredients for major pharmaceutical companies and is steadily developing its technology platform for functional polymers.

20 21 Improving health.
Mumbai, on the west coast of the Indian subcontinent, is a vibrant city with more than 12 million inhabitants. India’s largest city never sleeps—and is continuing to expand into the surrounding area. Evonik’s India Research Center is located on Saki Vihar Road, right in the center of the city. The airy building with the enormous glass facade sur-rounded by 15-meter high palm trees is often mistaken for the admin-istrative headquarters of a company. Yet here in this building Research Manager Shraddha Bodinge and her team of some thirty scientists are working on new polymer coatings for the pharmaceutical industry.
Better medication for the growing middle class“The pharmaceutical market is growing rapidly in India, much faster than the global average,” says Bodinge. The country’s economic upswing is leading to the development of a more broadly based middle class that can afford better medical care. However, in many cases a reliable active ingredient is not sufficient to ensure successful treatment. It is equally important to ensure that the substance is released in the body at the right time and place. That is precisely what Evonik’s EUDRAGIT brand of functional polymers does. For example, these ultra-thin tablet coatings ensure that sensitive active ingredients that are supposed to act in the colon are not destroyed by aggressive gastric acids in the stomach. Evonik’s product ensures controlled release of the active ingredient throughout the day or even over a longer period.
Modern medicines are expected to meet an increasingly broad spec-trum of requirements. “The challenge is the wide range of formula-tions,” explains Shraddha Bodinge. In addition, the range of diseases and the drugs used to treat them varies, so individual solutions are required. “In Europe, for example, diseases linked to affluence such as diabetes and hypertension are becoming more common, whereas in developing countries infectious diseases tend to be more prevalent.”
India’s middle class is growing fast.
Mumbai (India)
Evonik has had a presence here since 2002Evonik’s central R&D location in India
“The pharmaceutical market is growing rapidly in India, much faster than the global average.”
Shraddha Bodinge, Research Manager at Evonik’s R&D Center in India

22 23Accessing growth markets.
Since its establishment in 2002, Evonik’s research center in Mumbai has become a key element in its global business with EUDRAGIT polymers. Anil Sha regularly visits the facility. He is director of a family-run development company close to Mumbai that produces finished drug formulations and intermediates for export. “The increasing regu-lation of the Indian market is raising the demands made on products and their ingredients, and thus on the polymers used as tablet coatings,” says Sha. Evonik’s presence in India, its skilled personnel, technology, the consistent quality of its polymers and its innovative capability are the basis of this partnership. “We need polymers with a wide range of properties and Evonik is a single-source supplier.”
Trend to outsourcing is continuingChange of scene: Lafayette in Indiana (USA) is more than 14,000 kilo-meters from Mumbai. Here, at the Tippecanoe site in the east of the United States, more than 600 Evonik employees produce active phar-maceutical ingredients (APIs). Specialties include highly potent ingre-dients that have to be manufactured under exceptionally stringent safety standards. Evonik is one of the world’s leading producers of these substances. It acquired this site from the US pharmaceutical com-pany Eli Lilly in 2009. The acquisition reflects a sector trend that is
expected to continue in the future: Major players in the pharma- ceutical industry are increasingly outsourcing the production of active ingredients. Evonik sees that as a big opportunity: Only a few compa-nies in the world have the strong technology platforms and the chemicals expertise needed to meet the steadily rising demands of the pharmaceutical industry. The two are combined at its Tippecanoe site.
In front of the main building, which is surrounded by lovingly tended flowers, a US flag flutters in the breeze. “APIs are the components that make a medicine effective. In short, they are the ingredients that reduce blood pressure or cholesterol, and cure headaches,” explains the site’s German manager Dr. Gerwin Specka. “What is important is that in future we can offer an even broader technology base to meet our customers’ growing long-term needs.” In Specka’s view, Evonik is well-positioned: “One key advantage is that we can draw on the resources of our international technology network to meet customers’ individual needs at short notice.” That network provides access to resources from entire Evonik Group as well as other parts of the business unit.
Tippecanoe (Indiana, USA)
Part of the Evonik Group since 2009642 Evonik employees

22 23 Improving health.
2
31
1 Tablets coated with EUDRAGIT allow controlled release of active ingredients. 2 Liquid EUDRAGIT is fed through a hose into the fluidized bed coater.3 In the coater, active ingredient granulates are coated with EUDRAGIT.
24 25Accessing growth markets.
Selective acquisitions to extend the businessEvonik initially built up its competence in pharmaceuticals at its sites in Darmstadt, Hanau and Dossenheim in Germany, where it still has a strong presence. However, the highest growth potential is in the emerg-ing markets, especially China and India. Evonik therefore started up a production plant for APIs in Nanning in the Chinese province of Guangxi in 2010. This is another example of cooperation: Evonik built the facility in collaboration with a European pharmaceutical company. The Evonik Group also makes selective acquisitions to extend its busi-ness in this field. For instance it has acquired Boehringer Ingelheim’s RESOMER operations and the pharmaceuticals business of SurModics Inc., based in Birmingham (Alabama, USA). These operations focus on developing custom-tailored controlled release drug delivery mecha-nisms for parenteral applications to make sure the active ingredient is not absorbed via the gastrointestinal tract.
The aim of all these activities is to improve the treatment of patients worldwide, regardless whether they live in India, Germany, the USA or any other country.
“What is important is that in future we can offer an even broader technology base to meet our customers’ growing long-term needs.”
Dr. Gerwin Specka, Site Manager, Evonik Degussa Corporation, Tippecanoe
Nanning (China)
Evonik site since 2010

24 25 Text.
0
2010 2015
1234567 billion
1980
1985
1990
1995
2000
2005
2010
2015
2020
2008
20302025
2030
2035
2040
2045
2050
Aging populationworldwide
Age-related illnessesAlzheimer‘s diseaseby age group
Lifestyle-related diseases
Low-to-middle income countries,
change between 2008 and 2030
US$39 billionAPI market:
Growth rate p. a. US$53 billion
Outsourced
Age:
Healthy Sick
3%
65–74
19%
75–84
47%
85+
ObesityCases worldwide
Increase
Non-communicablediseases (NCDs) Percentage of deaths in high-income countries
DiabetesCasesin the USA
3billion
1.6billion
Europe and Central Asia +4%
East Asia and Pacific +12%
Latin America and Caribbean +13%
Middle East and North Africa +12%
South Asia +39%
Sub-Saharan Africa +64%
29million
+88% +164%
+6.5%
+1%
15–5960–6465–84over 85
60%
40%
50%
50%
11million
89%
87%
In-house
Aging global population—Rise in lifestyle-related diseases
Outsourcing trend in the pharmaceutical sector
Sources: Department of Economic and Social Affairs, Population Division Database | The World Bank Human Development Network: The Growing Danger of Non-Communicable Diseases (2011) | WHO: Noncommunicable diseases Fact sheet (2011) | Frost & Sullivan: Fine Chemicals—the industry and the business (2011).

Gaining a technological edge.

Reducing waste.

28 29Technologievorsprung vergrößern.
Evonik’s superabsorbents have improved the performance of diapers in recent years and made them more than 50 percent thinner. And that reduces the volume of refuse as well as improving hygiene.
Even so, there are still challenges to be met: In Europe and North America the trend is to increasingly thin diapers, while in the emerging markets, the challenge is keeping pace with growth.

28 29 Reducing waste.
Tilman Ehret is standing on the terrace of a hotel in downtown Dubai. In the background, the world’s highest building rises into the seemingly endless blue of the sky. This futuristic giant made of concrete, steel, glass and aluminum is 828 meters high. Since its completion in early 2010, the Burj Khalifa has become the city’s best-known landmark. Ehret is Evonik’s Regional President for the Middle East, North Africa and Pakistan, and the Group’s direct representative in this region. “Although this is not the biggest region for Evonik in terms of sales, we have ambitious targets. Growth rates are prodigious here and we want to participate in that.”
For example, through superabsorbents for babies’ diapers and adult hygiene products. These inconspicuous polymer beads can absorb up to 500 times their weight in liquid but, unlike a sponge, they do not release it even if pressure is applied.
“A region with a very high proportion of young inhabitants offers excel-lent growth prospects for our superabsorbents. We are following our customers so we can meet rising demand from local production,” is how Dr. Thomas Wildt, Vice President Strategy and New Business Development, describes the strategy for the region. Globally, an increasingly broad middle class is developing as a result of the rising prosperity in emerging markets and newly industrializing countries. There is growing demand for consumer goods, including hygiene prod-ucts. Evonik is therefore expanding its global capacity.
1 Our joint venture in Jubail (Saudi Arabia) will increase capacity in the Middle East.
2 Tilman Ehret, Regional President for the Middle East , North Africa and Pakistan.
1
2

30 31Gaining a technological edge.
1
Krefeld (Germany)
A major production location for superabsorbents since 19861,000 Evonik employees
1 Testing superabsorbents in the research lab in Krefeld.
2 An Evonik employee pours the test liquid into a glass beaker filled with superabsorbent.
3 Just a few seconds later the entire liquid has been absorbed.
2

30 31 Reducing waste.
3 A promising joint ventureIt is just over an hour’s flight across the sea from Dubai to Jubail in Saudi Arabia. Here, the Saudi government initiated an ambitious project to drive forward industrialization of the country in the 1970s. Jubail Industrial City is one of the world’s largest industrial parks, and it is continuing to grow—partly thanks to Evonik. At the end of 2013, a new production facility for superabsorbents with annual capacity of 80,000 metric tons is scheduled to start operating here. For Evonik, this is a significant step in the growing Middle East market.
Together with the Saudi Arabian companies Tasnee and Sahara Petro-chemicals, Evonik is investing triple-digit millions of euros in a joint venture. With capacity of around 470,000 metric tons p.a. Evonik is already one of the main superabsorbent producers.
Some of that amount is manufactured at the facilities in Greensboro in the US state of North Carolina. The enormous blue buildings are vis-ible from afar. Inside, a robotic arm continuously distributes a white compound on a metal conveyor that disappears into a covered instal-lation. At the end of this multi-step production process superabsorbents emerge. They are filled by the ton into large sacks, which are loaded by fork-lift trucks, ready for transportation to the major diaper produc-ers. “If we look ahead to the future and the major challenges in the superabsorbents market, two main trends can be identified: In Western Europe and North America, diapers are getting thinner, and in the emerging markets, the biggest challenge is keeping pace with growth,” says Cullen Cooper, Director Sales & Marketing. Greensboro, Evonik’s biggest production facility for superabsorbents, is prepared for those challenges.
Another of Evonik’s four current production facilities for superab-sorbents in Europe and the USA is located in Krefeld (Germany). Superabsorbents have been produced here, on the border between the Lower Rhine and Ruhr regions, for more than 25 years. The polymers are marketed under the FAVOR brand name and output is sufficient for more than 40 billion diapers a year. These polymers are responsible for the constant improvement in the quality of diapers. For instance, the weight and thickness of conventional diapers have more than halved in the past three decades. On average, just 10 grams of superabsorbent are sufficient to achieve the necessary wear comfort. The latest generation of ultra-thin diapers requires far more super-absorbent to achieve the same quality. And Evonik’s researchers still have plenty of ideas.
“Growth rates are prodigious here and we want to participate in that.”
Tilman Ehret, Regional President for the Middle East, North Africa and Pakistan

32 33Gaining a technological edge.
The test facilities at the laboratories in Krefeld include rigid plastic models of babies’ bottoms. Lab technicians wrap them in diapers and add a moisture sensor. Liquids are then fed into them. Right next to them a similar scenario is tested: A purple liquid flows from a test tube onto several diapers, to which pressure is applied. The technicians use a stopwatch to time how long it takes to absorb the liquid.
Dr. Markus Henn regularly discusses the test results with his colleagues. Here in Evonik’s applications technology department, the focus is no longer simply on the capacity of superabsorbents to take up liquids. “Modern superabsorbents need a handful of other properties that are essential for today’s diapers,” explains Dr. Henn: swelling under pres-sure, permeability and the ability to transmit fluids quickly. In Krefeld, a team of researchers and applications technicians works closely with leading producers of hygiene products. In this way, Evonik has made a significant contribution to the new ultra-thin diapers: Thanks to new superabsorbent technology they can be produced without pulp.
Evonik has recurrently been awarded the accolade “Supplier of the Year” by its customers. Its innovative capability, coupled with its clear focus on customers and strong competitive position, are the keys to its business performance. The Group estimates that innovative super-absorbents developed over the past five years account for around 65 percent of total superabsorbent sales today.
STOCKOSORB saves resources in agricultureWell over 90 percent of annual production of superabsorbents is for hygiene products. “Yet there are also advanced technical applications,” says Dr. Henn. Annette zur Mühlen in Krefeld is responsible for one of these: STOCKOSORB, an advanced superabsorbent granulate that is used in the soil in gardens, landscaping and the agricultural sector. This superabsorbent has one special attribute. It does not simply absorb large quantities of water; it also releases it again uniformly. “In areas with very low rainfall our product can make an important contribution to saving resources,” explains zur Mühlen.
For example in Almeria (Spain), some 2,000 kilometers from Krefeld. This area stretching over several hundred square kilometers is known as “Europe’s kitchen garden.” For decades, tomatoes, cucumbers and other vegetables have been grown for export in this dry, desert-like region. The sea of greenhouses extends right over to the coast. Water is a scarce and therefore precious resource in this region. Marie-Rose Chalhoub, who is responsible for marketing STOCKOSORB in southern Europe and North Africa, regularly visits customers. Several vegetable-growers have decided to incorporate STOCKOSORB granules into the sandy soil. One is Jose Sanchez Benavides: “STOCKOSORB means I can reduce the frequency of irrigation by between 20 and 50 percent. It also dramatically cuts the need for fertilizer.” In the early days, French-born Chalhoub spent much of her time persuading people. Lower consumption of water and fertilizer accompanied by good yields have proven very potent arguments for farmers like Benavides.
Almeria (Spain)
3,000 hours sunshine a year80 percent of the country’s exports of vegetables

32 33 Text.
Thinner diapers thanks to superabsorbents
Innovation drives profits
Source: Evonik.
Last generation
˜15 mm
˜50%
˜8 mm ˜3 mm
Next generationToday
˜60%
Number of diaperscontaining Evoniksuperabsorbents in
2011
approx.
40billion
diapers
One in four
containsEvonik superabsorbents
65%of new sales with
superabsorbent innovations from the past 5 years
Last generation
˜15 mm
˜50%
˜8 mm ˜3 mm
Next generationToday
˜60%
Number of diaperscontaining Evoniksuperabsorbents in
2011
approx.
40billion
diapers
One in four
containsEvonik superabsorbents
65%of new sales with
superabsorbent innovations from the past 5 years

Speeding up growth.

Slowing climate change.

36 37Umsatzwachstum beschleunigen.
Evonik is helping make cars more eco-friendly. Our silicas and silanes for green tires, catalysts for the production of bio-diesel, oil additives, lithium-ion technology and high-performance polymers play a part in holding back climate change and enable us to benefit from the growing global trend to more efficient vehicles.

36 37 Slowing climate change.
“Here in Wesseling we produce a good 170,000 metric tons of this substance every year,” says Dr. Wilfried Ostendorf shaking a fine white powder in a transparent bottle. Then he leaves his office to visit the production facility opposite the administrative building. That involves climbing a lot of stairs. The production process is spread over several floors, ending with an intensive drying stage that produces a powder or granulate: precipitated silica. Evonik is one of the world’s leading producers of this substance, which it markets as ULTRASIL. This is a business with a future because of the growing importance of precipitated silica and sulfur-functional silanes, which are also pro-duced by Evonik. They will play a key role in the next generation of tires with low rolling resistance, because they help cut fuel consumption.
So far, energy efficiency classifications are best-known from refrig-erators and freezers. Models with an A+++ rating are the most effi-cient and cheapest to run. Now a similar type of labeling is being introduced for tires. In Japan, voluntary labeling has already been introduced for replacement tires. Now it is set to become mandatory in Europe from this year, and the USA will most likely follow suit at a later date. Thanks to the increased transparency, consumers are expected to pay more attention to tires with low rolling resistance that enhance fuel economy. A specific blend of silica and silanes is needed to meet demands for lower fuel consumption and higher safety, and Evonik manufactures the necessary substances. The proportion of these substances used in tires will rise in future, while there will be a reduction in the proportion of carbon blacks.
Wesseling (Germany)
One of Evonik’s largest sitesMore than 1,200 employees
1 Removing a sample of silica.2 Dr. Wilfried Ostendorf, Head of Production and Technology.
2
1

38 39Speeding up growth.
Capacity for silica is being stepped up worldwideAlongside its site in Wesseling (Germany), Evonik has eight other plants that manufacture precipitated silica. One is in Taoyuan, in north-west Taiwan. Plant manager Hungshi Wu picks up a piece of sodium silicate, which shimmers blue like quartz, and holds it up to the light. The production facility features piles of this substance, which is the raw material for silica. “Most of our production goes to the tire industry,” says Wu. “Our customers include almost all tire producers in this region.” Just a stone’s throw away, applications technicians are combin-ing various ingredients in a complex process to produce a ready-to-use rubber blend. The blend is then pressed through a variety of rollers and vulcanized to prepare it for testing. The aim is to keep on develop-ing better products and technologies. To achieve this, Evonik works closely with tire producers to expand this successful business through innovations and new products.
MAXXIS Cheng Shin Tires has its head office not far from Evonik’s premises in Taipei. This company has been manufacturing tires for more than 30 years. Only a few years after its establishment it had become one of the leading producers in the Far East. Tires are conveyed along the yellowish-green production lines every few seconds. The com-pany’s Vice General Manager, Chung-Jen Huang, is standing in front of a selection of products and the MAXXIS logo. “I believe the future of the transportation industry is green. Fuel economy and fuel efficiency are becoming more and more important,” he says. Good partners are needed for that. “We have been doing business with Evonik for more than 20 years. Our companies work together closely. Alongside the technology, we are convinced by Evonik’s service: 100 percent service, 100 percent quality, 100 percent trust.” To meet the expected growth, Evonik is steadily raising production capacity for silica in Asia, Europe and the USA.
Biodiesel is a growth marketChange of scene: Mobile (Alabama, USA). Here on the Gulf of Mex-ico, Evonik produces a range of products, including sodium methylate, which is used as a catalyst to convert vegetable oil into biodiesel fuel. With its two production plants—in Mobile and Lülsdorf (Germany)—Evonik claims to be the world market leader. “The biodiesel industry has grown substantially over the past ten years. That would not have been possible without sodium methylate,” says general manager José Berges, who is in charge of the Functional Solutions Business Line. Today, demand is highest in Europe and North and South America. Biodiesel is also used in Germany: every liter of diesel sold at German gas stations contains up to 7 percent of this substance. “We will be supporting the ongoing growth of this industry,” says Berges looking forward. To ensure this, Evonik is currently investing in a new facility in Puerto General San Martin in the Rosario region of Argentina. The ground-breaking ceremony was held in September 2011 and the new production facility is expected to come on stream by the end of 2012.
It is about 16,000 kilometers from Rosario to Singapore, where plant man-ager Thilo Krapfl is holding his morning meeting. Around 20 employees from a variety of cultural backgrounds, all clad in blue coveralls, listen to what he has to say and discuss the tasks to be undertaken. He and his team produce oil additives, which are used principally in high- performance lubricants, mainly for the automotive sector, for example for gearbox and engine oil and hydraulic fluids. “The special feature of our oil additives is that they are custom-tailored,” he says. That means they are specifically adapted to the application, to raise energy efficiency.
Singapore
14.5 percent GDP growth in 2011Evonik’s first plant for oil additives in Asia
1

38 39 Slowing climate change.
1 In Singapore Evonik produces custom-tailored additives for biodiesel.
2 The Evonik Lotus Exige demonstrates how efficient autos with our technology can be today.
“I believe the future of the transportation industry is green. Fuel economy and fuel efficiency are becoming more and more important.”
Chung-Jen Huang, Vice General Manager MAXXIS Cheng Shin Tires
2

40 41Speeding up growth.
For instance, they reduce friction in engine oils. And that saves fuel. In hydraulic applications they reduce leakage flow rates. And they also play a significant role in biodiesel. “Biodiesel is made up of a very large number of different raw materials. Our custom-tailored additives improve the flow properties of biodiesel,” explains Krapfl. He is opti-mistic about the future. The automotive industry is continuing to develop in many parts of Southeast Asia. New technologies are im-proving the quality of lubricants and thus demand for high-quality additives. “Our local presence here is important.” Lubricant producers, Evonik’s main customers, have the assurance of a reliable local supplier. “From here we serve the large markets in China, Japan, South Korea and Indonesia, as well as Southeast Asia, Australia and New Zealand,” explains Krapfl.
Cooperation with DaimlerDr. Henrik Hahn, one of the “fathers” of a new Germany technology, has been working in Kamenz, near Dresden in eastern Germany for a good five years. Here a joint venture of Evonik and Daimler AG produces innovative large-scale battery cells based on lithium-ion tech-nology developed by Evonik. At its heart is a ceramic separator between the anode and cathode. The new technology’s quality standards ensure
high safety of the battery cells, a large range per battery charge and an extremely high service life of up to 6,000 charging cycles. “That is a world apart from present consumer applications such as cell phones and laptops, where the storage capacity of the battery cells diminishes after just a few hundred charging cycles,” explains Hahn, who is respon-sible for the production of separators and electrodes. Production capac-ity for battery cells in Kamenz is to be ramped up to three million units a year by 2013. Daimler is intent on this new technology: It plans to start serial production of the new E-Smart this year—with battery technology from Kamenz.
PLEXIGLAS® also makes vehicles more economicalEvonik also offers a wide range of other resource-saving products for the automotive sector. Alongside eco-friendly coatings that improve scratch resistance, the principal focus is on solutions for lightweight components. High-performance plastics and PLEXIGLAS® will increas-ingly replace traditional materials such as metal and glass in the future. Welds and rivets can be replaced by adhesives containing Evonik prod-ucts. That will make vehicles lighter, safer and more economical. And that’s why Evonik is driving forward business with these products as well. After all, tires are not the only components that make a difference.
Thanks to our local presence, we can serve the market in the Asia-Pacific region.

40 41 Text.
Plannedexpansion of silica capacity
up to 2014
+25percent
mainly in Asia and Europe
Annual growth rate in end-consumer market
for green tires
+30percent
(2010–2015)
+300%+4%p.a.
010 0billion0 10.520 10 15%530
2010
2005
2015
Year
Emerging marketsDeveloped markets Green tires as proportion of totalTotal sales of tires worldwide
Oil consumptionMillion barrels per day
40 million 1.5
Sources: Frost & Sullivan (2011) | Economist Intelligence Unit | International Energy Agency | Federal Ministry of the Interior | Evonik.
Global oil consumption and tire sales
Growth rates in green tires and expansion of silica production capacity

Raising sales.

Reducing emissions.

44 45Absatz erhöhen.
Evonik’s contribution to efficient use of resources includes key products for the wind power industry.
Its highly efficient crosslinkers are used in the manufacture of lightweight composites. They also ensure strong bonds between the elements of the rotor blades. ROHACELL, a high-performance structural foam produced by Evonik, looks set to become another key element in rotor blades in the future.

44 45 Reducing emissions.
The tension at EUROS’ site in Żory-Warszowice in southern Poland is palpable. A rotor blade in an airtight vacuum is ready for resin infusion. Alexander Krimmer, who heads the Materials department at this Berlin-based wind turbine developer, stands beside the nine-meter blade and carefully runs his hand over the film in which is packed. Then he bends over and puts his ear to it: A hissing sound would indicate a hole. But there is no sound—and the sensor also indicates that the vacuum is intact. The infusion process can start. The resin-crosslinker blend is fed through the film via a tube.
Slowly, the colorless liquid spreads from the center of the blade to the sides, penetrating the layers of fiberglass and plastic to create a new material: a fiberglass composite.
Rotor blades made with Evonik’s crosslinkers are very robust “Without high-tech materials like these it would be virtually impossible to build and operate wind turbines,” says Alexander Krimmer. They have a service life of at least ten years and during that time they have to withstand the elements: storms, sunshine, rain and salt water.
The resin used in the production of this rotor blade is made of two components: an epoxy resin (EP for short) and a curing agent, which ensures that the resin solidifies. One of its main components is isopho-rone diamine or IPD for short. This crosslinker facilitates and optimizes the solidification process. Curing agents containing IPD are used in the production of the majority of wind turbines—and VESTAMIN from Evonik is market leader.
1 Alexander Krimmer, head of the Materials department of EUROS, examining a nine-meter rotor blade before the next production step.
2 Rotor blades of this size can only be produced with high-performance structural foam.
Alexander Krimmer, head of the Materials department at EUROS
“Without high-tech materials like these it would be virtually impossible to build and operate wind turbines.”
1
2

46 47Raising sales.
Governments around the world are turning their attention to renewable energies according to a report by strategy consultants Frost & Sullivan. For example, the European Union wants to raise the proportion of energy generated from renewable resources to 20 percent by 2020 and some US states have set targets of between 10 and 20 percent. More-over, China is planning to generate an impressive 100 Gigawatts of power from renewable resources by 2020.
Wind energy is expected to play a major part in achieving these goals. Frost & Sullivan forecasts that wind power capacity will increase by 11 percent a year up to 2015. New turbines are springing up across the landscape: in flat coastland areas, on the tops of mountains and out at sea. The trend is to increasingly large turbines that yield even more wind power. The nine-meter blade that Krimmer and his team are producing in Żory-Warszowice is at the lower end of the scale. At the other end of the plant, work has started on a mold for a 50-meter blade. Some people think that blade lengths of up to 100 meters are possible.
Change of scene: Around 1,000 kilometers to the west, Alfred Schmidt-Steffen, manager of Evonik’s site in Herne (Germany) is standing in the lab holding a bottle containing a substance that is vital for the switch to renewable energy resources. “Isophorone diamine is as clear as water,” he says, looking at the bottle with its blue screw cap that con-tains about half a liter of VESTAMIN. This laboratory regularly checks the product quality before dispatch to customers.
New world-scale plant from 2014Herne, which is only a few kilometers from Evonik’s headquarters in Essen, is the world’s most important isophorone chemicals site. “VESTAMIN is produced from isophorone and its derivatives on three lines here,” says Schmidt-Steffen. Evonik has a fourth plant in Mobile (Alabama, USA) and is currently building a fifth facility in Shanghai (China). Schmidt-Steffen has sent two engineers to China to work on this new world-scale plant which is scheduled for start-up in 2014 Evonik will then be the only company in the world with a global net-work of production sites—in Europe, America and Asia—to support the growth of wind power.
Herne (Germany)
Site of the world’s most important isophorone chemicals facility
1

46 47 Reducing emissions.
1 A EUROS employee preparing to produce a rotor blade. 2 Renewable energies should make up 20 percent
of the energy mix in the EU by 2020.
Alexander Krimmer, head of the Materials department at EUROS
“We worked very closely and effectively with Evonik to tailor this material to our customers’ needs.”
2

48 49Raising sales.
Incidentally, Evonik’s products are not simply used as crosslinkers in the rotor blades for modern wind turbines. The Group’s isophorone chemicals are also used to ensure that the coating on the entire wind turbine is resistant to wind and weather. Other applications include curing agents for concrete at low ambient temperatures. And that is something that is not simply appreciated by manufacturers of wind turbines.
Evonik also offers a range of other products for the wind power industry: Special adhesives are needed to bond the large rotor blades. AEROSIL fumed silica and the functional silane Dynasylan make sure they have the necessary bonding power. Protectosil protects the concrete foun-dations from rain and salt water.
Wind turbines have to withstand tough conditionsWind turbines also include ROHACELL, a high-performance structural foam, already proven effective in lightweight structures for aviation and other applications. EUROS uses ROHACELL in the sandwich elements for wind turbine blades, in other words in the outer shells and the spar web inside the blades. “We worked very closely and effectively with Evonik to tailor this material to our customers’ needs,” reports Krimmer. Low weight and high quality are what engineers want from rotor blades. After all they will be exposed to extreme conditions for many years. “ROHACELL has good mechanical properties, including high tenacity and stiffness. It also reduces the weight of the blades. What’s more we need less resin than with other core materials,” says Krimmer.
Enormous potential for VESTAMIN in automotive engineeringReducing weight is a major objective in other industries as well. “Light-weight technologies for mass production are a key factor in product innovation in the automotive industry,” reports Martina Ortelt, Head of Application Technology Epoxy Curing in Evonik’s Crosslinkers Business Line in Marl. VESTAMIN curing agents play a central role in these developments. “The first prototypes were very encouraging,” says Ortelt. “I believe there is great potential here.”
At EUROS’ site in Żory-Warszowice—about 120 kilometers from Krakow—the resin has now spread evenly across the entire rotor blade. Now patience is needed. It takes at least eight hours to cure the resin. Alexander Krimmer and his colleagues carefully remove the silver-colored heated covers from the blade. “Curing needs a certain tem-perature as well as time,” he explains. The next day, the EUROS team will bond the two elements of the blade together. And soon the finished blade will be in service as part of a wind turbine in North America—working alongside other products from Evonik.
EUROS’ site in Żory-Warszowice (Poland)
Rotor blades of up to 59.5 m in length are produced here
Isophorone diamine: vital for the switch to renewable energy.

48 49 Text.
10 00 50 100 15010203040
Installed capacity in Gigawatts Power generation in Terawatt hours p.a.
2000
2002
2004
2006
2008
2010
2012
2014
2016
2018
2020
Steel
7.8metric tons 2.7
metric tons
Aluminium
32 kg
ROHACELL
Expansion of wind power in Germany up to 2020
Weight per m3 rotor blade, depending on material
Sources: German Renewable Energies Agency’s 2009 sector forecast for 2020 (the German Renewable Energies Agency is supported, among others, by the Federal Ministry for Environment, Nature Conservation and Nuclear Safety and the Federal Ministry of Food, Agriculture and Consumer Protection) | Evonik.
10 00 50 100 15010203040
Installed capacity in Gigawatts Power generation in Terawatt hours p.a.
2000
2002
2004
2006
2008
2010
2012
2014
2016
2018
2020
Steel
7.8metric tons 2.7
metric tons
Aluminium
32 kg
ROHACELL

Entering new markets.

Saving resources.

52 53Neue Absatzmärkte erobern.
Evonik’s plastics are gaining in importance around the world. For example, PLEXIGLAS from our joint venture in Taiwan makes LED televisions more energy-efficient and easier to recycle. And that saves precious resources. VESTAMID high-performance polymers are another example: They make pipelines less sensitive to pressure, corrosion and even earthquakes.
52 53 Saving resources.
2
1
“Taiwan is the gateway to Asia’s markets and especially to China,” says Gerard Berote (56), Evonik’s managing director in Taipei. He leans towards the window in his office on the ninth floor of Artists Building to look out at the busy street below. Massive illuminated signboards, skyscrapers, automobiles honking their horns—Taiwan’s capital is pul-sating with life. The city has almost 10,000 inhabitants per square kilo-meter, one-and-a-half times as many as Berlin. “Higher, faster, further” is the motto that has fueled Taiwan’s transition from an agricultural country to an industrialized nation since the 1970s.
Being close to customers is a competitive advantageAll six of Evonik’s business units have a presence in this country and they are nowhere near the end of their growth potential here. “We see promising future prospects in Taiwan, for example, in the electronics industry,” says Berote, gazing into the future as he looks out of his window. Taiwan is exceptionally innovative and the lifecycle of new electronics products is often only about two years. But anyone who hopes to benefit from the dynamic processes in this industry needs to be close to research facilities and customers. “There is enormous poten-tial for Evonik’s products here,” says Berote. The future is a world of displays, light-emitting diodes and solar power—and that means PLEXIGLAS from Evonik. This high-quality acrylic glass has been part of Evonik’s core business for many years. A transparent plastic based on methacrylate, it is a master of versatility. PLEXIGLAS has an amaz-ingly broad spectrum of applications—from the construction industry and vehicles to high-end electronics products such as flat screens and cell phones.
Evonik has now expanded production of PLEXIGLAS® well beyond its German facilities in Darmstadt and Worms. Alongside production in the USA, sites in Asia are becoming increasingly important. A new production facility for high-performance polymers came on stream in Shanghai (China) in 2009 and Evonik is currently ramping up produc-tion in both Shanghai and Taiwan. What’s more: To strengthen its
1 Gerard Berote, managing director of Evonik’s operations in Taiwan.
2 Taipei is brightly lit at night.
Taipei (Taiwan)
10.5 percent GDP growth in 2010Joint venture with AUO established in 2008

54 55Entering new markets.
innovative prowess still further, the company is establishing a research center for optoelectronic applications in Taipei (Taiwan). “We are real pioneers,” reports Dr. Michael Cölle, who heads up the new “Light & Electronics” Advanced Project House. “This is the center of the elec-tronics industry, the heart of development. We are networking and establishing contact to customers here to give Evonik a stronger profile in this market.” Cölle has been stationed in Taiwan since the start of 2011. Team meetings, customer calls, market analyses, sharing findings with research institutes—he is constantly on the go.
Ultra-pure PLEXIGLAS enhances energy efficiencyHis destination this morning is Hsinchu, about 70 kilometers outside Taipei. Four Chinese characters on the signboard outside the building are sufficient to indicate a global market leader: AU Optronics (AUO) is one of the world’s biggest manufacturers of flat screens. At the com-pany’s headquarters Cölle has a meeting with its purchasing manager K.P. Chu. Gleaming marble with turquoise blue LED strips set in the floor, glass facades and ultramodern flat screens all around—light and colors play a special role at AUO’s headquarters.
Its collaboration with Evonik is another special feature. Evonik supplies AUO with gaseous silanes and ultra-pure PLEXIGLAS, which is used as a light guide plate in the latest generation of LED televisions. Combined with LEDs, the high light transmittance of this transparent plastic ensures homogeneous lighting of the entire screen. With this system, screens need about a third less energy than with conventional lighting systems. And that means far lower power consumption and greater energy effi-ciency. “Evonik’s technology and product line are very advanced. Our research departments work together closely on PLEXIGLAS and silanes. That makes Evonik a significant strategic partner for us,” explains Chu.
AU Optronics is supplied by Evonik Forhouse Optical Polymers Cor-poration (EFOP), a Taichung-based joint venture in which Evonik has a 51 percent stake. AUO has an indirect stake in Forhouse Corporation. EFOP specializes in PLEXIGLAS for optical applications. At the end of 2010 AUO and Evonik decided to step up their cooperation and extend it to new applications. This year, capacity at the plant just outside Taipei will be doubled from 40,000 to 80,000 metric tons p.a.

54 55 Saving resources.
LED televisions are set to increase their market share.
“It is important that Evonik works very closely with us, especially locally, to ensure that we have a common understanding of the market challenges.”
Anand Joseph, Group Manager Blue Rhine
56 57Entering new markets.
1
2
3
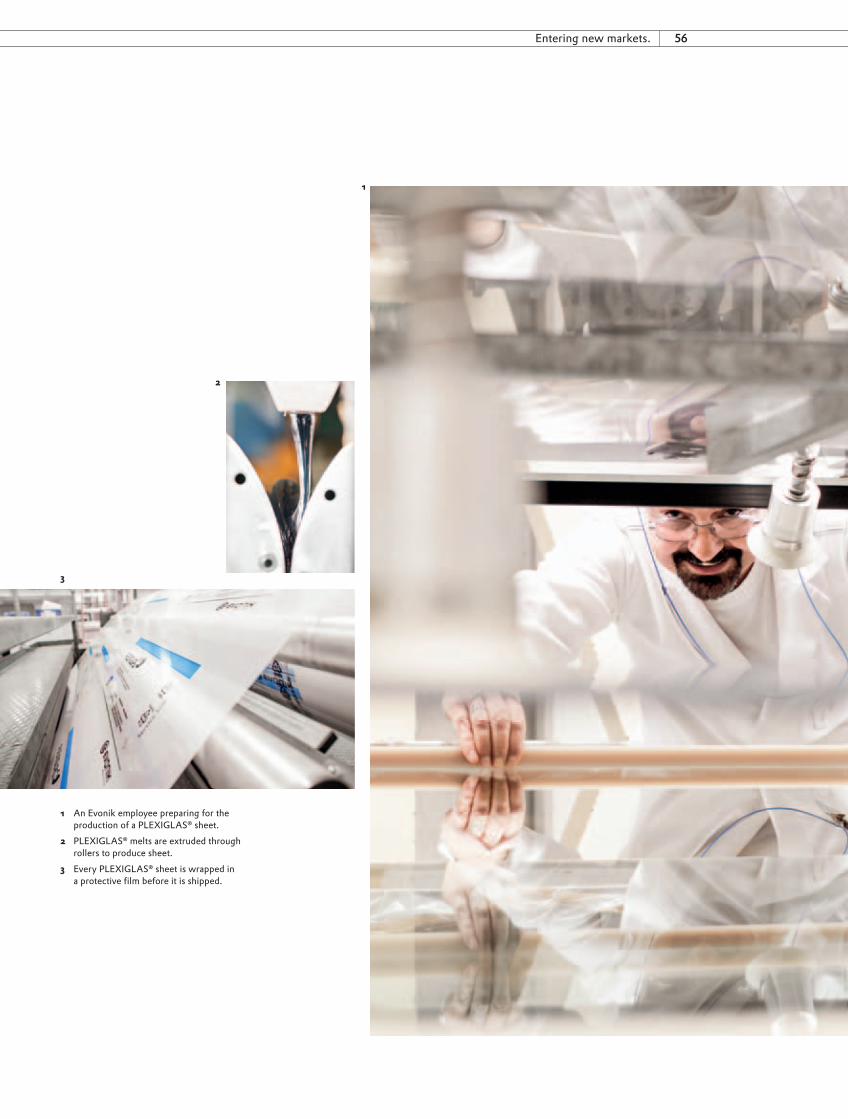
1 An Evonik employee preparing for the production of a PLEXIGLAS sheet.
2 PLEXIGLAS melts are extruded through rollers to produce sheet.
3 Every PLEXIGLAS sheet is wrapped in a protective film before it is shipped.

56 57 Saving resources.
Fully recyclableDarmstadt-Weiterstadt, Germany: PLEXIGLAS sheets are transported continuously through the cooling zone. Depending on their type, they may be colored or colorless, transparent, translucent or opaque. The latest development is a coated sheet which is exceptionally scratch and chemical-resistant so it meets extremely demanding surface require-ments. The sheets are covered with a protective film. Then a laser applies the Evonik logo and the sheets are stacked by cranes fitted with suction pads. “PLEXIGLAS is probably the world’s best-known plastic brand,” says Dr. Bernhard Schäfer (45) who is responsible for Evonik’s Construction & Mobility Product Line. Back in 1937 when it was still relatively new, PLEXIGLAS created a sensation at the World Expo in Paris, where it won a gold medal. Evonik has steadily developed PLEXIGLAS since then. It has better scratch resistance than many other plastics and higher light transmittance than glass. It is also resistant to weathering, and the colorless sheets do not yellow for at least 30 years.
“What’s more, it’s fully recyclable,” explains Dr. Schäfer. That makes PLEXIGLAS, which is marketed as ACRYLITE in the USA, a sustainable product.
Dubai Mall in the United Arab Emirates is the world’s second largest shopping center, covering a total of 350,000 square meters. Beneath its massive dome, thousands of artificial white butterflies flutter around in a stream of air. In the middle of the mall are gigantic waterfalls. Americans and Europeans stroll across the gleaming marble. Modern Arab ladies draped in black, with make-up and the latest smart phones, admire the luxury goods on display. Anand Joseph, Group Manager at Blue Rhine, one of the leading distributors of PLEXIGLAS in the Arab world, leans against the railing: “Our good collaboration with Evonik goes back many years,” he says. PLEXIGLAS was one of the building materials used in the Dubai Mall. Picking out one of its many attributes, Joseph highlights its durability: The guarantee given on outdoor uses is unmatched by any other producer in the world. He adds: “It is impor-tant that Evonik works very closely with us, especially locally, to ensure that we have a common understanding of the market challenges.” And they are wide-ranging: Blue Rhine is now targeting new markets: the Indian subcontinent and Africa.
Dubai (United Arab Emirates)
GDP 2011: approx. US$340 billion
Darmstadt-Weiterstadt (Germany)
A 430,000 m2 high-tech site550 Evonik employees

58 59Entering new markets.
There is no doubt that PLEXIGLAS is a classic product. VESTAMID is another: This polyamide 12 from Evonik has had a firm place in many sectors for decades. With the aid of its special technology platform, Evonik has now “reinvented” this high-performance polymer for use in large pipes, opening up new applications. For example, modern oil and gas pipelines have a special VESTAMID coating which makes them far less sensitive to corrosion and chemicals.
Offshore pipelines offer growth potential for VESTAMIDTons of valuable VESTAMID granulate are shipped from Evonik’s production facilities in Marl (Germany) to Newcastle in the north of England. Here, Wellstream International Limited, a company of General Electric, started production of innovative pipeline solutions for tomor-row’s energy supply in 2011. Its customers are major players in the sector. Black and yellow pipes are rolled onto gigantic drums in the production plant. George Karabelas, Vice President of Technology at Wellstream, is showing Andreas Dowe, head of Oilfield Applications at Evonik, around the plant. Dowe recently returned from several weeks in Brazil, which included a visit to Petrobras, Brazil’s largest energy company, which is being advised by Evonik’s experts on the use of plastic pipelines. “New offshore oil and gas reserves are generally dis-covered at increasing depths. And that offers significant growth poten-tial for VESTAMID,” says Dowe. Karabelas adds: “We have jointly addressed the challenges posed by this market trend and come up with innovative solutions.” Polyamide 12 is just one of several projects. As a classic product like PLEXIGLAS shows: The applications for innovative plastics seem to be endless.
“We have jointly addressed the challenges posed by this market trend and come up with innovative solutions.”
George Karabelas, Vice President of Technology at Wellstream
VESTAMID greatly increases the resistance of pipelines.

58 59 Text.
70–72 cm
Cathode ray tubes
212kWh p.a.
71–85 cm
129kWh p.a.
CCFL backlight technology
71–85 cm
87kWh p.a.
LED technologyTelevision technology
Cost of power consumptionBased on a price of €0.24 per kWh
Power consumptionBased on 4 hours use per day
UV protection UPF 50+
Fire safetyPLEXIGLAS does not form smoke if it burns, so emergency exits and
rescue routes remain visible; no toxic gases emitted
Resource efficiency100 percent recyclable
by splitting it into its starting products
or reprocessing
Durability30 years
without yellowing
High light transmission
High luminance with fewer light sources
€51p.a.
€31p.a.
€21p.a.
LED technology reduces power consumption
Advantages of PLEXIGLAS
Sources: Stift ung Warentest 11/1995 (CRT televisions) | manufacturers’ data (CCFL and LED televisions) | Evonik.


Management report Consolidated financial statements Supplementary information 1
2011 Financial report

Annual Report 2011 Evonik Industries
Evonik Group: Key figures
in € million 2007 2008 2009 2010 2011
Sales 14,444 15,873 10,518 13,300 14,540
EBITDA1) 2,236 2,165 1,607 2,365 2,768
EBITDA margin in % 15.5 13.6 15.3 17.8 19.0
EBIT2) 1,363 1,298 868 1,639 2,099
ROCE3) in % 9.7 9.0 7.7 15.0 18.7
Net income 876 281 240 734 1,011
Total assets as of December 31 19,800 20,115 18,907 20,543 16,944
Equity ratio as of December 31 in % 25.7 25.6 27.6 29.1 35.8
Cash flow from operating activities 1,215 388 2,092 2,075 1,309
Capital expenditures4) 1,032 1,160 569 652 830
Depreciation and amortization4) 862 842 712 694 647
Net financial debt as of December 31 3,924 4,583 3,431 1,677 843
Employees as of December 31 43,057 40,767 33,861 34,407 33,556
Figures for 2009 adjusted to reflect the reclassification of the former Energy Business Area to discontinued operations, figures for 2008 and 2007 as reported.1) EBITDA = Earnings before interest, taxes, depreciation, amortization, write-downs and non-operating result.2) EBIT = Earnings before interest, taxes and non-operating result.3) Return on capital employed.4) Intangible assets, property, plant, equipment and investment property.

Management report Consolidated financial statements Supplementary information 1
Financial report
Management report 7Performance and business conditions 9Earnings position 21Financial condition 22Asset structure 27Research and development 28Segment performance 34Regional development 49Performance of Evonik Industries AG 50Corporate responsibility 53Events after the end of the reporting period 63Risk report 63Report on expected developments 69
Consolidated financial statements 75Income statement 77Statement of comprehensive income 78Balance sheet 79Statement of changes in equity 80Cash flow statement 81Notes to the consolidated financial statements 82
Supplementary information 173Independent Auditor’s Report 175Report of the Supervisory Board 177Joint report of the Executive Board and Supervisory Board of Evonik Industries AG on Corporate Governance 180Further information on corporate officers 192Market positions 196Glossary 198

Europe(including Russia)
24,654
Africa
63
Central and South America
309
North America
3,905
Asia
4,523
Australia(+ New Zealand)
102
Norway 4
UAE 12
Austria 346Switzerland 276
Saudi Arabia 3
Canada 184
Iran 12
South Africa 50
Slovakia 188Hungary 112
UK 86
USA 3,611
Mexico 110
Guatemala 3
China 3.068Japan 337
Vietnam 6Thailand 106
South Korea 81
Bangladesh 3
Pakistan 1
India 247
Taiwan 251Hong Kong 15
Indonesia 113
Malaysia 7Philippines 2
Singapore 174
Australia 73
New Zealand 29
Ecuador 3
Brazil 269
Argentina 34
Belgium 1,019
Turkey 81
Spain 121Italy 84
France 296
Netherlands 123 Germany 21,909
Jordan 4
Russia 90
Morocco 2
Egypt 9Algeria 2
< 10 > 10 > 50 > 100 > 200 > 500 > 1,000
33,556 employeesworldwide
One person represents 50 employees (rounded).

Europe(including Russia)
24,654
Africa
63
Central and South America
309
North America
3,905
Asia
4,523
Australia(+ New Zealand)
102
Norway 4
UAE 12
Austria 346Switzerland 276
Saudi Arabia 3
Canada 184
Iran 12
South Africa 50
Slovakia 188Hungary 112
UK 86
USA 3,611
Mexico 110
Guatemala 3
China 3.068Japan 337
Vietnam 6Thailand 106
South Korea 81
Bangladesh 3
Pakistan 1
India 247
Taiwan 251Hong Kong 15
Indonesia 113
Malaysia 7Philippines 2
Singapore 174
Australia 73
New Zealand 29
Ecuador 3
Brazil 269
Argentina 34
Belgium 1,019
Turkey 81
Spain 121Italy 84
France 296
Netherlands 123 Germany 21,909
Jordan 4
Russia 90
Morocco 2
Egypt 9Algeria 2
< 10 > 10 > 50 > 100 > 200 > 500 > 1,000
33,556 employeesworldwide
As of December 31, 2011

Annual Report 2011 Evonik Industries4
Profile of Evonik Evonik is one of the world’s leading specialty chemicals companies. Profitable growth and a sustained increase in the value of the company form the heart of our strategy, which is supported by our owners, RAG-Stiftung (74.99 percent) and funds managed by CVC Capital Partners (25.01 percent).
Our specialty chemicals activities focus on high-growth megatrends—especially health, nutrition, resource efficiency, and globalization—and our goal is to enter attractive future-oriented markets. To support this we use integrated state-of-the-art technology platforms which are constantly being refined. Our strengths include the balanced spectrum of our business activities, end-markets and regional presence, and working closely with customers. We intend to systematically pursue our ambitious growth strategy in the coming years and drive forward our leading market positions and technological edge. At the same time, we intend to step up our presence in economically attractive emerging markets, especially in Asia, through significant investment projects. Our market-oriented research and development is a key driving force for profitable growth in the future. A steady improvement in the cost position of the Evonik Group, for example, through operational excellence, is also very important to us.
Our chemicals operations are grouped in three segments, each of which has two business units which act as entrepreneurs within the enterprise. The Group also includes the Services and Real Estate segments. The Corporate Center supports the Executive Board in its strategic management functions.
In order to focus on specialty chemicals, at the end of 2010 we signed an agreement to sell 51 percent of the shares in the energy company STEAG to a consortium of municipal utilities in Germany’s Rhine-Ruhr region. We also made binding arrangements to sell our remaining shares in these activities between 2014 and 2017.
Our real estate activities, which we plan to exit entirely in the medium term, focus on letting homes to private households in the federal state of North Rhine-Westphalia. Alongside Evonik’s portfolio of residential real estate, it comprises a 50 percent stake in THS. Effective January 1, 2012, Evonik and THS bundled the management of their properties in a newly formed joint venture, Vivawest Wohnen.

5
Consumer, Health & NutritionThis segment produces specialty chemicals, principally for applications in consumer goods, animal nutrition and pharmaceutical sectors. It comprises the Consumer Specialties and Health & Nutrition Business Units.
Resource EfficiencyThis segment provides solutions for environment-friendly and energy-efficient products. It is comprised of the Inorganic Materials and Coatings & Additives Business Units.
Specialty MaterialsThe heart of the Specialty Materials segment is the production of polymer materials and their preproducts, and additives. It comprises the Performance Polymers and Advanced Intermediates Business Units.
ServicesThis segment principally comprises Site Services and Evonik Business Services. It mainly provides services for Evonik’s chemicals segments and Corporate Center, but also serves third parties.
Real EstateThe Real Estate segment comprises Evonik’s portfolio of residential real estate and a 50 percent stake in THS.
Structure of the Evonik Group
Evonik
Consumer, Health & Nutrition
Resource Efficiency Specialty Materials Services Real Estate
Consumer Specialties
Health & Nutrition
Inorganic Materials
Coatings & Additives
Performance Polymers
Advanced Intermediates
Business Units
Segments

Annual Report 2011 Evonik Industries6

Management report Consolidated financial statements Supplementary information 7
Management report
Performance and business conditions 9
Earnings position 21
Financial condition 22
Asset structure 27
Research and development 28
Segment performance 34 Consumer, Health & Nutrition segment 34 Resource Efficiency segment 38 Specialty Materials segment 42 Services segment 46 Real Estate segment 47
Regional development 49
Performance of Evonik Industries AG 50
Corporate responsibility 53 Employees 54 Environment, safety and health 59
Events after the end of the reporting period 63
Risk report 63
Report on expected developments 69 Global economic conditions 69 Opportunities 71 Outlook 73
Combined management report for 2011 This management report is a combined management report for the Evonik Group and Evonik Industries AG. Given the influence of the segments, statements relating to the development of the segments in the Evonik Group also apply for Evonik Industries AG. The consolidated financial statements for the Evonik Group have been prepared in accordance with the International Financial Reporting Standards (IFRS) and the financial statements of Evonik Industries AG have been prepared in accordance with the provisions of the German Commercial Code (HGB).
Man
agem
ent r
epor
t

Annual Report 2011 Evonik Industries8
Thanks to rapid implementation of our On Track program, we
achieved our goal of annual savings of €500 million at year-end 2011,
one year earlier than planned.
Apprentices make up 9 percent of our workforce in Germany, well above the national average. Moreover, one in two newly qualified youngsters receives a permanent employment contract.
500mill
ion
9 %
Man
agem
ent r
epor
t

9Management report Consolidated financial statements Supplementary information
Performance and business conditions
Record results achieved—Growth projects driven forward
(1) Performance and business conditionsOverviewVery high earnings2011 was a very successful year for Evonik. Buoyed by high global demand for our products, we were once again able to raise earnings significantly. At the same time, we systematically drove forward the repositioning of Evonik as a dedicated specialty chemicals corporation and further improved our financial profile.
In 2011 Evonik achieved the highest operating earnings to date, with all business units contrib-uting higher—and in some cases considerably higher—earnings than in the previous year. The EBITDA margin increased from 17.8 percent to 19.0 percent. This very good earnings situation was attributable to strong demand, the related high capacity utilization and an improvement in margins. Our production capacity, most of which operated at full capacity especially in the first half of the year, is being expanded through plants that have already come into service or are currently under construction so we should be able to grow even faster than our markets in the future. The On Track cost-cutting and efficiency enhancement drive initiated during the economic crisis in 2009 has been successfully completed. Thanks to rapid implementation of this program, we achieved our goal of annual savings of €500 million for the first time at year-end 2011, one year earlier than planned. In this way, we have considerably improved our competitiveness compared with the pre-crisis situation.
Development of EBITDA and EBIT in the Evonik Group
in € million
20081)
20091)
2010
2011
0 500 1,000 1,500 2,000 2,500
EBITDA EBIT1) Excluding energy operations.
Consistent focus on specialty chemicalsWe made good progress in repositioning Evonik as a dedicated specialty chemicals company. In this field we are systematically focusing on high-margin business with attractive growth and earnings potential. In particular, we want to benefit from the global megatrends: health, nutrition, resource efficiency and globalization. Accordingly, we have aligned our business activities to these megatrends so we can operate even closer to the market.
We have also made significant progress in the divestment of non-core operations: In March 2011 we divested the majority of our shares in the energy activities bundled at STEAG GmbH to a consortium of municipal utilities in the Rhine-Ruhr region of Germany. In addition we made binding arrangements to sell our remaining shares in STEAG between 2014 and 2017. We also intend to withdraw entirely from the real estate business in the mid term. With this in mind, we are currently preparing to amalgamate the real estate operations of Evonik and THS GmbH, which together own around 130,000 residential units—mainly in the German state of North Rhine-Westphalia. Further, we divested the carbon black business and some smaller non-core operations.
1,648
1,607
2,365
2,768
883
868
1,639
2,099

Annual Report 2011 Evonik Industries10
Growth projects driven forward Profitable growth is a central element of our strategy. To respond to rising demand and strengthen our market position, we initiated some key investment projects in 2011. To expand our specialty chemicals business, especially in attractive growth markets, we have earmarked capital expenditures of over €6 billion for the next five years. Significant projects include building a new, backwardly integrated production complex for the amino acid DL-methionine in Singapore, which is scheduled to come into service in 2014. In China, we intend to erect a new production complex for isophorone and isophorone derivatives and a production facility for hydrogen peroxide by the end of 2013. In addition, in Argentina we are building a new production plant for alcoholates, which are used as catalysts for the production of biodiesel. This facility is scheduled to come on stream in late 2012.
Financial profile improvedIn 2011 our cash flow from operating activities was €1.3 billion and we reduced net financial debt by €0.8 billion to €0.8 billion.
Our operational and strategic performance has also received external recognition. In May 2011 our rating was raised to investment grade by the rating agencies Standard & Poor’s (BBB with a stable outlook) and Moody’s (Baa3 with a positive outlook).
Stock exchange listing is still our goalAs publicly announced in spring 2011, our owners are planning to list Evonik on the stock exchange. Evonik explicitly supports these plans and has made the necessary preparations so that in our view, subject to the decisions of our owners and, especially, to suitable conditions on the capital markets, this goal can be achieved.
Substantial rise in businessThe successful business trend seen in 2010 continued with increased momentum, especially in the first half of 2011, but a slowdown in demand became perceptible in some areas of business towards the end of the year. Overall, we grew sales by 9 percent to €14.5 billion in 2011. Organic growth was 12 percent, with 2 percentage points coming from volume growth and 10 percentage points from the increase in selling prices. Sales were also impacted by currency effects (minus 1 percentage point) and other factors (minus 2 percentage points), primarily the deconsolidation of the carbon black business in August 2011.
Sales 2011 vs. 2010
in %
Volumes 2
Prices 10
Exchange rates −1
Other −2
Total 9

11Management report Consolidated financial statements Supplementary information
Performance and business conditions
Further rise in operating resultsThanks to high demand, capacity was fully utilized at most of our production plants, especially in the first half of the year. Towards the end of the year, utilization was reduced to a normal level in line with the development of demand. We achieved a further improvement in our operating results thanks to higher volumes, favorable capacity utilization, successful cost cutting and higher selling prices. Earnings before interest, taxes, depreciation, amortization and the non-operating result (EBITDA) grew by 17 percent to €2.8 billion. The exceptionally high rise in earnings lifted the EBITDA margin from 17.8 percent to 19.0 percent. Earnings before interest, taxes and the non-operating result (EBIT) improved 28 percent to €2.1 billion. All segments played a part in the earnings increase. The EBIT contributed by other operations was minus €404 million, compared with minus €420 million in 2010. This includes, among others, expenses for the Corporate Center, strategic research and depreciation of the purchase price allocation from past acquisitions.
EBIT (before non-operating result) by segment
in € million 2011 2010Change
in %
Consumer, Health & Nutrition 917 853 7
Resource Efficiency 611 569 7
Specialty Materials 748 469 59
Services 56 28 101
Real Estate 171 140 21
Corporate, other operations −404 −420 4
Evonik 2,099 1,639 28
Prior-year figures restated.
Sales and reconciliation from EBITDA to net income
in € million 2011 2010Change
in %
Sales 14,540 13,300 9
EBITDA (before non-operating result) 2,768 2,365 17
Depreciation and amortization −669 −726
EBIT (before non-operating result) 2,099 1,639 28
Non-operating result, continuing operations −175 −236
Net interest expense −381 −428
Income before income taxes, continuing operations 1,543 975 58
Income before income taxes, discontinued operations −42 73
Income before income taxes (total) 1,501 1,048 43
Income taxes, continuing operations −451 −175
Income taxes, discontinued operations −36 −80
Income after taxes 1,014 793 28
Non-controlling interests −3 −59
Net income 1,011 734 38

Annual Report 2011 Evonik Industries12
Considerable improvement in net incomeThe non-operating loss of €175 million is the net balance of non-operating expense and non-operating income items which are by nature one-off or rare. Significant items were impairment losses, for example, due to the divestment of business operations, on property, plant and equipment in the Resource Efficiency segment as a result of weak demand, and in the Specialty Materials segment due to existing overcapacities. This item also includes expenses for the divestment of shareholdings and restructuring. Other includes recognition of income relating to the put and call options on the 49 percent stake in STEAG. The prior-year loss of €236 million mainly comprised restructuring and pension expenses, and impairment losses.
Non-operating result
in € million 2011 2010
Restructuring −30 −64
Impairment losses/reversal of impairment losses −131 −72
Purchase/sale of investments −33 0
Other 19 −100
Non-operating loss, continuing operations −175 −236
Net interest expense declined to €381 million, mainly due to higher interest income and lower interest expense for pension provisions. Income before income taxes from the continuing operations rose 58 percent to €1,543 million. Income before income taxes from the discontinued operations was minus €42 million and mainly related to the former Energy Business Area, and in particular, expenses in connection with the divestment of the 51 percent stake in STEAG. The prior-year figure of €73 million mainly comprised the operating earnings from the former Energy Business Area and one-off expenses relating to the divestment of these operations. Overall, income before income taxes rose 43 percent to €1,501 million. The income tax rate was 32 percent, above the expected Group tax rate of 30 percent, mainly owing to non-tax-deductible expenses in connection with the divestment of non-core businesses. As a result of the deconsolidation of STEAG, income attributable to non-controlling shareholders declined considerably to €3 million. The good operating performance lifted net income 38 percent to €1,011 million.
Economic backgroundEmerging markets are the mainstay of global economic growth Following the dynamic recovery in 2010, global economic growth slowed significantly in 2011. The high pace of growth in the first six months could not be maintained over the full year. As a result of the mounting uncertainty about the sovereign debt crisis in the euro zone and slower than expected growth in the US economy, global growth slowed considerably in the second half of the year. Moreover, 2011 was marked by political conflict and natural disasters. Global gross domestic product (GDP) nevertheless increased by 3.0 percent over the year.

13Management report Consolidated financial statements Supplementary information
Performance and business conditions
The main drivers of global economic growth in 2011 were the emerging markets in Asia, headed by China (plus 9.2 percent), which achieved strong growth despite a more restrictive monetary policy and measures to dampen the real estate market. India was another major growth driver. Although declining investment resulted in slower growth compared with 2010, economic output in this country nevertheless rose strongly (plus 6.8 percent).
The emerging markets in South America contributed 3.8 percent of global growth, which was below their contribution in 2010 (5.9 percent). In particular, a slowdown was registered in the region’s principal growth engine, Brazil. Owing to the strength of the currency and restrictive lending, the growth rate in this country, which is heavily dependent on raw material exports, dropped significantly from 7.5 percent in 2010 to 2.9 percent in 2011.
In the industrialized nations (OECD countries), the pace of growth slipped significantly in 2011 following the economic rebound in 2010. Gross domestic product in the OECD countries only increased by 1.6 percent year-on-year. Of significance for virtually all industrialized countries in 2011 was a clear reduction in growth momentum after the first quarter. In the euro zone in particular (plus 1.5 percent), the ongoing debt problems in southern European countries resulted in low growth, and a year-on-year drop in growth was reported by some countries, for example, Portugal (minus 1.5 percent) and Greece (minus 6.8 percent). Germany was able to escape the negative trend in the euro zone, especially in the first six months, because of its strong position as an exporter to growth markets and stable consumer spending. With a growth rate of 3.0 percent, Germany was a major growth driver in the euro zone. The economic recovery also weakened year-on-year in the USA (plus 1.8 percent). Overall, the stagnating labor market and little improvement on the housing market resulted in far lower growth than in the previous year. Japan suffered a catastrophe that had far-reaching consequences for economic growth in 2011. Since it brought the country’s industry to an almost complete standstill, the economy was still in recession at the end of the year. Overall, economic output was down 1.4 percent year-on-year.
Trends in the specialty chemicals sector and key customer industriesGlobal industrial output once again outpaced the rise in GDP in 2011. Nevertheless, following the strong recovery in 2010 (plus 8.1 percent) in the wake of the financial and economic crisis of 2008/2009, the pace of growth slowed to plus 3.8 percent. High growth in China (plus 13.4 percent) remained the main driver of global industrial output.
In the industrialized countries, industrial production was adversely affected by mounting consumer and corporate uncertainty about future trends. Massive destocking in many sectors of industry acted as a strong brake on industrial output at the end of the year. The uncertainty in Europe also impacted growth in industrial output in Asia, causing it to slow significantly at year end.
The development of the industries served by the specialty chemicals sector varied considerably in 2011. In the automotive industry in particular, growth normalized after an exceptionally good year in 2010. Driven by demand in Asia, the industry posted real growth of 7.0 percent year-on-year. Similar trends were registered in the electronics industry (plus 6.3 percent) and the information and communication technology sector (plus 4.0 percent). Despite consumers’ mounting uncertainty, growth remained high in the food industry (plus 3.8 percent) and the personal care industry (plus 6.0 percent). While the global construction industry registered a considerable rise in 2011 (plus 3.9 percent), growth was comparatively low in the paints and coatings industry (plus 1.2 percent).

Annual Report 2011 Evonik Industries14
The global specialty chemicals sector also normalized following rapid growth in 2010. Since capacity utilization was high in the chemical industry in industrialized countries, it was not possible to maintain the same pace of growth as in 2010. Moreover, industrial output weakened in the second half of the year. Thanks to the very good start to 2011, real year-on-year growth in 2011 was 4.8 percent. Moreover, in the first half of the year higher raw material costs led to a considerable hike in prices, resulting in a strong rise in sales in the specialty chemicals sector. This sector tends to move with key customers and therefore grew particularly strongly in Asia. The slowdown in growth in specialty chemicals was especially marked in the euro zone because of the more modest rise in output in non-export-oriented industries.
Development of raw material prices and exchange ratesThe price of oil (Brent crude) was very volatile in 2011. On average it was US$111 per barrel, 40 percent above the average for 2010. As a result of the good economic trend at the start of the year and supply-side risks, the average monthly price rose to as much as US$123. However, the possibility of a global economic downturn led to a significant easing of the price situation from mid-2011. As a consequence of the sovereign debt crisis in Europe, the long-term uptrend for the euro turned at year end and the currency came under heavy pressure. The average exchange rate against the dollar was €1.39 in 2011.
Trends in the residential real estate sectorThe residential real estate market in Germany is undergoing a dynamic trend. Rents, real estate transactions, prices, and the number of construction permits granted and new residential units completed have been rising since 2010. In the light of the present euro crisis and for reasons of diversification, investors with a long-term horizon are becoming more interested in raising their exposure to the property sector. Consequently 213 parcels of residential real estate comprising a total of 82,600 residential units were sold in 2011. Both of these figures were more than 50 percent up on the corresponding figures for 2010. The upswing was due principally to relatively small transactions of less than 800 units.
General demand for housing is directly linked to the number of private households and their disposable incomes. The number of households is continuing to rise as the average size of households is declining, although there is a clear divergence between the situation in different towns and communities. Trends in net rents for residential real estate (excluding utility charges) also differed by region. Average rents increased by 1 percent year-on-year in 2011. The trend in the residential construction sector continued in 2011. Construction permits were issued for 225,000 residential units in 2011, substantially more than in 2010 (192,000 units). The number of new residential units completed hit an absolute low of 143,000 in 2009. Due to the time lag between the granting of construction permits and completion of properties, this figure is not likely to rise above the 200,000 mark until 2012. Favorable factors for the future development of the German housing market include stable incomes, low mortgage rates, government programs to encourage the modernization of properties and high demand for residential real estate in prosperous regions.

15Management report Consolidated financial statements Supplementary information
Performance and business conditions
Business activitiesCorporate strategy geared to profitable growthEvonik is one of the world’s leading specialty chemicals companies. It also has investments in residential real estate and the energy sector. Profitable growth and sustained value creation form the heart of our strategy, which is supported by our owners, RAG-Stiftung (74.99 percent) and funds of the financial investor CVC Capital Partners (indirect stake of 25.01 percent).
Our specialty chemicals activities focus on high-growth megatrends—especially health, nutrition, resource efficiency and globalization—and on entering attractive future-oriented markets. To support this we use integrated technology platforms that are constantly being refined. Our strengths include the balanced spectrum of our business activities, end-markets and regional presence, and working closely with our customers. We intend to systematically pursue our ambitious growth strategy and further increase our market and technology leadership in the coming years. At the same time, we will be expanding our activities in attractive economic regions. Our market-oriented research and development is a key driving force for profitable growth in the future. Continuous improvement of the cost base within the Evonik Group is also very important.
A market-oriented structureWe have restructured our business to reflect our strategic alignment to the health, nutrition, resource efficiency and globalization megatrends.1) Our specialty chemicals operations are grouped in six business units, which are now assigned to three segments: Consumer, Health & Nutrition, Resource Efficiency, and Specialty Materials. In this new segment structure, our specialty chemicals operations are grouped on the basis of similar themes and long-term success factors. The Services segment mainly provides central services for the chemicals segments and the Corporate Center. Our real estate activities are bundled in the Real Estate segment. The Corporate Center supports the Executive Board in the strategic management of the Group. The prior-year figures have been restated to reflect the new structure.
Lean structures To make Evonik even more agile and transparent, we aim to achieve a further reduction in the complexity of the Group. We are therefore planning to merge key legal entities in Germany. As a first step, we transferred the management of all plants operated by Evonik Degussa GmbH, Evonik Goldschmidt GmbH, Evonik Oxeno GmbH, Evonik Röhm GmbH and Evonik Stockhausen GmbH to Evonik Industries AG effective August 1, 2011. This included transferring all employees of these companies to Evonik Industries AG. Further companies are to be transferred effective April 1, 2012. As a result of this structure, Evonik Industries AG is already the sole employer of all employees at the entities concerned and the employee representation structures have been adjusted accordingly. At the same time, this gives Evonik a uniform image with customers and business associates, and on the labor market.
Executive Board extendedTo strengthen the links between the Executive Board and operating business, the Executive Board was extended and Mr. Patrik Wohlhauser, Dr. Thomas Haeberle and Dr. Dahai Yu were appointed members from April 1, 2011. The new structure includes direct management of the operational business by members of the Executive Board, which streamlines decision-making structures and therefore speeds up processes. Effective September 1, 2011 Mr. Thomas Wessel became a member of the Executive Board and Chief Human Resources Officer. In both of these functions he succeeded Mr. Ralf Blauth, who took early retirement as of August 31, 2011.
1) For further details see Notes (1) and (9.1) to the consolidated financial statements.
At a glance
Strategy: Concentration on specialty chemicals systematically driven forward; plans to exit the Real Estate business in the mid termProfitable: EBITDA margin increased to 19 percent, ROCE rose to 18.7 percentGrowth strategy: Significant investments planned for the next five yearsRating: Investment grade rating achieved

Annual Report 2011 Evonik Industries16
Majority stake in STEAG GmbH divestedOn March 2, 2011 we closed the divestment of 51 percent of the shares in STEAG to a consortium of German municipal utilities from the Rhine-Ruhr region which was agreed in December 2010. That gives the energy activities the opportunity to develop their growth potential to the full with a new majority shareholder. The provisional purchase price for the 51 percent stake was €651 million. In view of the agreement to divest the energy activities, the former Energy Business Area was classified as a discontinued operation in the financial statements for 2010. Since March 2011, the remaining 49 percent stake in STEAG has been included in the consolidated financial statements at equity.
In connection with the divestment of the majority of shares in STEAG, in December 2010 a contractual agreement was made that enables us to sell our entire remaining 49 percent stake in STEAG to the consortium of municipal utilities in five years (put option). At the same time, the consortium has a contractually agreed option to acquire the 49 percent stake in STEAG from January 1, 2014 (call option). The put option is included in the balance sheet as a financial asset, while the call option is shown as a financial liability. Both options are treated as financial instruments and have to be remeasured regularly on the basis of a large number of parameters. They will continue to be revalued until they are exercised and the unrealized gains and losses will be reflected in the non-operating result.
Model for the future of the real estate businessIn September 2011 we signed key agreements with the German Mining, Chemicals and Energy industrial union (IG BCE) on implementing the model for the future of the real estate operations. The planned merger of our real estate business with THS, in which Evonik and IG BCE each have an indirect stake of 50 percent, will create Germany’s third-largest residential real estate company. To ensure stable long-term ownership structures, Evonik intends to transfer a stake in the real estate activities to the contractual trust arrangement (CTA) that secures employees’ long-term pension entitlements. RAG-Stiftung will also have a stake in the real estate company. In connection with our focus on specialty chemicals, we plan to exit our real estate operations completely in the mid term.
Effective January 1, 2012, Evonik and THS bundled the management of their properties in a joint venture, Vivawest Wohnen GmbH.
Active portfolio managementActive portfolio management, combined with efficient allocation of capital, is very important to our company. We only invest in businesses that we believe promise sustainable and profitable growth. Businesses that no longer fit our strategy or no longer meet our profitability requirements are divested.
Selective acquisitions are made to supplement the products, markets and technologies in our portfolio. To strengthen the market leadership of the Consumer, Health & Nutrition segment, in 2011 we acquired the RESOMER business from the Boehringer Ingelheim Group, Ingelheim (Germany), the pharmaceuticals business of SurModics Pharmaceuticals Inc., Birmingham (Alabama, USA), and the operations of the hanse chemie Group, Geesthacht (Germany). To complement the activities of the Resource Efficiency segment, we acquired the operations of the Norwegian company FESIL Sunergy AS from FESIL AS, Trondheim (Norway). Further, in the Specialty Materials segment we strengthened our position in the North American hydrogen peroxide market by acquiring a Canadian production facility from Kemira Chemicals Canada Inc., Maitland (Ontario, Canada).

17Management report Consolidated financial statements Supplementary information
Performance and business conditions
In accordance with the concentration on specialty chemicals, at end-July 2011 the Resource Efficiency segment’s carbon black business was sold to an investment company owned by investment funds managed and advised by Rhône Capital LLC, New York (NY, USA) and Triton Partners, St. Helier (Jersey, Channel Islands). Including obligations to be assumed, the value of this transaction was more than €900 million. The carbon black business was fully consolidated until end-July 2011. Since the divestment took place retroactively as of January 1, 2011, the pro rata income from the carbon black activities was no longer attributable to us and this has been adjusted via the non-operating result. At the end of July 2011 the Resource Efficiency segment divested its plastic additives and plastisols business to Kaneka Belgium N.V., Westerlo-Oevel (Belgium).
Evonik accepts its responsibility Sustainable development and corporate responsibility are vital for the future viability of com-panies—including Evonik. We accept responsibility—for our business, our employees and society. That is how we define corporate responsibility (CR). As part of our corporate strategy, our CR strategy takes up economic megatrends such as health, nutrition, resource efficiency and globalization, as well as ecological and social challenges, and supports the development of new business activities. Consequently, our products and technologies make a significant contribution to the sustainable development of society. At the same time, they strengthen our market position. We are system-atically extending our CR activities on this strategic basis and inform the general public of our activities.
On Track efficiency improvement program completed ahead of scheduleAs a response to the economic crisis, at the start of 2009 we introduced the On Track efficiency enhancement program to cut costs, initially in the short term, and to make lasting savings of €500 million p.a. from year-end 2012. This involved reviewing all major processes and cost positions in the Group. Thanks to swift implementation, we were able to achieve our target annual cost savings for the first time at the end of 2011. On Track therefore played a substantial part in improving Evonik’s competitiveness in recent years. In addition, by implementing measures and procedures for continuous optimization of the entire Group, a performance culture has become firmly established in our workforce. To maintain our competitiveness, we will continue to work on a sustained improvement in the company’s efficiency.
Global activitiesEvonik operates worldwide and has production facilities in 26 countries. The largest production sites such as Marl, Wesseling and Rheinfelden (Germany), Antwerp (Belgium), Mobile (Alabama, USA) and Shanghai (China) have integrated technology platforms used by various business units, enabling by-products from one production facility to be used as starting materials for other products. This results in optimum utilization of resources and thus high added value. Moreover, the business units can share the site energy supply and infrastructure cost-effectively. For technical or logistics reasons, we operate some production facilities close to our customers or on their sites (fence-to-fence facilities). There are also many smaller sites around the world that are only used by one business unit.

Annual Report 2011 Evonik Industries18
Efficient procurementProcurement is an essential element in the value-added chain, so we regard intensive cross-organizational and cross-functional collaboration with the business units as indispensable. In 2011 we used innovative concepts and global strategies to secure new methods of optimizing supply. At the same time, we were able to achieve a further reduction in potential procurement risks. We aim to increase procurement efficiency still further by steadily improving key processes.
Gaining access to new markets and securing supply will remain key tasks in the future. We are aware of our responsibility within the supply chain. Aspects such as quality, safety, health, environmental protection and corporate responsibility have a firm place in our procurement strategy.
With a view to securing long-term procurement of raw materials, we decided to play an active role in the preparations for the “Alliance to secure raw materials” established by the Federation of German Industries (BDI).
In 2011, Evonik spent around €9.4 billion on raw materials, energy, technical equipment and services. Raw materials account for around 60 percent of total procurement volume. Of special importance for the Evonik Group are petrochemical feedstocks, particularly steam cracker products and their derivatives, which make up more than 30 percent of procurement of raw materials.
Around 10 percent of the raw materials used in our production processes in 2011 were renewable resources, a further rise compared with the previous year. A significant proportion of these renewable raw materials is used in the production of high-quality starting products for the consumer goods industry and the fermentation of amino acids.
Raw material prices rose to a record level in the first half of 2011. However, in the second half they dropped back to the level recorded at the start of the year. To counter this rising volatility, a structured risk evaluation approach is used as a basis for selective action to minimize risks.
Value-oriented business managementEvonik is managed on the basis of a consistent system of value-oriented indicators. These are used to assess the performance of the operational units and the Group. Through systematic alignment to these indicators, the Group endeavors to create value by raising profitability and ensuring profitable growth.
Due to Evonik’s structure, the indicators have to take account of the differences between the various operations yet be comparable across the Group. To sharpen our focus on the goal of profitable growth and enhance its transparency, since 2010 the indicator used for value-oriented management at Evonik has been EVA (economic value added). The system of indicators also includes other relevant growth drivers and the associated indicators. These are derived from uniformly defined performance indicators taken from the income statement and balance sheet.
Clear value creation Compared with absolute earnings parameters, EVA extends the performance view to include the cost of capital, which is the minimum return the Group has to earn. EVA is the difference between EBIT and the cost of capital. If EVA is positive, Evonik creates value (value spread approach).
The cost of capital is calculated by multiplying average capital employed by the weighted average cost of capital. The cost of capital is the risk-adjusted return target. It is derived from the capital asset pricing model and WACC (weighted average cost of capital) and reflects the mid-term management perspective. The cost of capital for the Evonik Group was 9.5 percent before taxes in 2011, the same as in 2010.

19Management report Consolidated financial statements Supplementary information
Performance and business conditions
In 2011, Evonik generated EVA of €1,035 million and thus created considerable value. The year-on-year improvement of €434 million was due to a strong rise in earnings, coupled with an only slight increase in capital employed.
Higher return on capitalROCE measures the return on capital employed. It is calculated from EBIT in relation to average capital employed.
Capital employed and ROCE
in € million 2011 2010
EBIT (before non-operating result) 2,099 1,639
Intangible assets 3,325 3,543
+ Property, plant and equipment/investment property 5,799 5,882
+ Investments 995 602
+ Inventories 1,635 1,480
+ Trade accounts receivable 1,861 1,781
+ Other interest-free assets 782 397
− Interest-free provisions −1,283 −1,080
− Trade accounts payable −1,051 −929
− Other interest-free liabilities −859 −749
= Capital employed1) 11,204 10,927
ROCE (EBIT/capital employed) in % 18.7 15.0
1) Annual averages.
In 2011 average capital employed increased slightly to €11.2 billion, partly due to the addition of the 49 percent stake in STEAG. In the previous year, by contrast, the STEAG companies were reported as discontinued operations and not included in the calculation of capital employed. Capital employed was also increased by the rise in current assets as a result of the expansion of business, while the divestment of the carbon black business decreased capital employed.
Thanks to the clear rise in earnings, ROCE improved from 15.0 percent to 18.7 percent. The return on capital employed in the three chemicals segments in particular was well above-average. The Group’s ROCE was considerably lower as capital employed also includes identified hidden reserves from the acquisition of shares in the former Degussa AG and from earlier mergers of the former Degussa AG. In the structure in place in previous years, these were allocated to the former Chemicals Business Area. In the new segment structure they are recognized under “Corporate, other operations.”

Annual Report 2011 Evonik Industries20
ROCE by segment
in % 2011 2010
Consumer, Health & Nutrition 55.9 57.0
Resource Efficiency 29.5 25.7
Specialty Materials 43.9 28.8
Services 12.7 6.3
Real Estate 9.3 7.7
Evonik (including Corporate, other operations) 18.7 15.0
Prior-year figures restated.
Considerable improvement in marginsSince the EBITDA margin is a relative figure, it provides a key basis for internal and external comparison of cost structures and profitability. Depreciation, amortization and impairment losses are not included in EBITDA, so the EBITDA margin can be taken as an approximation of the return on sales-related cash flows.
In 2011 higher demand, the resultant improvement in capacity utilization and price increases lifted the EBITDA margin from 17.8 percent to 19.0 percent.
EBITDA margin by segment
in % 2011 2010
Consumer, Health & Nutrition 25.7 26.8
Resource Efficiency 18.9 17.8
Specialty Materials 18.6 15.2
Services 14.6 13.2
Real Estate 53.2 47.3
Evonik (including Corporate, other operations) 19.0 17.8
Prior-year figures restated.

21Management report Consolidated financial statements Supplementary information
Earnings position
(2) Earnings positionSubstantial improvement in earnings from continuing operationsWhen assessing the Group’s earnings position, it should be noted that the carbon black business was only consolidated for seven months in 2011 compared with the full year in 2010 as the divest-ment of this business was closed at the end of July 2011. The Evonik Group’s sales advanced 9 percent to €14,540 million due to higher volumes and prices. The cost of sales increased by 9 percent to €10,247 million. This was mainly due to higher raw material costs. As a consequence, the Group-specific raw material cost index was nearly 25 percent higher than in the previous year across all regions. The price of oil and gas feedstocks rose by between 20 and 30 percent, while key renewable raw materials were up by more than 50 percent. The gross profit on sales increased by 11 percent to €4,293 million. Selling and administrative expenses rose by less than sales, increasing 6 percent to €1,905 million. To strengthen our innovative capability still further, we raised research and development spending by 8 percent to €365 million.
Income statement for the Evonik Group
in € million 2011 2010
Sales 14,540 13,300
Cost of sales −10,247 −9,440
Gross profit on sales 4,293 3,860
Selling expenses −1,242 −1,198
Research and development expenses −365 −338
General administrative expenses −663 −606
Other operating income 1,021 968
Other operating expense −1,207 −1,347
Income before the financial result and income taxes, continuing operations 1,837 1,339
Financial result −294 −364
Income before income taxes, continuing operations 1,543 975
Income taxes −451 −175
Income after taxes, continuing operations 1,092 800
Income after taxes, discontinued operations −78 −7
Income after taxesof which attributable to Non-controlling interests Shareholders of Evonik Industries AG (net income)
1,014
31,011
793
59734
Prior-year figures restated.

Annual Report 2011 Evonik Industries22
The other operating income of €1,021 million includes income from the valuation of derivatives (€273 million), currency translation of monetary items (€272 million) and the valuation of the put option in connection with the divestment of the shares in STEAG (€102 million). The year-on-year increase of €53 million is attributable to the recognition of the put option for the first time. By contrast, income from the measurement of derivatives was considerably lower than in the previous year. The other operating expenses of €1,207 million included, among other things, expenses for the measurement of derivatives (€287 million), currency translation of monetary items (€233 million), impairment losses on assets (€172 million) and the call option in connection with the divestment of the shares in STEAG (€82 million). The decline of €140 million compared with 2010 was mainly due to lower expenses in connection with the valuation of derivatives. Income before the financial result and income taxes for the continuing operations improved 37 percent to €1,837 million.
The financial result improved by €70 million to minus €294 million, mainly due to higher interest income and lower interest expense for pension provisions. Income before income taxes from the continuing operations rose 58 percent to €1,543 million. After deducting the considerably higher income taxes, income after taxes from the continuing operations was €1,092 million, 37 percent more than in the previous year.
Far higher net income Income after taxes from the discontinued operations was minus €78 million and comprised operating income from the former Energy Business Area (€16 million), expenses relating to the divestment of this business (minus €106 million), and income relating to the sale of non-core activities in previous years (€12 million). Income after taxes improved 28 percent to €1,014 million. Non-controlling interests in after-tax income decreased from €59 million to €3 million as a result of the deconsolidation of the STEAG companies, which included foreign companies in which local share-holders had a stake. Overall, the net income of the Evonik Group improved 38 percent to €1,011 million.
(3) Financial conditionEffective financial managementThe central objectives of financial management are to safeguard the financial independence of the Evonik Group and limit refinancing risks. We therefore apply a central financing strategy. Borrowing and bond issuance are normally undertaken by Evonik Industries AG or its financing company Evonik Finance B.V., whose liabilities are fully guaranteed by Evonik Industries AG. Guarantee obligations for liabilities of Group companies are provided centrally by Evonik Industries AG. To reduce external borrowing, surplus liquidity is placed in a cash pool at Group level to cover financing requirements in other Group companies. Evonik has a flexible range of corporate financing instruments to meet capital requirements for day-to-day business, investments and the repayment of financial debt.

23Management report Consolidated financial statements Supplementary information
Financial condition
Rating upgrade—Evonik awarded investment grade ratingIn May 2011 Evonik was awarded investment grade ratings by the rating agencies Standard & Poor’s (BBB with a stable outlook), and Moody’s (Baa3 with a positive outlook). The Group intends to maintain a sound investment grade rating in the long term. To ensure this, the ratio of net debt (including unfunded pension obligations) to EBITDA should not exceed 2.5. As of December 31, 2011 it was 1.7.
Further reduction in net financial debtFinancial assets increased to €2,063 million thanks to the good business trend and significant proceeds from divestments. Accordingly, net financial debt1) declined from €1,677 million at year-end 2010 to €843 million.
Evonik used some of its cash and cash equivalents to repay financial liabilities. At the end of July 2011 we terminated and repaid the floating rate tranches of the €92 million promissory notes issued in 2009. Moreover, in November 2011 we conducted a partial buyback of the Evonik Degussa bond (2003/2013). Private and institutional investors sold bonds with a face value of some €157 million back to Evonik. The bonds repurchased by the company were withdrawn, reducing the nominal value of the Evonik Degussa bond to €1,093 million. This transaction reduced debt ahead of schedule and thus also reduced future interest commitments. Since it is highly probable that refinancing of up to €500 million will be necessary in 2013, we hedged the interest rate applicable at year-end 2011.
Net financial debt
in € million Dec. 31, 2011 Dec. 31, 2010
Non-current financial liabilities −2,657 −2,913
Current financial liabilities −249 −260
Financial debt −2,906 −3,173
− Cash and cash equivalents 1,609 1,103
− Current securities 449 388
− Other financial assets 5 5
Financial assets 2,063 1,496
Net financial debt as stated on the balance sheet −843 −1,677
Net financial debt, discontinued operations −979
Net financial debt (total) −2,656
Prior-year figures restated.
As well as reducing net financial debt, in 2011 we continued and extended the transfer of unfunded pension obligations relating to direct pension commitments to employees. The contractual trust arrangement (CTA) established for this purpose was allocated initial funding of €200 million in 2010 and a further €400 million in 20112). We plan to increase funding of the CTA stepwise in the future.
1) Since January 1, 2011 net financial debt has been calculated without taking account of liabilities and receivables from derivatives. The prior-year figures have been restated accordingly.
2) See also Note (7.10) to the consolidated financial statements.

Annual Report 2011 Evonik Industries24
Corporate bond is a central financing instrumentThe financial debt of €2,906 million comprises two corporate bonds totaling €1,860 million, long-term real estate financing (€547 million), decentralized borrowing (€285 million), promissory notes (€92 million), and other liabilities (€122 million).
Maturity profile of financial liabilities (continuing operations)
in € million
2012
2013
2014
2015
2016
2017
2018
2019 ff.
0 200 400 600 800 1,000 1,200
As of December 31, 2011.
Comfortable liquidity cushionAlongside cash and cash equivalents of €1,609 million and investments of €449 million in securities maturing in between three and twelve months, the Group’s central source of liquidity is a €1,500 million revolving credit facility from a syndicate of around 30 national and international banks. This credit facility is divided into three tranches of €500 million each, with terms running until August 2014, 2015 and 2016. This credit facility was not drawn at any time in 2011. Under the covenants for this revolving credit facility, Evonik has given an undertaking that it will meet specific financial ratios. The most important of these relates to total net debt leverage, in other words, the ratio of net financial debt to EBITDA. The second is the loan to value ratio, an asset-based indicator that compares the net financial debt of the Real Estate segment to the market value of its property. Timely monitoring of these ratios and forecasting of their development is ensured. Compliance with these covenants has to be reported quarterly to the banking syndicate that provides the credit facility. In 2011 we were able to demonstrate that we had met all contractually agreed minimum requirements by a wide margin on all reporting dates.
In addition, a special credit line amounting to €200 million is provided by the European Investment Bank to fund research and development projects. Borrowings run for up to five years from the time they are drawn. This facility was not used as of year-end 2011.
Further, as of December 31, 2011, various unused credit lines totaling €142 million were available to meet local requirements, especially in the Asia-Pacific region.

25Management report Consolidated financial statements Supplementary information
Financial condition
Considerably higher capital expenditures underscore growth in specialty chemicals Evonik is expanding in business segments and markets where it already has—or intends to build—a strong competitive position. Selective capital expenditures are designed to secure the potential for profitable long-term growth and opportunities to generate high added value. Every investment undergoes detailed strategic and economic analyses, including sensitivity analyses and scenario analyses to reflect major risks. Moreover, it has to meet business-specific, risk-adjusted minimum return requirements, which include covering the cost of central functions.
In 2011 we increased investment in property, plant and equipment by 27 percent to €830 million (2010: €652 million). The increase was attributable on the one hand to strategic growth projects that had been planned during the crisis and were started or continued in 2011. Further newly approved projects were added to realize our vision of value-enhancing growth. These will result in higher capital expenditures in the coming years. The largest single project in 2011 was expansion of production capacity for lithium-ion battery cells in Kamenz (Germany).
In keeping with our corporate strategy, the chemicals operations once again received the largest proportion of capital expenditures—68 percent—while 10 percent was invested in the Services segment and 9 percent in the Real Estate segment. The regional focus of capital expenditures was Germany, which accounted for 58 percent of the total, followed by the USA (13 percent) and China (8 percent).
Major projects completed or virtually completed in 2011
Segment Location Project
Consumer, Health & Nutrition Various sites Expansion of production capacity for methionine
Garyville (LA, USA) New steam and power supply infrastructure
Resource Efficiency Yokkaichi (Japan) New production plants for monosilane and AEROSIL
Specialty Materials Liaoyang (China) Expansion of production capacity and relocation of production of stabilizers/additives
Changchun (China) Expansion of production capacity for PEEK
Marl (Germany) Expansion of compounding capacity
Real Estate Germany Energy-efficient modernization, new developments in the Cologne area, selective purchases of residential real estate in the Ruhr region, portfolio acquisitions
For further information on current capital expenditure projects, please see the sections on the segments and regions.
Additions to financial assets1) totaled €140 million, well above the previous year’s figure of €36 million.
1) For information on acquisitions see also page 16 of this management report and Note (5.2).

Annual Report 2011 Evonik Industries26
Cash flow below previous year’s high levelThanks to our good operating performance, the cash flow from operating activities in our continuing operations was €1,435 million. That was €136 million less than in the previous year. Income before the financial result and income taxes was considerably higher, but this was countered mainly by higher income tax payments and an increase in net working capital as a result of the positive business trend. The cash flow from operating activities in the discontinued operations related to the former Energy Business Area and comprised an outflow of €126 million, compared with an inflow of €504 million in 2010. Overall, the cash flow from operating activities declined by €766 million to €1,309 million.
Cash outflows for investing activities amounted to €398 million (2010: €1,272 million) and mainly comprised outflows for property, plant and equipment amounting to €885 million (2010: €769 million) and investments of €134 million (2010: €55 million). A total cash outflow of €462 million (2010: €564 million) was registered for payments to the contractual trust arrangement for pensions, and for securities, capital investments and loans. The cash inflow from investing operations included €1,021 million from divestments, especially the carbon black business and the 51 percent stake in STEAG.
The cash outflow of €636 for financing activities (2010: outflow of €377 million) mainly comprised the payment of €400 million to our shareholders (2010: €320 million) and €237 million (2010: €59 million) to reduce financial debt.
Cash flow statement for the Evonik Group (excerpt)
in € million 2011 2010
Cash flow from operating activities, continuing operations 1,435 1,571
Cash flow from operating activities, discontinued operations −126 504
Cash flow from operating activities 1,309 2,075
Cash flow from investing activities1) −398 −1,272
Cash flow from financing activities1) −636 −377
Change in cash and cash equivalents1) 275 426
1) Including discontinued operations.

27Management report Consolidated financial statements Supplementary information
Asset structure
(4) Asset structure Reduction in total assetsTotal assets decreased by €3.6 billion to €16.9 billion. The principal influence here was the decon-solidation of the STEAG companies, which had been classified as assets held for sale at year-end 2010. Non-current assets increased by €0.3 billion to €11.0 billion. Increases from the addition of the 49 percent stake in STEAG that is included at equity and from higher capital expenditures were offset by reductions resulting from the disposal of the non-current assets associated with the carbon black business. Current assets contracted by €3.9 billion to €5.9 billion. The principal factors here were the deconsolidation of the STEAG companies from assets held for sale and of the current assets of the carbon black companies. The counter item was an increase in cash and cash equivalents, mainly due to the proceeds from the divestment of the carbon black business and the business-related increase in inventories. Non-current assets rose to 65 percent of total assets and are financed by liabilities with the same maturity structure.
Equity increased by €0.1 billion to €6.1 billion. Reserves increased by €0.6 billion to €5.5 billion, principally as a result of the good business trend, while non-controlling interests declined by €0.5 billion to €0.1 billion following the deconsolidation of the STEAG companies. The equity ratio improved from 29.1 percent to 35.8 percent.
Non-current liabilities decreased by €0.6 billion to €7.5 billion, principally due to the divestment of the carbon black business. The deconsolidation of the STEAG companies was the main factor affecting current liabilities, as they had been contained in “liabilities associated with assets held for sale”. Overall, current liabilities declined by €3.0 billion to €3.4 billion.
Balance sheet structure
in € million 20111) 20101) 20111) 20101)
16,944 20,543 16,944 20,543
1) As of December 31.2) Assets held for sale (Energy).3) Liabilities associated with asset held for sale (Energy).
11,026 (65%)
Non-current assets
5,918 (35%)
Current assets
10,739 (52%)
9,804 (48%)
6,074 (36 %)
Equity
7,484 (44%)
Non-current liabilities
3,386 (20%)
Current liabilities
5,969 (29%)
8,127 (40%)
6,447 (31%)2)
3)

Annual Report 2011 Evonik Industries28
(5) Research and developmentHigh strategic importance of R&DInnovative strength combined with closeness to customers is a key success factor for Evonik and a driver of profitable growth. As one of the world’s leading specialty chemicals corporations, we offer a constant stream of new and improved products and applications designed to enhance the competitiveness of our customers. In 2011 Evonik generated sales of €1.9 billion through new products and applications developed in the past five years. As a result of the strategic significance of research and development, the R&D budget was once again increased significantly to €365 million in 2011, a rise of 8 percent compared with 2010.
Our R&D is organized on a decentralized basis and closely aligned to market requirements. Evonik’s global R&D network comprises more than 35 locations with around 2,400 employees who work closely with marketing staff from the operational side of the specialty chemicals business and with the international sales organization. In this way, our innovation activities are very closely meshed with the needs of our customers and their customers.
These days, future-oriented areas of innovation are found principally at the interfaces between traditional disciplines, for example, between chemistry and biology, and chemistry and engineering. Our specialists therefore increasingly work in interdisciplinary teams. Evonik has defined six Areas of Competence. Through them we want to leverage further synergies in the development of innovations and realize additional growth potential. These Areas of Competence bundle our expertise in the following future-oriented technologies: Inorganic Particle Design, Coating & Bonding Technologies, Interfacial Technologies, Designing with Polymers, Biotechnology and Catalytic Processes. In addition, from an early stage in our R&D projects we combine our competence in specialty chemicals with in-house process and engineering know-how. That allows rapid translation of new processes into efficient industrial production.
R&D spending
Development of new products~40%
Other~5%
New technology platforms~20%
Improved production processes for established products~25%
Improved applications for established products~10%

29Management report Consolidated financial statements Supplementary information
Research and development
A strong culture of innovation Evonik sees itself as a “learning organization” and has anchored this in a long-term innovation management program. Within the operating units and at Creavis Technologies & Innovation (Creavis), where our strategic research is bundled, there are stringent processes for allocating R&D funding to specific projects. I2P (Idea to Profit)—our all-round project management system—allows efficient identification and evaluation of the entire innovation process. Sustainability also plays an important role in our innovation culture. For example, Evonik has developed a method to evaluate the carbon footprint of future products and processes at an early stage in their development.
Our internal Innovation Award is presented annually in recognition of outstanding application-oriented research achievements. In December 2011 the award for the category “New Product/ New System Solution” went to a fluoride-free backsheet for solar modules launched by the Performance Polymers Business Unit. So far a composite film comprising polyvinyl fluoride and polyester was used for these backsheets. The new VESTAMID backsheet is easier to recycle. It also has higher temperature and light resistance, better reflectance and is cheaper. In the “New or Improved Process” category, the winner was an innovative process for the production of a titanium silicate catalyst developed jointly by the Inorganic Materials and Advanced Intermediates Business Units. This innovation is used in the HPPO process developed jointly by Evonik and Uhde. The HPPO process uses hydrogen peroxide to produce propylene oxide, a key starting product for polyurethane. The market for propylene oxide is growing rapidly, especially in Asia. The new mixed oxide route for synthesis of the catalyst is simpler and cheaper than the old ester route and also more environment-friendly as it reduces waste streams.
Our R&D achievements also received external accolades in 2011. For instance, Evonik received the Responsible Care Award in the “large companies” category for the use of the soil additive STOCKOSORB in the reforestation of argan trees in Morocco. At the well-known Personal Care and Home Care Ingredients trade show (PCHi) in Shenzen (China), two Evonik products and technologies were honored with China Personal Care & Cosmetics Innovation Award. TEGO Twin 4100 received the Ringier Technology Award for the coating industry.
Driving tomorrow’s profitable growth Through our balanced innovation pipeline, we respond to the key megatrends we have identified, especially health, nutrition, resource efficiency and globalization. Our latest R&D highlights are products for displays, high-performance polymers for photovoltaic applications, and components to improve the energy efficiency of automobiles.
The large number of first-time patent applications filed by Evonik places it at the forefront of the specialty chemicals sector. In all, Evonik held more than 24,000 patents in 2011, including around 300 new patent applications filed during the year.
To strengthen our innovative potential still further, in September 2011 we held the groundbreaking ceremonies for two new research and development centers. Overall Evonik is investing some €31 million in these two complexes in Essen (Germany), which will have a combined workforce of more than 180 people from 2012/2013. One is dedicated to environment-friendly additives and specialty binders for the paints and coatings industry, while the other will be focusing on future-oriented cosmetic products.
To complement the present innovation structures and processes, we intend to invest up to €100 million in promising start-ups through our Corporate Venturing unit, either directly or indirectly through specialist venture capital funds. We see this as a suitable tool to speed up the development of new business and identify future areas of growth aligned to the megatrends we have identified.
Our Corporate Foresight team identifies sound future business opportunities for Evonik on a 10–15 year time horizon. It focuses on future needs: Trend analyses are used to identify the challenges for tomorrow’s markets. One example is the increasing number of megacities around the world, i.e. cities with more than ten million inhabitants, and the opportunities that offers for our specialty chemicals activities.
At a glance
Innovation culture: Firmly established in the Evonik GroupCustomer focus: R&D closely aligned to market requirementsInnovation pipeline: Well-stocked and balanced pipeline; around 450 short-, mid- and long-term projectsInterdisciplinary: Organizational and interdisciplinary bundling of know-how generates additional growth potentialGrowth impetus: Expansion of R&D in attractive emerging marketsInnovative capability: Sales of €1.9 billion generated with products and applications developed in the past five years

Annual Report 2011 Evonik Industries30
Interdisciplinary strategic research Our project houses, Science-to-Business (S2B) Centers and internal start-ups are run by Creavis. In our project houses, experts from several operating units work together for a three-year period on issues that are relatively closely related to Evonik’s product and technology portfolio and drive forward research until it is ready for use. When the project house reaches the end of its term, the research findings are commercialized by an internal start-up or our operating units. One example is the System Integration Project House, which recently successfully completed. Our current proj-ect house is Light & Electronics in Hsinchu (Taiwan).
In our S2B Centers, which are established for a longer period than the project houses, experts from Evonik work closely with external scientists, customers and suppliers on projects spanning the entire value chain. Some of our projects receive funding from the German government, the Federal State of North Rhine-Westphalia and the European Union. We currently have two S2B Centers: the Bio S2B Center, which is developing new biotechnology products and processes based on renewable raw materials, and the Eco2 S2B Center, which is working on innovative products and applications in the field of energy efficiency and climate protection. As of January 1, 2012 the Coatings & Additives Business Unit took over the printed electronics project from the Nanotronics S2B Center. This is a premiere for Evonik: It is the first time a business unit has taken over a business built up under the S2B concept, together with all employees and the research and application of technology.
Systematic global networking with scientists Based on the motto “Open Innovation”, Evonik also has a large number of cooperation agreements with universities and scientific institutes to ensure that top research findings on sustainable aspects of chemistry, biology and physics are rapidly transferred to the company. In 2011 we invested around €8 million in joint research with leading universities, scientific and technical institutes and other companies. These include, for example, the Leibniz Institute for Catalysis at Rostock University in Germany and the Industrial Technology Research Institute in Hsinchu (Taiwan). In December 2011 a cooperation was agreed with the University of Minnesota (USA) in the field of interfacial technol-ogy and material science.
The “Evonik Meets Science” forum, which is held regularly in Germany, China, Japan and the USA, is a platform for our experts to engage in discussion on scientific issues with leading research scientists. For instance, at the end of 2011 Evonik experts and leading university professors discussed current research into catalysts at a forum in Tokyo (Japan) while a discussion on “Coatings/Surfaces/Adhesives” was held in Pittsburgh (Pennsylvania, USA).

31Management report Consolidated financial statements Supplementary information
Research and development
Support for talented youngsters stepped upIn the 2011/2012 academic year, Evonik will provide a total of 150 German scholarships to support students at ten universities. These scholarships, which are awarded by the German government in collaboration with private sponsors, are designed to counter the shortage of skilled staff and encourage more young people to take a university degree. For many years, we have provided support for committed students and doctoral candidates through the Evonik Foundation.
Increased R&D in attractive growth regionsIn keeping with its corporate strategy, Evonik is stepping up its R&D presence in attractive growth regions. We already have technology centers in India and Japan and a research center in Shanghai (China), which has developed particularly fast: It has been extended twice since it opened in 2004 and a further extension is now scheduled for completion by mid-2013. Total investment will be around €23 million. The aim is to help strengthen the competitiveness of our Asian customers through research and applications technology geared specifically to local needs. In November 2011, we also opened our first research and development center for coating additives in Asia, the region where we are expecting the strongest growth in the paints and coatings industry in the next few years. At its locations in Singapore and Shanghai, it develops custom-tailored solutions for produc-ers in the Asia-Pacific region. The focus is on the fast-growing market for environment-friendly coating systems.
Since 2011, our Light & Electronics Project House in Hsinchu (Taiwan) has been engaged in research into products and technologies for photovoltaics, displays and the lighting industry. Given the increasingly short innovation and product lifecycles in the optoelectronics sector, strategic development alliances with key customers are very important.
In addition, our technology scouts in China, Japan, India, Brazil and the USA have a network of contacts to leading scientific institutions and companies in their regions. This enables them to rapidly identify suitable cooperation partners for business ideas developed by their colleagues on the operational side.
R&D at Evonik
R&D expenses €365 million
Expenses for joint research with other companies, universities and scientific/technical institutes approx. €8 million
R&D employees approx. 2,400
Locations more than 35
R&D projects approx. 450
Number of new patent applications filed approx. 300
Total patents held and applications filed more than 24,000
Total registered trademarks (including applications filed) more than 7,500

Annual Report 2011 Evonik Industries32
Market-oriented research and developmentIn 2011 our operating units once again developed and launched major innovative products and processes. In the Consumer, Health & Nutrition segment the Consumer Specialties Business Unit added a new emollient (light cosmetic oil) produced using an enzymatic process to its TEGOSOFT product family. TEGOSOFT AC is used in cosmetic formulations to give an extremely pleasant feel on the skin and meets the trend to resource-efficient products.
As a supplier of specialty additives, for example for the construction industry, the Consumer Specialties Business Unit also launched SITREN AirVoid 353/354 in 2011. These products regulate the quality of cementitious materials through selective regulation of air voids. This is used to man-age energy efficiency, tensile strength and durability. The products improve protection against salt. Applications for SITREN AirVoid 353/354 include dry mortar, an area where demand has been rising steadily for years. Evonik is one of the few suppliers that offers both antifoams and products to control air voids.
As part of its ongoing strategic development, the Health & Nutrition Business Unit is expanding its market activities into aquaculture. Given the scarcity of natural resources, the benefits of adding amino acids to feed for fish and shellfish include saving valuable fishmeal, raising the efficiency of the feed, and reducing environmental impact by cutting nitrogen emissions. In order to gain access to premium markets by offering a differentiated product range, Health & Nutrition has developed innovative products as an optimized source of methionine for shrimps and other shellfish. In addition, it is currently investigating fermentation methods for new types of algae that are rich in omega 3 fatty acids as a substitute for fish oil.
In 2011 the business unit opened a laboratory for highly potent active pharmaceutical ingredients (HPAPIs) in Hanau (Germany). At the same time, it extended cGMP (current good manufacturing practices) capacity for these active ingredients at Tippecanoe Laboratories in Lafayette (Indiana, USA). Evonik’s exclusive synthesis operations now cover all aspects of the production of highly potent active pharmaceutical ingredients, from the clinical phase to commercialization.
In addition, this business unit is acting as coordinator for the Federal Ministry of Education and Research’s three-year PeTrA project (platform for efficient epithelial transport of pharmaceutical applications with innovative particular carriers). This project involves industrial partners, leading research institutes and universities. It aims to formulate biopharmaceuticals, for example, for anti-cancer applications, as sprays or tablets so they do not have to be injected.
In the Resource Efficiency segment, research scientists in the Inorganic Materials Business Unit have developed a new method of insulating buildings based on AEROSIL. Bricks are filled with a mixture of AEROSIL and silanes, which gives excellent thermal insulation.
Systematic development of surface-modified AEROSIL products with hydrophobic (water-repellent) properties has led to the development of an innovative adhesive additive for rotor blades for large wind turbines. New AEROSIL types make the adhesive easier to apply to the two halves of rotor blades and give it the right viscosity and tensile strength.
At a glance
Innovation Award 2011: winnersCategory “New Product/ New System Solution“Project: VESTAMID for solar powerBusiness Unit: Performance Polymers
Category “New or Improved Process” Project: New mixed route for economical and environment-friendly production of the catalyst TS-1Business units: Inorganic Materials and Advanced Intermediates

33Management report Consolidated financial statements Supplementary information
Research and development
Further, this business unit has launched Dynasylan SIVO 160, a water-borne binder for anti-corrosion formulations that avoids or greatly reduces the use of toxic heavy metals such as chromium. Since it has excellent properties compared with systems containing heavy metals as well as ecological benefits, we regard Dynasylan SIVO 160 as a breakthrough in corrosion prevention.
The Coatings & Additives Business Unit has developed TEGO Airex 990 and TEGO Airex 991, a new generation of deaerators and antifoams for solvent-based high-solid paints. These liquid products contain 100 percent active substance. They are free of organic solvents and can also be coated so formulators are free to choose the solvent content of their products.
In addition, Coatings & Additives is adding a hydroxy-terminated polybutadiene (HTPB) to its range of polybutadienes. This high-growth substance is to be marketed as POLYVEST HT. Applications for this novel polymer material include sealants for triple glazing with high insulating properties and lightweight components for vehicles. The main growth drivers are energy efficiency and weight reduction. A new production plant for HTPB is being erected in Marl (Germany). In parallel with this, the business unit is continuing to drive forward research and development.
In the Specialty Materials segment, the Performance Polymers Business Unit has developed AVENEER, a new production process for methylmethacrylate (MMA) with convincing economic and environmental properties. Using catalysts developed by Evonik, it reduces by-products and raises yields, resulting in a perceptible reduction in both costs and CO2 emissions. A world-scale facility to produce MMA with the innovative AVENEER process is planned.
In collaboration with a partner, Performance Polymers has also developed a polymethyl-methacrylat-wood composite which can be used to produce profiles for applications including floorboards using a direct extrusion process. The properties of this new composite, PLEXIGLAS Wood, include far better colorfastness and weather resistance. In December 2011 it received the Innovation Award at the fourth German Wood-Plastic Composites Congress in Cologne.
There is steadily rising demand for energy-efficient and resource-saving technologies for the treatment of natural and synthetic gas. At the end of the initial production process, these gases contain a range of gases and trace elements as well as the desired substances such as methane or hydrogen. Gas scrubbing has become established for the purification of large quantities of these gases. The crude gas is mixed with suitable solvents that selectively absorb acid components. The Advanced Intermediates Business Unit is currently developing amine-based system solutions to reduce the cost of this process and make it far more efficient. These customized amines are expected to come onto the market in 2013.
Absorption cooling systems use thermal rather than electrical energy for air-conditioning or to provide industrial refrigerants. They can therefore be operated using solar energy or off-heat. At present, the chemicals used in these processes have drawbacks. A new development by this business unit is expected to pave the way for more widespread use of this resource-saving technology: In collaboration with the Process Technology & Engineering service unit, it has developed a new system solution based on ionic liquids. Field tests are currently being carried out with various industrial partners. These include the provision of refrigerants in the megawatt range.

Annual Report 2011 Evonik Industries34
(6) Segment performanceConsumer, Health & Nutrition segmentThis segment produces specialty chemicals, principally for applications in the consumer goods, animal feed and pharmaceutical sectors. The long-term development of its business is driven by socio-economic trends. As a result of growth in the world population, demand for food based on animal protein is rising. At the same time, the rise of an affluent middle class in the emerging markets is increasing demand for better quality day-to-day consumer goods such as personal care products and cosmetics. Moreover, the proportion of older people is rising in the developed markets as a result of demographic change, leading to higher demand for cosmetics, wellness products and pharmaceuticals. This segment comprises the Consumer Specialties and Health & Nutrition Business Units.
Key data for the Consumer, Health & Nutrition segment
in € million 2011 2010Change
in %
External sales 4,081 3,677 11
EBITDA 1,049 985 6
EBITDA margin in % 25.7 26.8 −
EBIT 917 853 7
Capital expenditures 186 109 70
Depreciation and amortization 123 121 2
Capital employed (annual average) 1,640 1,497 10
ROCE in % 55.9 57.0 −
Employees as of December 31 6,384 6,326 1
Prior-year figures restated.
Development of sales in the Consumer, Health & Nutrition segment
in € million
2008
2009
2010
2011
0 1,000 2,000 3,000 4,000
3,022
3,004
3,677
4,081

35Management report Consolidated financial statements Supplementary information
Segment performance
High demandThe very successful business trend continued in 2011. In the first half of the year in particular demand from all regions was very strong, so most capacity was fully utilized. Volume growth weakened in some areas of business towards the end of the year, but demand nevertheless remained high. Sales advanced 11 percent to €4,081 million in 2011, driven by perceptible volume growth and higher selling prices, principally due to the ability to pass on higher raw material costs.
Development of EBITDA and EBIT in the Consumer, Health & Nutrition segment
in € million
2008
2009
2010
2011
0 300 600 900 1,200
EBITDA EBIT
Excellent earnings performanceThe operating results improved further compared with the previous year’s good figures. EBITDA grew 6 percent to around €1,049 million, while EBIT increased 7 percent to €917 million. The main factors here were higher volumes and the resulting high capacity utilization. The EBITDA margin declined slightly to 25.7 percent.
Excellent return on capital As part of our endeavors to strengthen our market leadership, we raised capital expenditures by 70 percent to €186 million. That was well above depreciation, which amounted to €123 million. The average capital employed increased by €143 million to €1,640 million, principally because of the rise in capital expenditures and acquisitions. ROCE was excellent at 55.9 percent, although it was slightly lower than in the previous year due to the growth-induced rise in capital employed.
At a glance
Main areas of operation: Specialty chemicals for applications in the consumer goods, animal feed and pharmaceutical sectorsBusiness performance: Majority of production capacity fully utilized thanks to high demand; sales up 11 percentEarnings: EBITDA and EBIT increased
602
807
985
1,049
466
675
853
917

Annual Report 2011 Evonik Industries36
Consumer Specialties A high proportion of this business unit’s operations comprises ingredients, additives and system solutions, especially for high-quality consumer goods and specific industrial applications. The business unit has outstanding knowledge of interfacial chemistry. Its products are based on an extensive range of oleochemical derivatives, organically modified silicones, biochemistry and combinations of these. Key success factors are high innovative capability, integrated technology platforms and strategic partnerships with major consumer goods manufacturers.
Substantial rise in businessSales advanced 12 percent to €2,018 million in the Consumer Specialties Business Unit. Volume sales were already high in 2010 but demand increased further in 2011, especially in the first six months. This resulted in very high capacity utilization in the production facilities. Analogously to the general economic trend, demand normalized in fourth quarter, partly due to planned destocking by our customers. Overall, volumes were slightly up on the previous year, while the significant hike in selling prices mainly reflected recouping of raw material costs, which had risen significantly. EBIT increased, chiefly because of the rise in volumes and higher prices.
Global expansion of capacityThe Consumer Specialties Business Unit is building a research center for innovative and future-oriented products for the cosmetic industry in Essen (Germany) at a cost of some €17 million. Completion is scheduled for early 2013. In Shanghai (China), Evonik is currently investing a sum in the upper double-digit millions of euros in a production complex for organic specialty surfactants, which should come on stream in mid-2013. It will use renewable raw materials as the basis for ingredients for cosmetics, fabric care products and specialty surfactants for industrial applications. This will enable Consumer Specialties to support the growth of key customers in Asia, and especially the Chinese cosmetic industry, through local production.
In summer 2011 Consumer Specialties, National Industrialization Company (Tasnee) and Sahara Petrochemicals signed an agreement to establish a joint venture to produce and market super-absorbents in Saudi Arabia. A state-of-the-art world-scale production facility with annual capacity of 80,000 metric tons is to be built in Jubail. Start-up is scheduled for the end of 2013. Total invest-ment will run into triple-digit millions of euros. The joint venture is part of a new acrylic acid and derivatives complex on Tasnee’s site in the Al Jubail Chemical Park and will benefit from low-cost propylene from the neighboring cracker, which is operated by Tasnee and Sahara Petrochemicals in conjunction with LyondellBasell.
In May 2011 Consumer Specialties acquired the hanse chemie Group, which is a very good fit with its silicone-based products. This transaction has given Evonik a rapid entry to the new and fast-growing market for applications for specialty silicones.

37Management report Consolidated financial statements Supplementary information
Segment performance
Health & Nutrition The Health & Nutrition Business Unit produces and markets essential amino acids, mainly for animal nutrition and specialties for the pharmaceuticals industry. Key success factors are years of technical experience of organic synthesis and biotechnology, which we regard as key growth drivers for the Evonik Group.
Further hike in earningsThe very successful business trend continued in 2011. Sales grew 10 percent to €2,063 million as a result of a substantial rise in global demand and a slight increase in selling prices, principally because it was possible to pass higher raw material prices on to customers. Amino acids for animal nutrition and the pharmaceuticals business both contributed to this. The amino acids methionine and lysine, which are important for animal nutrition, continue to benefit from the ongoing rise in global demand for meat. The pharmaceuticals business also developed positively. The trend in the pharmaceutical industry to outsourcing active ingredient production is continuing. Thanks to higher demand, EBIT was above the previous year’s very good level.
Investing in further growthIn response to rising demand for the amino acid L-lysine for animal feed in the USA, capacity at the site in Blair (Nebraska, USA) is to be virtually doubled. The two-step expansion of capacity to 280,000 metric tons p.a. should be completed this year. The L-lysine, which is produced using biotechnological methods, is marketed as Biolys and is regarded worldwide as the preferred source of lysine for animal nutrition.
In view of the sustained growth in the amino acid methionine for animal feeds, we will be expanding capacity for DL-methionine at our three sites in Antwerp (Belgium), Wesseling (Germany), and Mobile (Alabama, USA) by 70,000 metric tons p.a. in a stepwise procedure, bringing the total to 430,000 metric tons p.a., probably by 2013. In addition, Evonik will be investing about half a billion euros in a new complex for the production of DL-methionine in Singapore. In a fully backwardly integrated complex on Jurong Island, Health & Nutrition will produce all key strategic starting products required for the production of methionine. This production complex with capacity of 150,000 metric tons p.a. is expected to come on stream in the second half of 2014. It will increase Evonik’s total production capacity for this product to 580,000 metric tons p.a.
Health & Nutrition has established a laboratory for highly potent active pharmaceutical ingre-dients (HPAPIs) in Hanau (Germany). At the same time, it has extended cGMP capacity for these active ingredients on a kilogram scale at Tippecanoe Laboratories in Lafayette (Indiana, USA). HPAPIs are active ingredients that are effective at very low concentrations and are mainly used in the treatment of cancer. They are one of the fastest growing segments of the pharmaceutical market.
Evonik strengthened its pharmaceutical business in 2011 by acquiring the RESOMER business from Boehringer Ingelheim and the pharmaceuticals business of SurModics. These acquisitions expand its range of pharmaceutical polymers and services for active ingredient formulations and give Evonik access to leading-edge know-how in the field of innovative parenteral and implant-based drug delivery forms. Both transactions are important elements in global expansion of the pharmaceutical business.

Annual Report 2011 Evonik Industries38
Resource Efficiency segmentThe Resource Efficiency segment offers solutions for environment-friendly and energy-efficient products. Since supplies of fossil fuels are limited, we see the trend to renewable energy sources and energy-efficient and environment-friendly products as a key factor in the development of this segment’s business. The segment comprises the Inorganic Materials and Coatings & Additives Business Units.
Key data for the Resource Efficiency segment
in € million 20111) 2010Change
in %
External sales 4,045 4,195 −4
EBITDA 765 746 3
EBITDA margin in % 18.9 17.8 −
EBIT 611 569 7
Capital expenditures 170 247 −31
Depreciation and amortization 152 171 −11
Capital employed (annual average) 2,068 2,215 −7
ROCE in % 29.5 25.7 −
Employees as of December 31 6,381 7,874 −19
Prior-year figures restated.1) Without the carbon black business from August 2011.
Adjusted sales above year-back level The Resource Efficiency segment’s sales totaled €4,045 million, slightly lower than in 2010 as a result of the divestment of the carbon black business which was closed at the end of July. After adjustment for carbon black sales in both years, sales grew by 8 percent. This was mainly due to higher selling prices, principally to pass on the higher cost of raw materials. In the first six months, demand was above the high level in the first half of 2010, leading to very high capacity utilization in most production facilities. However, demand weakened slightly in the second half, especially in Asia and Europe, so overall volume sales were around the previous year’s level.
At a glance
Main areas of operation: Solutions for environment-friendly and energy-efficient productsBusiness performance: Good capacity utilization in production plants over the year as a whole; volumes around prior-year level; sales up 8 percent (without carbon black)Earnings: EBITDA and EBIT increased despite divestment of the carbon black business

39Management report Consolidated financial statements Supplementary information
Segment performance
Development of sales in the Resource Efficiency segment
in € million
2008
2009
2010
2011
0 1,000 2,000 3,000 4,000
Higher operating earningsWe raised the operating results despite the missing earnings contributions from the carbon black business from August 2011 onwards. EBITDA grew 3 percent to €765 million, while EBIT increased 7 percent to €611 million. The EBITDA margin improved from 17.8 percent to 18.9 percent for operational reasons and as a result of the divestment of the carbon black business where the EBITDA margin was below average.
Development of EBITDA and EBIT in the Resource Efficiency segment
in € million
2008
2009
2010
2011
0 250 500 750
EBITDA EBIT
Improved return on capitalCapital expenditures totaled €170 million, 31 percent below the previous year’s high level, which included a number of major projects. Capital expenditures were well above depreciation, which amounted to €152 million. The average capital employed declined by €147 million to €2,068 million, principally because of the divestment of the carbon black business from the Inorganic Materials Business Unit and the acrylate-based plastic additives and plastisols activities from the Coatings & Additives Business Unit. ROCE increased from 25.7 percent to 29.5 percent due to lower capital employed and the improvement in EBIT.
3,828
3,181
4,195
4,045
558
463
746
765
375
264
569
611

Annual Report 2011 Evonik Industries40
Inorganic Materials A central feature of the Inorganic Materials Business Unit, one of the leading producers of a wide range of silicas and silanes, is its integrated silicon technology platform. Key customers include the tire, electronics, construction and fiber optics industries. Its expertise in designing organic particles and their surface properties is also used in the catalysts business.
High demandSales slipped 11 percent to €2,298 million in the Inorganic Materials Business Unit, mainly as a result of the divestment of the carbon black business. Excluding sales of the Carbon Black Business Line, sales increased 8 percent, principally because prices were increased to reflect higher raw material costs. In the first half of 2011 in particular, Inorganic Materials registered strong demand for its products, for example, from the automotive and construction sectors. Appreciable increases were achieved in energy-efficient and environment-friendly applications, especially “green” tires, thermal insulation, and adhesive additives for use in the construction of rotor blades for large wind turbines. In the second half of the year, demand deteriorated compared with the strong first half. Even though there were no earnings contributions from the carbon black business from August 2011 onwards, EBIT reached the previous year’s high level.
Capacity expansion The combined production facility for monosilane and AEROSIL fumed silicas at Yokkaichi (Japan) came on stream in early summer 2011. Evonik has a long-term agreement to supply monosilane to Taiyo Nippon Sanso Corporation. Monosilane is used in the production of silicon wafers for solar cells, flat-screen displays and semiconductors for the electronics industry. Applications for AEROSIL include processing into plastics, paints and coatings. This investment enables the Inorganic Materials Business Unit to participate in the high demand for applications for thin-layer voltaics, flat screens and semiconductors, especially in Asia.
To meet the continued rise in demand for precipitated silica, global capacity is to be raised by 25 percent by 2014, mainly at existing production sites in Asia and Europe. In this way, Inorganic Materials will ensure the continued availability of precipitated silica in all regions.
At the end of October 2011, Inorganic Materials acquired the activities of the Norwegian company FESIL Sunergy for metallurgical production of solar silicon (Solsilc process). These operations have been transferred to a newly formed entity, Evonik Solar Norge AS. The Solsilc process is an excellent basis for Evonik to further optimize its know-how in the production of solar silicon.

41Management report Consolidated financial statements Supplementary information
Segment performance
Coatings & Additives The Coatings & Additives Business Unit supplies high-quality functional polymers and specialty monomers to the paints, coatings, adhesives and sealants industries. It also produces high-performance oil additives and hydraulic fluids. A key attribute is its integrated isophorone technology platform. In addition, Coatings & Additives is closely meshed with Evonik’s methylmethacrylate and silicone platforms.
Further rise in sales and earningsThere was very high demand for the Coatings & Additives Business Unit’s products in the first half of 2011. Demand from the coatings and construction industries weakened in the second half of the year, but volume sales to the automotive industry remained very high throughout the year. Thanks to the high demand, we were able to recoup the rise in raw material costs by raising selling prices. Overall, sales advanced 8 percent to €1,747 million. EBIT rose even faster.
Investment in new productsThe Coatings & Additives Business Unit is investing €14 million in a new R&D center in Essen (Germany) where it will be developing environment-friendly additives and specialty binders for the paints and coatings industry and providing applications technology services.
In Marl (Germany), the business unit is building a production plant for adhesives and sealants to add a hydroxy-functionalized polybutadiene (HTPB) to its range of liquid polybutadienes. The plant will enable it to offer customers in the adhesives and sealants industries HTPB for the first time. The aim is to strengthen Evonik’s position as a provider of solutions for sustainable products that help utilize resources more efficiently. HTPB is used as a sealing compound in double- and triple-glazed windows that improve the insulation of homes. As an additive for adhesives used to bond a variety of materials and composites, HTPB plays a role in the safe and efficient use of plastics in automotive engineering. Increased use of plastics reduces the weight of vehicles and reduces fuel consumption.
In Shanghai (China), Evonik will be investing more than €100 million in world-scale production facilities for isophorone and isophorone diamine, which are scheduled to start operating in the first quarter of 2014. Isophorone is used, among other things, in paints and printing inks, while its derivative isophorone diamine is a curing agent for composites for applications such as rotor blades for wind turbines. Through these new facilities, Coatings & Additives is responding to the rapidly growing demand for these applications, especially in Asia.

Annual Report 2011 Evonik Industries42
Specialty Materials segmentThe heart of the Specialty Materials segment is the production of polymer materials and their preproducts, and additives. Progressive globalization offers market opportunities for this segment, driven by the mobility and urbanization megatrends, which are raising global demand for efficient transportation systems and sustainable construction methods. This is reinforced by the rise of an affluent middle class, especially in the emerging markets in Asia. Evonik is convinced that this segment’s growth will also be boosted by new applications resulting from the substitution of materials. The segment comprises the Performance Polymers and Advanced Intermediates Business Units.
Key data for the Specialty Materials segment
in € million 2011 2010Change
in %
External sales 4,880 4,117 19
EBITDA 907 626 45
EBITDA margin in % 18.6 15.2 −
EBIT 748 469 59
Capital expenditures 210 132 59
Depreciation and amortization 153 154 −1
Capital employed (annual average) 1,702 1,630 4
ROCE in % 43.9 28.8 −
Employees as of December 31 6,846 6,789 1
Prior-year figures restated.
Strong expansion of business The good business trend gained momentum in 2011. Demand for products marketed by the Specialty Materials segment was high worldwide, although it declined slightly towards the end of the year. The majority of our production plants were operating at full capacity, but production had to be adjusted to the decline in demand in the fourth quarter. The higher raw material costs were passed on by raising selling prices. Overall, sales advanced 19 percent to €4,880 million.
Development of sales in the Specialty Materials segment
in € million
2008
2009
2010
2011
0 1,000 2,000 3,000 4,000 5,000
At a glance
Main areas of operation: Production of polymer materials and their preproducts and additivesBusiness performance: Strong global demand resulting in full capacity utilization at most production plants; sales up 19 percentEarnings: Significant increase in EBITDA and EBIT
4,229
3,125
4,117
4,880

43Management report Consolidated financial statements Supplementary information
Segment performance
Further rise in operating results We achieved a considerable improvement in our operating results thanks to the positive volume trend, higher capacity utilization and price increases. EBITDA grew 45 percent to around €907 million, while EBIT increased 59 percent to €748 million. The EBITDA margin rose from 15.2 percent to 18.6 percent as a result of the strong rise in earnings.
Considerable improvement in ROCEWe have stepped up investment in response to rising demand. Capital expenditures increased by 59 percent to €210 million and were well above depreciation, which amounted to €153 million. The average capital employed increased by €72 million to €1,702 million. ROCE improved from 28.8 percent to 43.9 percent thanks to the considerable improvement in earnings.
Development of EBITDA and EBIT in the Specialty Materials segment
in € million
2008
2009
2010
2011
0 250 500 750
EBITDA EBIT
472
311
626
907
326
162
469
748

Annual Report 2011 Evonik Industries44
Performance Polymers The Performance Polymers Business Unit produces a wide range of high-performance materials, mainly for the automotive, aviation, electronics and photovoltaics industries. At its heart are integrated technology platforms for methylmethacrylate chemistry (MMA) and polyamide 12. In addition, it manufactures high-performance polymers based on polyetherether ketone (PEEK) and polyimides to meet extremely high-tech mechanical, thermal and chemical requirements.
Far higher earningsThe Performance Polymers Business Unit increased volumes further in 2011. This was driven mainly by the good business conditions for traditional applications for example in the automotive industry, and by increased demand for new applications such as LED screens and solar technology. In the second half of 2011, demand declined due to softer demand for LED screens and planned destocking by customers. Nevertheless, it remained at a very good level. Owing to the strong demand, some products were in short supply on the market, and this had a positive impact on selling prices. Overall, sales advanced 18 percent to €1,960 million. EBIT was considerably higher thanks to the increase in volumes and prices.
Significant increase in capacityIn response to rising global demand, Performance Polymers has increased its capacity for polyetherether ketone (PEEK) at its site in Changchun (China). PEEK polymers are resistant to chemicals and high temperatures and are used in the manufacture of components for constant use under exceptionally tough conditions, for example, in the aviation industry. The business unit is also expanding production capacity for polymethlymethacrylate (PMMA) molding compounds in China. Start-up of the second expansion phase in Shanghai has doubled regional production capacity for these products to around 40,000 metric tons p.a. A further extrusion line is being built in Taichung (Taiwan). Evonik’s PMMA molding compounds which are marketed as PLEXIGLAS and ACRYLITE are very well-known internationally. They are supplied to a range of industries including the automotive, lighting and electronics sectors.
In Marl (Germany), we have expanded compounding capacity—a preliminary step in the production of customized polyamide 12 materials. Start-up is scheduled for the first half of 2012. Expansion of capacity for the specialty polymer polyamide 12 in Marl is almost completed. There are plans to build a further production plant for polyamide 12 in Asia in the next three years. Performance Polymers is planning this substantial capacity increase to secure its leading position in the market for this product in the long term. Polyamide 12 is used in innovative, high-quality products in the automotive sector, electrical and electronic applications and gas and offshore oil pipelines.

45Management report Consolidated financial statements Supplementary information
Segment performance
Advanced Intermediates Key factors in the success of the Advanced Intermediates Business Unit are advanced chemical processes, which Evonik has developed systematically over decades. This applies in particular for the integrated C4 technology platform, where C4 crack is processed into specialties. This business unit has gained access to new growth markets for hydrogen peroxide thanks to its innovative capability, which is demonstrated above all by the hydrogen peroxide to propylene oxide (HPPO) process. In addition, Evonik is the world market leader in alcoholates, which are used as catalysts in the production of biodiesel.
Significant rise in sales and earningsThe Advanced Intermediates Business Unit benefited from sustained high demand. In particular, there was strong global demand for its plasticizer alcohols, butadiene, hydrogen peroxide and alcoholates for diesel production. Thanks to the sound order situation, it was possible to raise selling prices for many products and thus pass on the rise in raw material prices. Overall, sales advanced 19 percent to €2,920 million. EBIT grew as a result of the improved product mix and higher selling prices.
Investing in the futureAdvanced Intermediates is building a new production plant for catalysts for biodiesel in Puerto General San Martino (Argentina). Following completion, which is scheduled for the end of 2012, the plant will supply alcoholates for use as catalysts in the production of biodiesel from renewable raw materials. This new plant is expected to supply over 60,000 metric tons p. a. of these products in the future, mainly to Argentina and Brazil. Through this investment Advanced Intermediates aims to participate in the fast-growing South American market for biodiesel.
In Jilin (China), Evonik plans to build a new production facility for hydrogen peroxide (H2O2), which should be completed by the end of 2013. This will raise Advanced Intermediates’ annual production capacity by almost 40 percent from the present level of around 600,000 metric tons. This investment in the lower triple-digit millions of euros is a further step into the market for new applications for this environment-friendly oxidation agent. Evonik has a long-term agreement to supply hydrogen peroxide from the facility in Jilin to the neighboring propylene oxide plant which will be operated by Jishen Chemical Industry Co., Ltd., via a direct pipeline. Jishen will use the hydrogen peroxide to produce propylene oxide using an innovative technology known as the HPPO process. Propylene oxide is mainly used in the manufacture starting products for polyurethane and the market is growing rapidly, especially in Asia.
In November 2011 Advanced Intermediates acquired the hydrogen peroxide business of Kemira Chemicals Canada Inc., with a production facility in Maitland (Ontario, Canada). This acquisition has increased capacity in North America by 44,000 metric tons to over 200,000 metric tons p. a. The Maitland facility mainly supplies hydrogen peroxide to the North American pulp and paper industry as an environment-friendly oxidation agent.

Annual Report 2011 Evonik Industries46
Services segmentThe Services segment principally comprises Site Services and Evonik Business Services. Its services are mainly targeted at the chemicals segments and the Corporate Center, and to a lesser extent at third parties. The Site Services unit bundles cross-site infrastructure services, such as supply and disposal, logistics and facility management. Evonik Business Services supports the chemicals operations and the Corporate Center by providing standardized administrative services, including IT, human resources, accounting and legal services. It also includes the Group-wide procurement and engineering operations.
Key data for the Services segment
in € million 2011 2010Change
in %
External sales 952 801 19
EBITDA 139 106 32
EBITDA margin in % 14.6 13.2 −
EBIT 56 28 101
Capital expenditures 84 79 6
Depreciation and amortization 82 78 5
Capital employed (annual average) 442 447 −1
ROCE in % 12.7 6.3 −
Employees as of December 31 10,946 10,616 3
Prior-year figures restated.
Higher earningsThe Services segment’s sales totaled €2,423 million in 2011. Internal sales with the chemicals segments and Corporate Center accounted for €1,471 million of the total. The external sales of €952 million were mainly attributable to services and procurement activities for external customers. The 19 percent rise in external sales was due first and foremost to higher demand for services, and because we were able to pass on higher raw material prices in our procurement activities. EBITDA grew 32 percent to around €139 million, while EBIT doubled to €56 million. In particular, Site Services Europe lifted earnings thanks to effective cost-cutting measures.
New Site Services unit is proving successful Since October 2010, infrastructure services for the Group’s eleven largest chemicals sites in Europe have been bundled in the Site Services Europe unit. The role of this unit is to step up cross-site collaboration, expand business and offer customers far higher added value. Around 7,700 employees provide a full range of technical, logistics, supply, disposal and site management services. The performance program introduced at the end of 2010 was successful and exceeded its targets. It identified specific measures with the potential to make savings of over €100 million.

47Management report Consolidated financial statements Supplementary information
Segment performance
Real Estate segmentThe Real Estate segment, which Evonik plans to exit entirely in the medium term, focuses on letting homes to private households in the federal state of North Rhine-Westphalia. Alongside Evonik’s portfolio of residential real estate, it comprises a 50 percent stake in THS.
Key data for the Real Estate segment
in € million 2011 2010Change
in %
External sales 412 402 2
EBITDA 219 190 16
EBITDA margin in % 53.2 47.3 −
EBIT 171 140 21
Capital expenditures 74 41 79
Depreciation and amortization 47 47 0
Capital employed (annual average) 1,833 1,810 1
ROCE in % 9.3 7.7 −
Employees as of December 31 1,135 1,098 3
Prior-year figures restated.
An improvement in earnings Sales increased by 2 percent to €412 million. EBITDA rose 16 percent to €219 million and the EBITDA margin therefore advanced from 47.3 percent to 53.2 percent. EBIT grew 21 percent to €171 million. One reason for this was a one-time effect of €20 million from the revaluation of deferred tax assets in the at-equity earnings of THS, which increased its earnings to €46 million. The property management business posted improved earnings thanks to higher rental revenues. The average net monthly rent as of December (excluding utility charges) increased from €4.58 per square meter in 2010 to €4.71 per square meter in 2011. The demand-driven vacancy rate was optimized further, dropping from 2.2 percent in 2010 to 2.0 percent in 2011, and is very favorable by sector standards. Net maintenance expense was €11.85 per square meter, around the same level as in 2010 (€11.89 per square meter). Portfolio management also posted higher earnings than in the previous year thanks to its focus on selling individual residential units.
Higher EBIT and virtually unchanged capital employed enabled the Real Estate segment to increase its ROCE from 7.7 percent to 9.3 percent.

Annual Report 2011 Evonik Industries48
Higher investment Capital expenditures rose significantly to €74 million. The focus was on modernizing the housing stock to improve energy efficiency and on the construction and acquisition of new properties. The objective is to raise the value of the real estate portfolio in the long term through selective investment in modernization to secure or raise rental revenues and energy efficiency, and the purchase and construction of sustainable, future-oriented residential units at attractive locations in the federal state of North Rhine-Westphalia. The focus is on selected acquisition of residential properties that meet market requirements and offer attractive potential for rent rises in large and mid-sized cities in the Ruhr region.
Amalgamation with THS initiatedThe planned merger of our real estate business with THS, in which Evonik and the German Mining, Chemical and Energy industrial union (IG BCE) each have a 50 percent stake, will create Germany’s third-largest residential real estate company. Since January 1, 2012 around 130,000 properties owned by Evonik and THS have been jointly managed by Vivawest Wohnen GmbH, in which Evonik and THS each have a 50 percent stake.

49Management report Consolidated financial statements Supplementary information
Regional development
(7) Regional developmentA global presenceIn 2011, 74 percent of our sales were generated outside Germany. Sales in Germany increased 10 percent to €3,784 million as a result of buoyant demand. Above-average growth came from the Specialty Materials and Services segments, while sales in the Resource Efficiency segment were lower than in the previous year as a result of the divestment of the carbon black business.
Capital expenditures rose 53 percent to €481 million. The biggest project was the expansion of our production capacity for lithium-ion cells for lithium-ion batteries in Kamenz (Germany). Together with Daimler AG, Stuttgart (Germany), in 2011 we made further progress with preparations for mass production of lithium-ion batteries and battery cells in Kamenz. Evonik’s goal is to ramp up annual production capacity for cells at this site from around 300,000 units to about 3 million units by 2013. Daimler is expected to launch the E-Smart with lithium-ion batteries from Kamenz in 2012. The Real Estate segment increased its investment in residential property. In Marl (Germany), the Performance Polymers Business Unit is raising compounding capacity—a preliminary step in the production of customized polyamide 12 materials—and capacity for the specialty polymer polyamide 12. The Health & Nutrition Business Unit opened a laboratory for highly potent active pharmaceutical ingredients (HPAPIs) in Hanau (Germany).
Sales in the other European countries grew 12 percent to €4,151 million. Higher sales were reported mainly by the Specialty Materials and Consumer, Health & Nutrition segments. This region’s share of the Group’s total sales increased by 1 percentage point to 29 percent. Capital expenditures in this region decreased by 6 percent to €81 million.
Sales by region1)
Germany26%
North America19%
Other2%
Other European countries29%
Asia20%
Central and South America4%
1) By point of sale.
Expansion of our market position in Asia In Asia we grew sales 9 percent to €2,901 million. High demand enabled all business units to expand their business. This was countered by the divestment of the carbon black business. As a result, the region’s share of Group sales was unchanged at 20 percent. Capital expenditures amounted to €152 million and were thus below the previous year’s high level. We regard Asia and especially China as a very attractive region with enormous potential because of its economic momentum. The Performance Polymers Business Unit has therefore raised production capacity for polyetherether ketone (PEEK) and polymethylmethacrylate (PMMA) molding compounds. In Yokkaichi (Japan), the Inorganic Materials Business Unit started up a combined production facility for monosilane and AEROSIL fumed silica. In keeping with our growth strategy, we have also embarked on further significant projects: In Singpore we are building a new backwardly integrated complex for the
Annual Report 2011 Evonik Industries50
(8) Performance of Evonik Industries AG Evonik Industries AG, Essen (Germany) is the parent company of the Evonik Group. It holds direct and indirect stakes in all subsidiaries in the Group. RAG-Stiftung holds 74.99 percent of the shares in Evonik Industries AG. The annual financial statements for Evonik Industries AG have been prepared in accordance with the accounting standards set out in the German Commercial Code (HGB) and the German Stock Corporation Act (AktG). The earnings performance of Evonik Industries AG is essentially dependent on the performance of its subsidiaries and income and expenses relating to corporate financing and portfolio adjustment activities.
Effective August 1, 2011, the management of all plants operated by Evonik Degussa GmbH, Evonik Goldschmidt GmbH, Evonik Oxeno GmbH, Evonik Röhm GmbH and Evonik Stockhausen GmbH was transferred to Evonik Industries AG. In connection with this, around 13,600 employees of these companies were transferred to Evonik Industries AG. The above companies remain the economic owners of the assets and liabilities of the plants. Consequently the opportunities and risks are still borne by and assigned to these companies. As the operator, Evonik Industries AG recognizes all liabilities entered into in its name and capitalizes a claim for compensation from the owners of the plants. As a result of this structure, the sales revenues shown on the income statement of Evonik Industries AG merely comprise fees for the management of these plants. All other income and expenses are allocated to the companies that own the plants and are recognized in their annual financial statements. In 2011 the management fees were calculated on a pro rata basis.
amino acid DL-methionine, and in China we plan to build new production complexes for isophorone and isophorone derivatives and organic specialty surfactants, and a production facility for hydrogen peroxide.
High demand in America Sales in North America increased 10 percent to €2,766 million but this region’s share of total sales remained unchanged at 19 percent. Sales rose significantly in the Consumer, Health & Nutrition and Specialty Materials segments, but were down year-on-year in the Resource Efficiency segment due to the divestment of the carbon black business. Capital expenditures rose substantially to €109 million.
In Central and South America Evonik generated sales of €642 million. That was 2 percent below the previous year’s level due to the divestment of the carbon black business. This region’s share of total sales declined by 1 percentage point to 4 percent. Capital expenditures again amounted to €7 million. This region includes attractive emerging markets where we see above-average poten-tial for growth in the future. In order to benefit from this, we have initiated investment projects here. A production facility for alcoholates, which are used as catalysts in the production of biodiesel, is under construction in Argentina and in Brazil we will be building a facility for oleochemical spe-cialty surfactants.

51Management report Consolidated financial statements Supplementary information
Performance of Evonik Industries AG
Income statement for Evonik Industries AG
in € million 2011 2010
Sales 51 168
Other operating income 529 929
Personnel expense −87 −62
Depreciation of property, plant and equipment, amortization of intangible assets −3 −2
Depreciation of current assets −1 −1
Other operating expenses −811 −934
Operating result −322 98
Net interest expense −147 −122
Write-downs of financial assets −5 −440
Income from investments 101 848
Income before taxes −373 384
Extraordinary income 11 0
Extraordinary expense −17 −16
Extraordinary loss −6 −16
Income taxes −46 −237
Net loss/net income −425 131
Profit carried forward from previous year 115 384
Withdrawals from revenue reserves 735 0
Net profit 425 515
From January 1, 2008 Evonik Industries AG charged its subsidiaries for services rendered. These charges amounted to €24 million in 2011 and were recognized together with the pro rata fees of €27 million for management of the plants as sales. The system of obtaining reimbursement from Group companies was discontinued as of January 1, 2011. As a consequence, other operating income amounted to €529 million, well below the previous year’s level of €929 million, which included costs of €252 million reimbursed by Group companies. In the gross view, currency translation gains (€456 million) are included in other operating income and the corresponding expenses (€404 million) are included in other operating expenses. The net effect is a gain of €52 million. Personnel expense increased considerably to €87 million. This was attributable to one-off additions to pension provisions, costs relating to the introduction of the new corporate structure and general increases in personnel costs. It does not include personnel expense for the employees transferred effective August 1, 2011 because economically they are still attributable to the companies that own the plants.
The net interest expense of €147 million mainly resulted from borrowing for the company’s financing activities for the Group. This item also contains interest income and expense from the Group-wide cash pool, which is concentrated at Evonik Industries AG. Income from investments declined from €848 million in 2010 to €101 million in 2011, mainly because Evonik Degussa GmbH allocated its entire net profit to retained earnings in 2011, whereas it was transferred in full to Evonik Industries AG in the previous year. Income before taxes was negative at minus €373 million compared with €384 million in 2010 as general expenses were no longer allocated among subsidiaries and income from investments was lower. The extraordinary loss of €6 million comprised expenses in connection with the planned stock exchange listing. It also includes costs of €11 million for prepa-rations for the planned stock exchange listing that were reimbursed by the shareholders. The income

Annual Report 2011 Evonik Industries52
taxes of €46 million comprised taxes for previous years. The company recorded a net loss of €425 million compared with net income of €131 million in the previous year. Including the profit of €115 million carried forward from 2010 and withdrawals from revenue reserves totaling €735 million, the net profit was €425 million. The Executive Board will propose to the Annual Shareholders’ Meeting that the entire net profit should be used to pay a dividend to the company’s shareholders.
Balance sheet for Evonik Industries AG
in € million Dec. 31, 2011 Dec. 31, 2010
Assets
Intangible assets, property, plant and equipment 8 8
Financial assets 8,813 8,870
Non-current assets 8,821 8,878
Receivables and other assets 3,156 3,423
Securities 635 373
Cash and cash equivalents 1,192 860
Current assets 4,983 4,656
Prepaid expenses and deferred charges 2 2
Total assets 13,806 13,536
Equity and liabilities
Issued capital 466 466
Capital reserve 720 720
Revenue reserves 2,638 3,373
Net profit 425 515
Equity 4,249 5,074
Provisions 1,960 382
Liabilities 7,597 8,080
Total equity and liabilities 13,806 13,536
Evonik Industries AG’s total assets increased by €0.3 billion to €13.8 billion. Financial assets mainly comprise shares in subsidiaries. The receivables mainly comprise claims for reimbursement in connection with plant management and financial receivables of €1.0 billion, principally for cash pooling activities. Equity decreased by €0.8 billion to €4.2 billion due to the dividend payment and the net loss. The equity ratio therefore declined from 37.5 percent to 30.8 percent. Provisions increased by €1.6 billion to €2.0 billion, chiefly because of the transfer of pension provisions and personnel-related provisions from the companies that own the plants managed by Evonik Industries AG. The receivables and liabilities reflect the financing activities of Evonik Industries AG in its role as the holding company for the Group. Liabilities include financial liabilities of €6.9 billion, including €6.0 billion due to affiliated companies, mainly in connection with cash pooling activities. A further €750 million relates to the corporate bond issued in October 2009.

53Management report Consolidated financial statements Supplementary information
Corporate responsibility
(9) Corporate responsibility Evonik accepts responsibility—for its business, its employees and society. That is how we define corporate responsibility (CR). Global challenges such as climate change, shortages of resources, a lack of drinking water, poverty and malnutrition affect the lives of many people today. Our products and solutions are targeted at specific megatrends: health, nutrition, resource efficiency and globalization.
We actively respond to the expectations of our internal and external stakeholders on how we should contribute to the sustainable development of society and come up with answers to future challenges in close collaboration with our business units. The areas of activity defined in the CR strategy (the business, employees and processes) support corporate strategy and the attainment of corporate objectives.
We intend to drive forward our CR strategy in 2012 and integrate it even more closely into core business processes in the business units. This is based on the materiality analyses conducted in 2010 and 2011 to enhance our understanding of global challenges and evaluate their significance for society and for Evonik.
Building on the stakeholder survey carried out in 2010, in 2011 we approached our customers with the same questions about the global challenges and their significance for Evonik. In their opinion, the main issues are utilization of resources, health, diversity and equality of opportunity, and access to water. The importance attached to climate change as a challenge was lower than in the previous year.
Within the “employees” dimension, we continued the “CR in vocational training” project. Apprentices at the participating sites chose to evaluate and present the opportunities and risks for Evonik in the use of social media. All educational materials developed so far have been made available via a media library for sites that run vocational training programs. In the area of continuing professional development, potential to supplement the present training programs was identified. An example of how this can be put into practice was the inclusion of CR in “Tool Day”, a two-day information event for new employees. In 2012 we plan to develop an online tool to present basic elements of corporate responsibility and sustainability to all employees and enhance understanding of CR at all Evonik sites around the world. A tool of this type has already been developed and successfully introduced in the Procurement unit.
In 2011 Evonik shifted the focus of supplier evaluation from a volume-based approach to a full evaluation of all suppliers classified as risks in the coming years. The evaluation includes aspects such as occupational health and safety, environmental protection, prevention of corruption, working conditions, responsibility along the supply chain and quality, and is therefore focused on key aspects of the United Nations’ Millennium Goals.
A report on relations with affiliated companies has been prepared in accordance with Section 312 of the German Stock Corporation Act (AktG). It concludes with the following declaration: “Our company received adequate remuneration or compensation for each of the transactions set out in this report on relations with affiliated companies under the circumstances known to us at the time when the transactions were undertaken. No actions were performed or omitted at the instigation of such companies.”

Annual Report 2011 Evonik Industries54
EmployeesRealignment of HR workThe strategic refocusing of the Group on specialty chemicals and the new plant management structure entailed many challenges for our human resources (HR) departments around the world in 2011. They were confronted with far-reaching structural changes on the one hand and major future-oriented issues on the other. In the light of these developments, human resources work at Evonik was realigned. Evidence includes the introduction of uniform job evaluation and remu-neration systems, a common collective bargaining landscape and adjustment of the competency model to the new requirements.
HR strategy—Employees are the keys to successOur aim is to support Evonik’s strategic growth and efficiency targets by providing customized human resources concepts, especially in the exceptionally fast-growing Asian markets. Key future issues such as ongoing internationalization, fostering diversity within the company and demographic change represent a challenge for our creative force. HR makes a decisive con-tribution to Evonik’s success and competitiveness. Our HR strategy has therefore been aligned to the strategic drivers “Attract”, “Develop” and “Retain” employees. Alongside the functional excellence of HR work, our priority is employee excellence. Focal areas of our work therefore include employer branding and recruiting, personnel development and leadership, and the specific challenges of HR work in Asia.
HR on Track—Fit for the futureThe “HR on Track” project is establishing the structural basis for our worldwide HR activities. The aim is to ensure excellence in HR work through efficient and uniform processes, transparent structures and modern HR IT systems. This also includes a culture of constructive collaboration in all areas to ensure that our HR work bears a “common stamp”. At the end of 2011, decisions were taken on the first organizational and process changes, involving reorganization of HR work at our German sites in a “Germany” region. At the same time, it was agreed that we should introduce an Evonik Recruiting Center and Evonik HR Advisory Center in Germany and that further rules and regulations should be harmonized in collaboration with the bodies representing our employees.
Further, a uniform HR process model was developed with international input in 2011. The results are to be implemented for all employees from 2012 in tandem with the introduction of our new global HR IT system.
Structural change—A single employer Effective August 1, 2011, the management of all plants belonging to Evonik Degussa GmbH, Evonik Goldschmidt GmbH, Evonik Oxeno GmbH, Evonik Röhm GmbH and Evonik Stockhausen GmbH was transferred to Evonik Industries AG. The plants belonging to Evonik Goldschmidt Rewo GmbH, Evonik RohMax Additives GmbH, Evonik Technochemie GmbH and Evonik Tego Chemie GmbH will be integrated into this structure as of April 1, 2012. This new structure, which was introduced on August 1, 2011, and the related transfer of more than 13,600 employees means that Evonik Industries AG is the sole employer for all staff working at these plants. The employee representation structures have been adapted to the new corporate structure.

55Management report Consolidated financial statements Supplementary information
Corporate responsibility
Global realignment of remuneration systems—A milestone on the road to global growthWe restructured our remuneration systems in Germany and Asia in 2011. This cross-regional harmonization and the introduction of new global standards fit in well with Evonik’s new strategic focus and are a major milestone supporting our global growth strategy.
Together with representatives of the workforce, we developed a new, uniform remuneration system for exempt and managerial employees in Germany. From 2012, we will be introducing our first uniform remuneration policy for these employee grades. Until now, the remuneration landscape has been characterized by widely varying systems. The attractive new system introduces trans parent structures and aims to reduce complexity and simplify processes within the Group. In connection with this, we also revised and harmonized the performance appraisal system for exempt employees and managers in Germany.
Internationally, two projects were undertaken in Asia. In Greater China we reviewed the job evaluation and grading system introduced in 2007 and in the South East Asia, Australia, New Zealand (SEAANZ) region we initiated a similar review process.
Through international collaboration with Evonik’s remuneration specialists, in future we will be able to apply a consistent uniform job evaluation system for managers and employees in Germany, Greater China and the SEAANZ region. This system takes account of regional differences and will form a basis for local remuneration systems. As the next step, we plan to include further regions in the Evonik Global Grading System.
New performance-related salary increments for non-managerial employeesAs part of the performance appraisal system, in 2011 we introduced a new system of performance-related monthly salary increments for non-managerial employees in Germany in agreement with the Works Council. The new system means that the performance of our employees can directly increase the salary they earn each month. Evonik’s first uniform system of performance increments will be introduced in 2012.
Employee participation plan proves popular The employee participation plan was offered for the fourth time in 2011. Evonik rewards employees’ financial commitment by enabling them to share in the success of the Group: The capital invested earns a return based on the Group’s return on capital employed (ROCE). In addition, Evonik grants tax-free subsidies. The participation rate increased significantly from the high level seen in 2010. Around 34 percent of employees took part in 2011, showing that they are happy to invest their own capital in Evonik’s success. Nearly 7,500 of the eligible employees purchased participation rights with a total value of around €14.5 million.
Competencies systematically aligned to growth Evonik’s clear focus on specialty chemicals is also reflected in the changing demands made on the workforce, from employees to the top management. Within the framework of the Evonik Competency Model, which was updated in 2011, a balance of earnings orientation and long-term strategic thinking is considered to be as important for our success as our employees’ permanent ability to change and innovate. The keys to this are people with wide-ranging experience, to whom we can delegate responsibilities that reflect their strengths and continue to develop on the basis of the Evonik Competency Model.
Regular employee reviews are a fundamental aspect of personnel development at Evonik. The uniform standard for this which was introduced Group-wide in 2008 has now been adjusted to align it to the updated competency model. Integrating a common performance appraisal into the employee review underscores its importance at a central management tool.
At a glance
Strategy: HR work realigned on basis of corporate strategy; focus on strategic drivers: “Recruit”, “Develop”, “Retain” employeesDiversity: Diversity strategy adopted at the start of 2011; diversity included in objectives agreed with Group executivesA clear structure: Remuneration systems restructured in Germany and Asia; global standards introduced Responsibility: Apprentices account for about 9 percent of the workforce in Germany, which is above the national average; apprentices have far better prospects of being hired at the end of their trainingEmployer branding: Evonik successfully launched its Facebook presence in 2011

Annual Report 2011 Evonik Industries56
Vocational training—Proactively addressing the skills shortage Evonik’s declared aim is to meet future personnel requirements primarily from the upcoming generation within the company. We have about 2,160 young people on vocational training courses leading to some 40 recognized qualifications at more than 20 training centers in Germany. That shows how important vocational training is to Evonik. Apprentices make up 9 percent of our workforce in Germany—well above the national average—and we invested €49.8 million in vocational training in 2011.
To counter the increasing competition for skilled staff resulting from demographic change, in 2011 we reached an agreement on hiring apprentices at the end of their training. Under this agreement, which came into effect in March 2011, one in two newly qualified youngsters receives a permanent employment contract. That has increased the number of apprentices taken on by the company on completion of their training by about 150 percent and is an important message in the competition for the best applicants. In view of the declining number of 15–19 year-olds on the labor market, we launched a special advertising campaign in 2011 to position Evonik as an attractive employer and achieved a clear increase in the number of applicants for vocational training places.
For more than ten years, Evonik has participated in a special program initiated by the German Mining, Chemical and Energy union (IG BCE) and the chemical industry employers federation to prepare young people for vocational training. In 2011 we increased the number of participants to a total of 100.
Employer branding—Dialog fosters credibility Presenting Evonik’s unique strengths as an employer credibly to the relevant target groups is the central focus of our employer branding activities. In view of our international growth strategy, the aim is to give Evonik a recognizable global “face” as an employer. Our combination of growth, diversity and creativity sets us apart from competitors and appeals to our target groups.
In 2011 we raised our profile in the social media world with the successful launch of a presence on Facebook. As an employer, Facebook enables us to reach many people who are looking for a suitable start to their career or a new challenge. We see this form of communication as a big opportunity to position Evonik as an open, transparent and dynamic employer and to provide cred-ible and personal insights into our company.
Talent management—Today’s talented employees are tomorrow’s managersCompetition to secure the most talented employees is steadily increasing. Our philosophy is that key functions should be filled internally wherever possible. To that end, Evonik fosters quality within the company and stepped up its offering for talented employees in 2011. Alongside on-the-job development opportunities, we offer a range of additional measures, which are supported by the Executive Board and Group executives and therefore closely linked to the business.
A member of the Executive Board regularly meets up with our talents for intensive discussion of topical strategic issues. Participants in the “Leadership” program have an opportunity to reflect on the results of their 360° feedback with professional coaches and to discuss current management challenges with peers.
We are also continuing our cooperation with the IMD Business School in Switzerland, with which we develop custom-tailored programs for our talents.

57Management report Consolidated financial statements Supplementary information
Corporate responsibility
360° feedback—An active feedback cultureWe have used 360° feedback as a tool for targeted personnel and organizational development for many years. The concept was revised in 2011 to take account of the updated competency model. Evonik’s pioneering role was highlighted in 2011 when Executive Board members took part in the 360° feedback process. The message is that a feedback culture is not just an empty phrase; it is a clear obligation and above all, an opportunity for development. All Group executives will be following their example and taking part in the 360° feedback process in 2012.
Diversity—The driving force behind creativity and innovationWe regard diversity as a real asset for the company because it creates a lasting basis for creativity and innovation and therefore enhances our competitiveness. With this in mind, the Executive Board adopted a diversity strategy at the start of 2011. The aim is to foster diversity through teams that span differences of age and experience and bring together employees of different nationalities, genders and educational backgrounds.
Given the strategic significance of diversity, it has been integrated into the process of agreeing objectives with our Group executives. Moreover, in 2011 more than one hundred Group executives attended full-day Mindset Workshops where they discussed the various aspects of diversity and the challenges they pose for day-to-day management.
To supplement this, we also launched “Women@Work”, a seminar format designed to meet the specific needs of female managers and specialists. At the end of the year, participants from Germany met up for a first national networking day.
Employability and quality of life—”Well at work”There are many reasons for Evonik’s long-standing efforts to find ways of ensuring that employees retain their employability and, as an inseparable element of this, maintain and improve their quality of life. Examples include demographic change, the increase in lifestyle-related diseases and the increasing pressure of work, caused, for example, by constant availability and the fact that the boundaries between leisure and worktime are becoming less clear-cut. Many of Evonik’s sites actively addressed these issues over the years. Last year the focus was on drawing together the initiatives already in place and developing a Group-wide concept. The “Well at Work” program is designed to strengthen our employees’ physical and mental well-being and is scheduled for introduction in Germany in the second quarter of 2012. Our goal is to give greater prominence to the principles of “Well at Work” and raise employees’ awareness of the related issues. Common basic standards and a best-practice approach are therefore planned. In the longer term we plan to roll out this concept internationally.
Headcount in 2011At year-end 2011 the Evonik Group had 33,556 employees, around 23 percent of whom were female. The average age of the workforce was 41.4 years. 35 percent were employed outside Germany. The number of employees declined by 5,767, mainly because of divestments. About 5,500 employees left the company as a result of the divestment of a majority of the shares in STEAG. That was above the level reported at year-end 2010, principally because of the acquisition of an energy company in India in January 2011. The headcount in the Resource Efficiency segment decreased by around 1,450 employees as a result of the divestment of the carbon black business.

Annual Report 2011 Evonik Industries58
Employees by segment
Dec. 31, 2011 Dec. 31, 2010
Consumer, Health & Nutrition 6,384 6,326
Resource Efficiency 6,381 7,874
Specialty Materials 6,846 6,789
Services 10,946 10,616
Real Estate 1,135 1,098
Other operations 1,864 1,704
Continuing operations 33,556 34,407
Discontinued operations (Energy) 0 4,916
Evonik 33,556 39,323
Age structure in the Evonik Group
in %
Under 21 years
21 – 25 years
26 – 30 years
31 – 35 years
36 – 40 years
41 – 45 years
46 – 50 years
51 – 55 years
56 – 60 years
Over 60 years
0 2 4 6 8 10 12 14 16
Employees by region
Asia 13%
North America 12%
Other European countries 8 %
Central and South America 1%
Other 1% Germany 65%
4
8
9
10
12
15
17
15
8
2

59Management report Consolidated financial statements Supplementary information
Corporate responsibility
Environment, safety and healthIn view of the global challenges, we still regard a long-term focus and sustainable conduct as vital to ensure lasting success on the market. Environment, safety and health (ESH) are central elements of our corporate responsibility and play a key role in our obligation to implement the global Responsible Care principles. Our binding Group-wide rules, which have been audited externally, are permanently monitored by a large number of internal audits of business units, regions and sites. In 2011 we conducted 25 audits around the world. Over 95 percent of our global production has been validated externally as conforming to ISO 14011, the internationally recognized environmental management standard.
Progress in occupational and plant safetyMeasured by accident frequency (number of accidents at work involving company employees and contractors’ employees receiving direct instructions from Evonik per million hours worked), our occupational safety performance was unchanged from the previous year at 2.1. There was one fatal accident involving a contractor at our Tippecanoe site in the USA. Excluding the Real Estate segment, accident frequency increased from 1.3 to 1.5, which is the maximum level set by Evonik. Since the main reasons for the year-on-year rise could be identified locally, specific measures have been agreed to achieve a reduction in accident frequency in 2012.
Accident frequency1)
2011 2010
Chemicals operations including Services 1.5 1.3
Real Estate (Wohnen) 1.1 2.3
Real Estate (other activities) 28.2 42.0
Continuing operations 2.1 2.1
Discontinued operations (Energy) − 5.2
Total 2.1 2.5
1) Number of accidents at work involving company employees and contractors’ employees receiving direct instructions from Evonik per million hours worked.
Evonik conducted its first Group-wide survey on safety culture and occupational safety at the end of 2011. The survey was targeted at around 50 percent of employees and about two-thirds of them responded. We see the results of this survey as a leading indicator for a common under-standing of safety at Evonik. The business units and sites will define action to be taken on the basis of an analysis of the results. When the survey is repeated in 2013, it will be extended to cover all employees.
Safe and reliable operation of production plants is extremely important to protect our employees and local inhabitants, and thus essential for the success of our business. We aim to steadily improve plant safety and further reduce the number of incidents involving the release of substances, fires and explosions.

Annual Report 2011 Evonik Industries60
To achieve this and to avoid incidents even if they cause little or no damage, we introduced a plant safety indicator in 2008 to systematically record minor substance releases that do not have to be reported to the authorities. With the aid of this proprietary lagging indicator, we compile data on the number and frequency of unplanned releases of substances, fires and explosions on the basis of uniform criteria. There has been a clear reduction in both substance releases and damage since the introduction of this indicator. In 2011 there were no incidents at any of our production sites that had a major impact on people or the environment. There was one incidence of an unplanned substance release at our site in Mapleton (Illinois, USA) that did not represent a danger to the environment or to people but had to be reported to the relevant authorities. The plant safety indi-cator has dropped steadily since 2008 and was 52 points in 2011 (2008 reference base: 100 points). In addition, we calculate the frequency of incidents per million hours worked. This normative approach enables us to compare the development over time and derive internal benchmarks.
Like occupational safety, plant safety is regarded as a management task at Evonik. We have therefore developed new Group-wide indicators. The leading indicator for plant safety is designed to show the extent to which the business units with production operations are aware of their management responsibility for plant safety at our sites and production facilities. It will be integrated into our regular audits from 2012.
Evonik’s crisis team in actionThe earthquake in Japan, the resulting tsunami and the reactor catastrophe in Fukushima in March 2011 tested Evonik’s crisis management. Although our production plants in Japan did not sustain any major damage, support had to be provided for our staff in Japan and German employees on assignments there. We set up an information platform in the intranet to provide access to up-to-date local news and assessments by our local crisis management team. Our sites in Germany received advice on how to deal with products from Japan. In response to requests from customers, we also provided information on compliance with our duty of care in the procurement of raw materials from Japanese suppliers. Experience gained from this incident has been incorporated into our contingency planning to help us respond even better to natural disasters in the future.
Environmental protection costs and expenses for environmental protection equipmentTo achieve a further improvement in environmental protection, in 2011 we invested €48 million (2010: €36 million) in effective end-of-pipe technologies and process-integrated environmental protection measures. This comprised a large number of individual investments. For example, in Wesseling (Germany) we invested in flood protection and protection of the groundwater, in Rheinfelden (Germany), an additional activated carbon absorption plant was installed, while in Essen (Germany) an exhaust gas scrubber was replaced and floor coatings were refurbished. Measures were taken in Rheinmünster (Germany) to control air pollution following capacity expan-sions, and in Krefeld (Germany) to reduce wastewater loads. In Antwerp (Belgium) a wastewater collector tank was modified, the central container warehouse was extended and extractors and exhaust gas pipes were optimized.
Operating costs for environmental protection facilities amounted to €251 million in 2011 (2010: €264 million). The decline was partly attributable to the divestment of the carbon black business and a temporary reduction in costs for REACH.
At a glance
Audited: 25 internal audits confirm implementation of ESH rulesValidated: Over 95 percent of chemicals production conforms to ISO 14001Improved: KPIs for plant safety extended—improvement compared with previous yearSurvey: 50 percent of Group employees surveyed on safety culture and occupational safetySustainability: Sustainability indicators will be integrated into investment and acquisition decisions in the future

61Management report Consolidated financial statements Supplementary information
Corporate responsibility
Sharp drop in EU ETS CO2 emissions due to divestment of the carbon black businessMany facilities operated by Evonik fall directly within the remit of the European regulations on trading in CO2 emissions allowances (EU ETS). CO2 emissions from these plants totaled around 3.6 million metric tons1) in 2011 (2010: 4.2 million metric tons). The difference was attribut-able to the divestment of the carbon black business, as its emissions are no longer included from August 2011.
The EU ETS program for the period from 2013 has now been clarified. The allocation mechanisms for the third trading period—based on benchmarks—have been approved and applications for allowances have been completed. Significant reductions in the number of allowances allocated are likely as no allowances will be allocated for power generating facilities. The cross-sector reduction factor has not yet been decided. It will probably be published by the EU in mid-2012 and will additionally reduce the allowances allocated. The final allocation decisions for individual plants are not expected before fall 2012. Only then will the exact allocation of free emissions allowances be known, so that the probable shortfall can be calculated.
As a result of the economic uncertainty resulting from the euro crisis, market prices for emissions allowances dropped from around €18–20 per metric ton CO2 in the first half of 2011 to around €6–7 per metric ton at the end of the year.
Continued progress with sustainability performance Evonik’s carbon footprint was determined for the first time in 2008 and has been continuously updated since then. Alongside direct greenhouse gas emissions from production plants, we also monitor other emissions such as those resulting from the production of our raw materials (CO2e2) backpack) and the disposal of our products. For a number of products we also examine emissions reductions through the use/benefit of the products to our customers. Both Evonik’s carbon footprint and the method used to calculate the CO2e saving potential have been examined by external auditors. To assess the climate impact of our future activities we use this method to quantify savings in greenhouse gas emissions and, in our strategic research, to evaluate the expected CO2e footprint of innovations.
We will be participating in the Carbon Disclosure Project (CDP) for the first time in 2012. This global initiative by the financial community aims to raise transparency about greenhouse gas emissions. It should help us identify and evaluate further opportunities and risks to the company resulting from climate change and derive relevant management processes and business activities.
In future we intend to use sustainability indicators in our investment and acquisition decisions as well. The parameters will be used for strategic management of our business lines.
In 2011 we therefore examined the main ecological and societal indicators used to measure CR and sustainability. Aspects such as energy efficiency, CO2 intensity, water consumption, waste volumes, recycling, the use of renewable raw materials, plant safety, occupational safety, diversity, demography and sustainable customer benefits are taken as the basis for assessing our CR and sustainability activities. In 2012 we intend to apply the method we have developed in two business units.
1) Provisional.2) CO2e = CO2 equivalents (CO2 and other greenhouse gases).

Annual Report 2011 Evonik Industries62
Responsibility and product lifecycles Evonik implements product stewardship through the Chemicals Management System (CMS). The substance-specific hazards identified and analyzed through this system allow a prompt response. In this way we meet our voluntary commitments to the Responsible Care initiative, and the Global Product Strategy (GPS) of the International Council of Chemical Associations (ICCA). The CMS therefore plays a role in the development of a sustainable and forward-looking product portfolio. In addition, Evonik is raising transparency, improving communication along the product chain and provides generally understandable information on chemicals (GPS Safety Summaries) on its website.
REACH—Implementation and outlookBy the end of the first registration phase under the EU chemicals regulation REACH (Registration, Evaluation, Authorisation and Restriction of Chemicals) in late 2010 Evonik had registered 167 pre-registered substances and further substances without pre-registration status. This required us to collaborate with competitors in Substance Information Exchange Forums (SIEFs). We assumed leadership of the SIEFs for more than half of the substances. Around 130 further substances were registered in 2011. This again involved the submission of extensive dossiers. In addition, we were able to increase customer loyalty and the reliable sourcing of raw materials from our suppliers through intensive dialogue. We will probably register about 160 further substances in the present second registration phase, which covers substances with production volumes of between 100 and 1,000 metric tons p.a. and runs until May 31, 2013.

63Management report Consolidated financial statements Supplementary information
Events after the end of the reporting periodRisk report
(10) Events after the end of the reporting period
Following the transfer of the shares in Degussa AG to Evonik Industries AG pursuant to Section 327 a ff of the German Stock Corporation Act (AtkG) in 2006, the appropriateness of the cash compensation payment of €45.11 per share paid at the time was examined by Düsseldorf Regional Court in an appraisal process.
On February 6, 2012 an appraiser appointed by the court submitted a report on the appropriateness of the cash compensation payment. The conclusion was that a higher payment would have been appropriate. Evonik regards the adjustments outlined in the report as incorrect and still considers that the cash compensation payment was appropriate. We will therefore be responding accordingly to the report.
(11) Risk reportRisk strategyEvonik is exposed to a variety of risks in the course of its business activities. Risk management therefore forms a central element in the management of the company and is geared to targeted management of risk with a view to securing present and future potential for success and avoiding, preventing, countering and minimizing risk. We only enter into entrepreneurial risks if we are convinced that they can generate a sustained rise in the value of the company and that we are able to control any possible implications.
Structure and organization of risk management Evonik has an internal risk management structure covering the entire Group. Alongside organizational measures and internal control systems, this is supported by Corporate Auditing as a process-unrelated controlling and consulting body.
Risk management is organized on a decentralized basis in line with Evonik’s organizational structure. The business units, Corporate Center and service units bear prime responsibility for the early identification of risks, estimating their implications, introducing suitable preventive and control measures and for the related internal communication. Risk Coordinators within the organizational units are responsible for coordinating the relevant risk management activities. A central risk officer coordinates and oversees the processes and systems. He is the contact for all risk officers and is responsible for information, documentation and coordination at Group level. Further responsibilities include ongoing development of the methodology used by the risk management system. A Risk Committee was established in 2010. It is chaired by the CFO and includes representatives of the Corporate Center and the business units. The role of the committee is to validate the Group-wide risk situation and to verify that it is adequately reflected in financial reporting.

Annual Report 2011 Evonik Industries64
Risk management is a central element in Evonik’s controlling processes at all levels in the Group. That includes strategic and operational planning, preparations for investment decisions, monthly reporting and projections, and, from a certain level, immediate reporting of risks. The organizational units conduct an extensive annual risk inventory in connection with the mid-term planning process. Special risk management software introduced in 2010 is used for this. All risks are systematically identified and documented and the probability of the risks occurring and the potential damage are evaluated. The organizational units are required to provide details of action to be taken with regard to risks identified in the risk inventory and track their timely implementation. The annual risk inventory, which looks at risks on the basis of deviation from planned net income over a period of one year and at least five years, is supplemented by a quarterly review of all risks and monthly risk reports on changes in risk factors previously identified and newly identified risks for the current year. A binding policy on risk management has been issued.
In fiscal 2011 Corporate Auditing inspected risk management during its audits of the organizational units and established that they comply with statutory and in-house requirements. In addition, the system used to identify emerging risks is included in the annual audit in the same way as for listed companies. This showed that Evonik’s risk detection system is suitable for timely identification of risks that could pose a threat to the company’s survival.
Overall risk assessmentGiven the measures planned and implemented, no risks have been identified that—either individually or in conjunction with other risks—could jeopardize the continued existence of Evonik. In accordance with our risk catalog, we monitor risks on the basis of the four categories defined by the COSO Enterprise Risk Management model: strategic, operational, compliance/legal and financial.
Due to the fields in which it operates, the Evonik Group is confronted with constantly changing national and international political, societal, demographic, legal and economic operating conditions. To counter the resultant risks we monitor our business environment closely, anticipate market trends and consistently develop our portfolio in conformance with our corporate strategy.
In all, 2011 was another successful year for Evonik, following on from an excellent year in 2010. In particular, the chemical segments registered a further strong increase in demand in the first six months of 2011 and utilization of production capacities was once again very high. Further, selling prices were increased, enabling us to recoup higher raw material costs. As a result, earnings and cash flow risks were low in 2011.
1. Strategic risksPlans to grow the chemicals business through investment in attractive markets and acquisitions entails certain risks as regards the planned scope and timing of projects. These risks are addressed through established, structured processes, as outlined below.
Market and competition risksOne general risk factor is the intensive competition in some market segments. In particular, com-petitors in low-wage countries increase competitive pressure through aggressive pricing policies. To counter this we are broadening our foreign production base and gaining access to new markets in high-growth regions such as Asia and South America. The operating units affected also use various methods of increasing customer loyalty to reduce these risks. These include, in particular, strategic research alliances with customers and improving the services offered. We are constantly developing attractive and competitive new products to counter the risk that chemical products could be replaced by new, improved or less expensive materials or technologies. Alternatives also have to be found for certain raw materials subject to the REACH Regulation which may no longer be available in the future.

65Management report Consolidated financial statements Supplementary information
Risk report
The Real Estate segment uses a strategic mixture of modernization, demolition and new con-struction, supplemented by selective acquisition of attractive residential properties, to avoid the risk of a possible deterioration in the value and earning power of its portfolio due to regional or demographic factors.
Acquisition and divestment risksActive portfolio management, combined with value-based controlling, has high priority at Evonik. Our operating units are permanently screened for sustainable profitability and to ensure they fit the corporate strategy. The strategic development of Evonik may entail the expansion of specific operations, divestment or gaining a foothold in completely new fields of business. Evonik has defined structured processes for all of these alternatives.
Where it is not possible to strengthen business operations through organic growth, other companies or business operations are acquired. We have set out clear procedures for preparing, analyzing and undertaking acquisitions. In particular, these include clear rules on accountability and approval processes. For example, an intensive examination of potential acquisition targets (due diligence) is undertaken before they are acquired. This involves systematic identification of all major risks and opportunities and an appropriate valuation. Key aspects of this process are strategic focus, management quality and development potential and any legal, financial and environmental risks. New companies are rapidly integrated into the Group and thus into our risk management and controlling processes.
Any restructuring or divestment requirements relating to the strategic management of the Evonik Group are also systematically implemented. Post-transaction management closely monitors any liability and guarantee risks resulting from divestments. In connection with the divestment of the former energy business (STEAG), Evonik is exposed to risks arising from contractually agreed indemnification arrangements, relating, among others, to a new coal-fired power plant that has not yet come into service as a result of technical problems. Provisions have been established for these risks.
2. Operational risksIn view of the typical business-related dependence on external parameters, especially in the chemicals business (for example economic cycles and raw material prices), action to reduce operational risks is of central importance.
Sales and marketing risksThe customer base in the chemicals segments means they are only exposed to low cluster risks. However, some operational units have a certain dependence on key customers. A decline in demand from the industries served or a deterioration in the competitive position of customers could adversely affect the chemicals business. We respond to these risks by permanent monitoring of the market, acquiring new customers, and efforts to establish new applications and gain access to new markets as early as possible.
Procurement risksThe availability of starting products and intermediates and dependence on commodity and energy prices are further potential risk factors. The chemical segments are particularly dependent on the development of the price of crude oil and petrochemical feedstocks derived directly or indirectly from oil. They are also dependent on exchange rates, which have a major influence on both commodity and energy costs. We counter these risks by optimizing global purchasing activities, entering into long-term supply contracts and agreeing price formulae with established suppliers wherever possible or finding alternative suppliers. We also investigate the possibility of using substitute raw materials for various production processes and are working to develop alternative production technologies. As a result of high demand and short supply of some products, in 2011

Annual Report 2011 Evonik Industries66
we were able to recoup part of the renewed rise in procurement costs compared with 2010 by raising selling prices. The competitive situation means that cost rises cannot always be passed on to customers through price rises either immediately or in full.
Production risksAs an industrial corporation, Evonik is exposed to the risk of business interruptions, quality problems and unexpected technical difficulties. Group-wide policies on project and quality management effectively reduce these risks. Production stoppages due to plant failures are insured. Moreover, all facilities undergo thorough maintenance and employees receive appropriate initial and ongoing training.
Human resources risksThe skills and knowledge of our highly qualified managers and employees are vital to achieve the strategic and operational objectives of the organizational units. To ensure that we can recruit and retain qualified staff to meet our future requirements we offer attractive remuneration systems and systematic personnel development, giving employees a wide range of opportunities to develop and enhance their personal and professional abilities. We also maintain close links to universities and professional associations to help us recruit talented youngsters.
3. Compliance and legal risksCompliance risksCompliance risks relate to compliance with regulations and ethically correct business conduct. All Evonik employees are subject to the binding regulations on fair treatment of each other and of business partners set out in our Code of Conduct. The compliance issues regarded as particularly important from Evonik’s viewpoint are combined in a “House of Compliance”1). To minimize compliance risks, extensive training and sensitization of employees is undertaken at classroom-based training sessions and/or through e-learning programs.
The issues grouped at the “House of Compliance” include fighting corruption, data protection, IT compliance, know-how protection and antitrust and foreign trade law.
Data protection and IT compliance risksGroup-wide rules and regulations provide details of how to handle information and on the secure use of information systems. Modern information security and data protection technologies are used throughout the Group to avoid such risks. Appropriate procedures and state-of-the-art technical protection are installed to counter the risk of potential unauthorized access and the loss of data. These are expanded and adapted to the constantly changing risk situation to ensure that we have adequate protection against potential risks in the future. Internal communication methods such as IT security campaigns are used to heighten employees’ awareness of the need for security in the handling of information technology.
Know-how protection risksThe company is also exposed to a risk that intellectual property cannot be adequately protected, even through patents, especially when building new production facilities in countries like China. The Group-wide Intellectual Property Management (IPM) unit supports the operational units in protecting, developing and utilizing intellectual property and patents. It is assisted by a worldwide network of correspondent lawyers.
1) The Corporate Governance Report is contained in this annual report (see page 180).

67Management report Consolidated financial statements Supplementary information
Risk report
Legal risksEvonik is exposed to risks relating to legal disputes, administrative proceedings and fines. Similarly, guarantee claims against the company may result from divestments. In its operating business, the Group is exposed to liability risks, especially in connection with product liability, patent law, tax law, competition law, antitrust law and environmental law. We have developed a concept involving high quality and safety standards to ensure a controlled approach to such risks. Insurance cover has been purchased for the financial consequences of any damage that may nevertheless occur as a result of damage to property, product liability claims and other risks. Where necessary, provisions have been set up for such risks.
Environmental risks (environment, safety, health, quality)As an industrial corporation, Evonik is exposed to risks in the fields of plant safety, product safety, occupational safety and failure to comply with other environmental regulations. Group-wide policies on the environment, health and safety effectively reduce these risks. Moreover, audits are conducted at the request of the Executive Board to check the controlled handling of such risks. Furthermore, our environment and safety management systems, which are validated as con forming to international standards, undergo constant development and improvement. Adequate provisions have been established to secure or remediate contaminated sites where necessary. As a responsible company with significant chemical activities, Evonik ensures that such processes are operated in accordance with the principles of the global Responsible Care initiative and the UN Global Compact.
4. Financial risks For financial risk management purposes, Evonik follows the principle of separation of trading, risk controlling and back office functions and takes as its guide the banking-specific “Minimum Requirements for Risk Management” (MaRisk) and the requirements of the German legislation on corporate control and transparency (KonTraG). Binding trading limits, responsibilities and controls are thus set in accordance with recognized best practices, and Group-wide policies and principles are in place. All financial risk positions in the Group have to be identified and evaluated. This forms the basis for selective hedging to limit risks.
Credit risks relating to financial contracts are systematically examined when the contracts are concluded and monitored continuously afterwards. Ceilings are set for each counterparty on the basis of internal or rating-based creditworthiness analyses.
Details of the financial derivatives used and their recognition and valuation can be found in Note (10.2) to the consolidated financial statements.
Interest and exchange rate risksIn the course of its business, Evonik is exposed to the risk of changes in exchange rates and interest rates. A detailed overview of interest rate and foreign exchange management and the use of financial derivatives is given in Note (10.2) to the consolidated financial statements and Note (27) to the annual financial statements of Evonik Industries AG.

Annual Report 2011 Evonik Industries68
Liquidity risks At the heart of Evonik’s central liquidity risk management is a Group-wide cash pool. In addition, the Group’s financial independence is secured through a broadly diversified financing structure. A detailed overview of liquidity risks and their management can be found in Note (10.2) to the consolidated financial statements.
Details of the financing of the Evonik Group and action to protect liquidity can be found on page 22 (Financial condition).
Overall, Evonik believes that adequate financing instruments are available to ensure sufficient liquidity at all times.
Internal control system for financial accounting The main financial reporting risks are identified through the internal control system (ICS), which is based on a quantitative and qualitative analysis. Controls are defined for each risk area of the accounting process. Their efficacy is tested by Corporate Accounting at regular intervals and improved where necessary. All elements of the control process are verified by Internal Auditing on the basis of random samples.
To ensure the quality of financial statements we have a Group-wide policy which defines uniform accounting and valuation principles for all German and foreign companies included in the consolidated financial statements for the Evonik Group. The majority of companies have delegated the preparation of their financial statements to Evonik Business Services (EBS). Through systematic process orientation, standardization and utilization of economies of scale, this leverages sustained cost benefits and can also improve the quality of accounting. EBS is validated annually in confor-mance with German audit standard IDW 951. An external audit is conducted on the annual financial statements of more than 95 percent of companies.
All data are consolidated centrally in the Corporate Center using SAP SEM-BCS. Group companies submit their financial statements via a web-based interface. A range of technical validations are performed at this stage. Computerized and manual process controls and checking by a second person are the key oversight functions performed in the financial reporting process. The preparation of the monthly consolidated income statement and three full quarterly reports allows us to gain experience with new accounting issues and provides a good basis for plausibilization of the year-end accounts. The Executive Board receives monthly reports and quarterly reports are submitted to the Audit Committee of the Supervisory Board.
Aspects that may represent opportunities or risks for financial reporting in the future are identified and evaluated as early as possible through the integrated risk management system (RMS). This ensures that risk management can be closely aligned to controlling and accounting processes.

69Management report Consolidated financial statements Supplementary information
Report on expected developments
(12) Report on expected developments Global economic conditionsModerate growth in the global economy in 2012On the basis of our internal analyses, which are derived from the evaluation of a variety of reports and our own estimates, we expect global GDP to grow by 2.7 percent in 2012. Economic growth will probably be dominated by widening discrepancies in regional growth rates. In our view, sluggish consumer spending and fiscal saving programs in many industrialized countries are likely to result in weaker growth in 2012 than in 2011. There is some uncertainty regarding the global economic trend in 2012. At present it is difficult to predict how major growth drivers will develop. Moreover, it is still unclear what course the European sovereign debt crisis will take and whether it could have far-reaching implications for global growth.
In the euro zone, which is a particularly important market for us, we expect economic output to contract by 0.7 percent year-on-year in 2012. Our outlook for the euro zone is based on a slight recession at the end of 2011/start of 2012 caused by the increased efforts by many European countries to reduce their budget deficits and persistently high unemployment, which is still high. Although we anticipate an economic upturn in this region during 2012, growth rates in the various euro zone countries will vary. We expect Germany’s gross domestic product to post a slight rise of 0.2 percent compared with 2011.
For the major industrialized countries outside the euro zone we are predicting moderate growth. Our estimate for the USA is that the economy will probably grow by around 1.8 percent again in 2012. Unusually high unemployment is still holding back consumer spending, which is a major prop of US growth. We expect the Japanese economy to pick up considerably, growing by 2.9 percent following a perceptible drop in 2011. That could place Japan among the fastest growing industri-alized countries in 2012.
In our view, the emerging markets and developing countries (non-OECD states), especially China, will remain the bulwark of global growth, with total growth coming in at 5.4 percent. In China, the driving force of the global economy, we expect gross domestic product to increase by 8.0 percent in 2012. At the same time, we see a greater risk that the pace of growth in China will slow. That said, lower inflationary pressure in 2012 could give the Chinese government leeway to stimulate growth. A slowdown of the Chinese economy would have a clear implication for global growth expectations for 2012.
Development of specialty chemicals and key customer industriesAccording to our estimates, global industrial output will continue to grow in 2012. Our assumption is that it will rise by 3.5 percent, driven mainly by emerging markets and developing countries (plus 5.7 percent). For the industrialized countries we assume an increase of 2.3 percent.
Despite lower demand from its most important markets in Europe, we expect China (plus 10.9 percent) to remain the driving force behind global growth. Rising domestic demand and south-south trade suggest that industrial output is only likely be slightly lower than in 2011. Turning to the euro zone, our forecast is for a slight drop in industrial output. Even Germany will probably experience a loss of momentum as it seems unlikely to escape the negative European environment.

Annual Report 2011 Evonik Industries70
Globally, we expect key industries served by the specialty chemicals sector to increase output in 2012 but we assume there will be considerable variations between different industries and regions. For the food and pharmaceutical industries, we are forecasting robust growth in line with the long-term average. In the market for personal care products, lower consumer sentiment in Europe and the USA could trim the high growth rates seen in recent years. Global output in other important sectors in 2012, for example, the automotive and construction industries, will probably grow at about the same rates as in 2011. The automotive industry is most likely to see growth slowing in Asia. Nevertheless, global demand for cars should again receive strong growth impetus from the USA. Output in the paints and coatings industry should rise faster in 2012 than in 2011, while the electronics and information and communication technology sectors could continue to report above-average growth this year.
Given the global economic trends and conditions outlined for industries served by the specialty chemicals sector, we assume that this sector should be able to lift output by 3.2 percent in 2012. While the high momentum in China should be almost on a par with 2011, the general economic situation in Europe and the USA is likely to leave a mark on the specialty chemicals sector. Nevertheless, we are still anticipating growth in both Germany and the euro zone. In the USA, the sector growth rate is likely to lag overall industrial growth despite positive impetus from an improved competitive situation.
In our view, global inflation risks should decline in 2012 as economic momentum drops, and this should be visible on the commodity markets. We predict that in 2012 the oil price (Brent crude) will not be significantly above the average of just over US$111 per barrel seen in 2011. However, risk factors here include geopolitical factors such as the Iran conflict, which could adversely affect supply. Pressure on the euro is likely to persist as a result of the sovereign debt crisis, but we do not expect the exchange rate versus the US dollar to vary much from the exchange rate at year-end 2011.
Mid-term expectations for the global economySince it is not yet possible to assess how the sovereign debt crisis in Europe will develop, and there are also uncertainties regarding regional trends, forecasting mid-term growth in the global economy entails a high degree of uncertainty. Fundamentally, our mid-term forecast is that global growth will be above the level forecast for 2012. Drivers will be global megatrends, including the growing number of inhabitants in emerging markets who want to participate in global consumption, and new needs resulting from population aging in the industrialized countries.

71Management report Consolidated financial statements Supplementary information
Report on expected developments
OpportunitiesOur strategic focus on high-growth, high-margin specialty chemicals business should give Evonik access to further profitable growth opportunities. Above all, we want to benefit from global megatrends such as health, nutrition, resource efficiency and globalization. At the same time, we are stepping up our commitment to attractive emerging markets and regions where we see especially high potential due to the economic momentum. These are Asia, especially China, South America and the Middle East. In future, we will have an increased presence through our own production facilities. To this end, we have driven forward significant investment projects.
Opportunities offered by the health and nutrition megatrendsThere are very good business prospects for DL-methionine for healthy and environmentally compatible nutrition of livestock. Along with growth in the world population, demand for food based on animal protein is rising. Moreover, in Asia the emergence of an affluent middle class is altering eating habits, resulting in higher meat consumption. To enable us, as the global market and technology leader, to utilize the opportunities offered by rising demand, we plan to raise production capacity for DL-methionine in North America and Europe to a total of 430,000 metric tons by about 2013. We want to exploit market potential in the high-growth Asia-Pacific region even more effectively in the future. To achieve this, we are erecting a new backwardly integrated production complex for DL-methionine in Singapore, which is scheduled for completion by 2014. This should raise total capacity to 580,000 metric tons p. a.
Another attractive new market offering additional potential for methionine is aquaculture. Here, we have developed products that are an optimized source of methionine for shrimps and other shellfish. Given the scarcity of natural resources, benefits include saving valuable fishmeal, raising the efficiency of feed for fish and shellfish, and reducing environmental impact through lower nitrogen emissions.
In emerging markets, there is rising demand from the affluent middle class for personal care products and cosmetics. Looking forward, we expect that in the next few years South America will become the world’s second-largest market for personal care products, with China in third place. We intend to make intensive use of these growth opportunities by constructing new production facilities for oleochemical specialty surfactants in China and Brazil, which should start come into service in 2013/2014.
Opportunities offered by the resource efficiency megatrendIn addition, we utilize opportunities offered by the trend to renewable energies and efficient use of natural resources. One new specialty product from Evonik is a hydroxy-terminated poly-butadiene, which we expect to start producing in a new facility in Marl (Germany) in fall 2012. Applications for this novel polymer material include sealants for triple glazing with high insulating properties and lightweight components for vehicles.
The trend to renewable energies is driving demand for isophorone diamine, which is used as a curing agent in the production of rotor blades for large wind turbines. To utilize the attendant market potential, Evonik is building a new production complex for isophorone and isophorone derivatives in Shanghai (China). This is scheduled for completion by the end of 2013. We hope to derive especial opportunities from the fact that we are the first—and at present only—company with a production site for ispohorone chemicals in the attractive, high-growth Asian market.

Annual Report 2011 Evonik Industries72
Opportunities offered by the globalization megatrendProgressive globalization offers further opportunities for our specialty chemicals business. Production of biodiesel is growing fastest in South America. We aim to serve this attractive market through a new facility in Argentina, which will produce alcoholates as catalysts for biodiesel production. It is scheduled for start-up at the end of 2012. At present we produce these specialty catalysts in Germany and the USA.
Global growth will also be driven by new applications for existing products. One example is the hydrogen peroxide to propylene oxide (HPPO) process developed by Evonik and Uhde. Propylene oxide (PO) is a key starting product for polyurethane and the market for this product is growing particularly fast in Asia. The world’s first HPPO facility licensed by Evonik and Uhde came on stream in Ulsan (South Korea) in summer 2008. A new HPPO production complex is currently under construction in the Chinese province of Jilin in conjunction with a strategic partner. Evonik will supply hydrogen peroxide to this facility over the fence from a new facility. Start-up is scheduled for the end of 2013.
Innovative capability opens up new business opportunities1) We derive opportunities for additional specialty chemicals business principally from our own innovative capability. Sales generated by products and applications developed in the past five years amounted to €1.9 billion in 2011. With 450 short-, mid- and long-term projects under way, we believe we have a well-stocked and balanced innovation pipeline.
To supplement our present innovation processes and structures, we plan to invest up to €100 million in promising start-ups through our Corporate Venturing unit in the coming years, either directly or indirectly through specialist venture capital funds. This should speed up the development of new business and future growth areas.
We also use our strong R&D competence to refine Evonik’s integrated technology platforms and gain access to tomorrow’s markets. Alongside the HPPO process, the AVENEER process is a good example. AVENEER is a convincing new process which has economic and environmental benefits in the production of methylmethacrylate. We intend to build a world-scale production facility to enable us to utilize the resultant business opportunities.
In keeping with our corporate strategy, we are also stepping up R&D in attractive emerging markets. R&D and applications technology geared to local needs improve the competitiveness of our customers in these regions and open the door to new markets for Evonik.
Opportunities offered by active portfolio managementOur active portfolio management generates additional opportunities for Evonik. Businesses that no longer fit our strategy or no longer meet our profitability requirements are divested. In 2011, we therefore divested the carbon black operations and the plastic additives business. In the coming years, by contrast, our portfolio activities are expected to focus on acquisitions to support our growth strategy. In 2011, we gained access to high-growth products, markets and technologies through selective acquisitions. These include controlled-release pharmaceuticals for parenteral applications (injections) from Boehringer Ingelheim and SurModics, which are an excellent com-plement to our established pharmaceuticals business. Acquisition of the hanse chemie Group has paved the way for rapid entry into other markets for specialty applications based on silicone chem-istry. Moreover, by acquiring the hydrogen peroxide business of Kemira Chemicals Canada with a production facility in Maitland (Canada), we have established a key logistics triangle in North America, together with our plants in Gibbons (Canada) and Mobile (Alabama, USA). We now have a leading position in the region, giving us attractive new market and volume potential.
1) Further information can be found in the section on research and development on page 28.

73Management report Consolidated financial statements Supplementary information
Report on expected developments
Opportunities offered by improving our cost positionThrough our On Track program we achieved annual savings of €500 million by the end of 2011—one year earlier than originally planned. That has made Evonik far more competitive. In future, too, we will be systematically working to raise the efficiency of the Group.
Our Operational Excellence experts play an important role in this: Their remit is to achieve lasting productivity improvements in our operating facilities. The main focus is on cost efficiency, optimizing the use of raw materials and energy, and systematically sharing best practices within the Group.
Opportunities offered by a secure raw material supplyGaining access to additional sources to complement our own procurement activities helps safeguard the supply of raw materials to our specialty chemicals operations. In 2011 we therefore participated in the preparations led by the Federation of German Industries (BDI) for an alliance to secure the supply of raw materials to German industry.
Regular review of opportunities Evonik regularly reviews potential opportunities as part of the strategic planning process. Our Corporate Foresight team identifies sound future business opportunities on a 10–15 year time horizon. It focuses on future needs: Trend analyses are used to identify the challenges that will confront tomorrow’s markets and where they interface with or offer development potential for our specialty chemicals portfolio.
Outlook 2012 should be a successful year despite the economic uncertainty There are significant uncertainties surrounding the economic development in 2012, making it difficult to predict. Moreover, it is not clear how the European sovereign debt crisis will develop and to what extent it could have far-reaching implications for global growth. These economic uncertainties also affect the outlook for Evonik.
Moreover, in our outlook for 2012 it should be noted that in 2011 the figures for the carbon black business were included in our financial results until its divestment at the end of July. To improve comparability, the following guidance is based on figures after stripping out the carbon black business.
Assuming that the forecast trends outlined in the section “Global economic conditions” materialize, we expect another good business performance. We are expecting continued high demand for our specialty chemicals products, although the expected economic slowdown in Europe and some industries, especially in the first half of 2012, could have an impact on our business. Pres-sure on selling prices is likely to increase as a result of the more challenging economic environment. Overall, we assume that sales will be around the high level of 2011. The operating results will prob-ably be slightly below the excellent level reported for 2011.
If the economic slowdown in Europe and the drop in demand in specific industries proves less pronounced than we have assumed, we expect our operating results to be in line with or even slightly above the excellent 2011 level.

Annual Report 2011 Evonik Industries74
Higher investmentAs outlined in detail in the section on “Opportunities”, we have initiated significant investment projects as part of our growth plans, especially in attractive economic regions. Overall, we have earmarked more than €6 billion for this over the next five years (2012–2016). Our investment budget for 2012 is €1.3 billion so capital expenditures will be well above depreciation. We plan to finance investments entirely out of our free cash flow.
Net debt has been reduced significantly in recent years and is already at a low level. We therefore assume that it will remain basically unchanged in 2012.
Development of the segmentsThe Consumer, Health & Nutrition segment should continue to perform very well as a result of sustained high demand. By contrast, we anticipate that in the first half of 2012 the business trend in the Resource Efficiency and Specialty Materials segments could be affected by a temporary economic dip in Europe and in some industries. Nevertheless, we expect both segments to return to a positive trend from the second half of the year. For the Services and Real Estate segments we are forecasting a stable trend.
Considerable improvement expected in 2013We assume that the global economy will continue to grow in 2013 and that the European economy will recover significantly compared with 2012. This is based on the assumption that the European sovereign debt crisis will not have any further economic impact in 2013. On this basis, we anticipate that in 2013 our sales and operating results will be considerably higher than in 2011 and 2012. This should be driven partly by higher production capacity, which we anticipate will enable us to derive above-average benefit from the forecast market growth.
This report contains forward-looking statements based on the present expectations, assumptions and forecasts made by the Executive Board and the information available to it. These forward-looking statements do not constitute a guarantee of future developments and earnings expectations. Future performance and developments depend on a wide variety of factors which contain a number of risks and unforeseeable factors and are based on assumptions that may prove incorrect.

Management report Consolidated financial statements Supplementary information 75
Consolidated financial statements
Income statement 77
Statement of comprehensive income 78
Balance sheet 79
Statement of changes in equity 80
Cash flow statement 81
Notes to the consolidated financial statements 82 Segment report 82 General information 84 Basis of preparation of the financial statements 84 Discussion of assumptions and estimation uncertainties 102 Changes in the Group 104 Notes to the income statement 119 Notes to the balance sheet 125 Notes to the cash flow statement 147 Notes on the segment report 148 Other disclosures 154 Disclosures in compliance with German legislation 170
Cons
olid
ated
fina
ncia
l sta
tem
ents
Annual Report 2011 Evonik Industries76
150
Evonik generated EVA® of €1,035 million in 2011
and thus created considerable value.
In the 2011/2012 academic year, Evonik is providing a total of 150 German scholarships to support students at ten universities.
1billi
on
Cons
olid
ated
fina
ncia
l sta
tem
ents

77Management report Consolidated financial statements Supplementary information
Income statement
Income statement
Evonik Group
in € million Note 2011 2010
Sales (6.1) 14,540 13,300
Cost of sales −10,247 −9,440
Gross profit on sales 4,293 3,860
Selling expenses −1,242 −1,198
Research and development expenses −365 −338
General administrative expenses −663 −606
Other operating income (6.2) 1,021 968
Other operating expenses (6.3) −1,207 −1,347
Income before financial result and income taxes, continuing operations 1,837 1,339
Interest income (6.4) 50 23
Interest expense (6.4) −431 −451
Result from investments recognized at equity (6.5) 80 54
Other financial income (6.6) 7 10
Financial result −294 −364
Income before income taxes, continuing operations 1,543 975
Income taxes (6.7) −451 −175
Income after taxes, continuing operations 1,092 800
Income after taxes, discontinued operations (5.3) −78 −7
Income after taxesthereof attributable to
Non-controlling interestsShareholders of Evonik Industries AG (net income)
1,014
31,011
793
59734
Earnings per share in € (basic and diluted) (6.8) +2.17 +1.58
Prior-year figures restated.

Annual Report 2011 Evonik Industries78
Statement of comprehensive income
Evonik Group
in € million Note 2011 2010
Income after taxesthereof attributable to
Non-controlling interestsShareholders of Evonik Industries AG (net income)
1,014
31,011
793
59734
Unrealized gains/losses on available-for-sale-securities 2 −5
Gains/losses on hedging instruments −116 −25
Currency translation adjustment 173 284
Deferred taxes 15 7
Other comprehensive income after taxesthereof attributable to
Non-controlling interestsShareholders of Evonik Industries AG
(7.9) 74
713
261
31230
Total comprehensive incomethereof attributable to
Non-controlling interestsShareholders of Evonik Industries AG
1,088
741,014
1,054
90964

79Management report Consolidated financial statements Supplementary information
Statement of comprehensive income Balance sheet
Balance sheet
Evonik Group
in € million Note Dec. 31, 2011 Dec. 31, 2010
Intangible assets (7.1) 3,272 3,486
Property, plant and equipment (7.2) 4,356 4,455
Investment property (7.3) 1,545 1,528
Investments recognized at equity (7.4) 1,057 562
Financial assets (7.5) 255 108
Deferred tax assets (7.14) 477 518
Other income tax assets (7.14) 23 23
Other receivables (7.7) 41 59
Non-current assets 11,026 10,739
Inventories (7.6) 1,645 1,585
Other income tax assets (7.14) 60 47
Trade accounts receivable (7.7) 1,711 1,826
Other receivables (7.7) 358 257
Financial assets (7.5) 488 484
Cash and cash equivalents (7.8) 1,609 1,103
5,871 5,302
Assets held for sale (5.3) 47 4,502
Current assets 5,918 9,804
Total assets 16,944 20,543
Issued capital 466 466
Reserves 5,515 4,910
Equity attributable to shareholders of Evonik Industries AG 5,981 5,376
Equity attributable to non-controlling interests 93 593
Total equity (7.9) 6,074 5,969
Provisions for pensions and other post-employment benefits (7.10) 2,805 3,279
Other provisions (7.11) 1,014 956
Deferred tax liabilities (7.14) 481 502
Other income tax liabilities (7.14) 70 70
Financial liabilities (7.12) 2,745 2,915
Other payables (7.13) 369 405
Non-current liabilities 7,484 8,127
Other provisions (7.11) 1,174 1,467
Other income tax liabilities (7.14) 352 345
Financial liabilities (7.12) 402 307
Trade accounts payable (7.13) 1,086 1,088
Other payables (7.13) 284 273
3,298 3,480
Liabilities associated with assets held for sale (5.3) 88 2,967
Current liabilities 3,386 6,447
Total equity and liabilities 16,944 20,543

Annual Report 2011 Evonik Industries80
Statement of changes in equity
Evonik Group Note (7.9)
Issuedcapital Reserves
Attributable to shareholders of EvonikIndustries AG
Attributableto non- controllinginterests
Totalequity
in € millionCapitalreserve
Accumulatedincome
Accumulatedother
comprehensive income
As of January 1, 2010 466 1,165 3,525 −428 4,728 486 5,214
Capital increases/decreases 26 26
Dividend distribution −320 −320 −24 −344
Income after taxes 734 734 59 793
Other comprehensive income after taxes 230 230 31 261
Total comprehensive income 734 230 964 90 1,054
Other changes 9 −5 4 15 19
As of December 31, 2010 466 1,165 3,948 −203 5,376 593 5,969
Capital increases/decreases 18 18
Dividend distribution −400 −400 −14 −414
Changes in ownership interests in subsidiaries without loss of control −3 −3 −3
Income after taxes 1,011 1,011 3 1,014
Other comprehensive income after taxes 3 3 71 74
Total comprehensive income 1,011 3 1,014 74 1,088
Other changes 12 −18 −6 −578 −584
As of December 31, 2011 466 1,165 4,568 −218 5,981 93 6,074

81Management report Consolidated financial statements Supplementary information
Statement of changes in equity Cash flow statement
Cash flow statement
Evonik Group
in € million Note 2011 2010
Income before financial result and income taxes, continuing operations 1,837 1,339
Depreciation, amortization, impairment losses/reversal of impairment losses on non-current assets 785 799
Gains/losses on disposal of non-current assets 5 −21
Change in inventories −255 −179
Change in trade accounts receivable −121 −247
Change in trade accounts payable and current advance payments received from customers 76 240
Change in provisions for pensions and other post-employment benefits −200 −176
Change in other provisions −76 241
Change in miscellaneous assets/liabilities −108 −75
Cash outflows for interest −194 −199
Cash inflows from interest 32 34
Cash inflows from dividends 58 55
Cash inflows/outflows for income taxes −404 −240
Cash flow from operating activities, continuing operations 1,435 1,571
Cash flow from operating activities, discontinued operations −126 504
Cash flow from operating activities (8.1) 1,309 2,075
Cash outflows for investments in intangible assets, property, plant and equipment, investment property −885 −769
Cash outflows for investments in shareholdings −134 −55
Cash inflows from divestments of intangible assets, property, plant and equipment, investment property 62 53
Cash inflows from divestments of shareholdings 1,021 63
Cash inflows/outflows relating to securities, deposits and loans −62 −364
Cash outflows to fund the contractual trust arrangement (7.10) −400 −200
Cash flow from investing activities(thereof discontinued operations)
(8.2) −398(14)
−1,272(−161)
Cash inflows/outflows relating to capital contributions 18 26
Cash outflows for dividends to shareholders of Evonik Industries AG −400 −320
Cash outflows for dividends to non-controlling interests −14 −24
Cash inflows/outflows from changes in ownership interests in subsidiaries without loss of control −3 −
Cash inflows from the addition of financial liabilities 264 355
Cash outflows for repayment of financial liabilities −501 −414
Cash flow from financing activities(thereof discontinued operations)
−636(−8)
−377(−149)
Change in cash and cash equivalents 275 426
Cash and cash equivalents as of January 1 1,351 885
Change in cash and cash equivalents 275 426
Changes in exchange rates and other changes in cash and cash equivalents −15 40
Cash and cash equivalents as of December 31 (8.3) 1,611 1,351
Cash and cash equivalents included in assets held for sale −2 −248
Cash and cash equivalents as on the balance sheet as of December 31 (7.8) 1,609 1,103

Annual Report 2011 Evonik Industries82
Notes to the consolidated financial statements of the Evonik Group(1) Segment report
by operating segments Note (9.1)
Reporting segments
Consumer, Health & Nutrition Resource Efficiency Specialty Materials Services Real Estate Corporate, other operations, consolidation
Total Group (continuing operations)
in € million 2011 2010 2011 2010 2011 2010 2011 2010 2011 2010 2011 2010 2011 2010
External sales 4,081 3,677 4,045 4,195 4,880 4,117 952 801 412 402 170 108 14,540 13,300
Internal sales 77 65 57 55 114 92 1,471 1,389 1 2 −1,720 −1,603 − −
Total sales 4,158 3,742 4,102 4,250 4,994 4,209 2,423 2,190 413 404 −1,550 −1,495 14,540 13,300
EBITDA (before non-operating result) 1,049 985 765 746 907 626 139 106 219 190 −311 −288 2,768 2,365
EBITDA margin in % 25.7 26.8 18.9 17.8 18.6 15.2 14.6 13.2 53.2 47.3 19.0 17.8
Depreciation and amortization −123 −121 −152 −171 −153 −154 −82 −78 −47 −47 −90 −123 −647 −694
Result from investments recognized at equity 18 18 1 − 2 1 − − 44 28 15 7 80 54
EBIT (before non-operating result) 917 853 611 569 748 469 56 28 171 140 −404 −420 2,099 1,639
Capital employed (annual average) 1,640 1,497 2,068 2,215 1,702 1,630 442 447 1,833 1,810 3,519 3,328 11,204 10,927
ROCE in % 55.9 57.0 29.5 25.7 43.9 28.8 12.7 6.3 9.3 7.7 18.7 15.0
Capital expenditures 186 109 170 247 210 132 84 79 74 41 106 44 830 652
Additions to financial assets 87 1 19 − 22 6 − − 6 20 6 9 140 36
Other significant non-cash income and expenses −102 −166 −202 −276 −213 −228 −242 −238 −6 −19 −137 −251 −902 −1,178
Employees as of December 31 6,384 6,326 6,381 7,874 6,846 6,789 10,946 10,616 1,135 1,098 1,864 1,704 33,556 34,407
by regions Note (9.2)
Germany Rest of Europe Asia North America Central and South America Other Total Group (continuing operations)
in € million 2011 2010 2011 2010 2011 2010 2011 2010 2011 2010 2011 2010 2011 2010
External sales 3,784 3,445 4,151 3,713 2,901 2,670 2,766 2,521 642 657 296 294 14,540 13,300
Goodwill as of December 311) 1,607 1,717 541 540 263 252 283 308 27 26 23 21 2,744 2,864
Other intangible assets, property, plant and equipment, investment property as of December 311) 4,317 4,457 530 568 909 845 609 587 42 107 22 41 6,429 6,605
Capital expenditures 481 315 81 86 152 169 109 69 7 7 − 6 830 652
Additions to financial assets 82 29 9 6 2 − 46 1 − − 1 − 140 36
Employees as of December 31 21,909 21,894 2,745 3,010 4,523 4,865 3,905 4,064 309 336 165 238 33,556 34,407
Prior-year figures restated. 1) Non-current assets according to IFRS 8.33 b.

83Management report Consolidated financial statements Supplementary information
Segment report
Notes to the consolidated financial statements of the Evonik Group(1) Segment report
by operating segments Note (9.1)
Reporting segments
Consumer, Health & Nutrition Resource Efficiency Specialty Materials Services Real Estate Corporate, other operations, consolidation
Total Group (continuing operations)
in € million 2011 2010 2011 2010 2011 2010 2011 2010 2011 2010 2011 2010 2011 2010
External sales 4,081 3,677 4,045 4,195 4,880 4,117 952 801 412 402 170 108 14,540 13,300
Internal sales 77 65 57 55 114 92 1,471 1,389 1 2 −1,720 −1,603 − −
Total sales 4,158 3,742 4,102 4,250 4,994 4,209 2,423 2,190 413 404 −1,550 −1,495 14,540 13,300
EBITDA (before non-operating result) 1,049 985 765 746 907 626 139 106 219 190 −311 −288 2,768 2,365
EBITDA margin in % 25.7 26.8 18.9 17.8 18.6 15.2 14.6 13.2 53.2 47.3 19.0 17.8
Depreciation and amortization −123 −121 −152 −171 −153 −154 −82 −78 −47 −47 −90 −123 −647 −694
Result from investments recognized at equity 18 18 1 − 2 1 − − 44 28 15 7 80 54
EBIT (before non-operating result) 917 853 611 569 748 469 56 28 171 140 −404 −420 2,099 1,639
Capital employed (annual average) 1,640 1,497 2,068 2,215 1,702 1,630 442 447 1,833 1,810 3,519 3,328 11,204 10,927
ROCE in % 55.9 57.0 29.5 25.7 43.9 28.8 12.7 6.3 9.3 7.7 18.7 15.0
Capital expenditures 186 109 170 247 210 132 84 79 74 41 106 44 830 652
Additions to financial assets 87 1 19 − 22 6 − − 6 20 6 9 140 36
Other significant non-cash income and expenses −102 −166 −202 −276 −213 −228 −242 −238 −6 −19 −137 −251 −902 −1,178
Employees as of December 31 6,384 6,326 6,381 7,874 6,846 6,789 10,946 10,616 1,135 1,098 1,864 1,704 33,556 34,407
by regions Note (9.2)
Germany Rest of Europe Asia North America Central and South America Other Total Group (continuing operations)
in € million 2011 2010 2011 2010 2011 2010 2011 2010 2011 2010 2011 2010 2011 2010
External sales 3,784 3,445 4,151 3,713 2,901 2,670 2,766 2,521 642 657 296 294 14,540 13,300
Goodwill as of December 311) 1,607 1,717 541 540 263 252 283 308 27 26 23 21 2,744 2,864
Other intangible assets, property, plant and equipment, investment property as of December 311) 4,317 4,457 530 568 909 845 609 587 42 107 22 41 6,429 6,605
Capital expenditures 481 315 81 86 152 169 109 69 7 7 − 6 830 652
Additions to financial assets 82 29 9 6 2 − 46 1 − − 1 − 140 36
Employees as of December 31 21,909 21,894 2,745 3,010 4,523 4,865 3,905 4,064 309 336 165 238 33,556 34,407
Prior-year figures restated. 1) Non-current assets according to IFRS 8.33 b.

Annual Report 2011 Evonik Industries84
(2) General information Evonik Industries AG is an international specialty chemicals company headquartered in Germany. It also has investments in residential real estate and the energy sector. The company’s registered office is Rellinghauser Straße 1–11, 45128 Essen (Germany), and it is registered in the Commercial Register at Essen District Court under HRB No. 19474.
A new corporate structure with a strategic focus on specialty chemicals was introduced on April 1, 2011, and Mr. Patrik Wohlhauser, Dr. Thomas Haeberle and Dr. Dahai Yu were appointed as additional members of the Executive Board of Evonik Industries AG. For the current reporting period, the operating activities have been divided retroactively among five reporting segments—Consumer, Health & Nutrition, Resource Efficiency, Specialty Materials, Services and Real Estate (2010: divided into the three business areas Chemicals, Energy and Real Estate), see Notes (1) and (9.1). The former Energy Business Area was deconsolidated in the reporting period as a result of divestment of the majority shareholding, see Note (5.2). Effective September 1, 2011, Mr. Thomas Wessel was appointed to the Executive Board as Chief Human Resources Officer. The previous Chief Human Resources Officer, Mr. Ralf Blauth, retired from the Executive Board on August 31, 2011.
Evonik Industries AG is a subsidiary of RAG-Stiftung, Essen (Germany), which directly holds 74.99 percent of the shares in Evonik Industries AG. As a subsidiary of RAG-Stiftung, Evonik Industries AG and its subsidiaries are included at equity in the annual consolidated financial statements prepared by RAG-Stiftung in accordance with the German Commercial Code (HGB). The consolidated financial statements of RAG-Stiftung are published in the electronic Federal Gazette (www.ebundesanzeiger.de). The remaining 25.01 percent of the shares in are held by Gabriel Acquisitions GmbH (Gabriel Acquisitions), Gadebusch (Germany). Gabriel Acquisitions is an indirect subsidiary of funds established and advised by CVC Capital Partners (Luxembourg) S.à r.l., Luxembourg (Luxembourg).
The present consolidated financial statements of Evonik Industries AG and its subsidiaries (referred to jointly as Evonik or the Group) were prepared and approved for publication by the Executive Board of Evonik Industries AG at its meeting on February 20, 2012, and presented to the Supervisory Board by the Audit Committee for approval at its meeting on March 13, 2012. These consolidated financial statements are also published in the electronic Federal Gazette.
(3) Basis of preparation of the financial statements
(3.1) Compliance with IFRSAs permitted by Section 315 a Paragraph 3 of the German Commercial Code, the present consoli-dated financial statements have been prepared on the basis of the International Financial Reporting Standards (IFRS) and comply with these standards. The IFRS comprise the standards (IFRS, IAS) issued by the International Accounting Standards Board (IASB), London (UK) and the interpre-tations (IFRIC, SIC) of the IFRS Interpretations Committee (IFRS IC), as adopted by the European Union. Additional disclosures are made in accordance with national regulations pursuant to Section 315 a Paragraph 1 of the German Commercial Code.

85Management report Consolidated financial statements Supplementary information
General information Basis of preparation of the financial statements
(3.2) Presentation of the financial statementsThe consolidated financial statements cover the period from January 1 to December 31, 2011 and are presented in euros. All amounts are stated in millions of euros (€ million) except where otherwise indicated.
The recognition and valuation principles and items presented in the consolidated financial state-ments are in principle consistent from one period to the next. Deviations from this principle are outlined in Note (3.4). To enhance the clarity of presentation, some items are combined in the income statement, statement of comprehensive income, balance sheet and statement of changes in equity and explained in detail in the Notes.
The income statement has been prepared using the cost-of-sales method. Expenses are divided by function.
The statement of comprehensive income is a reconciliation from income after taxes as shown in the income statement to the Group’s total comprehensive income, taking into account other comprehensive income.
On the balance sheet, assets and liabilities are classified by maturity. They are classified as current if they are due or expected to be realized within twelve months from the reporting date.
The statement of changes in equity shows changes in the issued capital, reserves attributable to shareholders of Evonik Industries AG and changes in non-controlling interests in the reporting period. Transactions with shareholders in their capacity as owners are also shown separately here.
The cash flow statement provides information on the Group’s cash flows. The cash flow from operating activities is calculated using the indirect method.
The Notes contain basic information on the financial statements, supplementary information on the above components of the financial statements and further information such as the segment report.
(3.3) Newly issued IFRSAccounting standards applied for the first timeThe IASB has amended or issued a number of standards and interpretations. These have to be officially adopted into European law by the European Union before they can be applied. The accounting standards that had to be applied for the first time in fiscal 2011 do not significantly impact the consolidated financial statements or, with the exception of the newly issued standard IAS 24 Related Party Disclosures, see Note (10.3), are not relevant for the consolidated financial statements:• The amendment to IFRS 1 First-time Adoption of International Financial Reporting Standards:
Limited Exemption from Comparative IFRS 7 Disclosures• The amendment to IAS 32 Financial Instruments: Presentation: Classification of Rights Issues• The standards amended as part of the third annual improvements project (2010)• The amendment to IFRIC 14 IAS 19: The Limit on a Defined Benefit Asset, Minimum Funding
Requirements and their Interaction• The new interpretation IFRIC 19 Extinguishing Financial Liabilities with Equity Instruments.

Annual Report 2011 Evonik Industries86
Accounting standards that are not yet mandatoryThe IASB issued further accounting standards up to December 31, 2011 which did not become mandatory in the fiscal year or have not yet been officially adopted by the European Union. These new accounting standards will probably be applied for the first time—insofar as they are relevant for the Group’s consolidated financial statements—from the date on which they come into force.
In November 2009 the IASB published the new standard IFRS 9 Financial Instruments. This standard is part of a project for a new standard to replace IAS 39 Financial Instruments: Recognition and Measurement. In this first step it is concerned exclusively with the classification and measure-ment of financial assets. IFRS 9 replaces the former valuation categories with the categories “at amortized cost” or “at fair value”. The decision on whether to carry a financial instrument “at amortized cost” depends on the one hand on the entity’s business model and on the other on the contractually agreed cash flows from the financial instrument. Financial instruments that do not meet the criteria for measurement “at amortized cost” are recognized in income “at fair value”. Recognition of assets at fair value in other comprehensive income is permitted for selected equity instruments. The new standard is applicable retrospectively. In December 2011 the date for mandatory first-time application was postponed from January 1, 2013 to January 1, 2015. Earlier application is permitted. The impact on the consolidated financial statements is currently being examined.
In October 2010 the IASB published amendments to IFRS 7 Financial Instruments: Disclosures. These comprise supplementary disclosure requirements for the transfer of financial assets to provide a better understanding of the nature of the risks associated with continuing involvement. The amended standard is applicable for fiscal years beginning on or after July 1, 2011. Earlier appli-cation is permitted. The impact on the consolidated financial statements is currently being examined.
Further, the IASB has extended standard IFRS 9 Financial Instruments and issued a new version in October 2010. Supplementary to IFRS 9 (2009), IFRS 9 (2010) contains rules on the classification and measurement of financial liabilities and derecognition of financial assets and liabilities. The main changes relating to financial liabilities refer to the fair value option. In future changes in the fair value resulting from the company’s credit risk must be recognized in the statement of compre-hensive income, while all other changes in the fair value must be recognized in income after taxes in the income statement. It takes over the present ruling on derecognition. The standard is applicable retrospectively. In December 2011 the date for mandatory first-time application was postponed from January 1, 2013 to January 1, 2015. The impact on the consolidated financial state-ments is currently being examined.
In December 2010 the IASB published amendments to IFRS 1 First-time Adoption of International Financial Reporting Standards. The previous reference to January 1, 2004 is replaced by reference to the date of transition to the IFRS. It also contains new rules if a company is unable to apply all IFRS standards as a result of hyperinflation. The amended standard is applicable for fiscal years beginning on or after July 1, 2011. Earlier application is permitted. This amendment is not relevant for the consolidated financial statements.
In December 2010 the IASB also published amendments to IAS 12 Income Taxes. These clarify the treatment of temporary tax differences relating to application of the fair value model in IAS 40 Investment Property. In future, it will be presumed that such tax differences will be recovered entirely through sale and not through continued use of the investment property. The amended standard is applicable retrospectively for fiscal years beginning on or after January 1, 2012. Earlier application is permitted. This amendment is not relevant for the consolidated financial statements.

87Management report Consolidated financial statements Supplementary information
Basis of preparation of the financial statements
In May 2011 the IASB published three new and two revised standards on accounting for shares in other companies.
The new standard IFRS 10 Consolidated Financial Statements replaces the guidelines on control and consolidation contained in IAS 27 Consolidated and Separate Financial Statements and SIC-12 Consolidation—Special Purpose Entities. IFRS 10 alters the definition of “control” so that the same principles are applied to all companies to determine a relationship of control. This definition is supported by extensive application guidance. The new standard does not alter the previous core principle set out in IAS 27 that consolidated financial statements present the parent company and its subsidiaries as a single economic entity, nor does it alter the consolidation procedure. IAS 27 is to be renamed “Separate Financial Statements” and will in future only contain the unchanged rulings on the preparation of separate financial statements. SIC-12 will be withdrawn.
The new standard IFRS 11 Joint Arrangements supersedes IAS 31 Interests in Joint Ventures. As a result of the amended definitions in IFRS 11, there are now two types of joint arrangements: joint operations and joint ventures. In future, joint ventures will be recognized using the equity method in accordance with the amended standard IAS 28 Investments in Associates and Joint Ventures. The previous option of pro rata consolidation has been abolished. Companies that have a stake in joint operations will in future have to apply rules that are comparable to the present accounting standards for joint assets or joint operations.
The new standard IFRS 12 Disclosures of Interests in Other Entities brings together the revised and extended disclosures in the notes to financial statements required by the present standards IAS 27, IAS 28 and IAS 31.
The new and amended standards are applicable for fiscal years starting on or after January 1, 2013. Earlier application is permitted if all new and amended standards are applied earlier. The exception to this rule is IFRS 12. This standard on disclosures in the notes can also be applied earlier, without mandatory application of the other standards. The impact on the consolidated financial statements is currently being examined.
In May 2011 the IASB also published the new standard IFRS 13 Fair Value Measurement. This prescribes uniform rules for the measurement of fair value and extends the disclosures on fair value. It does not provide information on when fair value is to be used. This standard must be applied for fiscal years beginning on or after January 1, 2013. Earlier application is permitted. The impact on the consolidated financial statements is currently being examined.
In June 2011 the IASB published amendments to IAS 1 Presentation of Financial Statements: Presentation of Items of Other Comprehensive Income. The amendments mainly relate to the presentation of items of other comprehensive income after taxes. In future, these will have to be classified into items that will be reclassified (“recycled”) to income after taxes in subsequent years and those that might not. The amended standard is applicable for fiscal years beginning on or after July 1, 2012. Earlier application is permitted. The amendment will affect the presentation of other comprehensive income after taxes.
In June 2011 the IASB also published amendments to IAS 19 Employee Benefits. The amendments relate to the recognition and measurement of expense for defined benefit pension plans and termination benefits. In future, the corridor method currently used by Evonik will no longer be applicable and this could increase the volatility of provisions and equity without impacting income. Further, it increases the disclosure requirements on employee benefits. The amended standard is applicable for fiscal years beginning on or after January 1, 2013. Earlier application is permitted. The additional impact on the consolidated financial statements is currently being examined.

Annual Report 2011 Evonik Industries88
In October 2011 the IASB published the interpretation IFRIC 20 Stripping Costs in the Production Phase of a Surface Mine. This interpretation is concerned with the recognition and measurement of costs incurred in the removal of overburden during surface mining. This interpretation must be applied for fiscal years beginning on or after January 1, 2013. Earlier application is permitted. This interpretation is not relevant for the consolidated financial statements.
In December 2011 the IASB published amendments to IFRS 9 Financial Instruments and IFRS 7 Financial Instruments: Disclosures. As a result of these amendments, the mandatory effective date of IFRS 9 has been postponed from January 1, 2013 to January 1, 2015 and the restatement of prior-year figures is not required when it is first applied. Moreover, additional disclosures specified by IFRS 7 are required in the transition period to allow better assessment of the impact of first-time application of IFRS 9 on the measurement and valuation of financial instruments. Earlier application of IFRS 9 is still permitted. The impact on the consolidated financial statements is currently being examined.
Further, in December 2011 the IASB published amendments to IAS 32 and IFRS 7. The amendment to IAS 32 comprises application guidance giving further details of the conditions for offsetting financial instruments. For instance, it explains the current legally enforceable right of set-off and defines which systems with a gross set-off can be regarded as a net set-off within the meaning of the standard. The changes to IFRS 7 comprise supplementary disclosure requirements on the offsetting of financial instruments. The amended version of IFRS 7 is applicable for fiscal years beginning on or after January 1, 2013, while the amendment to IAS 32 is applicable for fiscal years starting on or after January 1, 2014. Earlier application is permitted. The impact on the consolidated financial statements is currently being examined.
(3.4) Restatement of prior-year figuresAn enterprise may only change its recognition and valuation principles or the items stated in prior years if this is required due to a standard or interpretation or results in the disclosure of more relevant information in the financial statements. Such changes must generally also be presented retroactively for the prior period. For the present consolidated financial statements, the following prior-year figures have been restated:
The introduction of a new corporate structure with a strategic focus on specialty chemicals resulted in a modified reporting structure for the operating segments; the prior-year figures have been restated accordingly, see Notes (1) and (9.1).
In the income statement, Evonik has altered the presentation of sales-related sponsoring and promotional expenses. This resulted in a €24 million increase in selling expenses in the previous year and a corresponding reduction in administrative expenses.

89Management report Consolidated financial statements Supplementary information
Basis of preparation of the financial statements
(3.5) Consolidation methods and scope of consolidationScope of consolidationAlongside Evonik Industries AG, the consolidated financial statements include all material German and foreign subsidiaries directly or indirectly controlled by Evonik Industries AG. Material associated companies and joint ventures are recognized using the equity method if the Group is able to exert a significant influence or exercises joint control. Initial consolidation or deconsolidation takes place as of the date on which the company gains or loses control.
Companies whose influence on the assets, financial position and earnings of the Group, both individually and in aggregate, is negligible are recognized at amortized cost in the consolidated financial statements in accordance with IAS 39 Financial Instruments: Recognition and Measurement.
Changes in the scope of consolidation are outlined in Note (5.1).
Consolidation methodsThe financial statements of the consolidated German and foreign subsidiaries are prepared using uniform accounting and valuation principles.
Capital is consolidated at the time of acquisition by offsetting the carrying amount of the business acquired against the pro rata revalued equity of the subsidiary. Ancillary acquisition costs are no longer included in the carrying amount of the subsidiary. Instead they are recognized as expense in the income statement. The assets and liabilities (net assets) of the subsidiary are included at their fair values. If shares in the subsidiary are held before acquiring control, they must be revalued and any resultant change in value must be recognized in the income statement in other operating income or other operating expenses. Gains or losses recognized in other comprehensive income must be derecognized in the same way as if the acquirer had divested the shares previously held. Any remaining excess of the acquisition cost over the fair value of the net assets is recognized as good-will. Negative differences are included in income following a renewed examination of the fair value of the net assets.
Changes in shareholdings in a previously consolidated subsidiary that do not result in a loss of control are recognized directly in equity as a transaction between owners. In this case, the shares attributable to the owners of the parent company and to the other shareholders are adjusted to reflect the changes in their respective stakes in the subsidiary. Any difference between this adjustment and the fair value of the consideration paid or received is recognized directly in equity and allocated to the shares attributable to the owners of the parent company. Directly related transaction costs are also recognized as a transaction between owners that has no impact on income, with the exception of costs for the issuance of debt or equity instruments, which are still measured in accordance with the criteria for recognizing financial instruments. Cash inflows and outflows relating to these transactions as presented in the cash flow from financing activities.
The subsidiary must be deconsolidated as of the date on which control is lost. The net assets of the subsidiary and non-controlling interests (proportionate net assets of the subsidiary) are derecognized. The gain or loss on the divestments must be calculated from the Group viewpoint. This is derived from the difference between the proceeds of the divestment (selling price less costs to sell) and the proportionate divested net assets of the subsidiary (including the remaining hidden reserves and liabilities, and any goodwill shown on the balance sheet). The shares in the former subsidiary still held by Evonik are revalued at fair value as of the date on which control is lost. All resulting gains and losses are recognized in the income statement as other operating income or other operating expenses. In addition, amounts shown in equity under other accumulated comprehensive income are also rebooked to the income statement, expect where another accounting standard requires direct transfer to revenue reserves.

Annual Report 2011 Evonik Industries90
Intergroup income and expenses, profits, losses, receivables and liabilities between consolidated subsidiaries are eliminated. Write-downs on shares in such companies recognized in the separate financial statements are reversed.
The same consolidation principles apply for companies accounted for using the equity method and any goodwill is recognized in the carrying amount of the investment. The financial statements of the companies recognized at equity are prepared using uniform accounting and valuation principles, see Note (3.7) “Investments recognized at equity”.
(3.6) Currency translationForeign currency transactions are measured at the exchange rate on the date of initial recognition. Any gains or losses resulting from the valuation of monetary assets and liabilities in foreign currencies as of the reporting date are recognized in other operating income or other operating expenses.
The functional currency method is used to translate the financial statements of foreign sub-sidiaries. In the consolidated financial statements, the balance sheets of all foreign subsidiaries are translated from the functional currency of the company into euros at closing rates on the reporting date, since they conduct their business independently in their functional currency. The equity of foreign companies recognized at equity is translated in the same way. As an asset pertaining to an economically autonomous foreign operation, goodwill is translated at the closing rate. Income and expense items are translated at average exchange rates for the year. The average annual exchange rates comprise the mean of the exchange rates at month-end over the past 13 months. Translation differences compared to the prior year and translation differences between the income statement and balance sheet are recognized in other comprehensive income.
The following exchange rates were used for currency translation:
€1 corresponds to
Annual average rates Closing rates
2011 2010 Dec. 31, 2011 Dec. 31, 2010
Brazilian real (BRL) 2.33 2.34 2.42 2.22
British pound (GBP) 0.87 0.86 0.84 0.86
Chinese renminbi yuan (CNY) 9.01 9.00 8.16 8.82
Japanese yen (JPY) 111.12 116.64 100.20 108.65
Swiss franc (CHF) 1.23 1.38 1.22 1.25
US dollar (USD) 1.40 1.33 1.29 1.34

91Management report Consolidated financial statements Supplementary information
Basis of preparation of the financial statements
(3.7) Accounting policiesRevenue recognitionRevenues from the sale of goods and services that constitute part of the company’s normal business activity and other revenues are recognized as follows:
(a) Sales Evonik mainly generates sales by selling specialty chemicals to industrial customers for further processing, see Note (9.1) for more detailed information.
The Consumer, Health & Nutrition segment produces specialty chemicals, principally for applications in the consumer goods, animal nutrition and pharmaceutical sectors.
The Resource Efficiency segment provides solutions for environment-friendly and energy-efficient products.
The heart of the Specialty Materials segment is the production of polymer materials and their preproducts, and additives.
The Services segment mainly provides services for Evonik’s chemicals segments and the Corporate Center but also serves third parties.
The Real Estate segment’s sales principally comprise revenues from letting, administration and running residential property, the construction of houses and apartment blocks for third parties and the sale of residential units. Properties held with a view to sale are reclassified to inventories if the sale is preceded by development activities. Utility charges and heating costs that can be charged to tenants are offset against prepayments received from tenants for such services and immediately recognized as sales.
The following comments on revenue recognition apply:Prices are contractually agreed between the parties to a transaction. Sales revenues are measured
as the fair value of the consideration received or to be received less value-added tax and any discounts or bulk rebates granted. The general principle for revenue recognition is that both the revenues and the related costs can be measured reliably. It must also be sufficiently probable that the economic benefit will flow to the company.
Revenues from the sale of goods are recognized, assuming that the general conditions for revenue recognition are met, when title and the associated risks pass to the customer. Provisions are established for general risks arising from such sales on the basis of previous experience.
Revenues from services are recognized, assuming that the general conditions for revenue recognition are met, when the percentage of completion can be reliably measured.
They are recognized in the year in which the service is rendered. Where the provision of services extends over more than one fiscal year, sales are recognized proportionately to the total service to be provided.
(b) Other revenuesOther revenues are only recognized if they can be determined reliably and it is sufficiently probable that the economic benefit will flow to the company.
Interest income is recognized on a pro rata temporis basis using the effective interest method. Income from royalties is accrued on the basis of the commercial terms of the underlying contract and recognized on a pro rata basis. Dividend income is recognized as of the date of the right to receipt of the payment.
Annual Report 2011 Evonik Industries92
Intangible assetsIntangible assets are capitalized at acquisition or production cost. Intangible assets with a finite useful life are amortized and an impairment test is conducted if there are indications of a possible impairment, see Note (3.7) “Impairment test”. Intangible assets with an indefinite useful life are not amortized; instead they are tested for impairment at least once a year.
(a) GoodwillGoodwill has an indefinite useful life and is tested for impairment at least once a year.
(b) Franchises, trademarks and licensesFranchises, trademarks and licenses are amortized over their estimated useful life of 5–25 years using the straight-line method. Some rights have an indefinite useful life. These are trademarks with no restrictions on their use. They are tested annually for impairment and to check that their useful life is still indefinite. If the assessment of the useful life of such trademarks has altered and is reclassified as finite, their carrying amounts are amortized over their estimated remaining useful life using the straight-line method.
(c) Capitalized development costsDevelopment costs are capitalized if they can be clearly assigned to a newly developed product or process that is technically feasible and is designated for captive use or commercialization. Capitalized development costs mainly relate to the development of new products and are amortized using the straight-line method over their estimated useful life of between 3 and 15 years.
(d) Other intangible assetsThe majority of other intangible assets are acquired customer relationships. These are amortized over their expected useful life using the straight-line method. Their useful life is estimated on the basis of contractual data and experience and is generally between 2 and 11 years. Amortization takes account of both useful life and probability of continuance of the customer relationship in the form of a “churn rate”.
Property, plant and equipmentProperty, plant and equipment are carried at acquisition or production cost and depreciated over their useful life using the straight-line method. If there are indications of a possible impairment, an impairment test is conducted as outlined in Note (3.7) “Impairment test”.
The cost of acquisition includes expenses directly attributable to the acquisition. The cost of production of assets manufactured within the Group comprises the direct cost of materials and labor, plus the applicable proportion of material and manufacturing overheads, including depreciation. Costs relating to obligations to dismantle or remove non-current assets at the end of their useful life are capitalized as acquisition or production costs at the time of acquisition or production. Acquisition and production costs may also include transfers from gains and losses on cash flow hedges entered into in connection with the purchase of property, plant and equipment and previously recognized in other comprehensive income. Borrowing costs that can be allocated directly to the acquisition, construction or production of a qualifying asset are included in the cost of acquisition or production. A qualifying asset is an asset for which more than a year is required to get it ready for its intended use.

93Management report Consolidated financial statements Supplementary information
Basis of preparation of the financial statements
Property, plant and equipment are depreciated using the straight-line method over the expected useful life of the assets.
in years
Buildings 5–50
Plant and machinery
Chemical facilities 5–25
Power plants and the related components 12–40
Decentralized energy supply installations 8–15
Other technical plant and equipment 3–25
Other plant, office furniture and equipment 3–25
Expenses for overhauls and major servicing (major repairs) are generally capitalized if it is probable that they will result in future economic benefits from an existing asset. They are then depreciated over the period until the next major repair date. Routine repairs and other maintenance work are expensed in the period in which they are incurred.
If there is a high probability that the project will be realized, costs incurred for planning and pre-engineering work for capital expenditure projects are capitalized. Depreciation is recognized in line with the useful life of the project.
If major components of an asset have different useful lives, they are recognized and depreciated separately.
Gains and losses from the disposal of property, plant and equipment are calculated as the difference between the net proceeds of sale and the carrying amount and recognized in other operating income or other operating expenses.
Investment propertyProperty held as a financial investment to generate rental revenues and/or for capital appreciation is valued at the cost of acquisition or production and depreciated over its useful life of 25–80 years using the straight-line method. If there are indications of a possible impairment, an impairment test is conducted as outlined in Note (3.7) “Impairment test”.
The fair value of such properties is valued by internal appraisers using the discounted cash flow (DCF) method. The DCF model maps future cash flows, which determine the value of the property, and thus represents an income-based valuation of the property, as is customary for rented residential property.

Annual Report 2011 Evonik Industries94
Impairment testIf there are indications of possible impairment, an impairment test is conducted on intangible assets, property plant and equipment and investment property in accordance with IAS 36: Impairment of Assets. The impairment test on such assets is generally conducted for a cash-generating unit (CGU), which is the smallest identifiable group of assets that generates independent cash flows, or for a group of CGUs. Goodwill is allocated to the segments (2010: to the business areas), in other words, to a group of CGUs. In connection with the new corporate structure, goodwill relating to the former Chemicals Business Area was allocated among the Consumer, Health & Nutrition, Resource Efficiency, Specialty Materials and Services segments (reporting segments) on the basis of their proportionate enterprise value less capital employed. Goodwill and other intangible assets with an indefinite useful life are tested for impairment at least once a year. The impairment test is conducted on September 30.
The impairment test comprises comparing the recoverable amount of the CGU/group of CGUs with its carrying amount. The recoverable amount is determined as the higher of the fair value less costs to sell (market value) and the value in use of the CGU/group of GCUs. An impairment loss is recognized if the recoverable amount of a CGU/group of CGUs is below its carrying amount. The impairment loss is reversed—except in the case of goodwill—if the reason for the original impairment charge no longer applies.
When testing goodwill for impairment, the recoverable value of goodwill is determined from the market value of the relevant segment. The market value is the present value of future cash flows determined using a valuation model. Future cash flows are derived from the current five-year mid-term plan. The mid-term planning is based on a mixture of experience and expectations of future market trends. The main economic data, such as growth in gross domestic product, the development of interest rates, exchange rates, raw material prices and the market price of CO2 allowances, etc., used in the mid-term planning are derived from market expectations and set centrally by Evonik. The specific growth rates for individual segments are derived from experience and future expectations. The average long-term growth rates for the markets in which the segments operate are not exceeded.
The expected future cash flows are discounted using the weighted average cost of capital (WACC) after taxes. WACC is determined for each segment on the basis of capital market models and is the weighted average cost of debt and equity. The cost of equity is determined from the risk-free interest rate and a risk premium. The risk-free interest rate is identical for all segments. The risk premium is derived by multiplying the beta factor by the market risk premium. The beta factor is obtained from the capital market by comparison with the values for comparable companies for the segment (peer group). The cost of debt for the Consumer, Health & Nutrition, Resource Efficiency, Specialty Materials and Services segments takes account of a risk-free interest rate and premiums for the credit risk and tax rates for the relevant segment. In the Real Estate segment the actual cost of debt is used. A terminal growth rate is assumed for individual segments.

95Management report Consolidated financial statements Supplementary information
Basis of preparation of the financial statements
The table shows the parameters used and the allocation of goodwill:
Risk-free interest rate (in %) WACC after taxes (in %) Growth rate (in %) Goodwill (in € million)
2011 2010 2011 2010 2011 2010 Dec. 31, 2011 Dec. 31,2010
Chemicals − 3.80 − 7.50 − 1.50 − 2,812
Energy − 3.80 − 6.00 − 0.70 − −
Consumer, Health & Nutrition 3.25 − 6.35 − 1.50 − 724 −
Resource Efficiency 3.25 − 8.82 − 1.50 − 1,009 −
Specialty Materials 3.25 − 8.41 − 1.50 − 894 −
Services 3.25 − 7.89 − 1.50 − 52 −
Real Estate 3.25 3.80 4.29 6.30 1.00 1.00 40 40
Corporate, other operations 3.25 3.80 7.18 7.30 1.50 1.00 25 12
The carrying amounts of goodwill are allocated among the segments (2010: business areas) for the purpose of impairment testing. The goodwill allocated to the three chemicals segments principally relates to earlier acquisitions of shares in Evonik Degussa GmbH ( Evonik Degussa), Essen (Germany). In the segment reporting, it is assigned to “Corporate, other operations, consolidation”. In 2010, the goodwill was assigned to the former Chemicals Business Area for both impairment testing and segment reporting.
Investments recognized at equityMaterial associated companies and joint ventures are recognized using the equity method if Evonik is able to exert a significant influence or exercises joint control.
Initially they are measured at cost of acquisition. The cost of acquisition also contains all ancillary acquisition costs directly attributable to the investment.
As the basis for the measurement of the investment in subsequent periods, the difference between the cost of acquisition and the proportionate equity must be determined. This is then analyzed to see whether it contains hidden reserves or hidden liabilities. Any positive difference remaining after allocation of hidden reserves or liabilities is treated as goodwill and recognized in the carrying amount of the investment. Negative differences are immediately included in income by increasing the carrying amount of the investment.
Starting from the cost of acquisition of the investment, in subsequent periods its carrying amount is increased or reduced by the proportionate net income. Further adjustments to the carrying amount of the investment are necessary if the equity of the investment alters as a result of items contained in other comprehensive income. Subsequent measurement must take into account depreciation of hidden reserves identified at the time of initial consolidation and deducted from the proportionate net income. To avoid dual recognition, any dividends received must be deducted from the carrying amount.
If there are indications of a possible impairment, the investment must be tested for impairment, see Note (3.7) “Impairment test”. No separate impairment test is performed for the proportionate goodwill. The impairment test is performed for the entire carrying amount of the investment. Accordingly, impairment losses are not allocated to the proportionate goodwill included in the carrying amount of the investment and can be reversed in full in subsequent periods.

Annual Report 2011 Evonik Industries96
InventoriesInventories are measured at the lower of cost and net realizable value. The net realizable value corresponds to the selling price in the ordinary course of business less the production and selling expenses incurred prior to sale. The cost of inventories of similar structure or for similar applications is determined uniformly as an average or using the first-in first-out method. The cost of production of finished goods and work in progress comprises the cost of raw materials and supplies, directly attributable personnel expenses, other direct costs and general overheads that can be assigned to production (based on normal operating capacity). The cost of inventories may also contain gains and losses for qualifying cash flow hedges for the purchase of raw materials which have been reclassified from other comprehensive income and borrowing costs for qualifying assets. A quali-fying asset is an asset for which more than a year is required to get it ready for sale and which does not comprise a large number of regularly produced inventories.
Purchased emissions allowances are recognized at the lower of cost or net realizable value. Analogously to IAS 20 Accounting for Government Grants and Disclosure of Government Assistance, a token amount is recognized for emissions allowances allocated free of charge. Provisions are recognized for the obligation to return emissions allowances insofar as such allowances are available, at the amount capitalized for such allowances. If the return obligation exceeds the allow-ances capitalized, the difference is recognized at the average price for the three months preceding the reporting date.
Impairment losses are reversed if the reason for them is no longer applicable; they may be written back at most to the historical cost of acquisition or production.
Cash and cash equivalentsThis item contains checks, cash and cash equivalents and balances held at banks. It also contains highly liquid financial instruments with a maturity, calculated as of the date of purchase, of no more than three months, that can be converted into cash and cash equivalents at any time and are only subject to negligible fluctuations in value. They are measured at fair value.

97Management report Consolidated financial statements Supplementary information
Basis of preparation of the financial statements
Provisions for pensions and other post-employment benefitsProvisions for pensions and other post-employment benefits are measured using the projected unit credit method for defined benefit obligations in accordance with IAS 19 Employee Benefits. This method takes account of future salary and pension increases as well as pension obligations and accrued entitlements as of the reporting date. In Germany, valuation is based on the biometric data in the 2005G mortality tables published by Klaus Heubeck. Pension obligations outside Germany are determined using country-specific parameters and measurement principles. The fair value of plan assets is deducted from the benefit obligation. Actuarial gains and losses are derived from the difference between the expected pension obligations and the actual obligation calculated at year end, and from deviations between the expected and actual fair value of plan assets calculated at year end. Actuarial gains and losses are only recognized if the balance of accumulated actuarial gains and losses not yet recognized in income exceeds the higher of one of the following at the end of the previous reporting period:• 10 percent of the present value of the defined benefit obligation• 10 percent of the fair value of plan assets.Amounts exceeding this level must be allocated over the expected average remaining service life of the employees covered by the plan and recognized in income from the following year.
The benefit obligations at year end are compared with the fair value of the plan assets (funded status). Pension provisions are derived from the funded status by deducting unrecognized actuarial gains and losses and past service cost, taking the asset ceiling into account.
Defined contribution plans result in an expense in the period in which the contribution is made. Defined contribution plans exist for both company pension plans and state pension plans (statutory pension insurance).
Other provisionsOther provisions are liabilities of uncertain timing or amount. They are established to cover a present legal or constructive obligation to third parties based on past events that will probably lead to an outflow of resources. It must also be possible to reliably estimate the level of the obligation. If there are several obligations of the same type, the probability of an outflow of resources is calculated for these obligations as an aggregate. Restructuring provisions are only established if constructive obligations exist on the basis of a formal, detailed plan and those affected have been given justifiable expectations that the restructuring will be carried out.
Provisions are based on settlement obligations and take account of future cost increases. Non-current provisions are discounted. Current provisions and the current portion of non-current provisions are not discounted. Provisions are adjusted over time to take account of new findings.
The Long-Term Incentive Plans comprise performance-related remuneration plans for Evonik’s executives. The resulting obligations are determined and expensed in accordance with IAS 19 Employee Benefits.

Annual Report 2011 Evonik Industries98
Deferred taxes, other income taxesIn compliance with IAS 12 Income Taxes, deferred tax assets and liabilities are established for temporary valuation and recognition differences between the assets and liabilities recognized in the balance sheets prepared for tax purposes and those prepared in accordance with IFRS. Tax-deductible loss carryforwards that will probably be utilized in the future are capitalized at the amount of the deferred tax asset. Deferred tax assets are recognized on the assumption that sufficient future taxable income is likely to be realized to cover these temporary differences. Where the realization of deferred tax assets is unlikely, they are written down.
Deferred tax assets and liabilities are netted if the company is permitted to net other income tax assets and liabilities and if the deferred tax assets and liabilities relate to income taxes in the same tax jurisdiction.
The tax rates used to calculate deferred taxes are those valid under current legislation or that have been announced as being applicable as of the date when the temporary differences will probably be settled. The overall tax rate used to calculate deferred taxes for companies in Germany is 30 percent. In addition to 15 percent German corporation tax, the tax rate includes a solidarity surcharge of 5.5 percent of the German corporation tax and average trade tax of around 14 percent. For German companies that utilize the right to extended trade reductions pursuant to Section 9 No. 1 Sentence 2 ff of the German Trade Tax Act (GewStG), a tax rate of 16 percent is used to calculate deferred taxes. This corresponds to German corporation tax including the solidarity surcharge. The tax rates used for foreign companies are their national tax rates. These vary between 10 percent (Hungary) and 41 percent (Japan).
Other income taxes for the reporting period and previous periods are recognized on the basis of the expected payment or refund. They are calculated using the company-specific tax rates applicable on the reporting date.
Financial instrumentsFinancial instruments comprise contractually agreed rights and obligations resulting in an inflow or outflow of financial assets or the issue of equity instruments. They are divided into derivative and non-derivative financial instruments and are recognized on the balance sheet as financial assets or financial liabilities or as trade accounts receivable or trade accounts payable.
Financial instruments are initially measured at fair value plus any directly attributable transaction costs. Transaction costs for financial instruments held at fair value through profit or loss are included directly in the income statement. Fair value measurement is based on a three-level hierarchy. The fair value is the quoted price on an active market, if such price data are available (Level 1). If such data are not available, either the quoted price on an active market for similar financial instruments should be used, or a different valuation method based on inputs from observable price data should be used (Level 2). In all other cases, valuation methods that are not based on observable market data are used (Level 3). Discounted cash flow analyses or option pricing models have been selected as established valuation methods. To measure non-current financial instruments that do not bear interest at market rates, the expected future cash flows are discounted to the date of acquisition using the effective interest rate (present value). The effective interest rate takes account of all directly attributable fees that are by nature interest. Subsequent measurement is based on the classification of the financial instruments.

99Management report Consolidated financial statements Supplementary information
Basis of preparation of the financial statements
(a) Non-derivative financial instruments Evonik classifies non-derivative financial instruments as financial assets in the categories loans and receivables or available-for-sale. They are initially recognized at the settlement date. Financial assets are derecognized when the contractual rights to receive payments lapse or are transferred and the Group has transferred substantially all opportunities and risks associated with ownership. There were no instances where the Group sold financial assets through securitization or a repurchase agreement and the assets were still reported in full or in part in the financial statements.
Non-derivative financial instruments that constitute financial liabilities are recognized at amortized cost. Financial liabilities are derecognized when the obligation has been settled, canceled or expired.
The categories used by the Group are outlined below:Loans and receivables principally comprise trade accounts receivable and loans. The assets
assigned to this category are valued at amortized cost using the effective interest rate method. If there are objective indications based on historical empirical values that it will not be possible to collect the full amounts due under the customary conditions, an impairment loss is recognized. This is measured as the difference between the carrying amount of the asset and the present value of the estimated future payments calculated using the effective interest rate. Impairment losses are recognized in the income statement. If the original reason for the impairment loss no longer applies, it is reversed to income, but only up to the amortized cost.
Available-for-sale assets comprise equity instruments that are not consolidated or recognized at equity, and other securities. If no fair value is available for such assets or it cannot be determined reliably, for example, in the case of equity instruments that are not listed on a stock exchange, the assets are recognized at amortized cost. Changes in the fair value are recognized in other compre-hensive income, taking into account deferred taxes. Financial assets are examined for objective indications of impairment on every reporting date. A material or lasting reduction in the fair value to below the carrying amount is regarded as an indication of impairment. In the case of shares, this is considered to be the case if the fair value is 20 percent below the carrying amount. In such cases, the corresponding losses are derecognized from other comprehensive income and recognized in the income statement. If the reason for the impairment loss no longer applies, the reversal is recognized in other comprehensive income and thus has no impact on income. Only debt instruments that are allocated to this category are written back by up to the amount of the original impairment in the income statement. Impairment losses are not reversed if they apply to investments and other financial assets whose fair value cannot be reliably determined.
The category at amortized cost mainly refers to trade accounts payable and loans. The liabilities assigned to this category are valued at amortized cost using the effective interest rate method.
b) Derivative financial instrumentsDerivative financial instruments are used to hedge the risk of changes in exchange rates, the price of commodities and interest rates. Hedging instruments such as interest rate swaps, options, forward exchange contracts and forward commodity contracts are recognized on the balance sheet either on a stand-alone basis or as a valuation unit with the corresponding hedged items (hedge accounting). Initial recognition is on the trading date. If no stock exchange or market price is available for the derivative from an active market, the fair value is determined using financial valuation methods. For forward exchange contracts, the forward exchange rate as of the reporting date is used. The market price of options is determined using established option pricing models. Commodity derivatives are valued with the aid of spot prices and forward rates while interest rate derivatives are valued by discounting future cash flows.

Annual Report 2011 Evonik Industries100
Stand-alone financial derivatives are assigned to the category at fair value through profit or loss and classified as held for trading. Financial instruments assigned to this category are recognized at fair value on each reporting date. Any gain or loss resulting from a change in their fair value is recognized in the income statement.
Both the hedging instrument and the hedged item have to meet specific criteria to qualify for hedge accounting. In particular, hedge accounting requires extensive documentation of the hedg-ing relationship, together with evidence that the expected and actual effectiveness of the hedge is between 80 and 125 percent. A derivative no longer qualifies for hedge accounting if these conditions are not fulfilled. In the case of cash flow hedges, hedge accounting must also be halted if the forecast transaction no longer appears probable. In such cases, the amount recognized in other comprehensive income is reclassified to the income statement.
Depending on the type of hedge, hedging instruments for which hedge accounting is used, are valued as outlined below:
The purpose of fair value hedges is to hedge the fair value of assets or liabilities reflected on the balance sheet. Changes in the fair value of the hedging instrument are recognized in the income statement together with the change in the value of the hedged item. These changes must relate to the hedged risk. If off-balance-sheet firm commitments are hedged, changes in the fair value of the firm commitment resulting from changes in the hedged risk give rise to recognition of an asset or a liability which affects income. In view of this method, changes in the value of the hedged item and the hedging instrument offset each other in the income statement.
The purpose of cash flow hedges is to minimize the risk of volatility of future cash flows from a recognized asset or liability or a forecast transaction that is considered highly probable. The effective portion of changes in the fair value of a hedging instrument is recognized in other comprehensive income and the ineffective portion of the change in value is recognized in the income statement. Amounts recognized in other comprehensive income are reclassified to the income statement as soon as the hedged item has an impact on the income statement. In the case of interest rate hedges, such amounts are included in net interest income or expense, while in the case of sales hedges they are included in the corresponding sales revenues and for procurement hedges directly in the cost of sales. If the hedged future transaction comprises a non-financial asset or liability, the profit or loss previously recognized in other comprehensive income is included in the cost of acquisition of the asset or liability when it is initially recognized.
The purpose of a hedge of a net investment is to reduce the foreign currency risk involved in an investment in a company whose functional currency is not the euro. Such hedges are accounted for in the same way as cash flow hedges. Gains and losses recognized in other comprehensive income are reclassified to the income statement when the foreign subsidiary is divested or investment in it is reduced.
LeasingA lease comprises an agreement that transfers the right to use an asset for a certain period in return for one or more payments. The Group is party to various operating and finance leases as either lessor or lessee.
A lease is classified as a finance lease if, under the lease agreement, the lessee bears substantially all opportunities and risks associated with ownership of the asset. In addition to contractually agreed finance leases, lease agreements relating to the use of assets, for example, long-term supply agree-ments, may be classified as finance leases if they meet certain cumulative criteria. Where Evonik is the lessee, the assets are included in property, plant and equipment at fair value or at the present value of the non-cancelable minimum lease payments, whichever is the lower. The payment obliga-tions arising from future lease payments are recognized as a liability at the discounted settlement value. Where Evonik is the lessor, it recognizes a receivable equivalent to the net investment value rather than the property, plant and equipment.

101Management report Consolidated financial statements Supplementary information
Basis of preparation of the financial statements
Receivables and liabilities from finance leases are recognized on the balance sheet as financial assets or financial liabilities.
All leasing arrangements that are not finance leases are classified as operating leases. The related income and expenses are recognized in the income statement in the period in which they are received or incurred.
Assets held for sale and the associated liabilitiesNon-current assets are classified as held for sale if the corresponding carrying amount is to be realized principally through a sale transaction rather than through continued use. Such assets must be available for immediate sale in their present condition, on terms that are usual and customary for the sale of such assets, and sale must be highly probable. If the associated liabilities are to be sold with the asset as part of the transaction, these must also be presented separately.
The assets and liabilities must be measured in accordance with the relevant accounting standards immediately before initial classification as held for sale. They are subsequently valued at the lower of the carrying amount and fair value less costs to sell. Where the assets and liabilities do not fall within the scope of the measurement criteria set out in IFRS 5 Non-current Assets Held for Sale and Discontinued Operations, subsequent revaluation is performed in accordance with the relevant accounting standards. At Evonik these are mainly:• IAS 2 Inventories• IAS 12 Income Taxes• IAS 19 Employee Benefits and• IAS 39 Financial Instruments: Recognition and Measurement.Unless they are classified as discontinued operations, the results of the valuation and the sale of the asset are still included in income from continuing operations.
Discontinued operationsA discontinued operation is either a major line of business or geographical area of the company that is to be sold or shut down on the basis of a single coordinated plan, either as a whole or in parts, or a subsidiary acquired with a view to resale.
The income from the operating activities and the measurement and divestment of discontinued operations is reported separately from the continuing operations on the income statement. Similarly the cash flows from the operating activities of discontinued operations are reported separately from the continuing operations in the cash flow statement.

Annual Report 2011 Evonik Industries102
Government grantsGovernment grants for the purchase or construction of property, plant and equipment reduce the cost of acquisition or construction of such assets. They are reflected in the income statement over the useful life of the assets through lower depreciation. Other grants are accrued and recognized as income over the same period as the expenses for which they are expected to compensate.
Contingent liabilities and other financial commitmentsContingent liabilities, except for those recognized in connection with a business combination, are possible or present obligations arising from past events where an outflow of resources is not improbable but which are not recognized on the balance sheet.
Other financial commitments result from non-onerous executory contracts, continuous obli-gations, statutory requirements and other commercial obligations that are not already included in the liabilities shown on the balance sheet or in contingent liabilities and that are of significance for an assessment of the company’s financial position.
(4) Discussion of assumptions and estimation uncertaintiesThe preparation of consolidated financial statements involves assumptions and estimates about the future. Evidently, the subsequent circumstances do not always match the estimates made. Adjustments to estimates are recognized in income as soon as better information is available. The estimates and assumptions that constitute a considerable risk that the carrying amounts of assets and liabilities may have to be adjusted within the next fiscal year are discussed below.
(a) Impairment testing of goodwillTesting intangible assets, especially goodwill, for impairment also involves assumptions and estimates regarding, for example, future cash flows, expected growth rates, exchange rates and discount rates. The relevant assumptions may change, leading to impairment losses in future periods.
A relative increase of 10 percent in the weighted cost of capital (WACC) after taxes as a result of changes in capital market interest rates would not result in any impairment losses.
(b) Impairment testing of deferred tax assetsDeferred tax assets may only be recognized if it is probable that sufficient taxable income will be available in the future. Deferred taxes are calculated on the basis of the tax rates applicable on the date when temporary differences are likely to be reversed. If these expectations are not met, an impairment loss must be recognized in income for the deferred tax assets.

103Management report Consolidated financial statements Supplementary information
Discussion of assumptions and estimation uncertainties
(c) Impairment of other assetsEstimates are made about the useful life, depreciation/amortization period and value of other intangible assets, property, plant and equipment, investment property, investments and loans and receivables. These estimates are based on experience and planning data, which contain assumptions on business conditions, sector trends and the creditworthiness of customers.
If there is a considerable change in such assumptions or circumstances, the estimates have to be reviewed. This may result in impairment of the related assets.
(d) Valuation of provisions for pensions and other post-employment benefitsThe valuation of provisions for pensions and other post-employment benefits is subject, among other things, to assumptions about discount rates, the expected long-term return on plan assets, expected future salary and pension increases, the cost trend for health care and mortality tables. The actual data may differ from these assumptions as a result of changes in economic or market conditions.
A reduction of one percentage point in the discount rate would increase the present value of the defined benefit obligation by €1,204 million. Conversely, increasing the discount rate by one percentage point would decrease the defined benefit obligation by about €961 million.
If the trend in health-care costs were to increase by one percentage point, the accumulated health-care benefit obligation would increase by €11 million and pension expense would increase by €1 million. Conversely, a reduction of one percentage point in the cost trend would reduce the accumulated health-care obligation by €10 million and personnel expense by €1 million.
(e) Valuation of other provisionsOther provisions, especially provisions for recultivation and environmental protection, litigation risks and restructuring are naturally exposed to significant forecasting uncertainties regarding the level and timing of the obligation. The company has to make assumptions about the probability of occurrence of an obligation or future trends, such as value of the costs, on the basis of experience. Non-current provisions in particular are exposed to forecasting uncertainties. In addition, the level of non-current provisions depends to a large extent on the selection and development of the market-oriented discount rate. The Group uses different interest rates for different currencies and terms to maturity.

Annual Report 2011 Evonik Industries104
(5) Changes in the Group
(5.1) Scope of consolidation and list of shareholdingsAlongside Evonik Industries AG, the consolidated financial statements include all material subsidiaries in Germany and abroad. Material associated companies and joint ventures are recognized at equity.
Companies whose influence on the assets, financial position and earnings of the Group, both individually and in aggregate, is negligible are recognized at amortized cost.
The scope of consolidation changed as follows:
Number of companies Germany Other countries Total
Evonik Industries AG and consolidated subsidiaries
As of December 31, 2010 98 139 237
Acquisitions 2 1 3
Other companies consolidated for the first time 1 11 12
Divestments −31 −26 −57
Intragroup mergers − −3 −3
Other companies deconsolidated −2 −7 −9
As of December 31, 2011 68 115 183
Investments recognized at equity
As of December 31, 2010 9 7 16
Acquisitions − − −
Other investments recognized at equity for the first time 3 − 3
Divestments −1 − −1
Other companies deconsolidated − −2 −2
As of December 31, 2011 11 5 16
79 120 199
Further information on acquisitions and divestments in 2011 can be found in Note (5.2).The following list shows Evonik’s shareholdings in accordance with Section 313 Paragraph 2 of
the German Commercial Code (HGB). The shareholdings have been calculated in accordance with Section 16 of the German Stock Corporation Act (AktG). Accordingly, the calculation includes shares held by the parent company, a subsidiary included in the consolidated financial statements or a person acting on behalf of these companies.
German subsidiaries that made use of the provisions of Sections 264 Paragraph 3 and 264 b of the German Commercial Code on exemption from disclosure of annual financial statements and the preparation of notes to their financial statements and a management report are indicated.
Companies in which Evonik’s shareholding amounts to more than 50 percent of the capital but which are recognized at equity as it does not have a majority of the voting rights are also indicated.

105Management report Consolidated financial statements Supplementary information
Changes in the Group
The following subsidiaries are included in the consolidated annual financial statements:
Name of company Registered office Shareholding in %
Consolidated subsidiaries
Germany
Aachener Bergmannssiedlungsgesellschaft mbH Hückelhoven 100.00
AQura GmbH Hanau 1) 100.00
ASTA Medica GmbH Essen 100.00
Bauverein Glückauf GmbH Ahlen 94.90
BHS Liegenschaften GmbH & Co. KG Peißenberg 100.00
BHS Liegenschaften Verwaltungs-GmbH Peißenberg 100.00
BHS Projektentwicklungs-GmbH & Co. KG Peißenberg 100.00
BK-Wolfgang-Wärme GmbH Hanau 100.00
CyPlus GmbH Hanau 1) 100.00
EBV Gesellschaft mit beschränkter Haftung Hückelhoven 100.00
Evonik Beteiligungs-GmbH Frankfurt am Main 1) 100.00
Evonik Chempower GmbH Essen 100.00
Evonik Degussa GmbH Essen 1) 100.00
Evonik Degussa Immobilien GmbH & Co. KG Marl 100.00
Evonik Degussa Immobilien Verwaltungs-GmbH Marl 100.00
Evonik Goldschmidt GmbH Essen 1) 100.00
Evonik Goldschmidt Rewo GmbH Steinau an der Straße 100.00
Evonik Gorapur GmbH Wittenburg 1) 100.00
Evonik Litarion GmbH Kamenz 100.00
Evonik Oxeno GmbH Marl 1) 100.00
Evonik Peroxygens GmbH Essen 1) 100.00
Evonik Peroxygens Holding GmbH Essen 100.00
Evonik Persalze GmbH Essen 100.00
Evonik Polymer Technologies GmbH Wörth am Main 1) 100.00
Evonik Projekt-Beteiligungs-GmbH & Co. KG Essen 99.00
Evonik Projekt-Beteiligung Verwaltungs-GmbH Essen 100.00
Evonik Risk and Insurance Services GmbH Essen 1) 100.00
Evonik RohMax Additives GmbH Darmstadt 1) 100.00
Evonik Röhm GmbH Darmstadt 1) 100.00
Evonik Services GmbH Essen 1) 100.00
Evonik Stockhausen GmbH Krefeld 1) 100.00
Evonik Technochemie GmbH Dossenheim 100.00
Evonik Tego Chemie GmbH Essen 1) 100.00
Evonik Wohnen GmbH Essen 100.00
1) Utilizes the exemptions permitted under Sections 264 Paragraph 3 and 264 b of the German Commercial Code.

Annual Report 2011 Evonik Industries106
Name of company Registered office Shareholding in %
Consolidated subsidiaries
Goldschmidt ETB GmbH Berlin 1) 100.00
Goldschmidt SKW Surfactants GmbH Essen 100.00
hanse chemie AG Geesthacht 100.00
Haus Vogelsang GmbH Essen 100.00
HD Ceracat GmbH Frankfurt am Main 100.00
Heinrich Schäfermeyer GmbH Hückelhoven 100.00
Hüls Service GmbH Marl 1) 100.00
Industriepark Wolfgang GmbH Hanau 1) 100.00
Infracor GmbH Marl 1) 100.00
Infracor Lager- und Speditions-GmbH Marl 1) 100.00
KMV Vermögensverwaltungs-GmbH Marl 100.00
Li-Tec Battery GmbH Kamenz 50.10
Lünener Wohnungs- und Siedlungsgesellschaft mbH Lünen 100.00
Mönch-Kunststofftechnik GmbH Bad König 1) 100.00
Nanoresins AG Geesthacht 100.00
R & B Industrieanlagenverwertung GmbH Essen 100.00
RBV Verwaltungs-GmbH Essen 100.00
RCIV Vermögensverwaltungs-GmbH Essen 100.00
Rhein Lippe Wohnen GmbH Duisburg 100.00
RHZ Handwerks-Zentrum GmbH Gladbeck 100.00
RIAG Immobilienverwaltung GmbH Essen 100.00
RÜTGERS Dienstleistungs-GmbH Essen 100.00
RÜTGERS GmbH Essen 100.00
RÜTGERS Rail Verwaltungs GmbH Essen 100.00
Siedlung Niederrhein GmbH Dinslaken 100.00
Stockhausen Unterstützung-Einrichtungs GmbH Krefeld 100.00
Th. Goldschmidt-Fürsorge GmbH Essen 100.00
Vivawest GmbH Essen 100.00
Walsum Immobilien GmbH Duisburg 94.90
Westgas GmbH Marl 100.00
Wohnbau Auguste Victoria GmbH Marl 100.00
Wohnbau Westfalen GmbH Dortmund 100.00
Wohnungsbaugesellschaft mbH „Glückauf“ Moers 100.00
Other countries
Aktivsauerstoff GmbH Treibach-Althofen (Austria) 51.00
Asian Bleaching Earth Company Ltd. (i.L.) Kongmadue (Thailand) 100.00
Colortrend Australia Pty Ltd. Dandenong (Victoria, Australia) 100.00
1) Utilizes the exemptions permitted under Sections 264 Paragraph 3 and 264 b of the German Commercial Code.

107Management report Consolidated financial statements Supplementary information
Changes in the Group
Name of company Registered office Shareholding in %
Consolidated subsidiaries
Colortrend Canada Inc. Brampton (Canada) 100.00
Colortrend USA LLC Wilmington (Delaware, USA) 100.00
Cosmoferm B.V. Delft (Netherlands) 100.00
Degussa Africa Holdings (Pty) Ltd. Johannesburg (South Africa) 84.37
Degussa International Inc. Wilmington (Delaware, USA) 100.00
Degussa Limited Milton Keynes (UK) 100.00
Degussa Re S.A. Luxembourg (Luxembourg) 100.00
Degussa SKW Co. Milton Keynes (UK) 100.00
Egesil Kimya Sanayi ve Ticaret A.S. Istanbul (Turkey) 51.00
EGL Ltd. Milton Keynes (UK) 100.00
Evonik Aerosil France S.A.R.L. Salaise-sur-Sanne (France) 100.00
Evonik Agroferm Zrt. Kaba (Hungary) 100.00
Evonik Amalgamation Ltd. Milton Keynes (UK) 100.00
Evonik Australia Pty Ltd. Dandenong (Victoria, Australia) 100.00
Evonik Canada Inc. Burlington (Canada) 100.00
Evonik Carbon Black Nederland B.V. Botlek (Netherlands) 100.00
Evonik CB LLC Wilmington (Delaware, USA) 100.00
Evonik Colortrend B.V. Maastricht (Netherlands) 100.00
Evonik Cristal Materials Corporation Taipei (Taiwan) 52.00
Evonik Cyro Canada Inc. Etobicoke (Canada) 100.00
Evonik Cyro LLC Parsippany (New Jersey, USA) 100.00
Evonik Degussa Africa (Pty) Ltd. Johannesburg (South Africa) 100.00
Evonik Degussa Antwerpen N.V. Antwerp (Belgium) 99.99
Evonik Degussa Argentina S.A. Buenos Aires (Argentina) 100.00
Evonik Degussa Brasil Ltda. São Paulo (Brazil) 100.00
Evonik Degussa Canada Inc. Burlington (Canada) 100.00
Evonik Degussa Carbons, Inc. Parsippany (New Jersey, USA) 100.00
Evonik Degussa Chile S.A. Santiago (Chile) 99.99
Evonik Degussa (China) Co., Ltd. Beijing (China) 100.00
Evonik Degussa Corporation Parsippany (New Jersey, USA) 100.00
Evonik Degussa France Groupe S.A.S. Ham (France) 100.00
Evonik Degussa Gulf FZE Dubai (United Arab Emirates) 100.00
Evonik Degussa Hong Kong Ltd. Hong Kong (Hong Kong) 100.00
Evonik Degussa Ibérica S.A. Granollers (Spain) 100.00
Evonik Degussa India Pvt. Ltd. Mumbai (India) 100.00
Evonik Degussa International AG Zurich (Switzerland) 100.00
Evonik Degussa Iran AG Teheran (Iran) 100.00

Annual Report 2011 Evonik Industries108
Name of company Registered office Shareholding in %
Consolidated subsidiaries
Evonik Degussa Italia S.p.A. Milan (Italy) 100.00
Evonik Degussa Japan Co., Ltd. Tokyo (Japan) 100.00
Evonik Degussa Korea Ltd. Incheon (South Korea) 100.00
Evonik Degussa Mexico S.A. de C.V. Mexico City (Mexico) 100.00
Evonik Degussa Mexico Servicios, S.A. de C.V. Mexico City (Mexico) 100.00
Evonik Degussa Peroxid GmbH Klagenfurt (Austria) 100.00
Evonik Degussa Peroxide Ltd. Morrinsville (New Zealand) 100.00
Evonik Degussa (SEA) Pte. Ltd. Singapore (Singapore) 100.00
Evonik Degussa Services LLC Wilmington (Delaware, USA) 100.00
Evonik Degussa Specialty Chemicals (Shanghai) Co., Ltd. Shanghai (China) 100.00
Evonik Degussa Taiwan Ltd. Taipei (Taiwan) 100.00
Evonik Degussa (Thailand) Ltd. Bangkok (Thailand) 100.00
Evonik Degussa Ticaret Ltd. Sirketi Tuzla/Istanbul (Turkey) 100.00
Evonik Degussa UK Holdings Ltd. Milton Keynes (UK) 100.00
Evonik Fermas s.r.o. Slovenská L’upča (Slovakia) 100.00
Evonik Fibres GmbH Schörfling (Austria) 100.00
Evonik Finance B.V. Amsterdam (Netherlands) 100.00
Evonik Foams Inc. Magnolia (Arkansas, USA) 100.00
Evonik Forhouse Optical Polymers Corporation Taichung (Taiwan) 51.00
Evonik Goldschmidt Corp. Hopewell (Virginia, USA) 100.00
Evonik Goldschmidt UK Ltd. Milton Keynes (UK) 100.00
Evonik International Holding B.V. Amsterdam (Netherlands) 100.00
Evonik Jayhawk Fine Chemicals Corporation Galena (Kansas, USA) 100.00
Evonik MedAvox SpA (i.L.) Milan (Italy) 100.00
Evonik Membrane Extraction Technology Limited Milton Keynes (UK) 100.00
Evonik Methionine SEA Pte. Ltd. Singapore (Singapore) 100.00
Evonik Metilatos S.A. Rosario (Argentina) 100.00
Evonik Mexico S.A. de C.V. Mexico City (Mexico) 100.00
Evonik Monosilane Japan Co., Ltd. Tokyo (Japan) 100.00
Evonik Oxeno Antwerpen N.V. Antwerp (Belgium) 100.00
Evonik Para-Chemie GmbH Gramatneusiedl (Austria) 99.00
Evonik Pension Scheme Trustee Limited Milton Keynes (UK) 100.00
Evonik Peroxide Africa (Pty) Ltd. Umbogintwini (South Africa) 100.00
Evonik Rexim (Nanning) Pharmaceutical Co., Ltd. Nanning (China) 100.00
Evonik Rexim S.A.S. Ham (France) 100.00
Evonik RohMax Asia Pacific Pte. Ltd. Singapore (Singapore) 100.00

109Management report Consolidated financial statements Supplementary information
Changes in the Group
Name of company Registered office Shareholding in %
Consolidated subsidiaries
Evonik RohMax Canada Inc. Morrisburg (Canada) 100.00
Evonik RohMax France S.A.S. Lauterbourg (France) 100.00
Evonik RohMax USA, Inc. Horsham (Pennsylvania, USA) 100.00
Evonik Sanzheng Chongqing Fine Chemical Co., Ltd. Chongqing (China) 100.00
Evonik Sanzheng (Yingkou) Fine Chemicals Co., Ltd. Yingkou (China) 65.00
Evonik Silquimica S.A. Zubillaga-Lantaron (Spain) 100.00
Evonik Solar Norge AS Trondheim (Norway) 100.00
Evonik Speciality Organics Ltd. Milton Keynes (UK) 100.00
Evonik Stockhausen LLC Greensboro (North Carolina, USA) 100.00
Evonik Thai Aerosil Co. Ltd. Bangkok (Thailand) 100.00
Evonik Tianda (Liaoyang) Chemical Additive Co., Ltd. Liaoyang (China) 97.04
Evonik United Silica Industrial Ltd. Tao Yuan (Taiwan) 100.00
Evonik United Silica (Siam) Ltd. Rayong (Thailand) 70.00
Evonik Wellink Silica (Nanping) Co., Ltd. Nanping (China) 60.00
Insilco Ltd. New Delhi (India) 73.11
Inspec Fine Chemicals Ltd. Milton Keynes (UK) 100.00
JIDA Evonik High Perfomance Polymers (Changchun) Co., Ltd. Changchun (China) 80.00
Laporte Chemicals Ltd. Milton Keynes (UK) 100.00
Laporte do Brasil Ltda. São Paulo (Brazil) 100.00
Laporte Group Pension Trustees Ltd. (i.L.) London (UK) 100.00
Laporte Industries Ltd. Milton Keynes (UK) 100.00
Laporte Materials (Barrow) Ltd. (i.L.) Milton Keynes (UK) 100.00
Laporte Nederland (Holding) B.V. Amsterdam (Netherlands) 100.00
Laporte Organisation Ltd. (i.L.) London (UK) 100.00
Laporte Properties Limited (i.L.) Milton Keynes (UK) 100.00
Nilok Chemicals Inc. (i.L.) Parsippany (New Jersey, USA) 100.00
Nippon Aerosil Co., Ltd. Tokyo (Japan) 80.00
OOO Destek Podolsk (Russian Federation) 59.00
OOO Evonik Chimia Moscow (Russian Federation) 100.00
Peter Spence & Sons Limited (i.L.) Milton Keynes (UK) 100.00
PT. Evonik Indonesia Cikarang Bekasi (Indonesia) 100.00
PT. Evonik Sumi Asih Bekasi Timur (Indonesia) 75.00
Qingdao Evonik Chemical Co., Ltd. Jiaozhou (China) 52.00
R + J Garroway Limited (i.L.) Glasgow (UK) 100.00
Roha B.V. Tilburg (Netherlands) 100.00
RÜTGERS Organics Corporation State College (Pennsylvania, USA) 100.00

Annual Report 2011 Evonik Industries110
Name of company Registered office Shareholding in %
Consolidated subsidiaries
SKC Evonik Peroxide Korea Co., Ltd. Ulsan (South Korea) 55.00
Stockhausen Nederland B.V. Amsterdam (Netherlands) 100.00
The St. Bernard Insurance Company Ltd. Douglas (Isle of Man) 100.00
The following joint ventures and associated companies are included in the consolidated financial statements using the equity method:
Name of company Registered office Shareholding in %
Joint ventures (recognized at equity)
Germany
StoHaas Management GmbH Marl 50.00
StoHaas Monomer GmbH & Co. KG Marl 50.00
THS GmbH Essen 50.00
Vivawest Wohnen GmbH Essen 50.00
Other countries
Daicel-Evonik Ltd. Tokyo (Japan) 50.00
Evonik Headwaters LLP Milton Keynes (UK) 50.00
Evonik Lanxing (Rizhao) Chemical Industrial Co., Ltd. Rizhao (China) 50.00
Perorsa – Peróxidos Orgánicos S.A. (i.L.) Barcelona (Spain) 50.00
Associated companies (recognized at equity)
Germany
ARG mbH & Co. KG Duisburg 20.28
Deutsche Industrieholz GmbH Essen 45.00
JSSi GmbH Freiberg 1) 51.00
RAG Verkauf GmbH Herne 49.00
STEAG GmbH Essen 49.00
TÜV Nord InfraChem GmbH & Co. KG Marl 49.00
TÜV Nord InfraChem Verwaltungsgesellschaft mbH Marl 49.00
Other countries
DSL. Japan Co., Ltd. Tokyo (Japan) 1) 51.00
1) Recognized at equity as Evonik does not have a majority of the voting rights.

111Management report Consolidated financial statements Supplementary information
Changes in the Group
The following companies are included in the consolidated financial statements at amortized cost:
Name of company Registered office Shareholding in %
Non-consolidated subsidiaries (recognized at amortized cost)
Germany
BF Technik GmbH Hückelhoven 100.00
Evonik Degussa Anlagen-Betriebs Verwaltungs-GmbH Essen 100.00
GSB Gesellschaft zur Sicherung von Bergmannswohnungen mbH Essen 50.00
PKU Pulverkautschuk Union GmbH (i.L.) Marl 100.00
RWS Wohnpark Sanssouci GmbH Essen 67.10
SJ Brikett- und Extrazitfabriken GmbH Hückelhoven 100.00
Studiengesellschaft Kohle mbH Mülheim 69.99
Other countries
Ariens Steenfabriek I B.V. Almelo (Netherlands) 100.00
Colortrend Colorants (Shanghai) Co., Ltd. Shanghai (China) 100.00
Evonik Degussa Praha s.r.o. (i.L.) Prague (Czech Republic) 100.00
Evonik Degussa Romania S.R.L. (i.L.) Bucharest (Romania) 100.00
Evonik Degussa UK Services Ltd. (i.L.) Milton Keynes (UK) 100.00
Inspec Finance Ltd. Milton Keynes (UK) 100.00
Inspec Invesco Milton Keynes (UK) 100.00
Laporte Invesco Milton Keynes (UK) 100.00
RÜTGERS S.r.L. (i.L.) Milan (Italy) 99.99
Sarclear Ltd. (i.L.) Milton Keynes (UK) 100.00
SKW Chemicals UK Ltd. Milton Keynes (UK) 100.00
Joint ventures (recognized at amortized cost)
Germany
Landschaftsagentur Plus GmbH Essen 50.00
Other countries
Taiyo Nippon Sanso Silane Gas Service Corporation Tokyo (Japan) 25.00
Associated companies (recognized at amortized cost)
Germany
ARG Verwaltungs GmbH Duisburg 20.00
Interkommunale Entwicklungsgesellschaft Hückelhoven-Wassenberg mbH Hückelhoven 25.00
Umschlagsterminal Marl GmbH & Co. KG Marl 50.00
Umschlagsterminal Marl Verwaltungsgesellschaft mbH Marl 50.00
Wohnbau Dinslaken GmbH Dinslaken 46.45

Annual Report 2011 Evonik Industries112
(5.2) Acquisitions and divestmentsThis section provides a more detailed overview of the changes in the scope of consolidation in the reporting period, divided into acquisitions and divestments.
AcquisitionsEvonik acquired the RESOMER business from the Boehringer Ingelheim Group, Ingelheim (Germany) on February 28, 2011 through an asset deal. This business comprises standard and custom-tailored polymer products for use in medical applications and the production of pharma-ceutical formulations, and has been integrated into the Consumer, Health & Nutrition segment. Through this transaction, Evonik aims to strengthen its position as a strategic partner for the pharmaceutical industry.
With effect from May 12, 2011 Evonik acquired the hanse chemie Group from a group of sellers. The transaction comprised the acquisition of all shares in hanse chemie AG and nanoresins AG, both of Geesthacht (Germany). The hanse chemie Group supplies products for specialty silicone chemistry applications and thus complements Evonik’s existing operations with silicone-based products. Most of the business has been integrated into the Consumer, Health & Nutrition segment. As a result of this acquisition, three subsidiaries were consolidated for the first time.
Effective October 31, 2011 Evonik acquired the metallurgical production of solar silicon (Solsilc process) from FESIL Sunergy AS and Solsilc Development Company AS, both of Trondheim (Norway), through an asset deal. These operations have been integrated into the Resource Efficiency segment. The Solsilc process is an excellent basis for Evonik to further optimize raw materials for the production of solar silicon.
On November 17, 2011 Evonik acquired the pharmaceuticals business of SurModics Pharma-ceuticals Inc., Birmingham (Alabama, USA) by means of an asset deal. This business is specialized in the development of controlled-release pharmaceutical delivery forms for parenteral applications (injections). This acquisition has given Evonik access to leading-edge knowledge in this field and strengthens its offering for the pharmaceutical market. The business comprises two sites in Birmingham with 75 employees and has been integrated into the Consumer, Health & Nutrition segment.
Name of company Registered office Shareholding in %
Other investments (recognized at amortized cost)
Germany
Faserwerke Hüls GmbH Marl 50.00
Industriepark Münchsmünster GmbH & Co. KG Münchsmünster 30.00
Industriepark Münchsmünster Verwaltungs-GmbH Königstein 38.00
Other countries
Aerosil Regional Representative Office Ltd. Bangkok (Thailand) 49.00
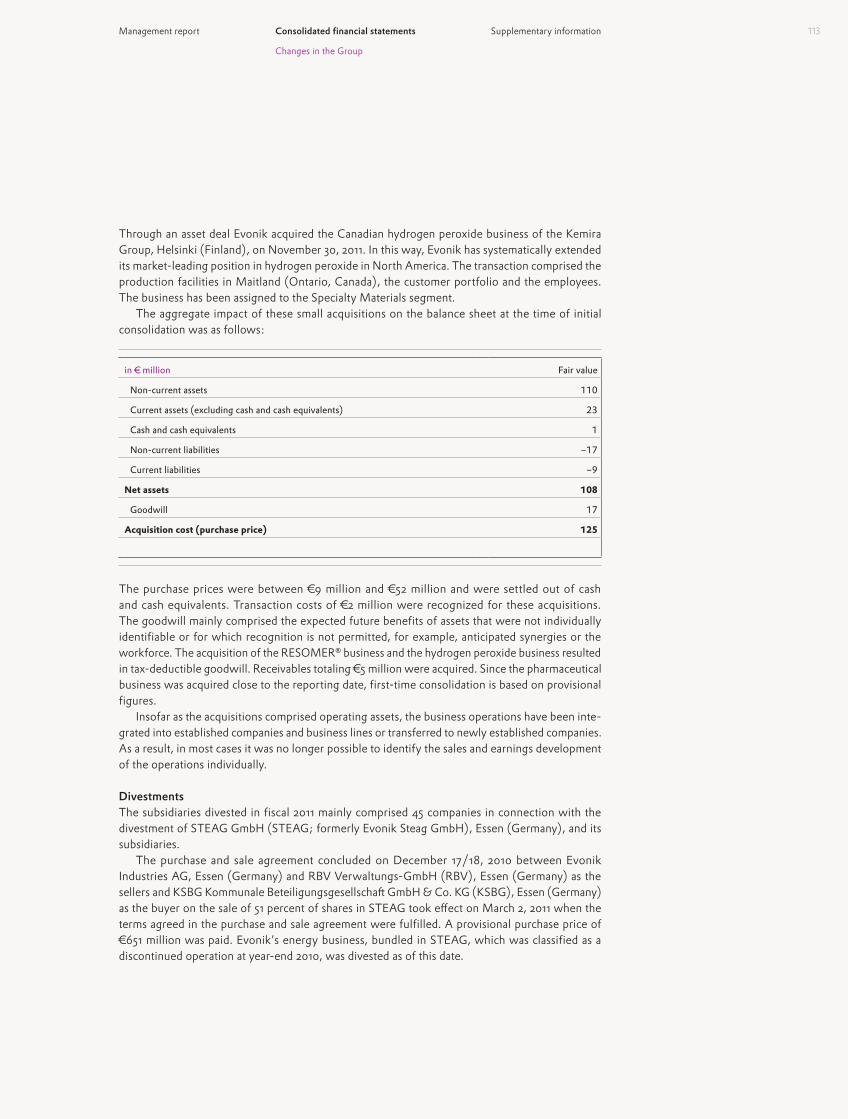
113Management report Consolidated financial statements Supplementary information
Changes in the Group
Through an asset deal Evonik acquired the Canadian hydrogen peroxide business of the Kemira Group, Helsinki (Finland), on November 30, 2011. In this way, Evonik has systematically extended its market-leading position in hydrogen peroxide in North America. The transaction comprised the production facilities in Maitland (Ontario, Canada), the customer portfolio and the employees. The business has been assigned to the Specialty Materials segment.
The aggregate impact of these small acquisitions on the balance sheet at the time of initial consolidation was as follows:
in € million Fair value
Non-current assets 110
Current assets (excluding cash and cash equivalents) 23
Cash and cash equivalents 1
Non-current liabilities −17
Current liabilities −9
Net assets 108
Goodwill 17
Acquisition cost (purchase price) 125
The purchase prices were between €9 million and €52 million and were settled out of cash and cash equivalents. Transaction costs of €2 million were recognized for these acquisitions. The goodwill mainly comprised the expected future benefits of assets that were not individually identifiable or for which recognition is not permitted, for example, anticipated synergies or the workforce. The acquisition of the RESOMER business and the hydrogen peroxide business resulted in tax-deductible goodwill. Receivables totaling €5 million were acquired. Since the pharmaceutical business was acquired close to the reporting date, first-time consolidation is based on provisional figures.
Insofar as the acquisitions comprised operating assets, the business operations have been inte-grated into established companies and business lines or transferred to newly established companies. As a result, in most cases it was no longer possible to identify the sales and earnings development of the operations individually.
DivestmentsThe subsidiaries divested in fiscal 2011 mainly comprised 45 companies in connection with the divestment of STEAG GmbH (STEAG; formerly Evonik Steag GmbH), Essen (Germany), and its subsidiaries.
The purchase and sale agreement concluded on December 17/18, 2010 between Evonik Industries AG, Essen (Germany) and RBV Verwaltungs-GmbH (RBV), Essen (Germany) as the sellers and KSBG Kommunale Beteiligungsgesellschaft GmbH & Co. KG (KSBG), Essen (Germany) as the buyer on the sale of 51 percent of shares in STEAG took effect on March 2, 2011 when the terms agreed in the purchase and sale agreement were fulfilled. A provisional purchase price of €651 million was paid. Evonik’s energy business, bundled in STEAG, which was classified as a discontinued operation at year-end 2010, was divested as of this date.

Annual Report 2011 Evonik Industries114
The remaining 49 percent of the shares in STEAG were remeasured at fair value as of this date and included in the consolidated financial statements at equity.
Further, an option agreement was concluded in December 2010. Under this agreement KSBG has an option to purchase the remaining 49 percent of shares (call option) between January 1, 2014 and December 31, 2017 while RBV has an option to sell the remaining 49 percent of the shares (put option) between January 1, 2016 and December 31, 2016.
On April 16, 2011 Evonik signed an agreement to sell its carbon black business to Kinove German Bidco GmbH, Frankfurt am Main (Germany). The purchaser is an investment company owned by investment funds managed and advised by Rhône Capital (New York, USA) and Triton Partners (Jersey, Channel Islands). The sale of the carbon black business, which was previously part of the Resource Efficiency segment, was closed on July 29, 2011. Including obligations to be assumed, the value of this transaction was more than €900 million. The agreed transaction comprised the assets and liabilities of carbon black companies in Europe, North America, Asia, Brazil, and South Africa. A small part of this business still has to be divested separately. This transaction resulted in the deconsolidation of ten subsidiaries and one company included at equity.
On May 30, 2011 Evonik and Dalian Kionge Group Co., Ltd., Dalian (China) signed an agreement on the divestment of the shares in the subsidiary Evonik Lynchem Co., Ltd., Dalian (China). The shares were transferred on August 30, 2011. Until then, this company formed part of the Consumer, Health & Nutrition segment.
On June 23, 2011 Evonik and Kaneka Belgium N.V., Westerlo-Oevel (Belgium) signed an asset deal comprising divestment of the plastic additives and plastisols business. The assets were transferred on July 29, 2011. This business was previously reported as part of the Resource Efficiency segment.
Following the divestment of a major part of the energy business, two companies that had been assigned to the energy business remained in the Evonik Group. On July 12, 2011 an agreement was signed with RAG Beteiligungs-GmbH, Herne (Germany) to sell a 2 percent stake in RAG Verkauf GmbH, Herne (formerly RVG GmbH, Essen), in which Evonik held 51 percent of the shares. As a result of this divestment, Evonik lost control of the capital and voting rights in RAG Verkauf GmbH (RAG Verkauf) and its subsidiary WSA GmbH, Herne (Germany), effective July 31, 2011. The 49 percent stake in RAG Verkauf still held by Evonik was remeasured at fair value as of this date and is included in the consolidated financial statements at equity. At the same time it was agreed that the remaining 49 percent stake would be transferred to RAG Beteiligungs-GmbH for a fixed price as of January 1, 2013. At year-end 2010 these companies were classified as discontinued operations. Following deconsolidation of the former Energy Business Area, the two companies were included in “Corporate, other operations, consolidation” until their divestment.
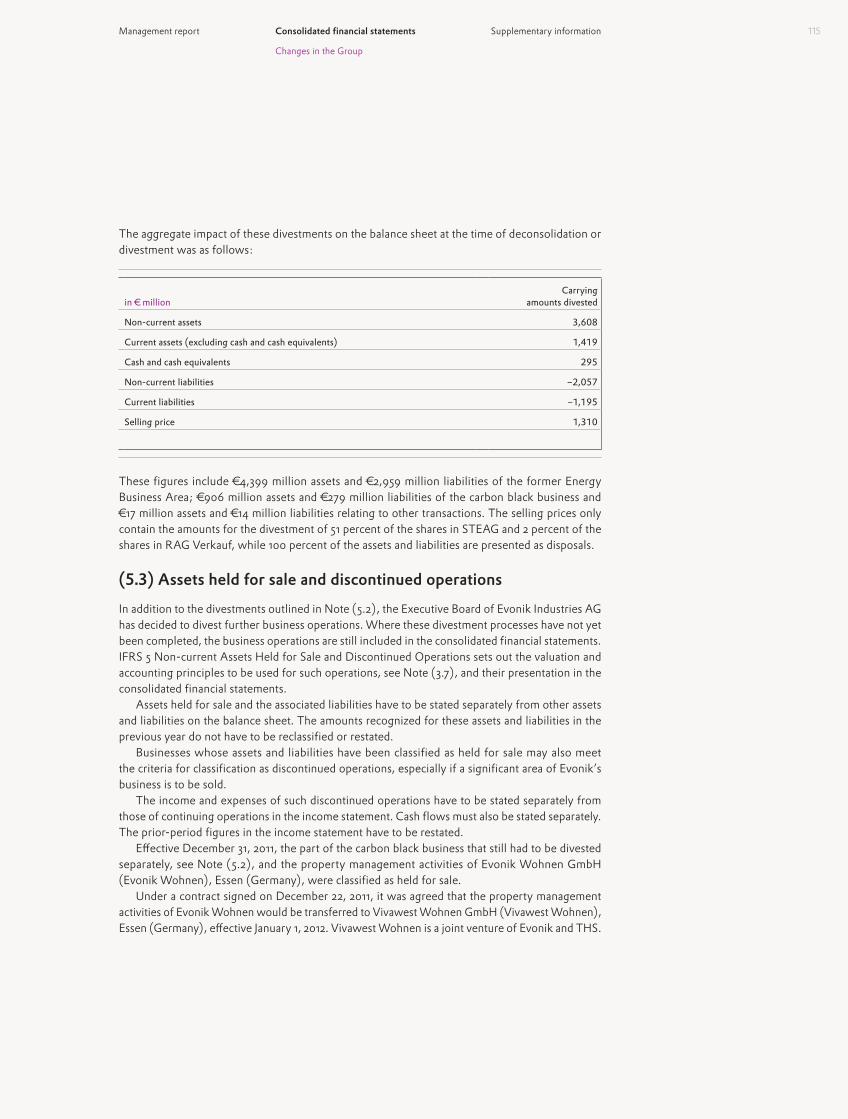
115Management report Consolidated financial statements Supplementary information
Changes in the Group
The aggregate impact of these divestments on the balance sheet at the time of deconsolidation or divestment was as follows:
in € millionCarrying
amounts divested
Non-current assets 3,608
Current assets (excluding cash and cash equivalents) 1,419
Cash and cash equivalents 295
Non-current liabilities −2,057
Current liabilities −1,195
Selling price 1,310
These figures include €4,399 million assets and €2,959 million liabilities of the former Energy Business Area; €906 million assets and €279 million liabilities of the carbon black business and €17 million assets and €14 million liabilities relating to other transactions. The selling prices only contain the amounts for the divestment of 51 percent of the shares in STEAG and 2 percent of the shares in RAG Verkauf, while 100 percent of the assets and liabilities are presented as disposals.
(5.3) Assets held for sale and discontinued operationsIn addition to the divestments outlined in Note (5.2), the Executive Board of Evonik Industries AG has decided to divest further business operations. Where these divestment processes have not yet been completed, the business operations are still included in the consolidated financial statements. IFRS 5 Non-current Assets Held for Sale and Discontinued Operations sets out the valuation and accounting principles to be used for such operations, see Note (3.7), and their presentation in the consolidated financial statements.
Assets held for sale and the associated liabilities have to be stated separately from other assets and liabilities on the balance sheet. The amounts recognized for these assets and liabilities in the previous year do not have to be reclassified or restated.
Businesses whose assets and liabilities have been classified as held for sale may also meet the criteria for classification as discontinued operations, especially if a significant area of Evonik’s business is to be sold.
The income and expenses of such discontinued operations have to be stated separately from those of continuing operations in the income statement. Cash flows must also be stated separately. The prior-period figures in the income statement have to be restated.
Effective December 31, 2011, the part of the carbon black business that still had to be divested separately, see Note (5.2), and the property management activities of Evonik Wohnen GmbH (Evonik Wohnen), Essen (Germany), were classified as held for sale.
Under a contract signed on December 22, 2011, it was agreed that the property management activities of Evonik Wohnen would be transferred to Vivawest Wohnen GmbH (Vivawest Wohnen), Essen (Germany), effective January 1, 2012. Vivawest Wohnen is a joint venture of Evonik and THS.

Annual Report 2011 Evonik Industries116
At the end of 2010, the former Energy Business Area was classified for the first time as held for sale and also met the criteria for classification as a discontinued operation. Following the divestment of a majority stake in 2011 it was deconsolidated, see Note (5.2). Further, post-divestment income and expenses resulted from past transactions which were classified as discontinued operations. These related to the divestment of the tar refining and initiators activities, food ingredients and construction chemicals.
The table shows the main impact of the discontinued operations on the income statement, broken down into operating earnings and the gain or loss on divestment:
Income statementOperating earnings after taxes
Divestment gains/losses after taxes
Income after taxes from discontinued operations
in € million 2011 2010 2011 2010 2011 2010
Former Energy Business Area 16 249 −106 −251 −90 −2
Other discontinued operations − − 12 −5 12 −5
16 249 −94 −256 −78 −7
In connection with the deconsolidation of the former Energy Business Area in 2011, a divestment loss was recognized, along with further additions to provisions to account for the risks associated with the indemnity agreements given to KSBG in the purchase and sale agreement. These expenses amounted to €106 million and are contained in divestment gains/losses.
In connection with the reclassification of the former Energy Business Area, impairment losses of €1 million and provisions of €4 million were recognized in 2010. The resulting expenses were included in the operating earnings of the discontinued operations. The strategic refocusing of Evonik on specialty chemicals represented a fundamental reorganization of the Group and led to the divestment of the Energy Business Area. In connection with this, Evonik established provisions of €251 million. The resulting expenses was included in full in the divestment gains/losses from discontinued operations.
€13 million of the loss resulting from the deconsolidation of the former Energy Business Area relates to the remeasurement of the remaining 49 percent shareholding in STEAG and therefore has to be shown under the divestment gains/losses from discontinued operations.

117Management report Consolidated financial statements Supplementary information
Changes in the Group
The following income and expense items relate to the operating earnings of the former Energy Business Area:
Income statement
in € million 2011 2010
Income 700 2,967
Expenses −649 −2,639
Operating earnings before income taxes, discontinued operations 51 328
Income taxes −35 −79
Operating earnings after taxes, discontinued operations 16 249
The divestment gains/losses from discontinued operations comprise the following:
Income statement
in € million 2011 2010
Income before income taxes from the divestment of discontinued operations −93 −255
Former Energy Business Area −105 −251
Other discontinued operations 12 −4
Income taxes −1 −1
Former Energy Business Area −1 −
Other discontinued operations from previous years − −1
Income after taxes from the divestment of discontinued operations −94 −256
Former Energy Business Area −106 −251
Other discontinued operations from previous years 12 −5

Annual Report 2011 Evonik Industries118
The assets and liabilities reclassified on the balance sheet as of December 31, 2011 included the carbon black activities that still had to be divested separately and the property management activities of Evonik Wohnen. In 2010 they were made up entirely of the assets and liabilities of the former Energy Business Area.
Balance sheet
in € million Dec. 31, 2011 Dec. 31, 2010
Intangible assets − 442
Property, plant and equipment 9 1,534
Investment property − 11
Investments recognized at equity − 94
Financial assets − 1,100
Deferred taxes/other income tax assets 6 121
Inventories 9 281
Trade accounts receivable 18 589
Other receivables 4 82
Cash and cash equivalents 1 248
Assets held for sale 47 4,502
Provisions for pensions and other post-employment benefits 29 555
Other provisions 27 335
Deferred taxes/other income taxes liabilities − 115
Financial liabilities 11 1,314
Trade accounts payable 3 507
Miscellaneous 18 141
Liabilities associated with assets held for sale 88 2,967
On the cash flow statement the cash flows from the operating, investing and financing activities of the discontinued operations only comprise cash flows generated through transactions with third parties. The net cash flows reflect the change in cash and cash equivalents and intra-Group cash pooling activities.

119Management report Consolidated financial statements Supplementary information
Notes to the income statement
(6) Notes to the income statement
(6.1) Sales
in € million 2011 2010
Revenues from the sale of goods and services 14,178 12,950
Revenues from investment property 362 350
14,540 13,300
(6.2) Other operating income
in € million 2011 2010
Income from the disposal of assets 14 11
Income from the reversal of provisions 120 61
Income from the reversal of deferred items 2 4
Income from the reversal of impairment losses 19 32
Income from the measurement of derivatives (excluding interest rate derivatives) 375 374
Gains on currency translation of monetary assets and liabilities 272 318
Income from non-core operations 92 71
Income from insurance refunds 11 6
Income from research subsidies 16 7
Other income 100 84
1,021 968
Income from the disposal of assets comprises €7 million (2010: €8 million) from the divestment of property, plant and equipment and investment property, and €7 million (2010: €3 million) from the sale of investments.

Annual Report 2011 Evonik Industries120
The income from reversals of impairment losses in accordance with IAS 39 Financial Instruments: Recognition and Measurement includes €2 million (2010: €4 million) relating to trade accounts receivable and loans. Further, pursuant to IAS 36 Impairment of Assets, €17 million (2010: €28 million) of the reversals relate to the following segments:
Reversal of impairment losses
in € million 2011 2010
Resource Efficiency 5 20
Specialty Materials 9 1
Real Estate 2 7
Corporate, other operations 1 −
17 28
In 2011 income from the measurement of derivatives included €102 million relating to the put option held by Evonik for the remaining 49 percent stake in STEAG.
(6.3) Other operating expenses
in € million 2011 2010
Losses on the disposal of assets 38 16
Losses on measurement of derivatives (excluding interest rate derivatives) 369 451
Losses on currency translation of monetary assets and liabilities 233 245
Expenses for restructuring 8 31
Expenses for recultivation and environmental protection 7 22
Other additions to provisions 120 146
Impairment losses pursuant to IAS 36 146 128
Impairment losses pursuant to IAS 39 17 16
Impairment losses pursuant to IFRS 5 9 −
Expenses relating to the REACH Regulation 7 11
Miscellaneous tax expense 4 6
Other expense 249 275
1,207 1,347
Losses on the disposal of assets mainly comprise €9 million (2010: €15 million) relating to the divestment of intangible assets, property, plant and equipment and investment property, and €29 million (2010: €1 million) relating to the sale of investments.
In 2011, the losses on measurement of derivatives comprised €82 million relating to the call option that can be exercised by KSBG for the remaining 49 percent stake in STEAG.
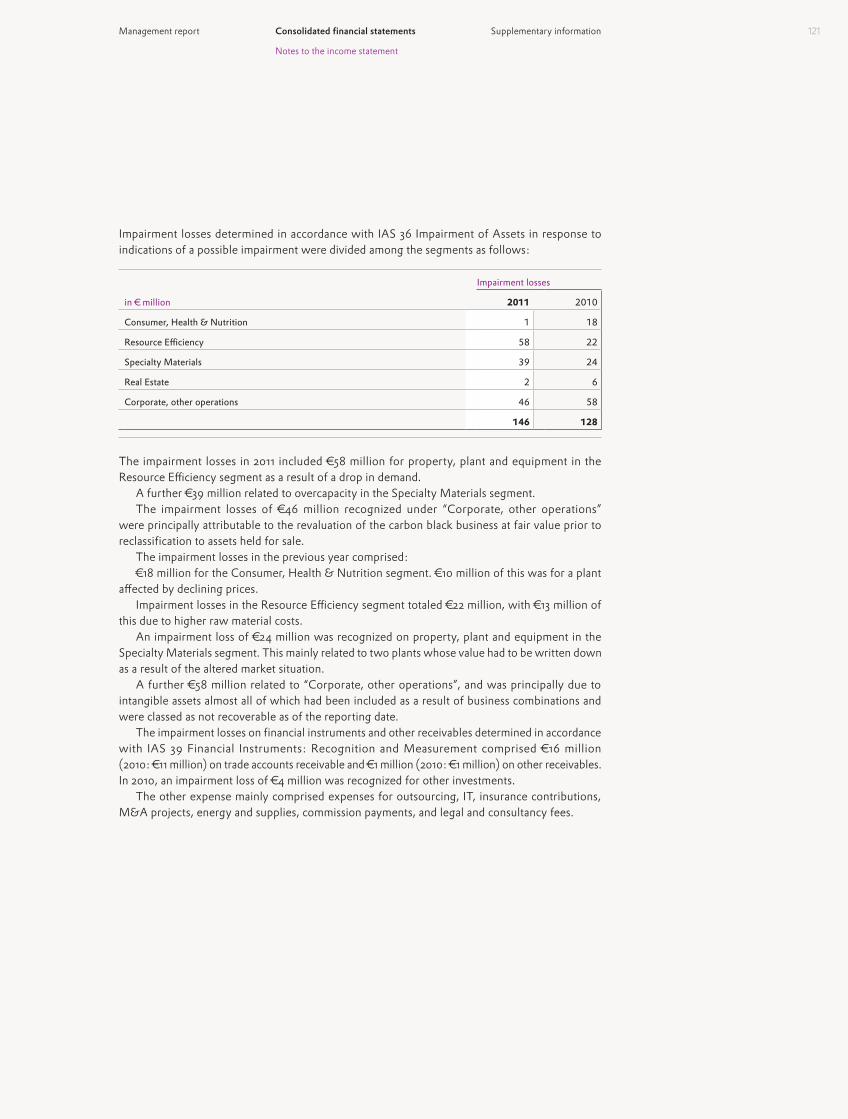
121Management report Consolidated financial statements Supplementary information
Notes to the income statement
Impairment losses determined in accordance with IAS 36 Impairment of Assets in response to indications of a possible impairment were divided among the segments as follows:
Impairment losses
in € million 2011 2010
Consumer, Health & Nutrition 1 18
Resource Efficiency 58 22
Specialty Materials 39 24
Real Estate 2 6
Corporate, other operations 46 58
146 128
The impairment losses in 2011 included €58 million for property, plant and equipment in the Resource Efficiency segment as a result of a drop in demand.
A further €39 million related to overcapacity in the Specialty Materials segment.The impairment losses of €46 million recognized under “Corporate, other operations”
were principally attributable to the revaluation of the carbon black business at fair value prior to reclassi fication to assets held for sale.
The impairment losses in the previous year comprised:€18 million for the Consumer, Health & Nutrition segment. €10 million of this was for a plant
affected by declining prices.Impairment losses in the Resource Efficiency segment totaled €22 million, with €13 million of
this due to higher raw material costs.An impairment loss of €24 million was recognized on property, plant and equipment in the
Specialty Materials segment. This mainly related to two plants whose value had to be written down as a result of the altered market situation.
A further €58 million related to “Corporate, other operations”, and was principally due to intangible assets almost all of which had been included as a result of business combinations and were classed as not recoverable as of the reporting date.
The impairment losses on financial instruments and other receivables determined in accordance with IAS 39 Financial Instruments: Recognition and Measurement comprised €16 million (2010: €11 million) on trade accounts receivable and €1 million (2010: €1 million) on other receivables. In 2010, an impairment loss of €4 million was recognized for other investments.
The other expense mainly comprised expenses for outsourcing, IT, insurance contributions, M&A projects, energy and supplies, commission payments, and legal and consultancy fees.

Annual Report 2011 Evonik Industries122
(6.4) Net interest expense
in € million 2011 2010
Income from securities and loans 24 9
Other interest-type income 26 14
Interest income 50 23
Interest expense on financial liabilities −170 −167
Other interest-type expense −32 −37
Net interest expense for pensions −183 −207
Interest expense on accrued interest on other provisions −46 −40
Interest expense −431 −451
−381 −428
Borrowing costs of €7 million (2010: €4 million) are capitalized. The average underlying cost of financing is 4.6 percent (2010: 3.3 percent).
(6.5) Result from investments recognized at equity
in € million 2011 2010
Income from measurement at equity 83 56
Expenses from measurement at equity −3 −2
80 54
Evonik has a claim to a guaranteed annual dividend until the put or call option for the remaining 49 percent of shares in STEAG is exercised. The guaranteed dividend is included in income from measurement at equity and replaces the pro rata income from STEAG.
(6.6) Other financial incomeOther financial income includes income of €7 million (2010: €10 million) from other investments.
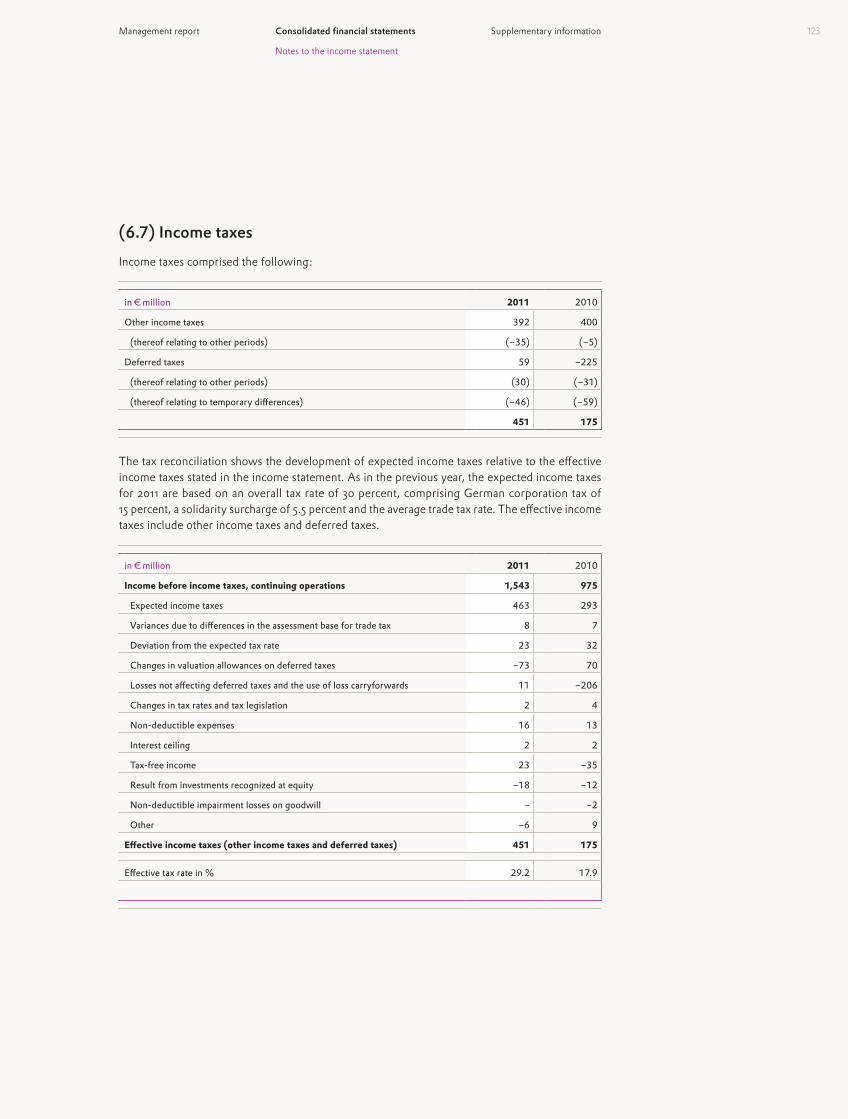
123Management report Consolidated financial statements Supplementary information
Notes to the income statement
(6.7) Income taxesIncome taxes comprised the following:
in € million 2011 2010
Other income taxes 392 400
(thereof relating to other periods) (−35) (−5)
Deferred taxes 59 −225
(thereof relating to other periods) (30) (−31)
(thereof relating to temporary differences) (−46) (−59)
451 175
The tax reconciliation shows the development of expected income taxes relative to the effective income taxes stated in the income statement. As in the previous year, the expected income taxes for 2011 are based on an overall tax rate of 30 percent, comprising German corporation tax of 15 percent, a solidarity surcharge of 5.5 percent and the average trade tax rate. The effective income taxes include other income taxes and deferred taxes.
in € million 2011 2010
Income before income taxes, continuing operations 1,543 975
Expected income taxes 463 293
Variances due to differences in the assessment base for trade tax 8 7
Deviation from the expected tax rate 23 32
Changes in valuation allowances on deferred taxes −73 70
Losses not affecting deferred taxes and the use of loss carryforwards 11 −206
Changes in tax rates and tax legislation 2 4
Non-deductible expenses 16 13
Interest ceiling 2 2
Tax-free income 23 −35
Result from investments recognized at equity −18 −12
Non-deductible impairment losses on goodwill − −2
Other −6 9
Effective income taxes (other income taxes and deferred taxes) 451 175
Effective tax rate in % 29.2 17.9

Annual Report 2011 Evonik Industries124
The change in the valuation allowances on deferred taxes is principally due to the adjustment of deferred tax assets. “Other” contains other income taxes and deferred taxes relating to different periods.
In 2010 the item “Losses not affecting deferred taxes and the use of loss carryforwards” mainly contained the change in the recognition of deferred tax assets for loss carryforwards not previously included in the valuation.
(6.8) Earnings per shareEarnings per share as shown in the income statement are calculated by dividing net income by the weighted average number of shares issued, i.e. 466,000,000 shares. Net income comprises the total earnings for the year less non-controlling interests, including the earnings of discontinued operations. Earnings per share could be diluted by potential ordinary shares. Since there were no potential ordinary shares in either 2011 or 2010, diluted earnings per share are identical to basic earnings per share.
in € million 2011 2010
Income after taxes, continuing operations 1,092 800
Income after taxes, discontinued operations −78 −7
Less income after taxes attributable to non-controlling interests −3 −59
Income after taxes attributable to shareholders of Evonik Industries AG (net income) 1,011 734
Earnings per share in € (basic and diluted)from continuing operationsfrom discontinued operationsless non-controlling interests
+2.34−0.16−0.01
+1.72−0.01−0.13
Earnings per share in € (basic and diluted) attributable to shareholders of Evonik Industries AG +2.17 +1.58

125Management report Consolidated financial statements Supplementary information
Notes to the balance sheet
(7) Notes to the balance sheet
(7.1) Intangible assets
in € million Goodwill
Franchises, trademarks
and licenses
Capitalized development
costs
Other intangible
assets Total
Cost of acquisition/production
As of January 1, 2010 3,301 1,758 167 524 5,750
Currency translation 60 10 − 3 73
Additions from business combinations 22 22 − 11 55
Other additions − 21 − 9 30
Reclassification pursuant to IFRS 5 −407 −64 − −63 −534
Disposal − −21 − −2 −23
Reclassification − 9 − −2 7
As of December 31, 2010 2,976 1,735 167 480 5,358
Currency translation 25 3 − − 28
Additions from business combinations 18 35 6 2 61
Other additions − 12 − 1 13
Reclassification pursuant to IFRS 5 −163 −62 −2 −2 −229
Disposal − −28 −3 − −31
Reclassification − 5 −1 −3 1
As of December 31, 2011 2,856 1,700 167 478 5,201
Amortization and impairment losses
As of January 1, 2010 117 1,149 127 407 1,800
Currency translation − 7 − 1 8
Additions from business combinations − 2 − − 2
Amortization − 84 6 24 114
Impairment losses − 57 3 1 61
Reversals of impairment losses − − − − −
Reclassification pursuant to IFRS 5 −5 −53 − −34 −92
Disposal − −21 − − −21
Reclassification − − − − −
As of December 31, 2010 112 1,225 136 399 1,872
Currency translation − 3 − − 3
Additions from business combinations − − − − −
Amortization − 74 4 16 94
Impairment losses 44 4 − − 48
Reversal of impairment losses − −2 − − −2
Reclassification pursuant to IFRS 5 −44 −10 − −1 −55
Disposal − −27 −3 −1 −31
Reclassification − − − − −
As of December 31, 2011 112 1,267 137 413 1,929
Carrying amounts as of Dec. 31, 2010 2,864 510 31 81 3,486
Carrying amounts as of Dec. 31, 2011 2,744 433 30 65 3,272

Annual Report 2011 Evonik Industries126
Franchises, trademarks and licenses include trademarks with an indefinite useful life totaling €208 million (2010: €238 million).
Capitalized development costs of €30 million (2010: €31 million) mainly related to the purchase price allocation for earlier purchases of shares in Evonik Degussa and the related recognition of hidden reserves.

127Management report Consolidated financial statements Supplementary information
Notes to the balance sheet
(7.2) Property, plant and equipment
in € million
Land, land rights and
buildingsPlant and
machinery
Other plant, office furniture and equipment
Advance payments and
construction in progress Total
Cost of acquisition/production
As of January 1, 2010 3,358 13,145 1,093 1,096 18,692
Currency translation 74 255 15 28 372
Additions from business combinations 22 47 4 4 77
Other additions 38 164 43 501 746
Reclassification pursuant to IFRS 5 −480 −3,016 −116 −771 −4,383
Disposal −136 −162 −43 −5 −346
Reclassification 39 218 4 −266 −5
As of December 31, 2010 2,915 10,651 1,000 587 15,153
Currency translation 22 73 1 7 103
Additions from business combinations 30 39 7 2 78
Other additions 20 176 46 504 746
Reclassification pursuant to IFRS 5 −199 −819 −62 −27 −1,107
Disposal −19 −141 −52 −4 −216
Reclassification 31 399 14 −446 −2
As of December 31, 2011 2,800 10,378 954 623 14,755
Depreciation and impairment losses
As of January 1, 2010 1,840 10,228 892 21 12,981
Currency translation 29 169 12 − 210
Additions from business combinations 1 16 2 − 19
Depreciation 72 485 62 − 619
Impairment losses 17 40 3 5 65
Reversal of impairment losses −7 −7 − −7 −21
Reclassification pursuant to IFRS 5 −246 −2,520 −81 −2 −2,849
Disposal −131 −149 −42 −2 −324
Reclassification −4 14 −10 −2 −2
As of December 31, 2010 1,571 8,276 838 13 10,698
Currency translation 8 41 1 1 51
Additions from business combinations 2 8 1 − 11
Depreciation 55 400 51 3 509
Impairment losses 3 87 − 7 97
Reversal of impairment losses −2 −11 − − −13
Reclassification pursuant to IFRS 5 −97 −598 −55 −9 −759
Disposal −17 −128 −50 − −195
Reclassification −9 19 −8 −2 −
As of December 31, 2011 1,514 8,094 778 13 10,399
Carrying amounts as of Dec. 31, 2010 1,344 2,375 162 574 4,455
Carrying amounts as of Dec. 31, 2011 1,286 2,284 176 610 4,356

Annual Report 2011 Evonik Industries128
The carrying amounts of assets from finance leases comprised €4 million (2010: €6 million) for land, land rights and buildings, €20 million (2010: €2 million) for plant and machinery and €1 million (2010: €1 million) for other plant, office furniture and equipment.
The carrying amounts of property, plant and equipment pledged as security for Group liabilities amounted to €15 million (2010: €63 million).
The Group had commitments of €187 million (2010: €190 million) to purchase property, plant and equipment.
As a lessor, Evonik mainly leases out land under operating leases. The expected future minimum lease payments for these assets over the non-cancelable term of the lease are due as follows:
in € million 2011 2010
Due within 1 year 5 5
Due in more than 1 and up to 5 years 11 16
Due in more than 5 years 107 111
123 132

129Management report Consolidated financial statements Supplementary information
Notes to the balance sheet
(7.3) Investment property
in € millionLand,
land rights Buildings
Buildings under
construction Total
Cost of acquisition/production
As of January 1, 2010 328 2,217 42 2,587
Currency translation 1 3 − 4
Additions from business combinations − − − −
Other additions 2 23 14 39
Reclassification pursuant to IFRS 5 −10 −4 − −14
Disposal − −1 − −1
Reclassification − 21 −35 −14
As of December 31, 2010 321 2,259 21 2,601
Currency translation − 1 − 1
Additions from business combinations − − − −
Other additions 7 50 14 71
Reclassification pursuant to IFRS 5 − − − −
Disposal −1 −2 −1 −4
Reclassification −2 4 −17 −15
As of December 31, 2011 325 2,312 17 2,654
Depreciation and impairment losses
As of January 1, 2010 7 1,026 − 1,033
Currency translation − 2 − 2
Additions from business combinations − − − −
Depreciation − 44 − 44
Impairment losses 2 7 − 9
Reversal of impairment losses − −7 − −7
Reclassification pursuant to IFRS 5 − −3 − −3
Disposal −1 − − −1
Reclassification − −4 − −4
As of December 31, 2010 8 1,065 − 1,073
Currency translation − 1 − 1
Additions from business combinations − − − −
Depreciation − 44 − 44
Impairment losses − 1 − 1
Reversals of impairment losses − −2 − −2
Reclassification pursuant to IFRS 5 − − − −
Disposal − −1 − −1
Reclassification − −7 − −7
As of December 31, 2011 8 1,101 − 1,109
Carrying amounts as of Dec. 31, 2010 313 1,194 21 1,528
Carrying amounts as of Dec. 31, 2011 317 1,211 17 1,545

Annual Report 2011 Evonik Industries130
Other additions comprise retroactive acquisition costs of €26 million (2010: €22 million). The fair value of investment property was €2,899 million (2010: €2,839 million).
The income statement comprises operating expenses totaling €224 million (2010: €225 million) that relate directly to investment property which generates rental revenues. Operating expenses for investment property which does not generate rental revenues amounted to €8 million (2010: €9 million).
The carrying amount of investment property with restrictions to title amounted to €1,038 million (2010: €1,045 million). This mainly comprised registered land charges for loans, which totaled €787 million on the reporting date (2010: €790 million).
Commitments to purchase real estate classified as investment property amounted to €14 million (2010: €19 million). Apart from this, there were only contractual commitments in respect of statutory obligations to undertake maintenance, repairs and improvements under rent contracts.
(7.4) Investments recognized at equityThis item comprises associated companies and joint ventures recognized using the equity method. The carrying amount of €1,057 million (2010: €562 million) mainly relates to the joint ventures THS GmbH, Essen (Germany), and StoHaas Monomer GmbH & Co. KG, Marl (Germany) and, for the first time, the associated company STEAG. A complete list of companies recognized at equity can be found in Note (5.1).
The combined financial data from the last available financial statements of the companies recognized at equity, based on the Group’s interest, are as follows:
Associated companies Joint ventures
in € million 2011 2010 2011 2010
Non-current assets as of December 31 1,368 33 1,390 1,396
Current assets as of December 31 999 25 132 93
Non-current liabilities as of December 31 −966 −3 −853 −863
Current liabilities as of December 31 −662 −32 −157 −136
Income 1,631 72 417 403
Expenses −1,522 −70 −364 −362

131Management report Consolidated financial statements Supplementary information
Notes to the balance sheet
(7.5) Financial assetsDec. 31, 2011 Dec. 31, 2010
in € million Totalthereof
non-current Totalthereof
non-current
Other investments 46 46 45 45
Loans 78 58 41 19
Securities and similar claims 497 48 430 42
Receivables from finance leases 1 1 − −
Receivables from derivatives 113 102 66 2
Other financial assets 8 − 10 −
743 255 592 108
(a) Other investmentsOther investments comprise investments in unlisted equity instruments that are recognized at the cost of acquisition since their fair value cannot be determined reliably.
(b) LoansLoans are exposed to an interest-rate risk, which can affect their fair value or future cash flows. They are recognized at amortized cost.
The risk and maturity structure of loans is as follows:
in € million Dec. 31, 2011 Dec. 31, 2010
Impaired loans 1 1
Gross amount 7 8
Impairment losses −6 −7
Non-impaired loans 77 40
Not yet due 77 40
Overdue − −
78 41
As in the previous year, Evonik did not renegotiate the terms and conditions of any long-term loans in 2011.
(c) Securities and similar claimsSecurities and similar claims are exposed to an interest-rate risk, which can affect their fair value or future cash flows. All securities are classified as available-for-sale and are measured at market price. Securities listed on a stock exchange are exposed to a risk of changes in their market price.
As of the reporting date, the Group had current securities totaling €449 million (2010: €388 million) from issuers with high creditworthiness. These were used for risk diversification and to diversify the investment of cash and cash equivalents.

Annual Report 2011 Evonik Industries132
(d) Receivables from derivativesThe breakdown of receivables from derivatives at year end was as follows:
in € million Dec. 31, 2011 Dec. 31, 2010
Receivables from currency derivatives 11 65
Receivables from commodity derivatives − 1
Receivables from other derivatives 102 −
113 66
The fair value of the put option for the remaining 49 percent of shares in STEAG is recognized under receivables from other derivatives.
(e) Security pledgedFinancial assets pledged as security for Group liabilities amounted to €40 million (2010: €28 million). These comprised current securities provided as security for commitments to employees under the partial retirement program in Germany. In the previous year financial assets amounting to €6 million were subject to other restrictions on title.
(7.6) Inventories
in € million Dec. 31, 2011 Dec. 31, 2010
Raw materials and supplies 442 484
Work in progress 123 105
Finished goods 1,080 996
1,645 1,585
Impairment losses on raw materials, supplies and other goods totaling €19 million were recognized in 2011 (2010: €21 million) while reversals of impairment losses amounted to €25 million (2010: €11 million).
(7.7) Trade accounts receivable and other receivablesDec. 31, 2011 Dec. 31, 2010
in € million Totalthereof
non-current Totalthereof
non-current
Trade accounts receivable 1,711 − 1,826 −
Advance payments made 38 16 50 8
Miscellaneous other receivables 289 12 229 37
Deferred expenses 72 13 37 14
2,110 41 2,142 59

133Management report Consolidated financial statements Supplementary information
Notes to the balance sheet
The risk and maturity structure of trade accounts receivable is as follows:
in € million Dec. 31, 2011 Dec. 31, 2010
Impaired receivables 30 10
Gross amount 42 17
Impairment losses −12 −7
Non-impaired receivables 1,681 1,816
Not yet due 1,478 1,626
Overdue 203 190
up to 3 months 192 174
more than 3 and up to 6 months 5 6
more than 6 and up to 9 months 3 −
more than 9 and up to 12 months − 7
more than 1 year 3 3
1,711 1,826
The terms for trade accounts receivable classified as not yet due with a carrying amount of €5 million (2010: €1 million) were renegotiated and would otherwise have been impaired or overdue. Receivables totaling €195 million are covered by credit insurance.
(7.8) Cash and cash equivalentsThe cash and cash equivalents totaling €1,609 million (2010: €1,103 million) include balances with banks, checks and cash. This item also includes financial securities with high liquidity and terms of no more than three months on the date of acquisition.
(7.9) Equity(a) Issued capitalAs in the previous year, the company’s fully paid-up capital stock was €466,000,000 on the reporting date and is divided into 466,000,000 no-par bearer shares.
On December 3, 2007, RAG-Stiftung notified Evonik Industries AG that, pursuant to Section 20, Paragraphs 4 and 1 and Section 16 Paragraph 4 of the German Stock Corporation Act (AktG), it holds a majority of the capital stock of Evonik Industries AG through its majority stake in RAG Aktiengesellschaft AG, Essen (Germany). On January 8, 2008 RAG-Stiftung submitted notification pursuant to Section 20 Paragraph 4 of the German Stock Corporation Act that it directly holds a majority of the capital stock of Evonik Industries AG.
Gabriel Acquisitions notified Evonik Industries AG on September 15, 2008 pursuant to Section 20 Paragraphs 1 and 3 of the German Stock Corporation Act that it directly holds more than a quarter of the shares in Evonik Industries AG.
Further, on September 15, 2008 the following companies submitted notification that they indirectly hold more than a quarter of the shares in Evonik Industries AG pursuant to Section 20 Paragraph 1 of the German Stock Corporation Act through their investment in Gabriel Acquisitions:

Annual Report 2011 Evonik Industries134
Gabriel Investments S.à r.l. (Gabriel Investments), Gabriel Holdings S.à r.l. (Gabriel Holdings), Clear Vision Capital Fund SICAV-FIS S.A., all of Luxembourg (Luxembourg) and CVC European Equity Partners Tandem (A) L.P., CVC European Equity Partners Tandem (B) L.P., CVC European Equity Partners Tandem (C) L.P., CVC European Equity Partners V (A) L.P., CVC European Equity Partners V (B) L.P., CVC European Equity Partners V (C) L.P., CVC European Equity Partners V (D) L.P., CVC European Equity Partners V (E) L.P., all of George Town (Grand Cayman, Cayman Islands) and CVC Nominees Ltd., CVC European Equity V Ltd., CVC European Equity Tandem GP Ltd., CVC Capital Partners Finance Ltd., CVC Capital Partners Advisory Company Ltd., all of St. Helier (Jersey, Channel Islands).
(b) Capital reserveThe capital reserve contains all other payments received from shareholders pursuant to Section 272 Paragraph 2 No. 4 of the German Commercial Code.
(c) Accumulated incomeThe accumulated income of €4,568 million (2010: €3,948 million) comprises Group earnings from fiscal 2011 and previous years. Income after taxes corresponds to the net income attributable to shareholders of Evonik Industries AG, as stated in the income statement for fiscal 2011. However, under German stock corporation law, only profit reserves from the separate financial statements drawn up by Evonik Industries AG which are not subject to any restrictions are available for distribution. As of December 31, 2011, Evonik Industries AG’s profit reserves totaled €2,638 million (2011: €3,373 million). €47 million of this comprised the statutory reserve that is not available for distribution.
A proposal will be submitted to the Shareholders’ Meeting that €425 million should be distributed for 2011. That corresponds to a dividend of around €0.91 per no-par share.
(d) Accumulated other comprehensive incomeAccumulated other comprehensive income contains gains and losses that are not included in the income statement. The reserve for unrealized gains and losses on available-for-sale securities contains remeasurement amounts resulting from changes in the value of financial instruments that are expected to be temporary and thus not charged to income. The reserve for gains and losses on hedging instruments comprises changes in the fair value of the effective portion of hedging instruments that are accounted for as cash flow hedges or net investment hedges. The reserve for revaluation surplus for acquisitions made in stages contains the change in the fair value of shares previously held in subsidiaries that were consolidated for the first time on or before December 31, 2009. The reserve for currency translation adjustment comprises differences arising from the translation of foreign financial statements.

135Management report Consolidated financial statements Supplementary information
Notes to the balance sheet
The changes in accumulated other comprehensive income (OCI) were as follows:
in € million
Unrealized gains/losses on available-
for-sale securities
Gains/losses on hedging instruments
Revaluation surplus for
acquisitions in stages
Currency translation adjustment Total
As of January 1, 2010 5 72 46 −551 −428
Other comprehensive income as in the statement of comprehensive income −5 −14 − 249 230
Gains/losses included in OCI 2 −59 − − −57
Amounts reclassified to the income statement −7 30 − − 23
Amounts reclassified to assets and liabilities − 10 − − 10
Currency translation adjustment − − − 249 249
Deferred taxes − 5 − − 5
Other changes − − −5 − −5
As of December 31, 2010 − 58 41 −302 −203
Other comprehensive income as in the statement of comprehensive income 2 −117 − 118 3
Gains/losses included in OCI 2 −42 − − −40
Amounts reclassified to the income statement − −91 − − −91
Amounts reclassified to assets and liabilities − −3 − − −3
Currency translation adjustment − − − 118 118
Deferred taxes − 19 − − 19
Other changes − − −18 − −18
As of December 31, 2011 2 −59 23 −184 −218
In 2011, an overall hedging result of €91 million (2010: minus €30 million) was reclassified from the reserve for gains/losses on hedging instruments to the income statement as follows:
in € million 2011 2010
Sales 39 −35
Cost of sales −3 −
Other operating expenses − −1
Income after taxes, discontinued operations 55 6
91 −30

Annual Report 2011 Evonik Industries136
(e) Non-controlling interestsNon-controlling interests amounting to €93 million (2010: €593 million) comprise shares in the issued capital and reserves of consolidated subsidiaries that are not attributable to the shareholders of Evonik Industries AG. The decline in 2011 was mainly due to the deconsolidation of the non-controlling interests in STEAG and its subsidiaries and is recognized in the statement of changes in equity under other changes.
The changes in accumulated other comprehensive income (OCI) were as follows:
in € million
Gains/losses on hedging instruments
Currency translation adjustment Total
As of January 1, 2010 −12 −87 −99
Other comprehensive income as in the statement of comprehensive income −4 35 31
Gains/losses included in OCI −15 − −15
Amounts reclassified to the income statement 9 − 9
Amounts reclassified to assets and liabilities − − −
Currency translation adjustment − 35 35
Deferred taxes 2 − 2
Other changes − − −
As of December 31, 2010 −16 −52 −68
Other comprehensive income as in the statement of comprehensive income 16 55 71
Gains/losses included in OCI 20 − 20
Amounts reclassified to the income statement − − −
Amounts reclassified to assets and liabilities − − −
Currency translation adjustment − 55 55
Deferred taxes −4 − −4
Other changes − − −
As of December 31, 2011 − 3 3
(7.10) Provisions for pensions and other post-employment benefitsProvisions for pensions are established to cover benefit plans for retirement, disability and surviving dependents’ pensions. The benefit obligations vary depending on the legal, tax and economic circumstances in the various countries in which the companies operate. The level of the benefit obligations generally depends on length of service and remuneration.
Germany accounted for around 93.6 percent (2010: 93.2 percent) and thus the vast majority of provisions for pensions on the reporting date.

137Management report Consolidated financial statements Supplementary information
Notes to the balance sheet
At the German companies, occupational pension plans are predominantly defined benefit plans. They are primarily funded by provisions and pension fund assets. In addition, some pension obligations were transferred to a contractual trust arrangement.
The pension plans at foreign companies may be either defined contribution or defined benefit plans.
The table shows the weighted average assumptions used for the actuarial valuation of the obligations and for the expected return on plan assets:
Group Germany
in % 2011 2010 2011 2010
Discount rate as of December 31 4.76 5.03 4.75 5.00
Future salary increases 2.60 2.62 2.50 2.54
Future pension increases 2.02 2.06 2.00 2.00
Expected return on plan assets as of December 31 5.05 5.35 4.80 4.93
Health-care cost trend 7.70 7.72 − −
The expected return on plan assets was derived from published capital market reports and forecasts and in-house experience for each class of assets.
The present value of the defined benefit obligation changed as follows in fiscal 2011:
in € million 2011 2010
Present value of the defined benefit obligation as of January 1 7,472 7,430
Current service cost 107 102
Interest cost 363 403
Employee contributions 32 31
Actuarial gains (−) and losses (+) 303 468
Benefits paid −413 −416
Past service cost 7 11
Additions from business combinations −53 −3
Reclassification pursuant to IFRS 5 −66 −608
Curtailments −3 −1
Settlement 5 1
Currency translation 33 54
Present value of the defined benefit obligation as of December 31 7,787 7,472

Annual Report 2011 Evonik Industries138
The fair value of the plan assets changed as follows in fiscal 2011:
in € million 2011 2010
Fair value of plan assets as of January 1 3,551 3,161
Expected return on plan assets 180 167
Employer contributions 514 344
Employee contributions 12 13
Actuarial gains (+) and losses (−) −13 −15
Benefits paid −176 −154
Outflows due to disposals −46 −2
Reclassification pursuant to IFRS 5 −6 −3
Currency translation 29 40
Fair value of plan assets as of December 31 4,045 3,551
In 2011 the plan assets were split as follows: €2,490 million (2010: €2,478 million) at Pensionskasse Degussa VVaG Marl (Germany), and €610 million (2010: €200 million) at Evonik Pensionstreuhand e.V., Essen (Germany). The remaining plan assets mainly comprised €532 million (2010: €508 million) in the UK and €338 million (2010: €287 million) in the USA.
The actual return on plan assets was €167 million in fiscal 2011 (2010: €152 million).Employer contributions of €107 million are expected to be incurred for 2012.The next table shows the present value of all defined benefit obligations, the fair value of plan
assets, the funded status and experience adjustments to actuarial gains (+) and losses (−) for the defined benefit obligation and plan assets over time:
in € million 2011 2010 2009 2008 2007
Present value of the defined benefit obligation as of December 31 7,787 7,472 7,430 6,815 7,078
Fair value of plan assets as of December 31 4,045 3,551 3,161 2,910 3,058
Funded status as of December 31 3,742 3,921 4,269 3,905 4,020
Experience adjustments to the defined benefit obligation −41 37 −37 −21 −39
Experience adjustments to plan assets −13 −15 116 −152 −129

139Management report Consolidated financial statements Supplementary information
Notes to the balance sheet
The funded status, which is defined as the difference between the present value of the defined benefit obligation and the fair value of the plan assets, is reconciled with the pension provisions shown in the balance sheet as follows:
in € million Dec. 31, 2011 Dec. 31, 2010
Present value of the defined benefit obligation 7,787 7,472
Fair value of plan assets 4,045 3,551
Funded status 3,742 3,921
Unrecognized past service cost 1 2
Unrecognized actuarial loss −1,030 −721
Other changes (including asset ceiling and IFRIC 14) 92 77
Pension provisions recognized on the balance sheet 2,805 3,279
As of the reporting date, €453 million (2010: €494 million) of the present value of all defined benefit obligations was unfunded and €7,236 million (2010: €6,889 million) was fully or partially funded. In addition, there were health-care obligations totaling €98 million (2010: €89 million). For an explanation of the impact of changes in the cost trends in the health-care sector, see Note (4).
The fair value of plan assets was split as follows:
Dec. 31, 2011 Dec. 31, 2010
in € million in % in € million in %
Shares 238 5.9 352 9.9
Debt instruments 3,247 80.3 2,830 79.7
Real estate 41 1.0 17 0.5
Other assets 519 12.8 352 9.9
4,045 100.0 3,551 100.0
Shares of €66 million (2010: €93 million) were hedged. Of the other assets, €29 million (2010: €28 million) were used by the company.
The pension provisions included concessionary coal and power allowances in Germany and the entitlements of retirees of US companies to receive health-care benefits.
The actuarial loss was €1,030 million (2010: €721 million) and exceeded the permitted corridor in some cases. The corridor and amortization are calculated separately for each plan recognized.

Annual Report 2011 Evonik Industries140
The total expense for the defined benefit obligation for the continuing operations is broken down as follows:
in € million 2011 2010
Current service cost 107 93
Interest cost 363 374
Expected return on plan assets −180 −167
Amortization of actuarial gains and losses 7 199
Amortization of past service cost 6 9
Losses due to plan changes and curtailments 2 −
Effect of asset ceiling 12 −115
Net pension expense 317 393
Preventive health-care benefits accounted for €5 million of the total expense (2010: €5 million).Further, current service cost of €1 million, interest cost of €2 million and €2 million of the
expected return on plan assets related to companies classified as held for sale.Interest cost and the expected return on plan assets are included in net interest expense, see
Note (6.4), while the other amounts are allocated to the functional areas as personnel expense (pension expenses). A breakdown of overall personnel expense is given in Note (11.2).
A total of €16 million (2010: €12 million) was paid into foreign defined-contribution plans, which are also included in personnel expense (pension expenses).
Further, €128 million (2010: €140 million) was paid into defined-contribution state plans (statutory pension insurance) in Germany and abroad. This is reported in personnel expense (expenses for social security contributions).
(7.11) Other provisionsDec. 31, 2011 Dec. 31, 2010
in € million Totalthereof
non-current Totalthereof
non-current
Personnel-related 1,076 538 1,092 563
Recultivation and environmental protection 260 224 248 218
Restructuring 193 119 331 33
Sales and procurement 130 15 152 12
Other taxes and interest on taxes 53 9 45 22
Dismantling obligations 5 1 4 3
Other obligations 471 108 551 105
2,188 1,014 2,423 956

141Management report Consolidated financial statements Supplementary information
Notes to the balance sheet
Personnel-related provisions are established for many different reasons. They include provisions for bonuses and variable remuneration, statutory and other early retirement arrangements, unused vacation entitlements, lifetime working arrangements and anniversary bonuses. Only a small proportion of these long-term provisions will result in payments after 2016.
Provisions for recultivation and environmental protection are established on the basis of laws, contracts and regulatory requirements. They cover soil reclamation obligations, water protection, the recultivation of landfills and site decontamination obligations. The long-term portion of these provisions is divided equally between those that will result in payments between 2013 and 2016 and those that will result in payments after 2016.
Provisions for restructuring are based on defined restructuring measures. Such measures comprise programs which are planned and controlled by the company and will materially alter one of the company’s areas of business activity or the way in which a business activity is carried out. Restructuring provisions may only be established for costs that are directly attributable to the restructuring program. These include severance packages, redundancy and early retirement arrangements, expenses for the termination of contracts, dismantling and soil reclamation expenses, rents for unused facilities and other shutdown and wind-up expenses. At year-end 2011 provisions of €145 million (2010: €251 million) were recognized in connection with the divestment of the former Energy Business Area. The reduction in the reporting period was mainly due to the set-off of provisions totaling €73 million against the carrying amount of STEAG which is included in the financial statements at equity. All of the long-term provisions will be utilized within five years.
The provisions for sales and procurement relate principally to guarantee obligations, outstanding commission payments, price discounts and rebates, impending losses and goods and services procured for which no invoice has yet been received. Almost all of these provisions will be utilized within one year.
Provisions for other taxes and interest on taxes mainly comprise property tax, value-added tax and interest obligations relating to all types of taxes. Most of these provisions will be utilized in the short term and only just over 10 percent will be utilized after 2016.
Provisions for dismantling obligations relate to dismantling that is not part of a restructuring program. The long-term portion will be utilized by the end of 2016.
Provisions for other obligations include risks relating to legal disputes, administrative proceedings or fines, especially in the areas of product liability, patent, tax, cartel and environmental law, legal and consultancy expenses and audit expenses. Similarly, guarantee claims against the company may result from divestments. Adequate provisions have been established in case such risks should materialize. About three-quarters of these provisions will be utilized within one year. The remainder will be utilized in full by year-end 2016.

Annual Report 2011 Evonik Industries142
Other provisions changed as follows in fiscal 2011:
in € million
Person-nel-
related
Recultiva-tion, envi-ronmental protection
Restruc-turing
Sales, procure-
ment
Other taxes,
interest on taxes
Dismant-ling
obligationsOther
obligations Total
As of January 1, 2011 1,092 248 331 152 45 4 551 2,423
Additions 491 18 95 65 25 4 164 862
Utilization −460 −16 −145 −55 −3 −1 −127 −807
Reversal −21 −7 −13 −28 −14 − −110 −193
Addition of accrued interest/interest rate adjustments 19 17 5 1 − − 1 43
Reclassification pursuant to IFRS 5 −51 −2 −1 −3 −1 −1 −10 −69
Other 6 2 −79 −2 1 −1 2 −71
As of December 31, 2011 1,076 260 193 130 53 5 471 2,188
(7.12) Financial liabilitiesDec. 31, 2011 Dec. 31, 2010
in € million Totalthereof
non-current Total thereof
non-current
Bonds 1,860 1,860 2,030 2,030
Liabilities to banks 872 677 999 789
Loans from non-banks 80 63 58 42
Liabilities from finance leases 28 23 9 6
Liabilities from derivatives 240 88 49 2
Other financial liabilities 67 34 77 46
3,147 2,745 3,222 2,915
(a) BondsThe amount stated under bonds includes a bond issued by Evonik Industries AG with a nominal value of €750 million. This bond matures in October 2014 and has an annual coupon of 7.0 percent. It is recognized at the issue price of 99.489 percent and the discount is amortized over the maturity of the bond using the effective interest rate method.
This item also includes a corporate bond issued by Evonik Degussa GmbH with a nominal value of €1,093 million (2010: €1,250 million). This bond matures in December 2013 and has an annual coupon of 5.125 percent. It is recognized at the issue price of 98.99 percent and the discount is amortized over the maturity of the bond using the effective interest rate method. The reduction in the nominal value is due to the repurchase of €157 million in the fourth quarter of 2011, followed by withdrawal of the units redeemed.
Fixed-interest bonds are exposed to a risk of price fluctuations while variable-rate liabilities are exposed to a risk of changes in interest rates. These risks may affect their fair value or future cash flows. The stock market price of the bond issued by Evonik Industries AG was 111.9 percent on the

143Management report Consolidated financial statements Supplementary information
Notes to the balance sheet
reporting date (2010: 111.0 percent), valuing it at €839 million (2010: €833 million). The stock market price of the bond issued by Evonik Degussa GmbH was 105.0 percent on the reporting date (2010: 105.4 percent), valuing it at €1,148 million (2010: €1,152 million; calculated from the issue volume outstanding as of the reporting date).
(b) Liabilities to banks, loans from non-banksThe liabilities to banks include low-interest loans from public-sector banks to finance subsidized residential properties. These are reported at fair value. The difference between the fair value of the loan and the amount disbursed is shown as deferred income and included in other liabilities, see Note (7.13).
Further, in 2009 Evonik Industries AG issued promissory notes with a nominal value of around €184 million, which were due to mature in 2013. These floating rate notes totaling €92 million were redeemed prematurely in 2011. The promissory notes that are still outstanding are recognized mainly in liabilities to banks.
The accrual of €15 million (2010: €15 million) for payment of the coupon on the bonds is recognized in current loans from non-banks.
(c) Liabilities from finance leasesLiabilities from finance leases are recognized if the leased assets are capitalized under property, plant and equipment as economic assets belonging to the Group. The reconciliation from the future minimum lease payments to their present values and their due dates are as follows:
in € million Dec. 31, 2011 Dec. 31, 2010
Future minimum lease payments 29 9
due within 1 year 5 2
due in more than 1 and up to 5 years 14 6
due in more than 5 years 10 1
Interest included therein −1 −
Present value of future minimum lease payments(liabilities from finance leases) 28 9
due within 1 year 5 2
due in more than 1 and up to 5 years 13 6
due in more than 5 years 10 1
Some of the assets leased are sub-leased. The expected minimum future lease payments for the non-cancelable sub-leasing agreements totals €3 million (2010: €3 million).
Liabilities from finance leases include €19 million for an agreement concluded in June 2011 between Evonik and Taiyo Nippon Sanso Silane Gas Service Co., Tokyo (Japan) on the sale-and-lease-back of a monosilane facility. This agreement runs for ten years. Evonik can exercise a purchase option at the end of this period.
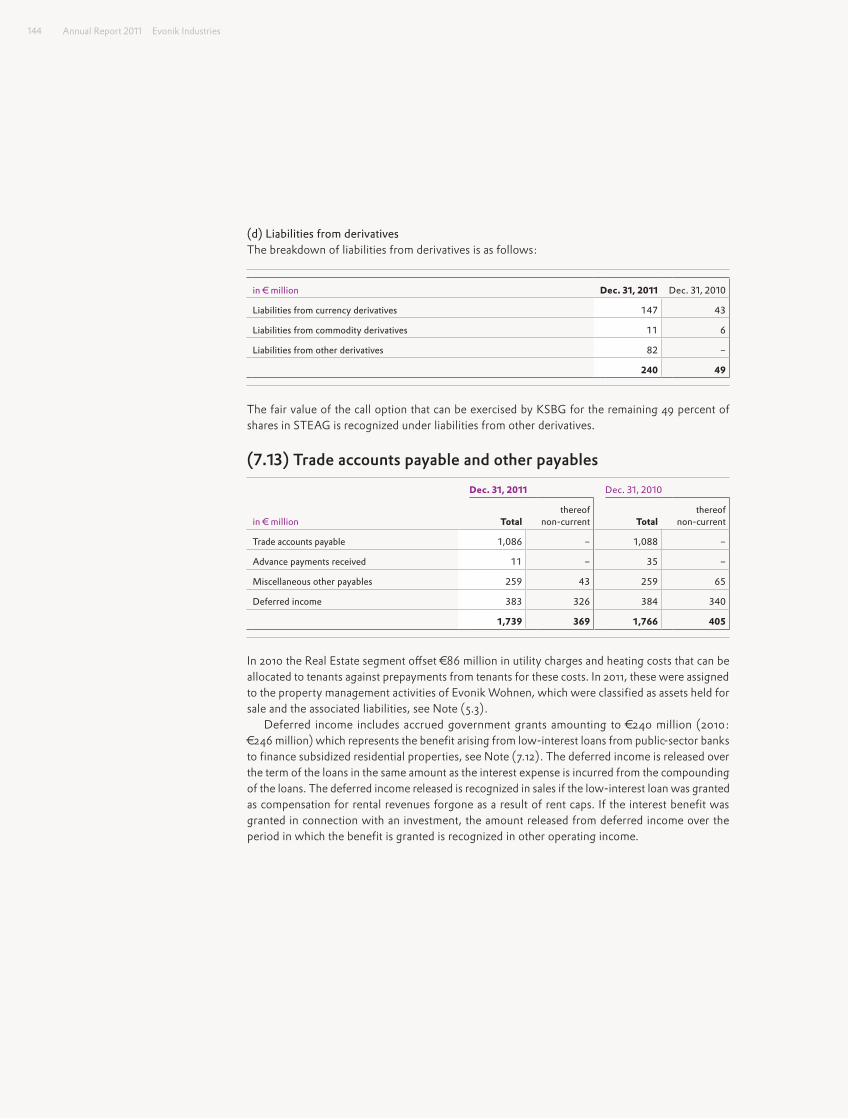
Annual Report 2011 Evonik Industries144
(d) Liabilities from derivativesThe breakdown of liabilities from derivatives is as follows:
in € million Dec. 31, 2011 Dec. 31, 2010
Liabilities from currency derivatives 147 43
Liabilities from commodity derivatives 11 6
Liabilities from other derivatives 82 −
240 49
The fair value of the call option that can be exercised by KSBG for the remaining 49 percent of shares in STEAG is recognized under liabilities from other derivatives.
(7.13) Trade accounts payable and other payablesDec. 31, 2011 Dec. 31, 2010
in € million Totalthereof
non-current Totalthereof
non-current
Trade accounts payable 1,086 − 1,088 −
Advance payments received 11 − 35 −
Miscellaneous other payables 259 43 259 65
Deferred income 383 326 384 340
1,739 369 1,766 405
In 2010 the Real Estate segment offset €86 million in utility charges and heating costs that can be allocated to tenants against prepayments from tenants for these costs. In 2011, these were assigned to the property management activities of Evonik Wohnen, which were classified as assets held for sale and the associated liabilities, see Note (5.3).
Deferred income includes accrued government grants amounting to €240 million (2010: €246 million) which represents the benefit arising from low-interest loans from public-sector banks to finance subsidized residential properties, see Note (7.12). The deferred income is released over the term of the loans in the same amount as the interest expense is incurred from the compounding of the loans. The deferred income released is recognized in sales if the low-interest loan was granted as compensation for rental revenues forgone as a result of rent caps. If the interest benefit was granted in connection with an investment, the amount released from deferred income over the period in which the benefit is granted is recognized in other operating income.

145Management report Consolidated financial statements Supplementary information
Notes to the balance sheet
(7.14) Deferred taxes, other income taxesThe breakdown of deferred taxes and current income taxes reported on the balance sheet by due date is shown in the table:
Dec. 31, 2011 Dec. 31, 2010
in € million Totalthereof
non-current Totalthereof
non-current
Deferred tax assets 477 266 518 289
Other income taxes assets 83 23 70 23
Deferred tax liabilities −481 −439 −502 −457
Other income tax liabilities −422 −70 −415 −70
In accordance with IAS 1 Presentation of Financial Statements, the current elements of deferred taxes are reported on the balance sheet under non-current assets and liabilities.
Deferred taxes related to the following balance sheet items:
Deferred tax assets Deferred tax liabilities
in € million Dec. 31, 2011 Dec. 31, 2010 Dec. 31, 2011 Dec. 31, 2010
Assets
Intangible assets 7 14 156 190
Property, plant and equipment, investment property 108 57 474 492
Financial assets 153 68 63 61
Inventories 81 66 8 13
Receivables and other assets 73 85 20 15
Liabilities
Provisions 344 447 132 54
Payables 103 91 114 159
Special tax allowance reserves (based on local law) − − 12 15
Loss carryforwards 162 270 − −
Tax credits 1 − − −
Other 5 7 4 3
Deferred taxes (gross) 1,037 1,105 983 1,002
Write-downs −58 −87 − −
Netting −502 −500 −502 −500
Deferred taxes (net) 477 518 481 502

Annual Report 2011 Evonik Industries146
No deferred tax assets were recognized on temporary differences of €471 million (2010: €1,119 million) because it is not probable that future taxable income will enable them to be realized. €13 million of this (2010: €37 million) related to the interest ceiling pursuant to Section 8 a of the German Corporate Income Tax Act (KStG) in conjunction with Section 4 h of the German Income Tax Act (EStG). Deferred tax assets of €76 million (2010: €11 million) were recognized for companies that made a loss. Sufficient taxable income is expected in the future to enable them to be realized as they relate, among other things, to start-up losses and tax measures to utilize losses.
In addition to tax loss carryforwards for which deferred taxes were recognized, there were tax loss carryforwards that were not utilizable and for which no deferred taxes were recognized. These are shown in the table, together with their expiration dates:
Corporation taxes(German and foreign)
Local taxes(German and foreign)
Tax credits (foreign)
in € million 2011 2010 2011 2010 2011 2010
Tax loss carryforwards by expiration date
up to 1 year 3 6 1 1 − −
more than 1 and up to 5 years 113 128 − 3 − −
more than 5 and up to 10 years − − − − − −
unlimited 252 241 185 213 153 152
368 375 186 217 153 152
147Management report Consolidated financial statements Supplementary information
Notes to the cash flow statement
(8) Notes to the cash flow statementThe cash flow statement shows the changes in cash and cash equivalents of the Group in the reporting period. It is broken down into cash flows from operating, investing and financing activities and reflects cash flows from continuing and discontinued operations. The impact of changes in the scope of consolidation has been eliminated.
Interest paid and interest and dividends received are included in operating activities while dividends paid are assigned to financing activities.
(8.1) Cash flow from operating activitiesThe cash flow from operating activities is calculated using the indirect method. Income before the financial result and income taxes from the continuing operations is adjusted for the effects on non-cash income and expenses and items that are allocated to investing or financing activities. Certain other changes in amounts shown on the balance sheet are calculated and added to the result. The net cash flow generated by the discontinued operations with external counterparties is shown as an aggregate.
(8.2) Cash flow from investing activitiesThe cash inflows from divestments and outflows for investments in shareholdings include the following:
The total purchase price for shares in subsidiaries consolidated for the first time was €125 million in 2011 (2010: €26 million). In 2011, as in 2010, the entire purchase price for such transactions resulted in cash outflows. The cash and cash equivalents acquired in 2011 amounted to €1 million (2010: €6 million).
The total selling prices of subsidiaries divested in 2011 was €1,295 million (2010: none), all of which was settled in cash and cash equivalents. Divestments included outflows of cash and cash equivalents totaling €295 million (2010: none).
Further, cash inflows from divestments in 2011 included €35 million from the sale of an investment that had been included at equity (2010: €52 million relating to divestments in previous years).
(8.3) Cash and cash equivalentsThe cash and cash equivalents of €1,611 million (2010: €1,351 million) comprise the liquid assets of the continuing operations as well as liquid assets relating to assets held for sale. Since the cash and cash equivalents assigned to the assets held for sale have to be reclassified on the balance sheet in accordance with IFRS 5 Non-current Assets Held for Sale and Discontinued Operations, see Note (5.2), a reconciliation is provided from the cash and cash equivalents shown in the cash flow statement to the balance sheet, see Note (7.8).

Annual Report 2011 Evonik Industries148
(9) Notes on the segment report
(9.1) Reporting based on operating segmentsAs the chief operating decision-maker for the Evonik Group, the Executive Board of Evonik Industries AG decides on the allocation of resources and evaluates the earnings power of the Group’s operations on the basis of the operating segments described below (subsequently referred to as segments). The operating activities are divided into business units within the segments. The reporting based on segments reflects the Group’s internal organizational and reporting structure (management approach).
The same accounting standards are applied as for external financial reporting, see Notes (3.5) to (3.7).
In accordance with its strategic focus on specialty chemicals, Evonik restructured its reporting segments in 2011. The prior-year figures have been restated accordingly.
Evonik now divides its operating activities into three chemicals segments, Consumer, Health & Nutrition, Resource Efficiency, and Specialty Materials, the newly established Services segment, and the Real Estate segment (2010: three business areas, Chemicals, Energy, and Real Estate). The former Energy Business Area was deconsolidated in 2011 following the divestment of the majority shareholding, see Note (5.2).
The chemicals operations formerly grouped in the Chemicals Business Area have been split among the Consumer, Health & Nutrition, Resource Efficiency, and Specialty Materials segments.
The new Services segment principally bundles Site Services, which used to be part of the Chemicals Business Area, with Evonik Business Services, which was recognized under “Corporate, other operations, consolidation”.
Hidden reserves, charges and goodwill arising from earlier acquisitions of shares in Evonik Degussa, chemicals-specific corporate functions and some smaller activities that are not assigned to any of the segments have been reclassified from the former Chemicals Business Area to “Corporate, other operations, consolidation”.
This new structure is designed to improve Evonik’s ability to utilize growth opportunities arising from the megatrends it has identified. The aim is to improve the Group’s market muscle and the efficiency of internal management.
Evonik’s segments are outlined below:
(a) Consumer, Health & NutritionThis segment produces specialty chemicals, principally for applications in the consumer goods, animal nutrition and pharmaceutical sectors. It comprises the Consumer Specialties and Health & Nutrition Business Units.
The Consumer, Health & Nutrition segment’s activities concentrate to a large extent on ingredients, additives and system solutions for high-quality cosmetics, personal care products and cleaning agents. Its outstanding expertise in interfacial chemistry is also used for selected industrial applications such as release coatings for self-adhesive labels. Key success factors are high innovative prowess, integrated technology platforms and strategic partnerships with major consumer goods manufacturers. In addition, this segment is the world’s only supplier of all four key amino acids for animal nutrition. Of special significance here is its long-standing technical experience of organic synthesis and biotechnology. Moreover, in view of its activities in the areas of exclusive synthesis, pharmaceutical amino acids and pharmaceutical polymers, the segment considers itself to be a strategic partner for the global pharmaceutical industry.

149Management report Consolidated financial statements Supplementary information
Notes on the segment report
(b) Resource EfficiencyThis segment provides solutions for environment-friendly and energy-efficient products. It comprises the Inorganic Materials and Coatings & Additives Business Units.
Its integrated silicon technology platform positions it as a market leader in a wide range of silicas and silanes. These are supplied, for example, to the tire, electronics, construction and fiber optics industries. The Resource Efficiency segment also uses its expertise in designing organic particles and their surface properties in its catalysts business. Other operations include supplying high-quality functional polymers and specialty monomers, especially to the paints, coatings, adhesives and sealants industries. Examples include crosslinkers used in the construction of rotor blades for wind turbines. The segment also produces high-performance oil additives and hydraulic fluids.
(c) Specialty MaterialsThe heart of the Specialty Materials segment is the production of polymer materials and their preproducts, and additives. It comprises the Performance Polymers and Advanced Intermediates Business Units.
This segment produces a broad spectrum of high-performance materials. Here it benefits from its integrated technology platforms for methylmethacrylate chemistry and polyamide 12. In addition, it manufactures high-performance polymers based on polyetherether ketone (PEEK) and polyimides to meet extremely high-tech mechanical, thermal and chemical requirements. Further key factors for the success of Specialty Materials are advanced chemical processes, which Evonik has developed systematically over decades. This applies in particular for the integrated C4 technology platform, where C4 crack is processed into specialties. The Specialty Materials segment has opened up new growth markets thanks to its innovative prowess. The prime example is the hydrogen peroxide to propylene oxide (HPPO) process. It also produces alcoholates, which are used as catalyst in the production of biodiesel. Key sectors supplied by this segment are the plastics, paints and coatings, automotive and aerospace industries. Thanks to their specific properties, its products are also used for architectural and design applications.
(d) ServicesThe Services segment principally comprises Site Services and Evonik Business Services. Its services are mainly targeted at the chemicals operations and the Corporate Center, and to a lesser extent at third parties.
The Site Services unit bundles cross-site infrastructure services, such as supply, disposal, logistics and facility management. Evonik Business Services supports the chemicals operations and the Corporate Center by providing standardized administrative services, including IT, human resources, accounting and legal services.

Annual Report 2011 Evonik Industries150
(e) Real EstateThe Real Estate segment, which Evonik plans to exit entirely in the medium term, focuses on letting homes to private households in the federal state of North Rhine-Westphalia. Alongside Evonik’s portfolio of residential real estate, it comprises a 50 percent stake in THS. Effective January 1, 2012, Evonik and THS bundled the management of their properties in a newly formed joint venture, Vivawest Wohnen.
(f) Corporate, other operations, consolidationThis comprises the Corporate Center, the Group’s strategic research and development, the 49 percent shareholding in STEAG and other operations that are not assigned to any of the reporting segments. It also includes hidden reserves and charges and the goodwill from earlier acquisitions of shares in Evonik Degussa and intersegment consolidation effects.
(9.2) Reporting based on regionsThe regional breakdown of the segments is based on geographical criteria, which are outlined in more detail in Note (9.3).
(9.3) Notes to the segment dataThe segment data are derived from the consolidated data for the subsidiaries, and the consolidation effects that arise at Group level and are allocated to the segments. These relate primarily to goodwill, hidden reserves and charges and the resultant impact on earnings. The segment data are explained below.
External sales reflect the segments’ sales with parties outside the Group. Sales generated between the segments are internal sales and are cross-charged at market prices or using the cost-plus method.
The following table shows a reconciliation from the sales of all reporting segments to Group sales.
in € million 2011 2010
Sales, reportable segments 16,090 14,795
Sales, other operations 389 293
Consolidation −1,939 −1,788
Sales, corporate, other operations, consolidation −1,550 −1,495
External sales of the Evonik Group 14,540 13,300
The total sales reported for the other operations mainly relate to services provided within the Group, especially energy management.

151Management report Consolidated financial statements Supplementary information
Notes on the segment report
External sales by country are divided by point of sale. They comprise:
in € million 2011 2010
Germany 3,784 3,445
USA 2,395 2,167
China 829 736
Switzerland 756 456
France 511 463
Netherlands 487 513
Italy 428 380
Japan 427 395
Other countries 4,923 4,745
External sales of the Evonik Group 14,540 13,300
The Executive Board of Evonik Industries AG uses economic value added (EVA) as the key financial indicator for internal management purposes. EVA shows the value created with capital employed after covering the cost of capital. Since EBIT (before non-operating result) is the operating parameter used to calculate EVA, it is the central earnings indicator used for internal management purposes.
The other internal management indicator used to measure operational performance, EBITDA (before non-operating result), is reported to the Executive Board of Evonik Industries AG.
EBIT (before non-operating result) is the main earnings parameter that can be influenced by the segment management. It comprises earnings before interest, taxes and the non-operating result (subsequently referred to as EBIT).
To calculate EBITDA (before non-operating result), EBIT is adjusted for depreciation and amortization, impairment losses and reversals of impairment losses which are not included in the non-operating result. This is subsequently referred to as EBITDA. The EBITDA margin is the ratio of EBITDA to external sales.
Depreciation and amortization relate to the depletion in the value of intangible assets, property, plant and equipment and investment property over their estimated useful life.
The result from investments recognized at equity corresponds to the result for these investments as reported in the income statement; see Note (6.5).

Annual Report 2011 Evonik Industries152
The following table shows the relationship between the internal management parameters EBITDA and EBIT and the external earnings parameter income before income taxes from the continuing operations.
in € million 2011 2010
EBITDA 2,768 2,365
Depreciation, amortization, impairment losses/reversal of impairment losses −750 −809
Impairment losses/reversal of impairment losses (non-operating result) 81 83
EBIT 2,099 1,639
Non-operating result −175 −236
Net interest expense −381 −428
Income before income taxes, continuing operations 1,543 975
The non-operating result reflects business transactions that are defined for purposes of internal management as occurring once or rarely and are significant for an assessment of the company’s earnings position. In 2011, the Group reported a non-operating loss of €175 million (2010: non-operating loss of €236 million).
The main non-operating expenses in 2011 were expenses and impairment losses in connection with the divestment of companies, write-downs of property, plant and equipment, and restructuring expenses. In addition, non-operating income and expense were recognized for the put and call options for the remaining 49 percent stake in STEAG.
The main non-operating expenses in 2010 were expenses for pensions in the UK, impairment losses on assets, the On Track efficiency enhancement program, and restructuring.
The reconciliation from the EBIT of all reportable segments to income before income taxes from the continuing operations is as follows:
in € million 2011 2010
EBIT, reportable segments 2,503 2,059
EBIT, other operations −25 2
EBIT, Corporate Center and corporate activities −334 −322
Consolidation −45 −100
EBIT, corporate, other operations, consolidation −404 −420
Group EBIT 2,099 1,639
Non-operating result −175 −236
Net interest expense −381 −428
Income before income taxes, continuing operations 1,543 975

153Management report Consolidated financial statements Supplementary information
Notes on the segment report
Capital employed comprises the net assets required by the reportable segments for their operations. Capital employed is calculated by determining the total of intangible assets, property, plant and equipment, investment property, investments, inventories, trade accounts receivable, financial assets required for operations, certain amounts relating to assets held for sale and other non-interest-bearing assets. The sum of interest-free provisions, trade accounts payable, and other interest-free liabilities is then deducted from this.
Another major internal management parameter used by the Group is the return on capital employed (ROCE). ROCE is calculated from the ratio of EBIT to capital employed. To smooth the closing date effect, the calculation uses average capital employed.
Capital expenditures comprise additions to intangible assets (excluding goodwill from capital consolidation), property, plant and equipment and investment property. Additions resulting from changes in the scope of consolidation are not taken into account. Capital expenditures by region are based on the location of the subsidiaries.
Additions to investments recognized at equity, other investments, non-current loans and non-current securities and security-type claims made in the reporting period are recognized as financial investments. The acquisition of subsidiaries is shown as an addition to financial investments in the year of acquisition (including goodwill from capital consolidation). Financial investments by region are based on the location of the subsidiaries.
Other material income and expense items that do not impact cash flows mainly comprise impair-ment losses, reversals of impairment losses, additions to and reversals of provisions and the reversal of deferred income and expenses.
The headcount is taken on the reporting date. It shows the number of employees. Part-time employees are included as absolute figures. The headcount by region is based on the location of the subsidiaries.
Goodwill and other intangible assets, property, plant and equipment and investment property are segmented by the location of the subsidiaries. Together, these assets comprise the non-current assets in accordance with IFRS 8 Operating Segments (c.f. IFRS 8.33 b). The following table provides a breakdown of the Group’s non-current assets by country:
in € million Dec. 31, 2011 Dec. 31, 2010
Germany 5,924 6,174
USA 792 816
China 590 543
Belgium 494 506
Other countries 1,373 1,430
Non-current assets 9,173 9,469

Annual Report 2011 Evonik Industries154
(10) Other disclosures
(10.1) Performance-related remunerationEvonik’s remuneration system comprises a basic salary, short-term incentives and long-term components, the Long-Term Incentive Plan for executives of the Evonik Group (Evonik LTI Plan) and a Long-Term Incentive Plan for executives of the former Evonik Degussa Group (Evonik Degussa LTI Plan). The value of these LTI Plans is not linked to the development of shares in the company. Instead it is calculated on the basis of defined business indicators. Both LTI Plans are long-term compensation plans and are therefore accounted for in accordance with IAS 19 Employee Benefits and recognized in other provisions.
(a) Evonik LTI Plan for members of the Executive Board of Evonik Industries AGThe Evonik LTI Plan was granted to members of the Executive Board by the Supervisory Board of Evonik Industries AG for the first time in 2008. This LTI Plan comprises a five-year performance period, starting on January 1 of the year in which it is granted. The intrinsic value of the plan depends on how the fictitious equity value of Evonik derived from EBITDA develops over the performance period.
The reference base for calculating the increase in value is the fictitious equity value as of December 31 of the year prior to its granting. The actual increase versus this reference base is compared with the mid-term plan approved by the Supervisory Board of Evonik Industries AG in the year in which the plan is granted. Assuming that after five years this reaches or exceeds the fictitious equity value set in the mid-term planning within a defined percentage range, a cash payment is made under the LTI Plan. The level of this payment is based on an individual target and the relationship between the actual and planned target attainment. The first payment for serving members of the Executive Board will be in 2013. For members who leaving the Executive Board before expiry of the five-year period, a three-year qualifying period is applied. Accordingly, in 2011 payments totaling €2 million under the LTI Plan 2008 were due and paid to former members of the Executive Board who stepped down in 2008 and 2009. As of December 31, 2011 a provision of €4 million had been established for the Evonik LTI Plans for 2008 through 2011. The prior-year values were reported with the LTI Plan for Group executives as of December 31, 2010.
(b) Evonik LTI Plan for Group executivesEvonik Industries AG granted the Evonik LTI Plan to executives nominated by the Executive Board for the first time in 2008. This LTI Plan comprises a three-year performance period, starting on May 1 of the year in which it is granted. The intrinsic value of the plan depends on how the fictitious equity value of Evonik derived from EBITDA develops over the performance period. From 2010 attainment of the mid-term EVA budget was added as an additional target.
The reference base for calculating the increase in value is the fictitious equity value as of December 31 of the year prior to its granting. The actual increase versus this reference base is compared with the mid-term plan approved by the Supervisory Board of Evonik Industries AG in the year in which the plan is granted. Assuming that this reaches or exceeds the fictitious equity value set in the mid-term planning within a defined percentage range, a cash payment is made under the LTI Plan. The level of this payment is based on an individual target and the relationship between the actual and planned target attainment. Under the conditions for the 2008 tranche of the LTI Plan, regular rights totaling €8 million were exercised in 2011. In addition, the conditions for a change of control applied for Group executives in the former Energy Business Area. As a result, the eligible executives received pro rata payments for the LTI Plans for 2008 through 2010 totaling €2 million.

155Management report Consolidated financial statements Supplementary information
Other disclosures
As of the reporting date, a provision of €24 million (2010: €24 million, including provisions for Executive Board members) had been established for the Evonik LTI Plans.
(c) Evonik Degussa LTI PlanUnder the Evonik Degussa LTI Plan, performance options were granted to the members of the Board of Management of Evonik Degussa GmbH and around 190 executives at the former Evonik Degussa Group for 2003 through 2006. The indicators for this LTI Plan were the ROCE and EBITDA of Evonik Degussa. Since consolidated financial statements for Evonik Degussa were last prepared for fiscal 2007, these indicators were subsequently determined by approximation.
A five-year period was defined as the term of each tranche of the LTI Plan from 2003 through 2006. This five-year period was divided into an initial lock-up period of two years, during which the performance options could not be exercised, followed by a three-year exercise period with four exercise windows. The LTI Plans for 2003 through 2006 have now expired.
The table shows the development of the performance options allocated under the Evonik Degussa LTI Plan:
Number of performance options LTI Plan 2006
As of January 1, 2011 95,687
Granted −
Exercised −95,687
Lapsed −
As of December 31, 2011 −
Exercise of the performance options was contingent upon achievement of a specific ROCE target for Evonik Degussa. If ROCE exceeded this hurdle, the number of options that could be exercised rose in line with ROCE. The formula used to calculate this was based on the weighted average cost of capital (WACC) of Evonik Degussa and was defined separately for each tranche of the LTI Plan.
EBITDA was used to calculate the value of the options eligible for exercise. The performance options only had an intrinsic value if the increase in EBITDA at Evonik Degussa was at least in line with the average EBITDA performance of the defined peer group companies. If EBITDA exceeded this level, the value of the options rose in line with the amount by which Evonik Degussa out-performed the peer group.
In 2010, the provision for the LTI Plan was €7 million. In the last exercise window for the 2006 LTI Plan, rights could be exercised in full and the provision recognized in 2010 was utilized.
(10.2) Additional information on financial instrumentsNet result from financial instrumentsThe income and expenses, gains and losses from financial instruments reflected in the income statement are reported as the net result for each of the valuation categories defined in IAS 39 Financial Instruments: Recognition and Measurement.

Annual Report 2011 Evonik Industries156
Net result by valuation category 2011
in € million
Available- for-sale
assetsLoans and
receivablesAssets held for trading
Liabilities held for trading
Liabilities at amortized
cost
Proceeds from disposals 2 − − − − 2
Income from the measurement of derivatives − − 273 −287 − −14
Impairment losses/reversals of impairment losses − −14 − − − −14
Net interest income/expense 6 18 − − −177 −153
Income from other investments 4 − − − − 4
12 4 273 −287 −177 −175
Net result by valuation category 2010
in € million
Available- for-sale
assetsLoans and
receivablesAssets held for trading
Liabilities held the trading
Liabilities at amortized
cost
Proceeds from disposals −1 − − − − −1
Income from the measurement of derivatives − − 374 −451 − −77
Impairment losses/reversals of impairment losses −4 −15 − − − −19
Net interest expense −2 −7 − − −171 −180
Income from other investments 5 − − − − 5
−2 −22 374 −451 −171 −272
Income from the measurement of derivatives does not include income from derivative financial instruments for which hedge accounting is applied.
Including interest income and expense relating to finance leases, interest income from financial instruments not allocated to the category held for trading amounted to €24 million (2010: €9 million), while the corresponding interest expense was €177 million (2010: €171 million). Further, as in 2010, net interest expense did not include any interest income on the impaired portion of financial assets or trade accounts receivable.
Carrying amounts and fair values of financial instrumentsFinancial instruments that fall within the scope of IFRS 7 Financial Instruments: Disclosures are to be disclosed by classes that take into account the characteristics of the financial instruments. At Evonik, the classification is based on the presentation on the balance sheet. The carrying amounts of each class are broken down to the valuation categories defined in IAS 39 Financial Instruments: Recognition and Measurement and are reconciled to the carrying amounts of the balance sheet items. Financial instruments not assigned to a valuation category are presented separately. Further, the fair value of each class as of the balance sheet date is disclosed.

157Management report Consolidated financial statements Supplementary information
Other disclosures
The following tables provide a reconciliation of the financial assets:
Carrying amount by valuation category Dec. 31, 2011
in € million
Available- for-sale
assetsLoans and
receivablesAssets held for trading
Not allocated to any
categoryCarrying
amount Fair value
Financial assets 543 86 110 4 743 743
Other investments 46 − − − 46 46
Loans − 78 − − 78 78
Securities and similar claims 497 − − − 497 497
Receivables from finance leases − − − 1 1 1
Receivables from derivatives − − 110 3 113 113
Other financial assets − 8 − − 8 8
Trade accounts receivable − 1,711 − − 1,711 1,711
Cash and cash equivalents − 1,609 − − 1,609 1,609
543 3,406 110 4 4,063 4,063
Carrying amount by valuation category Dec. 31, 2010
in € million
Available- for-sale
assetsLoans and
receivablesAssets held the trading
Not allocated to any
categoryCarrying
amount Fair value
Financial assets 475 51 39 27 592 592
Other investments 45 − − − 45 45
Loans − 41 − − 41 41
Securities and similar claims 430 − − − 430 430
Receivables from finance leases − − − − − −
Receivables from derivatives − − 39 27 66 66
Other financial assets − 10 − − 10 10
Trade accounts receivable − 1,826 − − 1,826 1,826
Cash and cash equivalents − 1,103 − − 1,103 1,103
475 2,980 39 27 3,521 3,521

Annual Report 2011 Evonik Industries158
The following tables provide a reconciliation of the financial liabilities:
Carrying amount by valuation category Dec. 31, 2011
in € millionLiabilities held
for tradingLiabilities at
amortized cost
Not allocated to any
categoryCarrying
amount Fair value
Financial liabilities 158 2,879 110 3,147 3,436
Bonds − 1,860 − 1,860 1,987
Liabilities to banks − 872 − 872 1,034
Loans from non-banks − 80 − 80 82
Liabilities from finance leases − − 28 28 26
Liabilities from derivatives 158 − 82 240 240
Other financial liabilities − 67 − 67 67
Trade accounts payable − 1,086 − 1,086 1,086
158 3,965 110 4,233 4,522
Carrying amount by valuation category Dec. 31, 2010
in € millionLiabilities held
for tradingLiabilities at
amortized cost
Not allocated to any
categoryCarrying
amount Fair value
Financial liabilities 33 3,164 25 3,222 3,520
Bonds − 2,030 − 2,030 2,151
Liabilities to banks − 999 − 999 1,171
Loans from non-banks − 58 − 58 63
Liabilities from finance leases − − 9 9 9
Liabilities from derivatives 33 − 16 49 49
Other financial liabilities − 77 − 77 77
Trade accounts payable − 1,088 − 1,088 1,088
33 4,252 25 4,310 4,608
That part of derivative financial instruments for which hedge accounting is applied is not allocated to any of the categories defined in IAS 39 Financial Instruments: Recognition and Measurement.

159Management report Consolidated financial statements Supplementary information
Other disclosures
The fair value determination of those financial instruments carried on the balance sheet at fair value was based on a three-level hierarchy:• Level 1: Quoted price in an active market• Level 2: Quoted price in an active market for similar financial instruments or valuation methods
based on observable market data• Level 3: Valuation methods not based on observable market dataThe table shows the allocation of financial instruments measured at fair value to the three levels of the hierarchy:
Fair value based on Dec. 31, 2011
in € million Level 1 Level 2 Level 3
Financial assets 497 11 102 610
Securities and similar claims 497 − − 497
Receivables from derivatives − 11 102 113
Financial liabilities − −158 −82 −240
Liabilities from derivatives − −158 −82 −240
Fair value based on Dec. 31, 2010
in € million Level 1 Level 2 Level 3
Financial assets 430 66 − 496
Securities and similar claims 430 − − 430
Receivables from derivatives − 66 − 66
Financial liabilities − −49 − −49
Liabilities from derivatives − −49 − −49
The fair values shown under Level 3 result from the valuation of the put option and the call option for the remaining 49 percent shareholding in STEAG. These options are measured using a binomial model. Initial measurement on March 2, 2011 comprised €209 million for the put option and minus €125 million for the call option. A sensitivity analysis of the derivatives in Level 3 can be found in the section headed “Market risk”.
Fair value measurement of financial instruments that are not included in the balance sheet at fair value was based on the following method:
Non-current receivables were valued using a variety of parameters. Impairment losses were recognized for any expected defaults on receivables. Accordingly, the net carrying amount of these receivables basically corresponded to their fair value. The assumption used to calculate the fair value of loans, receivables from finance leases, liabilities to banks, loans from non-banks and liabilities from finance leases was a risk-free interest rate. The stock market price of the bond on the reporting date was taken as its fair value. In all other cases the fair value of the financial instruments recognized on the balance sheet was their carrying amount on the reporting date.

Annual Report 2011 Evonik Industries160
Notional value of derivativesThe notional value of currency derivatives comprised the hedged foreign exchange amount converted into euros. The notional value of interest derivatives comprised the sum of the hedged items during their term to maturity, while the notional value of commodity derivatives comprised the hedged procurement cost translated into euros. The notional value of embedded derivatives corresponded to one of the above definitions of notional value, depending on the type of derivative.
Notional value of derivative financial instruments:
Dec. 31, 2011 Dec. 31, 2010
in € million Totalthereofcurrent
thereofnon-current Total
thereofcurrent
thereofnon-current
Currency derivatives 3,286 3,252 34 3,785 3,702 83
Interest derivatives 59 1 58 − − −
Commodity derivatives 31 18 13 33 24 9
3,376 3,271 105 3,818 3,726 92
The notional value of the put and call options for the remaining 49 percent of shares in STEAG depends on a formula set out in the options contract and was €498 million on the reporting date.
Where the criteria for hedge accounting were fulfilled, interest, currency and commodity derivatives were accounted for as fair value hedges, cash flow hedges or hedges of a net investment.
Hedge accountingHedge accounting was applied for the following major transactions in 2011:
(a) Fair value hedgesUntil August 2009, the €1,250 million bond issued by Evonik Degussa GmbH in November 2003 was hedged by receiver swaps with a notional value of €750 million and an expiration date of 2013. When the hedge was closed out, the accumulated income from the effective portion of the fair value hedge of the bond amounted to €60 million. This will be released to net interest expense over the remaining maturity of the bond using the effective interest method. €17 million of this amount was released in 2011 (2010: €13 million). €4 million of this amount related to the partial buyback of the bond at year-end 2011.
(b) Cash flow hedgesAs of the balance sheet date, forward exchange contracts were used to hedge forecast sales amounting to around €1,038 million (2010: €997 million) up to the end of 2012 against exchange rate movements. The fair value of hedging instruments included in hedge accounting was €67 million (2010: €11 million). Further, currency derivatives with a notional value of €27 million (2010: none) were used to hedge the exchange rate risk of planned purchases of property, plant and equipment. The fair value of these derivatives was close to zero on the balance sheet date.
Towards the end of 2011 Evonik undertook a series of hedging transactions to cover the refinancing requirement of up to €500 million regarded as highly probable in 2013 against the risk of changes in interest rates. On the reporting date, the first tranche of this hedge comprised a forward starting payer interest rate swap with a notional value of €50 million and a fair value close to zero.
At year-end 2011 commodity swaps with a negative fair value of €11 million (2010: negative fair value of €5 million) were used to hedge forecast purchases of raw materials against price fluctuations up to 2013.

161Management report Consolidated financial statements Supplementary information
Other disclosures
As of December 31, 2010 currency derivatives with a fair value of €4 million were included in the balance sheet as cash flow hedges used to hedge highly probable forecast transactions in the former Energy Business Area. These contracts were transferred or closed out in connection with the deconsolidation of the former Energy Business Area in 2011. The associated reserve for gains/losses on hedging instruments was derecognized, along with the hedge reserves accumulated by the energy companies in connection with their currency and commodity hedging transactions.
Evidence of the effectiveness of hedging relations was provided using the dollar offset method, critical term match, the hypothetical derivatives method, regression analysis and sensitivity analyses. Since 2009, in general only the spot components of forward exchange contracts used to hedge currency risks relating to transactions that are highly probable have been designated as hedges. As in 2010, only a negligible amount was recognized in income as the ineffective portion of the valuation of cash flow hedges.
(c) Hedge of a net investmentSince March 2010 the investment in UK subsidiaries has been hedged against foreign currency risks on a rolling basis. The hedging contracts have terms of one to two months. As of December 31, 2011, the notional value of the hedges was £76 million, as in the previous year. As in 2010, the fair value of the outstanding hedging contracts was close to zero. Between the inception of the hedge strategy in March 2010 and year-end 2011, total expenses of €7 million (2010: €4 million) were transferred to the reserve for gains/losses on hedging instruments based on these rolling hedge transactions.
Until the deconsolidation of the former Energy Business Area from Evonik Industries AG, the investment in its foreign power plant companies was hedged against currency risks on a rolling basis using currency derivatives. As of December 31, 2010, the outstanding contracts had a notional value of US$183 million and expiration dates up to March 2015. The fair value of the outstanding hedges was close to zero. At year-end 2010 the reserve for gains/losses on hedging instruments contained accumulated gains of €73 million from this net investment hedge, which were derecognized on the date of deconsolidation.
Financial risk managementAs an international company, Evonik is exposed to financial risks in the normal course of business. A major objective of corporate policy is to minimize the impact of market, liquidity and default risks both on the value of the company and profitability in order to check adverse fluctuations in cash flows and earnings without forgoing the opportunity to benefit from positive market trends. For this purpose a systematic financial and risk management system has been established. Interest rate and exchange rate risks are managed centrally at Evonik. Commodity risks are identified by the business units and hedged using forward contracts in compliance with corporate guidelines.
Derivatives are used to reduce financial risks. They were entered into exclusively in connection with the underlying transaction (hedged item) relating to normal operating business, which provides a risk profile directly opposite to that of the hedge. The instruments used to manage exchange rate and interest rate risks were customary products found on the market such as forward exchange contracts and currency options, interest rate and currency swaps and interest rate collars. Commodity risks relating to coal, gas, electricity and oil were hedged through forward contracts. The procurement of emissions allowances to meet obligations pursuant to Section 6 of the German Emissions Trading Act (TEHG) was optimized through the use of EUA-CER swaps, EUA or CER forward contracts and repurchase transactions.
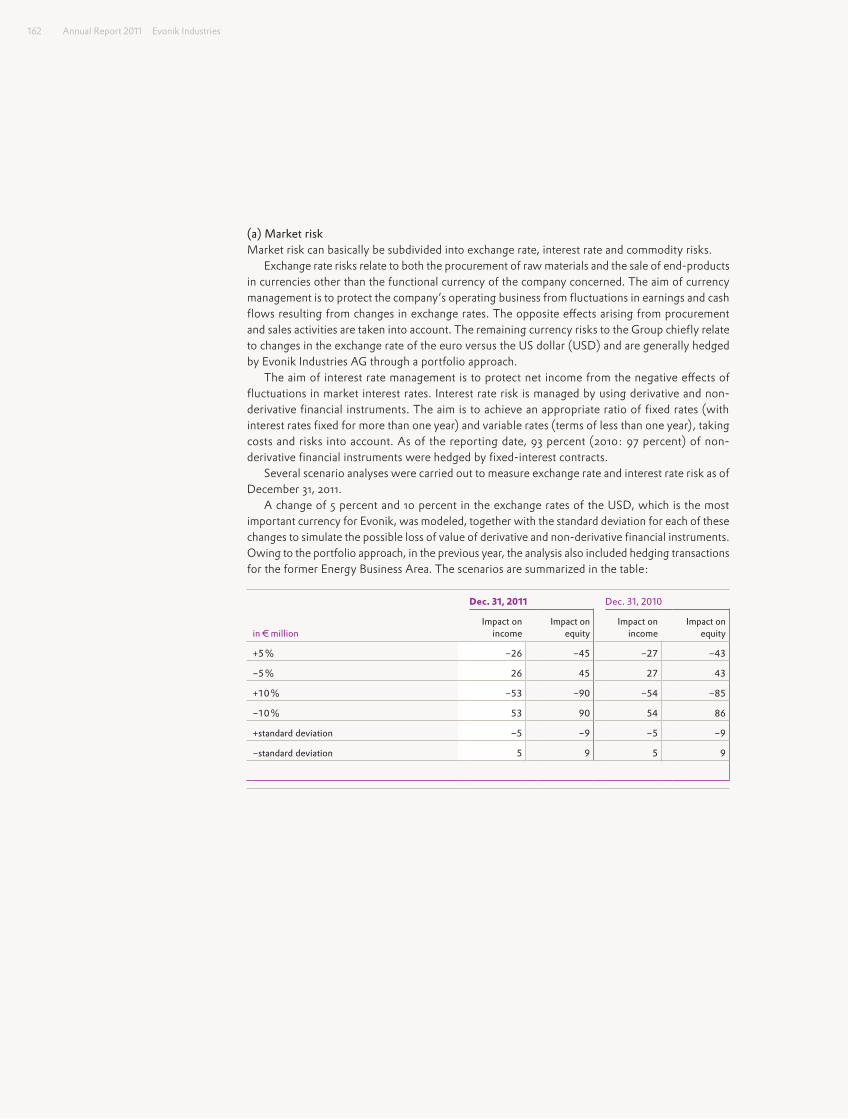
Annual Report 2011 Evonik Industries162
(a) Market riskMarket risk can basically be subdivided into exchange rate, interest rate and commodity risks.
Exchange rate risks relate to both the procurement of raw materials and the sale of end-products in currencies other than the functional currency of the company concerned. The aim of currency management is to protect the company’s operating business from fluctuations in earnings and cash flows resulting from changes in exchange rates. The opposite effects arising from procurement and sales activities are taken into account. The remaining currency risks to the Group chiefly relate to changes in the exchange rate of the euro versus the US dollar (USD) and are generally hedged by Evonik Industries AG through a portfolio approach.
The aim of interest rate management is to protect net income from the negative effects of fluctuations in market interest rates. Interest rate risk is managed by using derivative and non-derivative financial instruments. The aim is to achieve an appropriate ratio of fixed rates (with interest rates fixed for more than one year) and variable rates (terms of less than one year), taking costs and risks into account. As of the reporting date, 93 percent (2010: 97 percent) of non-derivative financial instruments were hedged by fixed-interest contracts.
Several scenario analyses were carried out to measure exchange rate and interest rate risk as of December 31, 2011.
A change of 5 percent and 10 percent in the exchange rates of the USD, which is the most important currency for Evonik, was modeled, together with the standard deviation for each of these changes to simulate the possible loss of value of derivative and non-derivative financial instruments. Owing to the portfolio approach, in the previous year, the analysis also included hedging transactions for the former Energy Business Area. The scenarios are summarized in the table:
Dec. 31, 2011 Dec. 31, 2010
in € millionImpact on
incomeImpact on
equityImpact on
incomeImpact on
equity
+5 % −26 −45 −27 −43
−5 % 26 45 27 43
+10 % −53 −90 −54 −85
−10 % 53 90 54 86
+standard deviation −5 −9 −5 −9
−standard deviation 5 9 5 9

163Management report Consolidated financial statements Supplementary information
Other disclosures
Several scenarios were also simulated for interest rates. These analyzed shifts of 50, 100 and 150 basis points in interest rates or the interest rate curve. The changes modeled related to the interest rate curves for all foreign currencies and for the euro to simulate the possible loss of value of derivative and non-derivative financial instruments. The former Energy Business Area was not included in this analysis in the previous year. The scenarios are summarized in the table:
Dec. 31, 2011 Dec. 31, 2010
in € millionImpact on
incomeImpact on
equityImpact on
incomeImpact on
equity
+50 basis points 1 −1 − −
−50 basis points −1 1 − −
+100 basis points 2 −2 −1 −
−100 basis points −2 1 1 −
+150 basis points 3 −3 −1 −
−150 basis points −3 2 1 −
Commodity risks resulted from changes in the market prices for the purchase and sale of raw materials and electricity. Raw materials were purchased principally to meet in-house demand, but steam coal was also purchased for resale to third parties via the market. Commodity management is the responsibility of the business units. They identify procurement risks and take effective measures to minimize them. For example, price escalation clauses and swaps are used to reduce price volatility. Other factors of importance for Evonik’s risk position are the availability and price of raw materials, starting products and intermediates. In particular, raw material prices of significance to the Evonik Group are dependent on exchange rates and the price of crude oil. Pricing and procurement risks are reduced through worldwide procurement and optimized processes to ensure immediate sourcing of additional raw material requirements. Similarly, use of alternative raw materials is examined for various production processes and Evonik is working on the development of alternative production technologies.
Financial derivatives were used to hedge procurement price risks. If the price of crude oil or natural gas had been 10 percent higher or lower on the reporting date, the equity impact of the fluctuation in the value of these derivatives would have been +€2 million or −€2 million (2010: +€3 million or −€3 million). The earnings impact in 2011 and 2010 would have been negligible.

Annual Report 2011 Evonik Industries164
Concurrently with the divestment of 51 percent of the shares in STEAG, a put option and a call option for the remaining 49 percent stake in STEAG was agreed with KSBG. The purpose of these options is to hedge the purchase price against the risk of a change in the fair value of the 49 percent stake in STEAG, while guaranteeing flexibility with regard to the future date of sale. Since the options are not eligible for hedge accounting, accounting risks arise from the different treatment of the options and the hedged item under IFRS rules. The options are recognized gross in receivables and liabilities from other derivatives with the related gains and losses disclosed as non-operating result in income from/losses on the measurement of derivatives. They are valued using a binomial model. Its central input variables are the formula-based exercise price of the options and an estimate of the fair value of the 49 percent stake in STEAG.
As of December 31, 2011 the net value of the options was calculated as €20 million. If the fair value of the 49 percent stake in STEAG had been 10 percent lower on December 31, 2011, the net value of the options would have been €48 million higher and would have resulted in an additional unrealized gain of €48 million in the non-operating result. An increase in the fair value of the 49 percent stake in STEAG of 10 percent would have reduced the net value of the options by €49 million, resulting in expense of €49 million in the non-operating result.
(b) Liquidity riskLiquidity risk is managed through business planning to ensure that the funds required to finance the current operating business and current and future investments in all Group companies are available at the right time and in the right currency at optimum cost. Liquidity requirements for business operations, investments and other financial activities are derived from a financing status and liquidity planning, which form part of liquidity risk management. Liquidity is pooled in a central cash management pool where this makes economic sense and is legally permissible. Central liquidity risk management facilitates low-cost borrowing and advantageous offsetting of financial requirements.
Since January 1, 2011 net financial debt has been calculated without taking account of liabilities and receivables from derivatives. The prior-year figures have been restated. On this basis, on the reporting date Evonik had financial assets amounting to €2,063 million (2010: €1,496 million).
In August 2011 Evonik prematurely refinanced the €1,500 million syndicated credit facility divided into three €500 million tranches which ran until June 2012, 2013 and 2015. The new €1,500 million syndicated credit facility also serves to secure the Group’s liquidity. It is divided into three €500 million tranches, running until August 2014, 2015 and 2016. This credit facility was not drawn at any time in 2011. There were also agreed bilateral credit facilities amounting to €616 million (2010: €369 million) to cover short-term funding requirements, and €322 million (2010: €447 million) for letters of credit. Drawings at year end 2011 were €221 million and €199 million respectively (2010: €179 million and €258 million).

165Management report Consolidated financial statements Supplementary information
Other disclosures
The table shows the remaining maturity of the non-derivative financial instruments based on the agreed dates for payment of the sum of interest and installment payments.
Payments due in Dec. 31, 2011
in € millionup to
1 year
more than 1 and up to
3 years
more than 3 and up to
5 yearsmore than
5 years
Financial liabilities 393 2,237 127 844 3,601
Bonds 109 2,004 − − 2,113
Liabilities to banks 221 193 114 752 1,280
Loans from non-banks 19 18 6 60 103
Liabilities from finance leases 5 9 5 10 29
Other financial liabilities 39 13 2 22 76
Trade accounts payable 1,086 − − − 1,086
Payments due in Dec. 31, 2010
in € millionup to
1 year
more than 1 and up to
3 years
more than 3 and up to
5 yearsmore than
5 years
Financial liabilities 390 1,816 898 641 3,745
Bonds 117 1,483 803 − 2,403
Liabilities to banks 221 297 78 587 1,183
Loans from non-banks 18 15 4 32 69
Liabilities from finance leases 2 4 2 1 9
Other financial liabilities 32 17 11 21 81
Trade accounts payable 1,088 − − − 1,088
The Group did not infringe the payment terms agreed for its financial liabilities.

Annual Report 2011 Evonik Industries166
The breakdown of the sum of interest and installment payments by maturity in the following table relates to derivative financial instruments with positive and negative fair values. The table shows the net value of cash inflows and outflows without the liquidity impact of the put option and the call option for the remaining 49 percent of shares in STEAG. If the call option is exercised on the earliest possible date, January 1, 2014, from the present vantage point that would result in a cash inflow of €498 million. Since netting was not agreed for currency derivatives, they are presented as gross amounts:
Payments due in Dec. 31, 2011
in € millionup to
1 year
more than 1 and up to
3 years
more than 3 and up to
5 years
Receivables from derivatives 10 − − 10
Currency derivatives 10 − − 10
Cash inflows 636 − − 636
Cash outflows −626 − − −626
Commodity derivatives − − − −
Liabilities from derivatives −146 −4 − −150
Currency derivatives −138 −2 − −140
Cash inflows 2,619 34 − 2,653
Cash outflows −2,757 −36 − −2,793
Commodity derivatives −8 −2 − −10
Payments due in Dec. 31, 2010
in € millionup to
1 year
more than 1 and up to
3 years
more than 3 and up to
5 years
Receivables from derivatives 68 2 − 70
Currency derivatives 67 2 − 69
Cash inflows 1,745 52 − 1,797
Cash outflows −1,678 −50 − −1,728
Commodity derivatives 1 − − 1
Liabilities from derivatives −44 −2 − −46
Currency derivatives −39 −1 − −40
Cash inflows 1,960 14 13 1,987
Cash outflows −1,999 −15 −13 −2,027
Commodity derivatives −5 −1 − −6

167Management report Consolidated financial statements Supplementary information
Other disclosures
(c) Risk of defaultCredit risk management divides default risk into three categories, which are analyzed separately on the basis of their specific features. The three categories are debtor and creditor risk, country risk and the risk of default by financial counterparties.
The debtor and creditor default risks are analyzed and monitored continuously with the aid of an internal limit system. Political risk (country risk) is also taken into account for export orders so that the overall risk assessment takes account of both political and economic risk factors. On the basis of this analysis, a maximum risk exposure limit is set for the contracting party. The credit standing of contracting parties is updated constantly via ratings or scoring processes.
In addition, a specific limit is set for financial counterparties for each type of risk (money market, capital market and derivatives). Maximum limits for each contracting party are set on the basis of the creditworthiness analyses. These are predominantly based on the ratings issued by international rating agencies and our own internal credit analysis.
Credit management also covers derivative financial instruments, where the risk of default is equivalent to the positive fair value. This risk is minimized by setting high standards for the creditworthiness of counterparties. Only common instruments found on the market with sufficient liquidity are used. Consequently, no material risk of default is expected in this field. As for non-derivative financial instruments, there is also a default risk amounting to the positive fair value. This can be minimized by regular creditworthiness reviews. We do not anticipate any material risk of default here either.
Owing to the diversity of business and large number of customers, there were no significant cluster risks.
(10.3) Related partiesIn addition to the subsidiaries included in the consolidated financial statements, the Group maintains relationships with related parties.
Related parties with which the Group maintains business relationships comprise RAG-Stiftung and Gabriel Acquisitions as shareholders of Evonik Industries AG, fellow subsidiaries of Evonik owned by RAG-Stiftung and associated companies and joint ventures of Evonik, which are recognized at equity.
Under the newly issued standard IAS 24 Related Party Disclosures, for fiscal 2011 for the first time the following are classified as related parties: the Federal Republic of Germany and the federal states of North Rhine-Westphalia and the Saarland. They are able to exercise a significant influence on RAG-Stiftung through their membership of the Board of Trustees of RAG-Stiftung. Transactions effected between Evonik and these federal and state governments and their subsidiaries or joint ventures in the reporting period comprised generally available government grants and subsidies, loans from public-sector banks to finance subsidized housing, and investments in their securities. Further, customary business relationships were maintained with the Deutsche Bahn Group, the Deutsche Telekom Group and the Duisport Group.

Annual Report 2011 Evonik Industries168
The transactions between the Group and these companies are shown in the table:
The receivables mainly resulted from trade relations while the debts mainly referred to financial relations.
As of the balance sheet date, €22 million (2010: €24 million) comprised security pledged to a fellow subsidiary for the liabilities of the Real Estate segment in connection with the financing of property.
In addition, on the reporting date, there was a contractual agreement to transfer the property management activities of Evonik Wohnen to Vivawest Wohnen on January 1, 2012, see Note (5.3).
Related parties also include members of the management who are directly or indirectly responsible for corporate planning, management and oversight, and members of their families. At Evonik, these parties comprise the Executive Board and Supervisory Board of Evonik Industries AG, the Executive Board and Board of Trustees of RAG-Stiftung and other members of the Group’s management who are responsible for the operating areas.
The remuneration paid to such related parties is shown in the table:
Short-term remuneration comprises both amounts not related to performance and short-term performance-related payments.
The present value of pension obligations (defined benefit obligation) was €16,245 thousand for the Executive Board (2010: €12,373 thousand) and €10,453 thousand (2010: €14,043 thousand) for other members of the management.
RAG-Stiftung Fellow subsidiaries Joint ventures Associated companies
in € million 2011 2010 2011 2010 2011 2010 2011 2010
Goods and services supplied 11 1 7 8 60 49 36 15
Goods and services received − − −26 −26 −11 −10 −33 −32
Other income − − − − − − 4 6
Receivables as of December 31 7 − 1 1 9 6 9 2
Liabilities as of December 31 − − −23 −24 −1 − −5 −
Contingent liabilities as of December 31 − − − − − − −14 −
Executive Board ofEvonik Industries AG
Supervisory Board ofEvonik Industries AG
Other management members
in € thousand 2011 2010 2011 2010 2011 2010
Short-term remuneration 11,141 8,321 2,584 2,399 6,639 10,362
Long-term performance-related remuneration (LTI Plans) − − − − 2,672 −
Current service cost for pensions and other post-employment benefits 1,192 773 − − 604 801
Termination benefits 2,181 − − − 1,666 4,454

169Management report Consolidated financial statements Supplementary information
Other disclosures
Further, the employee representatives elected to the Supervisory Board of Evonik Industries AG continued to receive the regular salary agreed in their employment contract. The level of their salary provided appropriate remuneration for the exercise of their functions and tasks in the company.
Apart from the relationships stated above, Evonik did not have any other significant business relationships with related parties.
(10.4) Contingent liabilities and other financial commitmentsContingent liabilities were as follows on the reporting date:
in € million Dec. 31, 2011 Dec. 31, 2010
Guarantee obligations 22 25
Obligations under warranties and indemnity guarantees 50 33
72 58
Evonik had a legal liability in respect of investments in partnerships, collectively owned enterprises and as the general partner of limited liability partnerships.
Other financial commitments are outlined below.The table shows the nominal value of obligations from future minimum lease payments for
assets leased under operating leases with the following payment terms:
in € million 2011 2010
Due within 1 year 66 62
Due in more than 1 and up to 5 years 196 160
Due in more than 5 years 133 135
395 357
Total payments of €93 million (2010: €93 million) were recognized as expense for operating leases in the reporting period. €92 million of this amount (2010: €93 million) related to minimum lease payments and €1 million (2010: none) comprised contingent rental payments.
(10.5) Other agreements between managers and third partiesIn connection with the acquisition of 25.01 percent of the shares in Evonik Industries AG by Gabriel Acquisitions, selected managers at Evonik were granted a right to participate indirectly in Evonik’s success. To this end, the managers purchase at market price, limited partnership shares in the partnership Angel MEP GmbH & Co. KG, Frankfurt am Main (Germany), which holds 25.01 percent of the shares in Evonik Industries AG jointly with Gabriel Holdings through two intermediate companies (Gabriel Investments and Gabriel Acquisitions).

Annual Report 2011 Evonik Industries170
The purpose of this program is to provide an incentive to managers to contribute to the future growth and sustained performance of the Group, which will be rewarded with the achievement of a contractually defined exit.
On the reporting date, the managers participating in this program held an indirect stake of 0.67 percent (2010: 0.85 percent) in Evonik Industries AG. The cash contribution for this was equivalent to the market value of the partnership shares and was determined by a suitable enterprise valuation method. Since the managers paid the fair value of the shares when they acquired them, the fair value of the equity instruments allocated in return was zero. For this reason, no expense would have to be recognized at any time, either in the event of an exit or if a manager were to leave the company.
Evonik will not at any time be required to make payments to the eligible managers under this program.
(10.6) Events after the reporting dateFollowing the transfer of the shares in Degussa AG to Evonik Industries AG pursuant to Section 327 a ff of the German Stock Corporation Act (AktG) in 2006, the appropriateness of the cash compensation payment of €45.11 per share paid at the time was examined by Düsseldorf Regional Court in an appraisal process.
On February 6, 2012 an appraiser appointed by the court submitted a report on the appropriateness of the cash compensation payment. The conclusion was that a higher payment would have been appropriate. Evonik Industries AG regards the adjustments outlined in the report as incorrect and still considers that the cash compensation payment was appropriate. Evonik Industries AG will therefore be responding accordingly to the report.
(11) Disclosures in compliance with German legislation
(11.1) Information on shareholdings pursuant to Section 313 Paragraph 2 of the German Commercial Code
The Group’s shareholdings are listed in Note (5.1). The list indicates which companies have made use of the provisions in Sections 264 Paragraph 3 and 264 b of the German Commercial Code on exemption from disclosure of annual financial statements and the preparation of notes to their financial statements and a management report.

171Management report Consolidated financial statements Supplementary information
Disclosures in compliance with German legislation
(11.2) Personnel expense and number of employees pursuant to Section 314 Paragraph 1 No. 4 of the German Commercial Code
The personnel expense for the continuing operations in the reporting period comprised the following items:
in € million 2011 2010
Wages and salaries 2,140 2,207
Social security contributions 315 309
Pension expenses 149 198
Other personnel expense 24 18
2,628 2,732
Interest expense on accrued interest on pensions and the expected return on plan assets are included in net interest expense, see Note (6.4).
The table shows the annual average headcount for the continuing operations:
Employees 2011 2010
Consumer, Health & Nutrition 6,259 6,369
Resource Efficiency 7,161 7,792
Specialty Materials 6,797 6,717
Services 10,515 10,576
Real Estate 1,119 1,070
Corporate, other operations 1,826 1,699
33,677 34,223
In addition, in 2011 an average of 957 employees (2010: 4,899 employees) worked for the discontinued operations, which related to the divestment of the former Energy Business Area, see Note (5.2).
(11.3) Remuneration of Board of Management and Supervisory Board pursuant to Section 314 Paragraph 1 No. 6 of the German Commercial Code
Remuneration paid to the members of the Executive Board of Evonik Industries AG for their work in 2011 amounted to €11,141 thousand (2010: €8,321 thousand). In 2011 provisions for bonus payments for Executive Board members for the previous year amounting to €112 thousand were utilized.
Total remuneration of former members of the Executive Board was €946 thousand in 2011 (2010: €5,501 thousand).
As of the balance sheet date, the present value of pension obligations (defined benefit obligations) to former members of the Executive Board amounted to €23,276 thousand (2010: €18,613 thousand).
The remuneration of the Supervisory Board for 2011 totaled €2,584 thousand (2010: €2,399 thousand).

Annual Report 2011 Evonik Industries172
(11.4) Auditors’ fees pursuant to Section 314 Paragraph 1 No. 9 of the German Commercial Code
The auditor for the consolidated financial statements of the Evonik Group was Pricewaterhouse Coopers Aktiengesellschaft Wirtschaftsprüfungsgesellschaft (PwC), Düsseldorf (Germany). PwC rendered the following services to the Group:
in € million 2011 2010
Auditing of annual financial statements 3.1 3.8
Other audit-related services 4.5 1.1
Tax consolidation services 1.2 0.1
Other services 2.3 1.1
11.1 6.1
The fees for auditing annual financial statements included expenses for the audit of the consolidated financial statements and of the separate annual financial statements of Evonik Industries AG and its German subsidiaries.
Other audit-related services comprised services apart from the auditing of annual financial statements, especially the review of interim financial statements and other assurance services in connection with projects.
Essen, February 20, 2012
Evonik Industries AGThe Executive Board
Dr. Engel Dr. Colberg Dr. Haeberle
Wessel Wohlhauser Dr. Yu

Management report Consolidated financial statements Supplementary information 173
Supp
lem
enta
ry in
form
atio
n
Supplementary information
Independent Auditor’s Report 175
Report of the Supervisory Board 177
Joint report of the Executive Board and Supervisory Board of Evonik Industries AG on Corporate Governance 180
Further information on corporate officers 192
Market positions 196
Glossary 198

Annual Report 2011 Evonik Industries174
EBITDA rose 17 percent to €2.8 billion and the EBITDA margin increased from 17.8 percent to 19.0 percent.
14.5About 7,500 employees in Germany took part in our employee participation plan in 2011. They acquired participation rights totaling €14.5 million.
mill
ion
2.8billion
Supp
lem
enta
ry in
form
atio
n

175Management report Consolidated financial statements Supplementary information
Independent Auditor’s Report
Independent Auditor’s ReportTo Evonik Industries AG, Essen
Report on the Consolidated Financial StatementsWe have audited the accompanying consolidated financial statements of Evonik Industries AG, Essen, and its subsidiaries, which comprise the income statement, the statement of comprehensive income, the balance sheet, the statement of changes in equity, the statement of cash flows and the notes to the consolidated financial statements for the business year from January 1, to December 31, 2011.
Executive Board’s Responsibility for the Consolidated Financial StatementsThe Executive Board of Evonik Industries AG, Essen, is responsible for the preparation of these consolidated financial statements. This responsibility includes that these consolidated financial statements are prepared in accordance with International Financial Reporting Standards, as adopted by the EU, and the additional requirements of German commercial law pursuant to § (Article) 315 a Abs. (paragraph) 1 HGB (“Handelsgesetzbuch”: German Commercial Code) and that these consolidated financial statements give a true and fair view of the net assets, financial position and results of operations of the group in accordance with these requirements. The Executive Board is also responsible for the internal controls as the Executive Board determines are necessary to enable the preparation of consolidated financial statements that are free from material misstatement, whether due to fraud or error.
Auditor’s ResponsibilityOur responsibility is to express an opinion on these consolidated financial statements based on our audit. We conducted our audit in accordance with § 317 HGB and German generally accepted standards for the audit of financial statements promulgated by the Institut der Wirtschaftsprüfer (Institute of Public Auditors in Germany) (IDW) and additionally observed the International Standards on Auditing (ISA). Accordingly, we are required to comply with ethical requirements and plan and perform the audit to obtain reasonable assurance about whether the consolidated financial statements are free from material misstatement.
An audit involves performing audit procedures to obtain audit evidence about the amounts and disclosures in the consolidated financial statements. The selection of audit procedures depends on the auditor’s professional judgment. This includes the assessment of the risks of material misstatement of the consolidated financial statements, whether due to fraud or error. In assessing those risks, the auditor considers the internal control system relevant to the entity’s preparation of consolidated financial statements that give a true and fair view. The aim of this is to plan and perform audit procedures that are appropriate in the given circumstances, but not for the purpose of expressing an opinion on the effectiveness of the group’s internal control system. An audit also includes evaluating the appropriateness of accounting policies used and the reasonableness of accounting estimates made by the Executive Board, as well as evaluating the overall presentation of the consolidated financial statements.
We believe that the audit evidence we have obtained is sufficient and appropriate to provide a basis for our audit opinion.

Annual Report 2011 Evonik Industries176
Audit OpinionAccording to § 322 Abs. 3 Satz (sentence) 1 HGB, we state that our audit of the consolidated financial statements has not led to any reservations.
In our opinion based on the findings of our audit, the consolidated financial statements comply, in all material respects, with IFRSs, as adopted by the EU, and the additional requirements of German commercial law pursuant to § 315 a Abs. 1 HGB and give a true and fair view of the net assets and financial position of the Group as at December 31, 2011 as well as the results of operations for the business year then ended, in accordance with these requirements.
Report on the Group Management ReportWe have audited the accompanying management report for the Evonik Group, which is combined with the management report of the company, Evonik Industries AG, Essen, for the business year from January 1 to December 31, 2011. The Executive Board of Evonik Industries AG, Essen, is respon-sible for the preparation of the combined management report in accordance with the requirements of German commercial law applicable pursuant to § 315 a Abs. 1 HGB. We conducted our audit in accordance with § 317 Abs. 2 HGB and German generally accepted standards for the audit of the combined management report promulgated by the Institut der Wirtschaftsprüfer (Institute of Public Auditors in Germany) (IDW). Accordingly, we are required to plan and perform the audit of the combined management report to obtain reasonable assurance about whether the combined management report is consistent with the consolidated financial statements and the audit findings, as a whole provides a suitable view of the Group’s position and suitably presents the opportunities and risks of future development.
According to § 322 Abs. 3 Satz 1 HGB we state that our audit of the combined management report has not led to any reservations.
In our opinion based on the findings of our audit of the consolidated financial statements and combined management report, the combined management report is consistent with the consolidated financial statements, as a whole provides a suitable view of the Group’s position and suitably presents the opportunities and risks of future development.
Düsseldorf, February 23, 2012
PricewaterhouseCoopersAktiengesellschaftWirtschaftsprüfungsgesellschaft
Andreas Menke Eckhard Sprinkmeier(German Public Auditor) (German Public Auditor)

177Management report Consolidated financial statements Supplementary information
Report of the Supervisory Board
Report of the Supervisory BoardLadies and gentlemen:
During the past fiscal year, the Supervisory Board performed the obligations imposed on it by law and the Articles of Incorporation. We maintained an ongoing dialog with the Executive Board, and continuously monitored and discussed its management of the company. The Executive Board provided us with full and timely information on relevant aspects of business policy, corporate planning and strategic development, business performance and the situation of the Group.
We addressed the issues of importance to the company at seven meetings, on January 17, March 15, May 2, June 28, August 12, September 26 and December 16, 2011 and in one case in April 2011 through a written circulation procedure. In addition, the Executive Board provided us with written reports on business developments and processes of particular significance for Evonik.
The Chairman of the Supervisory Board was kept constantly informed of all major business developments.
Overall, fiscal 2011 was a very positive year: Evonik successfully continued its strategic reposi-tioning from an integrated industrial group to a world leader in specialty chemicals and reported very good earnings. This highlights Evonik’s very good position and provides for confidence in its further development.
Significant developments included the divestment of the 51 percent stake in STEAG GmbH to a consortium of municipal utilities in Germany’s Rhine-Ruhr region, which was approved by the Supervisory Board in January 2011. Under a contractually agreed arrangement, the consortium will also acquire the remaining shares at a later date.
Other important issues discussed were the planned merger of Evonik Immobilien GmbH, now operating as Vivawest GmbH, and THS GmbH to form Germany’s third-largest residential real estate company, and the mid-term plans to exit the real estate operations. As a first step, Vivawest and THS pooled the management of their residential property effective January 1, 2012 in a newly formed joint venture, Vivawest Wohnen GmbH.
The Supervisory Board also discussed Evonik’s new organizational and management structure in detail. Key aspects included: • increasing the Executive Board to six members from April 1, 2011 by appointing
Mr. Patrik Wohlhauser, Dr. Thomas Haeberle and Dr. Dahai Yu • direct management of the operational business units by the extended Executive Board • bundling groups of two business units to form reporting segments.

Annual Report 2011 Evonik Industries178
Other issues discussed were:• the divestment of the carbon black business to Rhône Capital and Triton Partners • the acquisition of hanse chemie AG and nanoresins AG (Geesthacht, Germany)• the acquisition of SurModics Pharmaceuticals Inc. (USA)• the acquisition of the Canadian hydrogen peroxide business of Kemira Chemicals Canada Inc.• the erection of a superabsorbents facility (Saudi Arabia)• the construction of a backwardly integrated methionine facility (Singapore)• the construction of an oleochemical production complex (China)• the erection of a hydrogen peroxide plant (China)• the construction of an isophorone line (China)• expansion of lysine capacity (USA)• ramp-up of production of lithium-ion cells (Kamenz, Germany)The Supervisory Board discussed the planned stock market listing in detail, especially at a special meeting on August 12, 2011. A central issue was aligning corporate governance regulations to the standards of publicly listed companies.
The Supervisory Board and Executive Board of Evonik Industries AG are explicitly committed to responsible corporate governance as an expression of good corporate management. Evonik takes the recommendations and suggestions set out in the German Corporate Governance Code in the version dated May 26, 2010 as its guide.
There were no conflicts of interest relating to members of the Supervisory Board of Evonik Industries AG in fiscal 2011. Moreover, there were no consultancy, service or similar contracts with any members of the company’s Supervisory Board. Any transactions between the company or a company in the Evonik Group on the one hand and Supervisory Board members and related parties on the other complied with the customary standards in the sector.
The Supervisory Board has set objectives for its composition which will be taken into account in the future. In particular, these take account of diversity, which covers various aspects such as nationality, gender, age and experience, and pays considerable attention to the company’s strategic focus as a specialty chemicals corporation with global operations, and the regional focus of its business. The Super visory Board and its Nomination Committee monitor observance of these targets, for example through an efficiency review. The outcome of the efficiency review of the Supervisory Board and its committees was positive.
The work of the Supervisory Board was prepared and supported by its committees. The Executive Committee held eight meetings, the Finance and Investment Committee seven, the Audit Committee four, and the newly established Nomination Committee three.
PricewaterhouseCoopers Aktiengesellschaft Wirtschaftsprüfungsgesellschaft (PwC), Düsseldorf (Germany) has audited the financial statements of Evonik Industries AG as of December 31, 2011 prepared by the Executive Board in accordance with the German Commercial Code (HGB), the consolidated financial statements for the Evonik Group prepared using the International Financial Reporting Standards (IFRS), as permitted by Section 315 a Paragraph 3 of the German Commercial Code (HGB), and the combined management report for Evonik and the Evonik Group, and has endorsed them with an unqualified opinion pursuant to Section 322 of the German Commercial Code (HGB). The auditors also included the risk identification system in the annual audit on the basis of a discretionary request from the Supervisory Board.
The auditors outlined the main findings of their audit at the meeting of the Audit Committee on March 6, 2012 and the full meeting of the Supervisory Board on March 13, 2012. Following a thorough examination and discussion of the annual financial statements for the company, the consolidated financial statements for the Group and the combined management report, the Supervisory Board raises no objections to the financial statements for Evonik and the Evonik Group and the combined management report and concurs with the auditors’ findings. The Supervisory

179Management report Consolidated financial statements Supplementary information
Report of the Supervisory Board
Board therefore endorses the annual financial statements for Evonik Industries AG and the consolidated financial statements for the Evonik Group. The annual financial statements for 2011 are thus ratified.
The Executive Board has prepared a report on relations with affiliated companies. This was examined by the auditors, who have issued the following unqualified opinion in accordance with Section 313 of the German Stock Corporation Act (AktG):“In accordance with our professional audit and judgment, we confirm that 1. the factual disclosures made in this report are correct2. the company’s expenditures in connection with the legal transactions contained in the report
were not unreasonably high and compensation was received for any disadvantages.”The auditors outlined the main findings of their audit at the meeting of the Audit Committee on March 6, 2012 and the full meeting of the Supervisory Board on March 13, 2012.
In its examination of the transactions outlined in the report, the Supervisory Board established that the company’s expenditures in connection with these transactions were not unreasonably high. It obtained an explanation of how the relevant activities and the remuneration therefor were determined, particularly in the case of transactions of material significance.
The Audit Committee discussed the report and gave the Supervisory Board an extensive over-view of the outcome of its meeting. The Supervisory Board has no objections to raise to the final declaration made by the Executive Board in its report on relations with affiliated companies and concurs with the auditors’ findings.
As prescribed by German law, Mr. Horst Rohde’s mandate as a member of the Supervisory Board ended when the 51 percent stake in STEAG GmbH was transferred to the consortium of municipal utilities. Mr. Ulrich Terbrack was appointed a member of the Supervisory Board for the current term of office of the Supervisory Board in his place effective March 12, 2011.
Mr. Konrad Oelze and Mr. Rainer Schankweiler resigned from the Supervisory Board as of July 31, 2011. Mr. Dieter Kleren and Mr. Norbert Pohlmann were appointed as their successors for the current term of office of the Supervisory Board with effect from August 1, 2011.
Mr. Ralf Blauth retired from his position as a member of the Executive Board and Chief Human Resources Officer of Evonik Industries AG on August 31, 2011. Mr. Thomas Wessel was appointed to succeed him for a five-year period starting on September 1, 2011.
The Supervisory Board would like to thank all members who have left the Supervisory Board and Mr. Blauth for their many years of service for the good of the company and its employees.
The Supervisory Board would like to thank the Executive Board, Works Councils and Senior Staff Committees representing the workforce, and all employees of Evonik Industries AG and its affiliated companies for their hard work and commitment over the past year.
Essen, March 2012
The Supervisory Board
Wilhelm Bonse-Geuking, Chairman

Annual Report 2011 Evonik Industries180
Joint report of the Executive Board and Supervisory Board of Evonik Industries AG on Corporate Governance(Corporate Governance Report)
(1) Principles of corporate governance and corporate structureCorporate governance comprises all principles for the management and supervision of a company. As an expression of good and responsible corporate management, it is therefore a key element in Evonik’s management philosophy. The principles of corporate governance relate mainly to cooperation within the Executive Board and Supervisory Board and between these two boards and the shareholders, especially at Shareholders’ Meetings. They also relate to the company’s relationship with other people and organizations with which it has business dealings.
Evonik is committed to the German Corporate Governance Code Evonik Industries is a stock corporation established under German law.
Alongside compliance with the provisions of the relevant legislation, the basis for ensuring responsible management and supervision of Evonik with a view to sustained value creation is our commitment to the German Corporate Governance Code in the version dated May 26, 2010. This code, which was adopted by the Government Commission on the German Corporate Governance Code, contains both key statutory provisions on the management and supervision of publicly listed German companies and recommendations and suggestions based on nationally and internationally recognized standards of responsible corporate governance. The aim is to ensure that corporate governance in Germany is transparent and understandable in order to strengthen the trust of investors, customers, employees and the general public in the management and supervision of listed companies.
The Executive Board and Supervisory Board of Evonik Industries AG are explicitly committed to responsible corporate governance and identify with the goals of the German Corporate Governance Code.
(2) Information on corporate management
(2.1) The German Corporate Governance CodeSince it is not listed on the stock exchange, with respect to 2011 Evonik Industries AG is not subject to the obligation contained in Section 161 the German Stock Corporation Act (AktG) to submit a declaration of the extent to which it has complied or will comply with the German Corporate Governance Code and which recommendations have not been and will not be met, together with the reasons for this (Declaration of Conformity).
Nevertheless, Evonik aligns itself to the recommendations contained in the code. Insofar as certain requirements assume a stock market listing or only make sense in such cases, organiza-tional steps have been taken to ensure that they are met, for example through corresponding provisions in the Articles of Incorporation or Rules of Procedure (for example, recommendations on the exercise of shareholders’ rights at a public general meeting or the transmission of such rights by electronic media). As a result, Evonik complies with a large part of the recommendations and suggestions.

181Management report Consolidated financial statements Supplementary information
Joint report of the Executive Board and Supervisory Board of Evonik Industries AG on Corporate Governance
(2.2) Relevant information on corporate management practicesCompliance Evonik understands compliance as all activities to ensure that the conduct of the company, members of its governance bodies and its employees respects all applicable statutory and in-house regulations and voluntary undertakings. The basis for this is set out in Evonik’s Code of Conduct.
Code of Conduct Evonik’s binding Group-wide Code of Conduct contains the most important corporate values and principles and governs the conduct of Evonik, its legal representatives and its employees both internally, in relation to one another, and externally in relation to the company’s shareholders and business partners, representatives of authorities and government bodies, and the general public. It requires all employees to comply with the applicable laws, regulations and other obligations. They are also required to observe certain ethical standards. Compliance with the Code of Conduct is monitored and action is taken in the event of infringement. The Code of Conduct fosters a culture that ensures clear responsibility, mutual trust and respect, dependability and lawfulness. The compliance culture created by the Code of Conduct, in particular, forms the basis for the “House of Compliance.”
House of ComplianceThe compliance issues identified as being of specific relevance to our company are bundled in a House of Compliance. They are the pillars of compliance management, which is based on uniform minimum requirements for all these issues. Alongside traditional compliance issues such as antitrust law, foreign trade law, fighting corruption and data protection, as a technology-driven specialty chemicals company, issues of relevance to us include the environment, safety, health, quality, know-how protection and IT compliance.
House of Compliance
Effectiveness of the compliance management system
Compliance management system
Compliance culture
Supervisory Board
Executive Board
Coordinated by the Chief Compliance Officer (Chairman of the Compliance Committee)
Ant
itrus
t
Fore
ign
Trad
e
Figh
ting
Corr
uptio
n
Capi
tal M
arke
t Com
plia
nce
Dat
a Pr
otec
tion
Envi
ronm
ent,
Safe
ty,
Hea
lth, Q
ualit
y
Know
-how
Pro
tect
ion
IT C
ompl
ianc
e

Annual Report 2011 Evonik Industries182
This extensive approach to compliance is the result of a risk analysis conducted with external support. Regular reviews of the issues are initiated by the Chief Compliance Officer.
The Chief Compliance Officer is responsible for structuring and ongoing development of the House of Compliance. He operates autonomously and reports directly to the Chairman of the Executive Board. He is supported in all major issues by a Compliance Committee, an internal advi-sory committee composed of the heads of the various specialist departments and Corporate Audit. Compliance officers in the business units and regions ensure close integration of our operating business.
Corporate ResponsibilityCompanies that strive for lasting success on the market need social acceptance as well as reliable and responsible corporate governance. Together with the Code of Conduct, our Environment, Safety and Health Values (ESH Values) and Global Social Policy (GSP) contribute to the responsible corporate management of the company.
In its Global Social Policy, Evonik outlines its principles of social responsibility for its employees. The GSP states that the company’s success and reputation are based fundamentally on the professionalism and commitment of all employees. At the same time, all employees are required to comply with the principles of the GSP, which are based primarily on internationally recognized standards such as the International Labor Standards of the International Labour Organisation (ILO) and the Guidelines for Multinational Enterprises issued by the Organisation for Economic Cooperation and Development (OECD).
By joining the United Nations’ Global Compact, Evonik also gave an undertaking that, within its sphere of influence, it would respect human rights and labor rights, avoid discrimination, protect people and the environment and fight against corruption.
Further, within its sphere of influence, Evonik does not tolerate any conduct that violates the OECD Guidelines for Multinational Enterprises. The governments of the OECD member states and further countries developed these principles as recommendations for multinational companies on responsible corporate conduct. A revised version was published in 2011.
As a signatory to the chemical industry’s Responsible Care Global Charter, we have given an undertaking that we continuously strive to improve our performance in health protection, safety, environmental protection and product stewardship. At the end of 2010 Evonik signed the Code of Responsible Conduct for Business, which sets measurable standards that have to be firmly anchored in participating companies. These include fair competition, social partnership, the merit principle and sustainability.
The main documents containing the guidelines on conduct in the Evonik Group can be found on the company’s homepage:
Code of Conduct www.evonik.com/coc
ESH Values www.evonik.com/esh
Global Social Policy www.evonik.com/gsp
Code of Responsible Conduct for Businesshttp://www.wcge.org/download/120206_leitbild-eng_Unterschriften_o.pdf

183Management report Consolidated financial statements Supplementary information
Joint report of the Executive Board and Supervisory Board of Evonik Industries AG on Corporate Governance
(2.3) Work of the Executive Board and Supervisory BoardThe German Stock Corporation Act (AktG) forms the legal basis for the incorporation of Evonik Industries AG. Further details are set out in the company’s Articles of Incorporation. The Executive Board and Supervisory Board take the German Corporate Governance Code as their guide.
Executive BoardThe Executive Board of Evonik Industries AG is responsible for running the company in the company’s interests with a view to sustained value creation, taking into account the interests of the shareholders, employees and other stakeholders. It works together trustfully with the other corporate governance bodies for the good of the company.
The Executive Board defines and updates the company’s business objectives, its basic strategic focus, business policy and corporate structure. It is responsible for complying with statutory provisions and internal directives, and exerts its influence to ensure that they are observed by Group companies (compliance). Its tasks also include ensuring appropriate risk management and risk controlling within the company.
When making appointments to management functions in the company, the Executive Board applies the principles of diversity. In this it strives, in particular, to ensure adequate representation of women.
Since April 1, 2011 the Executive Board has been composed of six members. One member is appointed to chair the Executive Board. With the approval of the Supervisory Board, the Executive Board has adopted rules of procedure and a plan allocating areas of responsibility. The chairman coordinates the work of the Executive Board, provides information for the Supervisory Board and maintains regular contact with the Chairman of the Supervisory Board.
The members of the Executive Board are jointly responsible for the overall management of the company. They work together constructively and keep each other informed of the main activities and developments in their areas of responsibility.
Ensuring that the Supervisory Board receives sufficient information is the joint responsibility of the Executive Board and Supervisory Board. The Executive Board provides the Supervisory Board with the reports to be prepared in accordance with the Rules of Procedure of the Supervisory Board, in compliance with Section 90 of the German Stock Corporation Act (AktG). It gives the Supervisory Board timely, regular and full information on all matters relating to planning, business development, risks, risk management and compliance. It outlines deviations between the planned and actual business performance and targets and the reasons therefor.
Further, the Executive Board submits timely reports to the Supervisory Board on business matters and actions for which it is required by the Articles of Incorporation or Rules of Procedure to obtain the approval for the Supervisory Board, for example, the annual finance and investment planning for the Group.
Members of the Executive Board are required to act in the interests of the company. They may not pursue personal interests in their decisions, nor may they utilize business opportunities available to the company for themselves.
The members of the Executive Board are subject to a comprehensive non-compete obligation during their term of office. They may only assume additional posts, especially seats on the supervisory boards of companies that are not affiliated companies of Evonik Industries AG, with the approval of the Supervisory Board. Where such posts are assumed with the approval of the Supervisory Board, the Executive Board member shall accept the post as a personal office and shall ensure strict confidentiality and strict separation from his/her activities as a member of the company’s Executive Board. Every member of the Executive Board is required to disclose any conflict of interests to the Chairman of the Supervisory Board without delay and to inform the other members of the Executive Board. In fiscal 2011 there were no conflicts of interest relating to members of the Executive Board of Evonik Industries AG.

Annual Report 2011 Evonik Industries184
All transactions between the company or companies in the Evonik Group on the one hand and Executive Board members and related parties on the other must take place on terms that are customary in the sector. No such transactions took place in the reporting period.
The composition of the Executive Board is outlined on page 195.
Supervisory BoardThe Supervisory Board advises and supervises the Executive Board. It appoints the members of the Executive Board and names one member as the Chairman of the Executive Board. It also decides on the remuneration of the Executive Board. The Executive Board is required to obtain the approval of the Supervisory Board on decisions of fundamental importance, which are defined in a separate list.
The Supervisory Board examines the company’s annual financial statements and the proposal for the appropriation of the profit, the consolidated financial statements for the Group and the combined management report. The Supervisory Board’s decision on whether to ratify the annual financial statements and its proposal for the distribution of the profit are prepared by the Audit Committee. The Supervisory Board submits a written report on the outcome of the audit to the Shareholders’ Meeting.
The Supervisory Board is subject to the German Codetermination Act 1976 (MitbestG). In accordance with these statutory provisions, the Supervisory Board comprises twenty members: ten representatives of the shareholders and ten representatives of the workforce. The representatives of the shareholders are elected by the Shareholders’ Meeting. The Supervisory Board nominates candidates on the basis of suggestions made by its Nomination Committee. The representatives of the employees are elected by the workforce and comprise seven employee representatives and three representatives of the industrial union.
The members of the Supervisory Board should have the knowledge, ability and professional experience required to perform their duties. At least one independent member of the Supervisory Board must have expertise in accounting or auditing. The members of the Supervisory Board may not undertake any duties as officers or advisors to the company’s major competitors.
The Supervisory Board should by its own judgment have sufficient independent members to ensure independent advice and supervision of the Executive Board. A member of the Supervisory Board is deemed to be independent if he or she has no business or personal relationship with the company and its Executive Board that could result in a conflict of interests.
The Supervisory Board should not include more than two former members of the Executive Board. All members of the Supervisory Board must ensure that they have sufficient time to perform their tasks as a member of the Supervisory Board. Members of the Supervisory Board who are also members of the Executive Board of a publicly listed stock corporation should not hold more than three seats on the Supervisory Boards of listed companies outside their group of companies or Supervisory Boards of companies where comparable demands are made on them.
Members of the Supervisory Board must not pursue personal interests in their decisions, nor may they utilize business opportunities available to the company for themselves. Members must disclose conflicts of interest to the Supervisory Board. Any member of the Supervisory Board who discloses a conflict of interests is excluded from resolutions at the meetings of the Supervisory Board dealing with matters relating to this conflict of interests. In its report to the Shareholders’ Meeting the Supervisory Board discloses any conflicts of interest that have arisen and how they have been dealt with. Material conflicts of interest relating to a member of the Supervisory Board that are not by nature temporary should lead to termination of his/her term of office.
185Management report Consolidated financial statements Supplementary information
Joint report of the Executive Board and Supervisory Board of Evonik Industries AG on Corporate Governance
Consultancy, service and similar contracts between a member of the Supervisory Board and the company must be approved by the Supervisory Board. There were no contracts of this type in 2011.
The Supervisory Board has adopted Rules of Procedure. Two regular meetings of the Super-visory Board are held in each calendar half-year. In addition, meetings may be convened as required and the Supervisory Board may adopt resolutions outside meetings. If an equal number of votes is cast when taking a decision, and a second vote does not alter this situation, the Chairman of the Supervisory Board has the casting vote.
The Supervisory Board has adopted the following objectives for its composition and intends to take account of them when nominating candidates to the Shareholders’ Meeting for the next regular election of Supervisory Board members in 2013.• At least two members should have sound knowledge and experience of regions which are of
material importance for the Evonik Group’s business either through their background or through professional experience gained in an international context.
• At least two members should have special knowledge and experience of business administration and of finance/accounting or auditing.
• At least two members of the Supervisory Board should have specialist knowledge and experi-ence of the area of specialty chemicals.
• At least two members should have experience of managing or supervising a major company.• There should be at least two female members of the Supervisory Board.• The members of the Supervisory Board should not hold consulting or governance positions
with customers, suppliers, creditors or other business partners that could lead to a conflict of interests. Deviations from this rule are permitted in legitimate individual cases.
• Members of the Supervisory Board should not normally be over 70 when they are elected.
The Supervisory Board and its Nomination Committee will monitor observance of these targets through its efficiency review. See the report of the Supervisory Board on page 178.
The Supervisory Board has the following committees:The Executive Committee comprises the Chairman of the Supervisory Board, his deputy and four further members. It undertakes the regular business of the Supervisory Board and advises the Executive Board on fundamental issues relating to the ongoing strategic development of the company. Insofar as is permitted by law, it takes decisions in place of the full Supervisory Board on matters which cannot be put off until the necessary resolution is passed by the full Supervisory Board without detrimental effects for the company. It also takes decisions on the use of authorized capital. It prepares meetings of the Supervisory Board and, in particular, personnel decisions and resolutions on the remuneration of the Executive Board, including the main contractual elements and the overall remuneration of individual members of the Executive Board. It is also responsible for concluding and terminating employment contracts with the members of the Executive Board, where this does not involve altering or setting remuneration, and represents the company in other transactions of a legal nature with present and former members of the Executive Board and certain related parties. Further, it examines issues relating to corporate governance and reports to the Supervisory Board at least once a year on the status, effectiveness and scope to implement any improvements to corporate governance.

Annual Report 2011 Evonik Industries186
The Audit Committee has six members. The members of the Audit Committee should have specialist knowledge and experience in the application of accounting standards and internal control systems.
The committee’s tasks comprise, in particular, supervising the accounting process and the efficacy of the internal control system, the risk management system, the internal audit system and compliance, the required independence of the auditor and any additional services provided by the auditor, issuing the audit assignment to the auditor and, where applicable, the auditor of the interim financial statements, setting focal points for the audit and agreeing audit fees with the auditor. It prepares the Supervisory Board’s proposal to the Shareholders’ Meeting on the choice of auditor, decides on the appointment of the auditor and authorizes the Chairman of the Supervisory Board to issue the contract to the auditor.
The Audit Committee prepares the decision of the Supervisory Board on approval of the annual financial statements of Evonik Industries and the consolidated financial statements for the Group. For this purpose, it is required to conduct a preliminary examination of the annual financial statements of Evonik Industries, the consolidated financial statements for the Group, the combined management report and the proposal for the appropriation of the profit. The auditor of the financial statements must attend these meetings of the Audit Committee.
The Audit Committee examines the quarterly financial statements and half-yearly statements (interim reports) and discusses the audit review report with the auditor.
The Finance and Investment Committee has six members. Its work covers aspects of corporate finance and investment planning. For example, it takes decisions on behalf of the Supervisory Board involving approval for the establishment, acquisition and divestment of businesses, capital measures at other Group companies and real estate transactions with a value of more than €25 million and up to €50 million. If the value of such measures or transactions exceeds the above limit, it prepares for a resolution by the Supervisory Board. The Finance and Investment Committee also takes decisions on the assumption of guarantees and sureties for loans exceeding €50 million and on investments in companies exceeding €100 million.
The Nomination Committee comprises three Supervisory Board members elected as representatives of the shareholders. The task of the Nomination Committee is to prepare a proposal for the Supervisory Board on the candidates to be nominated to the Shareholders’ Meeting for election to the Supervisory Board.
Finally, there is a Mediation Committee established in accordance with Section 27 Paragraph 3 of the German Codetermination Act 1976. This mandatory committee is composed of the Chairman and Deputy Chairman of the Supervisory Board, one shareholder representative and one employee representative. This committee puts forward proposals to the Supervisory Board on the appoint-ment of members of the Executive Board if the necessary two-thirds majority of the Supervisory Board members is not achieved in the first vote. It is only convened when necessary.
All other committees meet regularly and may also hold additional meetings on specific issues in line with their responsibilities as set out in the Rules of Procedure for the Supervisory Board. Further details of the work of the Supervisory Board and its committees in the past fiscal year can be found in the report of the Supervisory Board on page 177.
For details of the composition of the Supervisory Board see pages 192–194.

187Management report Consolidated financial statements Supplementary information
Joint report of the Executive Board and Supervisory Board of Evonik Industries AG on Corporate Governance
Directors’ DealingsOn the reporting date, members of the Executive Board and Supervisory Board and related parties did not have an obligation pursuant to Section 15 a of the German Securities Trading Act to disclose the purchase and sale of shares in Evonik Industries AG and related financial instruments because shares in Evonik Industries AG are neither listed for trading on an organized market nor has any such listing been applied for or officially announced.
Total (indirect) holdings of shares in Evonik Industries AG and related financial instruments by members of the Executive Board and Supervisory Board on the reporting date amounted to less than 1 percent of the issued shares.
(3) Shareholders and the Shareholders’ MeetingThe shareholders exercise their rights at the Shareholders’ Meeting. The Shareholders’ Meeting elects the auditor and the shareholder representatives on the Supervisory Board and resolves on the ratification of the actions of members of the Executive Board and Supervisory Board, the appropriation of the profit, capital transactions and amendments to the Articles of Incorporation. Since the changeover from bearer shares to registered shares in December 2011, shareholders who are entered in the register of shareholders are eligible to attend the Shareholders Meeting and exercise their voting rights, providing they register in good time to attend the meeting. The shareholders may exercise their voting rights at the Shareholders’ Meeting in person, through a proxy of their choice or through a proxy appointed by the company. Each share entitles the holder to one vote.
(4) Information on accounting and auditing of the financial statements
Evonik Industries AG prepares its annual financial statements in accordance with the German Commercial Code (HGB) and the German Stock Corporation Act (AktG). The consolidated financial statements are prepared on the basis of the International Financial Reporting Standards (IFRS), as adopted for use in the EU. In addition, Section 315 a of the German Commercial Code is taken into account.
The Shareholders’ Meeting appointed PricewaterhouseCoopers Aktiengesellschaft Wirtschafts-prüfungsgesellschaft (PwC) as auditor for the annual financial statements of Evonik Industries AG and the consolidated financial statements of the Evonik Group for 2011. The Supervisory Board previously ascertained the independence of the auditor.
PwC has audited the annual financial statements and consolidated annual financial statements of Evonik Industries AG and the combined management report for fiscal 2011 and also conducted a review of the half-year financial statements in 2011. These covered the risk management system as well as the accounts.
The interim financial statements are discussed with the Audit Committee before they are published.
(5) Risk management and internal control system (ICS)Risk management in the Evonik Group, including the ICS relating to the accounting process, is described in the risk report, which forms part of the management report. Details can be found on page 63.

Annual Report 2011 Evonik Industries188
(6) RemunerationRemuneration reportThe remuneration report outlines the principles of the remuneration system for the members of the Executive Board and the structure and level of the Executive Board’s remuneration. It also contains information on the remuneration of the Supervisory Board.
The presentation of the remuneration of the Executive Board contains the data required to comply with German commercial law.
Remuneration of the Executive BoardThe remuneration system for the Executive Board is designed to ensure that its members receive adequate remuneration for their tasks and responsibilities and to take direct account of the perfor-mance of each member of the Executive Board and of the company.
The appropriateness of the remuneration is evaluated regularly by remuneration reviews. These examine the structure and level of remuneration of the Executive Board in comparison with the external market and in relation to remuneration elsewhere in the company. If this reveals a need to adjust the remuneration system or level of remuneration, the Executive Committee submits a corresponding proposal to the Supervisory Board for a decision. The last review of remuneration was in June 2011.
Components of remunerationThe remuneration paid to the members of the Executive Board comprises a fixed monthly base salary, a performance-related annual bonus and long-term variable remuneration.The structure is as follows:• Base salary: approx. 35 percent• Annual bonus (based on 100 percent attainment of targets): approx. 45 percent• Long-term remuneration (based on the value of rights granted): approx. 20 percent
All remuneration received for offices held in the interests of the company, apart from allowances for the attendance of meetings, is deducted from the annual bonus payment or paid over to the company.
In addition to the remuneration components outlined above, the total remuneration package includes pension and other entitlements and fringe benefits.
The fixed base salary is a cash payment for the fiscal year. It takes account of the experience and scope of responsibility of each Executive Board member. The individual base salary is paid out in twelve equal installments.
The performance-related annual bonus is dependent on the attainment of business targets measured by performance indicators (bonus factor) and the attainment of individual objectives (performance factor). The bonus factor and performance factor are multiplied. The level of the bonus factor depends on the achievement of the business targets derived from the corporate planning and may be between 0 and 200 percent. The parameters are set individually on the basis of the individual member’s area of responsibility. They comprise economic value added (EVA), earnings before taxes (EBT), free cash flow and a target dividend. The accident situation in the fiscal year also has an impact.

189Management report Consolidated financial statements Supplementary information
Joint report of the Executive Board and Supervisory Board of Evonik Industries AG on Corporate Governance
The performance factor rewards the attainment of personal targets and can vary between 0.8 and 1.2. If the targets are achieved in full, the contractually agreed bonus is paid. If the company’s income falls short of the planned level, the bonus factor may—in the extreme case—be zero, regardless of personal attainment. In other words, it is conceivable that a bonus might not be paid for a specific year. The bonus is capped at 200 percent of the target bonus.
The business and personal targets set for Executive Board members for the bonus and perfor-mance factors are agreed annually in writing between the Supervisory Board and the Executive Board members. Together with the corporate planning approved by the Supervisory Board, personal targets form the basis for calculation of the annual bonus.
At the end of the fiscal year, the bonus factor and personal performance factor for each member of the Executive Board are calculated on the basis of the Group’s net income. The target level is achieved if both company and personal targets are fully achieved. The final decision is taken by the Supervisory Board.
The long-term remuneration is based on a sustained increase in the value of the company. This remuneration component is designed as a reward for achieving or exceeding the operating earnings targets set in the mid-term planning and their impact on the value of the company. Each plan runs for five years and new tranches are normally issued each year.
At the end of each period, the increase in value and payout are determined by comparison with the mid-term planning.
There is an upper limit on these payments, which may be between 0 and 300 percent.
Contractually agreed fringe benefitsAs contractually agreed fringe benefits members of the Executive Board are entitled to a company car with a driver for business and personal use, telecommunications media for business and private use, appropriate accident insurance, legal expenses insurance for traffic and criminal defense cases and an annual medical check-up. Executive Board members may receive a rent subsidy if performance of their duties requires them to rent a second apartment. Further, a third-party financial loss insurance policy is provided for the members of the Executive Board. In the event of a claim, this provides for a deductible of ten percent of the damage, up to one-and-a-half times the individual member’s fixed annual remuneration. In some cases, the third-party financial loss insurance does not yet include a deductible. This is in accordance with the transition provision for “existing contracts” set out in Section 23 Paragraph 1 of the Introductory Act to the German Stock Corporation Act.
Pension entitlementsThe members of the Executive Board are entitled to receive pension payments after they leave the company in the following cases: If they leave the Executive Board on or after the date on which they reach the standard retirement age of 60, if they retire due to inability to work or—based on historical agreements—if their contract is terminated early or not renewed by the company with-out cause.
For some members of the Executive Board, company pension entitlements are calculated as a percentage of their base salary. The percentage depends on their years of service with the company. The pension commitments provide for lifelong retirement and surviving dependents’ benefits. A new defined-contribution pension plan applies for the members appointed to the Executive Board in 2011. This is a capital-based system funded by provisions. The company credits a fixed annual amount to their pension account. This comprises 15 percent of their target remuneration, i. e. base salary and 100 percent of the target bonus payment. The guaranteed annual return is 5 percent. The pension benefit comprises the amount that has accrued on the account, i.e. contributions credited to the account plus accumulated interest. In the event of death or disability, the amount that would be available on the account on the member’s 55th birthday, including projected

Annual Report 2011 Evonik Industries190
contributions and interest, is calculated. Payment options comprise either a lifelong pension or a combination of installment payments and a lump-sum payment. Pension entitlements previously accrued in the system are integrated. If the contract with the Executive Board member is terminated prematurely, no further contributions are paid into the account, but interest is accrued until benefits are drawn.
Cap on termination benefits in the event of premature termination of term of officeFor all members of the Executive Board there is a cap on termination benefits. If a member’s term of office is terminated without cause, payments, including fringe benefits, may not exceed two years’ remuneration. Moreover, periods beyond the remaining term of the contract are not covered. The cap is calculated from total remuneration (base salary including variable components).
Change-of-control clauseChange-of-control clauses are only agreed with members of the Executive Board in connection with long-term remuneration. A change of control is defined as cases when another company obtains control of Evonik Industries AG as defined in the German Securities Acquisition and Takeover Act (WpÜG) or there is a material change in the company’s shareholders as a result of a merger or comparable reorganization or planned business combination. In such cases, the long-term remuneration due to the eligible Executive Board members is calculated immediately and paid into their salary account with their next regular salary payment.
Remuneration of the Executive Board in fiscal 2011
Remuneration
in € thousand 2011 2010
Short-term remuneration1) 11,141 8,321
Current service cost for pension and other post-employment benefits2) 1,192 773
Termination benefits 2,181 −
Long-term performance-related remuneration (LTI Plans)3) − −
1) These comprise performance-unrelated and short-term performance-related salary components, including remuneration for the performance of specific governance duties and provisions.
2) The present value of the defined benefit obligations for the Executive Board is €16,245 thousand (2010: €12,372 thousand).3) Amounts disbursed.
Remuneration paid to the members of the Executive Board for their work in 2011 amounted to €10,523,444.57 (2010: €8,032,275.06). In 2011 provisions for bonus payments for Executive Board members for the previous year amounting to €112,000.00 were utilized.
Total remuneration for former members of the Executive Board was €945,962.76 in 2011 (2010: €5,500,662.00).
As of the reporting date €23,275,580.00 (2010: €18,613,086.00) was allocated to provisions for pension obligations to former members of the Executive Board.

191Management report Consolidated financial statements Supplementary information
Joint report of the Executive Board and Supervisory Board of Evonik Industries AG on Corporate Governance
Remuneration of the Supervisory BoardIn accordance with a provision contained in the Articles of Incorporation of Evonik Industries AG, the remuneration of the Supervisory Board is set annually by the Shareholders’ Meeting.
The remuneration system takes account of the responsibilities and scope of activities of the members of the Supervisory Board and the company’s performance. In addition to reimbursement of their expenses and value-added tax payable on their remuneration and expenses, the members of the Supervisory Board receive a fixed annual payment and a variable performance-related annual payment. Payment of the performance-related component is dependent on attainment of an earnings target, which is set annually by the Shareholders’ Meeting.
The members of the Supervisory Board receive a fixed annual payment. The Chairman receives one-and-a-half times this base amount and the Deputy Chairman receives one-and-a-quarter times the base amount. The fixed remuneration is also increased to reflect membership of the Audit Committee, Finance and Investment Committee, Mediation Committee and the Nomination Committee and for the chairperson of each committee. In addition, all members of the Executive Committee of the Supervisory Board receive additional fixed remuneration. Further, members of the Supervisory Board receive an allowance for each meeting of the Supervisory Board and its committees that they attend.
Members who only serve on the Supervisory Board for part of a fiscal year receive one-twelfth of the annual remuneration for each month or part-month in which they are members. This also applies for increases in the remuneration for the Chairman and Deputy Chairman of the Supervisory Board and any increases paid for membership or chairing a committee.
Finally, third-party financial loss insurance cover is provided for each member of Supervisory Board to cover their statutory liability arising from their work on the Supervisory Board. This originally provided for a deductible of €25,000 per insured event. In the light of Section 3.8 Paragraph 3 of the German Corporate Governance Code, following a resolution by the Share holders’ Meeting, effective October 1, 2011 the deductible for each member of the Supervisory Board was altered to 10 percent of the damage up to one-and-a-half times their fixed annual remuneration as a member of the Supervisory Board.
Allowances for attending meetings of the Supervisory Board and its committees are due after the end of the Shareholders’ Meeting that accepts the consolidated financial statements used as a basis for calculating the variable remuneration components. Accordingly, the remuneration for 2011 will be paid after the Annual Shareholders’ Meeting on March 20, 2012. Assuming that the Shareholders’ Meeting ratifies the actions of the Supervisory Board, the total remuneration of the Supervisory Board of Evonik Industries AG, including allowances for attending meetings, will be €2,198,666.66 for 2011 (2010: €2,126,000.00).
Annual Report 2011 Evonik Industries192
Further information on corporate officersSupervisory Board of Evonik Industries AGWilhelm Bonse-Geuking, EssenChairmanChairman of the Executive Board of RAG-Stiftunga) BP Europa SE (Chair)
RAG Aktiengesellschaft (Chair) RAG Deutsche Steinkohle AG (Chair)
b) HDI-Gerling AG COMMERZBANK AG
Werner Bischoff, MonheimDeputy ChairmanFormer member of the National Executive of the Mining, Chemical and Energy Industrial Union (IG BCE)a) Continental AG
RWE AG RWE Dea AG RWE Power AG
b) THS GmbH (Chair)
Günter Adam, FreigerichtDeputy Chairman of the Central Works Council of Evonik Industries AG
Dr. Peter Bettermann, WeinheimSpokesman for the management of Freudenberg & Co. KGa) BATIG Gesellschaft für Beteiligungen GmbH (Chair)
British American Tobacco (Germany) GmbH (Chair) British American Tobacco (Industries) GmbH
b) Wilh. Werhahn KG
Dr. Hans Michael Gaul, Düsseldorfa) BDO AG
EWE Aktiengesellschaft HSBC Trinkaus & Burkhardt AG Siemens AG VNG-Verbundnetz Gas AG

193Management report Consolidated financial statements Supplementary information
Further information on corporate officers
Stephan Gemkow, OverathMember of the Management Board of Deutsche Lufthansa AGa) Delvag Luftfahrtversicherungs-AG (Chair)
LSG Lufthansa Service Holding AG (Chair) Lufthansa AirPlus Servicekarten GmbH (Chair) Lufthansa Cargo AG (Chair) Lufthansa Systems AG (Chair) Lufthansa Technik AG (Chair)
b) Amadeus IT Group S. A. Amadeus IT Holding S. A. JetBlue Airways Corporation
Ralf Giesen, HanoverSecretary to the Board of the Mining, Chemical and Energy Industrial Union (IG BCE)a) Altana AG
Ralf Hermann, HertenChairman of the Central Works Council of Evonik Industries AGb) RAG-Stiftung
Prof. Wolfgang A. Herrmann, FreisingPresident of Munich Technical Universitya) E.ON Bayern AGb) Bayerische Forschungsallianz GmbH
Dieter Kleren, Wesselingfrom August 1, 2011Chairman of the Works Council for the Wesseling facilities
Steve Koltes, St. Moritz (Switzerland)Managing Director of CVC Capital Partners Luxembourg S.à r.l.b) Elster Group S.à r.l.
Flint Group Holdings S.à r.l. Flint Group Investments S.à r.l. Flint Group S.à r.l.
Rainer Kumlehn, HochheimFormer District Secretary of the Hesse-Thuringia Section of the Mining, Chemical and Energy Industrial Union (IG BCE) a) Goodyear Dunlop Tires Germany GmbH
Hoechst GmbH
Dr. Siegfried Luther, GüterslohFormer CFO of Bertelsmann AGa) Schaeffler AG
Sparkasse Güterslohb) RTL Group S. A. (Chair)
a) Membership of other statutory supervisory boards.b) Membership of comparable German and foreign supervisory bodies of business enterprises.

Annual Report 2011 Evonik Industries194
Jürgen Nöding, DuisburgChairman of the Central Works Council of Evonik Services GmbHa) Evonik Services GmbH
Norbert Pohlmann, Essenfrom August 1, 2011Chairman of the Works Council for the Goldschmidtstraße facilitiesb) BKK Novitas
Dr. Wilfried Robers, GescherChairman of the General Senior Staff Committee of Evonik Industries AGb) Pensionskasse Degussa VVaG
Christian Strenger, Frankfurt am MainFormer spokesperson for the management of DWS Investment GmbHa) DWS Investment GmbH
Fraport AG TUI AG
b) The Germany Funds (Chair)
Ulrich Terbrack, Reinheimfrom March 12, 2011Deputy Chairman of the Central Works Council of Evonik Industries AG
Dr. Volker Trautz, MunichFormer Chairman of the Management Board of LyondellBasell Holdings B.V.a) Citigroup Global Markets Deutschland AGb) CERONA Companhia de Energia Renovável
La Seda de Barcelona OSF Merchant Banking
Dr. Christian Wildmoser, Savigny (Switzerland)Managing Director of CVC Capital Partners Switzerland GmbHb) Flint Group Holdings S.à r.l.
Flint Group Investments S.à r.l. Flint Group S.à r.l.
The following gentlemen left the Supervisory Board in 2011Horst Rohde, Dattelnuntil March 2, 2011
Konrad Oelze, Essenuntil July 31, 2011
Rainer Schankweiler, Essenuntil July 31, 2011

195Management report Consolidated financial statements Supplementary information
Further information on corporate officers
Executive Board of Evonik Industries AGDr. Klaus Engel, Mülheim an der RuhrChairmana) STEAG GmbHb) Evonik Wohnen GmbH1)
Vivawest GmbH2)
Dr. Wolfgang Colberg, Ratingena) Evonik Services GmbH (Chair)
STEAG GmbHb) Evonik Wohnen GmbH1)
Pernod Ricard SA THS GmbH Vivawest GmbH2)
Dr. Thomas Haeberle, Einhausenfrom April 1, 2011a) Evonik Services GmbH
Thomas Wessel, Hertenfrom September 1, 2011a) Evonik Services GmbH
Industriepark Wolfgang GmbH (Chair) Infracor GmbH (Chair)
b) Gesellschaft zur Sicherung von Bergmannswohnungen mbH Evonik Wohnen GmbH1) (Chair)THS GmbH Vivawest GmbH2) (Chair)
Patrik Wohlhauser, Kelkheimfrom April 1, 2011
Dr. Dahai Yu, Shanghaifrom April 1, 2011
The following gentleman left the Executive Board in 2011Ralf Blauth, Marluntil August 31, 2011
a) Membership of other statutory supervisory boards.b) Membership of comparable German and foreign supervisory bodies of business enterprises.1) Supervisory Board disbanded as of December 31, 2011.2) Traded as Evonik Immobilien GmbH until December 31, 2011.
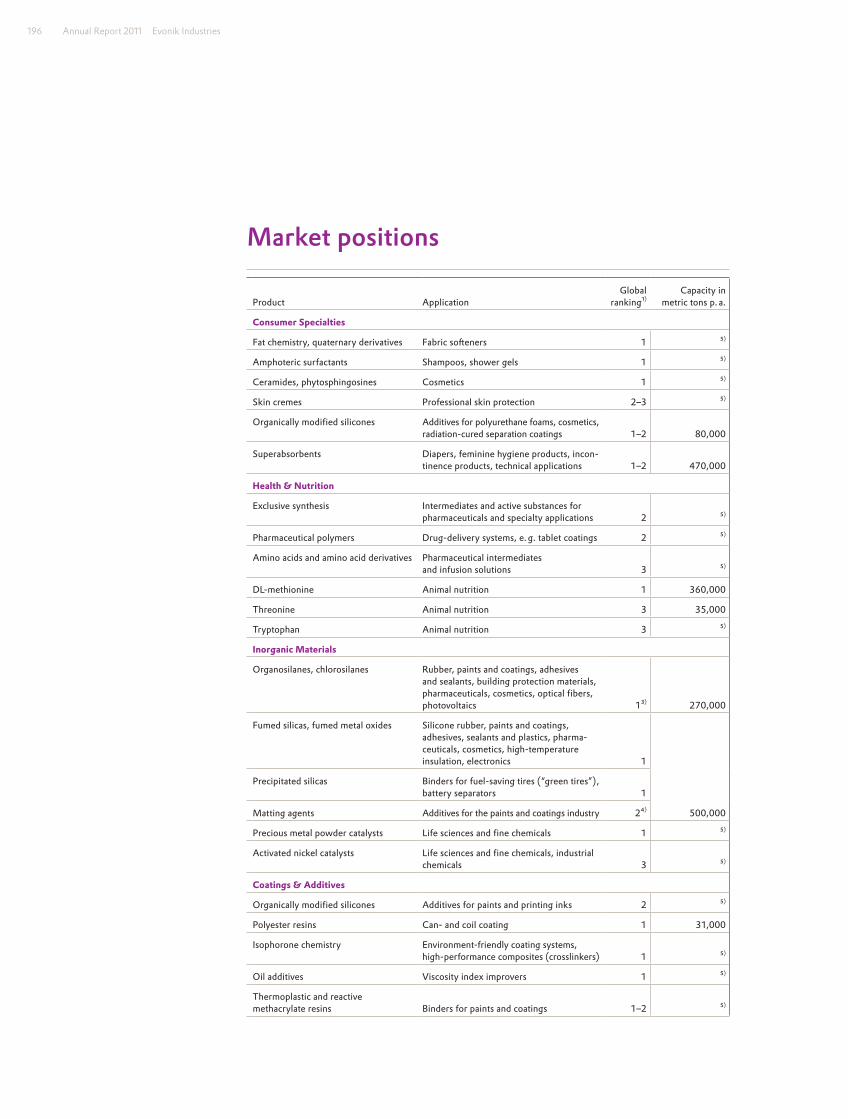
Annual Report 2011 Evonik Industries196
Market positions
Product ApplicationGlobal
ranking1)Capacity in
metric tons p. a.
Consumer Specialties
Fat chemistry, quaternary derivatives Fabric softeners 1 5)
Amphoteric surfactants Shampoos, shower gels 1 5)
Ceramides, phytosphingosines Cosmetics 1 5)
Skin cremes Professional skin protection 2–3 5)
Organically modified silicones Additives for polyurethane foams, cosmetics, radiation-cured separation coatings 1–2 80,000
Superabsorbents Diapers, feminine hygiene products, incon-tinence products, technical applications 1–2 470,000
Health & Nutrition
Exclusive synthesis Intermediates and active substances for pharmaceuticals and specialty applications 2 5)
Pharmaceutical polymers Drug-delivery systems, e. g. tablet coatings 2 5)
Amino acids and amino acid derivatives Pharmaceutical intermediates and infusion solutions 3 5)
DL-methionine Animal nutrition 1 360,000
Threonine Animal nutrition 3 35,000
Tryptophan Animal nutrition 3 5)
Inorganic Materials
Organosilanes, chlorosilanes Rubber, paints and coatings, adhesives and sealants, building protection materials, pharmaceuticals, cosmetics, optical fibers, photovoltaics 13) 270,000
Fumed silicas, fumed metal oxides Silicone rubber, paints and coatings, adhesives, sealants and plastics, pharma-ceuticals, cosmetics, high-temperature insulation, electronics 1
500,000
Precipitated silicas Binders for fuel-saving tires (“green tires”), battery separators 1
Matting agents Additives for the paints and coatings industry 24)
Precious metal powder catalysts Life sciences and fine chemicals 1 5)
Activated nickel catalysts Life sciences and fine chemicals, industrial chemicals 3 5)
Coatings & Additives
Organically modified silicones Additives for paints and printing inks 2 5)
Polyester resins Can- and coil coating 1 31,000
Isophorone chemistry Environment-friendly coating systems, high-performance composites (crosslinkers) 1 5)
Oil additives Viscosity index improvers 1 5)
Thermoplastic and reactive methacrylate resins Binders for paints and coatings 1–2 5)

197Management report Consolidated financial statements Supplementary information
Market positions
Product ApplicationGlobal
ranking1)Capacity in
metric tons p. a.
Performance Polymers
Polyamide 12 High-performance specialty polymer applications (e.g. automotive, medical, sport, gas and offshore pipelines) 1 5)
Methacrylate monomers Dispersions, coatings, plastics, additives, adhesives, optical lenses 1–2 5)
Methacrylate polymers (PMMA molding compounds and PMMA semi-finished products)
Construction materials for the automotive and electrical/electronics industries, specialty medical technology, architecture, design and communications applications 1–2 390,000
PEEK Special applications in the oil and gas, automotive and aviation industries, electronics/semiconductors, specialty medical technology (e. g. implants) 2 500
Advanced Intermediates
Alcoholates Catalysts for biodiesel, pharmaceuticals, agrochemicals and other applications 1 >200,000
Cyanuric chloride Crop protection and industrial applications (e. g. optical brighteners) 1 115,000
Hydrogen peroxide Bleaching of pulp and textiles, oxidation agent for the chemical industry, starting product for polyurethane 2 650,000
Butene-1 Co-monomer for polyolefins 12) 235,000
Isononanol High-molecular plasticizers 2 340,000
DINP High-molecular plasticizers 2 220,000
1) Evonik’s assessment based on various individual market reports/information and in-house market research.2) Freely traded volumes.3) Chlorosilanes: freely traded volumes. Overall assessment—market position differs depending on application.4) Ranked second by volume and first by sales.5) No data available.

Annual Report 2011 Evonik Industries198
GlossaryTechnical termsAmino acidsAmino acids (e.g. methionine, lysine) are building blocks for proteins. They are used in animal nutrition and medical treatment (e.g. in infusion solutions and as starting products for medicines). Evonik is the only company in the world that offers all four major essential amino acids for animal nutrition, i.e. MetAMINO (DL-methionine), ThreAMINO (L-threonine), TrypAMINO (L-tryptophan) and Biolys (L-lysine).
BiodieselBiodiesel is produced from renewable raw materials. In many countries, it is already mandatory to add a proportion of biodiesel to mineral diesel fuel. Higher percentages are expected to improve climate protection and reduce dependence on imports. Evonik produces alcoholates which are used as catalysts for efficient high-yield production of biodiesel. Using Evonik’s catalysts, biodiesel can be manufactured in a process that does not require water. That prevents contamination of the products, thus facilitating separation and processing.
cGMPAbbreviation for current good manufacturing practices. It refers to guidelines that assure the quality of processes and facilities used to produce active ingredients, medicines, food and animal feeds.
FermentationFrom the Latin: fermentare. The conversion of substances with the aid of microorganisms is referred to as fermentation. Fermentation has traditionally been used to produce dairy products, wine, beer and bread. Fermentation processes allow cost-effective production of vitamins, enzymes and amino acids.
HPAPIAbbreviation for highly potent active pharmaceutical ingredient, i.e. the component that is responsible for the active functioning of a medicine.
Integrated technology platforms Integrated technology platforms allow efficient use of product streams and thus high added value by utilizing by-products from one production process as starting products for others. That saves resources, reduces CO2 emissions and leverages cost-efficiency. Examples of integrated technology platforms in the Evonik Group are isophorone and silicon.

199Management report Consolidated financial statements Supplementary information
Glossary
Isophorone/isophorone diamineIsophorone is used as a solvent in the coatings, colorants and adhesives industries. It is also used to produce isophorone diamine, which is mainly used as a curing agent for epoxy resin systems for industrial floor coatings and composites.
MonomersMonomers are low-molecular-weight molecules of similar structure that can react with each other to form polymers.
PEEKPolyetherether ketones (PEEK) are partially crystalline high-performance polymers with outstanding mechanical properties and very good temperature resistance. In view of their exceptionally high mechanical, thermal and chemical properties, they are mainly used in functional components and assemblies in automotive engineering, aviation, electronics and medical appliances.
PMMAAbbreviation for polymethylmethacrylate. This is a colorless polymer (acrylic glass) that can be colored in a range of shades. Properties: high light transmittance, good moldability, exceptionally high weather resistance. Applications: automotive and aviation engineering, architecture, lighting, design, electronics and communications technology. Best-known brand: PLEXIGLAS. Form supplied: thermoplastic molding compounds, cast or extruded semi-finished goods (sheet, film, tubes, rods).
Polymers/oligomersLong-chain, short-chain or crosslinked molecules (macromolecules) produced from smaller molecules (monomers).
Polyurethane (PUR)Polymers with excellent thermal and sound insulating properties at a very broad spectrum of applications. Flexible, foamed PUR is used for cushions, mattresses and interior trims. Rigid PUR is used in automotive engineering, construction and furniture.
Silanes The term silanes refers to a group of chemical compounds comprising silicon and hydrogen. Silanes are used to produce ultrapure silicon for integrated circuits and solar panels. Fumed silicas can be produced from chlorosilanes and chloroalkylsilanes. Special silanes known as functional organosilanes are used to functionalize surfaces, for example, to protect surfaces in the construction sector.

Annual Report 2011 Evonik Industries200
Silicas Evonik produces both precipitated silicas using a wet route and fumed silicas, produced by combustion. ULTRASIL precipitated silica is used, for example, in the latest generation of tires with low rolling resistance. Applications for AEROSIL fumed silica include cosmetics and the electronics industry.
SuperabsorbentsCrosslinked polymers that are insoluble in water and can absorb and store large quantities of aqueous liquid through a mechanism that causes them to swell and form hydrogen gels. The liquid is not released even under pressure. Consequently, these polymers are mainly used in diapers. Special forms of superabsorbent are used in agriculture to regulate the moisture in soil. As well as absorbing large quantities of water, they can release them to the plants during dry periods.
World-scale facilityA large-scale production facility. World-scale facilities are often more economical because fixed costs per metric ton decline as output increases.
Financial and economic termsComplianceCompliance refers to the observance of rules, for example, the applicable statutory provisions, in-house regulations and voluntary commitments entered into by Evonik.
Corporate governanceCorporate governance comprises all principles underlying the management and supervision of a company. As an expression of good and responsible management of the company, it is therefore a central element in a company’s management philosophy. Corporate governance relates, in particular, to collaboration within the Executive Board and Supervisory Board and between the boards and the company’s owners. It also refers to the relationship between our company and other people and organizations with which we have a business relationship.
CTAAbbreviation for contractual trust arrangement. This is a model used by Evonik to transfer some of its pension obligations to a trust established especially for this purpose: Evonik Pensionstreuhand e. V., Essen (Germany). The assets transferred to this trust secure employees’ pensions.
EBIT (Earnings before interest and taxes)An earnings parameter showing the operating performance of an enterprise irrespective of the structure of its assets.
201Management report Consolidated financial statements Supplementary information
Glossary
EBITDA (Earnings before interest, taxes, depreciation and amortization)An earnings parameter showing the operating earnings performance of an enterprise irrespective of the structure of its assets and its investment profile. EBITDA is a cash flow-related parameter. The EBITDA margin, which shows the relationship between EBITDA and sales is used as a basis for in comparison with competitors.
EVAAbbreviation for economic value added. This is the main indicator used for value-oriented management of the Evonik Group. EVA is calculated from the difference between EBIT and the cost of capital employed. If EVA is positive, value is created.
GPSGPS stands for Global Product Strategy, an initiative of the International Council of Chemical Associations (ICCA). The objective of GPS is to improve and harmonize standards of product responsibility in the global chemical industry. A central focus is providing transparent information on safe handling and use of chemical substances.
Hedge accountingThis refers to accounting for hedging transactions and the associated hedged items as a single valuation unit. The purpose of hedge accounting is to synchronize the otherwise different periods in which the hedged item and hedge impact on earnings.
HedgingHedging is the strategy used offset the exposure of business transactions to risks such as changes in exchange rates, interest rates and raw material prices. The company enters into an additional transaction whose profile is exactly opposite to the profile of the hedged transaction. Derivative financial instruments such as forward contracts, swaps and options are used as hedging tools.
ICCAInternational Council of Chemical Associations.
IFRSInternational Financial Reporting Standards. Since 2005 companies listed on stock exchanges in the European Union have been required to prepare consolidated financial statements in accordance with IFRS.
Non-operating resultThe non-operating result comprises items that are outside of normal operations, relate to other reporting periods or are classified as exceptional. They are infrequent or one-off events, for example, income and expenses relating to the acquisition and divestment of business operations, impairment losses/reversals of impairment losses and restructuring expenses.

Annual Report 2011 Evonik Industries202
OECDOrganisation for Economic Co-operation and Development
RatingIn the financial community, a rating is an assessment of the creditworthiness of a debtor. Ratings are generally awarded by specialized rating agenices. The probability of default is calculated on the basis of specific criteria and debtors are assigned to rating classes that are indicated by rating codes. Ratings are also awarded for corporate and government bonds. A rating indirectly affects the debtor’s business activity. Normally a better rating enables a debtor to obtain favorable terms for borrowing.
ROCEThe return on capital employed is a measure of the profitability of capital employed. It is calculated by dividing EBIT by the average capital employed in the reporting period.
StakeholdersIn a corporate context, the term stakeholders refers to all natural or legal persons with an interest in the development of enterprise. Stakeholders range from owners and employees through customers and suppliers to the state and general public.
Swaps, currency swaps and interest swapsDerivative financial instruments used to hedge currency or interest rate risks by swapping cash flows. Currency swaps entail swapping payments in different currencies, while interest swaps comprise swapping fixed interest rates are variable rates.
VolatilityVolatility is a measure of the fluctuation in the price of traded goods, e.g. shares, currencies, interest rates, in a given period. It expresses the standard deviation of relative changes in prices over a given period (e.g. a year). The term is often used to denote the fluctuation in prices or interest rates on entire markets.

203Management report Consolidated financial statements Supplementary information
Glossary

Annual Report 2011 Evonik Industries204
Credits
Published by Evonik Industries AGRellinghauser Straße 1 – 1145128 EssenGermanywww. evonik.com
ContactCommunications/Board Officephone +49 201 177-3899fax +49 201 [email protected] Relationsphone +49 201 177-3147fax +49 201 177-3148investor-relations@ evonik.com
Concept, layout, typesetting and productionXEO – Energy for Brands, Düsseldorf (Germany)
PhotographsDirk BannertAdrian Bedoy Karsten BootmannFrank ElschnerBenno KraehahnCarsten PaulFrank PreußFraunhofer IWESGetty ImagesistockphotoLudovic/REA/laif Picture Alliance/dpa
PrintingWAZ-Druck GmbH & Co. KG, Duisburg (Germany)
Evonik Industries is a worldwide manufacturer of PMMA products sold under the PLEXIGLAS trademark on the European, Asian, African and Australian continents and under the trademark ACRYLITE in the Americas.

1
Company report
AnnuAl RepoRt 2011
Success means responsibilityHow we meet our responsibility as a global player in a growing world
Evonik Industries AG Rellinghauser Straße 1–1145128 EssenGermany www. evonik.com
Annu
Al R
epoR
t 20
11