london.ca/budget...$15.00/hour effective january 1, 2019 (7.1% increase). on december 12, 2017,...
TRANSCRIPT

london.ca/budget
6 MULTI-YEARBUDGET2019 ANNUAL UPDATE
I N V E S T I N G I N O U R F U T U R E
FOR THE DRAFT2019 Budget Amendment Cases
December 17, 2018

Table of Contents 2016-2019 Multi-Year Budget - 2019 Annual Budget Update Amendment Cases
Operating Budget Amendments Revenue Driver 1 – Recommended Adjustments to Achieve Council Direction to Reduce the 2019 Tax Levy Increase to 2.9% ........................ 1 Changed Regulation 2 – Cancellation of Planned 2019 Minimum Wage Increase ...................................................................................................... 8 Confidential Matter – “In-Camera” 3 – Confidential Matter – “In-Camera” ..................................................................................................................................... 11 Changed Regulation 4 – Bicycle Lane Maintenance ................................................................................................................................................. 13 Cost Driver 5 – Additional Land Ambulance Resources to Address Service Pressures .............................................................................. 15 6 – London Police Service – Safeguard Program .................................................................................................................... 19 For Consideration – New Council Direction 7 – London Children’s Museum Funding Request ................................................................................................................... 22 Capital Budget Amendments Lifecycle Renewal 8 – London Convention Centre - Realign 10 Year Capital Plan ............................................................................................... 32 9 – Covent Garden Market Garage Painting ............................................................................................................................ 35 Growth 10 – Masonville Transit Village Secondary Plan ........................................................................................................................ 37 11 – Project Estimate Updates - Growth Transportation Capital Projects .................................................................................. 40 12 – Realignment of Growth Transportation Capital Projects .................................................................................................... 47

STRATEGIC AREA OF FOCUS: LEADING IN PUBLIC SERVICE
INITIATIVE: RECOMMENDED ADJUSTMENTS TO ACHIEVE COUNCIL DIRECTION TO REDUCE THE 2019 TAX LEVY INCREASE TO 2.9%
SERVICE(S): BY-LAW ENFORCEMENT, PARKING, GARBAGE DISPOSAL, LICENSING, TAXATION AND DEVELOPMENT SERVICES
SERVICE LEAD(S): GEORGE KOTSIFAS, MANAGING DIRECTOR, DEVELOPMENT & COMPLIANCE SERVICES AND CHIEF BUILDING OFFICIAL
KELLY SCHERR, MANAGING DIRECTOR, ENVIRONMENTAL & ENGINEERING SERVICES AND CITY ENGINEER
BARRY CARD, MANAGING DIRECTOR, LEGAL AND CORPORATE SERVICES AND CITY SOLICITOR
ANNA LISA BARBON, MANAGING DIRECTOR, CORPORATE SERVICES AND CITY TREASURER, CHIEF FINANCIAL OFFICER
TYPE OF AMENDMENT: REVENUE DRIVER
Budget Amendment Tax Levy Impact ($000’s)
2016 2017 2018 2019 2016-2019 TOTAL
Expenditure $0 $0 $0 $0 $0 Revenue $0 $0 $0 ($1,072) ($1,072) Net Requested Tax Levy (Cumulative) $0 $0 $0 ($1,072) ($1,072)
Net Incremental Tax Levy $0 $0 $0 ($1,072) ($1,072) Annual Tax Levy Impact % 1 0.0% 0.0% 0.0% (0.18)%
Note 1: The tax levy impact is calculated using the approved budget.
AMENDMENT FORM – CASE # 1
Page 1

AMENDMENT 1: TIPPING FEE REVENUE INCREASE
Operating Budget Table ($000’s)
Garbage Collection & Disposal 2016 2017 2018 2019 2020-2025 Net Net Net Expenditure Net Expenditure Net
Approved Budget 12,530 12,735 13,055 16,982 13,381 101,892 80,286 Cumulative Amendment 0 (400) 0 (2,400)
Revised Budget 16,982 12,981 101,892 77,886
Tax Levy Per Cent Impact Table
Tax Levy Impact (Incremental Changes)
2016 2017 2018 2019 2016-2019 Average
Operating Impact 0.0% 0.0% 0.0% (0.07)% (0.02)%
Staffing Table Staffing Summary
(Cumulative Changes) 2019
# of Full-Time Employees Impacted 0 # of Full-Time Equivalents Impacted 0.0 Full-Time Equivalents Cost ($000’s) $0
What is the reason(s) for the budget amendment(s)? As part of the 2018 service review process, a three year analysis of tipping fees across a range of customers was performed. Given the experience over this period, the tipping fee revenue budget can be increased by $400 thousand in order to right-size the budget to reflect current trends.
Page 2

AMENDMENT 2: LICENSING/CEREMONY REVENUE INCREASE
Operating Budget Table ($000’s)
Public Support Services - Licensing & Certificates
2016 2017 2018 2019 2020-2025 Net Net Net Expenditure Net Expenditure Net
Approved Budget (320) (311) (304) 508 (308) 3,048 (1,848) Cumulative Amendment 0 (10) 0 (60)
Revised Budget 508 (318) 3,048 (1,908)
Tax Levy Per Cent Impact Table
Tax Levy Impact (Incremental Changes)
2016 2017 2018 2019 2016-2019 Average
Operating Impact 0.0% 0.0% 0.0% (0.01)% 0.0%
Staffing Table Staffing Summary
(Cumulative Changes) 2019
# of Full-Time Employees Impacted 0 # of Full-Time Equivalents Impacted 0.0 Full-Time Equivalents Cost ($000’s) $0
What is the reason(s) for the budget amendment(s)? As part of the 2018 service review process, a zero-based review was performed on the licensing and ceremonies revenue categories. Based on the review and past experience, the revenue budget can be increased by $10 thousand in order to right-size the budget to reflect current trends; $5 thousand in each marriage licenses and ceremony fees.
Page 3

AMENDMENT 3: TAXATION REVENUE INCREASE
Operating Budget Table ($000’s)
Taxation 2016 2017 2018 2019 2020-2025 Net Net Net Expenditure Net Expenditure Net
Approved Budget 661 677 710 2,119 686 12,714 4,116 Cumulative Amendment 0 (200) 0 (1,200)
Revised Budget 2,119 486 12,714 2,916
Tax Levy Per Cent Impact Table
Tax Levy Impact (Incremental Changes)
2016 2017 2018 2019 2016-2019 Average
Operating Impact 0.0% 0.0% 0.0% (0.03)% (0.01)%
Staffing Table Staffing Summary
(Cumulative Changes) 2019
# of Full-Time Employees Impacted 0 # of Full-Time Equivalents Impacted 0.0 Full-Time Equivalents Cost ($000’s) $0
What is the reason(s) for the budget amendment(s)? As part of the 2018 service review process, a review of the various revenues in Taxation was performed. As a result of reviewing past revenue performance, the budget for fees charged for taxation related services can be increased by $200 thousand in order to right-size the budget to reflect current trends. These services include fees levied on issuing tax certificates, changes in ownership, new tax accounts and mortgage confirmations.
Page 4

AMENDMENT 4: PARKING & COURT FEES REVENUE INCREASE
Operating Budget Table ($000’s)
Parking 2016 2017 2018 2019 2020-2025 Net Net Net Expenditure Net Expenditure Net
Approved Budget (3,314) (3,237) (3,135) 2,864 (3,077) 17,184 (18,462) Cumulative Amendment 0 (325) 0 (1,950)
Revised Budget 2,864 (3,402) 17,184 (20,412)
Tax Levy Per Cent Impact Table
Tax Levy Impact (Incremental Changes)
2016 2017 2018 2019 2016-2019 Average
Operating Impact 0.0% 0.0% 0.0% (0.06)% (0.01)%
Staffing Table Staffing Summary
(Cumulative Changes) 2019
# of Full-Time Employees Impacted 0 # of Full-Time Equivalents Impacted 0.0 Full-Time Equivalents Cost ($000’s) $0
What is the reason(s) for the budget amendment(s)? As part of the 2018 service review process, a review of the parking revenue (fees and fines) suggests that revenue budgets can be increased by $325 thousand in order to right-size the budget to reflect current trends. Parking fines were increased in September 2016 and based on the experience in 2017, this revenue budget can be increased by $150 thousand. An additional $175 thousand increase is attributable to extra court fines/service charges levied by the Province.
Page 5

AMENDMENT 5: NEW BUSINESS LICENSING CATEGORIES
Operating Budget Table ($000’s)
By-Law Enforcement & Property Standards
2016 2017 2018 2019 2020-2025 Net Net Net Expenditure Net Expenditure Net
Approved Budget 1,239 1,314 1,411 3,708 1,360 22,248 8,160 Cumulative Amendment 0 (25) 0 (150)
Revised Budget 3,708 1,335 22,248 8,010
Tax Levy Per Cent Impact Table
Tax Levy Impact (Incremental Changes)
2016 2017 2018 2019 2016-2019 Average
Operating Impact 0.0% 0.0% 0.0% (0.01)% 0.0%
Staffing Table Staffing Summary
(Cumulative Changes) 2019
# of Full-Time Employees Impacted 0 # of Full-Time Equivalents Impacted 0.0 Full-Time Equivalents Cost ($000’s) $0
What is the reason(s) for the budget amendment(s)? On December 5, 2017, Council approved a new Business Licensing By-law that included a number of new business categories (e.g. payday loan lenders, donation bin operators) and a number of changes to existing regulations (e.g. adult entertainment, second-hand shops). The new and revised regulations were developed with consideration of public comments received from eight public participation meetings. As a result of the new business licensing by-law, new revenues will be realized, some of which will be partially offset with increased staffing (occurred in 2018) and other program expenditures.
Page 6
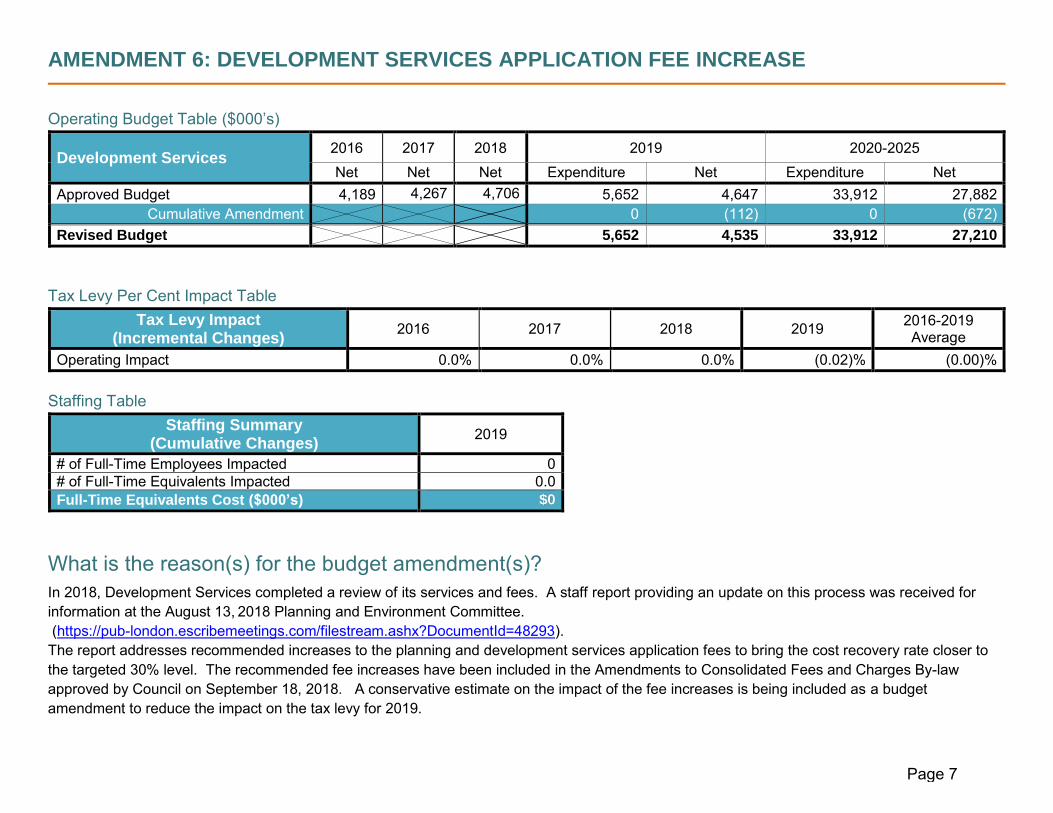
AMENDMENT 6: DEVELOPMENT SERVICES APPLICATION FEE INCREASE
Operating Budget Table ($000’s)
Development Services 2016 2017 2018 2019 2020-2025 Net Net Net Expenditure Net Expenditure Net
Approved Budget 4,189 4,267 4,706 5,652 4,647 33,912 27,882 Cumulative Amendment 0 (112) 0 (672)
Revised Budget 5,652 4,535 33,912 27,210
Tax Levy Per Cent Impact Table
Tax Levy Impact (Incremental Changes)
2016 2017 2018 2019 2016-2019 Average
Operating Impact 0.0% 0.0% 0.0% (0.02)% (0.00)%
Staffing Table Staffing Summary
(Cumulative Changes) 2019
# of Full-Time Employees Impacted 0 # of Full-Time Equivalents Impacted 0.0 Full-Time Equivalents Cost ($000’s) $0
What is the reason(s) for the budget amendment(s)? In 2018, Development Services completed a review of its services and fees. A staff report providing an update on this process was received for information at the August 13, 2018 Planning and Environment Committee. (https://pub-london.escribemeetings.com/filestream.ashx?DocumentId=48293). The report addresses recommended increases to the planning and development services application fees to bring the cost recovery rate closer to the targeted 30% level. The recommended fee increases have been included in the Amendments to Consolidated Fees and Charges By-law approved by Council on September 18, 2018. A conservative estimate on the impact of the fee increases is being included as a budget amendment to reduce the impact on the tax levy for 2019.
Page 7

STRATEGIC AREA OF FOCUS: LEADING IN PUBLIC SERVICE
INITIATIVE: CANCELLATION OF PLANNED 2019 MINIMUM WAGE INCREASE
SERVICE(S): VARIOUS
SERVICE LEAD(S): ANNA LISA BARBON, MANAGING DIRECTOR, CORPORATE SERVICES AND CITY TREASURER, CHIEF FINANCIAL OFFICER
TYPE OF AMENDMENT: CHANGED REGULATION
Budget Amendment Tax Levy Impact ($000’s)
2016 2017 2018 2019 2016-2019 TOTAL
Expenditure $0 $0 $0 ($573) ($573) Revenue $0 $0 $0 $52 $52 Net Requested Tax Levy (Cumulative) $0 $0 $0 ($521) ($521)
Net Incremental Tax Levy $0 $0 $0 ($521) ($521) Annual Tax Levy Impact % 1 0.0% 0.0% 0.0% (0.09)%
Note 1: The tax levy impact is calculated using the approved budget.
AMENDMENT FORM – CASE # 2
Page 8

AMENDMENT 1: CANCELLATION OF PLANNED 2019 MINIMUM WAGE INCREASE
Operating Budget Table ($000’s)
Reduction to Approved 2018 Budget Amendment #7
2016 2017 2018 2019 2020-2025 Net Net Net Expenditure Net Expenditure Net
Approved Budget 0 0 1,203 1,907 1,724 11,442 10,344 Cumulative Amendment (573) (521) (3,438) (3,126)
Revised Budget 1,334 1,203 8,004 7,218
Tax Levy Per Cent Impact Table
Tax Levy Impact (Incremental Changes)
2016 2017 2018 2019 2016-2019 Average
Operating Impact 0.0% 0.0% 0.0% (0.09)% (0.02)%
What is the reason(s) for the budget amendment(s)? On November 27, 2017 Bill 148, the Fair Workplaces, Better Jobs Act, 2017, received Royal Assent. Among the various changes to employment standards and labour laws included in this legislation was an increase in the minimum wage in Ontario to:
$14.00/hour effective January 1, 2018 (20.7% increase); and $15.00/hour effective January 1, 2019 (7.1% increase).
On December 12, 2017, Municipal Council approved the 2018 Annual Budget Update to the 2016-2019 Multi Year Budget. As part of the 2018 Budget Update, Budget Amendment #7 was approved to provide the required funding to support the planned increase in the minimum wage to $14.00/hour in 2018 and $15.00/hour in 2019.
On November 21, 2018, Bill 47, Making Ontario Open for Business Act, 2018, received Royal Assent. This legislation includes the cancellation of the planned increase in the minimum wage for 2019; instead the minimum wage will remain at $14.00/hour. This has the effect of reducing the 2019 budget requirement for the various services affected by the increase in minimum wage legislated by Bill 148. As a result, this budget amendment is proposed to eliminate the incremental funding for 2019 that was approved in 2018 Budget Amendment #7.
Page 9

The following table provides a further breakdown of the anticipated impact on the various services:
Forecasted Impact of Cancellation of 2019 Minimum Wage Increase
Gross
Expenditure
Impact
Offsetting
Factors (see
notes below)
Net Budget
Reduction
Civic Service Areas:
Aquatics (84,453) - (84,453)
Arenas (59,349) - (59,349)
Community Centres (72,136) - (72,136)
Community Development and Funding (645) - (645)
Community Recreation & Leisure Programming (89,156) - (89,156)
Golf 1 (36,390) 36,390 -
Special Events (5,952) - (5,952)
Sports Services (7,376) - (7,376)
Storybook Gardens (37,427) - (37,427)
Corporate Security & Emergency Management (18,000) - (18,000)
Street Lighting & Traffic Signals - School Crossing Guards (65,300) - (65,300)
Civic Service Areas Total (476,184) 36,390 (439,794)
Agencies, Boards and Commissions:
Kettle Creek Conservation Authority 2 (25,371) - (25,371)
London Public Library (52,000) - (52,000)
London Convention Centre (4,400) - (4,400)
Centennial Hall 3 (15,000) 15,000 -
Agencies, Boards & Commissions Total (96,771) 15,000 (81,771)
TOTAL (572,955) 51,390 (521,565)
Note 2 - London's share of the total KCCA municipal levy is approximately 57% based on the current apportionment of costs
among member municipalities. The figure presented represents London's share of the total estimated cost.
Note 3 - The minimum wage impacts on Centennial Hall were mitigated by adjusting user fee revenues.
2019
Note 1 - Consistent with the "golf pays for golf" strategy, the minimum wage impacts on Golf were mitigated by adjusting user
fee revenues.
Page 10

STRATEGIC AREA OF FOCUS: LEADING IN PUBLIC SERVICE
INITIATIVE: CONFIDENTIAL MATTER – “IN CAMERA”
SERVICE(S): FINANCIAL MANAGEMENT
SERVICE LEAD(S): ANNA LISA BARBON, MANAGING DIRECTOR, CORPORATE SERVICES AND CITY
TREASURER, CHIEF FINANCIAL OFFICER
TYPE OF AMENDMENT: CONFIDENTIAL MATTER – “IN-CAMERA”
Budget Amendment Tax Levy Impact ($000’s)
2016 2017 2018 2019 2016-2019 TOTAL
Expenditure $0 $0 $0 ($2,000) ($2,000) Revenue $0 $0 $0 $0 $0 Net Requested Tax Levy (Cumulative) $0 $0 $0 ($2,000) ($2,000)
Net Incremental Tax Levy $0 $0 $0 ($2,000) ($2,000) Annual Tax Levy Impact % 1 0.0% 0.0% 0.0% (0.35)%
Note 1: The tax levy impact is calculated using the approved budget.
AMENDMENT FORM – CASE # 3
Page 11

AMENDMENT 1: CONFIDENTIAL MATTER – “IN-CAMERA”
Operating Budget Table ($000’s)
Confidential Matter 2016 2017 2018 2019 2020-2025 Net Net Net Expenditure Net Expenditure Net
Approved Budget 0 0 1,455 2,485 2,485 14,910 14,910 Cumulative Amendment (2,000) (2,000) (12,000) (12,000)
Revised Budget 485 485 2,910 2,910
Tax Levy Per Cent Impact Table
Tax Levy Impact (Incremental Changes)
2016 2017 2018 2019 2016-2019 Average
Operating Impact 0.0% 0.0% 0.0% (0.35)% (0.09)%
Staffing Table Staffing Summary
(Cumulative Changes) 2019
# of Full-Time Employees Impacted 0 # of Full-Time Equivalents Impacted 0.0 Full-Time Equivalents Cost ($000’s) $0
What is the reason(s) for the budget amendment(s)? A matter pertaining to labour relations and employee negotiations, advice or recommendations of officers and employees of the Corporation including communications necessary for that purpose, and for the purpose of providing instructions and directions to officers and employees of the Corporation.
Page 12

STRATEGIC AREA OF FOCUS: BUILDING A SUSTAINABLE CITY
INITIATIVE: BICYCLE LANE MAINTENANCE
SERVICE(S): TRANSPORTATION SERVICES
SERVICE LEAD(S): KELLY SCHERR, MANAGING DIRECTOR, ENVIRONMENTAL & ENGINEERING SERVICES AND CITY ENGINEER
JOHN PARSONS, DIVISION MANAGER, TRANSPORTATION & ROADSIDE OPERATIONS
DOUG MACRAE, DIRECTOR, ROADS AND TRANSPORTATION
TYPE OF AMENDMENT: CHANGED REGULATION
Budget Amendment Tax Levy Impact ($000’s)
2016 2017 2018 2019 2016-2019 TOTAL
Expenditure $0 $0 $0 $408 $408 Revenue $0 $0 $0 $0 $0 Net Requested Tax Levy (Cumulative) $0 $0 $0 $408 $408
Net Incremental Tax Levy $0 $0 $0 $408 $408 Annual Tax Levy Impact % 1 0.0% 0.0% 0.0% 0.07%
Note 1: The tax levy impact is calculated using the approved budget.
AMENDMENT FORM – CASE # 4
Page 13

AMENDMENT 1: CHANGED REGULATION FOR CYCLING NETWORKS
Operating Budget Table ($000’s) Summer & Winter Maintenance for New Cycling Networks Standard
2016 2017 2018 2019 2020-2025
Net Net Net Expenditure Net Expenditure Net
Approved Budget 1) 1) 1 0 250 422 422 422 2,532 2,532 Cumulative Amendment 408 408 2,448 2,448
Revised Budget 830 830 4,980 4,980 (1) Approved budget includes funding in both Roadway and Winter Maintenance services. Tax Levy Per Cent Impact Table
Tax Levy Impact (Incremental Changes)
2016 2017 2018 2019 2016-2019 Average
Operating Impact 0.0% 0.0% 0.0% 0.07% 0.02%
What is the reason(s) for the budget amendment(s)? Ontario regulation 239/02, Minimum Maintenance Standards for Municipal Highways, was amended and enacted on May 3, 2018. The amendments included adding a standard for cycling networks. Bicycle lanes are defined as a portion of the roadway that has been designated by pavement markings or signage for the preferential or exclusive use of cyclists, or a portion of a roadway that has been designated for the exclusive use of cyclists by signage and a physical or marked buffer.
The increased winter maintenance cost for this service includes plowing and snow bank removal approximately five times per season in areas where snow storage is limited. Summer maintenance will include asphalt patching, crack sealing, sweeping, line marking and signing.
Total funding required to maintain this new standard in both summer and winter is $830 thousand based on the estimated cost per kilometer identified in the Cycling Master Plan. The existing approved budget already includes $422 thousand to maintain cycling networks, therefore an additional $408 thousand is required to maintain the new standard.
Pertinent Reports: August 13, 2018, Civic Works Committee
https://pub-london.escribemeetings.com/filestream.ashx?DocumentId=48766
Page 14

STRATEGIC AREA OF FOCUS: STRENGTHENING OUR COMMUNITY
INITIATIVE: ADDITIONAL LAND AMBULANCE RESOURCES TO ADDRESS SERVICE PRESSURES
SERVICE(S): LAND AMBULANCE
SERVICE LEAD(S): MIDDLESEX LONDON PARAMEDIC SERVICE
ANNA LISA BARBON, MANAGING DIRECTOR, CORPORATE SERVICES AND CITY TREASURER, CHIEF FINANCIAL OFFICER
TYPE OF AMENDMENT: COST DRIVER AND CHANGED REGULATION
Budget Amendment Tax Levy Impact ($000’s)
2016 2017 2018 2019 2016-2019 TOTAL
Expenditure $0 $0 $0 $1,476 $1,476 Revenue 1 $0 $0 $0 ($886) ($886) Net Requested Tax Levy (Cumulative) $0 $0 $0 $590 $590
Net Incremental Tax Levy $0 $0 $0 $590 $590 Annual Tax Levy Impact % 2 0.0% 0.0% 0.0% 0.10%
Note 1: The growth-related portion of this amendment is proposed to be funded through assessment growth funding in accordance with the City’s Assessment Growth Policy. Note 2: The tax levy impact is calculated using the approved budget.
AMENDMENT FORM – CASE # 5
Page 15

AMENDMENT 1: ADDITIONAL LAND AMBULANCE RESOURCES
Operating Budget Table ($000’s)
Land Ambulance* 2016 2017 2018 2019 2020-2025*** Net Net Net Expenditure Net Expenditure Net
Approved Budget 13,219 14,427 14,742 14,967 14,967 89,802 89,802 Cumulative Amendment 1,476 590** 8,856 3,540
Revised Budget 16,443 15,557 98,658 93,342
* All figures represent London’s share of the net Middlesex London Paramedic Service Budget based on the cost apportionment agreement between the City and the County. ** Approximately 60% of the 2019 budget increase is directly attributable to call volume growth particularly in the City of London. It is proposed that the growth-related portion of the budget increase be funded through assessment growth funding in accordance with the City’s Assessment Growth Policy, with the balance funded through incremental tax levy. *** 2020-2025 forecasts exclude any potential provincial funding increases. Tax Levy Per Cent Impact Table
Tax Levy Impact (Incremental Changes)
2016 2017 2018 2019 2016-2019 Average
Operating Impact 0.0% 0.0% 0.0% 0.10% 0.03%
Staffing Table Staffing Summary
(Cumulative Changes) 2019
# of Full-Time Employees Impacted 8 # of Full-Time Equivalents Impacted 8.25 Full-Time Equivalents Cost ($000’s) $551*
* London’s share of the total cost of the additional staff based on the approved cost apportionment agreement between the City and the County (currently approx. 83.5%).
Page 16

Key Performance Indicator(s) Table Metrics
(Cumulative Changes) 2016 2017 2018* 2019*
Calls within City of London 69,643 75,097 80,977 87,318 Total Patient Calls within Middlesex-London 79,940 86,153 92,847 100,061
* Projections assume continued call volume growth consistent with 2017 growth rate. Original estimates included in the 2016 – 2019 Multi-Year Budget allowed for call volume growth of 3.3% per year.
What is the reason(s) for the budget amendment(s)? The County of Middlesex is accountable to the Province for the provision of Land Ambulance services for the County of Middlesex including the City of London. A cost sharing agreement is in place between the City and the County which governs the apportionment of costs. The information for this budget amendment has been provided by the Middlesex London Paramedic Service (MLPS) and County of Middlesex in its capacity as service manager for Land Ambulance services.
This budget amendment is driven by the steady increase in paramedic call volume, primarily within the City of London, as well as further investments required to mitigate organizational risk and meet changing Ministry of Health standards and requirements. MLPS responded to over 86,000 total calls in 2017, a significant increase in call volume over the prior year. The steady rise in call volume has continued into 2018 with demand for paramedic service expected to remain at higher than originally predicted levels. The pressures to various operating budget lines are further compounded by off-load delays at both Victoria and University hospitals. The significant increase in call volume has resulted in shift overruns as well as increased labour relations related costs. There are situations where, due to demand, ambulances must leave their Middlesex County locations to respond to pressures in the City of London. To make the situation worse, ambulances from other jurisdictions such as Elgin or Oxford have to cover off the County and City calls.
In response to the rise in call volume, MLPS added two temporary 12 hour units starting in the spring of 2018 in order to meet the increased demand for paramedic services.
Due to operating pressures in previous years, MLPS was required to absorb any uncontrollable cost increases through its operating reserves in order to maintain service levels. As a result, the 2019 budget cannot accommodate the existing and growing demand for paramedic services within the County of Middlesex and City of London.
Call Volume
The most significant driver of the 2019 budget amendment is a result of increased call volumes due to growth in service demand. In the City of London, the following factors have impacted call volume:
Population growth, Increase in mental health challenges, Aging population,
Page 17

Hospital offload delays that are impacting paramedic operations, Increase in demand due to post-secondary institutions (Western University and Fanshawe College), Hosting of large events such as 2018 Ontario Summer Games, 2019 Juno Awards, Country Music Awards, Budweiser Gardens events, etc. Annual events such as Rock the Park, Home County Music and Art Festival, Sunfest, “FOCO”, “HOCO”, St. Patrick’s Day, etc.
Approximately 60% of the 2019 budget increase is directly attributable to call volume growth and increased service demand in the City of London; consequently it is proposed that this portion of the budget increase be funded through Assessment Growth funding in accordance with the City’s Assessment Growth Policy. These costs include:
A further increase of one (1) additional 12 Hour City vehicle (4 FTE) for a total increase of two (2) 12 Hour vehicles in 2019 (the addition of one 12 hour vehicle was included in the previously approved 2019 land ambulance budget);
Four (4) new full-time Vehicle Service Technician positions to adequately support the operations division; Increased Vehicle Operations and Capital budgets to support the larger fleet of ambulances; and Additional insurance, facilities and technology costs to support greater operational demands.
Risk Mitigation
Risk is an inherent part of paramedic operations. Over the past several years risk to the organization has increased significantly. Risk factors include an increase in the complexity of patient care, increase in paramedic scope of practice, changes to basic and advanced life support standards, as well as a notable increase in occupational health and safety risk. All of these factors result in potentially serious liabilities to the organization. Central to the notion of risk management is the need for enhanced paramedic training, education and various other countermeasures. MLPS has made, and will continue to require, strategic investments in order to properly mitigate these real and perceived risks facing the organization.
Approximately 40% of the 2019 budget increase is attributable to increased costs related to changes in legislation, increased measures necessary to control risks and ensure appropriate service standards are maintained, and other miscellaneous cost increases. These costs include:
Additional personnel costs as a result of Bill 163 (Supporting Ontario’s First Responders Act) and WSIB pressures, as well as collective agreement adjustments;
Additional costs (0.25 FTE additional staff) related to an enhanced training model focused on health and safety, patient care, improved education and increased focus on peer support that assists employees experiencing mental health issues related to traumatic events;
Increased fees for technology support and software licensing; Other increases related to insurance, utilities and extended warranties on defibrillators.
Provincial funding is not available in 2019 for the additional 2019 budget pressures. The Ministry’s historical funding allocation is based on 50% of the previous year’s budget (in this case 2018) with some increased allocation for inflationary pressures. The Ministry funding allocation is also discretionary in nature; therefore no provincial funding is factored into this budget amendment.
Page 18

STRATEGIC AREA OF FOCUS: STRENGTHENING OUR COMMUNITY
INITIATIVE: SAFEGUARD PROGRAM – LONDON POLICE SERVICE
SERVICE(S): LONDON POLICE SERVICE
SERVICE LEAD(S): JOHN PARE, CHIEF, LONDON POLICE SERVICE
TYPE OF AMENDMENT: COST DRIVER
Budget Amendment Tax Levy Impact ($000’s)
2016 2017 2018 2019 2016-2019 TOTAL
Expenditure $0 $0 $0 $161 $161 Revenue $0 $0 $0 $0 $0 Net Requested Tax Levy (Cumulative) $0 $0 $0 $161 $161
Net Incremental Tax Levy $0 $0 $0 $161 $161 Annual Tax Levy Impact % 1 0.0% 0.0% 0.0% 0.03%
Note 1: The tax levy impact is calculated using the approved budget.
AMENDMENT FORM – CASE # 6
Page 19

AMENDMENT 1: SAFEGUARD PROGRAM – LONDON POLICE SERVICE
Operating Budget Table ($000’s)
London Police Service 2016 2017 2018 2019 2020-2025 Net Net Net Expenditure Net Expenditure Net
Approved Budget 97,966 102,042 106,932 116,925 107,935 701,550 647,610 Cumulative Amendment 161 161 1,926 1,926
Revised Budget 117,086 108,096 703,476 649,536
Tax Levy Per Cent Impact Table
Tax Levy Impact (Incremental Changes)
2016 2017 2018 2019 2016-2019 Average
Operating Impact 0.0% 0.0% 0.0% 0.03% 0.01%
Staffing Table Staffing Summary
(Cumulative Changes) 2019
# of Full-Time Employees Impacted 2 # of Full-Time Equivalents Impacted 2.0 Full-Time Equivalents Cost ($000’s) $161
What is the reason(s) for the budget amendment(s)? A key objective of the London Police Business Plan is to support members’ wellness. The London Police Service (LPS) recognizes that the health and wellbeing of each of our members impacts critically on our ability to provide service to the community and to achieve organizational goals. The mental wellness and psychological security of our members are key components of a productive, effective and healthy work space.
The LPS is committed to creating and sustaining a supportive work environment within which members throughout the organization are able to thrive and achieve their individual and collective potential. To this end, we are committed to promoting and supporting the psychological health and safety of our members, particularly as it relates to occupational stress injury, post-traumatic stress disorder and associated stigma.
Page 20

It is recognized that the provision of policing services, by its very nature, involves risks to members, including occupational stress injury and other mental health risks. Police officers, in some cases, cope with some of society’s most complex and critical situations and as such, tools, programs and services must be adapted for the unique culture and operational realities in a police service.
A “safeguard” program is a formal, coordinated system of psychological health checks delivered by a mental health professional. In specialized areas or high risk areas psychological supports are available through the Safeguard Program. However, there is no central co-ordination or early identification and intervention that is currently extended to other specialized areas or across the organization. There is little in the way of proactive and preventative psychological supports for front-line officers and civilian members exposed to cumulative trauma.
The goals of the Safeguard Program are:
Protect the psychological health and wellbeing of members Reduce stigma of seeking out an appointment with a psychologist Educate members about mental health and supports available to them Manage risk by providing additional mental health screening to members
The Safeguard Program will move us in the direction of implementing a proactive process to ensure we continue to build a comprehensive and co-ordinated psychological wellness program that provides supports and programs to protect our members.
We need to make a culture shift towards eliminating stigma associated with operational stress injuries and improving education, training, supports and services for all of our members; sworn and civilian.
The resources for a full time psychologist and administrative support staff will facilitate expansion of the Safeguard Program to include all sworn and civilian members across LPS. Costs will be lower in the first year considering the projected hire dates for the positions.
Page 21
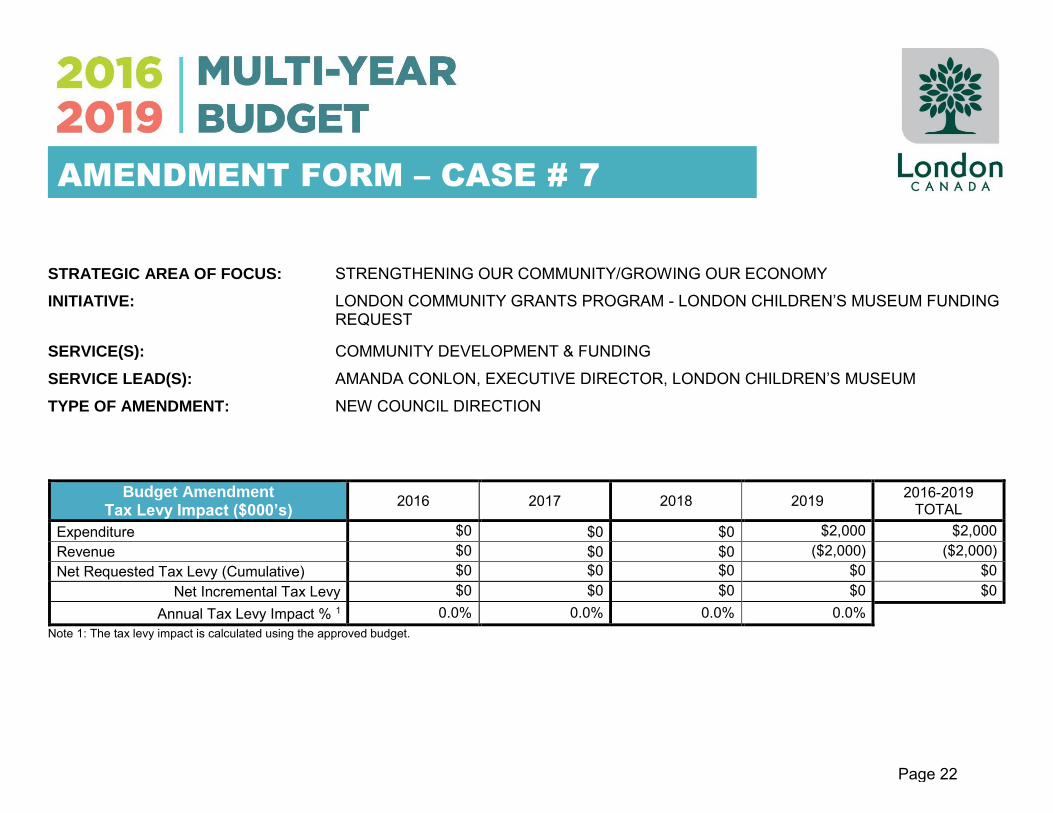
STRATEGIC AREA OF FOCUS: STRENGTHENING OUR COMMUNITY/GROWING OUR ECONOMY
INITIATIVE: LONDON COMMUNITY GRANTS PROGRAM - LONDON CHILDREN’S MUSEUM FUNDING REQUEST
SERVICE(S): COMMUNITY DEVELOPMENT & FUNDING
SERVICE LEAD(S): AMANDA CONLON, EXECUTIVE DIRECTOR, LONDON CHILDREN’S MUSEUM
TYPE OF AMENDMENT: NEW COUNCIL DIRECTION
Budget Amendment Tax Levy Impact ($000’s)
2016 2017 2018 2019 2016-2019 TOTAL
Expenditure $0 $0 $0 $2,000 $2,000 Revenue $0 $0 $0 ($2,000) ($2,000) Net Requested Tax Levy (Cumulative) $0 $0 $0 $0 $0
Net Incremental Tax Levy $0 $0 $0 $0 $0 Annual Tax Levy Impact % 1 0.0% 0.0% 0.0% 0.0%
Note 1: The tax levy impact is calculated using the approved budget.
AMENDMENT FORM – CASE # 7
Page 22

AMENDMENT 1: LONDON CHILDREN’S MUSEUM FUNDING REQUEST
Operating Budget Table ($000’s)
London Community Grants Program
2016 2017 2018 2019 2020-2025 Net Net Net Expenditure Net Expenditure Net
Approved Budget 2,356 2,483 2,613 2,797 2,797 16,782 16,782 Cumulative Amendment 2,000 0 1 0 0
Revised Budget 4,797 2,797 16,782 16,782
Note 1: Funded by the Economic Development Reserve Fund, $2 million in 2019. Tax Levy Per Cent Impact Table
Tax Levy Impact (Incremental Changes)
2016 2017 2018 2019 2016-2019 Average
Operating Impact 0.0% 0.0% 0.0% 0.0% 0.0%
Staffing Table Staffing Summary
(Cumulative Changes) 2019
# of Full-Time Employees Impacted 0 # of Full-Time Equivalents Impacted 0.0 Full-Time Equivalents Cost Inc./(Dec.) - $000’s $0
Page 23

Key Performance Indicator(s) Table
Metrics (Cumulative Changes)
CURRENT FORECAST YEAR 1 NEW CHILDREN’S
MUSEUM*
FORECAST YEAR 2 NEW CHILDREN’S
MUSEUM* More Londoners will be engaged in amazing arts, culture and recreation experiences
Operating hours More people have access to cultural resources through exhibits,
programs and collections Total # of public program offerings Total # of interactions with collection items
The Children’s Museum contributes to a healthy, safe and accessible city
Total # of Londoners accessing free or subsidised admissions and programs
Total value of free or subsidised admissions, memberships and programs
An investment in the Children’s Museum contributes to a diverse and resilient economy by promoting culture as a key part of economic growth and quality of life
Total # of visitors from outside the City of London Total economic impact from visitors (e.g. restaurant spending) Total economic impact through direct operational expenditures
The Children’s Museum contributes to the health and well-being of all children, youth, and families in London o More parents/caregivers spend quality time with their children building
mutual knowledge, skills and self-efficacy Total overall adult admission
o Children are engaged in play-based learning experiences supporting
their development of executive functioning skills Total overall child admission Students participating in school programs
2,481 hours 88,288 visitors
624
35,000
13,800
$128,000
41,495 $3,760,000 $900,000
37,154
51,134 10,500
2,637 hours 141,000 visitors
1,225 56,307
21,450
$271,000
66,450 $4,580,500 $1,657,500
59,000
81,998 15,356
2,637 hours 145,000 visitors
1,257
57,750
22,000
$278,000
68,150 $4,700,000 $1,700,000
60,900
84,100 15,750
*The projected increases are conservatively estimated based on information gathered from the experiences of like organizations in
similar sized cities and reinforced with data reported by the Association of Children’s Museums.
Page 24

What is the reason(s) for the budget amendment(s)? Description of the Amendment:
This amendment is a $2 million investment in the bold new future of the London Children’s Museum. The investment will be a component of a broader $13.9 million project to support the establishment of a new Children’s Museum at 100 Kellogg Lane that will be a state of the art educational and cultural destination for children and families in London. The total cost of the project is summarized as follows: Components Amount
Leasehold Improvements $2.8 million Design and Fabrication of Exhibits $8.8 million Capital Campaign & Transitional Lease Costs $2.3 million Total Project Cost $13.9 million
A sustainability plan has been prepared for the new Children’s Museum. Diversified financing including fundraising, debt and social financing, and the use of internal reserves will be required to complete this project. The Children’s Museum has embarked on a $13.9 million Capital Campaign. Revenue goals are as follows:
Funding Source Amount
Public Sector: Government Grants - Federal, Provincial and Municipal $6 million
(including $2 million requested from City
of London)
Private Sector: Individuals, Corporations, Foundations, Associations & Groups
$7.9 million
Total Campaign Revenue $13.9 million
Grants are being sought from all levels of government in support of the project and private sector donors will raise the remaining funds required. The City of London’s one time support will help to leverage funding from other levels of government and private donors. Specifically, the City of London’s
contribution would be utilized for the design and construction of the new exhibits within the new Children’s Museum space. Impact – By investing in the new Children’s Museum:
64% more children and families will be engaged in amazing arts, culture and recreation experiences through an increase in operating hours, more public program offerings, and more interaction with the Children’s Museum collection.
59% more families will have access to subsidy programs, memberships and admissions ensuring that all children, regardless of economic circumstances, have access to meaningful educational experiences.
37% more spending will be contributed to the local economy through direct and indirect expenditures. Page 25

64% more parents and caregivers will spend quality time with their children building skills and supporting their health and wellbeing. 64% more children will engage in play-based learning experiences supporting their development of executive functioning skills helping them
with self-control, organization, regulating emotions and multitasking.
What Is Driving The Amendment?
London Children’s Museum has the honour of being the first children’s museum ever established in Canada (1977) and one of only nine today. Children’s Museums are cultural institutions, committed to serving the needs and interests of children by providing exhibits and programs that stimulate curiosity, inspire imagination and motivate learning. The Children’s Museum has grown to become a unique cultural and educational centre that fosters creative learning for children and families.
After extensive community consultation, best-practice review of regional, national and international children’s museums, and substantial research
investigating key elements for a successful children’s museum, the current organizational strategic plan and new Children’s Museum business plan identifies the need to create dynamic content that appeals to and aligns with the needs of today’s children and families – a new location and bold new direction is instrumental to future success. The beloved building of the Children’s Museum opened in 1982 and has seen a lot of play. The new Children’s Museum will ensure more interactive play, up-to-date exhibits and shared spaces that foster a community of innovation where all children can learn, connect and grow through play.
The new Children’s Museum, at 100 Kellogg Lane, will be an innovative destination to explore and discover, with 32,000 square feet of accessible, centrally located, open-concept space. Permanent galleries, travelling exhibits, outdoor space, hands-on activities and interactive programs will make a unique place that brings together children, families and community.
By preserving play in a fast-paced, changing world, the new Children’s Museum will be:
A place for play and possibilities. A space filled with places to explore, examine, learn, and discover. A place where children can learn about science, technology, art, music, history, and nature through hands-on, interactive exhibits.
A place for experiential learning. A space offering unique opportunities for interactive learning, experiential exploration and discovery, and technology-enhanced exhibits that nurture curiosity, build knowledge and fuel imagination – the kind of active learning not offered elsewhere in the community.
A place for all. A welcoming environment for children and families of all abilities and backgrounds. A gathering place where children can experience the diversity of our city and a vital resource for schools with supporting classroom curricula. As a family learning centre, the new Children’s Museum
will appeal to more adults and young people in London and the surrounding region.
When And How Will The Amendment Occur?
A detailed Capital Campaign plan has been completed, providing strategies for raising the required funds. The organization’s current Strategic Plan and thorough Children’s Museum Business Plan have been prepared to provide details of the viability and impact of a regional Children’s Museum. The Children’s Museum is currently transitioning to the design phase of the project, finalizing the details of the new space, after which construction will proceed. The Children’s Museum is targeting the opening of the new Children’s Museum to occur in 2022.
Page 26

Link to City of London Strategic Plan
By investing in the Children’s Museum’s project the City of London can: Strengthening our Community - Create amazing arts, culture, and recreation experiences: As explained in London’s Cultural Prosperity Plan,
London is striving to be known as a regional cultural centre and is working towards strengthening London as a tourist destination by building greater recognition of the city’s assets. An anchor destination for families to have amazing arts, culture and recreation experiences, the Children’s Museum directly contributes to London’s recognition as a culturally rich and diverse city. The Children’s Museum connects children and youth to cultural programming and is building cultural appreciation among the next generation of Londoners.
Growing our Economy - Invest in local, regional, and global innovation: As an innovative childhood development resource that fosters creative learning and discovery through play, the Children’s Museum is a local asset. It is a vibrant cultural attraction that adds value to our community, helping to make London a great place to live, work, and play, and is key to attracting and retaining 25-44 year olds and their children to London. The Children’s Museum was the first in Canada and is one of only nine across Canada today. It is a testament to London-born creativity, innovation and entrepreneurship. Also a tourism driver, the Children’s Museum attracts 47% of general admission visitors from outside of London.
Strengthening our Community - Build a diverse, inclusive, and welcoming community: Children’s museums are popular, yet neutral sources of information that attract a diverse cross-section of people to engage in shared experiences. This uniquely positions the Children’s Museum to help reverse stigma and discrimination. By exposing adults and children to unfamiliar concepts in a non-threatening, fun, hands-on environment, and ensuring the experience is accessible to those of differing abilities and backgrounds, the Children’s Museum creates bridges of understanding.
Strengthening our Community - Develop a healthy, safe, and accessible city: The Children’s Museum is considered a safe, accessible space
and community hub in London that supports children in their cognitive, physical and social development and programs and exhibits focus on the whole child. Through subsidized memberships and free admission every Friday evening, the Children’s Museum is open and accessible to all families in London. By eliminating the financial barrier to participation, all children in London have the freedom to explore their interests and skills and are inspired to pursue their education and to set goals for their future. An updated design will also allow for increased physical accessibility, as well as allowing the addition of sensory nights for children and caregivers with sensitivities to lights and sound. A new space will provide increased flexibility to reduce all barriers to children and families engaging with the space.
What Will The Community Impact Be?
The Children’s Museum is an essential thread in London’s economic, cultural, and community fabric. Tourism, spending, jobs, culture, and community partnerships all see measurable, positive impact from the Children’s Museum, for all Londoners. With a sustainable future, the Children’s Museum will be able to continue to build upon this success in the following ways:
Economic Impact: o Community Investment: Londoners often choose to visit the Children’s Museum instead of attractions in other cities, retaining their
spending in our city. The Children’s Museum is also a gateway to London for children and families who do not live here, and to families who are new to the city. As noted above, 47% of Children’s Museum visitors are from outside of the City of London, and these tourists have a direct impact on local businesses thanks to their visits to local restaurants, hotels, stores, and other venues. With more visitors to the new Children’s Museum, this impact is expected to grow.
Page 27

o Employment and Job Creation: The Children’s Museum offers meaningful employment, internships, co-operative education placements, and volunteer opportunities for many skill sets. With 10 full-time staff, 31 part-time and seasonal staff, the Children’s
Museum is also supported by more than 120 active volunteers. o Economic Contribution: Just under $1 million is contributed to the local economy annually through direct operational expenditures. The
new Children’s Museum will increase its economic contribution through significant growth in the number of annual visitors (locally, regionally, and beyond). Combined with expanded employment and volunteer opportunities, the direct operational expenditures are projected to increase to $1.7 million annually.
A Cultural, Educational, and Community Hub: o Cultural Attraction: Children’s museums are cultural institutions committed to serving the needs and interests of children and families
by providing exhibits and programs that stimulate curiosity, inspire imagination and motivate learning. The London Children’s Museum
was the first in Canada. It is a testament to London-born creativity, innovation, and perseverance. The Children’s Museum is a vibrant
cultural attraction that adds value to our community and works to build future generations of museum goers. The re-imagined Children’s
Museum will be at the heart of the arts, cultural, and education community continuing to build a foundation for creativity and play; nurturing and inspiring children.
o Play and Well-Being: Play is essential for children. Play-based learning will result in a community of innovators, creators, thinkers and highly skilled individuals. Further, there will be enhanced resilience and health of children in our community as they are provided with learning opportunities that best support their social, emotional, physical and cognitive development. Researchers are consistent in pointing to the relationship between the lack of play and increased prevalence of depression, stress-related diseases and addictions. They suggest that by increasing the amount an individual plays their overall health and well-being will improve. Finally, children’s ability
to learn and develop will be improved. Studies have shown that while children play in a children’s museum, observable and quantifiable learning takes place.
o Lifelong Learning: Children’s Museum education programs directly align with the Ontario curriculum – programs are designed by Children’s Museum education specialists who are Ontario certified teachers – and extend enriching, interactive learning opportunities for children and families outside of the classroom. The first years of life are essential to future success and when children visit the Children’s Museum, they are excited to learn. The Children’s Museum nurtures creativity in a supportive environment. The informal learning environment of science, math, heritage, culture, arts, and humanities transcend age and experience and empower children to set their own pace.
Bringing People Together: o Making Connections: The Children’s Museum builds social capital and engages community members to meet and share information.
A sense of belonging to one’s community is at the heart of social capital. For children and families, the Children’s Museum has emerged as the community institution providing a unique, interactive environment where children and adults connect.
o Building a Sense of Community: The Children’s Museum is neutral source of information and has the unique position to make a real
difference towards reversing feelings of stigma and discrimination. The Children’s Museum intentionally and thoughtfully welcome
community participation in the museum experience. Local citizens are invited to demonstrate talents and to share from their cultural backgrounds. Through all these actions, the Children’s Museum helps to build a strong community.
o Accessibility for All: The Children’s Museum is open and accessible to all London families. For those families in difficult financial situations, access to free and subsidized memberships are available through partnerships with the Ontario Works LEAP program, the
Page 28

Salvation Army, newcomer programs and women’s and family shelters. Further, any resident of London can apply for a subsidized
membership. By eliminating the financial barrier to participation, children from all across London have the freedom to explore their interests and skills, are inspired to pursue their education and to set goals for their future - ultimately helping to break the cycle of poverty.
Partnering With Schools and Community Organizations: o Education Partnerships: The Children’s Museum partners with educators to complement lesson plans and support childhood learning.
This symbiotic relationship means educators bring museum resources to the classroom or they can bring students to the Children’s
Museum. o Community Partnerships: Collaborations with community organizations such as Growing Chefs! Ontario, Childreach, the Boys’ and
Girls’ Club, the Children’s Aid Society of London and Middlesex, London Public Library, Merrymount Children’s Centre, Anova, Cross Cultural Learners Centre, Neighbourhood Family Centres, Thames Valley District School Board, London District Catholic School Board, local Independent Schools and many more through our membership in the Child and Youth Network. The Children’s Museum
will continue to seek new partnerships and collaborations that will strengthen the ability to serve children and families. Sustainability:
o Expanded & Diverse Revenue Streams: Building sustainability is a core focus of the Children’s Museum. The profits from the sale of
the current building will be invested into the new Children’s Museum. A capital fundraising campaign has been launched, during which private and family foundations, all levels of government, as well as corporate and individual sponsors will be asked to participate and support financially. Finally, in-kind donations, grant funding, and exhibit sponsorships will round out the comprehensive fund development strategy. The new Children’s Museum will be sustained through expanded and diverse revenue streams: admissions, memberships, special events, donations, sponsorships, endowments, social enterprise initiatives, program fees, facility rentals, third-party fundraising, and gift shop sales.
What are the risks of not supporting this amendment?
Municipal support is often considered when applications for federal or provincial funds are reviewed. Without this support, contributions from other levels of government and the private sector are more challenging to secure as they often look to municipal support as a benchmark for timing and grant size. The financial support from the City of London will also be essential for the Children’s Museum to leverage funding from the community as
a whole. The support will demonstrate to the community that the City of London supports the Children’s Museum and values its contribution to the
community.
What are the risks of the project and how are they being managed? A rigorous risk assessment exercise was conducted to identify probable risk factors and their impact on the project and to set a risk mitigating action plan. In summary, Children’s Museum has identified the following four risk factors that have a high impact on the project:
Operational risk factors o Projected attendance levels o Projected revenue levels
Economic risk factors: o Project cost over-runs o Success of capital campaign
Page 29
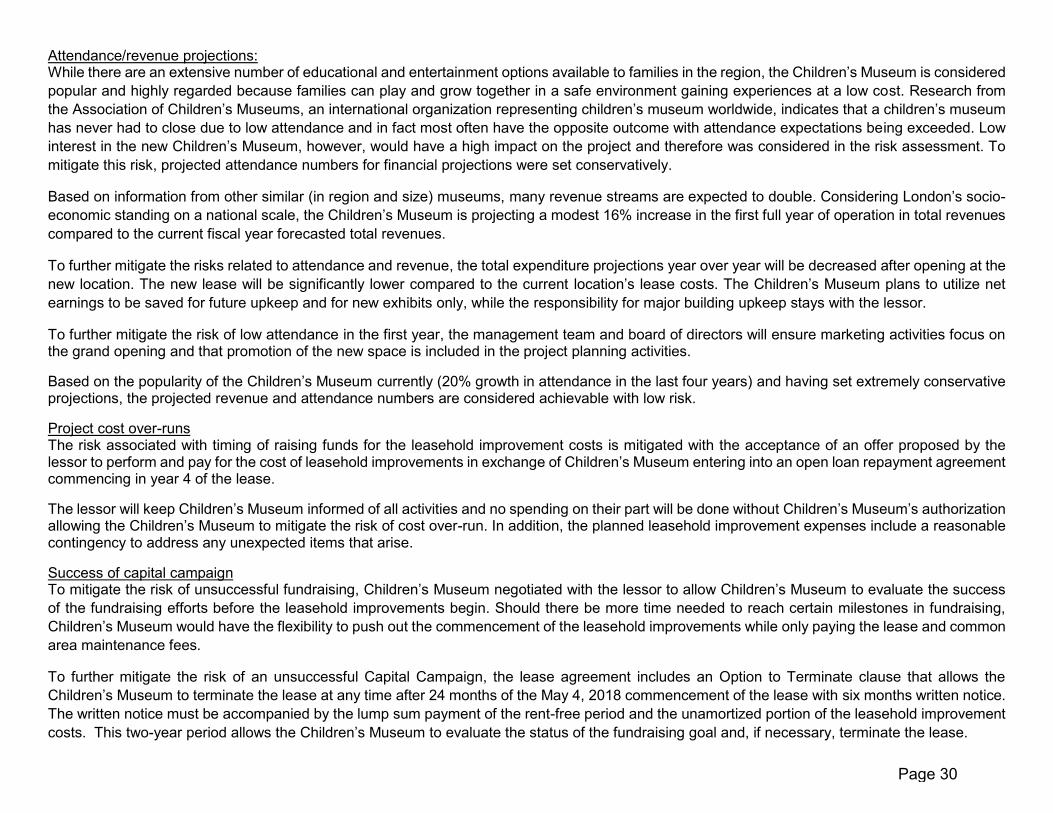
Attendance/revenue projections: While there are an extensive number of educational and entertainment options available to families in the region, the Children’s Museum is considered popular and highly regarded because families can play and grow together in a safe environment gaining experiences at a low cost. Research from the Association of Children’s Museums, an international organization representing children’s museum worldwide, indicates that a children’s museum
has never had to close due to low attendance and in fact most often have the opposite outcome with attendance expectations being exceeded. Low interest in the new Children’s Museum, however, would have a high impact on the project and therefore was considered in the risk assessment. To mitigate this risk, projected attendance numbers for financial projections were set conservatively.
Based on information from other similar (in region and size) museums, many revenue streams are expected to double. Considering London’s socio-economic standing on a national scale, the Children’s Museum is projecting a modest 16% increase in the first full year of operation in total revenues compared to the current fiscal year forecasted total revenues.
To further mitigate the risks related to attendance and revenue, the total expenditure projections year over year will be decreased after opening at the new location. The new lease will be significantly lower compared to the current location’s lease costs. The Children’s Museum plans to utilize net earnings to be saved for future upkeep and for new exhibits only, while the responsibility for major building upkeep stays with the lessor.
To further mitigate the risk of low attendance in the first year, the management team and board of directors will ensure marketing activities focus on the grand opening and that promotion of the new space is included in the project planning activities.
Based on the popularity of the Children’s Museum currently (20% growth in attendance in the last four years) and having set extremely conservative projections, the projected revenue and attendance numbers are considered achievable with low risk.
Project cost over-runs The risk associated with timing of raising funds for the leasehold improvement costs is mitigated with the acceptance of an offer proposed by the lessor to perform and pay for the cost of leasehold improvements in exchange of Children’s Museum entering into an open loan repayment agreement commencing in year 4 of the lease.
The lessor will keep Children’s Museum informed of all activities and no spending on their part will be done without Children’s Museum’s authorization allowing the Children’s Museum to mitigate the risk of cost over-run. In addition, the planned leasehold improvement expenses include a reasonable contingency to address any unexpected items that arise.
Success of capital campaign To mitigate the risk of unsuccessful fundraising, Children’s Museum negotiated with the lessor to allow Children’s Museum to evaluate the success of the fundraising efforts before the leasehold improvements begin. Should there be more time needed to reach certain milestones in fundraising, Children’s Museum would have the flexibility to push out the commencement of the leasehold improvements while only paying the lease and common area maintenance fees.
To further mitigate the risk of an unsuccessful Capital Campaign, the lease agreement includes an Option to Terminate clause that allows the Children’s Museum to terminate the lease at any time after 24 months of the May 4, 2018 commencement of the lease with six months written notice. The written notice must be accompanied by the lump sum payment of the rent-free period and the unamortized portion of the leasehold improvement costs. This two-year period allows the Children’s Museum to evaluate the status of the fundraising goal and, if necessary, terminate the lease.
Page 30
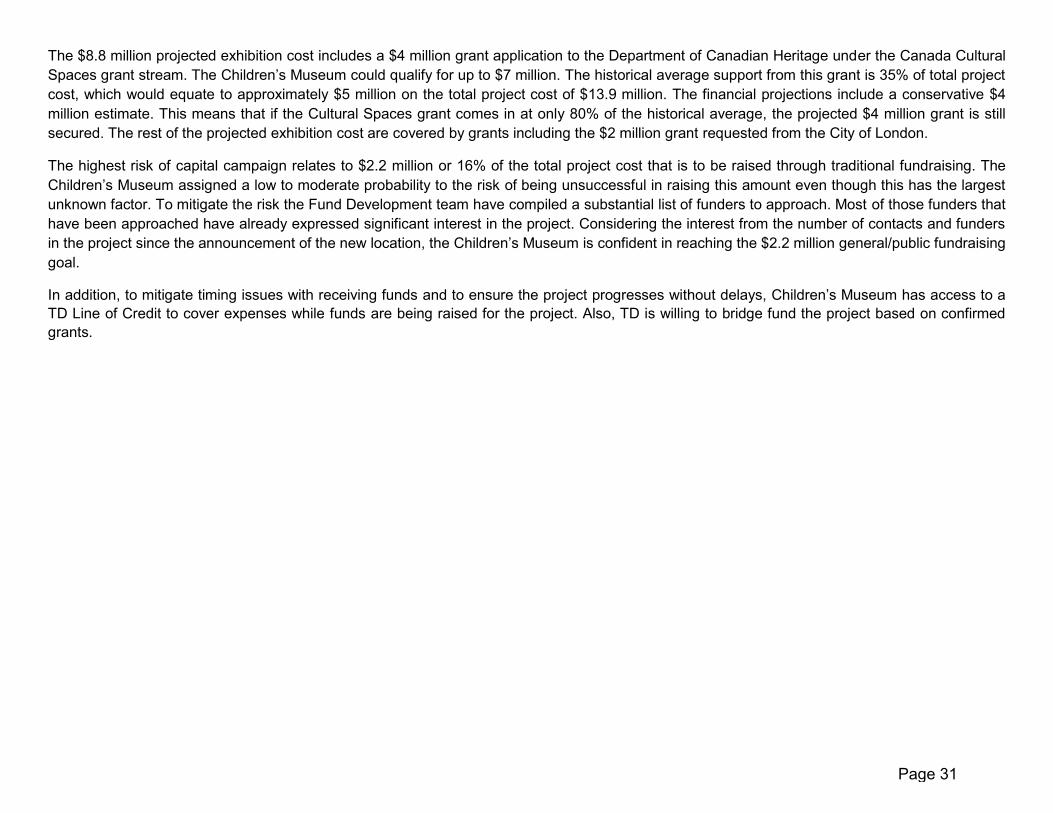
The $8.8 million projected exhibition cost includes a $4 million grant application to the Department of Canadian Heritage under the Canada Cultural Spaces grant stream. The Children’s Museum could qualify for up to $7 million. The historical average support from this grant is 35% of total project cost, which would equate to approximately $5 million on the total project cost of $13.9 million. The financial projections include a conservative $4 million estimate. This means that if the Cultural Spaces grant comes in at only 80% of the historical average, the projected $4 million grant is still secured. The rest of the projected exhibition cost are covered by grants including the $2 million grant requested from the City of London.
The highest risk of capital campaign relates to $2.2 million or 16% of the total project cost that is to be raised through traditional fundraising. The Children’s Museum assigned a low to moderate probability to the risk of being unsuccessful in raising this amount even though this has the largest unknown factor. To mitigate the risk the Fund Development team have compiled a substantial list of funders to approach. Most of those funders that have been approached have already expressed significant interest in the project. Considering the interest from the number of contacts and funders in the project since the announcement of the new location, the Children’s Museum is confident in reaching the $2.2 million general/public fundraising goal.
In addition, to mitigate timing issues with receiving funds and to ensure the project progresses without delays, Children’s Museum has access to a TD Line of Credit to cover expenses while funds are being raised for the project. Also, TD is willing to bridge fund the project based on confirmed grants.
Page 31

STRATEGIC AREA OF FOCUS: GROWING OUR ECONOMY
INITIATIVE: REALIGN 10 YEAR CAPITAL PLAN
SERVICE(S): LONDON CONVENTION CENTRE
SERVICE LEAD(S): LORI DA SILVA, GENERAL MANAGER – LONDON CONVENTION CENTRE
TYPE OF AMENDMENT: COST DRIVER
Budget Amendment Tax Levy Impact ($000’s)
2016 2017 2018 2019 2016-2019 TOTAL
Expenditure $0 $0 $0 $1,857 $1,857 Revenue $0 $0 $0 ($1,857) ($1,857) Net Requested Tax Levy (Cumulative) $0 $0 $0 $0 $0
Net Incremental Tax Levy $0 $0 $0 $0 $0 Annual Tax Levy Impact % 1 0.0% 0.0% 0.0% 0.0%
Note 1: The tax levy impact is calculated using the approved budget.
AMENDMENT FORM – CASE # 8
Page 32

AMENDMENT 1: LONDON CONVENTION CENTRE REALIGN 10 YEAR CAPITAL PLAN
Capital Budget Table ($000’s)
GG176519 Convention Centre Repairs Expenditure
2016 2017 2018 2019 2020-2025 Approved Budget 440 816 549 196 5,701
Cumulative Amendment 1,857 (2,489) Revised Budget 2,053 3,212
Source of Financing
Approved Budget 0 0 0 (196) (5,701)
Am
en
dm
en
ts Capital Levy (CL)
Debenture (D) Reserve Fund (RF) (1,857) 2,489
Other (O) Non-tax Supported (NTS)
Revised Budget (2,053) (3,212)
2026 Capital Gross Expenditure: $838 2027 Capital Gross Expenditure: $807 2028 Capital Gross Expenditure: $743 Tax Levy Per Cent Impact Table
Tax Levy Impact (Incremental Changes)
2016 2017 2018 2019 2016-2019 Average
Capital Impact 0.0% 0.0% 0.0% 0.0% 0.0%
Page 33

What is the reason(s) for the budget amendment(s)? The London Convention Centre (LCC) is a City owned asset which opened in October 1993 and is managed by the London Convention Centre Corporation. The LCC has a mandate to prospect, contract and host in a fiscally and socially responsible way, multi-day meetings, conventions, tradeshows, one-day meetings, food & beverage and specialty events generating economic impact for the community. Annually the LCC generates $15-$20 million in direct spend for London. The LCC supports the City of London strategy for Growing the Economy.
The LCC has a 25 year capital plan and a capital reserve held by the City of London. Annually the City transfers approximately $636 thousand to the LCC Reserve Fund. The LCC is now in its 25th year of operation with the original roof. On-going roof repairs have been completed as required. In June 2018, the LCC commissioned a roof condition assessment report. The report findings recommend the majority of the roof, with the exception of one small section, should be replaced in the next two years. The one small section referenced should be replaced in the next 10+ years. The roof has been identified as in poor condition meaning the component has exceeded its design life and is beyond repair. Capital expenditure is recommended within the next two years. Currently, $515 thousand is included in 2023 of the LCC’s 25 year capital plan for roof replacement assuming the roof would be replaced in phases. The LCC has a planned 2nd floor interior finishes upgrade scheduled for summer 2019 which was originally approved in 2017. This project was delayed due to successful bids for summer conventions in 2018. This upgrade has been rescheduled for July/August 2019. The interior finishes refresh requires the entire 2nd floor of the LCC to be blocked from bookings during July and August to complete the work. The City of London Facility consultants have recommended that LCC Administration consider replacing the LCC roof as one project rather than in phases due to the cost of setting up and tearing down the staging requirements. It is the recommendation of LCC Administration and the LCC Board of Directors that the roof be replaced in 2019. Scheduling the roof replacement during the currently planned closure in 2019 reduces the need for future “down time” of the ballroom which minimizes future negative impact to LCC revenue and reduces the potential guest impact from noise and odours when the roof section directly over the LCC ballroom is replaced assuming that this work can be completed in July/August 2019. The roof work would be scheduled during the LCC 2nd floor summer closure period.
The total estimated cost of the roof and the delayed interior 2nd floor refresh is $3 million. To finance this project, LCC and the City have identified available life-to-date capital budgets of $950 thousand and LCC Reserve Fund financing of $1.75 million, leaving an approximate $300 thousand shortfall. Based on the recommendations of the City Treasurer, this shortfall, if realized, will be managed through the City’s available working funds until 2020 when a portion of the annual LCC Reserve Fund contribution will be used to repay any working funds applied. Also, to reduce or eliminate this shortfall, consideration will be given to recommending any 2018 and/or 2019 LCC operating surpluses be contributed to the LCC Reserve Fund. If this request is approved, the LCC Reserve Fund will be depleted for a period of approximately three to six months. During this period, should any major capital issues arise, the LCC will need to seek financial assistance from the City of London. The risk of not completing the roof in 2019 is the potential escalation of leaks and increasing repair costs. The opportunity exists to minimize the potential revenue loss to the LCC and reduce the impact to the guest experience by completing the roof work with the scheduled interior finishes work in 2019. The City Finance Department has been very supportive in assisting the LCC in planning the best approach to complete this repair.
Page 34

STRATEGIC AREA OF FOCUS: GROWING OUR ECONOMY
INITIATIVE: COVENT GARDEN MARKET GARAGE PAINTING - NEW CAPITAL PROJECT
SERVICE(S): COVENT GARDENT MARKET
SERVICE LEAD(S): BOB USHER, GENERAL MANAGER - COVENT GARDEN MARKET
TYPE OF AMENDMENT: COST DRIVER
Budget Amendment Tax Levy Impact ($000’s)
2016 2017 2018 2019 2016-2019 TOTAL
Expenditure $0 $0 $0 $50 $50 Revenue $0 $0 $0 ($50) ($50) Net Requested Tax Levy (Cumulative) $0 $0 $0 $0 $0
Net Incremental Tax Levy $0 $0 $0 $0 $0 Annual Tax Levy Impact % 1 0.0% 0.0% 0.0% 0.0%
Note 1: The tax levy impact is calculated using the approved budget.
AMENDMENT FORM – CASE # 9
Page 35

AMENDMENT 1: COVENT GARDEN MARKET GARAGE PAINTING
Capital Budget Table ($000’s) GG1784 Covent Garden Market Garage Painting
Expenditure 2016 2017 2018 2019 2020-2025
Approved Budget 0 0 0 0 0 Cumulative Amendment 50 52
Revised Budget 50 52
Source of Financing
Approved Budget 0 0 0 0 0
Am
en
dm
en
ts Capital Levy (CL)
Debenture (D) Reserve Fund (RF)
Other (O) Non-tax Supported (NTS) (50) (52)
Revised Budget (50) (52)
2026 Capital Gross Expenditure: $0 2027 Capital Gross Expenditure: $0 2028 Capital Gross Expenditure: $0 Tax Levy Per Cent Impact Table
Tax Levy Impact (Incremental Changes)
2016 2017 2018 2019 2016-2019 Average
Capital Impact 0.0% 0.0% 0.0% 0.0% 0.0%
What is the reason(s) for the budget amendment(s)? The project to paint the parking garage has been initiated due to the deterioration of the concrete in the market parking garage. This project will help protect the concrete, reducing repairs and extending the useful life of the structure. The project will span two years beginning in 2019.
This project is fully funded by the Covent Garden Market reserve.
Page 36

STRATEGIC AREA OF FOCUS: STRENGTHENING OUR COMMUNITY
INITIATIVE: MASONVILLE TRANSIT VILLAGE SECONDARY PLAN - NEW CAPITAL PROJECT
SERVICE(S): PLANNING SERVICES
SERVICE LEAD(S): JOHN FLEMING, MANAGING DIRECTOR, PLANNING AND CITY PLANNER
TYPE OF AMENDMENT: COST DRIVER
Budget Amendment Tax Levy Impact ($000’s)
2016 2017 2018 2019 2016-2019 TOTAL
Expenditure $0 $0 $0 $75 $75 Revenue $0 $0 $0 ($75) ($75) Net Requested Tax Levy (Cumulative) $0 $0 $0 $0 $0
Net Incremental Tax Levy $0 $0 $0 $0 $0 Annual Tax Levy Impact % 1 0.0% 0.0% 0.0% 0.0%
Note 1: The tax levy impact is calculated using the approved budget.
AMENDMENT FORM – CASE # 10
Page 37

AMENDMENT 1: MASONVILLE TRANSIT VILLAGE SECONDARY PLAN
Capital Budget Table ($000’s) PD2156 Masonville Transit Village Secondary Plan
Expenditure 2016 2017 2018 2019 2020-2025
Approved Budget 0 0 0 0 0 Cumulative Amendment 75
Revised Budget 75 0
Source of Financing
Approved Budget 0 0 0 0 0
Am
en
dm
en
ts Capital Levy (CL)
Debenture (D) Reserve Fund (RF)
Other (O) * (15) Non-tax Supported (NTS) ** (60)
Revised Budget (75) 0
2026 Capital Gross Expenditure: $0 2027 Capital Gross Expenditure: $0 2028 Capital Gross Expenditure: $0 * One-time Planning operating budget savings are available to fund the non-growth related portion of the cost of this project. ** Rapid Transit Village Plans are approximately 80% growth related (80% Development Charges supported) and therefore Development Charges will fund a portion of the total cost. Tax Levy Per Cent Impact Table
Tax Levy Impact (Incremental Changes)
2016 2017 2018 2019 2016-2019 Average
Capital Impact 0.0% 0.0% 0.0% 0.0% 0.0%
Page 38

What is the reason(s) for the budget amendment(s)? The 2014 Development Charges (DC) Background Study identified a number of DC-eligible studies and projects to support the future growth and development of the City. Rapid Transit Village Secondary Plans were identified as an eligible category of studies. The DC Background Study provides for $300 thousand of funding for these projects. The purpose of this Budget Amendment is to establish a capital account for the first study under this program.
The preparation of a Secondary Plan for the Masonville Transit Village will provide the basis for the consideration of future planning applications for the redevelopment of this Transit Village. The policies of The London Plan establish a long term vision for the future development of this area as an intensive, mixed-use, pedestrian-oriented neighbourhood at the northern terminus of the City’s rapid transit system. The Secondary Plan will provide
more specific direction to guide the anticipated incremental redevelopment of this neighbourhood as a result of the changing retail and demographic environments, capitalizing on the neighbourhood’s location as the northern terminus of the rapid transit system and major employment node.
Page 39

STRATEGIC AREA OF FOCUS: BUILDING A SUSTAINABLE CITY
INITIATIVE: PROJECT ESTIMATE UPDATES - GROWTH TRANSPORTATION PROJECTS
SERVICE(S): TRANSPORTATION SERVICES
SERVICE LEAD(S): KELLY SCHERR, MANAGING DIRECTOR, ENVIRONMENTAL & ENGINEERING SERVICES AND CITY ENGINEER
DOUG MACRAE, DIRECTOR, ROADS AND TRANSPORTATION
TYPE OF AMENDMENT: COST DRIVER
Budget Amendment Tax Levy Impact ($000’s)
2016 2017 2018 2019 2016-2019 TOTAL
Expenditure $0 $0 $0 ($1,325) ($1,325) Revenue $0 $0 $0 $1,325 $1,325 Net Requested Tax Levy (Cumulative) $0 $0 $0 $0 $0
Net Incremental Tax Levy $0 $0 $0 $0 $0 Annual Tax Levy Impact % 1 0.0% 0.0% 0.0% 0.0%
Note 1: The tax levy impact is calculated using the approved budget.
AMENDMENT FORM – CASE # 11
Page 40
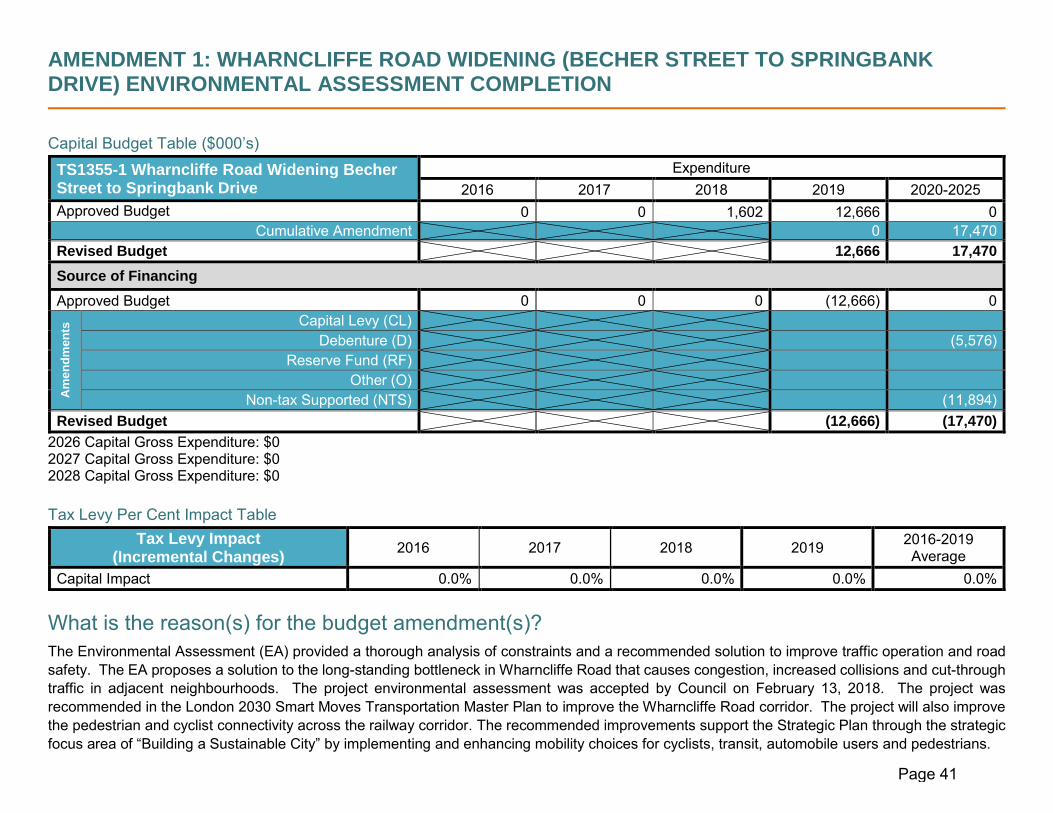
AMENDMENT 1: WHARNCLIFFE ROAD WIDENING (BECHER STREET TO SPRINGBANK DRIVE) ENVIRONMENTAL ASSESSMENT COMPLETION
Capital Budget Table ($000’s) TS1355-1 Wharncliffe Road Widening Becher Street to Springbank Drive
Expenditure 2016 2017 2018 2019 2020-2025
Approved Budget 0 0 1,602 12,666 0 Cumulative Amendment 0 17,470
Revised Budget 12,666 17,470
Source of Financing
Approved Budget 0 0 0 (12,666) 0
Am
en
dm
en
ts Capital Levy (CL)
Debenture (D) (5,576) Reserve Fund (RF)
Other (O) Non-tax Supported (NTS) (11,894)
Revised Budget (12,666) (17,470)
2026 Capital Gross Expenditure: $0 2027 Capital Gross Expenditure: $0 2028 Capital Gross Expenditure: $0 Tax Levy Per Cent Impact Table
Tax Levy Impact (Incremental Changes)
2016 2017 2018 2019 2016-2019 Average
Capital Impact 0.0% 0.0% 0.0% 0.0% 0.0%
What is the reason(s) for the budget amendment(s)? The Environmental Assessment (EA) provided a thorough analysis of constraints and a recommended solution to improve traffic operation and road safety. The EA proposes a solution to the long-standing bottleneck in Wharncliffe Road that causes congestion, increased collisions and cut-through traffic in adjacent neighbourhoods. The project environmental assessment was accepted by Council on February 13, 2018. The project was recommended in the London 2030 Smart Moves Transportation Master Plan to improve the Wharncliffe Road corridor. The project will also improve the pedestrian and cyclist connectivity across the railway corridor. The recommended improvements support the Strategic Plan through the strategic focus area of “Building a Sustainable City” by implementing and enhancing mobility choices for cyclists, transit, automobile users and pedestrians.
Page 41
The recommended solution requires an increased budget and is being integrated into the 2019 Development Charges Background Study development. The environmental assessment cost estimate for Phase 1, Wharncliffe Road South between Becher Street and Springbank Drive is $38.9 million. This includes $5 million in sewer and watermain lifecycle renewal work (includes engineering and shared construction items) that will be funded out of sewer and water capital projects resulting in a $33.9 million transportation project ($3.8 million in life-to-date funding, $12.7 million in 2019, $17.4 million in 2020). Cost sharing is anticipated with Canadian National Railway at 15% of the railway grade separation cost, conservatively estimated at $2.4 million based on applicable components (included in total project budget). The required cost adjustment is being integrated into the 2019 Development Charges Background Study development. Pertinent Reports: February 6, 2018 Civic Works Committee https://pub-london.escribemeetings.com/filestream.ashx?DocumentId=38949
Page 42

AMENDMENT 2: RICHMOND STREET & FANSHAWE PARK ROAD INTERSECTION IMPROVEMENTS ENVIRONMENTAL ASSESSMENT COMPLETION
Capital Budget Table ($000’s) TS1134 Richmond Street & Fanshawe Park Road Intersection Improvements
Expenditure 2016 2017 2018 2019 2020-2025
Approved Budget 0 2,700 400 0 4,000 Cumulative Amendment 0 4,500
Revised Budget 8,500
Source of Financing
Approved Budget 0 (2,700) 0 0 (4,000)
Am
en
dm
en
ts Capital Levy (CL)
Debenture (D) (450) Reserve Fund (RF)
Other (O) Non-tax Supported (NTS) (4,050)
Revised Budget 0 8,500
2026 Capital Gross Expenditure: $0 2027 Capital Gross Expenditure: $0 2028 Capital Gross Expenditure: $0 Tax Levy Per Cent Impact Table
Tax Levy Impact (Incremental Changes)
2016 2017 2018 2019 2016-2019 Average
Capital Impact 0.0% 0.0% 0.0% 0.0% 0.0%
What is the reason(s) for the budget amendment(s)? The need to improve the subject intersection was identified in the London Smart Moves 2030 Transportation Master Plan and it was carried forward into the 2014 Development Charges Background Study for near-term implementation subject to approvals and funding. The environmental assessment (EA) provided a thorough analysis of constraints and a recommended solution to improve traffic operation and road safety. The EA study was accepted by Council on October 2, 2018. The recommended solution requires an increased budget and is being integrated into the 2019 Development Charges Background Study development. The recommended plan in the EA improves traffic operation and road safety, better
Page 43
accommodates pedestrians and is compatible with the BRT design, “Main Street”, “Transit Village” and “Rapid Transit Boulevard” designations of the London Plan.
The recommended improvements support the Strategic Plan through the strategic focus area of “Building a Sustainable City” by implementing and enhancing mobility choices for cyclists, transit, automobile users and pedestrians. Richmond Street and Fanshawe Park Road Intersection is currently operating at a very poor level of service and is not a pedestrian and cycling friendly intersection. The intersection improvements are also tied to the proposed BRT route just south of the intersection. The revised budget is necessary to undertake the detailed design and property acquisition for the project and proceed with construction of the intersection improvements. Not proceeding with the intersection improvements will result in increased traffic congestion and adverse impacts on other modes of transportation.
Implementation timing is subject to approvals and coordinated land acquisition with the Shift Rapid Transit project.
Page 44

AMENDMENT 3: HAMILTON ROAD & HIGHBURY AVENUE INTERSECTION IMPROVEMENTS ENVIRONMENTAL ASSESSMENT COMPLETION
Capital Budget Table ($000’s) TS1309 Hamilton Road & Highbury Avenue Intersection Improvements
Expenditure 2016 2017 2018 2019 2020-2025
Approved Budget 0 740 250 1,325 0 Cumulative Amendment (1,325) 2,000
Revised Budget 0 2,000
Source of Financing
Approved Budget 0 (740) (250) (1,325) 0
Am
en
dm
en
ts Capital Levy (CL)
Debenture (D) 133 (200) Reserve Fund (RF)
Other (O) Non-tax Supported (NTS) 1,192 (1,800)
Revised Budget 0 (2,000)
2026 Capital Gross Expenditure: $0 2027 Capital Gross Expenditure: $2,800 2028 Capital Gross Expenditure: $700 2029 Capital Gross Expenditure: $4,010 Tax Levy Per Cent Impact Table
Tax Levy Impact (Incremental Changes)
2016 2017 2018 2019 2016-2019 Average
Capital Impact 0.0% 0.0% 0.0% 0.0% 0.0%
What is the reason(s) for the budget amendment(s)? The need to improve the subject intersection was identified in the London 2030 Transportation Master Plan (TMP) and it was carried forward into the 2014 Development Charges Bylaw for implementation subject to approvals and funding. The Environmental Assessment (EA) provided a thorough analysis of constraints and a recommended solution to improve traffic operation and road safety. The EA was accepted by Council on June 12, 2018. The recommended solution requires an increased budget and is therefore recommended for longer term implementation. Implementation timing is subject to the 2019 Development Charges Background Study development and is assumed in 2029.
Page 45

The recommended improvements support the Strategic Plan through the strategic focus area of “Building a Sustainable City” by implementing and
enhancing mobility choices for cyclists (along Hamilton Road), transit, automobile users and pedestrians. Hamilton Road and Highbury Avenue Intersection is currently operating at a very poor level of service. This budget amendment is necessary to have funding available in the 2020-2025 period for detailed design and property acquisition before proceeding with the planned construction of the intersection improvements in 2029. Not proceeding with the intersection improvements will result in increased traffic congestion and loss of opportunity to improve active transportation.
Page 46

STRATEGIC AREA OF FOCUS: BUILDING A SUSTAINABLE CITY
INITIATIVE: REALIGNMENT OF GROWTH TRANSPORTATION CAPITAL PROJECTS
SERVICE(S): TRANSPORTATION SERVICES
SERVICE LEAD(S): KELLY SCHERR, MANAGING DIRECTOR, ENVIRONMENTAL & ENGINEERING SERVICES & CITY ENGINEER
DOUG MACRAE, DIRECTOR, ROADS AND TRANSPORTATION
TYPE OF AMENDMENT: COST DRIVER
Budget Amendment Tax Levy Impact ($000’s)
2016 2017 2018 2019 2016-2019 TOTAL
Expenditure $0 $0 $0 ($6,833) ($6,833) Revenue $0 $0 $0 $6,833 $6,833 Net Requested Tax Levy (Cumulative) $0 $0 $0 $0 $0
Net Incremental Tax Levy $0 $0 $0 $0 $0 Annual Tax Levy Impact % 1 0.0% 0.0% 0.0% 0.0%
Note 1: The tax levy impact is calculated using the approved budget.
AMENDMENT FORM – CASE # 12
Page 47

AMENDMENT 1: WONDERLAND ROAD WIDENING – PHASE 1 (RIVERSIDE DRIVE TO SPRINGBANK DRIVE) DEFERRED
Capital Budget Table ($000’s) TS1348-1 Wonderland Road Widening – Phase 1 Riverside Drive to Springbank Drive
Expenditure 2016 2017 2018 2019 2020-2025
Approved Budget 1,009 0 0 1,686 18,018 Cumulative Amendment (1,686) 1,686
Revised Budget 0 19,704
Source of Financing
Approved Budget (1,009) 0 0 (1,686) (18,018)
Am
en
dm
en
ts Capital Levy (CL)
Debenture (D) 118 (118) Reserve Fund (RF)
Other (O) Non-tax Supported (NTS) 1,568 (1,568)
Revised Budget 0 (19,704)
2026 Capital Gross Expenditure: $0 2027 Capital Gross Expenditure: $0 2028 Capital Gross Expenditure: $0 Tax Levy Per Cent Impact Table
Tax Levy Impact (Incremental Changes)
2016 2017 2018 2019 2016-2019 Average
Capital Impact 0.0% 0.0% 0.0% 0.0% 0.0%
What is the reason(s) for the budget amendment(s)? 2019 funds deferred to 2020 anticipating schedule adjustment confirmation in upcoming 2019 Development Charges Background Study.
Page 48

AMENDMENT 2: WONDERLAND ROAD WIDENING – PHASE 2 (SPRINGBANK DRIVE TO COMMISSIONERS ROAD) DEFERRED
Capital Budget Table ($000’s) TS1348-2 Wonderland Road Widening – Phase 2 Springbank Drive to Commissioners Road
Expenditure 2016 2017 2018 2019 2020-2025
Approved Budget 0 0 0 304 4,038 Cumulative Amendment (304) 304
Revised Budget 0 4,342
Source of Financing
Approved Budget 0 0 0 (304) (4,038)
Am
en
dm
en
ts Capital Levy (CL)
Debenture (D) 76 (76) Reserve Fund (RF)
Other (O) Non-tax Supported (NTS) 228 (228)
Revised Budget 0 (4,342)
2026 Capital Gross Expenditure: $0 2027 Capital Gross Expenditure: $0 2028 Capital Gross Expenditure: $0 Tax Levy Per Cent Impact Table
Tax Levy Impact (Incremental Changes)
2016 2017 2018 2019 2016-2019 Average
Capital Impact 0.0% 0.0% 0.0% 0.0% 0.0%
What is the reason(s) for the budget amendment(s)? 2019 funds deferred to 2020 anticipating schedule adjustment confirmation in upcoming 2019 Development Charges Background Study.
Page 49

AMENDMENT 3: WONDERLAND ROAD WIDENING – PHASE 3 (RIVERSIDE DRIVE TO OXFORD STREET) DEFERRED
Capital Budget Table ($000’s) TS1348-3 Wonderland Road Widening – Phase 3 Riverside Drive to Oxford Street
Expenditure 2016 2017 2018 2019 2020-2025
Approved Budget 0 0 0 810 18,805 Cumulative Amendment (810) 810
Revised Budget 0 19,615
Source of Financing
Approved Budget 0 0 0 (810) (18,805)
Am
en
dm
en
ts Capital Levy (CL)
Debenture (D) 340 (340) Reserve Fund (RF)
Other (O) Non-tax Supported (NTS) 470 (470)
Revised Budget 0 (19,615)
2026 Capital Gross Expenditure: $0 2027 Capital Gross Expenditure: $0 2028 Capital Gross Expenditure: $0 Tax Levy Per Cent Impact Table
Tax Levy Impact (Incremental Changes)
2016 2017 2018 2019 2016-2019 Average
Capital Impact 0.0% 0.0% 0.0% 0.0% 0.0%
What is the reason(s) for the budget amendment(s)? 2019 funds deferred to 2020 anticipating schedule adjustment confirmation in upcoming 2019 Development Charges Background Study.
Page 50

AMENDMENT 4: SUNNINGDALE ROAD STAGE 2 PHASE 2 (BLUEBELL ROAD TO RICHMOND STREET) DEFERRED
Capital Budget Table ($000’s) TS1496-4 Sunningdale Road Stage 2 Phase 2 Bluebell Road to Richmond Street
Expenditure 2016 2017 2018 2019 2020-2025
Approved Budget 0 0 0 407 6,867 Cumulative Amendment (407) 407
Revised Budget 0 7,274
Source of Financing
Approved Budget 0 0 0 (407) (6,867)
Am
en
dm
en
ts Capital Levy (CL)
Debenture (D) 32 (32) Reserve Fund (RF)
Other (O) Non-tax Supported (NTS) 375 (375)
Revised Budget 0 (7,274)
2026 Capital Gross Expenditure: $0 2027 Capital Gross Expenditure: $0 2028 Capital Gross Expenditure: $0 Tax Levy Per Cent Impact Table
Tax Levy Impact (Incremental Changes)
2016 2017 2018 2019 2016-2019 Average
Capital Impact 0.0% 0.0% 0.0% 0.0% 0.0%
What is the reason(s) for the budget amendment(s)? 2019 funds deferred to 2020 anticipating schedule adjustment confirmation in upcoming 2019 Development Charges Background Study.
Page 51

AMENDMENT 5: POND MILLS OVERPASS CONTRIBUTION DEFERRED
Capital Budget Table ($000’s)
TS1412 Pond Mills Overpass Expenditure
2016 2017 2018 2019 2020-2025 Approved Budget 0 0 0 1,500 0
Cumulative Amendment (1,500) 1,500 Revised Budget 0 1,500
Source of Financing
Approved Budget 0 0 0 (1,500) 0
Am
en
dm
en
ts Capital Levy (CL)
Debenture (D) Reserve Fund (RF)
Other (O) Non-tax Supported (NTS) 1,500 (1,500)
Revised Budget 0 (1,500)
2026 Capital Gross Expenditure: $0 2027 Capital Gross Expenditure: $0 2028 Capital Gross Expenditure: $0 Tax Levy Per Cent Impact Table
Tax Levy Impact (Incremental Changes)
2016 2017 2018 2019 2016-2019 Average
Capital Impact 0.0% 0.0% 0.0% 0.0% 0.0%
What is the reason(s) for the budget amendment(s)? Expenditure timing is subject to Ministry of Transportation Ontario program and has been adjusted to 2022 based on current project schedule.
Page 52

AMENDMENT 6: CLARKE ROAD WIDENING (VETERANS MEMORIAL PARKWAY EXTENSION TO FANSHAWE PARK ROAD) DEFERRED
Capital Budget Table ($000’s) TS1476 Clarke Road Widening Veterans Memorial Parkway Extension to Fanshawe Park Road
Expenditure
2016 2017 2018 2019 2020-2025
Approved Budget 0 593 0 1,188 22,929 Cumulative Amendment (1,188) 1,188
Revised Budget 0 24,117
Source of Financing
Approved Budget 0 0 0 (1,188) (22,929)
Am
en
dm
en
ts Capital Levy (CL)
Debenture (D) 35 (35) Reserve Fund (RF)
Other (O) Non-tax Supported (NTS) 1,153 (1,153)
Revised Budget 0 (24,117)
2026 Capital Gross Expenditure: $0 2027 Capital Gross Expenditure: $0 2028 Capital Gross Expenditure: $0 Tax Levy Per Cent Impact Table
Tax Levy Impact (Incremental Changes)
2016 2017 2018 2019 2016-2019 Average
Capital Impact 0.0% 0.0% 0.0% 0.0% 0.0%
What is the reason(s) for the budget amendment(s)? 2019 funds deferred to 2020 anticipating schedule adjustment confirmation in upcoming 2019 Development Charges Background Study.
Page 53

AMENDMENT 7: PACK ROAD UPGRADES (COLONEL TALBOT ROAD TO BOSTWICK ROAD) DEFERRED
Capital Budget Table ($000’s) TS1358 Pack Road Upgrades – Colonel Talbot Road to Bostwick Road
Expenditure 2016 2017 2018 2019 2020-2025
Approved Budget 0 0 0 425 7,275 Cumulative Amendment (425) 425
Revised Budget 0 7,700
Source of Financing
Approved Budget 0 0 0 (425) (7,275)
Am
en
dm
en
ts Capital Levy (CL)
Debenture (D) 55 (55) Reserve Fund (RF)
Other (O) Non-tax Supported (NTS) 370 (370)
Revised Budget 0 (7,700)
2026 Capital Gross Expenditure: $0 2027 Capital Gross Expenditure: $0 2028 Capital Gross Expenditure: $0 Tax Levy Per Cent Impact Table
Tax Levy Impact (Incremental Changes)
2016 2017 2018 2019 2016-2019 Average
Capital Impact 0.0% 0.0% 0.0% 0.0% 0.0%
What is the reason(s) for the budget amendment(s)? 2019 funds deferred to 2020 anticipating schedule adjustment confirmation in upcoming 2019 Development Charges Background Study.
Page 54
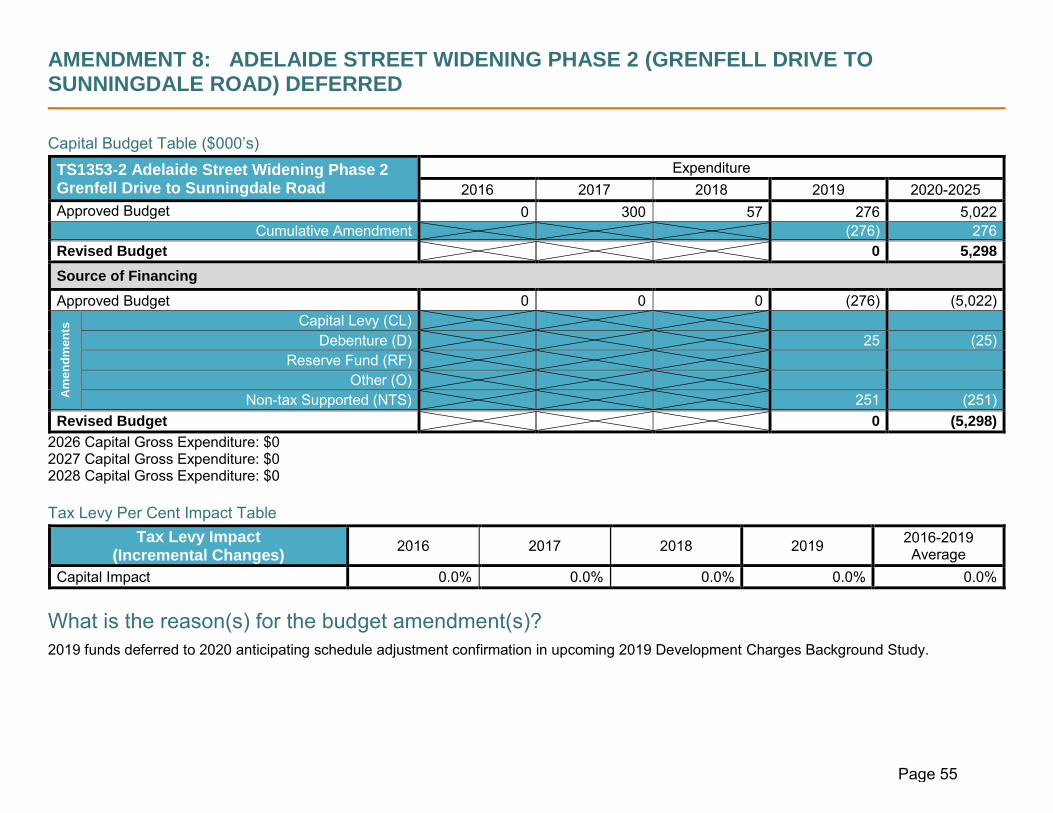
AMENDMENT 8: ADELAIDE STREET WIDENING PHASE 2 (GRENFELL DRIVE TO SUNNINGDALE ROAD) DEFERRED
Capital Budget Table ($000’s) TS1353-2 Adelaide Street Widening Phase 2 Grenfell Drive to Sunningdale Road
Expenditure 2016 2017 2018 2019 2020-2025
Approved Budget 0 300 57 276 5,022 Cumulative Amendment (276) 276
Revised Budget 0 5,298
Source of Financing
Approved Budget 0 0 0 (276) (5,022)
Am
en
dm
en
ts Capital Levy (CL)
Debenture (D) 25 (25) Reserve Fund (RF)
Other (O) Non-tax Supported (NTS) 251 (251)
Revised Budget 0 (5,298)
2026 Capital Gross Expenditure: $0 2027 Capital Gross Expenditure: $0 2028 Capital Gross Expenditure: $0 Tax Levy Per Cent Impact Table
Tax Levy Impact (Incremental Changes)
2016 2017 2018 2019 2016-2019 Average
Capital Impact 0.0% 0.0% 0.0% 0.0% 0.0%
What is the reason(s) for the budget amendment(s)? 2019 funds deferred to 2020 anticipating schedule adjustment confirmation in upcoming 2019 Development Charges Background Study.
Page 55
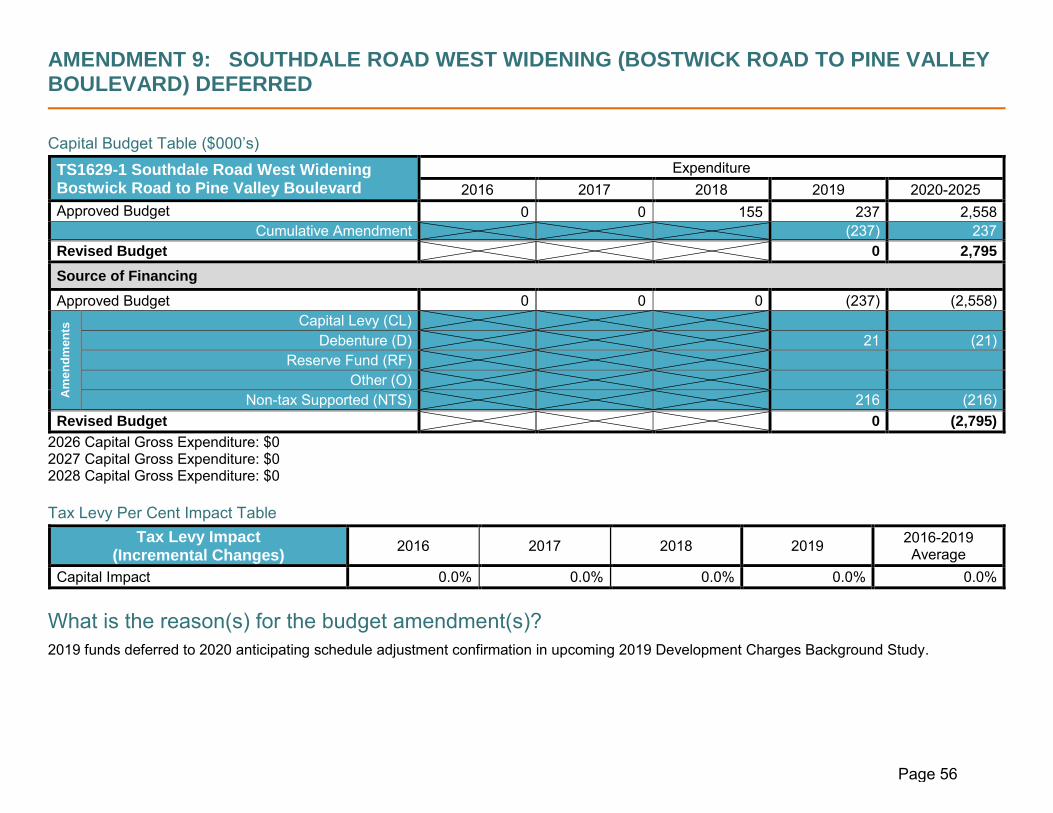
AMENDMENT 9: SOUTHDALE ROAD WEST WIDENING (BOSTWICK ROAD TO PINE VALLEY BOULEVARD) DEFERRED
Capital Budget Table ($000’s) TS1629-1 Southdale Road West Widening Bostwick Road to Pine Valley Boulevard
Expenditure 2016 2017 2018 2019 2020-2025
Approved Budget 0 0 155 237 2,558 Cumulative Amendment (237) 237
Revised Budget 0 2,795
Source of Financing
Approved Budget 0 0 0 (237) (2,558)
Am
en
dm
en
ts Capital Levy (CL)
Debenture (D) 21 (21) Reserve Fund (RF)
Other (O) Non-tax Supported (NTS) 216 (216)
Revised Budget 0 (2,795)
2026 Capital Gross Expenditure: $0 2027 Capital Gross Expenditure: $0 2028 Capital Gross Expenditure: $0 Tax Levy Per Cent Impact Table
Tax Levy Impact (Incremental Changes)
2016 2017 2018 2019 2016-2019 Average
Capital Impact 0.0% 0.0% 0.0% 0.0% 0.0%
What is the reason(s) for the budget amendment(s)? 2019 funds deferred to 2020 anticipating schedule adjustment confirmation in upcoming 2019 Development Charges Background Study.
Page 56