-1l-3 - national oceanic and atmospheric administration · second quarter estimates of relative...
TRANSCRIPT
STOCK CATALOGUE
OF THE
NEW ENGLAND FISHERIES
SECOND QUARTER, 1970
H. Stern Jr. and F. A. Dreyer
B Ireau of Commercial Fisheries Biological laboratory Woods Hole, Massachusetts,02543
-1l-3
Laboratory Reference lJo. 7I-3

HADDOCK
ICNAF regulat'ions closed Browns Bank-and most of Georges Bank to fishing during April, 1970 (March, in the first quarter, was also closed.). This made for an abbreviated quarter on the two prime US haddock fishing grounds.
Total landings for the second quarter were about .11.5 million pounds (Table 1), which was some 6 million pounds less than the second quarter of 1969. Georges Bank landings for the second quarter, 1970 were about 7 million pounds under the landings for the same period of 1969. Scro~ iandings accounted for 51 percent of this deficit. Although the closure must have had some effect, part of the reduction was due to lower abundance. Browns Bank landings were about 29, percent higher for the second quarter, 1970 than for 1969. This increase was apparently due to additional fishing effort.
During April many US vessels fished in Division 4W (East of LaHave) where landings of approximately one million pounds were reported. During the first quarter, about 0.3 million pounds were landed from this area. ,This marks the first time in 11 years that US vessels have fished intensively this far away from home'for haddock.
In relation to the ICNAF landings quotas for haddock, at the close of the second quarter the following totals were reported (in millions of pounds, live weight):
US
Other Nations
Total
Percent of Quota
January-June
Sub Area 5
(Quota: 26.5)
1.0.6
1.7
12.3
53
-1-
Division 4X
(Quota: 40.0)
2.4
14.6
16.9
49

Second quarter estimates of relative abundance from 1962 through 1970 for Georges Bank haddock using an analysis of variance model are presented in Figure 1. Only data from May and June were used in order 'that all years would be comparable with 1970. Total abundance on Georges Bank remains at a very low state, and because of poor recruitment since 1965, scr.od abundance is exceptionally low. Browns Bank stock are also low when compared to pre-1965 years. Relative abundance indicators were higher ·for the 1970 second quarter than for the same period in 1969; however, these estimates are based on minimal effor~ data. .
-2-
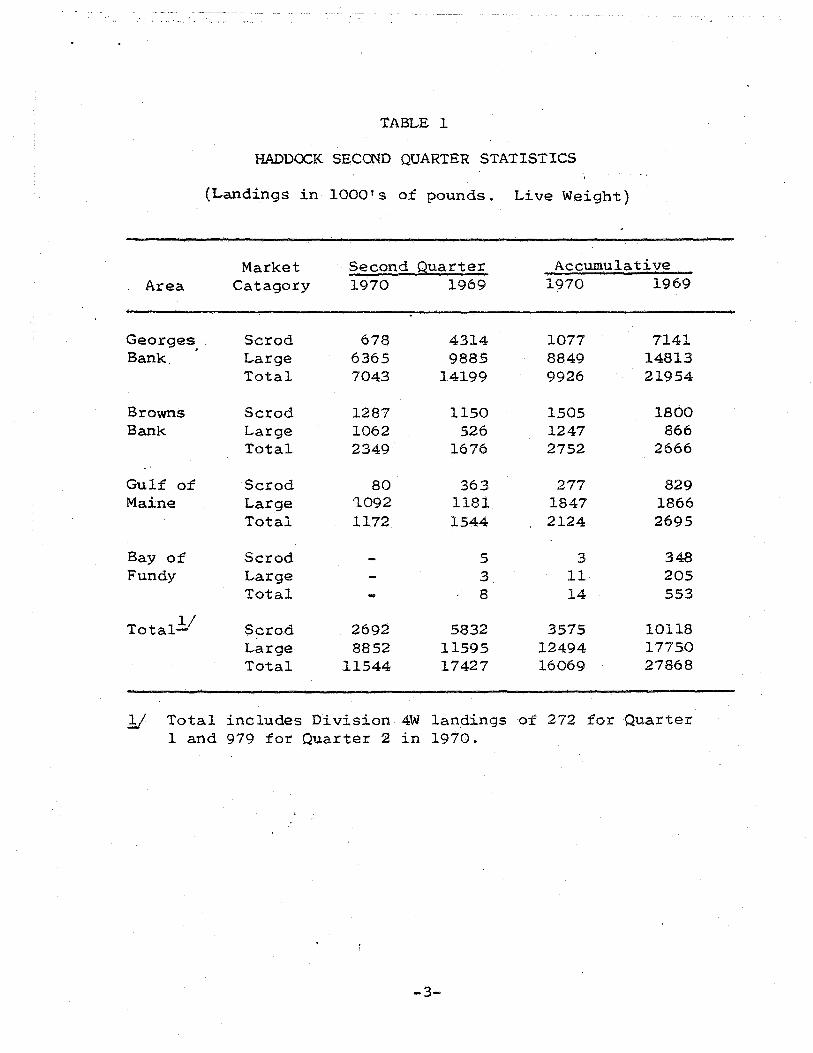
TABLE 1
HADDOCK SECOND QUARTER STATISTICS
(Landings in 1000's of pounds. Live Weight)
Market Second Quarter Accumulative Area Catagory 1970 1969 1970 1969
Georges, Scrod 678 4314 1077 7141 Bank, Large 6365 9885 8849 14813
Total 7043 14199 9926 21954
Browns Scrod 1287 1150 1505 1800 Bank Large 1062 526 1247 866
Total 2349 1676 2752 2666
Gulf of Scrod 80 363 277 829 Maine Large 'l092 1181 1847 1866
Total 1172 1544 2124 2695
Bay of Scrod 5 3 348 Fundy Large 3 11 205
Total 8 14 553
TotalY Scrod 2692 5832 3575 10118 Large 8852 11595 12494 17750 Total 11544 17427 16069 27868
11 Total includes Division 4W landings of 272 for Quarter 1 and 979 for Quarter 2 in 1970.
-3-

-14~--------------------------------------------------~ GEORGES BANK HADDOCK
SECOND QUARTER
~ 13~~--------~--~~--------~-------------------------4 ~ o 0..
La..
. 0 12~~~----~--------~----------------------------~--~ Cf) o Z <l CJ)
5 ll~--~--~------------~------------------------------~ ::I: .--o w :r: ~IO~----~~---------------+-----------------------------4 La.. .
(J)
~ o o 9~--~------------------------~~--------------------~ a::: g z ~ ~ 8~--------------------------------~------------------~ en o z o z S 7~----------------------------------------------------~
6 1962 1963 1964 1965 1966 1967 1968 1969 1970
Figure 1
-4-
---_._--_ .. _. ....-.;.,.;, ....... ~~~.

YE;LLOWTAIL
Total yellowtail food landings for the second quarter were close to 15 million pounds (Table '2 ) which represents a gain of 11 percent over the same period in 1969. Georges Bank landings were up 0.5 million pounds (6 percent) while landings from ~he Southern New England grounds increased 1.2 million pounds (28 percent) over the second quarter, 1969.
Total catches of yellowtail (which includes discards and industria~ landings) for the two major fishing totals.~re given in Table 3. Total catch for Georges Bank was 3.4 million pounds (25 percent) greater than for the second quarter, 1969. This rise was the result of a large increase in estimated discard. Total catch for the Southern New England grounds showed a 1.8 million pound (21 percent) increase over the same period of 1969. Discards were significantly higher in this area for 1970 also; however, industrial landings were lower by 11 percent.
Relative abundance, expressed as landings per day, on both major fishing grounds for the secbnd quarter, 1970 we're similar in comparison with the second quarter, 1969 (Table 2). Increase in landings, then, were primarily the result of increased fishing effor~.
Age composition of yellowtail landings for 1969 (Figure 2) show a relatively weak 1967 year class (age 2), and Albatross IV survey data indicates low abundance of age 2 in 1970. This projected below average recruitment added to increases in fishing effort points to a continued decline in abundance on both the Southern New England grounds and Georges Bank.
-5-
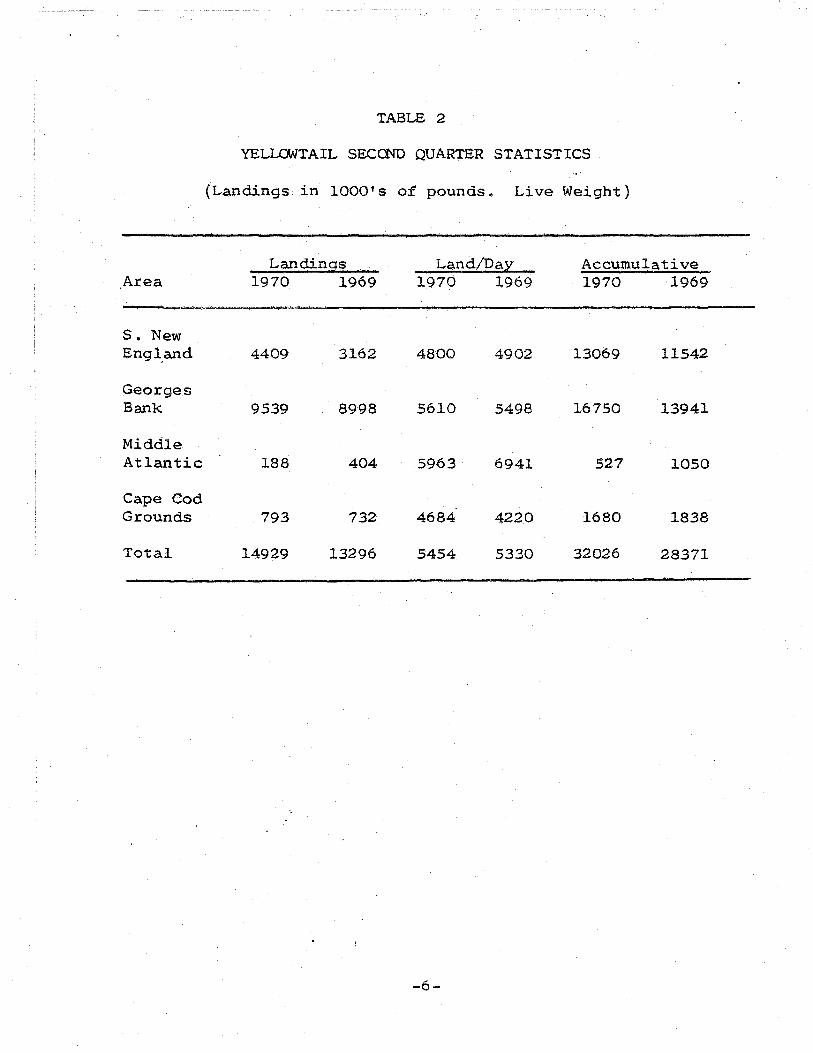
TABLE 2
YELLOWTAIL SECOND QUARTER STATISTICS .. ,.
(Landings in 1000·5 of pounds. Live Weight)
Landings Lan d/D a;z:: Accumulative Area 1970 1969 1970 1969 1970 1969
S. New Engl,and 4409 3162 4800 4902 13069 11542
Georges Bank 9539 8998 5610 5498 16750 13941
Middle Atlantic 188 404 5963 6941 527 1050
Cape Cod Grounds 793 732 4684 4220 1680 1838
Total 14929 13296 5454 5330 32026 28371
-6-

TABLE 3
YELLOWTAIL CATCH FOR THE TWO MAJOR FISHING AREAS
SECOND QUARTER, 1969 and 1970
(Landings in 1000's of pounds. Live Weight)
Food Landings
Estimated Percent Discards
Estimated Discards (lbs.)
Estimated Catch*
Industrial Landings
Total Catch**
Southern New England 1970 1969
4409 3162
34.3 18.9
1512 598
5921 3760·
2646 2978
8567 6738
Georges Bank 1970 1969
9539 8998
43.5 14.1
4149 1269
13688 10267
13688 10267
* Estimated ·catch = food landings + estimated discards.
** Total catch = estimated catch + industrial landings.
-7-

, ,.~ ': , •• ~ •• a 0 .;...
YELLOWTAIL AGE STRUCTURE FROM COMMERCIAL LANDINGS
1969
SO. NEW ENGLAND GEORGES BANt<
300~--------------------~--------------------~
20001-----1'
>-<l 100 0
0::: W C- O
(J) a::: w CD
4000 1960-69 AVERAGE
~ ::::> z
3000
2000r---~~'~------------~--~
Figure 2 -8-,
, ,

COD
Cod landings for the quarter were close to the 1999 second quarter level (Table 4). Landings per day were up considerably from 1969; however, it is doubtful that this portrays a significant increase in abundance of the stock~ Catch per tow on Albatross IV survey cruises indicate a drop in population abundance in 1968 and 1969.
TABLE 4
COD SECOND QUARTER STATISTICS
(Landings in thousands' of pounds. Live Weight)
Area
Georges Bank
Landings 1970 1969
9508 9727
11 Based on Boston OIL's
Land/DayY Accum.u1ative 1970 1969 1970 1969
5068 3265 . 15122 15573
-9-
~".
'/
REDFIsrt'77 , -',
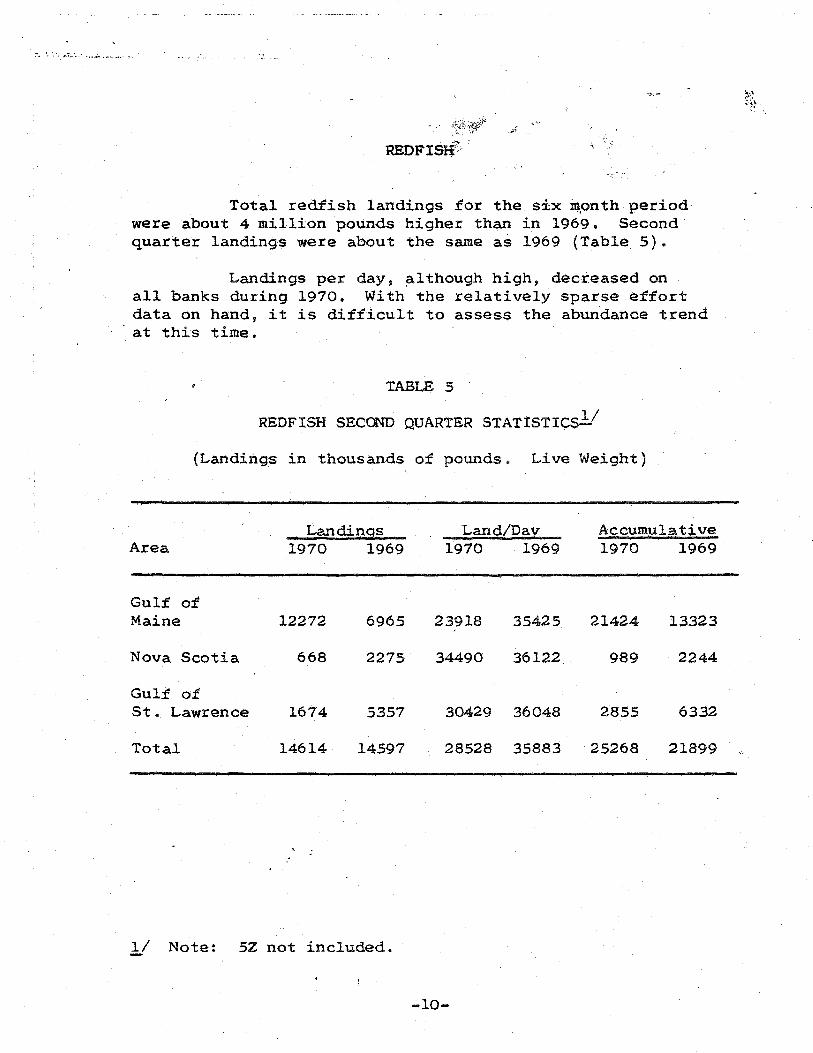
Total redfish landings for the six ~pnth period were about 4 million pounds higher than in 1969. Second quarter landings were about the same as 1969 (Table 5).
Landings per day, ~lthough high, decreased on all banks during 1970. With the relatively sparse effort data on hand, it is difficult to assess the abundance trend
. at this time.
TABLE 5 .
REDFISH SECOND QUARTER STATISTIcslI
(Landings in thousands of pounds. Live Weight)
Area
Gulf of Maine
Nova Scotia
Gulf of St. Lawrence
Total
Landings 1970 1969
12272 6965
668 2275
1674 5357
14614 14597
11 Note: 5Z not included.
Land/Day 1970 1969
23918 35425
34490 36122
30429 36048
28528 35883
-10-
Accumulative 1970 1969
21424 13323
989 2244
2855 6332
25268 21899
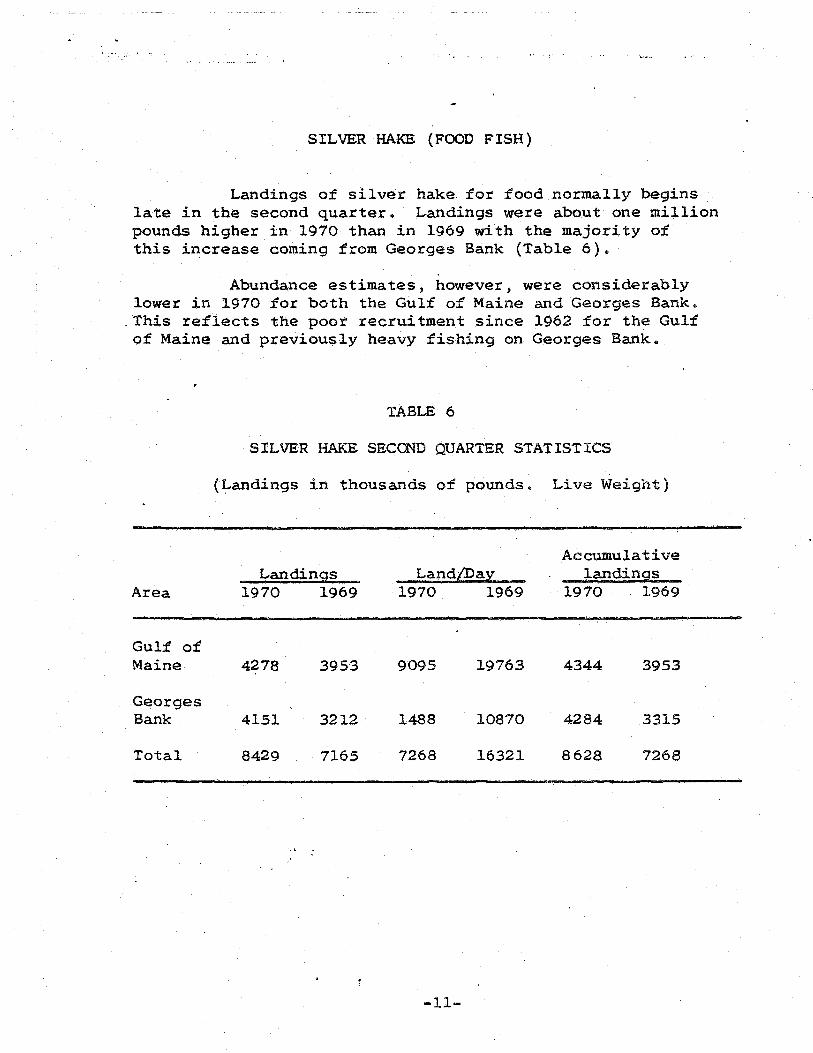
SILVER HAKE (FOOD FISH)
Landings of silver hake for food normally begins late in the second quarter. Landings were about one million pounds higher in 1970 than in 1969 with the majority of this increase coming from Georges Bank (Table 6).
Abundance estimates, however, were considerably lower in 1970 for both the Gulf of Maine and Georges Bank •
. This reflects the poor recruitment since 1962 for the Gulf of Maine and previously heavy fishing on Georges Bank.
Area
Gulf of Maine
Georges Bank
Total
TABLE 6
SILVER HAKE SECOND QUARTER STATISTICS
(Landings in thousands of pounds. Live Weight)
Landings 1970 1969
4278 3953
4151 3212
8429 7165
Land/Day 1970 1969
9095 19763
1488 10870
7268 16321
-11-
Accumulative landings
1970 1969
4344 3953
4284 3315
8628 7268

~"- ... ..
~USTRIAL SPECIES
Total industrial landings for the six month period of 1970 were off 15 million pounds from 1969. ·Second quarter landings for 1970 were 9 million pounds under the same period of 1969, (Table 7). Silver hake landings were down 79 percent for the second quarter, 1970 as ,compared with 1969, while red hake landings declined 20 percent.
Relative abundance of s:i,.lverhake" as measured by Albatross IV surveys, has declined since 1967. There are indications of good year classes in 1968 and 1969 so that abundance could increase by 1971. Measurements of relative abun4ance of red hake indicate a significant decline after 1965 with slow recovery to date. Recruitment has not been good in recent years, thus no increase in abundance is expected through 1970 and 1971.
-12-

.. \ r ...
TABLE 7
rNDUSTRIAL RED AND SILVER HAKE SECOND QUARTER STATISTICS
(Landings in thousands of pounds. Live Weight)
Landings Land/Da~ Accumulative Area - Species 1970 1969 1970 1969 1970 1969
S. New England Red hake 3251 3576 13896 21009 3263 3608
• SiLver hake 455 2056 1971 12077 467 2120 Total Red and Silver hake 3706 5632 15867 33086 3730 5728
Total Industrial 16842 21225 27543 37116
Mid-At Ian t.ic Red hake 36 524 747 10956 83 524 Silver hake 65 403 1370 8428 77 408 Total Red and Silver hake 101 927 2117 19384 160 932
Total Industrial 2050 6546 4125 9322
Total Red hake 3287 4100 13752 19724 3346 4132
Total Silver hake 520 2459 1896 11497 544 2528
Total Industrial 18892 27771 31668 46498
.'