· 2 table of contents agriculture w. kozirok, Ł. fornal, j. drzewiecki – the kernels endosperm...
TRANSCRIPT

PUBLISHER UWMOLSZTYN 2009
(1/2009)24

1
EDITORIAL BOARDJanusz Falkowski (Editor-in-chief), Eugeniusz Biesiadka, Jan Glogowski,
Ryszard Zadernowski, Hans Harms (Germany), Vaclav Matoušek (Czech Republic), Juraj Młynek (Slowak Republic)
Executive editor Agnieszka Orłowska-Rachwał
The Polish Journal of Natural Sciences is indexed and abstractedin Biological Abstracts and Biosis Previews
The Journal is also available (from volume 22) in electronic form. The online edition is hosted by MetaPress (www.metapress.com) in partnership with Versita
(www.versita.com)
PL ISSN 1643-9953
© Copyright by Wydawnictwo Uniwersytetu Warmińsko-MazurskiegoOlsztyn 2009
PUBLISHER UWM OLSZTYN
Addressul. Jana Heweliusza 14,
10-718 Olsztyn-Kortowo, Polandtel. (48) (089) 523 36 61 fax (48) (089) 523 34 38
e-mail: [email protected]
Ark. wyd. 6,7; ark. druk. 5,5, nakład egz. 110Druk – Zakład Poligraficzny UWM w Olsztynie
zam. nr 159

2
TABLE OF CONTENTS
Agriculture
W. KOZIROK, Ł. FORNAL, J. DRZEWIECKI – The Kernels Endosperm Colour of a Longitudinal Section of Malting Barley and the Similarity Amongst Varieties. Part I. The Kernel Endosperm Colour of the Longitudinal Section before Malting ...............................................................................
W. KOZIROK, Ł. FORNAL, J. DRZEWIECKI – The Kernels Endosperm Colour of a Longitudinal Section of Malting Barley and the Similarity Amongst Varieties. Part II. Colour Changes after Germination and Heating .......................................................................................................
D. ZALEWSKI, R. WEBER, J. KACZMAREK – Variation in Leaf Infection of Winter Wheat Cultivars by Fungi of Genus Septoria in Relation to Environmental Conditions ...................................................................
Animal Breeding and Husbandry
V. SVEDAITE, K. LIPIŃSKI, A. FALKOWSKA, D. BARANAUSKIENE, J. KULPYS, R. STANKEVICIUS, R. NAGINIENE – Effect of Selenium and Vitamin E Supplementation on the Quantity and Quality of the Pork Production and Selenium Accumulation in Organism of Fattening Pigs ................
Biology
M. JASTRZĘBSKA, T. SZAREJKO, CZ. HOŁDYŃSKI, W.P. JASTRZĘBSKI – Spe-cies Diversity in Grassland Communities under Different Habitat Conditions ..................................................................................................
Environmental Protection
E. ZĘBEK – Qualitative and Quantitative Changes of Green Algae with Relation to Physiochemical Water Parameters in the Urban Lake Jeziorak Mały .............................................................................................
Fishery
D. ŻARSKI, W. SASINOWSKI, D. KUCHARCZYK, M. KWIATKOWSKI, S. KREJSZEFF, K. TARGOŃSKA – Mass Initial Rearing of Burbot Lota Lota (L.) Larvae under Controlled Conditions .....................................................................
1
14
23
35
43
60
76

3
SPIS TREŚCI
Rolnictwo
W. KOZIROK, Ł. FORNAL, J. DRZEWIECKI – Barwa przekroju podłużnego bielma ziarniaków jęczmienia browarnego a podobieństwo odmianowe. Część I. Barwa bielma przekroju podłużnego ziarniaków jęczmienia browarne-go przed słodowaniem ...............................................................................
W. KOZIROK, Ł. FORNAL, J. DRZEWIECKI – Barwa przekroju podłużnego biel-ma ziarniaków jęczmienia browarnego a podobieństwo odmianowe. Część. II. Zmiany barwy po kiełkowaniu i ogrzewaniu ............................
D. ZALEWSKI, R. WEBER, J. KACZMAREK – Zmienność porażenia liści róż-nych odmian pszenicy ozimej grzybami z rodzaju Septoria w zależności od warunków środowiska .............................................................................
Chów i Hodowla Zwierząt
V. SVEDAITE, K. LIPIŃSKI, A. FALKOWSKA, D. BARANAUSKIENE, J. KULPYS, R. STANKEVICIUS, R. NAGINIENE – Wpływ dodatku selenu i witaminy E na ilość i jakość produkowanej wieprzowiny oraz akumulację selenu w organizmie tuczników .............................................................................
Biologia
M. JASTRZĘBSKA, T. SZAREJKO, CZ. HOŁDYŃSKI, W.P. JASTRZĘBSKI – Różnorod-ność gatunkowa zbiorowisk łąkowo-pastwiskowych w różnych warun-kach siedliskowych .....................................................................................
Ochrona Środowiska
E. ZĘBEK – Zmiany ilościowe i jakościowe zielenic na tle fizyczno-chemicznych parametrów wody w śródmiejskim jeziorze Jeziorak Mały ......................
Rybactwo
D. ŻARSKI, W. SASINOWSKI, D. KUCHARCZYK, M. KWIATKOWSKI, S. KREJSZEFF, K. TARGOŃSKA – Masowy podchów larw miętusa (Lota lota L.) w wa-runkach kontrolowanych ...........................................................................
1
14
23
35
43
60
76

The Kernels Endosperm Colour of a Longitudinal Section of Malting Barley... 1POLISH JOURNAL OF NATURAL SCIENCES Abbrev.: Pol. J. Natur. Sc., Vol 24(1) 1-13, Y. 2009
DOI 10.2478/v10020-009-0001-2
THE KERNELS ENDOSPERM COLOUR OF A LONGITUDINAL SECTION OF MALTING BARLEY
AND THE SIMILARITY AMONGST VARIETIESPART I. THE KERNEL ENDOSPERM COLOUR OF THE LONGITUDINAL
SECTION BEFORE MALTING
Witold Kozirok1, Łucja Fornal1, Jerzy Drzewiecki2
1Chair of Food Plant Chemistry and ProcessingUniversity of Warmia and Mazury in Olsztyn
2Institute of Plant Breeding and Acclimatization in Radzików
K e y w o r d s: malting barley, variety, colour, digital image analysis, endosperm hordeins.
A b s t r a c t
Microstructure of malting barley kernels is one of the most significance factor of malt quality and is determined using simple evaluation of vitreous or mealy areas. The object of investigation was to verify the hypothesis, that the colour of endosperm of malting barley kernels depends of variety. The investigated materials were grains of 13 varieties of malting barley. The similarity of varieties was estimated by the electrophoresis of hordeins. The colour was measured using DIA system LUCIA G. It was found, that only the varieties for which the hordein image differed most (Maresi, Sezam, Granal) also differed in terms of the endosperm colour. The differences were statistically significant at p = 0.05. In majority of investigated varieties the endosperm colour was not specific variety feature, however, they are distinguished by hordein electrophoresis.
BARWA PRZEKROJU PODŁUŻNEGO BIELMA ZIARNIAKÓW JĘCZMIENIA BROWARNEGO A PODOBIEŃSTWO ODMIANOWECZĘŚĆ I. BARWA BIELMA PRZEKROJU PODŁUŻNEGO ZIARNIAKÓW
JĘCZMIENIA BROWARNEGO PRZED SŁODOWANIEM
Witold Kozirok1, Łucja Fornal1, Jerzy Drzewiecki2
1 Katedra Przetwórstwa i Chemii Surowców RoślinnychUniwersytet Warmińsko-Mazurski w Olsztynie
2 Instytut Hodowli i Aklimatyzacji Roślin w Radzikowie
S ł o w a k l u c z o w e: jęczmień browarny, odmiana, barwa, cyfrowa analiza obrazu, hordeiny bielma.
1Address: Łucja Fornal, University of Warmia and Mazury, pl. Cieszyński 1, 10-726 Ol-sztyn, Poland, phone: +48 (089) 523 37 70, e-mail: [email protected]

2 Witold Kozirok, Łucja Fornal, Jerzy Drzewiecki
A b s t r a k t
Mikrostruktura ziarniaków jęczmienia browarnego jest jedną z ważnych cech jakości sło-du. Najczęściej oznacza się ją jako występowanie obszarów szklistych lub mączystych bielma. Celem badań było zweryfikowanie hipotezy, czy barwa bielma jęczmienia browarnego jest ce-chą odmianową. Badano 13 odmian jęczmienia browarnego o różnej jakości słodowniczej. Po-dobieństwo odmianowe określano na podstawie elektroforetycznego rozdziału hordein. Barwę oznaczano, stosując wizyjną analizę obrazu – system LUCIA G. Stwierdzono, że tylko odmia-ny o wyraźnie różniącym się rozdziale elektroforetycznym hordein (Maresi, Sezam, Granal) różniły się również barwą bielma. Różnice były istotne statystycznie dla p = 0,05. Barwa biel-ma pozostałych badanych odmian, mimo różnic w obrazie elektroforetycznym, nie wykazywała różnic istotnych statystycznie.
Introduction
Malting barley is a raw material which has to meet specific and complex requirements concerning its quality. It is tested both for its chemical and biological properties. Currently, more and more attention is being paid to the relationship between the microstructure of grains and their significance in building malt quality (PALMER 1992). The structural features of barley endosperm are commonly determined by the degree of mealness or steelness (CHANDRA et al. 1999, BROADBENT, PALMER 2001, KOLIATSON, PALMER 2003). The structural differences depend mainly from the concentration of proteins and β glucans in endosperm. In grain in which vitreous areas dominate, the concentration of protein in endosperm increases, whereas in grain with mealy endosperm, protein is located much more in the germ and aleuronic layer. EDNEY et al. (1998) claim however, that a high content of β glucans in barley does not determine its high content in beer. The content of β glucans in malt or in congress wort is a much better determinant. Therefore, the strains with high β-glucan content in grain should not be discarded in breeding research. The structure of endosperm is not constant and is affected by the content of protein, starch and β-glucans; it primarily affects the water translocation during the process of soaking and enzyme activity (PETR et al. 2000, ALTUNKAYA et al. 2001). MAC GREGOR (1996) claims that the methods of molecular biology and biotechnology may be useful in improving the quality of grain in term of malt-enzymes activity and content of their substrates. The structure of endosperm and creating abnormal grain is also largely and adversely affected by climatic conditions during the grain ripening period. This phenomenon may limit the use of varieties of malting barley in malting. Numerous abnormal grain features can be eliminated in early--ripening varieties (BAUMER et al. 1998). The complexity of relationships in the high quality malt production process requires a constant checking of the raw material quality. Steelness or mealness of endosperm corresponds to its specific colour. Determining the colour of endosperm in a cross-wise or longitudinal section is made possible, e.g. by a digital image analysis (GUDACZEWSKI, FORNAL 1998, UTKU, KOKSEL 1998, MAJUMDAR, JAYAS 2001,

The Kernels Endosperm Colour of a Longitudinal Section of Malting Barley... 3
KOLIATSON, PALMER 2003, KOZIROK, FORNAL 2004). The characteristic features of endosperm structure and its relationship with malting quality of a variety are not widely investigated issues. It is also suggested that the hardness of endosperm or its mealiness can be used in predicting the malt quality and in characterising barley endosperm for a particular variety (GARCIA MORAL DEL et al. 1998, CHANDRA et al. 1999).
The object of investigation was to verify the hypothesis that the colour of endosperm of longitudinal section of malting barley grain may be a variety-dependent feature. Does the similarity of hordeins and varieties determine the possibility to distinguish the varieties based on the colour of endosperm, i.e. in varieties similar in terms of hordeins the colour of endosperm is similar, which makes them impossible to distinguish, and, conversely, distant varieties have endosperm of different colour?
Materials and Methods
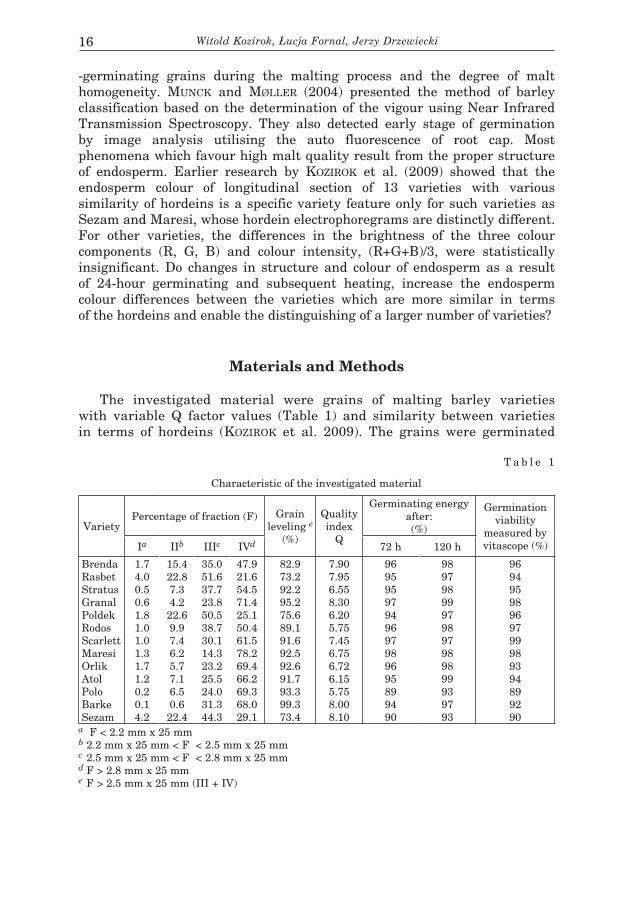
The investigated materials were the grains of dominating by size fraction of 13 varieties malting barley, different in terms of the value of the malting quality factor Q (Table 1). The size of grain and its germination viability was determined according to Polish Standards (Jęczmień... PN-R-74110 Barley – Test methods).
T a b l e 1
Characteristic of the investigated material
VarietyPercentage of fraction (F) Grain
leveling e
(%)
Quality index
Q
Germinating energy after:
(%)Germination vi-ability measured by vitascope (%)
Ia IIb IIIc IVd 72 h 120 h
BrendaRasbetStratusGranalPoldekRodosScarlettMaresiOrlikAtolPoloBarkeSezam
1.74.00.50.61.81.01.01.31.71.20.20.14.2
15.422.87.34.222.69.97.46.25.77.16.50.622.4
35.051.637.723.850.538.730.114.323.225.524.031.344.3
47.921.654.571.425.150.461.578.269.466.269.368.029.1
82.973.292.295.275.689.191.692.592.691.793.399.373.4
7.907.956.558.306.205.757.456.756.726.155.758.008.10
96959597949697989695899490
98979899979897989899939793
96949598969799989394899290
a F < 2.2 mm x 25 mm.b 2.2 mm x 25 mm < F < 2.5 mm x 25 mm c 2.5 mm x 25 mm < F < 2.8 mm x 25 mmd F > 2.8 mm x 25 mme F > 2.5 mm x 25 mm (III + IV)

4 Witold Kozirok, Łucja Fornal, Jerzy Drzewiecki
Q – the indicator of barley malting quality, including five features with the following weight factors: – extraction ability of malt (Wi = 0.45)– wort viscosity (Wi = 0.25)– the degree of final attenuation of wort (Wi = 0.15)– Kolbach number (Wi = 0.10)– diastatic activity (Wi = 0.05)
is calculated from the following equation:
Q = Σ [(parameter class)i x Wi]where:
Wi = weight factor of a parameter
Estimation of colour
The colour of endosperm longitudinal sections was determined with a system of image analysis, consisting of a CCD Panasonic GP-KR222E camera, 1044 dpi. The light source was BOB OM 100x1 (BOB Manufacture, Poland) with 2x100 W (60 kLx) optic fiber lamps (OSRAM), a computer with a VFG card for image analysis and LUCIA G ver. 4.6 (Laboratory Universal Computer Image Analysis) software package delivery by Laboratory Imaging Ltd. The brightness for each component RGB (Red – Green – Blue) and colour intensity, (R+G+B)/3, were determined in the scale from 0 to 255 numbers of brightness, formulate as grey levels for R, G, B components. The analyses were conducted on 100 kernels of each variety. The results of endosperm colour analysis were presented in the form of histograms showing average value of grey levels versus
Fig. 1. The schedule of analytical procedure
grains
screening by size
dominated fraction
histograms of investigated feature
digital image analysisof longitudinal section

The Kernels Endosperm Colour of a Longitudinal Section of Malting Barley... 5
its frequency of occurrence. The schedule of the analytical procedure is presented in Figure 1, and the example of images in Figure 2.
The experimental results were analysed statistically using STATISTICA 6.0 software. The calculations were performed at the significance level of p = 0.05.
Fig. 2. The images of longitudinal sections of malting barley kernels
POLO MARESI SCARLETT
Electrophoretic analysis of hordeins
Hordeins were extracted from single grains (50 for each variety) with 150 μl of a solution of urea with 1% of 2-mercaptoethanol. The extraction was performed overnight, at room temperature; in the morning 50 μl of increasing density solution was added to the test tubes. The supernatant was centrifuged at 18.000 × g for 5 min.
The separation was done in a Hoeffer SE 600 apparatus, using so-called ‘discontinuous’ electrophoresis in 7% polyacrylamide gel, pH 3.1. The process of electrophoresis of wheat gliadins (BRZEZIŃSKI et al. 1989) was slightly modified by replacing the water component in both gels with 4.44 M urea solution.
The anode (+) buffer consisted of 0.02M solution of HCOOH and 0.0005M K2SO4. The cathode (+) buffer was a 0.8 M solution of HCOOH. 8–12 μl of a protein solution applied on gels. The separation was conducted simultaneously in four gels (180 mm x 160 mm x 1.5 mm) 15 min. at 100 V, and subsequently at a voltage over 300 V until the methyl green had reached the apparatus edge. The gels were fixed and stained with 0.0002% (w/v) solution of Coomassie Brillant Blue (CBB) G 250. The composition of the CBB solution: 60 g TCA, 200 cm3 99.8% methanol, 70 cm3 glacial acetic acid and 800 cm3 water. The gels were destained in 0.5% detergent solution, rinsed in water and scanned in an Agfa Snapscan 1236 apparatus.
The analysis of the similarity of varieties
The spectra of 13 varieties were analysed in 16 spectral lanes “paths”; 13 of them representing the electrophoregram of hordeins of one grain of each variety and additionally for the Rodos, Polo and Sezam varieties, the second lane (path) for the spectrum of hordeins of the second grain

6 Witold Kozirok, Łucja Fornal, Jerzy Drzewiecki
(Figure 3). The analysis of polymorphism was conducted. Additionally, the repeatability of the hordein image was evaluated (only for the varieties of Rodos, Polo and Sezam). The similarity of hordeins, in the form of similarity coefficients (GS), NEI and LI (1979) was determined with the use of the BIO-GENE ver. 99 computer program, developed by Vilber Lourmat. This was done for all possible combinations of pairs of varieties; a similarity matrix for those varieties was also generated. A dendrogram was created based on the similarity matrix (GS x 100) by UPGMA algorithm.
Fig. 3. Electrophoregram of hordeins of 13 malting barley varieties. Samples in lanes (from left to right): 1 – Barke, 2 – Granal, 3 – Rodos „I”, 4 – Maresi, 5 – Polo „I”, 6 – Scarlett, 7 – Atol,
8 – Rasbet, 9 – Poldek, 10 – Brenda, 11 – Stratus, 12 – Sezam „I”, 13 – Orlik, 14 – Sezam „II”, 15 – Rodos „II”, 16 – Polo „II”. The zones of protein pattern are markes as C (C – hordeins)
and B (B-hordeins). Rodos „I”, Polo „I” and Sezam „I” means the electrophoregram of hordeins extracted from first grain, Rodos „II”, Polo „II” and Sezam „II” means
the electrophoregram of hordeins extracted from the second grain
1 2 3 4 5 6 7 8 9 10 11 12 13 14 15 16
C
B
Results and Discussion
Colour characteristics of the endosperm of longitudinal sections
The brightness formulate as the frequency of occurrence of the average values of grey levels corresponding to the red (R), green (G) and blue (B) colour showed both the similarities and differences amongst varieties (Table 2). The most frequent occurrence of grey levels from 161

The Kernels Endosperm Colour of a Longitudinal Section of Malting Barley... 7
to 200 corresponded to the intensity of red colour (Table 2). Amongst the investigated varieties, lower grey levels dominated in the endosperm colour of Granal and Rasbet varieties, and the higher levels – in Barke, Polo, Scarlett, Orlik, Rodos, Atol and Poldek varieties. The highest grey levels occurred in Stratus, Brenda, Sezam and Maresi varieties (Table 2).
In the case of green colour, the grey levels from 141 to 190 dominated (Table 2). The lowest grey levels were observed for the endosperm colour of Granal, Rasbet, Rodos and Poldek varieties. Higher grey levels which corresponded to green colour were characteristic of the Polo, Stratus, Rodos, Atol, Brenda, Barke, Sezam, Scarlett, Orlik and Brenda varieties. The highest grey levels – 181–190 – was noted for the Maresi variety.
T a b l e 2
Characteristic of the endosperm colour of malting barley
Range of grey levels
Varieties
Brenda Rasbet Stratus Granal Poldek Rodos Barke Sezam Scarlett Maresi Orlik Atol Polo
Number of red (R) component (%)
141–150 0 1 0 3 4 5 0 0 0 0 1 1 2
151–160 1 16 4 14 11 15 2 0 4 0 4 13 6
161–170 11 47 7 52 39 33 18 2 16 0 19 23 34
171–180 35 31 37 26 43 36 51 11 51 6 37 34 38
181–190 42 5 44 5 3 9 28 35 28 26 31 20 19
191–200 9 0 8 0 0 2 1 47 1 44 7 7 1
201–210 2 0 0 0 0 0 0 5 0 24 1 1 0
211–220 0 0 0 0 0 0 0 0 0 0 0 1 0
Number of green (G) component (%)
121–130 0 1 2 3 2 3 0 0 0 0 1 0 0
131–140 0 15 2 18 19 14 1 0 0 0 0 7 2
141–150 12 55 14 58 44 37 7 3 7 0 10 24 20
151–160 40 26 50 18 34 36 43 16 31 1 29 32 37
161–170 39 3 29 3 1 8 45 48 48 15 42 28 37
171–180 9 0 3 0 0 2 4 30 13 35 15 7 3
181–190 0 0 0 0 0 0 0 3 1 43 3 1 1
191–200 0 0 0 0 0 0 0 0 0 6 0 1 0
Number of blue (B) component (%)
81–90 0 16 2 13 19 4 0 1 0 0 1 5 2
91–100 12 68 18 48 49 34 1 7 7 0 9 22 14
101–110 42 15 49 31 30 38 18 37 41 2 32 35 45
111–120 38 1 30 6 2 22 58 39 43 21 47 33 36
121–130 8 0 1 2 0 2 23 15 9 53 10 3 3
131–140 0 0 0 0 0 0 0 1 0 24 1 1 0
141–150 0 0 0 0 0 0 0 0 0 0 0 1 0

8 Witold Kozirok, Łucja Fornal, Jerzy Drzewiecki
In terms of the intensity of blue colour, very low and low grey levels from 91 to 130 dominated (Table 2). Very low grey levels occurred the most frequently for the Granal, Rasbet and Poldek varieties.
The analysis of the endosperm colour intensity, (R+G+B)/3, for the investigated varieties indicated the dominating occurrence of the grey levels from 131 to 160 (Table 3). The colour of the endosperm of the Maresi variety is an exception, as it is dominated by the grey levels from 161 to 180. Exemplary histograms of varieties pairs with diversified colour
T a b l e 3
Characteristic of the endosperm colour intensity, (R+G+B)/3, of malting barley (%)
Range of grey levels
Varieties
Brenda Rasbet Stratus Granal Poldek Rodos Barke Sezam Scarlett Maresi Orlik Atol Polo
111–120 0 1 0 3 3 2 0 0 0 0 1 0 0
121–130 0 12 4 12 13 9 1 0 0 0 1 8 2
131–140 10 59 11 56 44 35 4 3 8 0 12 23 24
141–150 40 27 44 23 38 38 38 16 38 2 33 38 39
151–160 41 1 39 6 2 14 50 49 46 18 41 24 31
161–170 8 0 2 0 0 2 7 30 8 45 11 5 4
171–180 1 0 0 0 0 0 0 2 0 33 1 1 0
181–190 0 0 0 0 0 0 0 0 0 2 0 1 0
intensity included Sezam – Granal, Sezam – Maresi, Sezam – Polo, Maresi – Polo, Maresi – Scarlett or Maresi – Brenda are presented in Figure 4. For the other varieties, the histograms of the endosperm colour intensity were poorly diversified. The intensity of the endosperm colour does not distinguish such varieties as Scarlett, Brenda or Sezam (Figure 4).
The analysis of statistical significance differences of intensity for red, green and blue colours showed that only the Maresi variety is significantly different from the other varieties in terms of each of the investigated components of the endosperm colour (R, G, B and (R+G+B)/3), the Sezam variety – in terms of R, G and (R+G+B)/3 parameters, the Rodos variety – in terms of G and (R+G+B)/3 parameters, and the Granal variety – only in terms of B parameter (Table 4). In the case of the other varieties, there is no differentiating specific component of the endosperm colour (R, G, B or (R+G+B)/3). However, in this group there are distinguishable varieties, statistically different in terms of one (or more) parameters, e.g. Brenda and Rasbet, Rasbet and Stratus, Rodos and Barke are different – for all the parameters, Orlik and Atol – in terms of G, B and (R+G+B)/3, and Granal and Poldek – in terms of the B parameter (Table 4).

The Kernels Endosperm Colour of a Longitudinal Section of Malting Barley... 9
Fig
. 4. H
isto
gram
s of
th
e m
alti
ng
barl
ey e
ndo
sper
m c
olou
r of
lon
gitu
din
al s
ecti
ons,
dep
endi
ng
on t
he
vari
ety:
a –
Gra
nal
, Sez
am, S
carl
ett,
b
– M
ares
i, P
olo,
Sez
am, c
– M
ares
i, S
carl
ett,
Bre
nda
;*
ran
ge o
f br
igh
tnes
s le
vels
0
10
20
30
40
50
60
150
Xre
d
0
10
20
30
40
50
60
Xgre
en
010
20
30
40
50
60
Xb
lue
Xred
Xg
reen
Xb
lue
Xred
Xg
reen
Xb
lue
(R+
G+
B)/
3
0
10
20
30
40
50
60
Gra
nal
Sez
amS
carl
ett
(R+
G+
B)/
3
Mar
esi
Sca
rlet
tB
renda
(R+
G+
B)/
3
Mar
esi
Polo
Sez
am
0
10
20
30
40
50
60 0
10
20
30
40
50
60 0
10
20
30
40
50
60 0
10
20
3040
50
60
0
10
20
30
40
50
60 0
10
20
30
40
50
60 0
10
20
30
40
50
60 0
10
20
30
40
50
60
number(%) number(%) number(%) number(%)
number(%) number(%) number(%) number(%)
number(%) number(%) number(%) number(%)
ab
c
71–80
81–90
91–100
101–110
111–120
121–130
131–140
141–150
151–160
161–170
171–180
181–190
191–200
201–210
211–220
221–230*
71–80
81–90
91–100
101–110
111–120
121–130
131–140
141–150
151–160
161–170
171–180
181–190
191–200
201–210
211–220
221–230*
71–80
81–90
91–100
101–110
111–120
121–130
131–140
141–150
151–160
161–170
171–180
181–190
191–200
201–210
211–220
221–230*

10 Witold Kozirok, Łucja Fornal, Jerzy Drzewiecki
The electrophoretic characteristics of hordeins
The electrophoregrams of hordeins for all the investigated varieties, were uniform (one-line). The image for hordeins from two single grains of the Rodos, Polo and Sezam varieties is identical (Figure 3). The line spectra consisted of 28 to 36 lines, depending on the variety. The most significant differences (the highest polymorphism) were observed for
T a b l e 4
Results of statistical analysis
Variety R G B (R+G+B)/3
Brenda 180f 160d 110ef 150de
Rasbet 168a 147a 95a 137a
Stratus 180ef 157c 106cd 148cd
Granal 167a 146a 99b 137a
Poldek 169a 147a 96a 137a
Rodos 169a 150b 104c 141b
Barke 176cd 160d 116g 151e
Sezam 190g 167f 112f 156f
Scarlett 176cd 163e 111f 150de
Maresi 194h 179g 126h 166g
Orlik 177de 162e 111f 150e
Atol 174bc 156c 106cd 146c
Polo 172b 158cd 108de 146c
a, b, c, d… – mean value followed by the same letter are not significantly different at α = 0.05
T a b l e 5
Genetic similarity coefficients are shown as whole numbers (GS x 100)
Variety Barke Granal Rodos Maresi Polo Scarlett Atol Rasbet Poldek Brenda Stratus Sezam Orlik
Barke 100Granal 88 100Rodos 80 79 100Maresi 73 81 70 100Polo 76 69 74 67 100Scarlett 79 75 77 83 76 100Atol 80 75 81 77 76 86 100Rasbet 75 73 78 71 74 81 84 100Poldek 83 92 74 83 71 77 77 72 100Brenda 83 92 73 83 70 76 77 71 97 100Stratus 75 73 81 71 74 78 88 82 72 71 100Sezam 59 63 66 68 63 63 66 67 66 68 63 100Orlik 78 77 85 75 81 84 85 86 75 75 89 67 100

The Kernels Endosperm Colour of a Longitudinal Section of Malting Barley... 11
hordeins C. Electrophoretic images of hordeins enabled the distinguishing of all the investigated varieties. The Brenda and Poldek varieties proved the most similar in terms of hordeins, with a similarity of 97%, followed by the Granal variety in relation to Poldek and Brenda (92% each). For most varieties, the degree of similarity was approximately 60–80% (Table 5). The most genetically distant varieties are Sezam and Maresi (Figure 3).
The similarity of hordeins and the similarity of endosperm colour
The degree of similarity of varieties (based on hordein feature) is not always associated with the significance of endosperm colour differences. The Brenda and Poldek varieties, for which the electrophoregrams are virtually undistinguishable, are significantly different in terms of the endosperm colour. Conversely, such varieties as Brenda and Stratus, Atol and Polo, Orlik and Scarlett, are easily distinguishable with hordein electrophoresis, whereas the colour of their endosperm is identical (Figure 3, Table 4).
However, it is highly characteristic that the varieties which are the most different in terms of the hordein image – Maresi and Sezam – are also among those statistically different from all the other varieties in terms of the endosperm colour (Maresi is totally different for all the parameters R, G, B, (R+G+B)/3, Sezam – for three of them, Table 4). The endosperm colour for these varieties may be considered a specific “marker” for a given variety, like a hordein image.
It is advisable that an investigation should be conducted with the material of those three varieties, collected in different agrotechnical and climatic conditions, and subsequently for a larger number of varieties. If the endosperm colour for the grain of Maresi, Sezam and Granal varieties was a persistent feature, it would be possible to use its measurement for routine evaluation of grain in the malting industry – for verifying variety identity, genetic purity and even for identification of varieties.
The research conducted by DRZEWIECKI et al. (2000) showed that the geometric features of grain (length, width) are differentiating factors for three out of the seven varieties. No connection was found between the degree of similarity of hordeins and the identification of varieties based on the geometric features of grains. Research into endosperm colour reveals that for varieties which are genetically distant, it may be possible to distinguish them based on other features, in this case – endosperm colour. It may be an argument for a greater use of this feature in malting. It may be easier to select varieties and reduce the number of samples for image analysis, which is not insignificant from a technical and economic point of view.
The results of the current research justify the claim that the sensitivity of image analysis of endosperm colour is sufficient to classify varieties

12 Witold Kozirok, Łucja Fornal, Jerzy Drzewiecki
into groups of genotypes of non-specific (non-distinguishing) and specific (distinguishing) endosperm colour. It may be assumed that investigation with a larger number of genotypes would confirm the specificity of endosperm colour for only some forms.
Conclusions
The endosperm colour in the Maresi variety can be a specific, statistically significantly different feature for each of the four analysed colour components (R, G, B and (R+G+B)/3). The endosperm colour in the Sezam, Rodos and Granal varieties is not specific for all the colour components; however, it can be used as a variety characteristic in terms of at least one colour component. The endosperm colour in the Brenda, Rasbet, Stratus, Poldek, Scarlett, Barke, Orlik, Atol and Polo varieties is not a specific variety feature. The method used to measure the endosperm colour enables the variety identity verification of barley grain to a limited extent – some varieties may be distinguished from each other. The varieties for which the hordein image differs most – Maresi, Sezam and Granal – also differ most in terms of the endosperm colour. A larger genetic distance between varieties can enable distinguishing some varieties by measuring the endosperm colour. Similarity in endosperm colour between varieties is not always associated with similarity of hordeins. It is advisable that more research should be conducted with other varieties in order to confirm the specificity of endosperm colour of the Maresi, Sezam and Granal varieties.
Translated by Joanna Jensen Accepted for print 3.02.2009
References
ALTUNKAYA A., CELIK S., YALÇIN E., KÖKSEL H., ÖZKARA R. 2001. Effects of genotype and environ-ment on malt β-glucanase activity. J. Inst. Brew., 107(1): 27–30.
BAUMER M., GROBMANN O., MIEDANER H., GRAF H., SACHER B. 1998. Kornanomalien bei Braugerste – Begriffsbestimmung und Bewertung. Monatsschrift fur Brauwissenschaft, 11/12: 176–188.
BROADBENT R.E., PALMER G.H. 2001. Relationship between β-amylase activity, steeliness, meali-ness, nitrogen content and the nitrogen fractions of the barley grain. J. Inst. Brew., 107(6): 349–354.
BRZEZIŃSKI W., GELDER W.M.J. VAN, MENDELEWSKI P., KOLSTER P. 1989. Polyacrylamide gel elec-trophoresis of wheat gliadins: the use of moving boundary for improved resolution. Euphyti-ca, 40: 207–212.
CHANDRA G.S., PROUDLOVE M.O., BAXTER E. D. 1999. The structure of barley endosperm – An im-portant determinant of malt modification. J. Sci. Food Agric., 79: 37–46.
DRZEWIECKI J., FORNAL Ł., FILIPOWICZ A., KONOPKA S. 2000. Comparison of computer image ana-lysis and used soluble proteins electrophoresis for identyfication of malting barley varieties. Plant Varieties Seeds, 13: 159–171.

The Kernels Endosperm Colour of a Longitudinal Section of Malting Barley... 13
EDNEY M.J., LA BERGE D.E., LANGRELL D.E. 1998. Realationships among the β-glucan contents of barley, malt, malt congress extract, and beer. J. Am. Soc. Brew. Chem., 56(4): 164–168.
GARCIA MORAL L.F. DEL, SOPENA A., MONTOYA J.L., POLO P., VOLTAS J., CODESAL P., RAMOS J.M., MOLINA-CANO J.L. 1998. Image analysis of grain and chemical composition of the barley plant as predictors of malting quality in Mediterranean environment. Cereal Chem., 75(5): 755–761.
GUDACZEWSKI W., FORNAL Ł. 1998. Surface and cross sectional optical density of wheat grain as discriminant of wheat variety classification. Pol. J. Food Nutr. Sci., 7/48(2): 131–136.
Jęczmień. Metody badań. PN-R-74110: 1998.KOLIATSON M., PALMER G.H. 2003. A new method assess mealness and steelness of barley varieties
and relations of mealness with malting parameters. J. Am. Brew. Chem., 61(3): 114–118.KOZIROK W., FORNAL Ł. 2004. Jakość słodownicza odmiany a zmiany barwy przekroju podłużnego
jęczmienia browarnego w czasie moczenia. Pam. Puł., 135: 101–112.MAC GREGOR A.W. 1996. Malting and brewing science: challenges and opportunities. J. Inst.
Brew., 102: 97–102, MAJUMDAR S., JAYAS D.S. 2001. Classification of cereal grains using machine vision: II. Color
models. Trans. ASAE, 43(6): 1677–1680. Nei M., Li W.H. 1979. Mathematical model for studying genetic variation in terms of restriction
endonucleases. Proceedings of the National Academy of Science, USA, 76: 5269–5373. PALMER G.P. 1992. Cereal science and malting technology – the future. J. Am. Soc. Brew. Chem.,
50(4): 121–130.PETR J., ŠKEŘNIK J., PSOTA V., LANGER I. 2000. Quality of malting barley grown under different
cultivation system. Monatsschrift fűr Brauwissenschaft, 5/6: 90–94.UTKU H., KOKSEL H. 1998. Clasification of barley based on malting quality by image analysis.
J. Food Eng., 36: 385–394.
14 Witold Kozirok, Łucja Fornal, Jerzy DrzewieckiPOLISH JOURNAL OF NATURAL SCIENCES Abbrev.: Pol. J. Natur. Sc., Vol 24(1) 14-22, Y. 2009
DOI 10.2478/v10020-009-0002-1
THE KERNELS ENDOSPERM COLOUR OF A LONGITUDINAL SECTION OF MALTING BARLEY
AND THE SIMILARITY AMONGST VARIETIESPART II. COLOUR CHANGES AFTER GERMINATION AND HEATING
Witold Kozirok1, Łucja Fornal1, Jerzy Drzewiecki2
1Chair of Food Plant Chemistry and ProcessingUniversity of Warmia and Mazury in Olsztyn
2Institute of Plant Breeding and Acclimatization in Radzików
K e y w o r d s: malting barley, variety, endosperm colour, digital image analysis.
A b s t r a c t
The previous of our research showed that the endosperm colour of 13 varieties depends of differences in similarity of hordeins. The endosperm colour is not specific for varieties of high similarities of hordeins. Do changes in microstructure of endosperm as a result of 24 hours germinating and heating increase the differences of colour amongst varieties which are more similar in hordeins electrophoregrams. The endosperm colour of 13 varieties was measured using DIA System LUCIA G. It was proved that germinating and heating significant differences in colour of endosperm of some varieties with highly similar hordeins. It suggests the possibility of evaluating the variety uniformity of malting barley batch, as well as predicting the malting quality of grains using evaluation of endosperm colour after one day germinating and heating of grains.
BARWA PRZEKROJU PODŁUŻNEGO BIELMA ZIARNIAKÓW JĘCZMIENIA BROWARNEGO A PODOBIEŃSTWO ODMIANOWE
CZĘŚĆ. II. ZMIANY BARWY PO KIEŁKOWANIU I OGRZEWANIU
Witold Kozirok1, Łucja Fornal1, Jerzy Drzewiecki2
1Katedra Przetwórstwa i Chemii Surowców RoślinnychUniwersytet Warmińsko-Mazurski w Olsztynie
2Instytut Hodowli i Aklimatyzacji Roślin w Radzikowie
S ł o w a k l u c z o w e: jęczmień browarny, odmiana, barwa bielma, wizyjna analiza obrazu.
A b s t r a c t
W zamieszczonych w części I pracy badaniach wykazano, że barwa bielma 13 odmian jęczmienia browarnego zależy od różnic w podobieństwie hordein. Barwa bielma nie jest za-tem specyficzna dla odmian o dużym podobieństwie hordein. Celem badań było zweryfikowa-nie hipotezy, czy zmiany w mikrostrukturze bielma, spowodowane 24 godz. kiełkowaniem, a następnie ogrzewaniem, mogą zwiększyć różnice w barwie odmian o dużym podobieństwie hordein. Barwę oznaczano, stosując wizyjną analizę obrazu system LUCIA G. Wykazano,
1Address: Łucja Fornal, University of Warmia and Mazury, pl. Cieszyński 1, 10-726 Ol-sztyn, Poland, phone: +48 (089) 523 37 70, e-mail: [email protected]

The Kernels Endosperm Colour of a Longitudinal Section of Malting Barley... 15
że kiełkowanie i ogrzewanie wyraźnie zwiększa różnice w barwie bielma niektórych odmian. Sugeruje to możliwość wstępnej oceny jednolitości odmianowej jęczmienia browarnego, a tak-że przewidywanie jakości słodowniczej, z zastosowaniem pomiaru barwy bielma, po 1-dnio-wym kiełkowaniu i ogrzewaniu.
Introduction
Structural features of the endosperm of the malting barley endosperm are specific for the species and varieties and depend largely on environment conditions (CHANDRA et al. 1999). To some extent these features result from the low value of protein content required, which reduces the share of steelness area in the endosperm structure (KOZIROK et al. 2009). However, AGU and PALMER (1998) proved that grains of malting barley with a higher nitrogen content are better able to produce β-amylase, while low nitrogen content indicates more intense β- and α-amylase synthesis during the malting process. The authors stress that the relationship is difficult to understand and is probably connected with the ability of endosperm to modification during the malting process. SCHROEDER and MACGREGOR (1998) have shown that the activity of α-amylase grows rapidly after 24 hours of germinating what means that the secreting of α-amylase from the aleuronic layer may be expected in early stages of germinating. Unlike α-amylase, limiting dextrinase, though synthesised in the aleuronic layer, moves more slowly towards the starch endosperm. Another important phenomenon, associated with attenuation, is the production of endo β-glucanase and a change in β glucan content. ALLOSIO-OURNIER et al. (2000), using high-performance ion-exchange chromatography (HPAEC), found an increasing content of arabinose, glucose and sucrose after soaking of grain of 5 varieties of malting barley. This indicated a rapid decomposition of macromolecular polysaccharides during the germinating process. Also, an increasing content of maltose in grains of some varieties, indicated the partial decomposition of starch. WALKER et al. (2001) assumed that the degree of decomposition of cell walls is closely linked with the malting quality of a variety. Based on this, they demonstrated that the contents of β glucan after 2 days of germinating may be an indicator of potential extractive ability of malt obtained from a particular variety.
The above research concerns the links between chemical composition, enzymatic activity, the quality of endosperm structure, the degree of endosperm attenuation and predicting the technological quality of varieties of malting barley. The evaluation of malting barley quality is made possible by Carlsberg Seed Fixation System tests (AASTRUP 1988) and others. An improved version of this test, using digital image analysis (DIA) and a Calcoflour Test was presented by REINIKAINEN et al. (1996). They showed that it is possible to use DIA to determine the content of sprouted grains in malting barley, water distribution during soaking, content of non-
16 Witold Kozirok, Łucja Fornal, Jerzy Drzewiecki
-germinating grains during the malting process and the degree of malt homogeneity. MUNCK and MØLLER (2004) presented the method of barley classification based on the determination of the vigour using Near Infrared Transmission Spectroscopy. They also detected early stage of germination by image analysis utilising the auto fluorescence of root cap. Most phenomena which favour high malt quality result from the proper structure of endosperm. Earlier research by KOZIROK et al. (2009) showed that the endosperm colour of longitudinal section of 13 varieties with various similarity of hordeins is a specific variety feature only for such varieties as Sezam and Maresi, whose hordein electrophoregrams are distinctly different. For other varieties, the differences in the brightness of the three colour components (R, G, B) and colour intensity, (R+G+B)/3, were statistically insignificant. Do changes in structure and colour of endosperm as a result of 24-hour germinating and subsequent heating, increase the endosperm colour differences between the varieties which are more similar in terms of the hordeins and enable the distinguishing of a larger number of varieties?
Materials and Methods
The investigated material were grains of malting barley varieties with variable Q factor values (Table 1) and similarity between varieties in terms of hordeins (KOZIROK et al. 2009). The grains were germinated
T a b l e 1
Characteristic of the investigated material
VarietyPercentage of fraction (F) Grain
leveling e
(%)
Quality index
Q
Germinating energy after:(%)
Germination viability
measured by vitascope (%)Ia IIb IIIc IVd 72 h 120 h
BrendaRasbetStratusGranalPoldekRodosScarlettMaresiOrlikAtolPoloBarkeSezam
1.74.00.50.61.81.01.01.31.71.20.20.14.2
15.422.87.34.222.69.97.46.25.77.16.50.622.4
35.051.637.723.850.538.730.114.323.225.524.031.344.3
47.921.654.571.425.150.461.578.269.466.269.368.029.1
82.973.292.295.275.689.191.692.592.691.793.399.373.4
7.907.956.558.306.205.757.456.756.726.155.758.008.10
96959597949697989695899490
98979899979897989899939793
96949598969799989394899290
a F < 2.2 mm x 25 mm b 2.2 mm x 25 mm < F < 2.5 mm x 25 mm c 2.5 mm x 25 mm < F < 2.8 mm x 25 mmd F > 2.8 mm x 25 mme F > 2.5 mm x 25 mm (III + IV)

The Kernels Endosperm Colour of a Longitudinal Section of Malting Barley... 17
on filter paper for 24 hours at 30oC, and subsequently heated in a boiling water bath for 30 s. Heating the grains resulted in gelation of starch, which did not undergo enzymatic hydrolysis and preserved the ability to turn into gel, which differentiated the colour of endosperm surface. After heating the grains were dried in ambient temperature between the sheets of blotting paper and the longitudinal sections were prepared (Figure 1). The example of images is presented in Figure 2. The colour of endosperm was determined with the LUCIA G system (KOZIROK et al. 2009).
The experimental results were analysed statistically using STATISTICA 6.0 software. The calculations were performed at the significance level of p = 0.05.
grains
screening by size
dominated fraction
histograms of investigated feature
digital image analysisof longitudinal section
germinating
30 C, 24 ho
heating
boiling water, 30 s
Fig. 1. The schedule of analytical procedure
POLO MARESI SCARLETT
Fig. 2. The images of longitudinal sections of malting barley kernels

18 Witold Kozirok, Łucja Fornal, Jerzy Drzewiecki
Results and Discussion
After germinating and heating the brightness of endosperm colour of the investigated malting barley varieties were characterized by average values of grey levels of red (R) component – from 141 to 220; the corresponding values for the green (G) colour were from 121 to 200
T a b l e 2
Characteristic of the endosperm colour of malting barley after germinating and heating
Range of grey levels
Varieties
Brenda Rasbet Stratus Granal Poldek Rodos Barke Sezam Scarlett Maresi Orlik Atol Polo
Number of red (R) component (%)121–130 0 0 0 1 0 0 0 0 0 1 0 1 6131–140 2 0 0 5 0 5 4 0 0 0 0 4 14141–150 15 0 1 12 2 22 19 2 0 5 0 38 24151–160 40 5 6 45 10 44 38 4 0 7 1 36 19161–17 0 33 22 36 23 43 24 21 12 0 13 0 17 17171–180 8 39 39 13 27 4 15 28 0 22 8 4 13181–190 2 24 17 1 17 0 3 35 1 33 32 0 4191–200 0 8 1 0 1 1 0 19 4 14 33 0 3201–210 0 2 0 0 0 0 0 0 25 5 18 0 0211–220 0 0 0 0 0 0 0 0 48 0 8 0 0221–230 0 0 0 0 0 0 0 0 17 0 0 0 0231–240 0 0 0 0 0 0 0 0 5 0 0 0 0
Number of green (G) component (%)
101–110 0 0 0 0 1 2 1 0 0 1 0 2 1111–120 4 0 0 7 2 12 5 1 0 0 0 8 10121–130 21 1 1 20 12 42 28 3 0 0 0 41 21131–140 43 10 7 41 40 39 28 7 0 6 0 31 21141–150 26 27 21 24 30 4 24 28 0 5 1 16 23151–160 5 33 50 7 12 0 12 31 0 9 6 2 9161–170 1 23 19 0 3 1 2 24 1 27 26 0 12171–180 0 5 2 1 0 0 0 6 2 28 35 0 2181–190 0 1 0 0 0 0 0 0 18 19 22 0 1191–200 0 0 0 0 0 0 0 0 47 5 10 0 0201–210 0 0 0 0 0 0 0 0 25 0 0 0 0211–220 0 0 0 0 0 0 0 0 7 0 0 0 0
Number of blue (B) component (%)51–60 0 0 0 0 2 1 1 0 0 1 0 0 161–70 0 0 0 3 10 4 0 2 0 0 0 1 271–80 11 0 0 12 24 33 8 2 0 0 0 15 1081–90 42 4 1 35 29 45 29 11 0 1 0 35 2891–100 34 10 1 30 23 15 34 26 0 4 0 34 21101–110 12 36 22 18 11 2 19 31 0 8 1 15 18111–120 1 31 47 1 1 0 8 19 0 12 4 0 10121–130 0 17 25 1 0 0 1 9 1 31 21 0 9131–140 0 2 4 0 0 0 0 0 7 30 33 0 1141–150 0 0 0 0 0 0 0 0 25 12 26 0 0151–160 0 0 0 0 0 0 0 0 39 1 14 0 0161–170 0 0 0 0 0 0 0 0 28 0 1 0 0

The Kernels Endosperm Colour of a Longitudinal Section of Malting Barley... 19
of grey levels and for the blue (B) colour – from 81 to 160 of grey levels (Table 2). The endosperm colour of the Scarlett variety distinguished itself from other varieties by occurrence of highest grey levels for the three components (R, G, B) which might suggest the brightest colour. On the other hand, the grey levels in the spectrum of the Polo, Atol, Barke, Granal varieties corresponded to the darkest colour of the endosperm. Following the assumption stated in REINIKAINENEM et al. (1996), that the gelatinised starch produces darker areas in comparison with non-gelatinised starch, the starch contained in endosperm of the Scarlett variety was decomposed after 24 hours of germination to a lesser extent than in the Polo, Atol, Barke, Granal varieties. This is one possible interpretation. The endosperm
T a b l e 3
Characteristic of the endosperm colour intensity, (R+G+B)/3, of malting barley after germinating and heating (%)
Range of grey levels
Varieties
Brenda Rasbet Stratus Granal Poldek Rodos Barke Sezam Scarlett Maresi Orlik Atol Polo
91–100 0 0 0 0 0 1 0 0 0 1 0 1 2101–110 3 0 0 5 2 5 4 0 0 0 0 2 8111–120 16 0 1 11 6 29 16 1 0 0 0 31 18121–130 44 5 1 41 38 52 35 8 0 6 0 36 25131–140 27 19 16 28 31 12 24 20 0 5 1 24 21141–150 9 41 49 14 19 0 16 32 0 11 3 6 11151–160 1 23 24 0 4 1 5 31 1 27 13 0 13161–170 0 11 9 1 0 0 0 8 1 31 35 0 1171–180 0 1 0 0 0 0 0 0 16 16 33 0 1181–190 0 0 0 0 0 0 0 0 39 3 12 0 0191–200 0 0 0 0 0 0 0 0 34 0 3 0 0201–210 0 0 0 0 0 0 0 0 9 0 0 0 0
T a b l e 4
Results of statistical analysis
R G B (R+G+B)/3
Brenda 159b 137bc 90b 129b
Rasbet 176d 154d 111f 147c
Stratus 173c 154d 116g 148c
Granal 158b 136b 91bc 129b
Poldek 171c 140c 85a 132b
Rodos 156ab 129a 82a 122a
Barke 158b 136b 94cd 130b
Sezam 180e 154d 103e 146c
Scarlett 214g 196g 155j 188f
Maresi 179de 169e 126h 158d
Orlik 194f 176f 138i 169e
Atol 153a 131a 90b 125a
Polo 154a 139bc 97d 130b
a, b, c, d… – mean value followed by the same letter are not significantly different at α = 0.05

20 Witold Kozirok, Łucja Fornal, Jerzy Drzewiecki
0
10
20
30
40
50
60
Xre
d
0
10
20
30
40
50
60
Xgre
en
010
20
30
40
50
60
Xb
lue
Xred
Xg
reen
Xb
lue
Xred
Xg
reen
Xb
lue
(R+
G+
B)/
3
0
10
20
30
40
50
60
Gra
nal
Sez
amS
carl
ett
(R+
G+
B)/
3
Sca
rlet
tB
renda
(R+
G+
B)/
3
Mar
esi
Polo
Bar
ke
0
10
20
30
40
50
60 0
10
20
30
40
50
60 0
10
20
30
40
50
60 0
10
20
3040
50
60
0
10
20
30
40
50
60 0
10
20
30
40
50
60 0
10
20
30
40
50
60 0
10
20
30
40
50
60
number(%) number(%) number(%) number(%)
number(%) number(%) number(%) number(%)
number(%) number(%) number(%) number(%)
ab
c
51–6061–7071–8081–90
91–100101–110111–120121–130131–140141–150151–160161–170171–180181–190191–200201–210211–220221–230231–240
241–250*
Sca
rlet
t
51–6061–7071–8081–90
91–100101–110111–120121–130131–140141–150151–160161–170171–180181–190191–200201–210211–220221–230231–240
241–250*
51–6061–7071–8081–90
91–100101–110111–120121–130131–140141–150151–160161–170171–180181–190191–200201–210211–220221–230231–240
241–250*
Fig
. 3. H
isto
gram
s of
th
e m
alti
ng
barl
ey e
ndo
sper
m c
olou
r of
lon
gitu
din
al s
ecti
ons,
dep
endi
ng
on
th
e va
riet
y: a
– G
ran
al, S
ezam
, Sca
rlet
t,
b –
Mar
esi,
Sca
rlet
t, P
olo,
c –
Bre
nda
, Bar
ke, S
carl
ett
* ra
nge
of
brig
htn
ess
leve
ls

The Kernels Endosperm Colour of a Longitudinal Section of Malting Barley... 21
colour after germinating and heating is also affected by the degree of attenuation, protein denaturation and other factors.
In the parameter of colour intensity, (R+G+B)/3, the grey levels from 110 to 200 dominated (Table 3). In the endosperm colour of the investigated varieties after germinating and heating, the colour intensity of Maresi, Scarlett and Orlik varieties was significantly different.
The statistical analysis of the significance of differences showed that the colour of endosperm, taking account of the four components: R, G, B and (R+G+B)/3, is statistically different for the Orlik and Scarlett varieties (for each parameter), Maresi (for three parameters) and Sezam (for one) – Table 4.
Amongst the four mentioned varieties, only Maresi and Sezam are considered genetically distant (KOZIROK et al. 2009). The Scarlett and Orlik cannot be considered such, on the contrary, they are very similar in terms of hordeins in relation to the other investigated varieties.
Amongst other varieties some can be distinguished, to a limited extent, in pairs, e.g.: Polo – Stratus, Rasbet – Granal, Polo – Rasbet. Numerous varieties remain which are undistinguishable, even in pairs, e.g. Barke – Brenda (Table 4).
The differences in statistical significance are also confirmed by colour histograms. Amongst the investigated varieties, attention should be drawn to the endosperm colour of the Scarlett variety; its histograms are significantly different from all the others (Figure 3). The Maresi and – to a lesser degree – Sezam also differ from other varieties. The endosperm colour of the Barke and Brenda varieties is identical (Figure 3c). Scarlett is a variety of malting barley of high technological quality and its negative feature is a high content of β-glucans, which results in attenuation of the endosperm during the soaking process.
Conclusions
Germinating and heating under experimental conditions changes the endosperm colour. It makes the differences visible amongst some varieties with highly similar hordeins, and, indirectly, with high or low technological quality. It can therefore be claimed that a large genetic distance favours the distinguishing of varieties by comparing the endosperm colour, and germination and than heating broadens the possibility by some varieties which are more similar. It suggests the possibility of evaluating the genetic purity of a batch of varieties of malting barley, as well as predicting and evaluating the technological quality using one more parameter of quality. The results of this research can be used as a basis for developing a evaluation of the quality model of the malting barley endosperm.
Translated by JOANNA JENSEN Accepted for print 3.02.2009

22 Witold Kozirok, Łucja Fornal, Jerzy Drzewiecki
References
AASTRUP S.A. 1988. Review of quick, reliable and simple check methods for barley and malt based on the Carlsberg Seed Fixation System. J. Am. Soc. Brew. Chem., 56: 37–43.
AGU R.C., PALMER G.H. 1998. Some relationships between the protein nitrogen of barley and the production of amylolytic enzymes during malting. J. Inst. Brew., 104: 273–276.
ALLOSIO-OUARNIER N., QUEMENER B., BERTRAND D., BOIVIN P. 2000. Application of high performan-ce anion exchange chromatpgraphy to the study of carbohydrate changes in barley during malting. J. Inst. Brew., 106(1): 45–52.
BROADBENT R.E., PALMER G.H. 2001. Relationship between β-amylase activity, steeliness, meali-ness, nitrogen content and the nitrogen fractions of the barley grain. J. Inst. Brew., 107(6): 349–354.
CHANDRA G.S., PROUDLOVE M.O., BAXTER E.D. 1999. The structure of barley endosperm – An im-portant determinant of malt modification. J. Sci. Food Agric., 79: 37–46.
KOZIROK W., FORNAL Ł., DRZEWIECKI J. 2009. The kernels endosperm colour of a longitudinal sec-tion of malting barley and the similarity amongst varieties. I. The kernels endosperm colour of a longitudinal section before malting. Pol. J. Natur. Sci., 24(1): 1–13.
MUNCK L., MøLLER B. 2004. A new germinative classification model of barley for prediction of malt quality amplified by near infrared transmission spectroscopy calibration for vigour “on line” both implemented by multivariate date analysis. J. Inst. Brew., 110(1): 3–17.
REINIKAINEN P., HIRVONEN J., JAAKKOLA N., OLKKU J. 1996. Image processing of halved kernels in the control of malting and malting barley. J. Am. Soc. Brew. Chem., 64: 26–28.
SCHROEDER S.W., MACGREGOR A.W. 1998. Synthesis of limit dextranase in germinated barley kernels and aleurone tissues. J. Am. Soc. Brew. Chem., 56(1): 32–37.
WALKER C., DICKIE K., BIAWA J.P., UEDA T., MULLER R.E. 2001. Prediction of extract potential in new barley varieties by measuring cell-wall breakdown. J. Inst. Brew., 107(3): 167–174.

Variation in Leaf Infection of Winter Wheat Cultivars by Fungi of Genus Septoria... 23POLISH JOURNAL OF NATURAL SCIENCES Abbrev.: Pol. J. Natur. Sc., Vol 24(1) 23-34, Y. 2009
DOI 10.2478/v10020-009-0003-0
VARIATION IN LEAF INFECTION OF WINTER WHEAT CULTIVARS BY FUNGI OF GENUS SEPTORIA
IN RELATION TO ENVIRONMENTAL CONDITIONS
Dariusz Zalewski1, Ryszard Weber2, Jan Kaczmarek1
1Department of Genetics, Plant Breeding and Seed Production Wrocław University of Environmental and Life Sciences
2Department of Ecology and Soil Tillage in Wrocław Institute of Soil Science and Plant Cultivation in Puławy
K e y w o r d s: genotype-environment interaction, the method of principal components, winter wheat, Septoria ssp.
A b s t r a c t
The study, covering analysis of the variation in the intensity of septoria leaf spot, made use of the results obtained in Post-registration Variety Testing experiments carried out in Lower Silesia. Of these experiments, eight locations characterized by diverse soil conditions were selected. The analysis regarded a three-year period of cultivation, spanning 2004–2006, of eleven winter wheat cultivars. The experiments were conducted in the standard variant (a1) and the intensive (a2), the latter differing in nitrogen fertilization higher by 40 kg ha–1, full chemical protection against fungal diseases, use of a growth regulator and foliar feeding of the plants with multi-nutrient preparation.
The analysis performed has revealed significant interaction of the cultivars with the environment, which points out to varied reaction of the wheat genotypes to atmospheric and edaphic conditions in particular years of the study. The high values of the genotype--environment interaction obtained for the locations of Kobierzyce, Tarnów, Pawłowice and Krościna indicate that in the area of Lower Silesia these experimental sites are distinguishable by increased danger that the plants may be highly infected by populations of fungi representing the genus Septoria.
The fact that the number of cultivars analyzed in Post-registration Variety Testing trials each year is different, the evaluations of the interaction between the genotypes and the environments may not be absolutely reliable. Therefore, the number of experimental sites of variable edaphic-climatic conditions which is taken under analysis should be large enough. The significant differences in the level of infection of particular genotypes obtained for some locations indicate the necessity to evaluate of new cultivars in numerous environments considering the genotype-environment interaction and the danger of occurrence of new races of fungi characterized by increased aggressiveness.
1Address: Dariusz Zalewski, Wrocław University of Environmental and Life Sciences, pl. Grunwaldzki 24A, 50-363 Wrocław, Poland, phone: +48 (071) 320 18 34, e-mail: [email protected]

24 Dariusz Zalewski, Ryszard Weber, Jan Kaczmarek
ZMIENNOŚĆ PORAŻENIA LIŚCI RÓŻNYCH ODMIAN PSZENICY OZIMEJ GRZYBAMI Z RODZAJU SEPTORIA W ZALEŻNOŚCI OD WARUNKÓW
ŚRODOWISKA
Dariusz Zalewski1, Ryszard Weber2, Jan Kaczmarek1
1Katedra Genetyki, Hodowli Roślin i NasiennictwaUniwersytet Przyrodniczy we Wrocławiu
2Zakład Herbologii i Technik Uprawy Roli we WrocławiuInstytut Uprawy, Nawożenia i Gleboznawstwa, Państwowy Instytut Badawczy w Puławach
S ł o w a k l u c z o w e: interakcja genotypowo-środowiskowa, metoda składowych głównych, pszenica ozima, Septoria ssp.
A b s t r a k t
W badaniach obejmujących analizę zmienności nasilenia septoriozy liści wykorzysta-no wyniki uzyskane z Porejestrowego Doświadczalnictwa Odmianowego na Dolnym Śląsku. Spośród doświadczeń wybrano 8 miejscowości odznaczających się zróżnicowanymi warunkami glebowymi. Analizowano 3-letni okres uprawy (2004–2006) 11 odmian uprawnych pszenicy ozimej. Doświadczenia prowadzono w dwóch wariantach uprawy, intensywnym (a2) o pod-wyższonym o 40 kg N ha–1 nawożeniu azotowym, w porównaniu do standardowego (a1), oraz z pełną ochroną chemiczną przed chorobami grzybowymi, stosowaniem antywylegacza i do-listnym dokarmianiem roślin preparatem wieloskładnikowym.
Stwierdzono istotną interakcję odmian ze środowiskiem, co wskazuje na zróżnicowaną reakcję genotypów pszenicy na warunki atmosferyczne i glebowe w poszczególnych latach ba-dań. Wysokie wartości interakcji genotypowo-środowiskowej w miejscowościach Kobierzyce, Tarnów, Pawłowice i Krościna wskazują, że na obszarze Dolnego Śląska te punkty doświad-czalne odznaczają się zwiększonym niebezpieczeństwem wystąpienia znacznego porażenia roślin populacją grzybów z rodzaju Septoria. Z powodu zróżnicowanej liczby analizowanych odmian w doświadczeniach porejestrowych w każdym roku interakcja genotypowo-środowi-skowa może ulegać znacznym zmianom. Liczba punktów doświadczalnych o zmiennych wa-runkach glebowo-klimatycznych powinna być dlatego odpowiednio wysoka. Znaczne różni-ce w stopniu porażenia poszczególnych genotypów w niektórych miejscowościach wskazują na konieczność badania nowych odmian w wielu środowiskach, ze względu na interakcję ge-notypowo-środowiskową oraz niebezpieczeństwo wystąpienia nowych ras grzybów o wzmożo-nej agresywności.
Introduction
Annually, diseases and pests cause yield losses ranging from 27 from to 42%, which constitutes worth of 244 million dollars (PIMENTAL, WILSON 1997). Therefore, immune-oriented cultivation is of great importance in the development of new varieties of cultivated plants as it reduces the costs of agricultural production and is conducive to environmental conservation. Results of research conducted in Poland indicate that septoria diseases of leaves and glumes are among the major ones that result in significant lowering of the winter wheat yield (JACZEWSKA-KALICKA 2002). In Post--registration Variete Testing experiments with cultivars these diseases undergo compulsory evaluation.

Variation in Leaf Infection of Winter Wheat Cultivars by Fungi of Genus Septoria... 25
Septoria leaf spot occurs at all phases of the development of cereal plants, although mostly affecting leaves. The fungus Septoria tritici can infect cultivars at 20-hour moist period, which is why epidemic occurrence of this disease is sporadically observed in Poland. Septoria nodorum infects plants at leaf dampness persisting for 3–6 hours. This particular fungus induces mainly septoria glume blotch but also septoria leaf spot, and it can also cause dying of seedlings. At extensive invasion by S. nodorum, the yield loss can amount to 50–60%. Septoria diseases are one of the main reasons behind a decrease in wheat cropping on organic farms due to worse grain filling and a lower 1000-grain weight (KUŚ et al. 2006, JOŃCZYK et al. 2002). So far merely a few genes responsible for the resistance to S. nodorum have been localized, which often originate from Triticum tauschii or T. timopheevi. A greater number of genes which determine the resistance to S. tritici have been detected on chromosomes 5B, 7B, 3A, 6D or 7D (MCINTOSH et al. 2003). For the majority of them molecular markers have been found (GOODWIN, ADHIKARI 2003). Also, in some wheat cultivars partial or one highly specific one resistance to certain isolates of S. tritici has been recorded (CHARTRAIN et al. 2004). A search for the loci involved with the resistance to the septoria leaf spot shows that quantitative traits loci (QTL) are located in chromosomes 1D, 2D, 3D, 6B, 7B (BÖRNER et al. 2003).
The wide genetic diversity in the populations of the two fungus species concerned, accompanied by their capability of repeated reproduction within a single year, indicates that the sources of resistance mentioned can decline in a short time. The Post-registration Variety Testing Experiments carried out in Poland with the aim to assess the infection of leaves and glumes by fungi representing the genus Septoria allow to practically analyze the susceptibility to infection of particular cultivars under various environmental conditions. The objective of the present study was to determine the variation in the incidence of septorial diseases of leaves caused by the fungi Septoria tritici and S. nodorum in Lower Silesian experiments with the winter wheat.
Material and Methods
The investigations, which involved analysis of the variance in the level of infection with septoria leaf spot, made use of the results obtained in Post-registration Variety Testing (PDO) experiments performed in Lower Silesia (Table 1). Of the PDO experiment plots, eight locations were selected which were distinguished by diverse edaphic conditions, including Kobierzyce, Krościna, Tarnów and Zybiszów of soils representing valuation categories II and IIIa, and belonging to a good and very good wheat complex, and Jelcz-Laskowice, Naroczyce, Wrocław-Pawłowice and Tomaszów Bolesławiecki which are characterized by III- and IVa-class

26 Dariusz Zalewski, Ryszard Weber, Jan Kaczmarek
Ta
ble
1
En
viro
nm
enta
l co
ndi
tion
s in
200
4–20
06
Spe
cifi
cati
onT
arn
ówN
aroc
zyce
Paw
łow
ice
Kob
ierz
yce
Zyb
iszó
wT
omas
zów
Krośc
ina
Jelc
z--L
asko
wic
e
Soi
ls c
ompl
ex2
42
11
52
4
Soi
l bo
nit
atio
n c
lass
IIIa
IVa
IIIb
IIII
IVb
IIIa
IVa
Nit
roge
n r
ates
a1
(kg
ha–
1 )11
080
100
8112
013
015
090
Nit
roge
n r
ates
a2
(kg
ha–
1 )15
012
014
012
116
017
019
013
0
Ph
osph
oric
rat
es (
kg h
a–1 )
6490
4010
180
5654
80
Pot
assi
um
rat
es (
kg h
a–1 )
104
8460
112
100
116
111
120
See
d dr
essi
ng
Fu
nab
en T
Fu
nab
enT
Fu
nab
enT
Oxa
fun
T–
Sar
fun
TF
un
aben
TF
un
aben
T
Her
bici
deA
relo
n F
ox
(2 L
ha–
1 )C
hw
asto
x (2
L h
a–1 )
L
enti
pur
(2.5
L h
a–1 )
Cou
gar
(1.5
L h
a–1 )
Gle
an
(22
g h
a–1 )
Gra
nst
ar
(15
g h
a–1 )
Sta
ran
e (0
.4 L
ha–
1 )
Cou
gar
(1.5
L h
a–1 )
Ch
isel
(6
0 g
ha–
1 )G
ran
star
(1
0 g
ha–
1 )
Mar
aton
(4
ha–
1 )
Fu
ngi
cide
– a
2Ju
vel
(1 L
ha–
1 )
Tan
go
Ale
rt
(1 L
ha–
1 )A
mis
tar
(1 L
ha–
1 )A
lert
(1
L h
a–1 )
Am
ista
r (1
L h
a–1 )
Juve
l (1
L h
a–1 )
Juve
l (1
L h
a–1 )
Tan
go
Ale
rt
(1 L
ha–
1)A
lert
(1
L h
a–1 )
Fol
iar
fert
ilis
atio
n –
a2
Bas
foli
ar
(10
L h
a–1 )
Bas
foli
ar
(16
L h
a–1 )
Bas
foli
ar
(10
L h
a–1 )
–B
asfo
liar
(1
4 L
ha–
1 )B
asfo
liar
(1
2 L
ha–
1 )P
lon
vit
Z
(1 L
ha–
1 )B
asfo
liar
(1
2 L
ha–
1 )

Variation in Leaf Infection of Winter Wheat Cultivars by Fungi of Genus Septoria... 27
soils of good rye complex. The analysis covered three years (2004–2006) of cultivation of eleven winter wheat cultivars. The experiments were carried out by the method of split-block design in two replications and two cultivation variants: a1 – standard and a2 – intensive. The intensive level differed from the standard in nitrogen fertilization higher by 40 kg ha–1 as well as in full chemical protection against fungal diseases, use of a growth regulator and foliar feeding of the plants with multi-component nutrient. Fertilization with the remaining macroelements and other agro-technical measures were undertaken to the same extent for all plots of the experiments. The assessment of the level of infection of the plants by Septoria fungi was performed in a 9-degree scale (1*– completely infection, 9* – no infection) based on observations of glumes and three uppermost leaves at milk stage. In order to estimate the infection variability among wheat cultivars at particular locations, statistical analysis proposed by CALIŃSKI et al. (1987a, b) was used. Calculations were made with the Sergen 4 programme.
Discussion of the Results
The level of glume infection by S. nodorum was characterized by low variability, ranging between 6.5 and 9 points in a 9-degree scale. The statistical calculations did not reveal significant differences between cultivars, locations or years of study. And therefore, these results have been omitted from the tables.
For the septorial disease of leaves (Table 2), variance analysis for many years’ synthesis of cultivars, years and environments (Table 3) shows significant variation in the infection by Septoria ssp. At agrotechnical level a2, chemical protection against fungal diseases caused significant differences only between locations. In both cultivation variants significant interaction between cultivars and environments was obserwed.
Climatic conditions were found to conspicuously affect the degree of infection of the cultivars in the study period 2004–2006. The application of fungicides in the intensive variant was responsible for the insignificant variability in the infection of cultivars by the fungi causing septoria leaf spot. The mean incidence of disease symptoms observed in the studied cultivars at particular locations in the three-year period under analysis did not show significant variation. However, the significant interaction of cultivars with the environments points out to diverse degree of Septoria ssp. infection at locations in particular seasons, both in the standard and intensive variant. In the former cultivation variant, the significant variability recorded for cultivars in their resistance to the population of fungi which cause septoria leaf spot is worth mentioning.

28 Dariusz Zalewski, Ryszard Weber, Jan Kaczmarek
Ta
ble
2M
ean
s of
tes
ted
gen
otyp
es
Loc
alit
esN
aroc
zyce
Kob
ierz
yce
Zyb
iszó
wT
arn
ówT
omas
zów
Las
kow
ice
Paw
łow
ice
Krośc
ina
Mea
nD
esig
nat
ion
sA
B1;
9; 1
7A
B2;
10;
18
AB
3; 1
1; 1
9A
B4;
12;
20
AB
5; 1
3; 2
1A
B6;
14;
22
AB
7; 1
5; 2
3A
B8;
16;
24
Gen
otyp
eS
tan
dard
cu
ltiv
atio
n v
aria
nt
Kob
ra6.
55.
55.
57.
54.
87.
07.
07.
06.
35T
onac
ja6.
57.
56.
57.
55.
77.
07.
06.
86.
81F
inez
ja6.
06.
76.
07.
05.
37.
37.
56.
36.
52M
ewa
6.2
5.3
5.7
7.2
5.5
6.8
5.5
6.5
6.06
Zyt
a6.
87.
56.
27.
75.
57.
57.
37.
36.
98S
oraj
a5.
54.
75.
86.
85.
86.
36.
76.
25.
97S
ukc
es7.
07.
06.
57.
36.
37.
37.
07.
36.
98N
adob
na
6.0
6.2
5.8
7.3
5.3
6.8
6.8
6.7
6.37
Rap
sodi
a7.
27.
06.
07.
36.
37.
37.
87.
37.
03R
ube
ns
6.8
5.0
4.7
7.2
5.3
6.3
6.4
6.7
6.05
Tre
nd
6.2
6.7
5.5
6.8
5.0
6.8
6.3
6.8
6.26
Mea
n6.
426.
275.
837.
245.
536.
976.
826.
826.
49L
SD
0.88
2.01
1.93
0.89
1.69
1.46
1.56
n.s
.In
ten
sive
cu
ltiv
atio
n v
aria
nt
Kob
ra7.
36.
86.
58.
37.
08.
08.
38.
27.
56T
onac
ja7.
88.
27.
28.
27.
58.
38.
87.
87.
98F
inez
ja7.
37.
77.
07.
87.
28.
29.
08.
07.
77M
ewa
7.8
7.5
7.0
8.0
7.2
7.7
8.0
8.0
7.65
Zyt
a7.
78.
27.
28.
57.
38.
28.
88.
28.
00S
oraj
a7.
37.
37.
28.
37.
57.
88.
38.
27.
75S
ukc
es8.
08.
07.
38.
07.
78.
28.
38.
37.
98N
adob
na
7.7
7.2
6.5
8.2
7.0
7.5
8.5
8.3
7.60
Rap
sodi
a8.
08.
07.
08.
07.
88.
38.
78.
38.
02R
ube
ns
7.5
6.7
6.3
8.0
7.0
7.5
8.5
8.5
7.50
Tre
nd
7.8
8.0
6.3
8.0
6.7
7.8
7.8
8.2
7.58
Mea
n7.
677.
596.
868.
127.
267.
968.
478.
187.
76L
SD
n.s
.1.
371.
56n
.s.
1.58
n.s
.1.
63n
.s.
Des
ign
atio
ns:
Th
e n
um
bers
at
the
AB
let
ters
mea
n t
he
year
s 20
04, 2
005
and
2006
at
part
icu
lar
loca
liti
es, r
espe
ctiv
ely
n.s
. – n
on-s
ign
ific
ant
Variation in Leaf Infection of Winter Wheat Cultivars by Fungi of Genus Septoria... 29
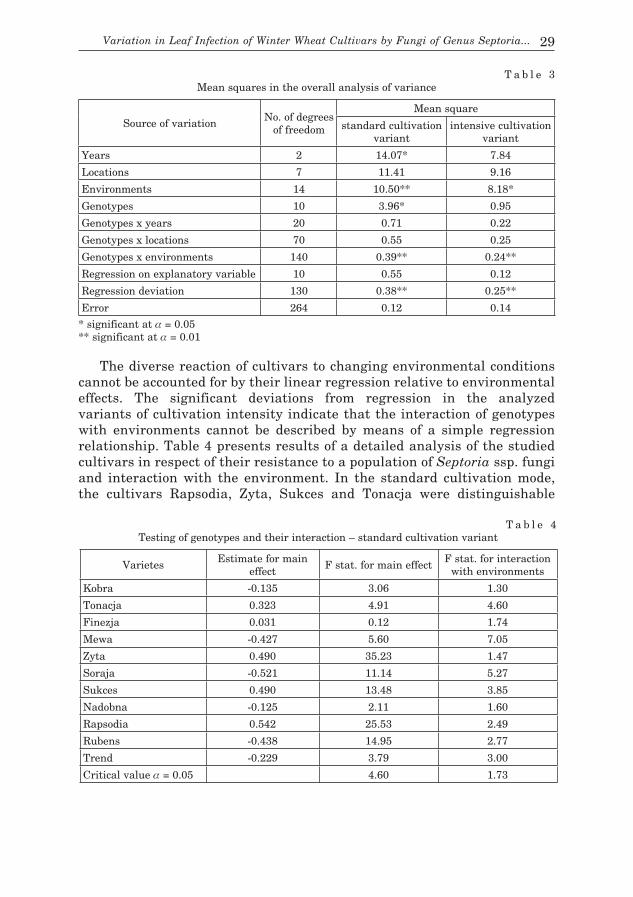
The diverse reaction of cultivars to changing environmental conditions cannot be accounted for by their linear regression relative to environmental effects. The significant deviations from regression in the analyzed variants of cultivation intensity indicate that the interaction of genotypes with environments cannot be described by means of a simple regression relationship. Table 4 presents results of a detailed analysis of the studied cultivars in respect of their resistance to a population of Septoria ssp. fungi and interaction with the environment. In the standard cultivation mode, the cultivars Rapsodia, Zyta, Sukces and Tonacja were distinguishable
T a b l e 3Mean squares in the overall analysis of variance
Source of variation No. of degrees
of freedom
Mean square
standard cultivation variant
intensive cultivation variant
Years 2 14.07* 7.84
Locations 7 11.41 9.16
Environments 14 10.50** 8.18*
Genotypes 10 3.96* 0.95
Genotypes x years 20 0.71 0.22
Genotypes x locations 70 0.55 0.25
Genotypes x environments 140 0.39** 0.24**
Regression on explanatory variable 10 0.55 0.12
Regression deviation 130 0.38** 0.25**
Error 264 0.12 0.14
* significant at α = 0.05** significant at α = 0.01
T a b l e 4Testing of genotypes and their interaction – standard cultivation variant
Varietes Estimate for main
effectF stat. for main effect
F stat. for interaction with environments
Kobra -0.135 3.06 1.30
Tonacja 0.323 4.91 4.60
Finezja 0.031 0.12 1.74
Mewa -0.427 5.60 7.05
Zyta 0.490 35.23 1.47
Soraja -0.521 11.14 5.27
Sukces 0.490 13.48 3.85
Nadobna -0.125 2.11 1.60
Rapsodia 0.542 25.53 2.49
Rubens -0.438 14.95 2.77
Trend -0.229 3.79 3.00
Critical value α = 0.05 4.60 1.73

30 Dariusz Zalewski, Ryszard Weber, Jan Kaczmarek
by the main effects being positive. In the analyzed environments, these cultivars were characterized by significantly higher resistance to septoria leaf spot as compared with the mean obtained for all studied cultivars, whereas Rubens, Soraja and Mewa at eight locations displayed increased susceptibility to fungi from the genus Septoria. The remaining four cultivars did not show significant deviations from the general mean in the extent of disease symptoms. Significant interaction with environments was characteristic of most cultivars under investigation, with only Kobra, Zyta and Nadobna showing no significant variability in the susceptibility to septoria leaf spot. The assessment of the analyzed environments (locations) with respect to the genotype-environment (G x E) interaction was performed through division of the F statistics of this interaction into components corresponding with particular contrasts (deviations) between genotypes. A pertinent F statistics, expressed in per cent of F statistics for the G x E interaction from the general variance analysis, indicates the part of this interaction which is absorbed by a given contrast. In order to graphically represent the environments on a plane, the first two principal components, which constitute estimates of contrasts between genotypes calculated for particular locations, have been used.
Figure 1 presents distribution of environments on a plane in the system of principal components for the standard cultivation mode. An environment of high proportion in the G x E interaction is characterized by a vector with long distance from the beginning of the coordinate system. The intensity of disease symptoms in cultivars in this environment differs significantly from the average level of infection of cultivars by populations
Fig. 1. Representation of environments in the system of principal components – standard cultivation variant

Variation in Leaf Infection of Winter Wheat Cultivars by Fungi of Genus Septoria... 31
of fungi from the genus Septoria in Lower Silesia in 2004–2006. In variant a1, the most remote from the beginning of the co-ordinate system are the environments related to locations Kobierzyce 2004, Tarnów 2004, Pawłowice 2004, Pawłowice 2006 and Krościna 2006 (Figure 2). These environments are characterized by average infection of cultivars by septoria leaf spot, significantly deviating from the level of infection
Fig. 2. Representation of environments in the system of principal components – intensive cultivation variant
by Septoria ssp. at other locations. The wide differences in the degree of infection of the cultivars in the experiments mentioned as compared with the remaining environments stem from the changeability of the climatic conditions prevailing at these locations in the span of three study years. This is evidenced by long distances between the analyzed environments in particular years.
In the intensive variant (Figure 2), the considerable distance from the beginning of the system of the points representing Pawłowice 2004, Kobierzyce 2005 and 2006 is also worth noting. Probably, in these years, in the environments mentioned the reaction of cultivars to the fungicides used was different than at the remaining locations.
Using an analysis of dual components, one can examine the structure of the G x E interaction in respect of genotypes. Figure 3 shows the genotypes in the system of principal components for the standard cultivation variant. The magnitude (proportion) of interactions of particular genotypes with environments is illustrated by the section (vector) of the F statistics value drawn from each point to the beginning of the system. The highest proportion in the sum of squared deviations for the G x E

32 Dariusz Zalewski, Ryszard Weber, Jan Kaczmarek
interaction is characteristic of cultivars Tonacja, Soraja and Mewa. In the studied environments, these genotypes are distinguishable by more variable infection by fungi from the genus Septoria than the other cultivars. On the other hand, cultivars Zyta, Kobra and Nadobna display higher stability of the reaction to a population of Septoria fungi. The differential reaction of cultivars to the climatic and edaphic conditions at particular locations manifests itself in different intensity of disease symptoms.
The results presented herein point out to significantly diverse reaction of cultivars to changeable environmental conditions in respect of the level of leaf infection by Septoria fungi. Similar results were obtained by KULIG et al. (2001). BRANCOURT, LECOMETE (2003) demonstrated that the genotype-environment interaction had 77% influence on the variability of 13 wheat lines in the cultivation conditions of France. The reaction of wheat cultivars to the infection by fungi from the genus Septoria is to a high degree determined by climatic factors, but it also depends on the stage of plant growth and cultivation management (JACZEWSKA-KALICKA 2001, WOJTOWICZ, JAKUBOWSKA 2001). Selection of cultivars, which would be suitable to the climatic-edaphic conditions and agronomic practices in a given region of the country, constitutes also an essential component of comprehensive plant protection (BOLLER et al. 1997).
Conclusions
1. The significant interaction of cultivars with the environment points out to diverse reaction of wheat genotypes to climatic and soil conditions in particular years of study.
2. The high values of the genotype-environment interaction at locations Kobierzyce, Tarnów, Pawłowice and Krościna indicate that these Lower Silesian experimental sites are distinguishable by increased risk of
-2
-1
0
1
2
3
-3 -2 -1 0 1 2 3
Mewa
SorajaSukces
Finezja
Kobra
Zyta
Tonacja
Rubens
Nadobna
Rapsodia
Trend
V2
(25.6
%)
V1 (32.2%)
Fig. 3. Vectors of genotypes in the system of principal components – standard cultivation variant

Variation in Leaf Infection of Winter Wheat Cultivars by Fungi of Genus Septoria... 33
extensive infection of plants by populations of fungi representing the genus Septoria.
3. The genotype-environment interaction analyzed in Post-registration Variety Testing experiments can undergo significant changes depending on particular variables. In order to obtain reliable results, the number of experimental locations of changeable edaphic-climatic conditions ought not to be reduced considerably.
4. The significant differences in the infection level recorded for particular cultivars at some locations point out to the necessity to investigate the new varieties in a number of different environments in view of the genotype--environment interaction and the danger of appearance of new fungal races characterized by increased aggressiveness.
Tranlated by Renata Brasińska Accepted for print 4.02.2009
References
BOLLER E.F., MALAVOLTA C., JORG E. 1997. Specific crop guidelines for integrated production: winter cereals (wheat, barley, oats, rye, triticale). IOBC WPRS, 20(5): 239–246.
BÖRNER A., SIMON M.R., RODER M.S., AYALA F.M., CORDO C.A. 2003. Molecular mapping of QTLs determining resistance/tolerance to biotic and abiotic stress in hexaploid wheat. Proceedings of the Tenth International Wheat Genetics Symposium 1–6 September 2003, Pastum, Italy, 1: 331–333.
BRANCOURT-HULMEL M., LECOMTE C. 2003. Effect of environmental variates on genotype x environ-ment interaction of winter wheat. Crop Scie., 43: 608–617.
CALIŃSKI T., CZAJKA S., KACZMAREK Z. 1987a. A model for the analysis of series of experiments repeated at several places over a period of years. I. Theory. Biul. Oceny Odm., 10: 7–33.
CALIŃSKI T., CZAJKA S., KACZMAREK Z. 1987b. A model for the analysis of series of experiments repeated at several places over a period of years. II. Example. Biul. Oceny Odm., 10: 35–71.
CHARTRAIN L., BRADING P.A., MAKEPEACE J.C., BROWN J.K.M. 2004. Sources of resistance to Septo-ria tritici blotch and implications for wheat breeding. Plant Patohology, 53: 454–460.
GOODWIN S.B., ADHIKARI T.B. 2003. Molecular markers linked to genes for resistance to Septoria tritici leaf blotch in wheat. Proceeding of the Tenth International Wheat Genetics Sympo-sium, 1–6 September 2003, Italy, 3: 1142–1144.
JACZEWSKA-KALICKA A. 2001. Występowanie chorób i straty plonu pszenicy ozimej ze szczególnym uwzględnieniem warunków atmosferycznych. Prog. in Plant Protection/ Post. w Ochr. Roślin, 41(2): 607–610.
JACZEWSKA-KALICKA A. 2002. Występowanie i szkodliwość najważniejszych chorób pszenicy ozimej w Polsce. Prog. in Plant Protection/ Post. w Ochr. Roślin, 42(1): 93–101.
JOŃCZYK K., KUŚ I., MRÓZ A. 2002. Intensity of diseases and Fielding of Winter wheat cultivated in ecological and conventional crop production systems. Deutsche Pflanzenschutztagung 53(390): 435–437.
KULIG B., KANIA S., SZAFRAŃSKI W., ZAJĄC T. 2001. Reakcja wybranych odmian pszenicy ozimej na intensywność uprawy. Biuletyn IHAR 218/219: 117–126.
KUŚ I., MRÓZ A., JOŃCZYK K. 2006. Nasilenie chorób grzybowych wybranych odmian pszenicy ozi-mej w uprawie ekologicznej. Journal of Research and Applications in Agricul. Engineering, 51(2): 88–93.
MCINTOSH R.A., YAMAZAKI Y., DEVOS K.M., DUBKOVSKY J., ROGERS W.J., APPELS R. 2003. Catalogue of Gene Symbols for Wheat. In: Grain Genes <http://wheat.pw.usda.gov/ggpages/wgec/2003/>.

34 Dariusz Zalewski, Ryszard Weber, Jan Kaczmarek
PIMENTAL D., WILSON C. 1997. Economic and environmental benefits of biodiversity. BioScience, 47(11): 747–756.
WOJTOWICZ A., JAKUBOWSKA M. 2001. Ochrona pszenicy ozimej odmiany Maltanka przed grzybami z rodzaju Septoria na podstawie wskazań wybranych systemów wspierających podejmowanie decyzji. Prog. in Plant Protection/ Post. w Ochr. Roślin, 41(2): 752–754.

Effect of Selenium and Vitamin E Supplementation on the Quantity and Quality... 35
EFFECT OF SELENIUM AND VITAMIN E SUPPLEMENTATION ON THE QUANTITY AND QUALITY
OF THE PORK PRODUCTION AND SELENIUM ACCUMULATION IN ORGANISM OF FATTENING PIGS
Vita Svedaite1, Krzysztof Lipiński2, Aniela Falkowska2,Dale Baranauskiene3, Jurgis Kulpys1, Rolandas Stankevicius1,
Rima Naginiene3
1Institute of Animal ScienceLithuanian Veterinary Academy, Tilzes 18, LT-47181 Kaunas, Lithuania
2Department of Animal Nutrition and Feed ManagementUniversity of Warmia and Mazury in Olsztyn*
3Institute for Biomedical ResearchKaunas University of Medicine, Eiveniu 4, LT-50009 Kaunas, Lithuania
K e y w o r d s: selenium, supplements, performance, carcass, meat quality, pigs.
A b s t r a c t
Selenium accumulates in the organism of livestock and thus increases the additive value of meat, prolongs its storage time, and improves culinary properties. In addition, selenium in meat is an important source of selenium in human nutrition. The aim of present research was to determine the effects of supplementation of diet with antioxidant preparation containing Se and vitamin E (0.1 mg and 20 mg kg–1, respectively) on the growth of fattening pigs, to assess the selenium accumulation in their organism, and to evaluate its effects on the physical-chemical properties of the meat. Two groups (12 pigs in each) of analogous pigs’ hybrid were investigated. Experimental group got the supplements of antioxidants. Addition of Se and vitamin E preparation to diet had no significant effect on feed intake, animal growth and meat quality indicators. Blood analyses showed the accumulation of trace element selenium in fattening pigs.
WPŁYW DODATKU SELENU I WITAMINY E NA ILOŚĆ I JAKOŚĆ PRODUKOWANEJ WIEPRZOWINY ORAZ AKUMULACJĘ SELENU
W ORGANIZMIE TUCZNIKÓW
Vita Svedaite1, Krzysztof Lipiński2, Aniela Falkowska2, Dale Baranauskiene3, Jurgis Kulpys1, Rolandas Stankevicius1, Rima Naginiene3
1Instytut Nauk o ZwierzętachLitewska Akademia Weterynaryjna, Tilzes 18, LT-47181 Kowno, Litwa
2Katedra Żywienia Zwierząt i Paszoznawstwa, Uniwersytet Warmińsko-Mazurski w Olsztynie3Instytut Badań Biomedycznych
Uniwersytet Medyczny w Kownie, Eiveniu 4, LT-50009 Kowno, Litwa
S ł o w a k l u c z o w e: selen, dodatki, wyniki produkcyjne, jakość tuszy i mięsa, świnie.
*Address: Krzysztof Lipiński, University of Warmia and Mazury, ul. Oczapowskiego 5, 10-718 Olsztyn, Polska, phone: +48 (089) 523 32 32, e-mail: [email protected]
POLISH JOURNAL OF NATURAL SCIENCES Abbrev.: Pol. J. Natur. Sc., Vol 24(1) 35-42, Y. 2009
DOI 10.2478/v10020-009-0004-z

36 Vita Svedaite et al.
A b s t r a k t
Selen gromadzi się w organizmie zwierząt gospodarskich i w ten sposób dodatko-wo podnosi jakość mięsa, przedłuża czas jego przechowywania oraz poprawia właści-wości kulinarne. Selen zawarty w mięsie jest ponadto ważnym źródłem Se w żywieniu ludzi. Celem badań było określenie wpływu dodatku preparatu antyoksydacyjnego zawiera-jącego Se i witaminę E (odpowiednio, 0,1 mg i 20 mg kg–1 mieszanki) na wzrost tuczników i akumulację selenu w ich organizmie oraz właściwości fizykochemiczne mięsa. Badania prze-prowadzono na grupie 24 świń mieszańców podzielonych metodą analogów na dwie grupy, po 12 sztuk w każdej. Grupa doświadczalna otrzymywała dodatek preparatu antyoksydacyj-nego. Zastosowanie dodatku selenu i witaminy E do mieszanek paszowych nie miało istot-nego wpływu na pobranie paszy, wzrost i wskaźniki jakości mięsa. Analiza krwi wykazała akumulację selenu w organizmie tuczników.
Introduction
The productivity and well-being of animals depends on number of factors. Therefore, the ration composition plays a key role in sustaining the wellness of animals and preventing from diseases (SAHNOUN et al. 1997, MABRY 1998, DROCHNER et al. 2000). The antioxidants are particular agents among the various elements of ration (SAHNOUN et al. 1997, WHANGER 2002).
The selenium supplements are widely used in the diets of livestock because of strong antioxidative properties of trace element selenium (Se). The supplement of selenium reduces the diseases risk and improves organism immunity. Selenium is included in the composition of glutathione peroxidase (GSH-Px), the enzyme that is natural cell protector from oxidation, involved in a number of biochemical reactions, and is essential for various organism functions (BENEYTOUT 1992, JEROCH et al. 1999, SAHNOUN et al. 1997, WHANGER 2002). Moreover, the selenium while accumulating in the livestock organism increases the additive value of meat and prolongs its storage time (FULBERT, CALS 1992, HARPER 2000, MATEO et al. 2007, WHANGER 2002, ZHAN et al. 2007). Selenium in meat is an important source of selenium in human nutrition (OBERLEAS et al. 1999).
The aim of present study was to determine the effects of antioxidant preparation containing Se and vitamin E on the performance of growing-fattening pigs, to assess the selenium accumulation in their organism, and to evaluate its effects on the physical-chemical properties of the meat.
Material and Methods
Two groups of analogous growing pigs hybrid (F1: Landras x Lithuanian White) were investigated: control (n = 12) and experimental (n = 12) one. Piglets were fed from 15 kg to 90 kg of weight during the period I (from
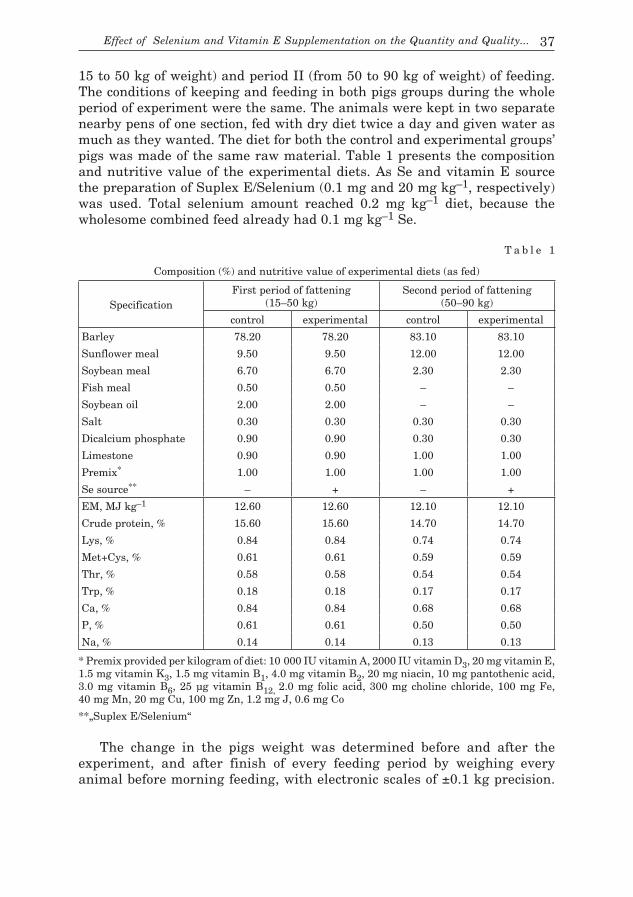
Effect of Selenium and Vitamin E Supplementation on the Quantity and Quality... 37
15 to 50 kg of weight) and period II (from 50 to 90 kg of weight) of feeding. The conditions of keeping and feeding in both pigs groups during the whole period of experiment were the same. The animals were kept in two separate nearby pens of one section, fed with dry diet twice a day and given water as much as they wanted. The diet for both the control and experimental groups’ pigs was made of the same raw material. Table 1 presents the composition and nutritive value of the experimental diets. As Se and vitamin E source the preparation of Suplex E/Selenium (0.1 mg and 20 mg kg–1, respectively) was used. Total selenium amount reached 0.2 mg kg–1 diet, because the wholesome combined feed already had 0.1 mg kg–1 Se.
T a b l e 1
Composition (%) and nutritive value of experimental diets (as fed)
SpecificationFirst period of fattening
(15–50 kg)Second period of fattening
(50–90 kg)
control experimental control experimental
Barley 78.20 78.20 83.10 83.10
Sunflower meal 9.50 9.50 12.00 12.00
Soybean meal 6.70 6.70 2.30 2.30
Fish meal 0.50 0.50 – –
Soybean oil 2.00 2.00 – –
Salt 0.30 0.30 0.30 0.30
Dicalcium phosphate 0.90 0.90 0.30 0.30
Limestone 0.90 0.90 1.00 1.00
Premix* 1.00 1.00 1.00 1.00
Se source** – + – +
EM, MJ kg–1 12.60 12.60 12.10 12.10
Crude protein, % 15.60 15.60 14.70 14.70
Lys, % 0.84 0.84 0.74 0.74
Met+Cys, % 0.61 0.61 0.59 0.59
Thr, % 0.58 0.58 0.54 0.54
Trp, % 0.18 0.18 0.17 0.17
Ca, % 0.84 0.84 0.68 0.68
P, % 0.61 0.61 0.50 0.50
Na, % 0.14 0.14 0.13 0.13
* Premix provided per kilogram of diet: 10 000 IU vitamin A, 2000 IU vitamin D3, 20 mg vitamin E, 1.5 mg vitamin K3, 1.5 mg vitamin B1, 4.0 mg vitamin B2, 20 mg niacin, 10 mg pantothenic acid, 3.0 mg vitamin B6, 25 μg vitamin B12, 2.0 mg folic acid, 300 mg choline chloride, 100 mg Fe, 40 mg Mn, 20 mg Cu, 100 mg Zn, 1.2 mg J, 0.6 mg Co
**„Suplex E/Selenium“
The change in the pigs weight was determined before and after the experiment, and after finish of every feeding period by weighing every animal before morning feeding, with electronic scales of ±0.1 kg precision.

38 Vita Svedaite et al.
Based on the weighing data, we calculated the general increase in weight (kg), the amount of animal feed used (kg), the feed intake per kg of weight gain, and the number of days to achieve 90 kg mass. The control slaughter performed in the end of experiment. The physical and chemical properties of the meat determined in the samples of loin muscle (Longissimus dorsis) in three animals of each control and experimental group.
Following 48 hours the slaughter the quality of the meat determined in the loin muscle based on the following indices: the dry matter (desiccating till dry mass at 105oC), fat amount and cooking waste were determined according to standard methods described in the official methods of analysis of the (AOAC 1990), ash (incineration in the muffle furnace at 400–600oC), pH (pH-meter), water adhesion (method by GRAU, HAMM 1953), meat colour (CIF-LAB method). To determine the accumulation of selenium, four pigs – 2 males and 2 females – were selected from each group, and samples of their hair and blood (n = 4) were taken. The amount of Se was determined using the method of atomic absorption spectrometry with the thermo chemical atomizer (ADAC/986.15).
The investigation data was processed using the statistics package “STATISTICA 5.0” (STATISTICA for Windows, 1995). The entire investi-gated indices given as mean if not indicated differently.
Results and Discussion
The physical observation of pigs showed that during the investigation period (up to 4 months) pigs in both groups were healthy, lively and had a good appetite. The pigs in the experimental group grew faster than control ones during the feeding period I (Figure 1). During this period, the increase of experimental pigs weight was 4.4 kg (9.2%) higher (P > 0.05) as compared to that in the control group. During feeding period II, the increase in experimental pigs’ weight was negligible, and was merely 0.87 kg (0.09%) as compared to the control ones. The pigs getting
14.23
47.34
89.58
13.80
51.70
90.45
0
20
40
60
80
100
kg
control experimental
I weighing II weighing
III weighing
Fig. 1. Dynamics of pigs’ growth – pigs weight (mean), kg

Effect of Selenium and Vitamin E Supplementation on the Quantity and Quality... 39
the supplement of antioxidant preparation consumed less diet to achieve final weight (Figure 2). At the same time, a few pigs had diarrhoea in the control group.
kg
control experimental
3627 3663
919.8904.2 135 d.136 d.
3.63.7
0
500
1000
1500
2000
2500
3000
3500
4000
0
0.5
1.0
1.5
2.0
2.5
3.0
3.5
4.0
animal feed used (kg)
increase in weight (kg)
number of days needed to achieve final weight
feed utilization
kg
Fig. 2. Feed utilization (mean, kg)
Analogous observations pointed out in the other studies (HARPER 2000, WHANGER 2002), indicating that pigs, getting rations with not enough amounts of Se or a lack of vitamin E, get diarrhoea more often, experience more stress and eat less.
Data show that diet supplemented with antioxidant preparation accelerated the growth by 1 day and makeweight by 1.7%. During the whole investigation, the feed utilization per 1 kg gain was less by 2.7% as compared to the control group. However, the differences of all the indicators studied were statistically insignificant.
The indices and characteristics altogether describe the meat quality, which conditions its nutritive value, conversion and human health (SEGERSON et al. 1986, SHEGLOV, BOYARSKYI 1990, TCHELEKPAEV, NAURUZOV 1990, RIBIKAUSKIENE, DZIAUGYS 2002, RAZMAITE, JANCIENE 2003). Entire meat indices e.g., pH, colour intensity, amount of muscles, fats, dry matter, meat adhesion, meat toughness, cooking waste, ashes etc., are essential. All these indices investigated in experimental and control pigs (Table 2).
The commodity exterior and culinary properties were different in the investigated groups. Experimental pigs’ meat colour was lighter by 15.1%, and had higher amount of dry matter by 0.4%. The increase of meat colour light is associated with major level of dry matter (TCHELEKPAEV, NAURUZOV 1990, SOSNICKYI 1998, WHANGER 2002). The suitability of meat for further technological processing usually evaluated by meat colour (SHEGLOV, BOYARSKYI 1990, RIBIKAUSKIENE, DZIAUGYS 2002). The meat colour depends on pH as well. We found similar meat pH of 5.47 in both pigs groups as well as the content of ashes did not differ. The tenderness is one of the

40 Vita Svedaite et al.
essential properties of meat savour, which directly affects pork value and relish. Muscles have least connective tissue and is considerably mild, although the correlation is not reliable (SHEGLOV, BOYARSKYI 1990). The tenderer meat have more hydrated proteins, more adhered water and emit less sap while cooking and keeping (SHEGLOV, BOYARSKYI 1990, RADIENE et al. 2004). Our study confirms these results. We found that experimental pork was tender by 3.2%, had fewer fats by 0.2%, more adhesion water by 2.9% and excreted less sap while cooking by 0.3% as compared to the control. However, the differences of all the indicators studied were statistically insignificant. Therefore, the productivity, meat quality, additive value of livestock depends on number of factors, the most important among those are animal age, fattening mode and grade, condition, species, gender and castration.
The obtained data (Figure 3) show that the experimental pigs had almost triple amount (x ± SD) of Se in blood 0.016±0.0004 mg dm–3. That is 266.7% higher (Student criterion value td = 9.26; P < 0.001) than in the blood of the control group. The selenium level (x ± SD) in the covering hair of experimental animals was 0.151 ± 0.028 mg kg–1. That is 1.2% higher
T a b l e 2
Physical-chemical properties (mean, statistical deviation SD) of meat (longissimus dorsis)
IndicesControl pigs Experimental pigs
x SD x SD
Dry matter, % 24.89 ±0.84 25.43 ±0.96
pH 5.47 ±0.09 5.47 ±0.03
Colour intensity, EK 64.0 ±4.42 54.33 ±3.89
Water adhesion, % 46.76 ±2.57 49.63 ±3.11
Cooking waste, % 32.26 ±1.35 31.98 ±1.17
Tenderness, kg cm–2 1.86 ±0.44 1.80 ±0.32
Fat, % 2.15 ±0.58 1.94 ±0.04
Ash, % 1.04 ±0.04 1.05 ±0.04
control experimental0
0.151
0.131
0.0160.0060.02
0.04
0.06
0.080.10
0.12
0.140.16
Se amount in hair mg kg-1
Se amount in blood mg dm-3
mg
Fig. 3. Amount of Se (mean, mg) in pigs’ organism

Effect of Selenium and Vitamin E Supplementation on the Quantity and Quality... 41
(Student criterion value td = 0.74; P > 0.05) as compared to the control ones. These results are generally consistent with previous report (KIM, MAHAN 2001). The selenium in blood contributes to the selenium content in meat of animal and thus considered as rather important source in human nutrition (OBERLEAS et al. 1999).
The trace element selenium in antioxidant preparation was in inorganic form. Therefore, the accumulation of Se in the pigs’ organism was obvious. The similar data show other studies (SEGERSON et al. 1986, SAHNOUN et al. 1997, FLORES et al. 1998, HARPER 2000, WHANGER 2002).
Conclusions
Supplement of antioxidant preparation in pigs diet had no significant effect on feed intake, animal growth and meat quality indicators. The selenium level in blood was 266.7% higher (P < 0.001) in experimental pigs blood and 1.2% higher (P > 0.05) in covering hair as compared to the control ones.
Translated by Rima Naginiene Accepted for print 7.01.2009
References
AOAC: 1990. Official methods of analysis of the association of Official Analytical Chemists. Arlington, USA.
BENEYTOUT J.L. 1992. Propriétés biologiques de la glutathion peroxydase séléniée. Option/bio, 98: 6–8.
DROCHNER W., MIKULIONIENE S., KULPYS J. 2000. Pigs feeding. Kaunas, 62.FLORES M., ARMERO E., ARISTOY M.C. et al. 1999. Sensory characteristics of cooked pork loin as
affected by nucleotide content and post-mortem meat quality. Meat Science, 51: 53–59.FULBERT J.C., CALS M.J. 1992. Les radicaux libres en biologie clinique. Path. Biol., 1: 66–77.GRAU R., HAMM R. 1953. Eine einfasche methode zur bestimmung des wasserbindung in muskel.
Fleischwirtschaft, 4: 295–297.HARPER J. 2000. Utilisation des antioxidants en clinique. Waltham Focus, 10:12–16.JEROCH H., DROCHNER W., SIMON O. 1999. Ernährung landwirtschaftlicher Nutztiere. Eugen
Ulmer, Stuttgart, pp.116–140.MATEO R.D., SPALLHOLZ J.E., ELDER R., YOON I., KIM S.W. 2007. Efficacy of dietary selenium
source on growth and carcass characteristics of growing-finishing pigs fed diets containing high endogenous selenium. J. Anim. Sci., 85: 1177–1183.
KIM Y.Y., MAHAN D.C., 2001. Effect of dietary selenium source, level, and pig hair color on various selenium indices. J. Anim. Sci., 79: 949–955.
MABRY J., BAAS T.J. 1998. The impact of genetics on pork quality. National Pork Board. American Meat Science Association, 29.
OBERLEAS D., HARLAND B.F., BOBILYA D.J. 1999. Selenium. In: Minerals. Nutrition and metabo-lism. Vantage Press, New York, pp. 168–177.
RADIENE Z., RIMKEVICIUS S., RAUDINIKIS A., REKSTYS V., JUKNA V. 2004. Results of control fattening in state pigs stock farm in 2004. Baisogala, 41–104 [Lithuanian].
RAZMAITE V., JANCIENE I. 2003. Lithuanian White Pigs succulent properties and their selection harmonisation with finite grade. Stockbreeding. Science proceedings, 42:3–12 [Lithuanian].

42 Vita Svedaite et al.
RIBIKAUSKIENE D., DZIAUGYS V. 2002. The effect of grade on Lithuanian White Pigs fatten-ing and succulent properties. Stockbreeding. Science proceedings, 41:101–110 [Lithuanian].
SAHNOUN Z., JAMMOUSI K., ZEGHAL K.M. et al. 1997. Radicaux libres et anti-oxydants: phy-siologie, pathologie humaine et aspects humaine et aspects thérapeutiques. Thérapie, 52(4): 251–270.
SEGERSON E.C., GUNSETT F.C., GETZ W.R. 1986. Selenium-vitamin E supplementation and production efficiency in ewe marginally deficient in Selenium. Livestock Production Science, 14: 149–159.
SHEGLOV V.V, BOYARSKYI L.G. 1990. Feed: concoction, keeping and usage, Moscow [Rus-sian].
SOSNICKYI A. 1998. Analyses of meat quality. Pig breeding, 6: 31–32 [Russian].STATISTICA for WindowsTM (Version 5.0). 1995. Statsoft Inc., Tulsa OK.TCHELEKPAEV YA.D., NAURUZOV M.M. 1990. About meat. Kainar, Alma-Ata, 318 [Russian].WHANGER P.D. 2002. Selenocompounds in plants and animals and their biological significance. J.
Am. Coll. Nutr. 21(3): 223–232.ZHAN X.A., WANG M., ZHAO R.Q., LI W. F., XU Z.R. 2007. Effects of different selenium source on
selenium distribution, loin quality and antioxidant status in finishing pigs. Anim. Feed Sci. Technol., 132: 202–211.
Species Diversity in Grassland Communities under Different Habitat Conditions 43POLISH JOURNAL OF NATURAL SCIENCES Abbrev.: Pol. J. Natur. Sc., Vol 24(1) 43-59, Y. 2009
DOI 10.2478/v10020-009-0005-y
SPECIES DIVERSITY IN GRASSLAND COMMUNITIES UNDER DIFFERENT HABITAT CONDITIONS
Magdalena Jastrzębska1, Tadeusz Szarejko2, Czesław Hołdyński2, Wiesław Piotr Jastrzębski2
1Chair of Agricultural Systems*2Chair of Botany and Nature Protection
University of Warmia and Mazury in Olsztyn
Key words: grasslands, plant communities, species diversity, ecological indicator values.
Abstract
Two hundred species of vascular plants were identified in grasslands on the Popielno Peninsula, in the part used for agricultural purposes. Species diversity in plant communities, measured by the Shannon-Wiener index, was found to depend on soil type, land use type and phytosociological affiliation. Greater species diversity was observed in communities that developed on mineral soils, are used as pastures, and belong to the class Molinio--Arrhenetheretea. The biodiversity of grassland communities on the Popielno Peninsula is affected by habitat conditions. The relationship between vegetation biodiversity and habitat quality is difficult to grasp due to its multidimensional character. The methods of multivariate statistics may prove useful in this respect.
RÓŻNORODNOŚĆ GATUNKOWA ZBIOROWISK ŁĄKOWO--PASTWISKOWYCH W RÓŻNYCH WARUNKACH SIEDLISKOWYCH
Magdalena Jastrzębska1, Tadeusz Szarejko2, Czesław Hołdyński2, Wiesław Piotr Jastrzębski2
1Katedra Systemów Rolniczych2Katedra Botaniki i Ochrony Przyrody
Uniwersytet Warmińsko-Mazurski w Olsztynie
S ł o w a k l u c z o w e: użytki zielone, zbiorowiska roślinne, różnorodność gatunkowa, eko-logiczne liczby wskaźnikowe.
A b s t r a k t
Na łąkach i pastwiskach rolniczej części Półwyspu Popielniańskiego zidentyfikowano 200 gatunków roślin naczyniowych. Różnorodność gatunkową zbiorowisk roślinnych, mierzoną wskaźnikiem Shannona-Wienera, różnicował rodzaj gleby, sposób użytkowania oraz przyna-leżność do klasy fitosocjologicznej. Większą różnorodność osiągały ugrupowania formujące się na glebach mineralnych, użytkowanie pastwiskowo oraz przynależące do klasy Molinio--Arrhenetheretea. Bioróżnorodność zbiorowisk użytków zielonych Półwyspu Popielniańskie-
*Address: Magdalena Jastrzębska, University of Warmia and Mazury, pl. Łódzki 3, 10-718 Olsztyn, Poland, phone: +48 (089) 523 48 29, e-mail: [email protected]
44 Magdalena Jastrzębska et al.
go wykazywała związek z warunkami siedliska. Pełne uchwycenie tej zależności jest trudne z uwagi na jej wielowymiarowość. Pomocne w tym względzie mogą być metody statystyki wie-lozmiennej.
Introduction
The Convention on Biological Diversity was adopted in Rio de Janeiro in 1992. Since that time the issues dealt with under the Convention have received wide recognition (RICOTTA 2003, WAMELINK et al. 2003). Apart from research aimed at exploring and documenting various aspects of biodiversity (e.g. World Atlas of Biodiversity, World Biodiversity Database, Różnorodność biologiczna... 2003, WILSON 1990), studies are also undertaken to determine the effect of biodiversity on ecosystem functioning (BALVANERA et al. 2006, DUFFY et al. 2007, HOOPER et al. 2005). From the standpoint of energy and production, a key role is played by plant communities which constitute the basis of all ecological systems (HOOPER et al. 2005). Attempts are continuously made to confirm a positive correlation between plant community diversity, productivity and response to environmental stress factors (SHLAPFER, SCHMID 1999, HOOPER et al. 2005, BULLOCK et al. 2001, DUFFY et al. 2007).
Numerous authors point to the direct and strong link between biodiversity and ecological conditions (SPANOS, FEEST 2007). The global--scale geographic patterns of species diversity and richness have been already established (MAY 1993, STEVENS 1989, 1992), whereas the problem of biodiversity response to changing microhabitat conditions has not been fully elucidated, particularly when biodiversity is considered from a functional perspective, taking into account not only the number of taxa in the investigated communities, but also their quantitative proportions (RICOTTA 2003).
The objective of this study was to analyze plant community biodiversity in permanent grasslands on the Popielno Peninsula, with the use of biological indices, and to determine the relationship between biodiversity and habitat conditions. The study is a continuation of the earlier work of JASTRZĘBSKA et al. (2007) in which the investigated habitats were assessed by a phytoindication method.
Materials and Methods
A total of 194 phytosociological relevés were carried out by the Braun--Blanquet technique in permanent grasslands in the northern part of the Popielno Peninsula. The environmental and geographic characteristics of the research area can be found in a paper by JASTRZĘBSKA et al. (2007). The phytosociological relevés provided a basis for computing the values

Species Diversity in Grassland Communities under Different Habitat Conditions 45
of biological indices. For each species in a single relevé, the degrees of cover/abundance were replaced by values determined by the midpoints of the cover ranges (%), corresponding to particular degrees: 5–87.5%, 4–62.5, 3–37.5, 2–17.5, 1–5.0, + –0.1%. The average cover of a given species was a measure of its abundance in a plant community, while total cover was a measure of abundance of the entire community. The Shannon--Wiener diversity index, the Shannon-Wiener evenness index (SHANNON 1948, WIENER 1948; see also WEINER 2003) and the Simpson’s domination index (SIMPSON 1949) were computed for all communities represented by phytosociological relevés.
The biological indices were calculated as follows:– the Shannon-Wiener diversity index (H’): H’ = – ∑ (pi⋅lnpi), – the Shannon-Wiener evenness index (J’): J’ = H’⋅(lnS)–1, – the Simpson’s domination index (λ): λ = ∑pi
2,where: pi – the proportion of individuals of the i-th species to the total number
of individuals in the community, S – species richness (the number of species in the community).
The values of indices determined for particular relevés were tabulated, summarized and generalized. They were independently grouped four times, according to the criteria given in Table 1. Some relevés were disregarded while grouping since they could not be classified based on the adopted assumptions. Mean, range of variation, coefficient of variation, median, mode and mode count were calculated for the entire research area and for particular groups, in accordance with the established criteria. Within each criterion, mean values for groups were compared by the t-test for independent samples. Coefficients of simple correlation were used to present relationships between the indices of diversity, evenness and domination and the synthetic indices of habitat conditions (L – light, T – temperature, W – soil moisture content, Tr – trophic state of soil/waters, R – soil reaction, D – soil particle size distribution, H – soil organic matter content). The latter were computed referring to the ecological
T a b l e 1
Criteria for the division of the experimental material into groups
Criteria Group Number of relevés in a group
Location Popielno 178
Wierzba 16
Soil type organic 80
mineral 114
Land use type pasture 129
meadow 51
Plant community (phytosociological class)
Molinio-Arrhenetheretea (Mol-Arr)Phragmitetea (Phragm)
15737

46 Magdalena Jastrzębska et al.
indicator values (ZARZYCKI et al. 2002) and were presented in the earlier work of JASTRZĘBSKA et al. (2007). Based on the Shannon-Wiener index and the synthetic indices of habitat conditions, phytosociological relevés representing particular phytocenoses were grouped into clusters by the Ward method (FILIPIAK, WILKOS 1998).
Results
A total of 200 species of vascular plants were identified in the analyzed area, including 196 in the grasslands of Popielno and 80 in the grasslands of Wierzba, 124 on organic soils and 147 on mineral soils, 179 in pastures and 95 in meadows, 187 in communities of the class Molinio-Arrhenetheretea and 92 in communities of the class Phragmitetea. Significant differences in the number of taxa in groups result primarily from considerable asymmetries in the phytosociological material (the majority of relevés were carried out within communities of the class Molinio--Arrhenetheretea which developed in pastures in Popielno – Figure 1),
0
50
100
150
200
Popielno
Molinio-Arrhenetheretea
pasture
mineral soil
Wierzba
Phragmitetea
meadow
organic soil
Fig. 1. Distribution of relevés in groups
which in turn are due to the study area characteristics. It is a well-known fact that – within certain limits – an increase in land area (i.e. a greater number of relevés) is followed by an increase in the number of accessory species. For the above reasons, the analysis involved a comparison of information on the existing plant communities which developed under specific conditions. As a result, variation in the number of species actually detected within phytocenoses was narrowed down to a range of 2–31 (on average 16.4 species, coefficient of variation – 32%; Table 2). Species richness is the simplest indicator of diversity, however it gives equal weight to abundant species and to taxa represented by single individuals

Species Diversity in Grassland Communities under Different Habitat Conditions 47
in the phytocenosis. The Shannon-Wiener index (also known as the Shannon index) is commonly used in studies on functional biodiversity in communities of living organisms. The value of this index increases along with a rise in the number of species in the community. Maximum evenness also maximizes the Shannon-Wiener index, therefore the index of evenness and the index of domination are usually calculated simultaneously. In general, the index of domination constitutes the reverse of the index of biodiversity. Basic statistical measures for the entire study area (i.e. for all analyzed relevés) can be found in Table 2. They are documentary in character. More interesting material for analysis is contained in Tables 3–7, where the characteristics of plant communities are compared according to the established criteria. It should be noted that grassland phytocenoses located in Popielno and Wierzba do not differ in terms of the investigated features. However, a different situation was observed with respect to the three criteria adopted in the study, i.e. soil type, land use type
T a b l e 2
Biological indices determined for plant communities in the investigated area – statistical cha-racteristics
Basic descriptive statis-tics
Total coverSpecies richness
Index
H’ J’ λ
Mean 142.2 16.4 1.566 0.561 0.317
Median 136.9 16 1.685 0.592 0.252
Mode multimodal multimodal 0.259 0.125 0.886
Mode count 4 19 3 3 3
Minimum 73.3 2 0.009 0.013 0.102
Maximum 243.7 31 2.587 0.850 0.998
Coefficient of variation, % 24.4 32.0 33.7 28.9 60.0
T a b l e 3
Statistical characteristics of total cover in plant communities
Specification MeanRange
of variationCoefficient
of variation, %
Location – Popielno 142.3a 73.3–293.1 24.6
– Wierzba 141.6a 93.1–186.0 22.2
Soil type – organic 134.7a 73.3–198.5 21.0
– mineral 147.5b 86.2–243.7 31.0
Land use type – pasture 147.8A 73.3–243.7 25.4
– meadow 131.0B 88.1–198.5 19.8
Plant community – Mol-Arr 145.8A 86.2–243.7 23.6
– Phragm 127.2B 73.3–198.5 25.6
AB, ab – significance of differences between means: values in particular categories with identical superscript letters are not significantly different at p = 0.05 (small letters) and at p = 0.01 (capital letters)

48 Magdalena Jastrzębska et al.
T a b l e 4
Statistical characteristics of species richness in plant communities
Specification Mean Range of variation Coefficient of variation, %
Location – Popielno 16.4a 2–31 32.3
– Wierzba 16.1a 8–25 28.8
Soil type – organic 16.6a 2–30 32.9
– mineral 16.3a 2–31 31.4
Land use type – pasture 17.0a 2–31 32.1
– meadow 15.9a 7–25 29.5
Plant community – Mol-Arr 16.9A 2–31 29.7
– Phragm 14.1B 2–29 39.6
* Explanatory notes as in Table 3
T a b l e 5
Statistical characteristics of the diversity index (H’) in plant communities
Specification Mean Range of variation Coefficient of variation, %
Location – Popielno 1.57a 0.009–2.587 33.0
– Wierzba 1.48a 0.259–2.382 42.2
Soil type – organic 1.41A 0.053–2.382 43.3
– mineral 1.68B 0.009–2.587 25.6
Land use type – pasture 1.67A 0.009–2.587 28.5
– meadow 1.35B 0.053–2.382 44.6
Plant community – Mol-Arr 1.70A 0.009–2.587 25.0
– Phragm 0.99B 0.053–2.150 54.1
* Explanatory notes as in Table 3
T a b l e 6
Statistical characteristics of the evenness index (J’) in plant communities
Specification Mean Range of variation Coefficient of variation, %
Location – Popielno 0.56a 0.013–0.850 28.1
– Wierzba 0.53a 0.120–0.782 37.4
Soil type – organic 0.50A 0.027–0.787 37.0
– mineral 0.65B 0.013–0.850 21.1
Land use type – pasture 0.60A 0.013–0.850 24.1
– meadow 0.48B 0.027–0.782 39.1
Plant community – Mol-Arr 0.61A 0.013–0.850 20.7
– Phragm 0.38B 0.027–0.641 45.4
* Explanatory notes as in Table 3

Species Diversity in Grassland Communities under Different Habitat Conditions 49
and phytosociological affiliation. Communities that developed on organic soils, compared with those occupying mineral soils, are characterized by significantly lower values of total cover, highly significantly lower values of diversity and evenness, and higher values of species domination (measured with the relevant indices). Species richness in communities on both soil types is identical in statistical terms. Land use type exerted no considerable influence on the number of species in phytocenoses, but had a highly significant effect on the other investigated parameters: pasture communities are marked by higher total cover, higher average indices of species diversity and evenness, and lower species domination. The most natural division of plant communities, based on phytosociological classes, was found to be significant for all analyzed features, including for species richness. Higher total cover, greater biodiversity (measured as the number of species and the Shannon-Wiener index), higher evenness and lower domination values were reported for communities of the class Molinio-Arrhenetheretea, in comparison with communities of the class Phragmitetea. The variation ranges of features within groups are relatively
T a b l e 7
Statistical characteristics of the domination index (λ) in plant communities
Specification Mean Range of variation Coefficient of variation, %
Location – Popielno 0.31a 0.102–0.998 60.6
– Wierzba 0.37a 0.125–0.886 62.7
Soil type – organic 0.38A 0.113–0.986 62.3
– mineral 0.27B 0.102–0.009 51.7
Land use type – pasture 0.28A 0.102–0.998 60.3
– meadow 0.41B 0.125–0.986 57.6
Plant community – Mol-Arr 0.26A 0.102–0.998 51.4
– Phragm 0.54B 0.171–0.986 43.5
*Explanatory notes as in Table 3
T a b l e 8
Correlation between the diversity index (H’) and other characteristics of plant communities
Specification Total cover Species richness J’
Location – Popielno 0.56*** 0.70*** 0.94***
– Wierzba 0.65*** 0.83*** 0.98***
Soil type – organic 0.64*** 0.76*** 0.97***
– mineral 0.53*** 0.76*** 0.90***
Land use type – pasture 0.55*** 0.67*** 0.92***
– meadow 0.57*** 0.83*** 0.99***
Plant community – Mol-Arr 0.47*** 0.71*** 0.91***
– Phragm 0.85*** 0.74*** 0.95***
* Significant at p = 0.05, ** significant at p = 0.01, *** significant at p = 0.001

50 Magdalena Jastrzębska et al.
wide, but the coefficients of variation are not particularly high, which is indicative of the concentration of values from single relevés around the mean; the highest variation was noted for the index of species domination (43.5–62.7%). The Shannon-Wiener diversity index increased along with a rise in the evenness of the distribution of individuals among species, and in species richness (Table 8). Both correlations are strong and highly significant. A strong positive relationship was also observed between the diversity index and total cover.
The analyzed features of grassland communities on the Popielno Peninsula were also related to habitat conditions expressed in the form of synthetic indices based on the ecological indicator values proposed by ZARZYCKI et al. (2002). It should be stressed that habitat conditions, except for soil moisture content, varied within a relatively narrow range, which is presented in a synthetic form in Table 9. The continentality index was disregarded in the assessment, because in our previous study (JASTRZĘBSKA et al. 2007) it was found to be nearly constant in all communities; therefore, no significant correlations were expected between this index and the characteristics of phytocenoses.
T a b l e 9
Synthetic indices of habitat conditions, determined for the investigated area, and their statisti-cal characteristics
Indicator values for habitats Scale MeanRange
of variationCoefficient
of variation, %
Light value (L) 1–5 4.07 3.47–4.65 3.6
Temperature value (T) 1–5 3.56 3.48–3.99 3.2
Soil moisture value (W) 1–6 3.62 2.83–5.89 18.1
Soil (water) trophy value (Tr) 1–5 3.89 3.32–4.20 3.4
Soil (water) acidity value (R) 1–5 4.16 3.56–4.79 3.8
Soil granulometric value (D) 1–5 4.18 3.13–5.00 5.6
Organic matter content value (H) 1–3 2.18 1.90–2.95 10.9
An analysis of the entire experimental material (with no division into groups) revealed that species diversity, evenness and total cover in communities increased with an improvement in light conditions, and decreased with a rise in the indices of temperature, soil moisture content, soil trophic state, soil particle size distribution and soil organic matter content. The domination index always follows the opposite trends to the diversity index (Table 10). It is noteworthy that the diversity index H’ usually showed greater strength (and in some cases also greater significance) of correlation with habitat conditions than species richness. No relationships were found between community features and soil reaction (R) across the research area.

Species Diversity in Grassland Communities under Different Habitat Conditions 51
Interesting data are provided by an analysis of the above dependencies within particular groups (Tables 11–14). Table 11 shows that the relation-ships between the investigated characteristics of phytocenoses and the synthetic indices of habitat conditions L, T, W, Tr, R, D and H in Popielno and Wierzba are almost identical, and that they do not differ considerably from those determined for all relevés. The absence of significant correlations in communities located in Wierzba, despite relatively high coefficients of correlation (compared to those determined in Popielno), most probably results from a small number of relevés in this group.
T a b l e 1 0
Coefficients of simple correlation between habitat indices and the characteristics of plant com-munities in the entire research area
Characteristics of plant communi-
ties
Indicator values for habitats
L T W Tr R D H
Species richness 0.16* –0.18* –0.18* –0.09 –0.12 –0.27*** –0.23**
Total cover 0.17* –0.18* –0.30*** –0.06 –0.12 –0.29*** –0.30***
Indices H’ 0.27*** –0.36*** –0.50*** –0.22** –0.10 –0.51*** –0.52***
J’ 0.27*** –0.39*** –0.54*** –0.25*** –0.04 –0.54*** –0.56***
λ –0.32*** 0.37*** 0.54*** 0.23*** 0.04 0.55*** 0.56***
* Significant at p = 0.05, ** significant at p = 0.01, *** significant at p = 0.001
T a b l e 1 1
Coefficients of simple correlation between habitat indices and the characteristics of plant com-munities in Popielno and Wierzba
Characteristics of plant communi-
ties
Indicator values for habitats
L T W Tr R D H
Popielno
Species richness 0.13 –0.16* –0.16* –0.08 –0.14 –0.25*** –0.19*
Total cover 0.14 –0.17* –0,32*** –0.06 –0.14 –0.29*** –0.31***
Indices H’ 0.21** –0.31*** –0.48*** –0.20** –0.12 –0.48*** –0.50***
J’ 0.20** –0.33*** –0.53*** –0.23** –0.06 –0.50*** –0.54***
λ –0.25*** 0.32*** 0.53*** 0.21** 0.06 0.51*** 0.53***
Wierzba
Species richness 0.55* –0.42 –0.53* –0.27 0.22 –0.49 –0.68**
Total cover 0.50* –0.28 –0.21 –0.07 0.23 –0.37 –0.43
Indices H’ 0.66** –0.67** –0.64** –0.49 0.16 –0.73*** –0.79***
J’ 0.66** –0.71** –0.63** –0.52* 0.17 –0.77*** –0.77***
λ –0.69** 0.66** 0.60* 0.46 –0.23 0.75*** 0.75***
* Significant at p = 0.05, ** significant at p = 0.01, *** significant at p = 0.001

52 Magdalena Jastrzębska et al.
The division of relevés into groups based on soil type (Table 12) revealed differences in the response of plant communities that developed on organic and mineral soils to changing habitat conditions, even if the changes were slight. The relationships noted in the group of communities on organic soils were similar to those observed across the entire study area. The only exception was a slight (though statistically significant) increase in species evenness (accompanied by a decrease in domination) reported for neutral and alkaline soils. In communities on mineral soils none of the examined features depended on the values of L, W, Tr, D and H (except for a correlation between H and total cover). However, in contrast to organic soils, there was a strong and significant correlation (p = 0.001) between the characteristics of communities on mineral soils and soil reaction. The response to higher pH levels included an increase in species domination and a decrease in the values of the other features.
T a b l e 1 2
Coefficients of simple correlation between habitat indices and the characteristics of plant com-munities on organic and mineral soils
Characteristics of plant communi-
ties
Indicator values for habitats
L T W Tr R D H
Organic soil
Species richness 0.26* –0.12 –0.61*** –0.23* 0.17 –0.47*** –0.43***
Total cover 0.30** –0.04 –0.52*** –0.34** 0.15 –0.52*** –0.37***
Indices H’ 0.31** –0.28** –0.76*** –0.43*** 0.21 –0.64*** –0.61***
J’ 0.31** –0.29** –0.73*** –0.46*** 0.25* –0.66*** –0.63***
λ –0.36*** 0.27** 0.75*** 0.45*** –0.27* 0.65*** 0.61***
Mineral soil
Species richness 0.09 –0.24** 0.02 –0.03 –0.49*** –0.12 –0.12
Total cover 0.01 –0.26** –0.08 0.05 –0.36*** 0.04 –0.22*
Indices H’ 0.09 –0.46*** –0.05 –0.10 –0.59*** –0.07 –0.18
J’ 0.07 –0.51*** –0.05 –0.13 –0.50*** –0.00 –0.14
λ –0.12 0.53*** 0.02 0.10 0.59*** 0.02 0.15
* Significant at p = 0.05, ** significant at p = 0.01, *** significant at p = 0.001
A different and interesting response of plant communities to soil reaction was noted when the experimental material was divided subject to land use type (Table 13). In pastures, situated primarily on mineral soils, the relationships between variables were the same as in all grassland communities on this type of soil. In meadows, species domination decreased along with an increase in soil acidity or, more precisely, with a shift in the index gradient towards moderate acidity. In pastures, like in communities on mineral soils, no directed relationships were noted between the characteristics of communities and the trophic state of soils.

Species Diversity in Grassland Communities under Different Habitat Conditions 53
Within the ranges of the synthetic indices of habitat conditions in the investigated area, the features of plant communities belonging to the class Molinio-Arrhenetheretea were not dependent on changes in light, moisture (except for J’) and trophic conditions (Table 14). The measures of species diversity and evenness decreased with an increase in the mean values of T, R, D and H (species domination showed the opposite trend).
T a b l e 1 3
Coefficients of simple correlation between habitat indices and the characteristics of plant com-munities in pastures and meadows
Characteristics of plant communi-
ties
Indicator values for habitats
L T W Tr R D H
PastureSpecies richness 0.14 –0.04 –0.09 –0.03 –0.34*** –0.07 –0.06Total cover 0.15 –0.17* –0.24** –0.02 –0.38*** –0.15 –0.23**Indices H’ 0.23** –0.22* –0.41*** –0.17 –0.52*** –0.23** –0.34***
J’ 0.21** –0.31*** –0.45*** –0.21* –0.49*** –0.23** –0.38***
λ –0.26** 0.31*** 0.45*** 0.17 0.54*** 0.21* 0.34***
MeadowSpecies richness 0.28* –0.25 –0.72*** –0.36** 0.38** –0.65*** –0.65***Total cover 0.20 –0.04 –0.30* –0.31* 0.36** –0.48*** –0.33*Indices H’ 0.25 –0.35* –0.76*** –0.46*** 0.46*** –0.78*** –0.72***
J’ 0.24 –0.34* –0.72*** –0.46*** 0.49*** –0.79*** –0.71***
λ –0.30* 0.31* 0.74*** 0.47*** –0.53*** 0.81*** 0.72***
* Significant at p = 0.05, ** significant at p = 0.01, *** significant at p = 0.001
T a b l e 1 4
Coefficients of simple correlation between habitat indices and the characteristics of plant com-munities of the classes Molinio-Arrhenetheretea and Phragmitetea
Characteristics of plant commu-
nities
Indicator values for habitats
L T W Tr R D H
Molinio-ArrhenethereteaSpecies richness 0.10 –0.22** 0.03 –0.01 –0.36*** –0.09 –0.09Total cover 0.07 –0.23** –0.15 0.04 –0.28*** –0.08 –0.19*
Indices H’ 0.07 –0.38*** –0.12 –0.11 –0.43*** –0.19* –0.21**
J’ 0.04 –0.41*** –0.18* –0.15 –0.38*** –0.19* –0.22**λ –0.12 0.45*** 0.15 0.11 0.43*** 0.16* 0.24**
PhragmiteteaSpecies richness 0.15 0.08 –0.45** –0.37* 0.20 –0.37* –0.19Total cover 0.25 0.16 –0.61*** –0.48** 0.11 –0.54*** –0.34*Indices H’ 0.33* –0.01 –0.67*** –0.58*** 0.25 –0.54*** –0.43**
J’ 0.37* –0.04 –0.65*** –0.56*** 0.31 –0.56*** –0.51***λ –0.35* –0.01 0.65*** 0.57*** –0.29 0.54*** 0.41*
* Significant at p = 0.05, ** significant at p = 0.01, *** significant at p = 0.001

54 Magdalena Jastrzębska et al.
Species diversity, evenness and domination in communities of the class Phragmitetea on the Popielno Peninsula were not related to the values of T and R, and increased with a rise in L and a decline in the mean values of W, Tr, D and H.
The relationship between the species diversity of plant communities and particular habitat features is easy to interpret since it has the form of a linear correlation. It should be noted that such an analysis is a simplification, because habitat quality is a multidimensional property. In three-dimensional space, biodiversity can be illustrated graphically only in the gradient of two habitat features as independent variables. An example may be a graph showing the dispersion of points representing the diversity indices H’ for particular communities (relevés), compared with the habitat indices of soil moisture content (W) and soil particle size distribution (D), which had the greatest ranges of variation within the research area (Figure 2). A cluster analysis may be employed to grasp
3.0
2.5
2.0
1.5
1.0
0.5
5 4 3 21D
H�
W
1
2
3
4
5
6
Fig. 2. Species diversity (H’) in plant communities on the Popielno Peninsula as dependent on soil
moisture content (W) and soil particle size distribution (D) – point dispersion
the multidimensional character of habitats. Table 15 presents the division of the experimental material into six groups, arranged according to increasing diversity (H’). There was almost no difference between clusters with regard to the mean values of climate indices (L and T). Table 15 shows than in the analyzed area biodiversity is affected to the greatest extent by soil moisture content. Similar mean values of the habitat indices in clusters 4 and 5, and considerably different mean values of diversity indices (H’) are indicative of a differentiating effect of other habitat variables not included in the analysis.

Species Diversity in Grassland Communities under Different Habitat Conditions 55
T a b l e 1 5
Values of variables in particular groups of relevés (clusters)
VariablesClusters (number of relevés)
1(17)
2(15)
3(29)
4(41)
5(45)
6(47)
H’ 0.52 0.94 1.21 1.56 1.91 2.04
L 3.92 4.03 4.03 4.08 4.10 4.11
T 3.57 3.69 3.62 3.54 3.51 3.54
W 4.99 3.00 4.33 3.14 3.82 3.11
Tr 3.97 3.94 3.91 3.89 3.86 3.88
R 4.08 4.34 4.21 4.15 4.19 4.09
D 4.63 4.06 4.31 4.05 4.17 4.07
H 2.66 2.08 2.37 2.09 2.15 2.03
Discussion
According to literature data (BULLOCK et al. 2001, MINNS et al. 2001, SZOSZKIEWICZ, SZOSZKIEWICZ 1999, GRYNIA et al. 1998), the last fifty years have seen agricultural intensification and the improvement of grassland productivity accompanied by a decrease in diversity. The negative impact of the above processes on ecosystems is less noticeable in Poland than in Western Europe. Today, when organic farming is becoming increasingly popular, low fertilization levels contribute to higher species diversity in permanent grasslands, which is not always accompanied by better productivity and quality (FISHER, RAHMAN 1997, GRYNIA et al. 1998)because natural succession proceeds towards the domination of ruderal weeds (BENNIE et al. 2006, GRABOWSKI et al. 1996, SZOSZKIEWICZ, SZOSZKIEWICZ 1998). The biodiversity of permanent grasslands has been the subject of long-term studies conducted at international research centers (SZOSZKIEWICZ, SZOSZKIEWICZ 1998). In Poland a vast body of literature is floristic documentation (GRYNIA, KRYSZAK 1998, TRĄBA et al. 2004, WYŁUPEK 2002) which provides scant information on a comparison of plant communities from the perspective of their functional biodiversity (SZOSZKIEWICZ, SZOSZKIEWICZ 1998). According to SZOSZKIEWICZ and SZOSZKIEWICZ (1998, 1999), the species diversity of grassland phytocenoses can be assessed and compared not only on the basis of the number of species in a community, but also with the use of the Shannon-Wiener diversity index, the Shannon-Wiener evenness index, the Simpson’s diversity index, the species rarity index and the Rényi diversity profiles. In the present study, the Shannon-Wiener diversity index was considered most suitable for an analysis of the gathered material. The value of this index increases with a rise in the number of species and in species evenness in the community. The Shannon-Wiener evenness index and

56 Magdalena Jastrzębska et al.
the Simpson’s domination index provide complementary information. The Simpson’s diversity index, proposed by SZOSZKIEWICZ and SZOSZKIEWICZ (1998), is a derivative of the domination index – diversity is determined as the reverse of domination or by subtraction from unity. The application of the quotient form is limited by the fact that this measure increases to the value referred to as the maximum diversity, equal to the number of species forming a community; thus, this index is suitable for comparing phytocenoses characterized by the same species richness (WANIC et al. 2005). According to Rényi (TÓTHMÉRÉSZ 1995), biodiversity is a multidimensional concept, and one community is more diverse than another if its diversity profile is above that of another over the whole range of the examined parameter. Diversity profiles may be used to compare actual phytocenoses as well as abstract clusters (groups), provided that the homogeneity of the experimental material and procedures is preserved. In the present study biodiversity was not assessed in the Rényi system due to considerable differences in the number of relevés in the compared groups, and the resulting heterogeneity of the material.
In this study biodiversity indices were computed based on phytosocio-logical relevés, replacing the degrees on the Braun-Blanquet cover/abundance scale by the mean values of percentage cover. ŚWIERKOSZ (2003) proposed to use this measure of species abundance while calculating the Shannon--Wiener diversity index in plant communities for the purpose of agricultural and environmental programs. CIEŚLAK (1993) demonstrated that biodiversity indices may be based on different quantitative parameters of taxa and communities, such as the number of individuals, number of pairs, biomass or the percentage share in the community. The information about plant communities acquired with the use of the Braun-Blanquet system is not precise (in contrast to frame methods employed e.g. in agricultural research), but this technique enables a rapid evaluation of vegetation cover within a relatively large area. In the course of analysis, the classical notation is often transformed into numeric form with the use of comprehensive database management systems, e.g. JUICE (TICHÝ 2002) or TURBOVEG (HENNEKENS, SCHAMONEE 2001). Multivariate statistical methods are commonly applied in ecological surveys. The possibilities they offer, with particular emphasis on the analysis of phytosociological relevés, have been discussed in detail by DZWONKO (2007). In this study the relationship between biodiversity and habitat conditions was determined using simple correlation and cluster analysis. KNOLLOVÁ et al. (2005) pointed out that the choice between traditional and modern methods is dependent on the ultimate goal which is to be achieved.
Works on the dependence of plant diversity (mostly species richness) on ecological factors sometimes refer to Ellenberg’s indicator values (ELLENBERG 1974, ELLENBERG et al. 1991) which are calibrated so as to adjust them to local conditions (ERSTEN et al. 1998). An analysis of changes in biodiversity along ecological (environmental) gradients is extremely difficult due

Species Diversity in Grassland Communities under Different Habitat Conditions 57
to the multidimensionality of the natural environment. As indicated in professional literature on the subject, environmental heterogeneity exerts a non-monotonic effect on diversity due to changes (shifts) in the abundance of constant or accidental species (SCHWILK, ACKERLY 2005). In most cases the analysis is performed in mono- or two-dimensional systems (CHYTRÝ et al. 2003, CORNWELL, GRUBB 2003, GODEFROID, KOEDAM 2000). It would be difficult to confront the above works with the present results, due to both the incomparability of study sites and procedural differences. An analysis of the cited sources suggests that soil moisture content is one of the factors exerting the most profound effect on species diversity across habitats (beta-diversity) (CHYTRÝ et al. 2003, CORNWELL, GRUBB 2003, HAVLOVÁ et al. 2004). HAVLOVÁ et al. (2004) demonstrated that a rise in the soil moisture content of grasslands in the Czech Republic was followed by an increase in beta-diversity. CORNWELL and GRUBB 2003 reported that in Central Europe species diversity reached a peak on nutrient-deficient soils in grasslands and swamps, while on nutrient-rich soils in forests, and that Ellenberg indicator values for moisture in the herbaceous and dwarf shrub layer were low (1–4). CHYTRÝ et al. (2003) observed no simple correlation between species diversity and soil acidity, following the Central-European approach to vegetation classification. GODEFROID and KOEDAM (2000) noted a positive correlation between species richness and Ellenberg indicator values for light in forests surrounding Brussels. The present paper describes preliminary findings that may represent a valuable contribution to a broader discussion. Such research projects should be undertaken not only for purely scientific purposes, but also for practical reasons, since environmental quality improvement is a prerequisite for biodiversity preservation (WAMELINK et al. 2003).
Conclusions
1. The Shannon-Wiener diversity index, accompanied by the Shannon--Wiener evenness index and the Simpson’s domination index, are good measures of species diversity in plant communities.
2. Greater species diversity was observed in communities that developed on mineral soils, are used as pastures, and belong to the class Molinio-Arrhenetheretea, compared with communities that developed on organic soils, are used as meadows, and belong to the class Phragmitetea.
3. The biodiversity of grassland communities on the Popielno Peninsula is affected by habitat conditions, as reflected in the synthetic indices computed based on the ecological indicator values.
4. The relationship between vegetation biodiversity and habitat quality is difficult to grasp due to its multidimensional character. The methods of multivariate statistics may prove useful in this respect.
Translated by Aleksandra Poprawska Accepted for print 21.11.2008
58 Magdalena Jastrzębska et al.
References
BALVANERA P., PFISTERER A.B., BUCHMANN N., HE J., NAKASHIZUKA T., RAFFAELLI D., SCHMID B. 2006. Quantifying the evidence for biodiversity effects on ecosystem functioning and services. Ecol. Lett., 9: 1146–1156.
BENNIE J., HILL M.O., BATER R., HUNTLEY B. 2006. Influence of slope and aspect on long-term vegetation change in British chalk grasslands. J. Ecol., 94: 355–368.
BULLOCK J.M., PYWELL R.F., BURKE M.J.W., WALKER K.J. 2001. Restoration of biodiversity enhances agricultural production. Ecol. Lett., 4: 185–189.
CHYTRÝ M., TICHÝ L., ROLEČEK J. 2003. Local and regional patterns of species richness in central european vegetation types along the pH/calcium gradient. Folia Geobot., 38: 429–442.
CIEŚLAK M. 1993. Koncepcja prostego wskaźnika różnorodności gatunkowej. Ochrona Środowiska i Zasobów Naturalnych, 5: 69–74.
CORNWELL W.K., GRUBB P.J. 2003. Regional and local patterns in plant species richness with respect to resource availability. Oikos, 100: 417–428.
DUFFY J.E., CARDINALE B.J., FRANCE K. E., MCINTYRE P.B.,THÉBAULT E., LOREAU M. 2007. The functional role of biodiversity in ecosystems: incorporating trophic complexity. Ecol. Lett., 10: 522–538.
DZWONKO Z. 2007. Przewodnik do badań fitosocjologicznych. Wyd. Sorus, Poznań-Kraków.ELLENBERG H. 1974. Zegeiwerte Gefässplantzen Mitteleuropas. Scripta Geobot., 9: 5–97.ELLENBERG H., WEBER H.E. DÜLL R., WIRTH V., WERNER W., PAULISSEN D. 1991. Zeigerwerte von
Pflanzen in Mitteleuropa. Scripta Geobot., 18: 1–248.ERSTEN A.C.D., ALKEMADE J.R.M., WASSEN M.J. 1998. Calibrating Ellenberg indicator values for
moisture, acidicity, nutrient availability and salinity in the Netherlands. Plant Ecol., 135: 113–124.
FILIPIAK K., WILKOS S. 1998. Wybrane metody analizy wielozmiennej i ich zastosowanie w bada-niach przestrzennych. IUNG Puławy, R 349, ss. 59.
FISHER G.E.J., RAHMANN G. 1997. Extensification – benefits and disavantages to grassland biodi-versity. Proc. of the International Occasional Symposium of the EGF, 2: 115–123.
GODEFROID S., KOEDAM N. 2000. Identifying indicator plant species of habitat quality and invasi-bility as a guide for peri-urban forest management. Biodivers. Conserv., 12: 1699–1713.
GRABOWSKI K., GRZEGORCZYK S., BENEDYCKI S., MARKS E. 1996. Przydatność niektórych gatunków traw do podsiewu łąki trwałej. Zesz. Probl. Post. Nauk Roln., 453: 89–97.
GRYNIA M., KRYSZAK A. 1998. Udział grup systematycznych w zbiorowiskach łąk właściwych z klasy Molinio-Arrhenetheretea. Pr. Komis. Nauk Rol. Kom. Nauk Leś., 85: 27–33.
GRYNIA M., KRYSZAK A., GRZELAK M. 1998. Udział Poa pratensis, Festuca rubra, Holcus lanatus, Deschampsia caespitosa w wybranych zbiorowiskach intensywnych i eskstensywnych. Pr. Ko-mis. Nauk Rol. Kom. Nauk Leś., 85: 35–38.
HAVLOVÁ M., CHYTRÝ M., TICHÝ L. 2004. Diversity of hay meadows in the Czech Republic: major types and environmental gradient. Phytocoenologia, 34(4): 551–567.
HENNEKENS, S.M., SCHAMINEE J.H.J. 2001. TURBOVEG, a comprehensive database management system for vegetation data. J. Veg. Sci., 12: 589–591.
HOOPER D.U., CHAPIN F.S., EWEL J.J. HECTOR A., INCHAUSTI P., LAVOREL S., LAWTON J.H., LODGE D.M., LOREAU M., NAEEM S., SCHMID B., SETALA H., SYMSTAD A.J., VANDERMEER J., WARDLE D.A. 2005. Effects of biodiversity on ecosystem functioning: a consensus of current knowledge. Ecol. Monographs, 75(1): 3–35.
JASTRZĘBSKA M., SZAREJKO T., HOŁDYŃSKI CZ., JASTRZĘBSKI W.P. 2007. Assessment of grassland habitats on the Popielno Peninsula by phytoindication methods. Pol. J. Natur. Sc. 22(4): 557–573.
KNOLLOVÁ I., CHYTRÝ M., TICHÝ L., HÁJEK O. 2005. Stratified resampling of phytosociological da-tabases: some strategies for obtaining more representative data sets for classification studies. J. Veg. Sci., 16: 479–486.
MAY R. 1993. Biological diversity: differences between land and sea. Phil. Trans. R. Soc. B., 343: 105–111.
MINNS A., FIN J., HECTOR A., CALDEIRA M., JOSHI J., PALMBORG C., SCHMID B., SCHERER-LORENZEN M.,

Species Diversity in Grassland Communities under Different Habitat Conditions 59
SPEHN E., TROUMBIS A., BIODEPTH PROJECT. 2001. The functioning of European grassland ecosystems: potential benefits of biodiversity to agriculture. Outlook Agric., 30(3): 179–185.
RICOTTA C. 2003. On parametric evenness measures. J. Theor. Biol., 222: 189–197.Różnorodność biologiczna Polski. 2003. Red. R. ANDRZEJEWSKI, A. WEIGLE. Narodowa Fundacja
Ochrony Środowiska, Warszawa. SCHLAPFER F., SCHMID B. 1999. Ecosystem effects of biodiversity: a classification of hypotheses and
exploration of empirical results. Ecol. Applications, 9: 893–912.SCHWILK D.W., ACKERLY D.D. 2005. Limiting similarity and functional diversity along environ-
mental gradients. Ecol. Lett., 8: 272–281.SHANNON C.E. 1948. A mathematical theory of communication. Bell Syst. Tech. J., 27: 379–423.SPANOS K.A., FEEST A. 2007. A review of the assessment of biodiversity in forest ecosystems.
Management of Environmental Quality, 18(4): 475–486.STEVENS G.C. 1989. The latitudinal gradient in geographical range: how so many species coexist
in the tropics. Am. Nat., 133: 241–256.STEVENS G.C. 1992. The elevational gradient in altitudinal range: an extension of Rapoport’s
latitudinal rule to altitude. Am. Nat., 140: 893–911.ŚWIERKOSZ K. 2003. Monitoring zbiorowisk seminaturalnych i wybranych gatunków roślin wyż-
szych na obszarach funkcjonowania programów rolno-środowiskowych. W: Ocena potrzeb związanych z tworzeniem optymalnych warunków dla ochrony i zrównoważonego użytkowa-nia programów różnorodności biologicznej. Priorytet 3. Cz. 3: <http://biodiversity-chm.org.pl/agrobiodiversity/pdf/priorytet3c.pdf.
SZOSZKIEWICZ K., SZOSZKIEWICZ J. 1998. Ocena różnorodności gatunkowej pratacenoz na przykła-dzie wybranych zbiorowisk. Pr. Kom. Nauk Rol. Kom. Nauk Leś., 85: 47–51.
SZOSZKIEWICZ K., SZOSZKIEWICZ J. 1999. Comparison of diversity of lowland grasland vegetation communities in Poland. Rocz. AR Pozn. CCCX, Melior. Inż. Środ., 20: 293–298.
TICHÝ L. 2002. JUICE, software for vegetation classification. J. Veg. Sci., 13: 451–453. TÓTHMÉRÉSZ B. 1995. Comparison of different methods for diversity ordering. J.Veg. Sci., 6: 283–
290.TRĄBA CZ., WOLAŃSKI P., OKLEJEWICZ K. 2004. Zbiorowiska roślinne nieużytkowanych łąk i pól
w dolinie Sanu. Łąkarstwo Pol., 7: 207–238.WAMELINK G.W.W., TER BRAAK C.J.F., VAN DOBBEN H.F. 2003. Changes in large-scale patterns
of plant biodiversity predicted from environmental economic scenarios. Landsc. Ecol., 18: 513–527.
WANIC M., JASTRZĘBSKA M., KOSTRZEWSKA M.K., NOWICKI J. 2005. Analiza zbiorowisk chwastów za pomocą wybranych wskaźników biologicznych. Acta Agrobot., 58 (1): 229–244.
WIENER N. 1948. Cybernetics, or control and communication in the animal and the machine. Cambridge, MA, The MIT Press,194.
WILSON E.O. 1990. Threats to biodiversity. Managing planet Earth. W.H. Freeman. New York, 49–60.
World Atlas of Biodiversity, http://stort.unep-wcmc.org/imaps/gb2002/book/viewer.htm.World Biodiversity Database, http://nlbif.eti.uva.nl/bis/index.php. WYŁUPEK T. 2002. Różnorodność florystyczna oraz walory przyrodnicze użytków zielonych w doli-
nie Poru. Fragm. Agron., 1(73): 213–223.ZARZYCKI K., TRZCIŃSKA-TACIK H, RÓŻAŃSKI W., SZELĄG Z., WOŁEK J., KORZENIAK U. 2002. Ecologi-
cal indicator values of vascular plants of Poland. Instytut Botaniki im. W. Szafera, PAN, Kraków, ss. 183.

60 Elżbieta ZębekPOLISH JOURNAL OF NATURAL SCIENCES Abbrev.: Pol. J. Natur. Sc., Vol 24(1) 60-75, Y. 2009
DOI 10.2478/v10020-009-0006-x
QUALITATIVE AND QUANTITATIVE CHANGES OF GREEN ALGAE WITH RELATION TO PHYSIOCHEMICAL WATER PARAMETERS IN THE URBAN LAKE JEZIORAK MAŁY
Elżbieta Zębek1
Law of Environmental Protection Laboratory University of Warmia and Mazury in Olsztyn
K e y w o r d s: lake, green algae, water temperature, oxygen content, total nitrogen.
A b s t r a c t
Phytoplankton in the littoral and pelagial zone of the urban Lake Jeziorak Mały were studied between April and October of 2002, 2003 and 2005. The relation between the abundance and biomass of green algae and selected physiochemical water parameters, species diversity and dominants in the total abundance and biomass of green algae were analyzed. The statistically significant relationships was noted between water temperature, oxygen content, total nitrogen and the biomass of green algae at the coefficient of multiple correlation R = 0.4722. Increased the abundance and biomass of green algae were followed by a decrease in water temperature and increase in oxygen content and total nitrogen concentration during their growth in a temperature range of 10.0oC to 18.8oC. The maximum biomass of green algae was noted in September and the maximum their abundance in October at the highest total nitrogen concentration. In the case of abundance, dominated taxa typical of plankton (Micratinium pusillum, Chlamydomonas spp., Golenkinia radiata, Golenkiniopsis sp., Koliella variabilis and Monoraphidium concortum) and biomass one – filamentous forms as a component of plant periphyton (Spirogyra sp., Stigeoclonium sp. and Ulothrix tenuissima).
ZMIANY ILOŚCIOWE I JAKOŚCIOWE ZIELENIC NA TLE FIZYCZNO-CHEMICZNYCH PARAMETRÓW WODY
W ŚRÓDMIEJSKIM JEZIORZE JEZIORAK MAŁY
Elżbieta ZębekPracownia Prawa Ochrony Środowiska
Uniwersytet Warmińsko-Mazurski w Olsztynie
S ł o w a k l u c z o w e: jezioro, zielenice, temperatura wody, natlenienie, azot ogólny.
A b s t r a k t
Badania fitoplanktonu prowadzono w strefie brzegowej i pelagialu śródmiejskiego jezio-ra Jeziorak Mały w sezonie od kwietnia do października w latach 2002, 2003 i 2005. Ana-lizowano relacje między liczebnością i biomasą zielenic a wybranymi parametrami fizyczno-
1Elżbieta Zębek, University of Warmia and Mazury, ul. Warszawska 98, 10-057 Olsztyn, Polska, +48 (89) 524 60 67, e-mail: [email protected]

Qualitative and Quantitative Changes of Green Algae... 61
-chemicznymi wody. Badano różnorodność gatunkową oraz dominanty w ogólnej liczebności i biomasie zielenic. Stwierdzono istotny statystycznie związek między temperaturą wody, za-wartością tlenu i azotu ogólnego a biomasą zielenic, gdy współczynnik korelacji wielokrot-nej R = 0,4722. W okresie rozwoju zielenic, w temperaturze wody od 10,0 do 18,8oC, wzrost liczebności i biomasy tych glonów następował wraz z obniżaniem się temperatury wody, wzro-stem natlenienia i zawartości azotu ogólnego. Maksimum biomasy zielenic odnotowano we wrześniu, a liczebności – w październiku, gdy zawartość azotu ogólnego była najwyższa. Naj-więcej było taksonów typowo planktonowych (Micratinium pusillum, Chlamydomonas spp., Golenkinia radiata, Golenkiniopsis sp., Koliella variabilis i Monoraphidium concortum), a największą biomasę miały formy nitkowate wchodzące w skład peryfitonu roślinnego (Spirogyra sp., Stigeoclonium sp. i Ulothrix tenuissima).
Introduction
In eutrophic lake, the phytoplankton often was dominated by blue--greens but also occurred green algae, especially in shallow hypertrophic lakes and ponds (VOLLENWEIDER 1968, REYNOLDS 1978, BUCKA 1989). Green algae, like other different algae, are subject to ecological succession. This phenomenon can depend e.g. on a regular and repeatable qualitative and quantitative changes of algae, resulting from cyclical environmental changes (LAMPERT, SOMMER 1996). Ecological succession may be affected by a variety of factors such as seasonal changes in water temperature, oxygen content, intensity of solar radiation or water mixing and resuspension of biogenic elements from sediments (phosphorus, nitrogen) (SOMMER et al. 1986, REYNOLDS 1990, JEPPENSEN et al. 2000, NASSAR, BJÖRKMAN 1966 cited in SHAMS EL-DIN 2006). The phenomenon of algae succession can be differently in water bodies with diverse trophy, catchment or subjected the protective and restorative works.
The large rate of water eutrophication and high degree of trophy of lakes stood a world problem and contributed to search of new methods of their protection. According to LOSSOW (1998) the basic and the most effective way of lake protection are the limitation or the liquidation of sources of biogene feeding, it in the lake protection favour unambiguously the internal methods (restorative) applied in ground basin of lake and the external methods (protective) regarding their catchment. The urban Lake Jeziorak Mały is an example of a highly eutrophic water body and subjected the protective and restorative works, where apart from blue-green algae (ZĘBEK 1998, 2005) occurred also green algae (ZĘBEK 2007). The aim of the present study was to determine the qualitative and quantitative changes of green algae as related to water temperature, oxygen content and total nitrogen concentration from April to October, and determine the differences in these variables between the littoral and pelagic zones. The study was conducted in Lake Jeziorak Mały in the years 2002, 2003 and 2005.

62 Elżbieta Zębek
Materials and Methods
The urban Lake Jeziorak Mały covers a total area of 26 ha; its maximum depth is 6.4 m, mean depth – 3.4 m, and water volume – 891 000 m3
(CYDZIK, SOSZKA 1988). For many decades the lake received untreated municipal sewage from the town of Iława. Since 1991, however, effluent has been treated at a local wastewater treatment plant. Work to improve the lake water quality began in 1997 and has been ongoing since that time, including the installation of separators for the pretreatment of storm water influent, and a fountain-based water aeration system. The littoral zone is diversified and partly of an anthropogenic character by covered the shore with concrete and piling up stones. The zone in about 30% of surface overgrown by vascular plants. CIECIERSKA (2000) recorded occurrence of the following communities: Thypetum angustifoliae, Sparganietum erecti, Phragmitetum, Typhetum latifoliae, Acoretum calami, Oenantho--Rorippetum, Glycerietum maximae, Butomus umbellatus, Cicuto-Caricetumpseudocyperi, Caricetum gracilis and Phalarideum arundinaceae.
Samples were collected monthly from April to October 2002, 2003 and 2005, at six sites located in the littoral zone (separators, stations with stony-gravel substrates and stations overgrown by vascular plants) and from the water surface to a depth of 4 m in the pelagic zone. The samples were collected with a 10 dm3 calibrated bucket (20 liters at each site) in the littoral zone and with a 5-liter plankton scoop TOŃ 2 (10 dm3 of water at each depth level). The samples were poured through a plankton net no 30, and then preserved with a Lugol’s solution and, separately, with a 4% formaldehyde solution. A total of 114 samples were collected. The following physiochemical water parameters were determined: temperature (oC) and oxygen concentration (mg O2 dm–3) – with a HI 9143 oxygen meter and total nitrogen concentration (mg N dm–3) – with a VEGA 400 spectrophotometer.
Quantitative and qualitative determinations of green algae were performed with an Alphaphot YS2 NIKON optical microscope at magnifications of 10x, 20x and 40x, by the following works of HUBER--PESTALOZZI et al. (1983) and HINDAK (1996). The specimens were counted in a 1 cm3 plankton chamber. Green algae biomass was calculated for biovolume by comparing algae to their geometrical shapes (ROTT 1981). Abundance and biomass of green algae were given per 1 dm3.
To verify the representativeness of the experimental materials collected, the following characteristics of the sets examined were calculated: standard deviation, coefficient of variation, median, modal value and coefficient of asymmetry representing distribution skewness (GUILFORD 1964). Calculations of these variables be leanings on individual observations (N = 114). The coefficients of multiple correlation was applied in order to determine the statistical significance of relationships between water temperature, oxygen content, total nitrogen concentration and the biomass of green algae, which determined the degree of dependence between

Qualitative and Quantitative Changes of Green Algae... 63
the studied variables. The ranking of factors was counted with equations of multiple correlation and expressed in percentages. In the analysis, means were applied that represented the sum of the abundance of individuals or the biomass divided by the number of measurements. The means counted from 6 sites in the littoral zone and from the water surface to a depth of 4 m in the pelagic zone. Shannon-Weaver species diversity index was analyzed (SHANNON, WEAVER 1949 cited in KAWECKA, ELORANTA 1994).
Results
General characteristics of the green algae and physiochemical water parameters
In Lake Jeziorak Mały in the years 2002, 2003 and 2005, the mean abundance of green algae was 500 indiv. dm–3 and the mean biomass was 0.002381 mg dm–3. The green algae reached low proportion in the total abundance and biomass of phytoplankton (1.37% and 2.25%, respectively). In this period, the mean values of physiochemical parameters were as follows: water temperature 18.4oC, oxygen content 7.54 mg O2 dm–3 and total nitrogen concentration 2.9 mg N dm–3 (Table 1).
T a b l e 1
Characteristics of datasets in terms of the representativeness of the experimental materials (N = 114) collected in Lake Jeziorak Mały in the years 2002, 2003 and 2005
VariableMean
(X)
Standarddeviation
(δ)
Coefficient of variation
(V)%
Median(Me)
Modal value(Mo)
Coefficient of asymme-
try(As)
Abundance of green algae (indiv. dm–3)Biomass of green algae (mg dm–3)Water temperature (oC)Oxygen content(mg O2 dm–3)Total nitrogen concen-tration (mg N dm–3)
500
0.002381
18.47.54
2.9
786
0.005721
4.54.40
2.4
157.20
240.28
24.4658.35
82.76
206
0.0004
19.27.13
2.6
41
0.000442
19.20.01
0.5
+0.58
+0.34
–0.18+1.71
+1.00
An evaluation of the significance of relationships between water temperature, oxygen content, total nitrogen concentration and the abundance and biomass of green algae were preceded by determination of representa-tiveness of the experimental variables. The data included in Table 1 show that standard deviations were higher than arithmetic mean for the numbers and biomass of green algae and lower – for water temperature, oxygen content and total nitrogen concentration. Standard deviations,

64 Elżbieta Zębek
apart the biomass of green algae, did not exceed the double value of mean. The coefficients of variations, expressed as a standard deviation to arithmetic mean ratio, were high for abundance and biomass of green algae and were 157.20% and 240.28%, respectively. High variation was noted also for total nitrogen concentration (82.76%) and low for water temperature (24.46%). Data distributions, determined by the coefficient of asymmetry, apart water temperature, were moderately positively skewed. Thus it was assumed that the data distributions and variations are close to normal and monomodal (GUILFORD 1964).
Relationships between water temperature, oxygen content, total nitrogen concentration and the abundance
and biomass of green algae
In order to undertake a analysis of the relationships between the abundance and biomass of green algae, and physiochemical parameters, the results were plotted with relation to water temperature range (Figure 1). To this aim, the ranges of water temperature were marked on an axis of ordinates, which was subordinated by using the mean abundance and biomass of green algae. The highest mean abundance and biomass was used to determine the temperature range of the development of green algae. The data included in Figure 1 show decreased the abundance of green algae in a temperature range of 10.0oC to 15.0oC, and then increased their abundance to maximum value at 18.8oC and rapidly decreased at 20.0oC to 25.0oC. However, increased the biomass of green algae was noted in a temperature range of 10.0oC to 17.5oC and then their decreased at 17.5oC to 25.0oC. Thus it was assumed that the in Lake
0
100
200
300
400
500
600
700
800
900
10–12.5 12.5–15.0 15.0–17.5 17.5–20.0 20.0–22.5 22.5–25.0
water temperature range ( C)o
0
0.001
0.002
0.003
0.004
0.005
0.006
0.007
0.008
0.009
abundance biomass
abundan
ceof
gre
enal
gae
(indiv
.dm
)-3
bio
mas
sof
gre
enal
gae
(mg
)dm
-3
Fig. 1. Mean abundance and biomass of green algae in water temperature ranges in Lake Jeziorak Mały (means of the years 2002, 2003 and 2005)

Qualitative and Quantitative Changes of Green Algae... 65
Jeziorak Mały in the years 2002, 2003 and 2005, the development of green algae was in a water temperature range of 10.0oC to 18.8oC.
For the purpose of analysis, the multiple correlation was applied in order to determine the relationships between water temperature, oxygen content, total nitrogen concentration and the biomass of green algae. In water with a temperature range of 10.0oC to 18.8oC, a statistically significant correlation was observed between these variables as was confirmed by the coefficient of multiple correlation level of R = 0.4722. The equations of multiple regression for the biomass of green algae suggest that temperature decrease by 1oC was followed by an increase in the biomass of green algae of 0.00036 mg dm–3, and an increase in oxygen content of 1mg O2 dm–3 was accompanied by an increase in the biomass of green algae of 0.00238 mg dm–3, and an increase in total nitrogen concentration of 1 mg N dm–3 was accompanied by an increase in the biomass of green algae of 0.00929 mg dm–3. The ranking of factors was counted with equations of multiple correlation. The highest proportion was noted for total nitrogen concentration (77.22%) and the lowest for water temperature (3.00%) – Table 2.
T a b l e 2
Pearson coefficient of multiple correlation and equation of multiple regression between water temperature, oxygen content, total nitrogen concentration and the biomass of green algae
in a temperature range of 10.0oC to 18.8oC in Lake Jeziorak Mały in the years 2002, 2003 and 2005
ParametersIncreased the biomass of green al-gae in a water temperature range
of 10.0oC to 18.8oC at N = 39
Pearson coefficient between water temperature (x2), oxy-gen content (x3), total nitrogen concentration (x4) and the biomass of green algae (x1)
R = 0.4722
Equation of multiple regression x1’ = 0.0000092 – 0.00036x2 + 0.00238x3 + 0.00929x4
Rank of influence water temperature on biomass of green algae (%)
3.00
Rank of influence oxygen content on biomass of green algae (%)
19.78
Rank of influence total nitrogen concentration on biomass of green algae (%)
77.22
Changes of abundance and biomass of green algae and physiochemical water parameters from April to October period
In Lake Jeziorak Mały in the years 2002, 2003 and 2005, differences in the abundance and biomass of green algae and physiochemical water parameters in the months from April to October were observed. In the

66 Elżbieta Zębek
Fig. 2. Changes in the abundance and biomass of green algae and physiochemical water parameters from April to October in Lake Jeziorak Mały (means of the years
2002, 2003 and 2005)
spring season in April, the first abundance and biomass peaks of green algae (837 indiv. dm–3 and 0.003929 mg dm–3, respectively) were noted at high oxygen content (9.44 mg O2 dm–3), low water temperature (12.5oC) and total nitrogen concentration of 2.7mg N dm–3. In the moths from April to May, decreased the abundance and biomass of green algae were followed an increase in water temperature and a decrease in oxygen content and total nitrogen concentration. In the summer season (June, July and August) low abundance and biomass of these algae were observed. In the months from May to June, a little increase in oxygen content were accompanied by a little increase in the abundance and biomass of green algae. In the months from August to September, rapidly increased the abundance and biomass of these algae were followed by a decrease in water temperature and an increase in oxygen content and total nitrogen concentration. In the autumn period (September, October), the green algae reached the maximum biomass in September (0.00768 mg dm–3) and the maximum
0
0.001
0.002
0.003
0.004
0.005
0.006
0.007
0.008
0.009
abundance biomass
abundan
ceof
gre
enal
gae
(indiv
.dm
)-3
bio
mas
sof
gre
enal
gae
(mg
)dm
-30
500
1000
1500
2000
2500
3000
IV V VI VII VIIII IX X
0.0
5.0
10.0
15.0
20.0
25.0
IV V VI VII VIIII IX X0.0
0.5
1.0
1.5
2.0
2.5
3.0
3.5
4.0
temperature oxygen total nitrogen
wat
erte
mper
ature
(C
)o
oxygen
conte
nt
(mg
Odm
)
tota
lnit
rogen
(mg
Ndm
)
2-3
-3

Qualitative and Quantitative Changes of Green Algae... 67
abundance in October (2386 indiv. dm–3) at water temperature 18.3oC and 12.1oC, respectively, and at the highest total nitrogen concentration (3.8 mg N dm–3) – Figure 2.
Comparison of green algae communities and physiochemical water parameters between the littoral and pelagic zones
In Lake Jeziorak Mały in the years 2002, 2003 and 2005, higher means abundance and biomasses of green algae were noted in the littoral zone than in the pelagic zone (537 indiv. dm–3 and 410 indiv. dm–3; 0.003130 mg dm–3 and 0.000543 mg dm–3, respectively). In this zone in comparison from the pelagic zone were recorded about 1oC lower water temperature and about 0.2 mg total nitrogen concentration, and higher oxygen content. A higher species diversity of green algae was noted also in the littoral zone than in the pelagic zone. The Shannon-Weaver species diversity indices in these zones were 4.2685 bit. indiv.–1 and 3.8875 bit. indiv.–1 for 71 and 45 taxa (Table 3).
T a b l e 3Abundance and biomass of green algae, physiochemical water parameters and species diversity
indicies for green algae in the littoral and pelagic zones of Lake Jeziorak Mały (means of the years 2002, 2003 and 2005)
Parameters Littoral zone Pelagic zone
Abundance of green algae (indiv. dm–3)Biomass of green algae (mg dm–3)Water temperature (oC)Oxygen content (mg O2 dm–3)Total nitrogen concentration (mg N dm–3)Number of taxaShannon-Weaver species diversity index (bit. indiv.–1)
5370.003130
18.17.742.871
4.2685
4100.000543
19.17.023.045
3.8875
T a b l e 4Dominant taxa in the total abundance and biomass of green algae in the littoral and pelagic
zones of Lake Jeziorak Mały (means of the years 2002, 2003 and 2005)
Taxa Littoral zone Pelagic zone
proportion in the total abundance of green algae (%)
Chlamydomonas spp. Ettl.Golenkinia radiata Chod.Koliella variabilis (Nygaard) HindakMicratinium pusillum Fres.Monoraphidium concortum Komarek & Fott
14.87–
8.6824.50
–
13.0624.45
––
10.69
proportion in the total biomass of green algae (%)
Chlamydomonas spp. Ettl.Golenkiniopsis sp. KoršikovPediastrum duplex MeyenSpirogyra sp. LinkStigeoclonium sp. KützingUlothrix tenuissima Kützing
–––
26.9215.4811.62
16.2218.929.12
–––

68 Elżbieta Zębek
Differences in the dominants in the total abundance and biomass of green algae in both zones were observed. In the case of abundance, Micratinium pusillum (24.50%) dominated in the littoral zone and Golenkinia radiata (24.45%) in the pelagic zone. Accompanying taxa included Chlamydo--monas spp., Koliella variabilis and Chlamydomonas spp., Monoraphidium concortum, respectively. Filamentous forms reached the highest proportion in the total biomass of green algae in the littoral zone (Spirogyra sp., Stigeoclonium sp. and Ulothrix tenuissima) and taxa typical of plankton in the pelagic zone (Chlamydomonas spp., Golenkiniopsis sp. and Pediastrum duplex) – Table 4.
Discussion
Jeziorak Mały Lake is a highly eutrophic water body, polimictic and pond-type lake (JANKOWSKI 1966, SPODNIEWSKA 1979), where apart from blue-green algae (ZĘBEK 1998, 2005, 2007) occurred also green algae. In this lake in the years 2002, 2003 and 2005 low mean abundance and biomass of green algae (500 indiv. dm–3 and 0.002381 mg dm–3) and thus it the proportion in the total abundance and biomass of green algae below 3% were noted at high water temperature, oxygen content and total nitrogen concentration (Table 1). NASSAR, SHAMS EL-DIN (2006) recorded somewhat higher mean abundance of green algae level of 741 indiv. dm–3 (7.51% of total abundance of phytoplankton) at lower mean oxygen content of 3.64 mg O2 dm–3 in a strongly polluted lake. Numerous authors reported different nitrogen concentration in a variety trophy of lakes. COBELAS et al.(1994) reported total nitrogen concentration of 0.1–6.0 mg dm–3 in a shallow hypertrophic lake. NOGES, LAUGASTE (1998) recorded high mean concentration of this element level of 4.5 mg N dm–3 in a strongly eutrophic lake, LOSSOW et al. (2004) as 3.08 mg N dm–3 and 4.75 mg N dm–3 (LOSSOW et al.1998) in a shallow strongly eutrophic lake subjected the restorative works (inactivation of phosphorus and aeration system, respectively). JENSEN et al. (1994) noted lower total nitrogen concentration level of 2.8 mg N dm–3 in a shallow eutrophic lake and MAYER et al. (1997) as 1.8 mg dm–3 in a shallow hypertrophic lake. According to NOGES et al. (2003) the mean total nitrogen concentration level of 2.8 mg N dm–3 is typical of strongly eutrophicated lakes. The above data and cited literature suggest that in Lake Jeziorak Mały in the years 2002, 2003 and 2005, low means abundance and biomass of green algae and high mean total nitrogen concentration indicate strongly eutrophicated character of this lake.
The development of phytoplankton, including also green algae, in shallow eutrophic lakes, e.g. Lake Jeziorak Mały, may be affected by a variety of factors, such as water temperature, intensity of solar

Qualitative and Quantitative Changes of Green Algae... 69
radiation, water mixing, resuspension of biogenic elements from sediments, biogene concentrations, especially phosphorus and nitrogen (PADISAK et al. 1990, REYNOLDS 1990, KREBS 1996), and also oxygenation (BJÖRKMAN 1966 cited in NASSAR, SHAMS EL-DIN 2006). Particular phytoplankton species have specific environmental requirements and occurrence in definable ranges of physiochemical water parameters (PEŁECHATY, BURCHARDT 1998) e.g. water temperature or total nitrogen concentration.
Every the species of algae develops in definable for him range of water temperature (RODHE 1948, WALLACE 1955, HUTCHINSON 1967, PATRICK 1969 and LOWE 1974 cited in KAWECKA, ELORANTA 1994). The algae can occur both in the wide and the narrow of temperature range. Many species of blue-greens the best develop in a water temperature of 20oC to 35oC, and Chryspohyta and green algae at 15oC to 25oC (WILDE, TILLY 1981 cited in KAWECKA, ELORANTA 1994). In Lake Jeziorak Mały in the years 2002, 2003 and 2005, somewhat lower range of temperature for the development of green algae from 10.0oC to 18.8oC was observed (Figure 1). The equations of multiple regression suggest that increased the biomass of green algae was followed by a decrease in water temperature (Table 2). In Lake Jeziorak Mały, the green algae preferred lower water temperature than has been noted in the cited literature, may be caused by strong competition of blue-greens for resources of biogenic elements at higher water temperatures, especially in the summer season (ZĘBEK 2005). A lower water temperature was noted in the littoral zone than in the pelagic zone, it could favor the development of these algae, confirming that were higher mean their abundance and biomass (Table 3). It should be noted, however, that in Lake Jeziorak Mały water from the catchment flows through the separators, which disturbs the annual pattern of water temperature in the littoral zone. Warmer waters are supplied to the lake in the spring and fall, with cooler waters in the summer (ZĘBEK 1997), which might influence the mean water temperature of the lake and result in the development of green algae.
Oxygen in water comes from exchange from atmosphere or photo-synthesis of green plants (LAMPERT, SOMMER 1996). Oxygen plays essential role for the development of plant. This gas influences the rate of photo-synthesis, regulates the nitrification process, thus it stimulates the development of plants, including also green algae group. According to BJÖRKMAN (1966) the rate of photosynthesis is diverse in dependence from oxygen content and is different at particular taxa of green algae e.g. Chlorella sp. and Ulna sp. (BJÖRKMAN 1966 cited in KEMP, DODDS 2001 and NASSAR, SHAMS EL-DIN 2006). Photosynthetic oxygen (hydrogen) produced by green algae was discovered in the pioneering experiments of GAFFRON, RUBIN (1942), who analyzed in several green algae taxa e.g. Chlorella sp., Chlamydomonas reinchardtii and Scenedesmus sp. (GAFFRON, RUBIN 1942 cited in GREENBAUM, LEE 1990). According to IRVING, DROWNGOOLE (1986) the green algae can participate in the production of oxygen at

70 Elżbieta Zębek
water temperature of 15oC. In Lake Jeziorak in the years 2002, 2003 and 2005, increased the abundance and biomass of green algae were followed by an increase in oxygen content in the water in months from August to September, when they reached the maximum biomass, and little decreased oxygen content at the their maximum abundance in October (Figure 2). Moreover, the equations of multiple regression between water temperature, oxygen content, total nitrogen concentration and the biomass of green algae, suggest that an increase in oxygen content was accompanied by an increase in the biomass of green algae (Table 2). This may suggest that oxygen content could stimulate the development of green algae, especially in the littoral zone, where were noted higher oxygen content and higher abundance and biomass of green algae than in the pelagic zone (Table 3).
The nitrogen besides phosphorus is taken by phytoplankton and both biogenic elements are considered to be an index of productive capacity of water bodies (KREBS 1996). The variations of nitrogen content in the water usually reflects an equilibrium between outsider inputs of nitrogen through sewage, nitrogen delivered during resuspension from bottom and nitrogen uptake by phytoplankton (CALVERT, PRICE 1971 cited in NASSAR, SHAMS EL-DIN 2006). The nitrogen in lakes can be restrictive factor for algae growth, particularly at a low N:P ratio (< 5) (KAWECKA, ELORANTA 1994). LAFRANCOIS et al. (2002) reported a high relationship between the phytoplankton composition and nitrogen concentration in a water. According to cited authors a high nitrogen concentrations favor the development of blue-greens and green algae. NASSAR, SHAMS EL-DIN (2006) recorded also a correlation between the abundance of phytoplankton and oxygen content (r = 0.93) and nitrogen (r = 0.52). JENSEN et al. (1994) observed an increase in the proportion of green algae at an increase in nitrogen concentration in a water and they noted a statistically significant relationship between the abundance of green algae and nitrogen concentration (r = 0.75). In Lake Jeziorak Mały in the years 2002, 2003 and 2005, the relation was also observed between the abundance and biomass of green algae and nitrogen concentration. In the months from August to October, rapidly increased the abundance and biomass of green algae was followed by an increase in total nitrogen concentration (Figure 2). Moreover, the equations of multiple regression between water temperature, oxygen content, total nitrogen concentration and the biomass of green algae, suggest that an increase in total nitrogen concentration was accompanied by an increase in the biomass of green algae (Table 2). This may suggest that an increase in this biogenic element could stimulate the development of green algae. It should be noted, however, that the development of green algae in the lake may be affected by a complex of factors, confirmed by the statistically significant coefficient of multiple correlation level of R = 0.4722. The equations of multiple regression suggest that from among analyzed factors, the largest influence the green

Qualitative and Quantitative Changes of Green Algae... 71
algae could have total nitrogen concentration (77.22%), then oxygen content (19.78%) and water temperature (3.00%) – Table 2.
The qualitative and quantitative changes of phytoplankton, including the green algae, are often described on the basis of annual succession patterns. Many authors reported the highest abundance of green algae in spring and in autumn. According to SOMMER (1993) green algae mass appeared after spring blooms of diatoms in a shallow eutrophic lake. The cited author recorded two development tops of these algae group in May and in October. GERVAIS et al. (1999) noted domination of green algae in May and in August in a shallow eutrophic lake; ROMO, MIRACLE (1994) in April and May, and MAYER et al. (1997) in July at oxygen content of 7.80 mg O2 dm–3 in a shallow hypertrophic lake, however NASSAR, SHAMS EL-DIN (2006) in autumn at oxygen content of 4.92 mg O2 dm–3
in a strongly polluted lake. An increase in nitrogen concentration in annual cycle, as was previously mentioned, can favor the development of green algae. In a polimictic lake e.g. Lake Jeziorak Mały, mixing waters could to have influence oxygen content and biogenic elements and the plankton organisms. According to REYNOLDS (1984), GERVAIS et al. (1999), NOGES et al. (1999) the biogenic elements are accumulated in the sediments and are freed to water in results resuspension during mixing waters in a small eutrophic lake. WILHELM, ADRIAN (2008) the largest mixing waters expressed in percentages observed in April and May, which decreased in Juny and July, and increased from August to total mixing in October. During the mixing waters considerably increased nitrogen concentration from 50 to 330 μl–1. NOGES, LAUGASTE (1998) the highest nitrogen concentration noted in spring and in autumn in a strongly eutrophic lake. In Lake Jeziorak Mały in the months from April to October, two abundance green algae tops were noted in spring (April) and in autumn (September, October) at high nitrogen concentration during intensive mixing waters. However, the maximum abundance of green algae was recorded in October at the highest concentration of the element (Figure 2). The above data and cited literature suggest that the additional source of nitrogen in Lake Jeziorak Mały could be resuspension of the element from sediments during intensive mixing waters, especially in spring and in autumn, it might favor the development of green algae. This fact can be confirming a somewhat lower oxygenation and higher mean total nitrogen concentration in the pelagic zone than in the littoral zone (Table 3).
The characteristic features of green algae communities in a variety trophy of lakes are: number of taxa and dominant in the total abundance and biomass of phytoplankton. In a lakes characterized by very high biogenic concentrations, e.g. Lake Jeziorak Mały, the species number of phytoplankton is lower than in a less eutrophicated or oligotrophic lakes. This means that the number of species increases along with an increase in eutrophy, before it starts to reduce, which can be observed in hypertrophic lakes (REYNOLDS 1984). CELEWICZ-GOŁDYN (2005) reported 56 taxa of green

72 Elżbieta Zębek
algae in a shallow eutrophic lake. In Lake Jeziorak Mały in the years 2002, 2003 and 2005, higher number of taxa of these algae was noted in the littoral zone (71) than in the pelagic zone (45) – Table 3. This may suggest that in spite high trophy of the lake, the green algae characterized with large choice of species, especially in the littoral zone, confirmation this can be also high Shannon-Weaver species diversity index level of 4.2685 bit. indiv.–1 (Table 3).
In Lake Jeziorak Mały in the years 2002, 2003 and 2005, differences in the dominants in the total abundance and biomass of green algae between the littoral and pelagic zones were observed. In the case of abundance, dominated taxa typical of plankton in both zones, in turn Micratinium pusillum, Chlamydomonas spp. and Koliella variabilis in the littoral zone and Golenkinia radiata, Chlamydomonas spp. and Monoraphidium concortum in the pelagic zone (Table 4). According to BOMBÓWNA (1985) cited in BUCKA (1989), mass occurrence of the genera Chlamydomonas spp., Monoraphidium spp. maybe probably connected from large inflow of biogenic elements, particularly nitrogen. These taxa have the quick rate of reproduction and can occurrence in a nitrogen – rich waters. Many authors reported domination of these taxa in eutrophic lakes. COULTER et al. (1983), GERVAIS et al. (1999) recorded domination of the genus Chlamydomonas spp. in a shallow eutrophic lake and NASSAR, SHAMS EL-DIN (2006) in a strongly eutrophic lake. These taxa have been noted mainly in a pelagic zone. This may suggest that in the pelagic zone of Lake Jeziorak Mały, the possibility of inflow of nitrogen during resuspension from sediments could stimulate the development of green algae characteristic of biogene – rich eutrophic lakes, such as Chlamydomonas spp. and Monoraphidium concortum.
In Lake Jeziorak Mały in the years 2002, 2003 and 2005, in the case of biomass of green algae dominated the taxa typical of plankton (Chlamydomonas spp., Golenkiniopsis sp. and Pediastrum duplex) in the pelagic zone and filamentous forms of green algae (Spirogyra sp., Stigeoclonium sp. and Ulothrix tenuissima) in the littoral zone (Table 4). CELEWICZ-GOŁDYN (2005) reported occurrence of the genus Spirogyra sp. in a pelagic zone of shallow eutrophic lake, and NASSAR, SHAMS EL-DIN (2006) numerous occurrence of the genus Stigeoclonium sp. in a strongly eutrophic lake. A filamentous green algae often are a component of plant periphyton. LEMBI (2000), PILLSBURY et al. (2002) recorded numerous occurrence of the genus Spirogyra sp. in plant periphyton. However, HILLEBRAND (1978) reported domination of the genus Ulothrix sp. in epiphyton in an eutrophic lake. According to BURCHARDT, MESSYASZ (2004) frequent mixing waters in a shallow water bodies cause, that species typical of benthic (periphytic) sometimes can find in plankton in a pelagic zone. This situation could take place also in Lake Jeziorak Mały during intensive mixing waters, when the filamentous green algae as a component of plant periphyton, especially on the stones (ZĘBEK 2008),

Qualitative and Quantitative Changes of Green Algae... 73
could be rinsed to water. The above data and cited literature suggest that the dominant taxa of green algae in Lake Jeziorak Mały are typical of eutrophic waters. In the case of abundance, dominated the plankton taxa and biomass – filamentous forms, which often were a component of plant periphyton. This may suggest the anthropogenically transformation of the littoral zone of Lake Jeziorak Mały with creation new habitats for development of plan periphyton (mainly stones) could contribute to the enrichment of green algae group in typical of periphytic species.
Translated by Elżbieta Zębek Accepted for print 10.12.2008
References
BUCKA H. 1989. Ecology of selected planktonic algae causing water blooms. Acta Hydrobiologia, 31(3/4): 207–258.
BURCHARDT L., MESSYASZ B. 2004. Fykoflora Jeziora Trzebidzkiego w roku 2003. Biul. Parku Kra-jobraz. Wielkopol., 10,12: 135–168.
CELEWICZ-GOŁDYN S. 2005. Pelagic phytoplankton in four basins of the Rosnowskie Duże Lake in the Wielkopolska National Park. Rocz. Ar Pozn. CCCXXII, Bot. Stec., 8: 11–25.
CIECIERSKA H. 2000. Zróżnicowanie przestrzenne roślinności litoralu i otuliny wybranych jezior miejskich Pojezierza Mazurskiego. Rozpr. i monogr., nr 34, Wyd. UWM, Olsztyn, pp. 77.
COBELAS M.A., VELASCO J.L., RUBIO A., ROJO C. 1994. The time course of phytoplankton biomass and related limnological factors in shallow and deep lakes: a multivariate approach. Hydro-biol., 275/276: 139–151.
COULTER G.W., DAVIES J., PICKMERE S. 1983. Seasonal limnological change and phytoplankton production in Ohakuri, a hydro-electric lake on the Waikato River. New Zeal. J. Mar. Fresh., 17: 169–183.
CYDZIK D., SOSZKA H. 1988. Atlas stanu czystości jezior Polski badanych w latach 1979–1983. Monitoring Środowiska, Wyd. Geologiczne, Warszawa.
GERVAIS F., BERGER S., SCHÖNFELDER I., RUSCHE R. 1999. Basic limnological characteristics of the shallow eutrophic lake Grimnitzsee (Brandenburg, Germany). Limnologica, 29: 105–119.
GREENBAUM E., LEE J.W. 1999. Photosynthetic hydrogen and oxygen production by green algae. Symposium on Hydrogen Production, Storage and Utilization sponsored by the American Chemical Society, New Orleans, Louisiana, August 22–26, 1999, 1–5.
GUILFORD J.P. 1964. Podstawowe metody statystyczne w psychologii i pedagogice. PWN, Warszawa.HILLEBRAND H. 1978. Factor analysis of temporal and spatial patterns of multicellular green
freshwater algae. Verh. Internat. Verein. Limnol., 20: 2341–2346.HINDAK F. 1996. Key to the unbrancled filamentous green algae (Ulotrichineae, Ulotrichales, Chlo-
rophyceae). Biulletin Slovenskej botanickej spolocnosti pri SAV, Bratislava.HUBER-PESTALOZZI G., KOMAREK J., FOTT B. 1983. Das Phytoplankton des Sűsswassers, Systema-
tik und Biologie. Tell. 7. Chlorophyceae (Grűnalgen), Stuttgart.IRVING D.E., DROMGOOLE F.I. 1986. Algal populations and characteristics of oxygen exchange
of effluent samples from a facultative oxidation pond. New Zeal. J. Mar. Fresh., 20: 9–16.JANKOWSKI A. 1966. Studies on thermal-oxygen conditions in the Lake Jeziorak. Zesz. Nauk.
Uniw. Mikołaja Kopernika Toruń, 16(2): 17–31.JENSEN J.P., JEPPENSEN E., OLRIK K., KRISTENSEN P. 1994. Impact of nutrients and physial factors
on the shift from cyanobacterial and chlorophyte dominance in shallow Danish lakes. Can. J. Fish. Aquat. Sci., 51: 1692–1699.
JEPPENSEN E., JENSEN J.P., SOENDERGAARD M., LAURIDSEN T., LANKULDEHUS F. 2000. Trophic struc-ture, species richness and biodiversity in Danish lakes: changes along a phosphorus gradient, Freshwat. Biol., 45(2): 201–218.

74 Elżbieta Zębek
KAWECKA B., ELORANTA P.V. 1994. Zarys ekologii glonów wód słodkich i środowisk lądowych. PWN, Warszawa.
KEMP M.J., DODDS W.K. 2001. Centimeter scale patterns in dissolved oxygen and nitrification rates in a prairie stream. J. North Am. Benthol. Soc., 20(3): 347–357.
KREBS J. 1996. Ekologia. PWN, Warszawa.LAFRANCOIS B.M., NYDICK K.R., CARUSO B. 2002. Influence of nitrogen on phytoplankton biomass
and community composition in fifteen snowy range lakes (Wyoming U.S.A.), Arct. Antarct. Alp. Res., 499–508.
LAMPERT W., SOMMER U. 1996. Ekologia wód śródlądowych. PWN, Warszawa.LEMBI C.A. 2000. Relative tolerance of mat-forming algae to copper (notes). J Aquat. Plant Man-
age., 38: 67–70.LOSSOW K. 1998. Ochrona i rekultywacja jezior – teoria i praktyka. Idee Ekolog. Ser. Szkice, 13(7):
55–71.LOSSOW K., GAWROŃSKA H., JASZCZUŁT R. 1998. Attempts to use wind energy for artificial destrati-
fication of Lake Starodworskie. Pol. J. Environ. Stud., 7(4): 221–227. LOSSOW K., GAWROŃSKA H., ŁOPATA M., JAWORSKA B. 2004. Selection criteria for restoration me-
thod on Lake Suskie. Limnol. Review, 4: 143–152.MAYER J., DOKULIL M.T., SALBRECHTER M., BERGER M., POSCH T., PFISTER G., KRISCHNER A.K.T.,
VELIMIROV B., STEITZ A., ULBRICHT T. 1997. Seasonal successions and trophic relations between phytoplankton, zooplankton, ciliate and bacteria in a hypertrophic shallow lake in Vienna, Austria. Hydrobiologia, 342/343: 165–174.
NASSAR M.Z., SHAMS EL-DIN N.G. 2006. Seasonal dynamics of phytoplankton community in the Bitter Lake and Temsah Lake. Egypt. J. Aquatic Res., 32(1):198–219.
NOGES P., JARVET P.A., TUVIKENE L., NOGES T. 1998. The budgets of nitrogen and phosphorus in shallow eutrophic Lake Vortsjarv (Estonia). Hydrobiologia, 363: 219–227.
NOGES P., LAUGASTE R.. 1998. Seasonal and long-term changes in phytoplankton of Lake Vortjarv. Limnologica, 28(1): 21–28.
NOGES P., NOGES T., TUVIKENE L., SMAL H., LIGEZA S., KORNIJÓW R., PECZULA W., BECARES E., GARCIA-CRIADO F., ALVAREZ-CARRERA CH., FERNANDEZ-ALAEZ C., FERRIOL C., MIRACLE R.M., VINCENTE E., ROMO S., VAN DONK E., VAN DE BUND W., JENSEN J.P., GROSS E.M., HANSSON L.A., GYLLSTRÖM M., NYKÄNEN M., DE EYTO E., IRVINE K., STEPHEN D., COLLINGS S., MOSS B. 2003. Factors controlling hydrochemical and trophic state variables in 86 shallow lakes in Europe. Hydrobiologia, 506–509: 51–58.
OLRIK K. 2003. The occurence of planktonic desmid species in Danish lakes and ponds related to total nitrogen and phosphorus contents of the water body. Biologia, Bratislava, 58(4): 709–716.
PADISAK J., TOTH L.G., RAJCZY M. 1990. Stir-up effect of wind on a more-or-less stratified shallow lake phytoplankton community, Lake Balaton, Hungary. Hydrobiologia, 191: 249–254.
PEŁECHATY M., BURCHARDT L. 1998. Problemy bioindykacji w strefie ekotonowej jezior. W: Ekotony słodkowodne. Struktura-rodzaje-funkcjonowanie, Red. S. Radwan. Wyd. UMCS, Lublin.
PILLSBURY R.W., LOWE R.L., PAN Y.D., GREENWOOD J.L. 2002. Changes in the benthic algal com-munity and nutrient limitation in Saginaw Bay, Lake Huran, during the invasion of the zebra mussel (Dreissena polymorpha). J. North Am. Benthol. Soc., 21: 238–252.
REYNOLDS C.S. 1978. IX. Ecology of Aquatic Organisms. 2. Algae and other Plants. Stratification in natural populations of bloom-forming blue-green algae. Verh. Internat. Verein. Limnol., 20: 2285–2292
REYNOLDS C.S. 1984. Phytoplankton periodicity: the interactions of form, function and environ-mental variability. Freshwat. Biol., 14: 111–142.
REYNOLDS C.S. 1990. Temporal scales of variability in pelagic environmental and the response of phytoplankton. Freshwat. Biol., 23: 25–53.
ROMO S., MIRACLE R. 1994. Long-term phytoplankton changes in a shallow hypertrophic lake, Albufera of Valencia (Spain). Hydrobiologia, 275/276: 153–164.
ROTT E. 1981. Some results from phytoplankton counting intercalibrations. Schweizerische Zeitschrift für Hydrologie, 43: 34–62.
SOMMER U. 1993. Disturbance-diversity relationships in two lakes of similar nutrients chemistry
Qualitative and Quantitative Changes of Green Algae... 75
but contrasting disturbance regimes. Hydrobiologia, 249: 59–65.SOMMER U., GLIWICZ Z.M., LAMPERT W., DUNCAN A. 1986. The PEG-model of seasonal succession
of planktonic events in fresh waters. Arch. Hydrobiol., 106(4): 433–471. SPODNIEWSKA I. 1979. Phytoplankton as the indication oflakes eutrophication. II. Summer situa-
tion in 25 masurian lakes in 1976. Ekol. Pol., 27: 481–496.VOLLENWEIDER R.A. 1968. Scentific fundamentals of the eutrophication of lakes and flowing wa-
ters with particular references to nitrogen and phosphorus as factors in eutrophication. Paris, Org. Econ. Co-oper. Developm. Direct. Sci. Affaris. DAS/SCI/68, 27
WILHELM S., ADRIAN R. 2008. Impact of summer warming on the thermal characteristics of a polymictic lake and consequences for oxygen, nutrients and phytoplankton. Freshwat. Biol., 53: 226–237.
ZĘBEK E. 1997. Zmiany ilościowe i jakościowe fitoplanktonu w cyklu rocznym w politroficznym jeziorze Jeziorak Mały. XVII Zjazd Hydrobiologów Polskich, 8–11.09, Poznań (doniesienie).
ZĘBEK E. 1998. Water temperature of the littoral zone during the domination of the blue – green algae Planktothrix agardhii i Limnothrix redeckei in the composition of phytoplankton in the polytrophic lake Jeziorak Mały. Oceanol. Stud., 1: 53–59.
ZĘBEK E. 2005. Annual successsion patterns of blue-green algae vs. physicochemical water parameters in the urban Lake Jeziorak Mały in the years 1998–2003 period. Oceanol. Hydrobiol.
Stud., 36(4): 33–46.ZĘBEK E. 2007. Changes of species diversity of phytoplankton and physicochemical parameters
in annual cycles in the urban Lake Jeziorak Mały. Oceanol. Hydrobiol. Stud., Phycologica Polonica, 36(1): 49–55.
ZĘBEK E. 2008. Comparison of plant periphyton on the different substrates in the urban Lake Jeziorak Mały. XXVII Międzynarodowa Konferencja Fykologiczna 12–15 czerwiec 2008, Łódź-Spała (komunikat).

76 Daniel Żarski et al.POLISH JOURNAL OF NATURAL SCIENCES Abbrev.: Pol. J. Natur. Sc., Vol 24(1) 76-84, Y. 2009
DOI 10.2478/v10020-009-0007-9
MASS INITIAL REARING OF BURBOT LOTA LOTA (L.) LARVAE UNDER CONTROLLED CONDITIONS
1Daniel Żarski, Wojciech Sasinowski, Dariusz Kucharczyk, Maciej Kwiatkowski, Sławomir Krejszeff, Katarzyna Targońska
Department of Lake and River Fishery University of Warmia and Mazury in Olsztyn
K e y w o r d s: Lota lota, burbot, larvaeculture, mortality, controlled conditions, feeding.
A b s t r a c t
In this study the suitability of various feeds in mass rearing of burbot Lota lota (L.) larvae under controlled conditions was determined. During the rearing the fish were fed with: artificial fodder, live Artemia nauplii and decapsulated cysts of artemia. The experiment continued for 20 days and it was conducted from hatching of the larvae. The initial density of fish during rearing was 1000 individuals dm–3. Rearing water temperature was set at 12oC. The parameters such as: average body length and height of the larvae and survival after completion of rearing period, were recorded. The Artemia nauplii proved the most suitable for feeding burbot larvae during the initial rearing. Additionally, high mortality of larvae was recorded during the period of filling the swim bladder.
MASOWY PODCHÓW LARW MIĘTUSA (LOTA LOTA L.) W WARUNKACH KONTROLOWANYCH
Daniel Żarski, Wojciech Sasinowski, Dariusz Kucharczyk, Maciej Kwiatkowski, Sławomir Krejszeff, Katarzyna Targońska
Katedra Rybactwa Jeziorowego i Rzecznego Uniwersytet Warmińsko-Mazurski w Olsztynie
S ł o w a k l u c z o w e: Lota lota, miętus, larwikultura, śmiertelność, warunki kontrolowane, żywienie.
A b s t r a k t
W badaniach określono przydatność różnego rodzaju pokarmu w masowym podchowie larw miętusa (Lota lota L.) w warunkach kontrolowanych. Podczas podchowu ryby karmio-no: paszą sztuczną, żywymi stadiami nauplialnymi solowca oraz dekapsulowanymi cystami solowca. Eksperyment trwał 20 dni i prowadzono go od momentu wyklucia się larw. Zagęsz-czenie ryb podczas podchowu wynosiło 1000 osobn. dm–3. Temperaturę podchowu ustalono na 12oC. Notowano takie parametry jak: średnia długość i wysokości ciała larw oraz przeżywal-ność ryb po zakończeniu okresu podchowu. Najbardziej przydatne w żywieniu larw miętusa w początkowym okresie podchowu okazały się stadia nauplialne solowca. Odnotowano ponad-to wysoką śmiertelność larw w okresie napełniania przez nie pęcherza pławnego.
1Address: Daniel Żarski, University of Warmia and Mazury, ul. Oczapowskiego 5, 10-957 Olsztyn, e-mail: [email protected]

Mass Initial Rearing of Burbot Lota lota (L.) Larvae under Controlled Conditions 77
Introduction
During the past century a regular decrease in the population of burbot (Lota lota L.) within the entire area of its appearance was recorded. Including that species in the “Red list of freshwater ichthyofauna of Poland” (WITKOWSKI et al. 1999), as well as its disappearance in numerous countries of Europe create the necessity of improving both the biotechnology of reproduction and rearing of larvae for aquaculture and restitution purposes. Currently an increasing interest in that species from economic and environmental perspective is observed (KUJAWA et al. 2002a). In numerous countries, including Germany, Austria and Poland, attempts have already been undertaken to investigate the effectiveness of stocking open waters with the material produced under controlled conditions (WOLNICKI et al. 1999 a, b). Positive results of such research projects indicate a high potential for rearing burbot. The fast growth rate and high market price of the fish are the additional arguments in favour of implementing the latest achievements of biotechnology in rearing it (KUJAWA et al. 2002a, MAMCARZ 2003, KUCHARCZYK et al. 2004b).
In published data sources a lot of information on rearing of burbot larvae can be found although mass rearing of that species continues to be a subject that has yet been insufficiently known. Until now, the studies were conducted under fully controlled laboratory conditions considering low density of fish (WOLNICKI et al. 1999a, b, 2002, WOLNICKI 2001, KUJAWA et al. 1999, 2002b, KUCHARCZYK et al. 2004a, b). For fishery practice high individual fecundity of burbot reaching even 3,000,000 eggs (VOSTRADOVSKA 1963, BAILEY 1972, ANDRZEJEWSKI 1993) is important, which, coupled with high effectiveness of reproduction, as a result of which the embryos survival rate at the level exceeding 70% can be obtained (KUCHARCZYK et al. 2004 a, b), creates the necessity for using a large number of rearing tanks in case of applying standard densities of fish at several to some tens of individuals per 1 dm3. It was decided then to conduct mass rearing at the density so far not reported in the literature. Suitability of various feeds during mass rearing of the larval stages of burbot was also investigated.
Materials and Methods
Burbot spawners originated from Szczecin Lagoon (North-West Poland). The spawn was obtained during controlled spawning conducted according to the methodology described by KUCHARCZYK et al. (2004a). At the end of the incubation period the eggs were transported to the hatchery of the Department of Lake and River Fishery at the University of Warmia and Mazury in Olsztyn, where after placing it in water at the temperature of 6oC (+0,3), mass hatching of larvae took place.

78 Daniel Żarski et al.
Three experimental groups were established by placing the fresh hatched larvae in three tanks of 150 dm3 each. The markings of individual groups are presented in Table 1.
In each tank 150,000 individuals were placed, which gave the initial density of 1000 individuals dm–3. Freshly hatched larvae were counted by means of volumetric method (“wet”) according to the methodology described by GOLUBIEWSKA et al. (1998).
T a b l e 1
Feeding variants applied during rearing of burbot larvae
Type of food Hours of feeding
Group I Gemma Micro 150 8.0012.0016.0020.00
Group II decapsulated cysts of Artemia 8.0012.0016.0020.00
Group III Artemia nauplii 8.0020.00
Rearing was conducted in open water system for 20 days. Larvae were stocked to the tanks at time when ~50% of larvae started swimming actively but before filling the swim bladder. Water temperature in all tanks was the same at 12 ± 0.2oC. The inflow of water from the top and delicate aeration were provided. During the rearing the following parameters were measured: content of dissolved oxygen in water, concentrations of ammonia, nitrates and nitrites as well as pH. The tanks were lighted with gas-discharge tubes. The photoperiod was 15 hours of light and 9 hours of darkness per day (the light period covered from 06:00 until 21:00). During the entire rearing period the larvae were fed ad libitum 2 or 4 times a day depending on feeding variant applied (Table 1). At the end of each day, before the last feeding, the tanks were cleaned and at that time dead fishes were removed.
Test samples were collected at the time of stocking the tanks ad as of day 5 of rearing every 3 days. Each sample consisted of 30 individuals from each tank. Morphometric parameters such as body length (l.t.) and body height of larvae were measured with the accuracy of 0.01 mm. Additionally presence of feed in the alimentary system of the larvae was recorded. The documentation and analysis of results were maintained using computer software DP-Soft based on Analysis® software. The survival of larvae at the end of the experiment was determined by counting them on the last day of rearing by volumetric method (GOLUBIEWSKA et al. 1998).

Mass Initial Rearing of Burbot Lota lota (L.) Larvae under Controlled Conditions 79
Statistical differences between groups were analysed by single factor analysis of variance (ANOVA) and Tuckey’s post hoc test at the significance level below 5% (p < 0.05). Correlations between values of parameters recorded (average body length and height) and the rearing time were studied using regression analysis. Statistical analysis was conducted using Microsoft Excel and Statistica software.
Results
Physicochemical parameters of water monitored during the experiment (levels of ammonia, nitrates and nitrites) in each of the tanks were at the low level (Table 2). Content of oxygen dissolved in water did not drop below 6 mg dm–3.
T a b l e 2Physicochemical parameters of water monitored during the experiment.
Parameter Value
Dissolved oxygen >6.0 mg dm-3
Temperature 12+0.2oC
Ammonia <0.2 mg dm–3
Nitrite <0.04 mg dm–3
Nitrate <20 mg dm–3
pH 7.2–7.8
Results obtained during 20 days of the experiment showed evident differences between three experimental groups. In the first variant where burbot larvae were fed with Gemma Micro 150 feed the slowest increase in total body length (l.t.) was recorded (Figure 1). Among the fish from that experimental group a decrease in the average body height was also recorded (Figure 2). In this experimental group the highest share of individuals with developmental defects visible during macroscopic examination (spinal curvature) (Figure 3) as well as the highest mortality among the three experimental groups (Figure 4) were also recorded.
In the second experimental setup where burbot was fed with decapsulated cysts of artemia the feeding effects proved unsatisfactory. The average growth of larvae was higher than in the group fed on artificial feed, but significantly lower than in case of the fish fed with live Artemia nauplii (Figure 1). Additionally a significant difference in body height as compared to group I was recorded (Figure 2). Also in that group a high percentage of larvae with developmental defects was recorded, although it was lower by a half than in the case of the first variant (Figure 3). Although the survival rate of fish in that group was slightly higher than in the group fed with Gemma feed (no statistical differences were determined, however), it was significantly lower than in case of feeding
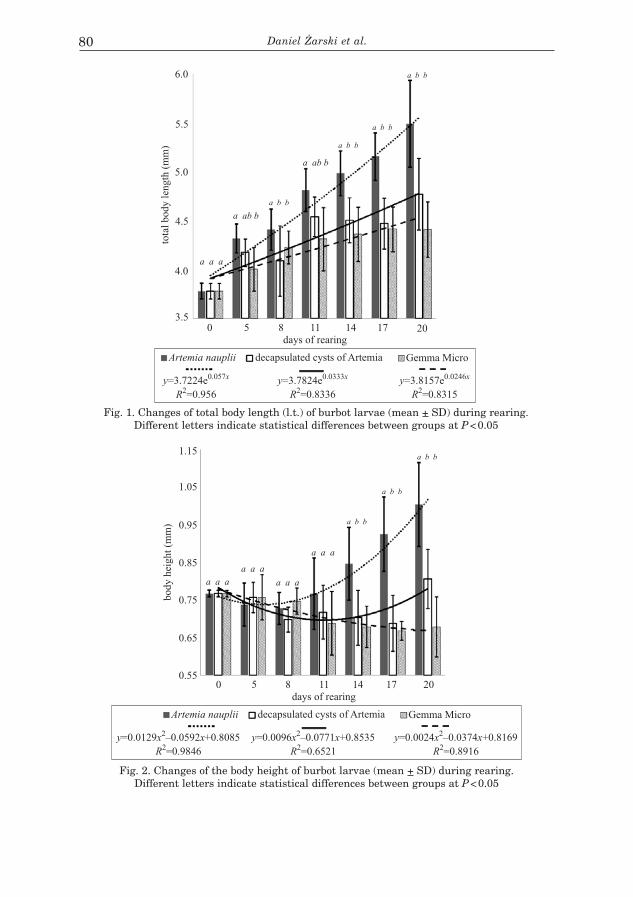
80 Daniel Żarski et al.
Fig. 1. Changes of total body length (l.t.) of burbot larvae (mean + SD) during rearing. Different letters indicate statistical differences between groups at P < 0.05
Fig. 2. Changes of the body height of burbot larvae (mean + SD) during rearing. Different letters indicate statistical differences between groups at P < 0.05
days of rearing
6.0
5.5
5.0
4.5
4.0
3.5
tota
lbody
length
(mm
)
a ab b
a a a
a b b
a ab b
a b b
a b b
a b b
y
R
=3.7224e
=0.956
0.057
2
x y
R
=3.7824e
=0.8336
0.0333x
2
y
R
=3.8157e
=0.8315
0.0246x
2
0 5 8 11 14 17 20
Artemia nauplii decapsulated cysts of Artemia Gemma Micro
days of rearing
a a a
a b b
a b b
a b b
0 5 8 11 14 17 20
Artemia nauplii decapsulated cysts of Artemia Gemma Micro
a a a
a a a
a a a
0.55
0.65
0.75
0.85
0.95
1.05
1.15
body
hei
ght
(mm
)
y x x
R
=0.0129 –0.0592 +0.8085
=0.9846
2
2
y x x
R
=0.0096 –0.0771 +0.8535
=0.6521
2
2
y x x
R
=0.0024 –0.0374 +0.8169
=0.8916
2
2

Mass Initial Rearing of Burbot Lota lota (L.) Larvae under Controlled Conditions 81
with live nauplial stages of artemia (Figure 4). Observations of digestive tract filling at the end of the experiment showed that in variant I and variant II the numbers of feed consuming larvae were compatible (over 4% of the initial stock). It should be noticed, however, that the survival almost 40% more fish of group II survived.
Gemma Micro Artemia naupliidecapsulated cystsof Artemia
70
60
50
40
30
20
10
0
per
centa
ge
of
indiv
idual
s(%
)
a
b
c
[ ]a [ ]a
[ ]b
developmental defects bacterial deposit
Gemma Micro Artemia naupliidecapsulated cystsof Artemia
35
30
25
20
15
10
5
0
surv
ival
(%)
b
a
a
individuals in which food in digestive tract not recordedindividuals with filled digestive tract
Fig. 3. Percentage of individuals with developmental defects and bacterial deposit at the end of the experimental rearing. Different symbols indicate statistical
differences between groups at P < 0.05
Fig. 4. Survival of burbot larvae at the end of the experiment in concern with percentage of individuals in which food in digestive tract were recorded. Different letters indicate statistical
differences between groups at P < 0.05

82 Daniel Żarski et al.
In group III where the larvae were fed on live nauplii artemia the highest increase in length differing from the results in the two earlier experimental groups was recorded (Figure 1). A similar trend was found in case of changes in the average body height of the larvae. After the initial slight decrease in that value an evident increase of it was recorded (Figure 2). Additionally no developmental defects were found among individuals fed with this type of feed (Figure 3). The survival rate in that group was over three times higher at over 30%, while digestive tracts of 100% of individuals were filled with the feed at the end of the experiment (Figure 4).
During control measurements presence of deposit that was classified as bacterial (the species of bacteria was not determined) was found on some individuals. It appeared in the groups fed with Gemma Micro 150 feed and with decapsulated cysts of artemia (Figure 3).
Discussion
WOLNICKI et al. (2002) reported that larvae of burbot reared at the temperature of 12oC, under controlled conditions are characterised by low growth rate, but also low mortality rate (10%). This temperature was chosen for this study, which can also be justified economically. Some authors used reared rotifers (Brachionus calyciflorus) (SHIRI HARZEVILI 2003, 2004) and protozoa (Paramecium caudatum) (KUJAWA et al. 2003) as the first feed of burbot under controlled conditions. Only after a few days the fish were given the nauplial stages of artemia. However, as reported by WOLNICKI et al. (2002) and KUJAWA et al. (2003), burbot larvae can be fed from the very beginning with nauplial stages of artemia obtaining high survival rates (90% at 12oC). In the group of larvae fed with Gemma Micro 150 feed, which is a substitute of live feed it was noticed that the fish were unwilling to ingest it, which lead to mass mortality in that group. On the other hand in feeding individual presence of developmental defects as well as the slowest among all the experimental groups rate of body length increase. This could be caused by insufficient quantity of digestive enzymes, which in case of feeding the larvae with live feed are additionally supplied together with the victim (POCZYCZYŃSKI 1996 a, b). Additionally, all the fish in that group were apathetic and their distribution indicated poor fitness; presence of the bacterial deposit was found on them. As it was also found on individuals developing correctly the suspicion that presence of the deposit could be linked to developmental defects was rejected. Individuals that were given dry decapsulated cysts of artemia showed intermediate characteristics as compared to the other two groups. The fish, similar to the first variant, were unwilling to intake dry feed in the form of decapsulated cysts of artemia. A relatively high percentage of body deformations was observed which could indicate

Mass Initial Rearing of Burbot Lota lota (L.) Larvae under Controlled Conditions 83
shortage of nutrients. The bacterial deposits were present in a significant number of larvae.
Fish fed on live Artemia nauplii were evidently more active as concerns mobility, evenly distributed in the tanks and the time of feeding stimulated them for active intake of the feed. The survival rate of larvae at the end of the experiment was the highest in this variant (30.33%), however it was low as compared with that reported by other authors (over 90%) (WOLNICKI et al. 1999a, b, 2002, WOLNICKI 2001, KUJAWA et al. 2002b, KUCHARCZYK et al. 2004b). The reason could be that in this experiment larvae were used before filling the swim bladder. That methodological option was chosen in an attempt at combining the scientific effect with practical application. It should be highlighted that the survival rate of such larvae is definitely lower because individuals with not filled swim bladder die and the mortality resulting from that exceeds even 90% (KUJAWA et al. 2002a, KUCHARCZYK et al. 2004b). Small ultimate dimensions of the initially reared larvae could indicate both excessive densities as well as too early stage of development the larvae used in this study. WOLNICKI et al. (2002) report that burbot larvae after 20 days of rearing at the temperature of 12oC can reach the length of over 9 mm, while SHIRI HARZEVILI et al. (2004) under the same conditions obtained the larvae with the average length of over 7 mm. The important issue is that larvae either on the 10th day after hatching (WOLNICKI et al. 2002) or after resorption of the yolk sac (SHIRI HARZEVILI et al. 2003, 2004) were used.
The results obtained indicate, among others, that it is necessary to determine the maximum optimal densities in case of mass rearing as well as to use live food as first feed for burbot larvae. Additionally the study shows the risk of high losses in the stock at the level of ca. 70% as a result of, among others, not filling the swim bladder.
Translated by Jerzy Gozdek Accepted for print 3.12.2008
References
ANDRZEJEWSKI W. 1993. Nasze ryby: miętus. Przegląd Rybacki, 3: 18–20.BAILEY M. 1972. Age, Growth, Reproduction and Food of the Burbot, Lota lota (L.), in Southwestern
Lake Superior. Transactions of the American Fisheries Society, 4: 667–674.GOLUBIEWSKA M., MAJEWSKA G., KŁODZIŃSKA H., OKONIEWSKI Z. 1998. Przetrzymywanie, manipu-
lacje i metody szacowania liczebności wylęgu ryb ciepłolubnych w wylęgarni. W: Wylęgarnia 1997–1998. Red. J. Waluga, Wyd. IRS, 133–151.
KUCHARCZYK D., MAMCARZ A., KUJAWA R., BABIAK I., GLOGOWSKI J., SAROSIEK B., KOWALSKI R., SKRZYPCZAK A., TARGONSKA-DIETRICH K., CHWALUCZYK R. 2004a. Burbot (Lota lota L.) repro-duction in captivity: comparison of different methods. In: Elevage de la lotte (Lota lota): Recherche et perspectives. Ed. Y. Jouan, F.L.A.C., Nancy, 12–16.
KUCHARCZYK D., KUJAWA R., MAMCARZ A., SKRZYPCZAK A., FURGAŁA-SELEZNIOW G., TARGOŃSKA-DIE-TRICH K. 2004b. Zootechnical parameters of rearing burbot larvae and juveniles. In: Elevage de la lotte (Lota lota): Recherche et perspectives. Red. Y. Jouan, F.L.A.C., Nancy, 6–11.

84 Daniel Żarski et al.
KUJAWA R., KUCHARCZYK D., MAMCARZ A. 1999. The rearing methods of burbot (Lota lota L.) fry un-der controlled conditions. European Aquaculture Society, Special Publication, 27: 135–136.
KUJAWA R., KUCHARCZYK D., MAMCARZ A. 2002a. Miętus, Wyd. IRS.KUJAWA R., KUCHARCZYK D., MAMCARZ A. 2002b. Biotechnika wychowu miętusa (Lota lota L.)
w warunkach kontrolowanych. W: Wylęgarnia 2001–2002 Red. Z. Okoniewski, E. Brzuska, Wyd. IRS, s: 77–87.
KUJAWA R., KUCHARCZYK D., MAMCARZ A. 2003. Biotechnika wychowu miętusa (Lota lota L.) w wa-runkach kontrolowanych. In: Ryby drapieżne. Rozród, podchów, profilaktyka. Red. Z. Zakęś et al., Wyd. IRS, 77–88.
MAMCARZ A. 2003. Miętus, nowy gatunek w akwakulturze ryb zimnolubnych, www.aquaflow.org, TL2003–198.
POCZYCZYŃSKI P. 1996a. Żywienie larw ryb – podstawy teoretyczne. I. Procesy trawienne u larw ryb. Komun. Ryb., 3: 7–8.
POCZYCZYŃSKI P. 1996b. Żywienie larw ryb – podstawy teoretyczne. II. Pasze sztuczne w żywieniu larw. Komun. Ryb., 4: 19–20.
SHIRI HARZEVILI A., DE CHARLEROY D., AUWERX J., VUGHT I., SLYCKEN J. VAN, DHERT P., SORGELOOS P. 2003. Larval rearing of burbot (Lota lota L.) using Brachionus calyciflorus rotifer as starter food. Journal of Applied Ichtiology, 19: 84–87.
SHIRI HARZEVILI A., DOOREMONT I., VUGHT I., AUWERX J., QUATAERT P., CHARLEROY D. DE. 2004. First feeding of burbot, Lota lota (Gadidae, Teleostei) larvae under different temperature and light conditions. Aquaculture Research, 35: 49–55.
VOSTRADOVSKA M. 1963. K biologii mnika jednovouseho (Lota lota L.) v Lipenske Udolni Nadrźi. I. Zmeny vahy jater, gonad a koeficientu vykrmenosti v pfedvyterovem obdobi. Bul VURH Vodńany, 3: 53–78.
WITKOWSKI A., BŁACHUTA J., KOTUSZ J., HEESE T. 1999. Czerwona lista słodkowodnej ichtiofauny Polski. Chrońmy Przyr. Ojczystą, 55(4): 5–19.
WOLNICKI J. 2001. Szanse masowej produkcji materiału zarybieniowego miętusa Lota lota (L.) w świetle ostatnich prac badawczych w Polsce i za granicą. Prz. Ryb., 2: 35–38.
WOLNICKI J., KAMIŃSKI R., KORWIN-KOSSAKOWSKI M., MYSZKOWSKI L. 1999a. Termiczne optimum wzrostu oraz optymalna temperatura podchowu wylęgu miętusa Lota lota (L.). Komun. Ryb., 5: 6–8.
WOLNICKI J., KLESZCZ M., KAMIŃSKI R., KORWIN-KOSSOWSKI M., MYSZKOWSKI L. 1999b. Miętus – nowy gatunek w rodzimej akwakulturze (wybrane aspekty rozrodu, wychowu narybku w stawach oraz kontrolowanego podchowu wylęgu). W: Rybactwo Jeziorowe, IV Krajowa Konferencja Rybackich Użytkowników Jezior, Wyd. IRS, 99–105.
WOLNICKI J., KAMIŃSKI R., MYSZKOWSKI L. 2002. Temperature-influenced growth and survival of burbot Lota lota (L.) larvae fed live food under controlled conditions. Archives of Polish Fisheries, 10 (1): 109–113.