© 2002 international center for agricultural...
TRANSCRIPT


© 2002 International Center for Agricultural Researchin the Dry Areas (ICARDA)
All rights reserved.
ICARDA encourages the fair use of this material.Proper citation is requested.
The author: Eddy De Pauw is Agroecologist at the International Center forAgricultural Research in the Dry Areas (ICARDA).
Recommended Citation: De Pauw, E. 2002. An agroecological exploration ofthe Arabian Peninsula. ICARDA, Aleppo, Syria, 77 pp.
ISBN: 92-9127-119-5
Key words: agroecology, desertification, GIS, Arabian Peninsula, arid zones
Front cover photographLandscape in Ahfara, Fujairah, United Arab Emirates. The relative lushness ofthe vegetation is the result of above-normal rainfall. Pronounced rainfallvariability, both in space and time, is a key characteristic of climate in theArabian Peninsula, and responsible for tremendous variations in rangelandproductivity.
ICARDAP.O.Box 5466, Aleppo, SyriaTel.: (963-21) 2213433, 2225112, 2225012Fax: (963-21) 2213490 / 2225105 / 2219380E-Mail: [email protected] site: http://www.icarda.cgiar.org

-3-

Foreword
The Arabian Peninsula constitutes one of the largest contiguous arid zones in theworld. Within this context of aridity the region is surprisingly diverse in climaticconditions, soil types, landscapes, and land use patterns. Agroecological niches occurwith edaphic conditions that can deviate substantially from those of surrounding areasand often have a higher biomass or agricultural productivity. In the context of globalclimate change this agroecological diversity is also an important source of abioticstressresistance in plants against drought, high temperatures, and salinity. However, the region is also ecologically fragile. Firstly, it is vulnerable to naturalprocesses, such as primary salinization, and wind and water erosion. In addition,overgrazing, fuel-wood extraction, drought, and depletion of fossil water resources areincreasingly threatening the sustainability of the natural resource base, and may lead topotentially irreversible desertification.
A rational approach to combating desertification requires in the first placedifferentiating true degradation, as a result of over-exploitation, from processes andconditions that are the natural outcome of the biophysical limits imposed by the harshclimates that prevail in the Arabian Peninsula. Such an approach necessitates thedevelopment of agroecological frameworks, which allow assessing the spatial andtemporal variations in the natural resource base and associated land use systems. To combat desertification effectively, a good agroecological characterization is of vitalimportance. Numerous thematic surveys in the form of soil survey reports, climaticmaps, and groundwater surveys already exist in the Arabian Peninsula. However, thechallenge is to develop integrated land and water resource information systems, basedon GIS-technology. This integration will allow linkage of multidisciplinary,geographically referenced databases at different resolutions, and to develop decision-support systems for more sustainable land use management and resource useregulations.
By bringing together information sources from the international public domainand the Arabian Peninsula itself, and processing them with state-of-the-art GIStechnology, this report aims to initiate this process of data integration at the regionallevel. As such it will be of value for agricultural research planning, biodiversitymanagement, land use planning, and public awareness at the national and regionallevel. We hope it will fill a major gap in our understanding of the agroecologicaldiversity, vulnerability, and agricultural productivity of one of the most important aridregions in the world.
Prof. Dr Adel El-BeltagyDirector General, ICARDA
-iii-

Acknowledgements
The author wishes to thank the following people and organizations for theirsupport and background efforts in the production of this technical bulletin.• Dr John Peacock and Dr Ahmed Mustafa Tawfik, Regional Coordinators of
the Arabian Peninsula Program.• The staff of the national agricultural research institutes in the region, who
have taken time and effort to provide information to the author. They aretoo numerous to mention individually, but are listed in the FeasibilityReport.
• The staff of CODIS, at ICARDA, for polishing the manuscript.• The donors of APRP, notably the Arab Fund for Economic and Social
Development, IFAD and OPEC, for their financial support.
-iv-
-v-
Abstract
This report provides an overview of the agroecological characteristics of theArabian Peninsula.
The Arabian Peninsula is a vast plateau bounded by mountainous terrain. Itcan be subdivided into 15 geomorphological regions. Its main characteristic isaridity, due to low and erratic rainfall, and high temperatures. As a result,productivity of rangelands and agriculture is variable and poor. The interactionof temperature and precipitation gradients leads to a great diversity of climaticconditions, which is evidenced by 22 distinct agroclimatic zones, of which eightcomprise 95% of the region.
The soils of the Arabian Peninsula reflect the general aridity of the climate.Most are poorly developed, shallow, or are enriched in lime, gypsum, or salts.Transported materials, such as sand dunes and sheets, cover large areas. Thatsaid, there is no shortage of good agricultural soils. The obvious limitation toput them into production is water availability. Where irrigation water isavailable, standard fertility management practices are required, and, ifprovided, allow maintenance and enhancement of soil quality.
Cropped areas are very limited in the Peninsula and most are irrigated,although substantial rainfed areas exist in Yemen and in Saudi Arabia. Between1980 and 1996, area under irrigation more than doubled, aided by modernirrigation technology, such as center-pivot and drip irrigation. This use of fossilgroundwater, however, is not sustainable.
The Arabian Peninsula is perceived as having limited heterogeneity, pooragricultural potential, and low population densities, and, therefore, it hasgenerated limited interest with regard to global biodiversity. This view isoversimplified. The region has great agroecological diversity and muchpotential as a source of genetic diversity and of abiotic stress resistance. Toachieve this goal there is a clear need to integrate existing thematic datasets intoagroecological frameworks for development. Specific methodologies, models,and decision-support systems must be developed to achieve and make use ofthis integration.
Priority should be given to the regional assessment of crop waterrequirements with a view to enhancing water use efficiency, and agroecologicalzoning for biodiversity conservation, rangeland rehabilitation, abiotic stressidentification, and development planning. Underpinning these research goalsshould be a strengthening of climate monitoring networks.

-vi-
ContentsForeword iii
Acknowledgements iv
Abstract v
1. Introduction 12. Human geography 33. Relief and geomorphology 54. Climate 11
4.1. General 114.2. Precipitation 12
4.2.1. Types and amounts 124.2.2. Seasonal patterns 124.2.3. Variability 14
4.3. Temperature 174.4. Evaporation and water deficit 22
4.4.1. Potential evapotranspiration 224.4.2. Aridity 22
4.5. Agroclimatic patterns 254.5.1. Agroclimatic zones 254.5.2. Similarity of climatic conditions 27
4.6. Climatic growing period 354.6.1. Types of growing period 354.6.2. Duration and onset of the growing period 38
4.7. Biomass productivity and climate 395. Soils of the Arabian Peninsula 44
5.1. General soil pattern 445.2. Soil management properties 49
5.2.1. Soil texture 495.2.2. Soil depth and stoniness 515.2.3. Soil fertility indicators 53
5.3. Conclusions 606. Agricultural production systems 607. Research priorities in agroecological characterization 65
7.1. Regional assessment of crop water requirements 657.2. Agroecological zoning 65

7.3. Improved climate monitoring 678. Methods and data sources 68
8.1. General maps 688.2. Relief and geomorphology 688.3. Climatic maps 688.4. Soil maps 758.5. Land use and cover maps 75
References 76
List of figures
Figure 1 Arabian Peninsula: General 4Figure 2 Population density 6Figure 3 Altitude 7Figure 4 Elevation range and geomorphological regions 8Figure 5 Wadi network in the northwest of the Arabian Peninsula
(Note: Wadis shown as blue lines. Elevation range is the same as in Figure 3) 10
Figure 6 Mean annual precipitation (mm) 13Figure 7a Seasonal distribution of precipitation. winter 15Figure 7b Seasonal distribution of precipitation. spring 15Figure 7c Seasonal distribution of precipitation. summer 15Figure 7d Seasonal distribution of precipitation. autumn 15Figure 8 Variability of annual rainfall, Muscat, Oman (1893-1978) 16Figure 9 Probability distribution of annual rainfall, Muscat,
Oman (1893-1978) 16Figure 10 Variability of monthly rainfall, Muscat, Oman (1893-1978) 17Figure 11 Areas of the Arabian Peninsula with mean annual
temperature exceeding 30°C (in red), or below 20°C (in magenta) 18
Figure 12 Mean annual temperature 19Figure 13 Climate diagram for Salalah, Oman 20Figure 14 Mean temperature of the coldest month 20Figure 15 Mean temperature of the warmest month 20Figure 16 Mean annual heat units 21Figure 17 Mean annual potential evapotranspiration (mm) 23Figure 18 Aridity index 24
-vii-

Figure 19 Annual precipitation deficit (mm) 24Figure 20 Winter types (blue: cool; green: mild; yellow: warm) 26Figure 21 Summer types (green: mild; yellow: warm; red: very warm) 27Figure 22 Agroclimatic zones (classified according to UNESCO, 1979) 28Figure 23a Station representative of agroclimatic zone A-M-W: Abha,
Saudi Arabia 29Figure 23b Station representative of agroclimatic zone HA-M-VW:
Al Jouf, Saudi Arabia 29Figure 23c Station representative of agroclimatic zone A-W-VW:
El Kod, Yemen 29Figure 23d Station representative of agroclimatic zone SA-M-M:
Mabar, Yemen 29Figure 23e Station representative of agroclimatic zone HA-W-VW:
Muscat, Oman 30Figure 23f Station representative of agroclimatic zone A-M-VW:
Riyadh, Saudi Arabia 30Figure 23g Station representative of agroclimatic zone HA-M-W:
Tabuk, Saudi Arabia 30Figure 23h Station representative of agroclimatic zone SA-M-W: Taiz,
Yemen 30Figure 24a Similarity in temperature and precipitation pattern
with Abha, Saudi Arabia 31Figure 24b Similarity in temperature and precipitation pattern with
Al Jouf, Saudi Arabia 31Figure 24c Similarity in temperature and precipitation pattern with
El Kod, Yemen 32Figure 24d Similarity in temperature and precipitation pattern
with Mabar, Yemen 32Figure 24e Similarity in temperature and precipitation pattern
with Muscat, Oman 33Figure 24f Similarity in temperature and precipitation pattern
with Riyadh, Saudi Arabia 33Figure 24g Similarity in temperature and precipitation pattern
with Tabuk, Saudi Arabia 34Figure 24h Similarity in temperature and precipitation pattern
with Taiz, Yemen 34Figure 25 Types of growing period 36
-viii-

Figure 26a Example of an all-year-round dry period (Al Jouf, Saudi Arabia) 37
Figure 26b Example of an intermediate growing period (Taiz, Yemen) 37Figure 26c Example of a normal growing period (Aleppo, Syria) 38Figure 27a Length of the first growing period, Yemen Highlands 38Figure 27b Length of the second growing period, Yemen Highlands 39Figure 27c Onset of the main growing period, Yemen Highlands 39Figure 28 Temperature adaptability ranges for different crop groups 40Figure 29a Biomass productivity index for crop group I,
Yemen Highlands 42Figure 29b Biomass productivity index for crop group II,
Yemen Highlands 42Figure 29c Biomass productivity index for crop group III,
Yemen Highlands 42Figure 29d Biomass productivity index for crop group IV,
Yemen Highlands 42Figure 30 Rangeland biomass productivity index 43Figure 31 Soil associations 45Figure 32 Soil associations: explanation of legend 47Figure 33 Simplified soil map (dominant soils) 48Figure 34 Legend of soil property distribution maps 50Figure 35 USDA textural triangle and simplified textural classes 50Figure 36 Distribution of coarse-textured soils 51Figure 37 Distribution of medium-textured soils 52Figure 38 Distribution of fine-textured soils 52Figure 39 Dominant soil depth 53Figure 40 Distribution of shallow soils 54Figure 41 Distribution of gravelly and stony soils 54Figure 42 Dominant organic carbon levels 55Figure 43 Organic carbon pool 56Figure 44 Dominant soil pH 57Figure 45 Dominant CEC 57Figure 46 Distribution of calcareous soils 58Figure 47 Distribution of soils with hardened lime or gypsum 59Figure 48 Distribution of soil salinity 59Figure 49 Land use and land cover 61Figure 50 Evolution of desert irrigation (1982-1993) 62
-ix-

Figure 51a Expansion of desert irrigation, observed from AVHRR imagery(1983) 63
Figure 51b Expansion of desert irrigation, observed from AVHRR imagery(1986) 63
Figure 51c Expansion of desert irrigation, observed from AVHRR imagery(1990) 63
Figure 51d Expansion of desert irrigation, observed from AVHRR imagery(1993) 63
Figure 52 Spatial pattern of desert irrigation 1982-1993 64Figure 53 Mapping the distribution of plant communities or
species using landscape frameworks. 67
List of tables
Table 1 Population in the Arabian Peninsula 3Table 2. Geomorphological regions of the Arabian Peninsula 9Table 3. Areas under different moisture regimes 22Table 4. Areas under different winter types 25Table 5. Areas under different summer types 26Table 6. Extent of agroclimatic zones of the Arabian Peninsula 29Table 7. Adaptability ranges of different crop groups 40Table 8. Main soil associations of the Arabian Peninsula 46Table 9. Main soil types of the Arabian Peninsula 47Table 10. Cropland in the Arabian Peninsula 60Table 11. Conversion equations from PET(Hargreaves) to
PET(Penman-Monteith) 69Table 12. Adaptability to temperature for different crop groups
(adapted from FAO, 1978) 74
-x-


1. Introduction
The Arabian Peninsula, also called Arabia, is a vast landmass, covering about2,590,000 km2. It is bounded by the Red Sea on the west and southwest, theArabian Sea on the south, and the Gulf of Oman and the Persian Gulf on thenortheast. It is composed of seven countries (Bahrain, Kuwait, Oman, Qatar,Saudi Arabia, the United Arab Emirates, and Yemen).
Arabia is one of the driest subcontinents in the world. With an averageprecipitation of less than 100 mm per year it can be considered a desert region.It is also one of the hottest, with daytime temperatures often exceeding 50°C insummer. Yet, despite its general aridity, its ecosystems are surprisingly diverse.The rich biodiversity of the Arabian Peninsula is important to agriculture. Theplants that are able to survive in this harsh environment might be carriers oftraits useful in developing new drought and heat tolerant crop varieties.
However, the biodiversity of the Arabian Peninsula is under threat. Aninherent fragility of the environment, combined with over-exploitation of thevegetation resources, has severely reduced the plant cover and narrowed thespecies pool. Huge parts of the Peninsula are now completely bare, not becauseof agroecological constraints, but because of overgrazing and fuelwoodextraction. Given the long time required for biomass production in aridenvironments, recovery under conditions that do not provide total plantprotection might be close to impossible. This is the true meaning of‘desertification’ in a desert environment.
The Arabian Peninsula has enormous reserves of groundwater. In manyparts of the Peninsula this precious resource has been exhausted in order tomaintain agricultural production systems, such as irrigated field crops, whichare essentially not adapted to the over-riding climatic constraint of hyper-aridity. Such systems are unsustainable because they consume huge amounts ofwater, where the supply is virtually non-renewable on a human time scale.
Combating desertification in the Arabian Peninsula requires good
-1-

information on the different environments. To some extent this information isalready available. Many environmental studies have been undertaken, whichhave produced inventories of climatic, soil, terrain, vegetation, and waterresources. Depending on the investments made by the governments of theregion, the level of detail, updating, and integration varies considerablybetween countries. In addition, the access of the general public to thisinformation is not always easy. As a result, it is difficult to obtain a synthesis ofthe agroecology at the level of the whole Peninsula.
Much information on the environments of the Arabian Peninsula exists alsoin the international community, in the form of books, journal articles, andinternational databases. Putting national and international data sources togetherin a concise booklet and integrating them through a Geographical InformationSystem (GIS) is the main subject of this publication.
Given the size and diversity of this subcontinent, this publication isrestricted to the level of ‘exploration,’ hence the title. Nevertheless, it is hopedthat the ‘bird’s-eye view’ it provides will be of value for agricultural researchplanning, biodiversity management, land use planning, and public awareness atthe national and regional level. In short, the publication is meant to fill animportant data gap and permit a better understanding of the resource diversityand environmental problems of the Arabian Peninsula.
This booklet is organized in several sections. The first gives a briefoverview of the human geography of the Peninsula. The second describes thecharacteristics of the natural environment in terms of relief, climate, soils, landuse, and cover. It also addresses the problem of land degradation assessment. Athird section looks into the current status of agroecological characterization inthe Arabian Peninsula, identifying knowledge gaps, thematic researchpriorities, and follow-up studies at the national and regional level.
This booklet is richly illustrated with maps. These maps were derived,through GIS techniques and methods of agroecological characterization, fromthe various data sources to which the author had access. Section eight brieflydescribes the methods used in generating the maps and lists the data sources.The maps in this publication are also available on a separate CD as GIS files(ARCView shape files and grids), and can be imported into compatible GISsoftware.
-2-

2. Human Geography
The Arabian Peninsula comprises the countries of Bahrain, Kuwait, Oman,Qatar, Saudi Arabia, the United Arab Emirates (UAE), and Yemen.
Notwithstanding the low aptitude of the subcontinent to support highpopulation densities (see section on ‘Climate’), these countries have witnesseda tremendous population increase over the last 50 years (Table 1).
In all Gulf countries, population increased between 1950 and 2000, by afactor of 5 to 30. The more spectacular growth rates (e.g., Kuwait, Qatar, UAE)are mostly due to a large net immigration of guest workers. However, thepopulation data for Yemen, a country of net emigration, shows that increase inthe native population is also a major contributing factor to population growth inthe Peninsula.
The distribution of the population centers is shown in Figure 1. With theexception of the agricultural hinterland of Riyadh, Saudi Arabia, most of thepopulation lives at the edges of the Peninsula, near coastal areas or in themountains bordering the sea. This is to be expected. Given the aridity of theinterior, people have historically concentrated in areas with higher rainfall (e.g.,Yemen, Asir), or along trade routes. As the rainfall map shows, the density ofpopulation centers is associated with the higher rainfall areas. Very few people,with the exception of nomadic tribes, live in the desert interior.
-3-
Table 1. Population in the Arabian Peninsula
Country Population Population change, % Density, persons/km2
1950 2000 1975-80 1995-2000 Overall Rural
Bahrain 116,000 617,000 4.9 2.0 778 5,789
Kuwait 152,000 1,972,000 6.2 3.1 82 1,017
Oman 456,000 2,542,000 5.0 3.3 9 3,759
Qatar 25,000 599,000 5.8 1.8 53 667
Saudi Arabia 3,201,000 21,607,000 5.6 3.4 8 90
UAE 70,000 2,441,000 14.0 2.0 27 968
Yemen 4,316,000 18,112,000 3.2 3.7 27 690
Source: World Resources Institute (2001) URL: http://earthtrends.wri.org/country_profiles

-4-
Fig. 1: Arabian Peninsula: General

The population density is shown in Figure 2. The subcontinent ischaracterized by generally low population density and high urbanization, withpockets of high rural population density. A high proportion of the countrypopulation still makes a living in agriculture in Yemen, and to a lesser extent inSaudi Arabia. Low cropland area (Table 1) and urbanization of the countryside(e.g., Kuwait, Bahrain, Oman, Qatar, UAE) might artificially raise the ruralpopulation density above levels that bear any relationship with the intensity ofrural land use.
3. Relief and Geomorphology
The Arabian Peninsula is a vast plateau, gently sloping northeastward from theRed Sea to the eastern lowlands bordering the Persian Gulf. It is bounded on thewest, south and east by mountainous terrain. According to the digital elevationmodel (DEM) GTOPO30 (Gesch and Larson, 1996), the altitude varies between–37 m in the lowest point, in the Matfi salt flat south of Qatar, and 3660 m atthe Peninsula’s highest peak, Jebel An Nabi Shu’ayb. The elevation map,derived from this DEM, is shown in Figure 3.
Elevation does not really show a landscape. In addition to its elevation, alandscape is defined by its degree of dissection, or the range between high andlow points. Plains are defined by a very small elevation difference betweenneighboring points, rolling topography by a higher difference, and mountainsby a very large difference. The map of Figure 4, derived from the GTOPO30DEM, captures the ‘ruggedness’ of the landscapes of the Arabian Peninsula. Itshould be noted that this map evidences errors in the DEM used. Thecheckerboard pattern in the central Rub-al-Khali desert in Saudi Arabia is dueto inadequate coverage by detailed topographical maps with elevationbenchmarks and does not constitute a natural pattern.
The blue lines on Figure 4 delineate 15 major geomorphological regions(modified after Guba and Glennie, 1998, and Barth, 1976). The superimposedareas in red are salt flats. The geomorphological regions are briefly described inTable 2.
Among the most common and important landscape elements of the ArabianPeninsula are its drainage channels. These seasonal watercourses, or wadis,drain wide catchment areas and high mountains through networks of well-developed tributaries, ravines and runnels. An example of the drainage network
-5-

-6-
Fig. 2: Population density

-7-
Fig. 3: Altitude

-8-
Fig. 4: Elevation range and geomorphological regions

-9-
Table 2. Geomorphological regions of the Arabian Peninsula (adapted from Guba and Glennie, 998)
symbol Name Altitude range Description(m)
1 Coastal plain 0-200 Includes two sub-regions, the Tihama bordering the Red Sea,and the Batinah bordering the Gulf of Oman. Both plains aremostly pediments, gently sloping upward from sea level to thefoothills of the mountains.
2 Western Escarpment Mountains2a Midian 300-2000 Scarp mountains, very strongly dissected, with high peaks rising
Mountains up to 3000 m.2b Hijaz 300-2000 Scarp mountains, rising less high, with interspersed high plateau
Mountains areas. Very complex lithology, including granitic, metamorphic,volcanic, and sedimentary rocks
2c Asir 300-2500 Scarp mountains, very strongly dissected in the Asir, with high Mountains peaks rising up to 3000 m. Towards the Yemen highlands the and Yemen high plateau areas become more widespread. Granitic and Highlands metamorphic rocks dominate the Asir, sedimentary rocks are
predominant in the northern Yemen Highlands, and extrusivevolcanic rocks in central and southern Yemen.
3 Arabian Shield3a Sandstone 700-1000 High plateau of fairly uniform elevation covered with sandy
plateau soils.3b Harrats 1000-1500 Area transitional towards the Najd plains at high elevation.
(western Structural slope from SW to NE. Complex terrain with salt flats, Najd) pediments, and hills.
3c Central 800-1200 Mostly plains and plateaux with inselbergs and hill areas, built plateau on the structural slope of the Arabian shield. Covered mostly by
granitic and metamorphic basement complex rocks. Includeslarge areas with basaltic rocks.
3d Summan 250-500 Low-lying plateau with fairly uniform topography composed of plateau flat-lying limestone with typical karst topography of sinkholes
and caves.4 Central Arabian Cuesta4a Dahna sands 500-800 Narrow belt of dunes and shifting sands extending over 1,300
and adjacent km and connecting the Rub Al-Khali with the Great Nafud.areas
4b Tuwayq 500-1000 Cuesta region with 800-km-long escarpments composed of mountain sedimentary rocks curving around the crystalline shield of the systems Central Plateau. Elevation may locally rise to 1500 m.
5 Southern Arabian Deserts5a Rub al-Khali 100-1000 The ‘Empty Quarter’ is the largest uninterrupted sand desert in
and adjacent the world. Contains both transverse and longitudinal dunes. areas Individual dunes reach heights exceeding 200 m.
5b Wahiba Sands 0-300 Small sand sea formed by winds of the southwest monsoon, withlongitudinal dunes mainly.
6 Great Nafud 700-1000 Second largest sand desert of the Arabian Peninsula7 Eastern Gulf 0-500 Coastal plain rising gently to inland plateau areas. Covered
Region mainly by unconsolidated beach sands, gravels, salt flats, andaeolian sands.

density, covering the northwestern part of the Peninsula, is shown in Figure 5.It is worth noting the absence of drainage channels in the eastern part, which isoccupied by sand dunes.
The wadis are common to all geomorphological units, with the exception ofsand dune areas, and support plant communities that are dependent on the waterregime. Along wadis the vegetation cover is usually denser, except underconditions of overgrazing, fuelwood extraction, or aquifer over pumping.However, the vegetation pattern is highly site-specific, determined by thefrequency of flooding, the stream velocity, type of sediments and coarsematerials deposited, and variability of rainfall in the catchment areas((Kürschner, 1998).
-10-
Table 2. Continued
symbol Name Altitude range Description(m)
8 Southern 300-1200 Includes the Hadramaut plateau and the raised plateau of limestone Dhofar, which can locally reach an altitude of 2000 m, and dips plateaux to the north. The Dhofar plateau is bounded southward by an
escarpment.9 Hajar 500-2500 Steeply dissected narrow mountain range with heights up to
Mountains 3000 m, formed by sedimentary rocks.
Fig. 5: Wadi network in the northwest of the Arabian Peninsula(Note: Wadis shown asblue lines. Elevation range is the same as in Fig.3)

4. Climate
4.1. General
The Arabian Peninsula is an ecoregion in which biomass productivity isprimarily limited by the availability of water. Although there are exceptions,notably the Yemen Highlands and their extension into the Asir Mountains, theregion is essentially arid or even hyper-arid. In addition to generally low rainfallamounts, rainfall distribution is usually unfavorable, coming in sudden anderratic showers, and variability is high between years.
The weather in the Peninsula is controlled by four air masses. The mainreasons for the region’s aridity are its remoteness in relation to the major rain-bearing weather systems, such as the North Atlantic depressions and the Indianmonsoon, and its exposure to air predominantly continental in origin.
With the exception of winter in the northern part of the Peninsula and high-altitude locations, temperatures are high to very high, causing high evaporation,but also high biomass productivity, if water is available.
The low and erratic rainfall causes large fluctuations in the productivity ofrangelands. It also enhances the importance of soils and landscape position incapturing the little rainfall available. Their ability to generate, concentrate, orreceive runoff is the main reason for the ‘patchiness’ of vegetation cover in thePeninsula.
Within the overall limitations imposed by aridity, there is an unexpecteddiversity in climatic conditions. This diversity is usually related to differencesin temperature and moisture regimes as a result of different exposure to rain-bearing systems, but also altitudinal gradients. The mountains at the edge of thePeninsula generally act as ‘moisture traps.’ At certain times of the year theinfluence of the mountains can be strong enough to generate their own weatherthrough erratic and intensive thunderstorm activity. This is certainly the case inthe Yemen and Asir highlands and the Hajar mountains in Oman. Topographyalso influences climate by ‘guiding’ wind flows and rain along favored paths.The Zagros mountains in western Iran, through this mechanism, play animportant role in generating precipitation over the extreme east of the Peninsula(Fisher and Membery, 1998). In the same way, the western mountains influencerainfall production along the Red Sea.
-11-

4.2. Precipitation
4.2.1. Types and amounts
Precipitation is mostly in the form of rainfall, although occasional snowfall hasbeen recorded in the Yemeni and Asir highlands.
Fisher and Membery (1998) report the regular occurrence of fog in thewestern highlands, the Dhofar region, and the central desert of Oman. Thecontribution of this ‘occult precipitation’ from fog, mist, low clouds, or dew, tothe regional waterbalance might be doubtful. However, these sources of hiddenprecipitation can help significantly in creating, at a micro-scale, improvedconditions for more productive and diverse plant life, particularly grasslandsand woodlands.
The distribution of the mean annual precipitation is shown in Figure 6.Generally speaking, precipitation levels are associated with elevation. Thehighest rainfall occurs in the Yemeni highlands and Asir mountains, and to alesser extent in the mountains of northern Oman. The lowest precipitation isrecorded in the low-lying areas of the Rub al Khali, the Najd in the north of thePeninsula, and the northern Red Sea coast.
4.2.2. Seasonal patterns
During winter the region is under the influence of polar continental air massesthat originate in Central Asia. The influx of these air masses is accompanied bydry weather with generally clear skies and fairly low temperatures.Occasionally the Peninsula is affected by polar maritime air coming from theNorth Atlantic. These air movements are the remainder of the mid-latitudedepressions that have already traversed North Africa and the Mediterranean.They are the main source of winter rainfall.
During summer the Peninsula is influenced by tropical continental airmasses, which bring hot and very dry air from Egypt and Sudan. These airmasses allow the region to become a stable high-pressure zone and source oftropical continental air. Cloudless skies, low humidity, very high temperatures(often >45°C), intensive surface heating, and dust characterize the weathersystem during summer (Fisher and Membery, 1998). The Indian monsoonsystem exercises some activity in summer, particularly in parts of Yemen,southwestern Saudi Arabia, and coastal Oman. However, its influence is limitedby the strong tropical continental air mass, which prevails over the Peninsula atthe time.
-12-

-13-
Fig. 6: Mean annual precipitation (mm2)

The seasonal distribution is shown in Figures 7a-7d as the percentage of theannual rainfall that falls in each of the four seasons. This distribution isexplained by the prevalence of one or another weather system at different timesof the year.
Figure 7a shows the influence of the winter rainfall pattern, which iscommon throughout Europe, North Africa, West Asia, and Central Asia. Figure7b shows the importance of spring rainfall (also largely associated with thewesterly systems) for the central landmass of the Peninsula. Figure 7c showsthe area of influence of the Indian monsoon, with peaks in the Yemen highlandsand the Dhofar area in southern Oman. Autumn does not contribute muchrainfall, except in the northern Red Sea coast region (Figure 7d).
4.2.3. Variability
As in other arid parts of the world, high rainfall variability is the norm and theimpact of drought severe. Variability affects the amount and distribution ofrainfall at different time scales.
Figure 8 shows a typical example of inter-annual variations for Muscat,time period 1893-1978, an unusually long dataset for the Arabian Peninsula. Atypical characteristic of rainfall in the arid zones is its negative skew. Thismeans that the probability of having rainfall below the mean is higher, butcompensated for by few high rainfall events, as represented by the peaks inFigure 8. The probability distribution of annual precipitation in Muscat, asapproximated by a log-normal transform, is shown in figure 9.
This figure shows that the probability of exceeding the mean (105 mm) isonly 40%, illustrating the greater likelihood of smaller rainfall amounts.
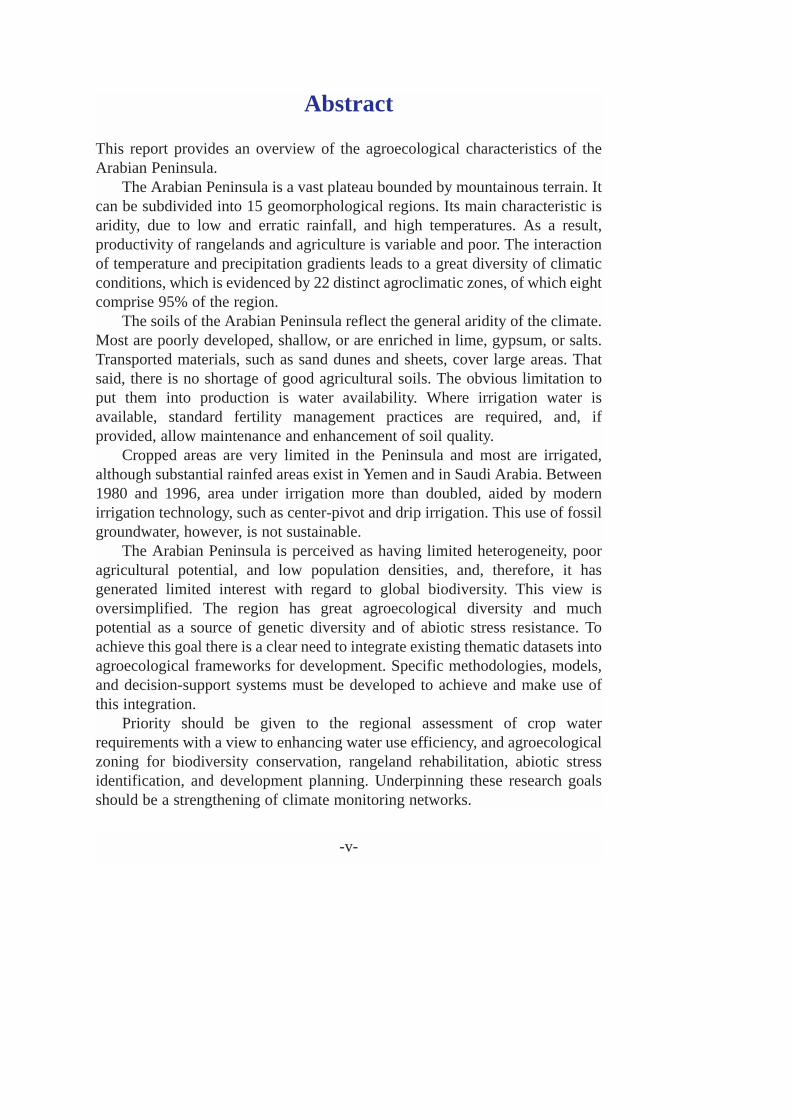
At smaller time scales, variability increases even more. Figure 10 shows,for each month of the year, the mean rainfall and the amounts that might not beexceeded in one year out of four (2nd decile), and in four years out of five (8th
decile). In the same figure it can be noted that between April and October, the 8th
decile is lower than the mean. This demonstrates that in areas (or times of theyear) with very low rainfall, the concept of an average rainfall pattern is astatistical artifact. It is caused by the lumping together of a few high-rainfallevents with very low probability, with numerous low-rainfall events with highprobability.
-14-

-15-
Fig. 7: Seasonal distribution of precipitation. Clockwise from top left: winter (a), spring (b), summer (c), autumn (d)
a b
dc

-16-
Fig. 8: Variability of annual rainfall, Muscat, Oman (period 1893-1978)
Fig. 9: Probability distribution of annual rainfall, Muscat, Oman (period 1893-1978))
The nature of individual rainstorms is such that they are often of limitedspatial extent with considerable gradients in intensity and amount. This impliesthat in large areas in the middle of a ‘rainy season,’ the pattern in reality mightbe one of intense rains separated by dry conditions or light falls (Jackson,1977). This ‘spottiness’ of rainfall has also been suggested by Fisher andMembery (1998).
The implication of increasing rainfall variability with decreasing time scaleis of fundamental importance to our understanding of vegetation growth,biomass productivity, and climatic adaptation in the Arabian Peninsula. Sincetemperature is usually not limiting, growth and flowering occurs whenever andwherever water is available, irrespective of time of year and ‘statistical’ dry andwet periods.
4.3. Temperature
The Arabian Peninsula is warm. More than 90% of its area has a mean annualtemperature of 20°C. A small area (shown in red) has a mean annualtemperature exceeding 30°C. The cooler areas are shown in magenta in figure11. They correspond with the western Yemen highlands, the Asir mountains,and the sandstone and limestone plateaux bordering Jordan.
-17-
Fig. 10: Variability of monthly rainfall, Muscat, Oman (period 1893-1978)

The major factors controlling temperature are elevation and latitude. Fromsouth to north there is a clear cooling trend, owing to increased exposure to coldcontinental air masses in winter. The map of mean annual temperature (Figure12) illustrates these controls on temperature.
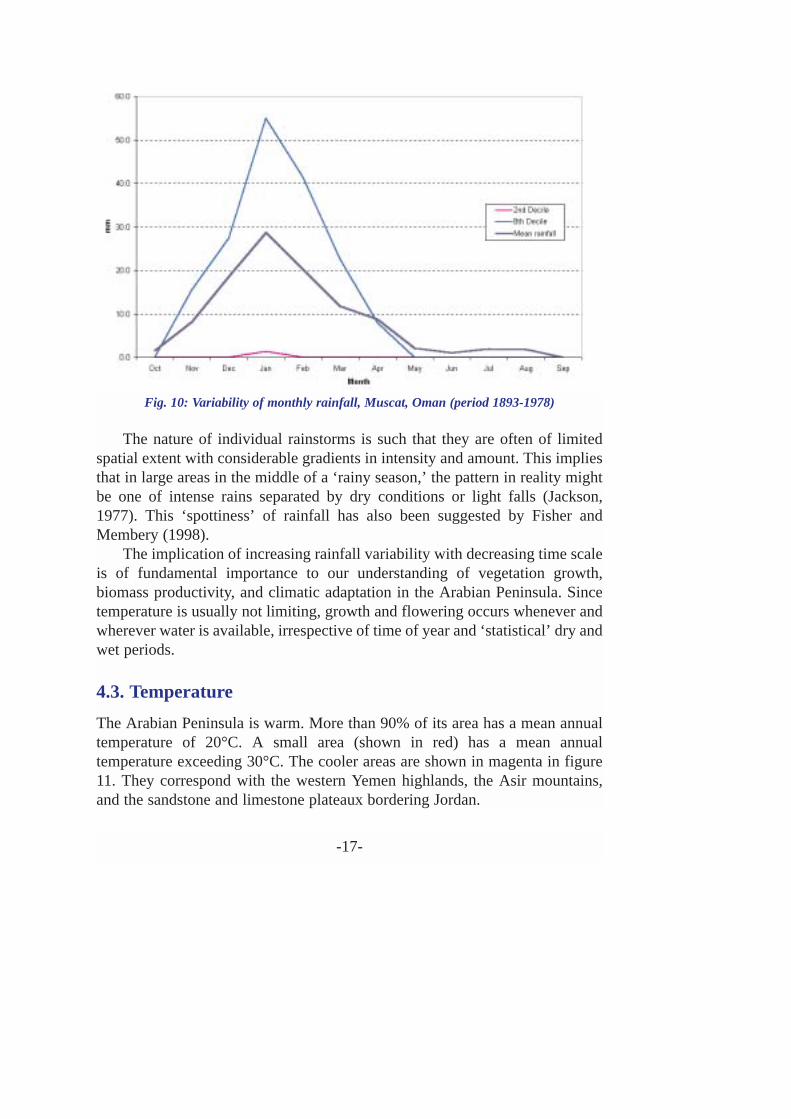
Temperature is strongly seasonal, with the lowest temperatures in theperiod December-February and the highest in the period June-September. Theareas exposed to the Indian monsoon are an exception. These show a noticeabletemperature drop in July-August, as illustrated by the climate diagram forSalalah (Figure 13).
Figures 14 and 15 show the temperature of the coldest and the warmestmonth, respectively.
Temperature seasonality tends to increase from the southeast to thenorthwest. The variability of temperature between years, in contrast withrainfall variability, is very low.
Temperature patterns can also be represented as the distribution of availableatmospheric energy, which evaporates water or makes plants grow faster, forexample. This representation of temperature as a source of energy for plantgrowth and biomass production can be done through the concept ofaccumulated heat units or growing degree days, which sum the daily
-18-
Fig. 11: Areas of the Arabian Peninsula with mean annual temperature exceeding 30°C (inred), or below 20°C (in magenta)

-19-
Fig. 12: Mean annual temperature
temperatures above a threshold (e.g., 0 °C) for a specified period (e.g., oneyear). The map of accumulated heat units in Figure 16 shows, unsurprisingly,the same pattern as the map of mean annual temperature, only the units (°Cdays) are different. It will be used later (see Section 4.7) to assess by proxy thepotential productivity of natural vegetation.
-20-
Fig. 13: Climate diagram for Salalah, Oman
Fig. 14: Mean temperature of the coldestmonth
Fig. 15: Mean temperature of the warmestmonth

-21-
Fig. 16: Mean annual heat units

4.4. Evapotranspiration and water deficit
4.4.1. Potential evapotranspiration
The evaporative demand of the atmosphere can be represented by the potentialevapotranspiration (PET), which is the evapotranspiration of a reference crop,a grass cover. The PET can be calculated by the Penman-Monteith method fromelementary climatic parameters, such as temperature, air humidity, radiation,and wind speed (Allen et al., 1998). The PET concept is the basis for theassessment of crop water requirements and for scheduling irrigation.
The pattern of mean annual PET throughout the region (Figure 17) is verysimilar to the pattern of mean annual temperature (Figure 12) and shows thesame trends, as governed by altitude and latitude. The PET is very high in theinterior of the Peninsula and decreases towards the edges.
4.4.2. Aridity
The Arabian Peninsula is characterized by a severe deficit of precipitation overatmospheric water demand. The UNESCO (1979) ‘aridity index’ can be used toquantify this deficit and map the severity of ‘dryness’ based on the ratio ofannual precipitation to annual potential evapotranspiration.
Figure 18 shows the distribution of the aridity index, corresponding withthe thresholds for the hyper-arid (<.0.03), arid (0.03-0.25), semi-arid (0.25-0.5),and sub-humid climatic regimes (>0.5). The areas under each moisture regimeare summarized in Table 3. Nearly 99% of the Peninsula is either hyper-arid(HA) or arid (A). Only part of the Yemen highlands is in the semi-arid (SA)class. A very small area is sub-humid (SH). The relationships between moistureregimes (as expressed by aridity index) and agriculture are discussed further insection 4.5.1.
These results reflect the huge negative balance between water supply fromprecipitation and the evaporative demand of the atmosphere. The size of thehydrological deficit on an annual basis is shown in figure 19.
-22-
Table 3. Areas under different moisture regimes
Moisture regime Aridity index % km2
Hyper-arid (HA) < 0.03 32.02 1,020,107Arid (A) 0.03 - 0.2 66.72 2,125,415Semi-arid (SA) 0.2 - 0.5 1.22 38,788Sub-humid (SH) > 0.5 0.04 1,199

-23-
Fig. 17: Mean annual potential evapotranspiration (mm)

-24-
Fig. 18: Aridity index
Fig. 19: Annual precipitation deficit (mm)

4.5. Agroclimatic patterns
4.5.1. Agroclimatic zones
Climatic diversity in the Arabian Peninsula can be adequately represented by asimple system of agroclimatic zones that takes into account the keydeterminants of climate: moisture and temperature. UNESCO (1979) hasdeveloped a simple system for differentiating agroclimatic zones based on threemajor criteria:• Moisture regime• Winter type• Summer type
The moisture regime is determined by the aridity index, as defined insection 4.4.2. In the hyper-arid moisture regime there is almost no perennialvegetation, with the exception of some bushes in riverbeds. In good years,annual plants can grow, but agriculture and grazing are generally impossible(UNESCO, 1979). In the arid moisture regime, scattered vegetation does grow,which might include bushes, and small woody, succulent, thorny, or leaflessshrubs. Very light pastoral use is possible. Rainfed agriculture is only feasiblewith some form of water harvesting and irrigation, and only where terrainconditions are favorable or where there are local water resources. As a result,agriculture, if any, is patchy. In the semi-arid moisture regime, vegetation isdenser and might include bushes, scrubs and even trees. Good grazing areasmight be found and rainfed agriculture is possible, albeit with great yieldfluctuations due to rainfall variability. Agriculture in either the arid or hyper-arid classes requires irrigation (see section on land use). Even in the semi-aridmountainous uplands of Yemen, agriculture is stabilized by terrace-basedsupplemental irrigation.
The winter type is determined by the average mean temperature during thewinter months. Table 4 shows the winter type classes and the areas they occupy.Figure 20 shows the spatial distribution of the winter types.
-25-
Table 4. Areas under different winter types
Winter type Temperature % km2
class (°C)
Cool (C) <10 2.81 89,622Mild (M) 10-20 74.71 2,379,883Warm (W) 20-30 22.48 716,005

In areas with cool winters, vegetation growth is limited by cold. If rainfallis concentrated in winter, plants adapted to these conditions will becharacterized by rapid phenological development in spring and efficient soilmoisture extraction. In areas with mild and warm winters, vegetative growthis possible in winter, and becomes more rapid with increasing temperature.
The summer type is determined by the average mean temperature duringsummer months. Table 5 shows the summer type classes and the areas theyoccupy. Figure 21 shows the spatial distribution of the summer types. The mildsummers are confined to the highest parts of the Yemen highlands.
-26-
Fig. 20: Winter types (blue: cool; green: mild; yellow: warm)
Table 5. Areas under different summer types
Summer type Temperature class (°C) % km2
Mild (M) 10-20 0.48 15,417Warm (W) 20-30 36.12 1,150,600Very warm (VW) >30 63.40 2,019,492

The combinations between moisture regimes and winter and summertypes form individual climatic patterns, or agroclimatic zones. For example,the pattern HA-M-VW represents a climate with a hyper-arid moistureregime, mild winter type, and very warm summer type. In total, 22agroclimatic zones have been differentiated in the Arabian Peninsula. Ofthese, eight taken together comprise 95% of the region. The remaining 14 arefairly small agroclimatic ‘islands’ with climatic conditions that are eithermore humid or colder than surrounding areas.
The extent of the agroclimatic zones is shown, in order of importance, inTable 6. The spatial distribution is shown in Figure 22.
Figures 23a-23h are climate diagrams of stations representing someagroclimatic zones. Some zones cannot be represented due to their limitedextent and the lack of meteorological data (see further).
4.5.2. Similarity of climatic conditions
In all the maps in this chapter, the value of selected climatic parameters isshown as classes with well-defined ranges, e.g., precipitation classes 0-10 mm,10-20 mm, etc. These classes show similarity in a way that is independent of
-27-
Fig. 21: Summer types (green: mild; yellow: warm; red: very warm)

-28-
Fig. 22: Agroclimatic zones (classified according to UNESCO, 1979)

-29-
Table 6. Extent of agroclimatic zones of the Arabian Peninsula
ACZ Representative % Km2 ACZ1 % km2
station
A-M-VW Riyadh 35.3 1,123,841 SA-M-M 0.4 11,522A-M-W Abha 17.7 563,774 SA-W-W 0.1 3,481HA-M-VW Al Jouf 15.5 495,144 A-M-M 0.1 1,925HA-W-VW Muscat 7.2 229,484 SA-C-M 0.0 866A-W-W 6.0 190,051 SH-M-M 0.0 828HA-M-W Tabuk 5.0 160,135 HA-C-VW 0.0 663A-W-VW El Kod 5.0 158,775 HA-C-W 0.0 469HA-W-W 4.2 134,213 SA-C-W 0.0 426A-C-W 2.4 75,341 SH-M-W 0.0 222SA-M-W Taiz 0.7 22,492 SH-C-M 0.0 148A-C-VW 0.4 11,580 A-C-M 0.0 1271 All data from mabar station.
Fig. 23a: Station representative foragroclimatic zone A-M-W: Abha, Saudi
Arabia
Fig. 23b: Station representative foragroclimatic zone HA-M-VW: Al Jouf, Saudi
Arabia
Fig. 23c: Station representative foragroclimatic zone A-W-VW: El Kod, Yemen
Fig. 23d: Station representative foragroclimatic zone SA-M-M: Mabar, Yemen

the values in individual locations. There is, however, a very different approachthat consists of taking the value of a climatic parameter or index at one location(the ‘match‘ location) and mapping similar locations (‘target’ locations). Thisapproach is valuable for assessing the likelihood of successful introduction of aplant species in a different area, in the assumption that the more similar theenvironments the more likely will be the adaptation.
The key is to be clear in the purpose and define similarity indicesaccordingly. If the purpose is to assess adaptation to heat stress, a temperature-based similarity index is needed. If the objective is to assess adaptation todrought, a precipitation-based index is needed. In this publication the purposeis to assess similarity both in moisture and temperature conditions, and for thisreason a combined similarity index has been developed (see Section 8.3.).
Figures 24a-24h show similarity between each part of the ArabianPeninsula and a reference location. In this case the reference locations are thestations that represent the main agroclimatic zones. In all cases, similarity isshown on the same scale between zero and one, with zero indicating total
-30-
Fig. 23e: Station representative foragroclimatic zone HA-W-VW: Muscat, Oman
Fig. 23f: Station representative foragroclimatic zone A-M-VW: Riyadh, Saudi
Arabia
Fig. 23g: Station representative foragroclimatic zone HA-M-W: Tabuk, Saudi
Arabia
Fig. 23h: Station representative foragroclimatic zone SA-M-W: Taiz, Yemen

dissimilarity and one total similarity. These examples demonstrate that in somecases the adaptability domain, as expressed by a high similarity index value, isvery widespread, and in other cases very limited.
-31-
Fig. 24a: Similarity in temperature and precipitation patterns with Abha, Saudi Arabia
Fig. 24b: Similarity in temperature and precipitation patterns with Al Jouf, Saudi Arabia

-32-
Fig. 24c: Similarity in temperature and precipitation patterns with El Kod, Yemen
Fig. 24d: Similarity in temperature and precipitation patterns with Mabar, Yemen

-33-
Fig. 24e: Similarity in temperature and precipitation patterns with Muscat, Oman
Fig. 24f: Similarity in temperature and precipitation patterns with Riyadh, Saudi Arabia

-34-
Fig. 24g: Similarity in temperature and precipitation patterns with Tabuk, Saudi Arabia
Fig. 24h: Similarity in temperature and precipitation patterns with Taiz, Yemen

4.6. Climatic growing period
Growing period, as a climatic concept, is the time of year when neither moisturenor temperature limit crop production. Developed about 30 years ago (e.g.Cochemé and Franquin, 1967), it was subsequently adapted and applied by theFood and Agriculture Organization of the United Nations (FAO, 1978-81) toassess potential plant productivity and land suitability at the global, continental,and regional scale.
The components of the climatic growing period (onset, duration, and end)are determined by a waterbalance approach, which matches monthly rainfall tomonthly potential evapotranspiration. In technical terms the growing period isthe ‘period of the year during which the actual evapotranspiration exceeds acritical threshold’ (De Pauw, 1983). This threshold is usually 50% of thepotential evapotranspiration.
4.6.1. Types of growing period
Three types of growing period are described for the Arabian Peninsula. Theirdistribution is shown in figure 25.
The vast majority of the region is characterized by an all-year-round dryperiod. There is no growing period because the critical ratios of actual topotential evapotranspiration are not exceeded. In this moisture regime thequality of the growing period is no longer determined by the rainfall but by thelevel of potential evapotranspiration; the higher the latter, the higher theirrigation requirements. An example of an all-year-round dry period is shown infigure 26a.
In the Yemen highlands, northern Kuwait, and parts of the mountains ofnorthern Oman, a second type of growing period occurs. The intermediategrowing period lacks a humid sub-period: when rainfall exceeds potentialevapotranspiration soil moisture is not recharged. Crop production in such areasis very risky and usually requires an additional source of water to stabilizeyields. However, this type of growing period has a reasonable productivity fornatural vegetation. An example, with two sub-periods, is shown in figure 26b.
In a very few areas of the Peninsula, located in the most rainy parts of theYemen highlands, the normal growing period occurs. It is characterized by ahumid sub-period, when soil moisture is recharged. This soil moisture can laterbe released to crops when rainfall drops below the potential evapotranspiration,thus buffering crops against drought stress. This type of growing period is of the
-35-

-36-
Fig. 25: Types of growing period

highest quality, ensuring optimal biomass productivity, and, if of sufficientlength, good crop yields. No representative station is available for the ArabianPeninsula; therefore, the concept is illustrated with an example from Aleppo,Syria (Figure 26c).
-37-
Fig. 26a: Example of a year-round dry period (Al Jouf, Saudi Arabia)
Fig. 26b: Example of an intermediate growing period (Taiz, Yemen)

4.6.2. Duration and onset of the growing period
In most of the Arabian Peninsula, length and timing of the growing period arehighly variable as a result of pronounced rainfall variability (see section 4.2.3.).The only areas where the growing period is sufficiently reliable to appear inaverage data are the highlands of Yemen. This part of the Peninsula has tworainy seasons, one in March-May, the other in July-September. The durations ofthe resulting two growing periods are shown in figures 27a and 27b. The onsetdate of the main growing period is shown in Figure 27c.
-38-
Fig. 26c: Example of a normal growing period (Aleppo, Syria)
Fig. 27a: Length of the first growing period, Yemen Highlands

4.7. Biomass productivity and climate
Climate is the primary determinant of potential biomass productivity of plantsand crops. This is because assimilation – the capture by plants of carbon dioxidefrom the atmosphere and its conversion into carbohydrates – is determined byradiation energy and water availability. Biomass productivity should, therefore,be related to climatic factors, in particular temperature (as proxy for theradiation energy) and soil moisture. Apart from radiation and moisture regime,
-39-
Fig. 27b: Length of the second growing period, Yemen Highlands
Fig. 27c: Onset of the main growing period, Yemen Highlands
the rate of assimilation and biomass production is strongly determined by cropcharacteristics.
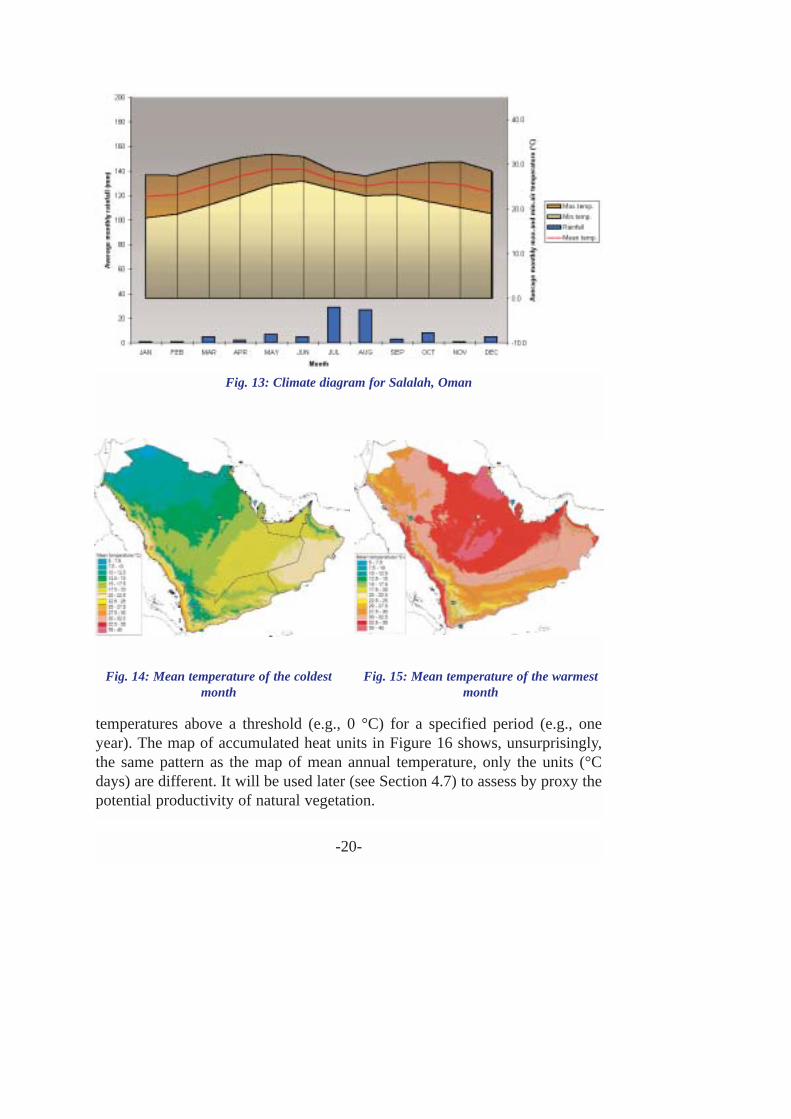
According to the response of assimilation rate to temperature, FAO (1978-81) has proposed four crop groups (Table 7). Each crop group has a differentresponse function, or adaptability range, to temperature (Figure 28).
Using this concept of crop adaptability groups, biomass productivityindices have been developed for each crop group. For the exact definition ofeach crop biomass productivity index (CBPI) refer to Section 8.3.
-40-
Table 7. Adaptability ranges of different crop groups
Crop Crop Optimal mean Examplesgroup types temperature
range
1 C3 15-20 Barley, bread wheat, chickpea, lentil,olive, sunflower, cabbage, oats, rye,grape, sugar beet; temperate grasses;almost all trees
2 C3 adapted for 25-30 Cotton, groundnut, cowpea, soybean, higher temperatures tobacco, sunflower, sesame, rice, fig,
grape, olive 3 C4 30-35 Maize, sorghum, sugarcane, all millets,
fonio rice; tropical grasses 4 C4 adapted for 20-30 Maize, sorghum, millets
lower temperatures
Fig. 28: Temperature adaptability ranges for different crop groups

The biomass productivity index was calculated for each crop group(CBPI1, CBPI2, etc.) for each location in the Arabian Peninsula. The resultsshow that only in part of the Yemen highlands do the indices have non-zerovalues. This is not surprising because the CBPI is strongly correlated withgrowing period, which is absent in most of the Peninsula.
Figures 29a-29d focus on the Yemen highlands and show the values of theCBPI for each crop group. Generally speaking, these figures show that the areasare better adapted to crop groups 2, 3, and 4 than to crop Group 1.
To assess the potential productivity of rangelands, a different kind of indexis required that is less demanding in terms of moisture regime. The rangelandbiomass productivity index (RBPI) is the product of the aridity index (seeSection 4.4.2.) and the annual accumulated heat units (see Section 8.3.).Distribution of the RBPI is shown in Figure 30.
The value of these biomass productivity indices is that they can be derivedfrom simple climatic data and allow extrapolation from site-specificproductivity measurements. It has to be realized that they provide a measure ofpotential productivity, not current productivity, and, therefore, do not take intoaccount management factors, such as overgrazing, etc.
-41-

-42-
Fig. 29a: Biomass productivity index for crop group I, YemenHighlands
Fig. 29c: Biomass productivity index for crop group III,Yemen Highlands
Fig. 29b: Biomass productivity index for crop group II, YemenHighlands
Fig. 29d: Biomass productivity index for crop group IV, YemenHighlands

-43-
Fig. 30: Rangeland biomass productivity index

5. Soils of the Arabian Peninsula
5.1. General soil pattern
The soils of the Arabian Peninsula reflect the aridity of the climate. Most arepoorly developed, shallow, or are enriched in lime, gypsum, or salts. Inaddition, transported materials, such as sand dunes and sheets, cover largeareas. The soils are mostly formed by the physical breakdown of geologicalmaterials and their subsequent removal, sorting and deposition by wind andwater.
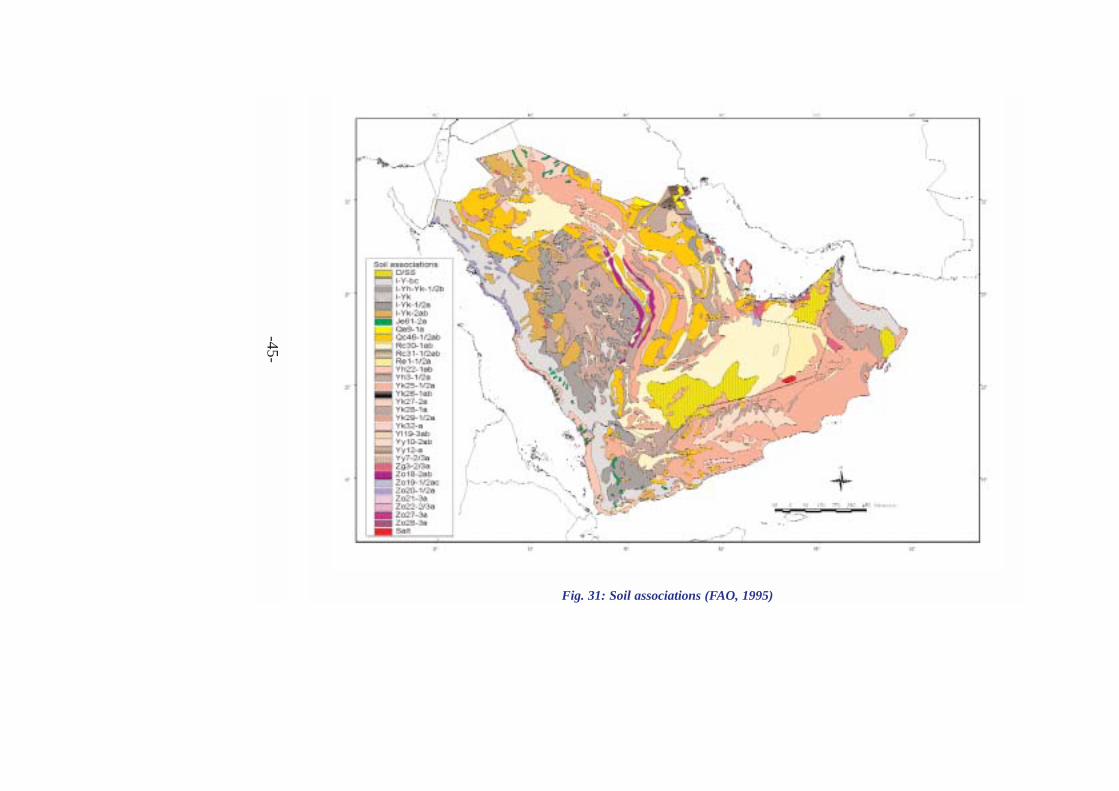
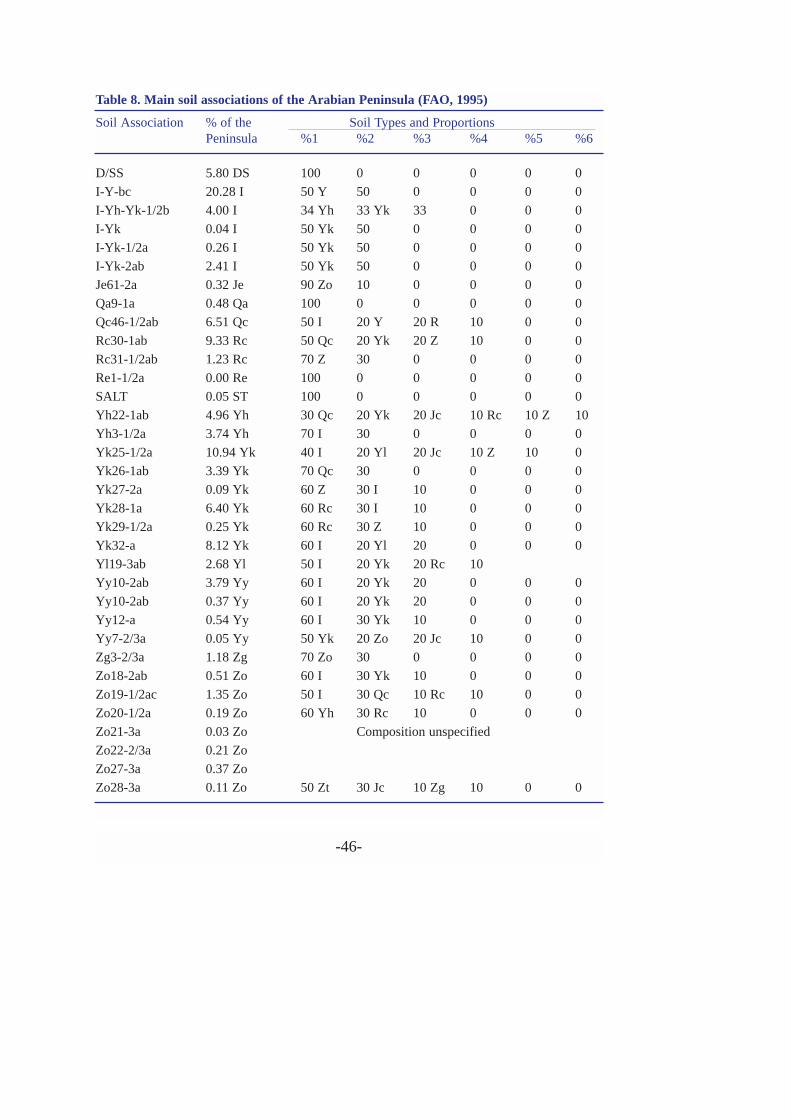
The distribution of the soils of the Arabian Peninsula is represented in theMap of Soil Associations (Figure 31). Soil association maps show patterns ofsoil occurrence, instead of the location of individual soils. Individual soilscannot be located at the scale of a subcontinent. Soil associations arecharacterized by the recurrence of a limited number of specific soil types withinparticular landforms, but in different proportions. The main associations of theArabian Peninsula are listed in Table 8.
As shown in the example of Figure 32, the name of the soil association isdetermined by the dominant soil type, the textural class, and the broad landformtype.
The association is further described by its full soil composition, which listseach soil type and its proportion (in percent) within the soil association (Table8).
The main soil types that occur in the Arabian Peninsula, classifiedaccording to the FAO Soil Map of the World (FAO, 1974), are listed in Table 9. Three textural classes are distinguished:1: Coarse (predominantly sandy)2: Medium (predominantly silty)3: Fine (predominantly clayey)These distinctions are further defined in the discussion on soil managementproperties (Section 5.2.).
In addition, the soil associations do consider three broad landform classes:a: flat topography; b: undulating topography; c: hilly topography
Looking only at the dominant soils within the different soil associations, thesoil association map can be simplified, as shown in the map of dominant soils(Figure 33).
-44-
-45-
Fig. 31: Soil associations (FAO, 1995)
-46-
Table 8. Main soil associations of the Arabian Peninsula (FAO, 1995)
Soil Association % of the Soil Types and ProportionsPeninsula %1 %2 %3 %4 %5 %6
D/SS 5.80 DS 100 0 0 0 0 0
I-Y-bc 20.28 I 50 Y 50 0 0 0 0
I-Yh-Yk-1/2b 4.00 I 34 Yh 33 Yk 33 0 0 0
I-Yk 0.04 I 50 Yk 50 0 0 0 0
I-Yk-1/2a 0.26 I 50 Yk 50 0 0 0 0
I-Yk-2ab 2.41 I 50 Yk 50 0 0 0 0
Je61-2a 0.32 Je 90 Zo 10 0 0 0 0
Qa9-1a 0.48 Qa 100 0 0 0 0 0
Qc46-1/2ab 6.51 Qc 50 I 20 Y 20 R 10 0 0
Rc30-1ab 9.33 Rc 50 Qc 20 Yk 20 Z 10 0 0
Rc31-1/2ab 1.23 Rc 70 Z 30 0 0 0 0
Re1-1/2a 0.00 Re 100 0 0 0 0 0
SALT 0.05 ST 100 0 0 0 0 0
Yh22-1ab 4.96 Yh 30 Qc 20 Yk 20 Jc 10 Rc 10 Z 10
Yh3-1/2a 3.74 Yh 70 I 30 0 0 0 0
Yk25-1/2a 10.94 Yk 40 I 20 Yl 20 Jc 10 Z 10 0
Yk26-1ab 3.39 Yk 70 Qc 30 0 0 0 0
Yk27-2a 0.09 Yk 60 Z 30 I 10 0 0 0
Yk28-1a 6.40 Yk 60 Rc 30 I 10 0 0 0
Yk29-1/2a 0.25 Yk 60 Rc 30 Z 10 0 0 0
Yk32-a 8.12 Yk 60 I 20 Yl 20 0 0 0
Yl19-3ab 2.68 Yl 50 I 20 Yk 20 Rc 10
Yy10-2ab 3.79 Yy 60 I 20 Yk 20 0 0 0
Yy10-2ab 0.37 Yy 60 I 20 Yk 20 0 0 0
Yy12-a 0.54 Yy 60 I 30 Yk 10 0 0 0
Yy7-2/3a 0.05 Yy 50 Yk 20 Zo 20 Jc 10 0 0
Zg3-2/3a 1.18 Zg 70 Zo 30 0 0 0 0
Zo18-2ab 0.51 Zo 60 I 30 Yk 10 0 0 0
Zo19-1/2ac 1.35 Zo 50 I 30 Qc 10 Rc 10 0 0
Zo20-1/2a 0.19 Zo 60 Yh 30 Rc 10 0 0 0
Zo21-3a 0.03 Zo Composition unspecified
Zo22-2/3a 0.21 Zo
Zo27-3a 0.37 Zo
Zo28-3a 0.11 Zo 50 Zt 30 Jc 10 Zg 10 0 0

-47-
Fig. 32: Soil associations: explanation of legend
Table 9. Main soil types of the Arabian Peninsula
Symbol Name Summary description
I Lithosols Undifferentiated very shallow soils; unsuitable foragriculture
Je Eutric Fluvisols Alluvial soils with good fertility status; the best soils foragriculture
Qa Albic Arenosols Strongly leached sandy soils, do not retain soil moisture;unsuitable for agriculture
Qc Cambic Arenosols Slightly matured sandy soils, retain soil moisture better;suitable for agriculture under sprinkler irrigation
Rc Calcaric Regosols Calcareous poorly developed soils, poor physical propertiesfor agriculture
Re Eutric Regosols Poorly developed soils with moderate fertility; poorphysical properties for agriculture
Yh Haplic Yermosols Undifferentiated very poorly developed soils of (semi-)deserts; management properties vary considerably; fullirrigation is needed for all agricultural uses
Yk Calcic Yermosols Very poorly developed soils of (semi-) deserts with calcium-enriched subsoil; unsuitable for agriculture
Yl Luvic Yermosols Very poorly developed soils of (semi-) deserts with clay-enriched subsoil; can be made suitable for agriculture if fullirrigation is available
Yy Gypsic Yermosols Very poorly developed soils of (semi-) deserts with gypsum-enriched subsoil; unsuitable for agriculture due to poorphysical properties and need for full irrigation
Zg Gleyic Solonchaks Saline soils with insufficient drainage; unsuitable foragriculture
Zo Orthic Solonchaks Undifferentiated saline soils; unsuitable for agriculture

-48-
Fig. 33: Simplified soil map (dominant soils)

5.2. Soil management properties
Soil maps, particularly those at the regional or national level, are notoriouslydifficult to interpret as a guide to agricultural management. In most cases, onlyclassification names are provided, but not the associated managementproperties, which are assumed to be understood. This is rarely the case, sincemost potential users of soil maps are not familiar with soil scientist jargon. Forthis reason, maps are needed that show the spatial distribution of soilmanagement properties.
This is a particularly daunting task because soil management propertiestend to vary considerably, even within classified soils. The best that can be doneon a regional scale is to show the distribution of certain soil properties, whichcan be associated with reasonable likelihood to the soil classification. Forexample, Lithosols are by definition associated with shallow soil depth.Arenosols are sandy soils, Fluvisols are likely to have optimal depth, waterholding capacity, and fertility status, Yermosols are associated with very loworganic carbon levels, and Solonchaks cover the wide spectrum of saline soils.By looking at soil classification units as ‘indicators’ of soil managementproperties, it is feasible to map the distribution of some properties, but notothers. It is possible to map soil texture, depth, stoniness, and some importantfertility indicators, such as organic carbon content, pH, and cation exchangecapacity (CEC). These are the more stable properties of soils, and are moreshaped by climate, geology, and landform, than by human intervention.However, it is not possible to map physical properties, such as infiltrationcapacity, aggregate stability, or nutrient availability (N, P, K), because theseproperties are very site-specific and highly responsive to management.
The spatial distribution of some management properties is shown in thefollowing set of maps. Refer to the legend in Figure 34 to link the properties tothe dominant soil type and the other soil types of the soil association. Theyellow color indicates, for example, that the particular soil managementproperty is likely to occur in about 10-20% of the areas colored yellow.
5.2.1. Soil texture
Soil texture refers to the relative proportions of various particle size groups ina mass of soil (Soil Survey Staff, 1951). Specifically, it refers to the proportionsof clay (<.002 mm), silt (.002-.05 mm), and sand (.05-2 mm). Soil scientists usea system of 12 standard textural classes (Figure 35). For a regional assessment
-49-
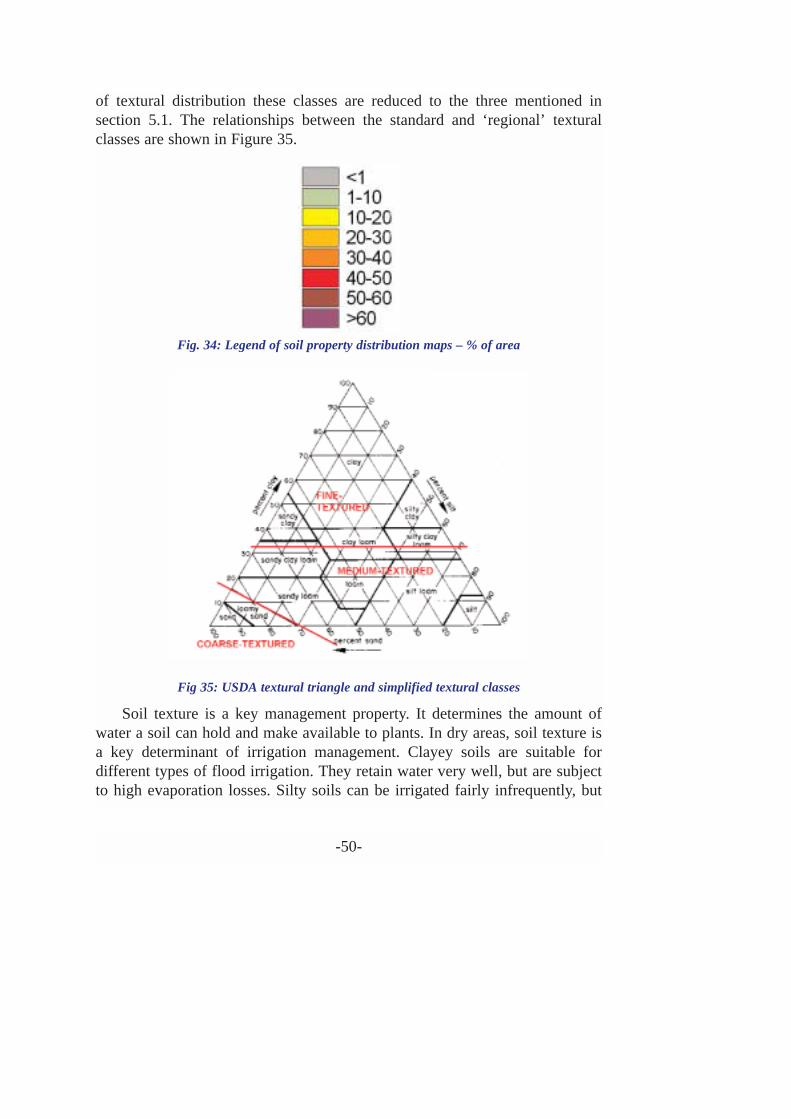
of textural distribution these classes are reduced to the three mentioned insection 5.1. The relationships between the standard and ‘regional’ texturalclasses are shown in Figure 35.
Soil texture is a key management property. It determines the amount ofwater a soil can hold and make available to plants. In dry areas, soil texture isa key determinant of irrigation management. Clayey soils are suitable fordifferent types of flood irrigation. They retain water very well, but are subjectto high evaporation losses. Silty soils can be irrigated fairly infrequently, but
-50-
Fig. 34: Legend of soil property distribution maps – % of area
Fig 35: USDA textural triangle and simplified textural classes
have high percolation losses. Sandy soils demand very frequent irrigation,usually by sprinkler or drip systems, or, if very coarse, cannot be irrigated. Soiltexture is also a determinant of soil structure and surface properties. Silty soilstend to form a surface seal, which reduces infiltration capacity and promotesrunoff even on gentle slopes. In contrast, water infiltrates sandy soils and noevaporation losses occur. As a result, higher biomass productivity of naturalvegetation is in the Arabian Peninsula often associated with sandy soils.
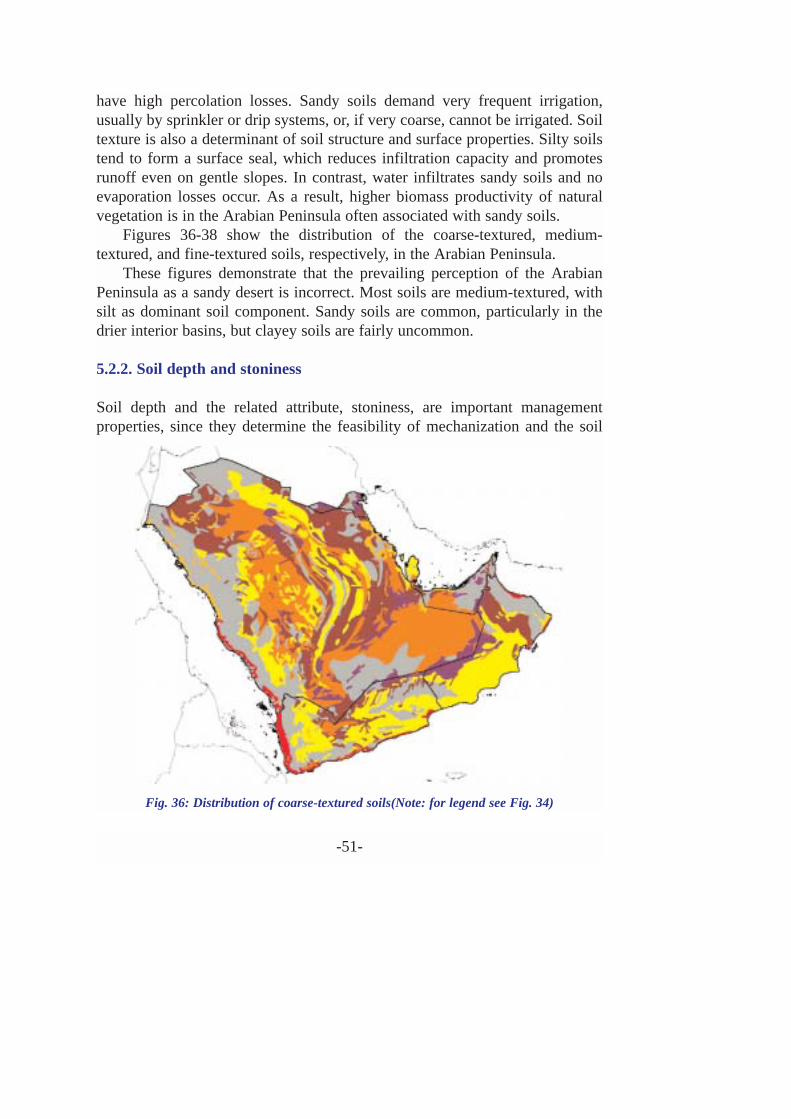
Figures 36-38 show the distribution of the coarse-textured, medium-textured, and fine-textured soils, respectively, in the Arabian Peninsula.
These figures demonstrate that the prevailing perception of the ArabianPeninsula as a sandy desert is incorrect. Most soils are medium-textured, withsilt as dominant soil component. Sandy soils are common, particularly in thedrier interior basins, but clayey soils are fairly uncommon.
5.2.2. Soil depth and stoniness
Soil depth and the related attribute, stoniness, are important managementproperties, since they determine the feasibility of mechanization and the soil
-51-
Fig. 36: Distribution of coarse-textured soils(Note: for legend see Fig. 34)

-52-
Fig 37: Distribution of medium-textured soils(Note: for legend see Fig. 34)
Fig 38: Distribution of fine-textured soils(Note: for legend see Fig. 34)

moisture storage capacity. Very shallow or stony soils do not have sufficient soilvolume in which to store moisture, and therefore dry out more rapidly than deepsoils, or soils of similar depth without stones. For the same reason, these soilshave more difficulty absorbing rainfall during storms and thus generate muchrunoff.
The distribution of soil depth and related attributes are shown in Figures 39-41. The map of the dominant soil depth (Figure 39) is an oversimplification, butshows a clear pattern. Mountain areas are invariably associated with high levelsof shallow (Figure 40) and stony soils (Figure 41). They occur mainly in thewestern highlands of the Midian, Hejaz, and Asir, the escarpment of the Yemenhigh plateau, and the Hajjarr and Mussandam mountains in Oman. In addition,there are interspersed but fairly large areas of gravel plains throughout thePeninsula. The most important ones occur in eastern Kuwait and south of theHajjar mountains.
5.2.3. Soil fertility indicators
As mentioned earlier, the fertility status of soils is, in general, so site-specificand determined by management that any region-wide assessment is
-53-
Fig 39: Dominant soil depth

-54-
Fig 40: Distribution of shallow soils(Note: for legend see Fig. 34)
Fig 41: Distribution of gravelly and stony soils(Note: for legend see Fig. 34)

meaningless, especially in a part of the world where moisture availability is theprevailing constraint. However, certain soil characteristics, such as organiccarbon content, pH, CEC, and lime content, are indicative of the fertility statusand are more static and spatially invariant, being mostly determined by climate.
The organic matter content is the most important indicator of the generalfertility status of a soil. Although the composition of organic matter is alsoimportant, soils with a high organic matter content are usually productive. Dryand hot climates, which do not support a dense cover of vegetation, do notpromote organic matter decay and accumulation. As a result, the organic carbonlevels are very low in the Arabian Peninsula (Figure 42). Most of this organicmatter is concentrated in the topsoil. The subsoils are virtually devoid oforganic carbon, and, as a result, the total organic carbon pools are very low(Figure 43). Given the considerable overgrazing and vegetation degradationthat has occurred during the last 30 years, it is suspected that even these lowlevels of organic carbon quoted are optimistic estimates.
Soil pH controls availability and eventual deficiency or toxicity of certainmicronutrients, which are needed by plants in very small amounts but which areessential for plant growth, such as zinc (Zn), iron (Fe), manganese (Mn), copper(Cu), and boron (B). At high pH, Zn might be deficient in sensitive plants. B-
-55-
Fig. 42: Dominant organic carbon levels

toxicity might occur in soils of volcanic origin, in other areas it might bedeficient (Ryan et al., 1997). The soil pH hovers in the Arabian Peninsulaaround neutral or above (Figure 44). It is mainly controlled by the presence offree calcium carbonate (see further), and is not limiting to plant growth, exceptwhere it is the consequence of high soil salinity (pH >8.2).
Cation exchange capacity (measured in milliequivalents per 100 g soil)quantifies the clay fraction’s capacity to retain nutrients, and is a measure ofresilience against nutrient depletion. In dry climates, the CEC is generally highfor most soils, with the exception of sandy soils, which do not have high enoughclay content. The CEC is therefore related to soil texture, particularly thecontent of clay, sand, and coarse fragments. The patterns in Figure 45 reflectbroad textural groupings rather than particular soil characteristics, with highCEC values associated with medium-and fine-textured soils.
The soils of the Arabian Peninsula are well supplied with free calciumcarbonate (CaCO3) as a result of inheritance from calcareous sediments and
rocks, but also due to the lack of leaching and weathering (Ryan et al., 1997).Apart from its control on soil pH and availability of certain micronutrients,CaCO3, within reasonable amounts, is not an impediment to crop productivity.
The distribution of calcareous soils is shown in Figure 46.
-56-
Fig. 43: Organic carbon pool

The same qualification applies to gypsum (CaSO4.2H2O), which can be
present in substantive amounts, particularly in the Gypsic Yermosol subgroup.Gypsum, like CaCO3, is another soluble mineral of sedimentary origin that is
very common in arid regions. Gypsiferous soils have special management
-57-
Fig. 44: Dominant soil pH
Fig. 45: Dominant cation exchange capacity

properties. They can be irrigated with fairly saline water without causingsalinity build-up. However, inefficient irrigation with high percolation losses,can cause the gypsum to dissolve, and the soil to collapse (possibly taking withit irrigation canals).
In some soils, lime or gypsum have built up massively to form hard banks.These ‘indurated’ soils are called ‘petrocalcic’ or ‘petrogypsic’ (petro, Greekroot for ‘rock’), depending on whether lime or gypsum is the cementing agent,and are often confused with sedimentary rocks. They are obviously unsuitablefor agriculture. Their distribution is shown in Figure 47.
In contrast with most other soil types, saline soils show a great diversity intheir appearance. Unless salinity is very pronounced, chemical tests are neededto recognize a saline soil. In order to be recognized as salt-affected, soils musthave a minimum concentration of salts at some time of the year within the rootzone. Soils are called saline when the total salt concentration, expressed inelectrical conductivity (ECe) of a saturated extract, is above 15 deciSiemens permeter (dS m-1) at 25°C within 30 cm of the surface at some time of the year, ormore than 4 dS.m-1 if the pH (H2O 1:1) exceeds 8.5. An ECe of 15 dS m-1
corresponds with about 0.65% salt (Driessen and Dudal, 1991).The distribution of soil salinity in the Arabian Peninsula is shown in Figure
48. Most of this salinity is due to primary salinization. This refers to the build-
-58-
Fig. 46: Distribution of calcareous soils(Note: for legend see Fig. 34)

up of salts as a result of lithological inheritance or topographical position, andis a natural process within arid zones. This map does not provide a goodrepresentation of secondary, or human-induced salinity. The latter hassignificantly increased since the large resource surveys of the 1970s and 1980s,due to the unregulated use of groundwater and large-scale irrigationdevelopment, often without adequate drainage.
-59-
Fig. 47: Distribution of soils with hardened lime or gypsum
Fig. 48: Distribution of soil salinity(Note: for legend see Fig. 34)

5.3. Conclusions
Soil patterns in the Arabian Peninsula are controlled by the interaction ofclimate, landforms, and geological parent materials. There is no shortage ofgood agricultural soils; the obvious limitation to put them into production iswater availability. Where irrigation water is available, standard fertilitymanagement practices are required, and, if provided, will allow maintenance orenhancement of soil quality. Gypsiferous soils require careful irrigationmanagement, but they can be made productive.
6. Agricultural Production SystemsNotwithstanding extreme aridity and limited renewable water resources, theArabian Peninsula has developed indigenous agricultural production systems,based on crop production under irrigation, and extensive livestock systems.Rapid economic development in the latter half of the 20th Century has resultedin significant changes in the traditional agricultural systems of the subcontinent.Increased agricultural production has contributed to economic growth, but atthe price of degradation of natural resources, particularly the rangelands and thenon-renewable groundwater aquifers.
Country-level data indicate that the cropland areas are very limited in thePeninsula (Table 10). With the exception of Saudi Arabia and Yemen, the
-60-
Table 10. Cropland in the Arabian Peninsula
Country Surface a Crop b Irrigation c
Bahrain 680 7.0 100Kuwait 17,820 0.4 71Oman 212,460 0.3 98Qatar 11,000 1.5 76S. Arabia 2,149,690 1.8 42UAE 83,600 1.0 89Yemen 527,970 2.9 31
Base year for statistics: 1997a Country area in km2
b Crop: % of country area that is cropland (defined as sum of arable land and permanentcropland)c Irrigation: irrigated land as a % of cropland areaSource: World Resources Institute, URL: http://earthtrends.wri.org/country_profiles

-61-
Fig. 49: Land use and land cover

majority of areas under crops are irrigated. Both statistics underscore the criticallimitation of water, since soil resources for agriculture are much less limiting(see Section ‘Soils’).
The land use and land cover of the Arabian Peninsula are shown in Figure49. It is clear that most of the subcontinent is either bare or under very sparsevegetation. The lack of vegetation is probably as much the result of overgrazingas aridity. Between 1980 and 1996 the livestock numbers nearly doubled, fromabout 15 million to about 28 million sheep and goats, and from about 550,000to 850,000 camels (FAO, 2001).
The best cover is found in the Yemen Highlands and Asir mountains. Itconsists of open shrubland and woodland interspersed with rainfed agriculture.(This is the only part of the Arabian Peninsula with a growing period adequatefor rainfed agriculture. See Section 4.6.2.)
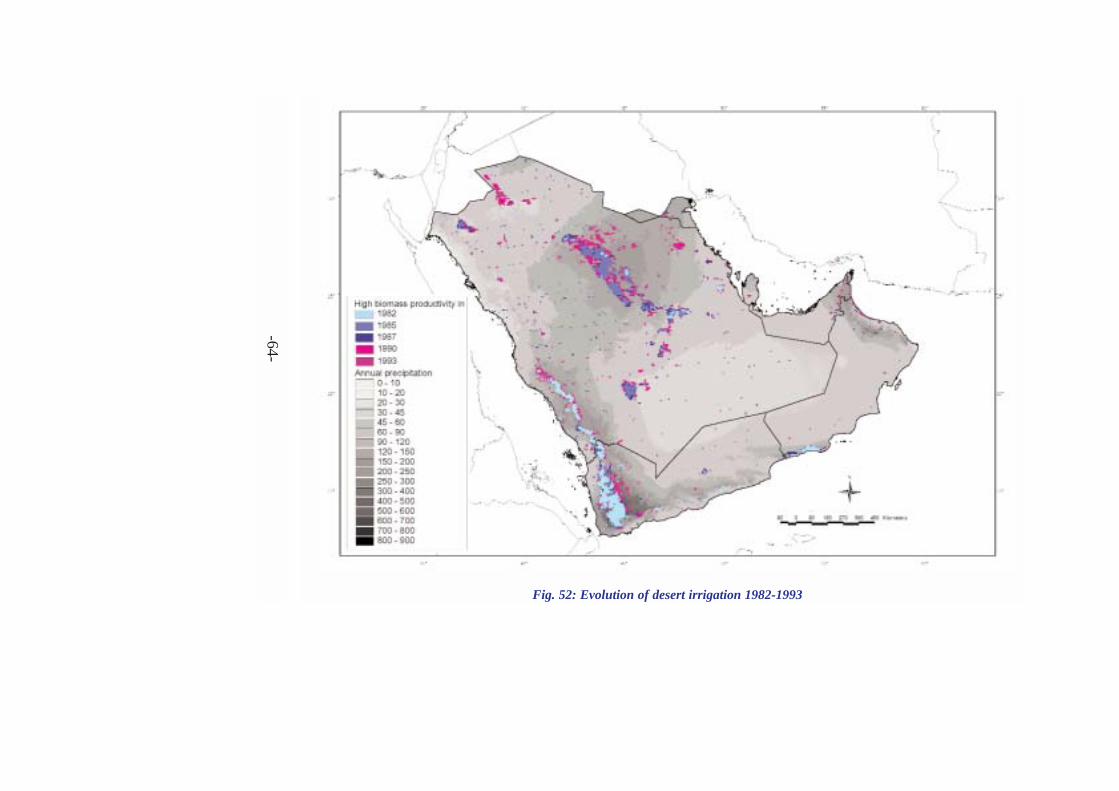
Between 1980 and 1996, area under irrigation more than doubled, aided bythe use of modern irrigation technology, such as center-pivot and drip irrigation(Figure 50). Some large areas in the deserts of Saudi Arabia are irrigated, as aresome valleys in Yemen (Figure 49). The spectacular growth in irrigatedagriculture in the center of the Arabian Peninsula between 1983 and 1993 isshown in the four scenes from the 8-km resolution AVHRR (Advanced VeryHigh Resolution Radiometer) satellite (Figures 51a-51d). The areas with highbiomass productivity are shown in red or brownish colors. The rainfed areas ofthe Yemen Highlands show up clearly, as do some coastal flats with halophytevegetation. All other inland areas in red or brown are irrigated. In 1983 (Figure51a) there were barely any irrigated areas. Ten years later they reached theirmaximum extent (Figure 51d).
The changes in biomass productivity as a result of irrigation in the desert(and some crop area increase in the rainfed areas of Yemen and the Asir) areshown in Figure 52. It should be noted that the small spots scattered across theimage are probably artifacts due to errors in processing the satellite signal.
Since most of the irrigated agriculture is fed by fossil aquifers, which arebarely recharged, this type of agriculture is obviously not sustainable.
-62-

-63-
Fig 51a, b, c, d: Expansion of desertirrigation, observed from AVHRR imagery.From top left: situation in 1983 (a), 1986(b), 1990 (c) and 1993 (d).
a
b
c
d
-64-
Fig. 52: Evolution of desert irrigation 1982-1993

7. Research Priorities in AgroecologicalCharacterization
The Arabian Peninsula suffers from a public perception that it is a subcontinentof limited heterogeneity, poor agricultural potential, and low populationdensities. This view is oversimplified, and the Peninsula is far from monolithicin its agroecological characteristics. In fact, some agroecological niches,admittedly small, have high agricultural potential. The subcontinent also hasimportant potential as a source of genetic diversity and abiotic stress resistance.In order to realize this potential, there is a clear need for better agroecologicalcharacterization of the Peninsula. Numerous thematic surveys in the form ofsoil survey reports, climatic maps, and groundwater surveys exist, therefore, theneed for new resourceinventories is probablylimited. The real need is tointegrate this information inthe form of agroecologicalframeworks for development.Specific methodologies,models, and decision-supportsystems must be developed toachieve and make use of thisintegration.
The number of synopticand climatological stations for a subcontinent of this size is inadequate to mapthe variations in agroclimatic conditions, particularly in very dry, hot, andmountainous areas. With the exception of a few areas, time series of climaticdata are generally short and often interrupted. As well, the temperature,radiation, moisture, humidity, and wind regimes in the Peninsula’sagroecological niches will need to be properly characterized. This will requirea network of well-monitored, integrated research sites.The following research priorities in agroecological characterization have beenidentified for the Arabian Peninsula (De Pauw, 1998):• Regional assessment of crop water requirements for enhancing water use
efficiency• Agroecological zoning for biodiversity conservation, rangeland
rehabilitation, abiotic stress identification, and development planning• Improved climate monitoring
-65-
Fig. 50: Evolution of irrigated areas in the ArabianPeninsula (1980-1996)

7.1. Regional assessment of crop water requirements
A basic principle behind efficient water use is irrigation to meet the crop waterrequirement. Crop water requirements can be calculated from climatic and cropdata. The main challenge in estimating crop water requirements is extrapolationof climatic and crop coefficient data, obtained by measurement at specific sites,to areas without data. As mentioned earlier, the climatic station network in theArabian Peninsula is sparse and records are recent. In addition, apart fromliterature data on crop coefficients, relatively little work has been done on thereassessment of crop coefficients for local crop cultivars under the specificclimatic conditions of the subcontinent. As a result, assessment of crop waterrequirements is usually very site-specific and difficult to generalize toagroecological zones.
Figure 17, which shows mean annual potential evapotranspiration, is arough basis for estimating regional water requirements. This work needs to beimproved, however, by using climatic data on a shorter time scale, and linkingthis with crop coefficients for specific crops and cultivars, calibrated inrepresentative sites.
7.2. Agroecological zoning
There is considerable data available on climate, soils, and water resources in theArabian Peninsula. These information sources range from fair to excellent,depending on the country and theme. With the exception of Yemen, little workhas been done in the region to integrate these data for targeted agriculturalresearch, ecosystem and biodiversity studies, and development planning. As aresult, data that are potentially highly valuable are under-analyzed, under-utilized, and under-valued.
Area profiles (agroecological zones) are required to identify differentenvironments as a basis for a holistic approach to development planning andresource conservation. Modeling, state-of-the-art interpolation techniques, GIS,and remote sensing could be used to integrate climatic, soils, and land coverdata into agroecological zones. Agroecological frameworks can form a rationalbasis for agricultural research priority setting, promote transferability andcompatibility across countries of research results, and provide an integratedspatial view of resource availability, quality, use, and degradation risk.
The concept of this research theme is illustrated in Figure 53. A macro-scale agroecological characterization allows assessment of edaphic diversity atthe level of broad landscapes. This edaphic diversity is nearly always associated
-66-

with different plant communities. The plants of the Arabian Peninsula havebeen described in many studies, but they have not been mapped in a consistentframework that allows extrapolation across the region. An agroecologicalcharacterization at macro-scale would address the issue of biodiversityassessment by linking landscapes (with their climatic, landscape and soilpatterns) to plant communities and species.
7.3. Improved climate monitoring
Techniques of data spatialization and remote sensing, such as those used in thispublication, are valuable tools for extracting maximum information contentfrom data sparse areas. However, they cannot compensate fully for thetremendous climatic data gap in the Arabian Peninsula. Meteorological servicesin the region should make an effort to service the most needy areas, usingagroecological frameworks as a basis for siting weather stations inrepresentative locations. Automatic stations, with data loggers and datatransmission by telephone or satellite, can overcome the remoteness of suchareas.
In addition, different meteorological data networks, including thoseindependent of the national meteorological services, should form partnerships,assisting each other with data collection, pooling, and sharing.
-67-
Fig. 53: Mapping the distribution of plant communities or species using landscapeframeworks.

8. Methods and Data Sources
8.1. General maps
Roads and population centers
Obtained from the Digital Chart of the World (ESRI, 1993). Annual precipitation background: see ‘Climatic maps.’
Population density
Obtained from Columbia University’s Center for International EnvironmentalScience Information Network (CIESIN) Gridded Population Database of theWorld (GPW version 2). This database contains estimates of population density(in square kilometers) of the world in 1995.[On-line document. URL:http://sedac.ciesin.org/plue/gpw/index.html?main.html&2 ]
8.2. Relief and geomorphology
Altitude
Derived from 1-km resolution global DEM GTOPO30 (USGS, 1996).
Elevation range
Derived from 1-km resolution global DEM GTOPO30 (USGS, 1996) byapplying a range filter on the 8 neighboring cells of each grid cell.
Geomorphological regions
Polyline on-screen digitizing of boundaries from Guba and Glennie (1998) onthe elevation range background.
Salt flats: polygon digitizing based on FAO (1995), with corrections basedon elevation range background. (Afterwards added as a mask.)Wadi network: obtained from the Digital Chart of the World (ESRI, 1993).
8.3. Climatic maps
All climatic maps were prepared by converting point data into grid datasets(with 1 km resolution) through spatial interpolation methods. The point datawere obtained from an international climatic database, FAOCLIM (FAO,
-68-
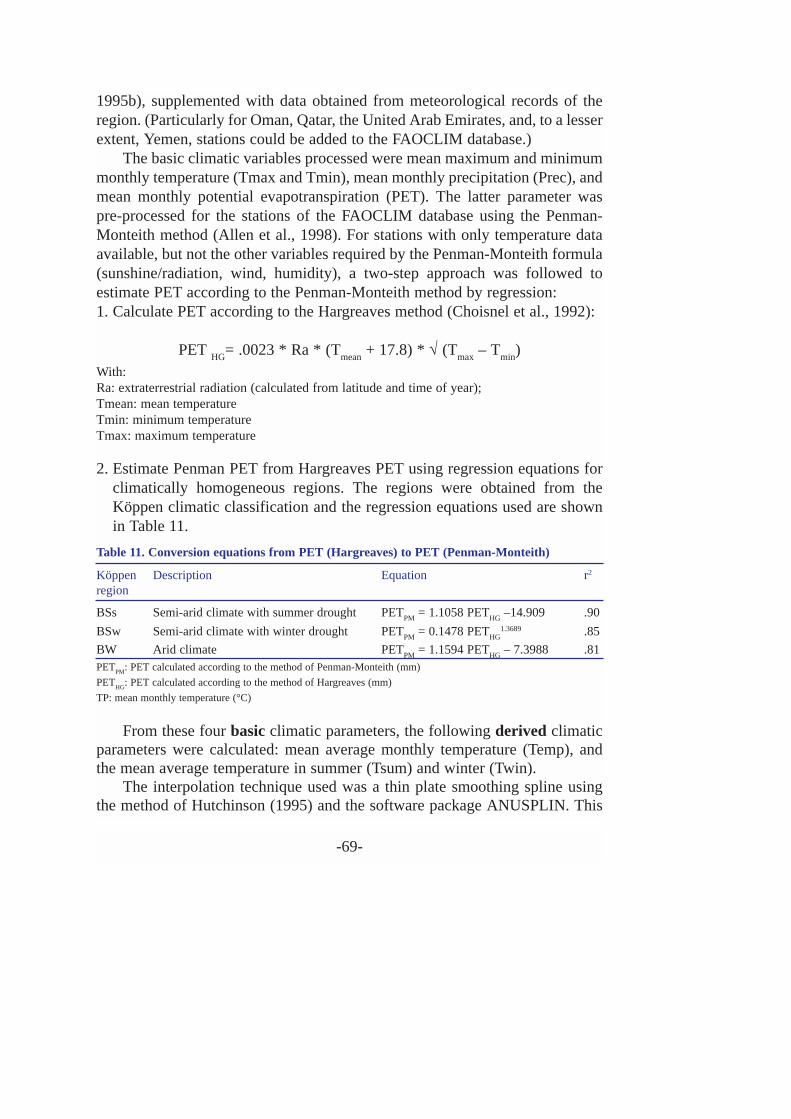
1995b), supplemented with data obtained from meteorological records of theregion. (Particularly for Oman, Qatar, the United Arab Emirates, and, to a lesserextent, Yemen, stations could be added to the FAOCLIM database.)
The basic climatic variables processed were mean maximum and minimummonthly temperature (Tmax and Tmin), mean monthly precipitation (Prec), andmean monthly potential evapotranspiration (PET). The latter parameter waspre-processed for the stations of the FAOCLIM database using the Penman-Monteith method (Allen et al., 1998). For stations with only temperature dataavailable, but not the other variables required by the Penman-Monteith formula(sunshine/radiation, wind, humidity), a two-step approach was followed toestimate PET according to the Penman-Monteith method by regression:1. Calculate PET according to the Hargreaves method (Choisnel et al., 1992):
PET HG= .0023 * Ra * (Tmean + 17.8) * √ (Tmax – Tmin)With:Ra: extraterrestrial radiation (calculated from latitude and time of year);Tmean: mean temperatureTmin: minimum temperatureTmax: maximum temperature
2. Estimate Penman PET from Hargreaves PET using regression equations forclimatically homogeneous regions. The regions were obtained from theKöppen climatic classification and the regression equations used are shownin Table 11.
From these four basic climatic parameters, the following derived climaticparameters were calculated: mean average monthly temperature (Temp), andthe mean average temperature in summer (Tsum) and winter (Twin).
The interpolation technique used was a thin plate smoothing spline usingthe method of Hutchinson (1995) and the software package ANUSPLIN. This
-69-
Table 11. Conversion equations from PET (Hargreaves) to PET (Penman-Monteith)
Köppen Description Equation r2
region
BSs Semi-arid climate with summer drought PETPM = 1.1058 PETHG –14.909 .90
BSw Semi-arid climate with winter drought PETPM = 0.1478 PETHG1.3689 .85
BW Arid climate PETPM = 1.1594 PETHG – 7.3988 .81PETPM: PET calculated according to the method of Penman-Monteith (mm)
PETHG: PET calculated according to the method of Hargreaves (mm)
TP: mean monthly temperature (°C)

method is essentially a radial basis interpolation function of the type:
B(h) = (h2 + R2) log (h2 + R2)With: B: weight at the grid nodeH: anisotropically rescaled, relative distance from the point to the node R2 smoothing factor specified by the user
In the approach of Hutchinson the smoothing factor, or inversely, the degreeof complexity of the created ‘climate surface,’ is determined automatically fromthe database by minimizing a measure of predictive error of the fitted surfacegiven by the generalized cross validation (GCV). In the surface fittingprocedure three independent spline variables were used, longitude, latitude, andelevation above sea level. They were considered the most appropriate for fittingsurfaces related to temperature or precipitation parameters.
Twelve monthly climate surfaces were created for each of the basic climaticparameters (Tmax, Tmin, Temp, Prec, and PET), and a surface for Tsum andTwin. These elementary climate surfaces were combined into various derivedclimate surfaces using formulas and models, which will be explained in thefollowing sections.
Aridity index (AI)
with i: month numberprec: total precipitation during month Ipet: total potential evapotranspiration (Penman-Monteith) during month I
Precipitation deficit (PD)
Annual heat units (AHU)
(Tempi x NumDaysi)Temp>Threshold
12
AHU= Σi=1
(preci – peti)12
PD = Σi=1
12 12
AI = Σ prec/ Σ pet
i=1 i=1
-70-
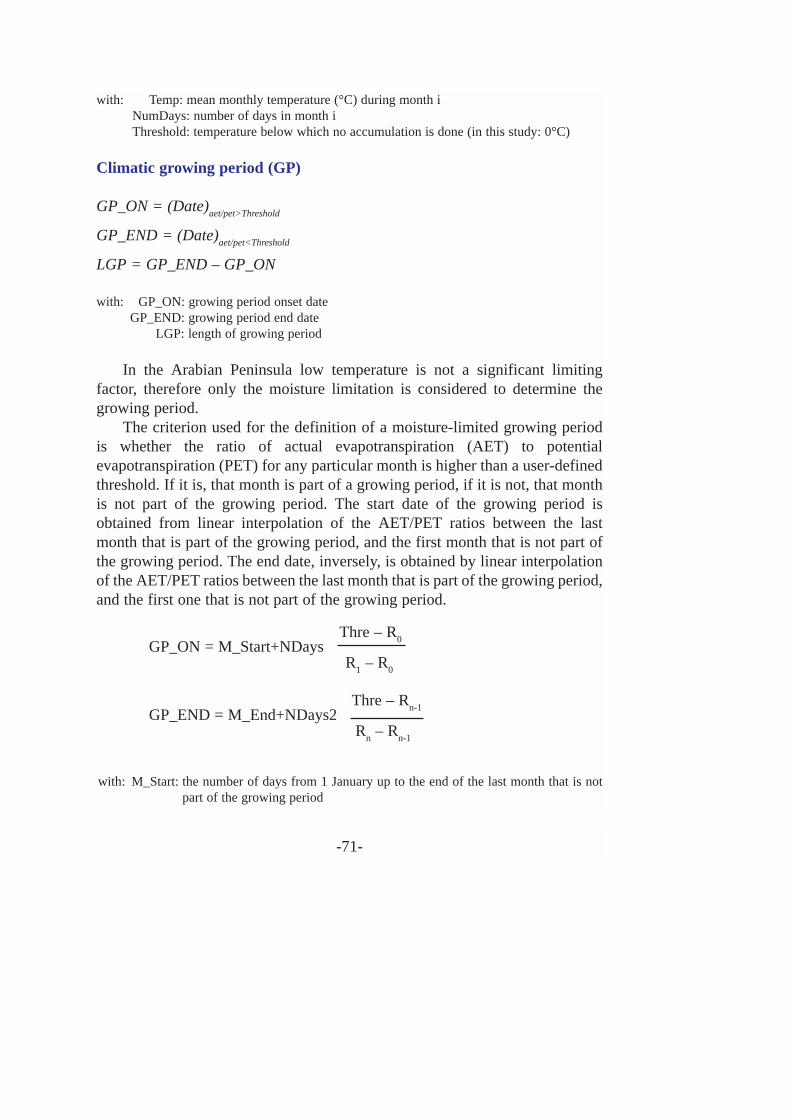
with: Temp: mean monthly temperature (°C) during month iNumDays: number of days in month iThreshold: temperature below which no accumulation is done (in this study: 0°C)
Climatic growing period (GP)
GP_ON = (Date)aet/pet>Threshold
GP_END = (Date)aet/pet<Threshold
LGP = GP_END – GP_ON
with: GP_ON: growing period onset dateGP_END: growing period end date
LGP: length of growing period
In the Arabian Peninsula low temperature is not a significant limitingfactor, therefore only the moisture limitation is considered to determine thegrowing period.
The criterion used for the definition of a moisture-limited growing periodis whether the ratio of actual evapotranspiration (AET) to potentialevapotranspiration (PET) for any particular month is higher than a user-definedthreshold. If it is, that month is part of a growing period, if it is not, that monthis not part of the growing period. The start date of the growing period isobtained from linear interpolation of the AET/PET ratios between the lastmonth that is part of the growing period, and the first month that is not part ofthe growing period. The end date, inversely, is obtained by linear interpolationof the AET/PET ratios between the last month that is part of the growing period,and the first one that is not part of the growing period.
with: M_Start: the number of days from 1 January up to the end of the last month that is notpart of the growing period
Thre – Rn-1GP_END = M_End+NDays2
Rn – Rn-1
Thre – R0GP_ON = M_Start+NDays
R1 – R0
-71-

M_End: the number of days from 1 January up to the end of the month preceding the lastmonth of the growing period
NDays: number of days in the first month of the growing periodNDays2: number of days in the last month of the growing periodThre: |AET/PET threshold for defining a growing period (user-defined; for this study set
to .5)R0: AET/PET ratio for the month preceding the first month of the growing period;
R1: AET/PET ratio for the first month of the growing period;
Rn-1: AET/PET ratio for the month preceding the last month of the growing period;
Rn: AET/PET ratio for the last month of the growing period.
If more than one growing period occurs, a distinction is made between thefirst and the second growing period, but the calculation procedure is the same.
Similarity index
A combined temperature-precipitation based similarity index is calculated asfollows1:
1. For each grid cell the 12 monthly mean temperature (Temp) and precipitationvalues (Prec) are taken;
2. The square deviations with the match locations are summed:
and
3. The deviations are sorted and ranked into arrays [Tr]n and [Pr]m.
4. The similarity index for temperature in a grid cell j is then calculated as:
( )
−−
−=1
,11100
N
TrTrrankTs j
j
( )∑=
−=12
1
2Pri iPiecPr
( )[ ]∑=
−=12
1
210i iTiTempTr
-72-
1 Procedure developed by Dr. F. Pertziger, SANIGMII, Tashkent, Uzbekistan.

and similarity in precipitation as:
in which rank is a ranking number of b in array .
5. The combined temperature-precipitation similarity is calculated as:
where the WT and WP are the weights assigned to temperature and precipitation, respectively. In
this study, equal weights have been used for WT and WP.
Biomass productivity indices
A distinction is made between biomass productivity indices for naturalvegetation/rangeland and for crops.
One rangeland biomass productivity index (RBPI) is defined as follows:
RBPI = AHU x AI
with: AHU: annual heat units (°C days)AI: aridity index
The RBPI can, therefore, be considered as the atmospheric energy availablefor biomass production, as expressed by accumulated temperature, adjusted forthe moisture regime.
Biomass productivity indices for crops can be developed using the sameprinciple, except that temperature outside the time bounds of the moisture-limited growing period are not considered.
The first step is to calculate a daily adjusted thermal increment (ATI) as afunction of the adaptability range for each crop group.
( ) ( )22
22
100PT
PSTS
WW
WPWTS
++
= ,
A( )Ab,
( )
−−
−=1
,11100
M
PrPrrankPs j
j ,
-73-
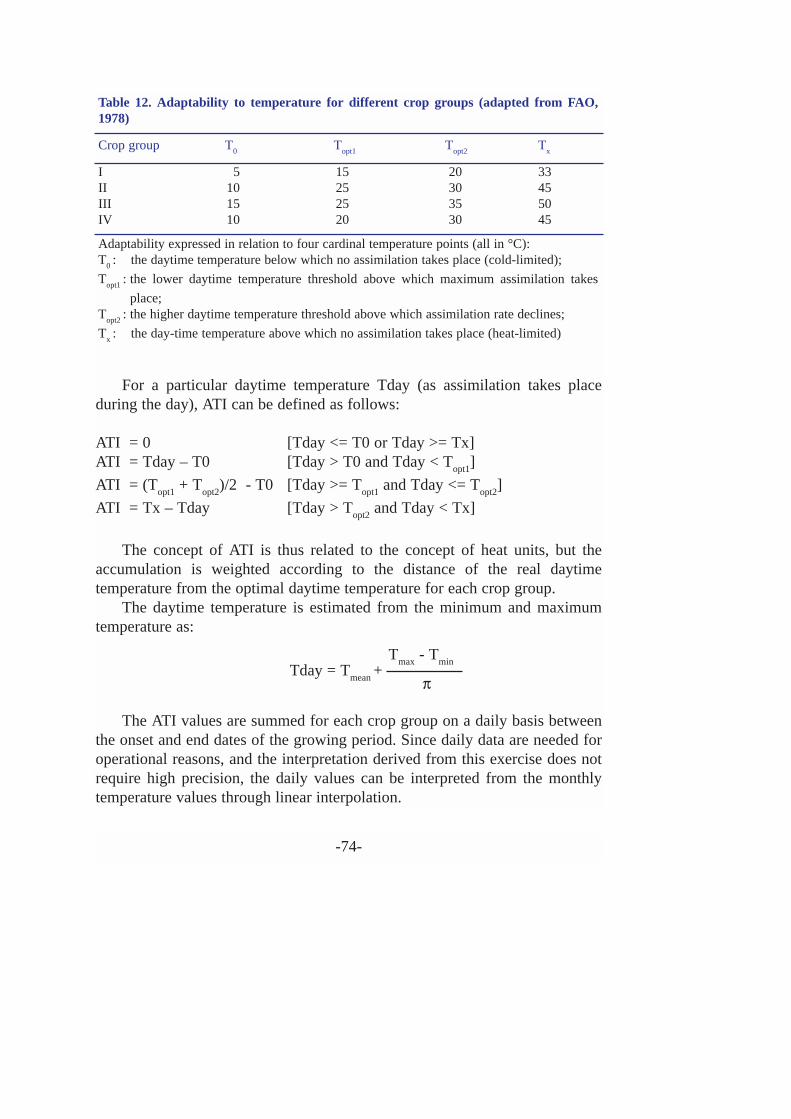
For a particular daytime temperature Tday (as assimilation takes placeduring the day), ATI can be defined as follows:
ATI = 0 [Tday <= T0 or Tday >= Tx]ATI = Tday – T0 [Tday > T0 and Tday < Topt1]
ATI = (Topt1 + Topt2)/2 - T0 [Tday >= Topt1 and Tday <= Topt2]
ATI = Tx – Tday [Tday > Topt2 and Tday < Tx]
The concept of ATI is thus related to the concept of heat units, but theaccumulation is weighted according to the distance of the real daytimetemperature from the optimal daytime temperature for each crop group.
The daytime temperature is estimated from the minimum and maximumtemperature as:
The ATI values are summed for each crop group on a daily basis betweenthe onset and end dates of the growing period. Since daily data are needed foroperational reasons, and the interpretation derived from this exercise does notrequire high precision, the daily values can be interpreted from the monthlytemperature values through linear interpolation.
Tmax - TminTday = Tmean +
π
Table 12. Adaptability to temperature for different crop groups (adapted from FAO,1978)
Crop group T0 Topt1 Topt2 Tx
I 5 15 20 33II 10 25 30 45III 15 25 35 50IV 10 20 30 45
Adaptability expressed in relation to four cardinal temperature points (all in °C): T0 : the daytime temperature below which no assimilation takes place (cold-limited);
Topt1 : the lower daytime temperature threshold above which maximum assimilation takes
place;Topt2 : the higher daytime temperature threshold above which assimilation rate declines;
Tx : the day-time temperature above which no assimilation takes place (heat-limited)
-74-

The biomass productivity index for each crop group can then be defined as:
with: j: crop groupI: day numberATI: adjusted thermal increment (°C)GP_ON: growing period onset date GP_END: growing period end date
8.4. Soil maps
All soil information was obtained, directly or indirectly, from the FAO Soil Mapof the World (SMW).
Soil associations
Obtained directly from the digital version of the SMW (FAO, 1995).
Derived soil properties
The original resolution of the derived soil property maps on the Digital SMWis 5 arc-minutes (about 10 x 10 km). To allow mapping of the derived soilproperties at 1 km resolution, the original Soil Associations vector file wasconverted to a 30 arc-second grid. The QuickBasic code of the viewing programIMAGES.BAS was then modified to allow operation on a 30 arc-second gridand to export the generated maps as ASCII grids.
8.5. Land use and cover maps
Land use/cover
Map clipped from CWANA map in Celis and De Pauw (2001).
Irrigated areas
NDVI (Normalized Difference Vegetation Index) from AVHRR 8 x 8 kmdownloaded from Goddard DAAC as monthly datasets for period 1981-94.(URL:
ji
ENDGP
ONGPij ATICBPI ,
_
_
)(∑=
=
-75-

http://daac.gsfc.nasa.gov/CAMPAIGN_DOCS/LAND_BIO/GLBDST_Data.html)
Threshold of NDVI > 0.46 used to superimpose masks for years 1982,1985, 1987, 1990, and 1993 representing expansion of irrigated areas.
References
Allen, R.G., Pereira, L.S., Raes, D. and Smith M. 1998. Crop evapotranspiration: Guidelines forcomputing crop water requirements. FAO Irrigation and Drainage Paper 56. FAO, Rome.300 pp.
Barth, H.K. 1976. Natürraumliche Gliederung und Einzellandschaften. Pages 51-90 in SaudiArabien. Natur, Geschichte, Mensch und Wirtschaft (Blume, H.H. ed.) H. Erdmann Verlag
Celis, D. and De Pauw, E. 2001. Assessment of land cover/land use and growing periodcharacteristics in CWANA region using AVHRR imagery. ICARDA Research Report,ICARDA, Aleppo, Syria.
Choisnel, E., de Villele, O. and Lacroze, F. 1992. Une approche uniformisée du calcul del'évapotranspiration potentielle pour l'ensemble des pays de la Communauté Européenne.Centre Commun de Recherche, Commission des Communautés Européennes, EUR 14223.178 pp.
Cochemé, J. and Franquin, P. 1967. An agroclimatology survey of a semi-arid area in Africasouth of the Sahara. World Meteorological Organization, 86, No. 210, TP 110.
De Pauw, E. 1983. Agricultural potential and constraints in relation to growing periods and theirvariability in Tanzania. Pédologie 33:2: 147?170.
De Pauw, E. 1998. Status of agroecological characterization in the Arabian Peninsula. Reportprepared for the Regional Technical Coordination Meeting held in Manama, Bahrain, 24-26May 1998. Arabian Peninsula Regional Program, ICARDA, Aleppo, Syria.
Driessen, P.M. and Dudal, R. (eds.) 1991. The major soils of the world. Lecture notes on theirgeography, formation, properties and use. Agricultural University of Wageningen andKatholieke Universiteit Leuven. 310 pp. ISBN 90-800725-1-6.
ESRI (Environmental Systems Research Institute). 1993. Digital chart of the world. ESRI,Redlands, California, USA
FAO (Food and Agriculture Organization of the United Nations). 1974. FAO-UNESCO soilmap of the world. Vol.I: Legend. UNESCO, Paris.
FAO (Food and Agriculture Organization of the United Nations). 1978?81. Reports of theagro?ecological zones project. World Soil Resources Report No. 48, Vol.1 Africa. FAO,Rome.
FAO (Food and Agriculture Organization of the United Nations). 1988. FAO-UNESCO soilmap of the world: revised legend. World Soil Resources Report No. 60. FAO, Rome, Italy.
FAO. (Food and Agriculture Organization of the United Nations). 1995. Digital soil map of theworld and derived soil properties. CD-ROM, version 3.5, November 1995.
FAO. (Food and Agriculture Organization of the United Nations). 1995b. FAOCLIM 1.2. ACD-ROM with a compilation of monthly worldwide agroclimatic data. FAOAgrometeorology Working Paper Series No.11. FAO, Rome, Italy. 68 pp. (and one CD-ROM)
-76-

FAO. (Food and Agriculture Organization of the United Nations). 2001. FAOSTAT AgricultureData. FAO Statistical Databases. http://apps.fao.org/page/collections?subset=agriculture
Fisher, M. and Membery, D.A. 1998. Climate. Pages 5-38 in Vegetation of the ArabianPeninsula. Geobotany 25 (Ghazanfar, S.A. and Fisher, M. eds.). Kluwer AcademicPublishers. Dordrecht, the Netherlands, 362 pp.
Gesch, D.B. and Larson, K.S. 1996. Techniques for development of global 1-kilometer digitalelevation models. in Pecora Thirteen, Human interactions with the environment. (And on-line document. URL: http://edcdaac.usgs.gov/gtopo30/README.html)
Guba, I. and Glennie, K. 1998. Geology and geomorphology. Pages 39-62 in Vegetation of theArabian Peninsula. Geobotany 25 (Ghazanfar, S.A. and Fisher, M. eds.). Kluwer AcademicPublishers , Dordrecht, the Netherlands, 362 pp.
Hutchinson, M.F. 1995. Interpolating mean rainfall using thin plate smoothing splines.International Journal of Geographical Information Systems, 9: 385-403.
Kürschner, H. 1998. Biogeography and introduction to vegetation. Pages 63-98 in Vegetation ofthe Arabian Peninsula. Geobotany 25 (Ghazanfar, S.A. and Fisher, M. eds.). KluwerAcademic Publishers, Dordrecht, the Netherlands, 362 pp.
Ryan, J., Masri, S., Garabet, S., Diekmann, J. and Habib, H. 1997. Soils of ICARDA'sagricultural experiment stations and sites. ICARDA, Aleppo, Syria, 107 pp.
USDA (United States Department of Agriculture) 1951. Soil survey manual. USDA,Agriculture handbook No. 18. USDA, Washington, D.C., USA.
UNESCO (United Nations Educational, Scientific and Cultural Organization) 1979. Map of theworld distribution of arid regions. Map at scale 1:25,000,000 with explanatory note. UNESCO, Paris. 54 pp.
World Resources Institute. 2001. EarthTrends.On-line database. URL: http://earthtrends.wri.org/country_profiles
-77-

An agroecological exploration of theArabian Peninsula
by
Eddy De Pauw
International Center for Agricultural Research in the Dry Areas

-78-
