© 2010 pearson addison-wesley chapter-2 the economic problem
TRANSCRIPT
© 2010 Pearson Addison-Wesley
CHAPTER-2
THE ECONOMIC PROBLEM

© 2010 Pearson Addison-Wesley
Why does food cost much more today than it did a few years ago?
We use an economic model—the production possibilities frontier—to explain the economic problem. (Scarcity-problem)
We also use this model to study how we can expand our production possibilities; how we gain by trading with others; and why the social institutions have evolved.
© 2010 Pearson Addison-Wesley
Production Possibilities and Opportunity Cost
The production possibilities frontier (PPF) is the boundary between those combinations of goods and services that can be produced and those that cannot.
To illustrate the PPF, we focus on two goods at a time and hold the quantities of all other goods and services constant.
That is, we look at a model economy in which everything remains the same (ceteris paribus) except the two goods we’re considering.

© 2010 Pearson Addison-Wesley
Production Possibilities and Opportunity Cost
Production Possibilities Frontier
Figure 2.1 shows the PPF for two goods: cola and pizza.
Any point on the frontier such as E and any point inside the PPF such as Z are attainable.
Points outside the PPF are unattainable.

© 2010 Pearson Addison-Wesley
Production Efficiency
We achieve production efficiency if we cannot produce more of one good without producing less of some other good.
Points on the frontier are efficient.
Production Possibilities and Opportunity Cost
© 2010 Pearson Addison-Wesley
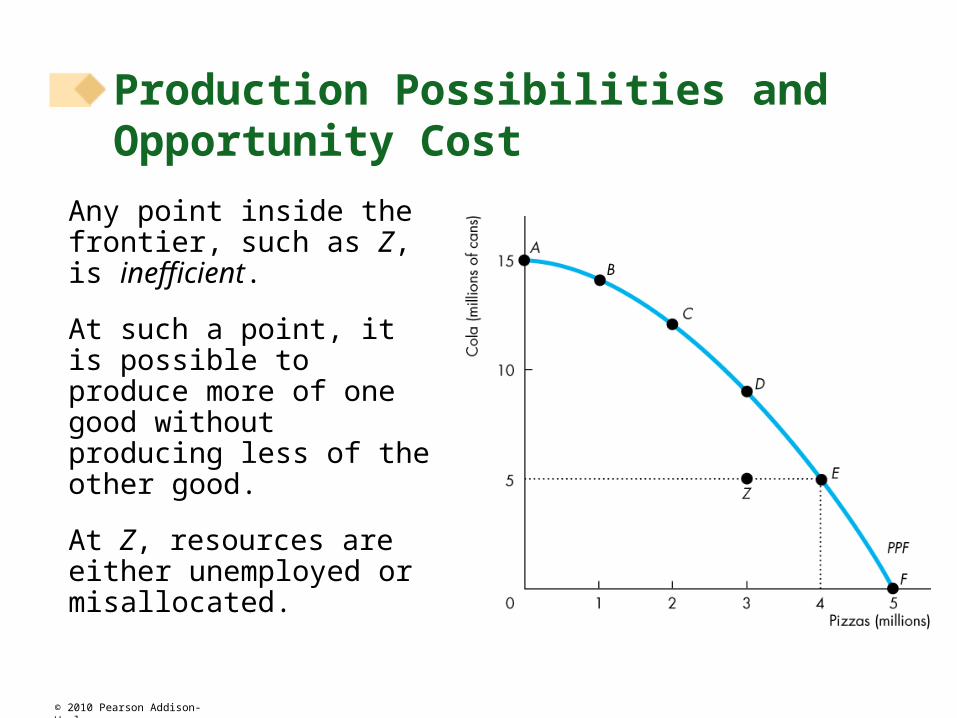
Any point inside the frontier, such as Z, is inefficient.
At such a point, it is possible to produce more of one good without producing less of the other good.
At Z, resources are either unemployed or misallocated.
Production Possibilities and Opportunity Cost
© 2010 Pearson Addison-Wesley
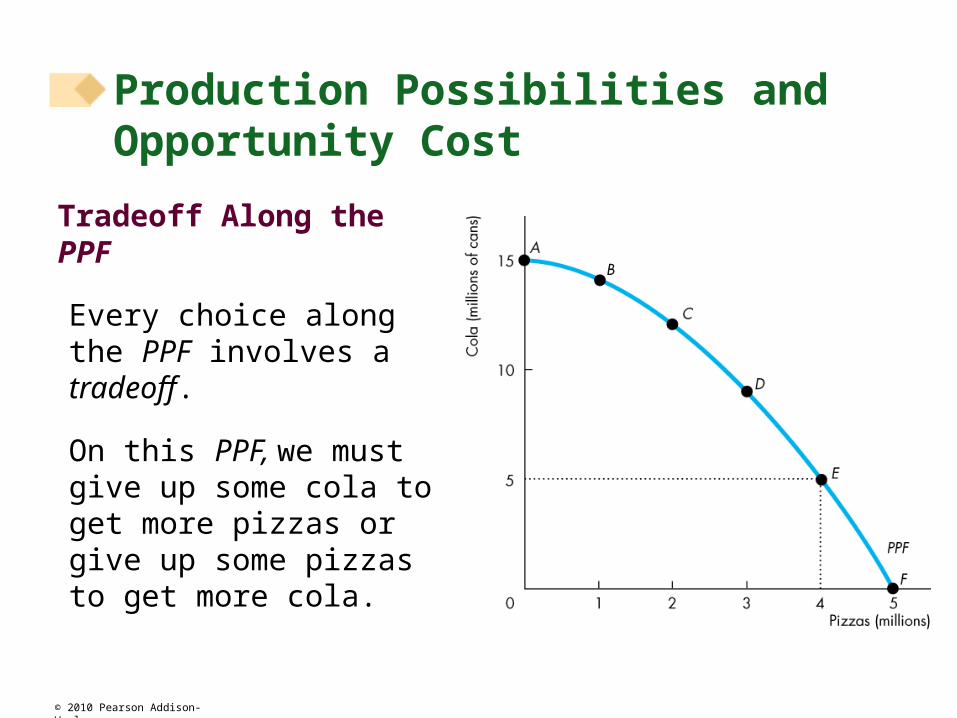
Tradeoff Along the PPF
Every choice along the PPF involves a tradeoff.
On this PPF, we must give up some cola to get more pizzas or give up some pizzas to get more cola.
Production Possibilities and Opportunity Cost
© 2010 Pearson Addison-Wesley
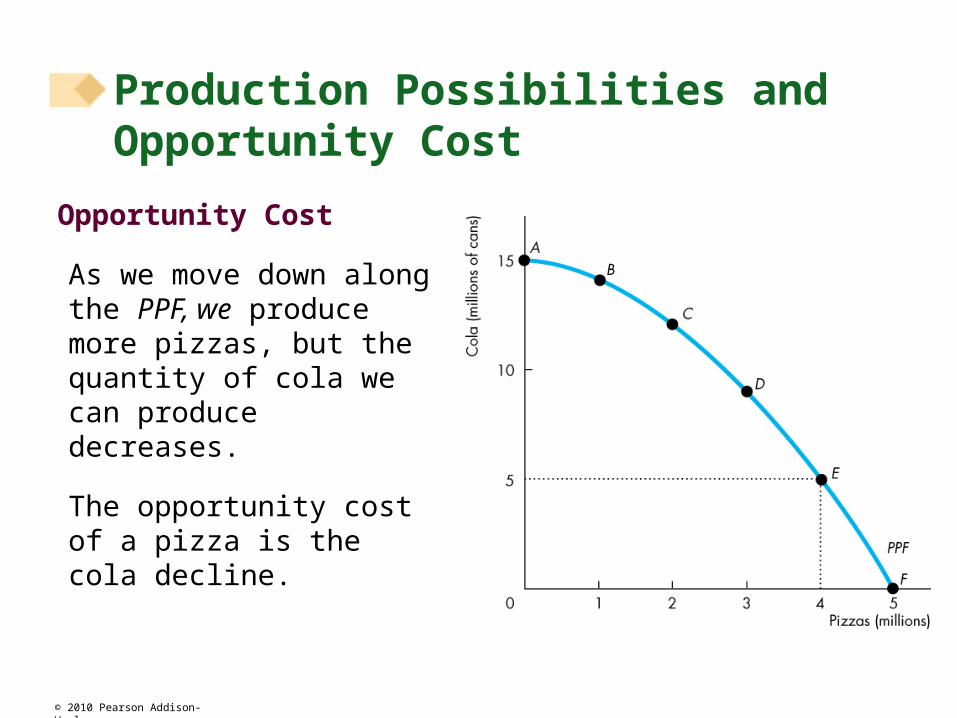
Opportunity Cost
As we move down along the PPF, we produce more pizzas, but the quantity of cola we can produce decreases.
The opportunity cost of a pizza is the cola decline.
Production Possibilities and Opportunity Cost
© 2010 Pearson Addison-Wesley
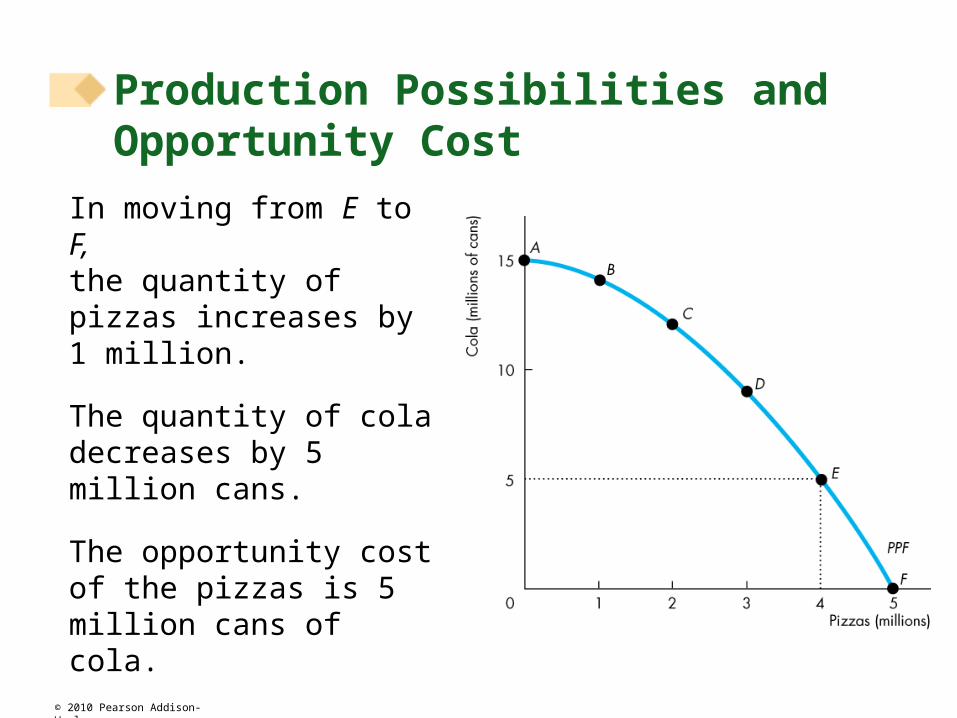
In moving from E to F, the quantity of pizzas increases by 1 million.
The quantity of cola decreases by 5 million cans.
The opportunity cost of the pizzas is 5 million cans of cola.
Production Possibilities and Opportunity Cost

© 2010 Pearson Addison-Wesley
In moving from F to E, the quantity of cola produced increases by 5 million.
The quantity of pizzas decreases by 1 million.
Production Possibilities and Opportunity Cost

© 2010 Pearson Addison-Wesley
Because resources are not equally productive in all activities, the PPF bows outward—is concave.
The outward bow of the PPF means that as the quantity produced of each good increases, so does its opportunity cost.
Production Possibilities and Opportunity Cost

© 2010 Pearson Addison-Wesley
All the points along the PPF are efficient.
To determine which of the alternative efficient quantities to produce, we compare costs and benefits.
The PPF and Marginal Cost
The PPF determines opportunity cost.
The marginal cost of a good or service is the opportunity cost of producing one more unit of it.
Using Resources Efficiently

© 2010 Pearson Addison-Wesley
Figure 2.2 illustrates the marginal cost of pizza.
As we move along the PPF in part (a), the opportunity cost of a pizza increases.
The opportunity cost of producing one more pizza is the marginal cost of a pizza.
Using Resources Efficiently

© 2010 Pearson Addison-Wesley
Using Resources Efficiently
In part (b) of Fig. 2.2, the bars illustrate the increasing opportunity cost of pizza.
The black dots and the line MC show the marginal cost of pizza.
The MC curve passes through the center of each bar.

© 2010 Pearson Addison-Wesley
Preferences and Marginal Benefit
Preferences are a description of a person’s likes and dislikes.
To describe preferences, economists use the concepts of marginal benefit and the marginal benefit curve.
The marginal benefit of a good or service is the benefit received from consuming one more unit of it.
We measure marginal benefit by the amount that a person is willing to pay for an additional unit of a good or service.
Using Resources Efficiently

© 2010 Pearson Addison-Wesley
It is a general principle that the more we have of any good, the smaller is its marginal benefit and the less we are willing to pay for an additional unit of it.
We call this general principle the principle of decreasing marginal benefit.
The marginal benefit curve shows the relationship between the marginal benefit of a good and the quantity of that good consumed.
Using Resources Efficiently
© 2010 Pearson Addison-Wesley
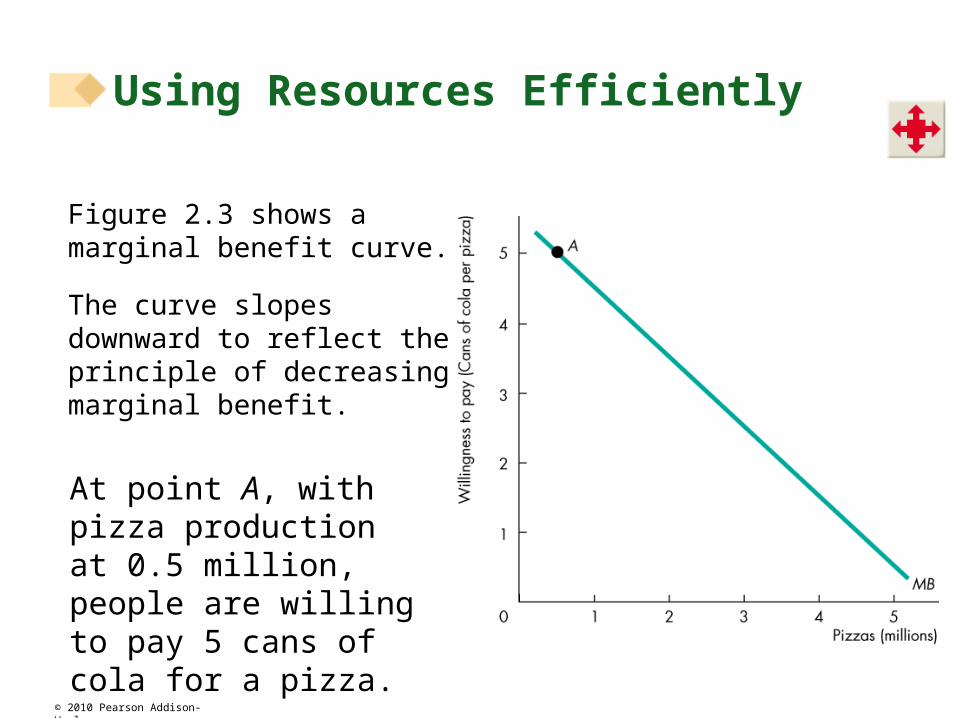
Figure 2.3 shows a marginal benefit curve.
The curve slopes downward to reflect the principle of decreasing marginal benefit.
At point A, with pizza production at 0.5 million, people are willing to pay 5 cans of cola for a pizza.
Using Resources Efficiently
© 2010 Pearson Addison-Wesley
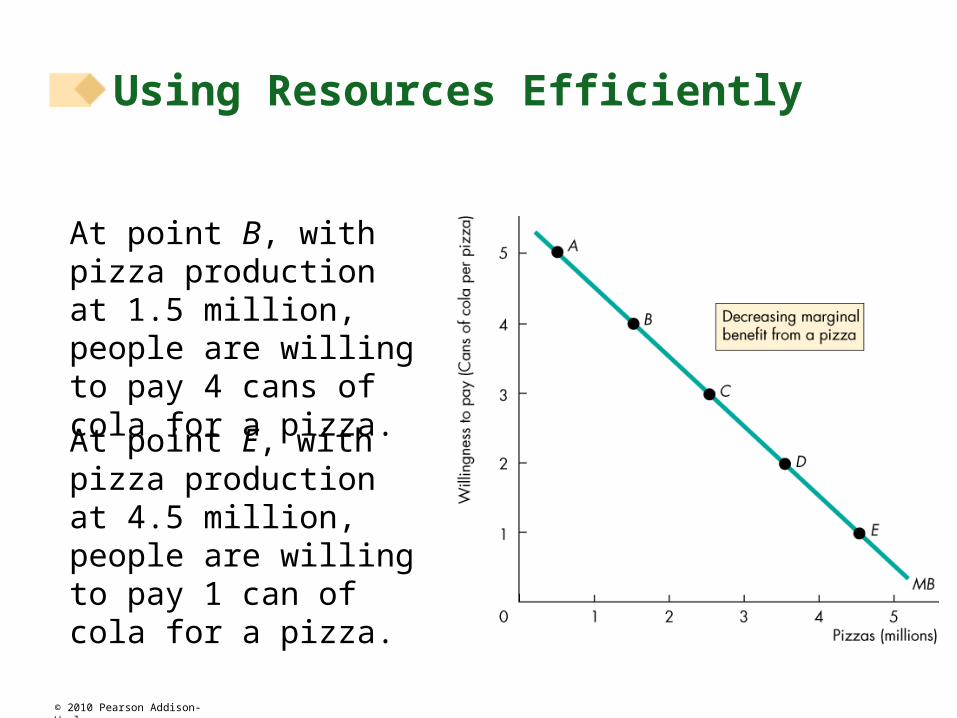
At point B, with pizza production at 1.5 million, people are willing to pay 4 cans of cola for a pizza.
At point E, with pizza production at 4.5 million, people are willing to pay 1 can of cola for a pizza.
Using Resources Efficiently

© 2010 Pearson Addison-Wesley
Allocative Efficiency
When we cannot produce more of any one good without giving up some other good, we have achieved production efficiency.
We are producing at a point on the PPF.
When we cannot produce more of any one good without giving up some other good that we value more highly, we have achieved allocative efficiency.
We are producing at the point on the PPF that we prefer above all other points.
Using Resources Efficiently

© 2010 Pearson Addison-Wesley
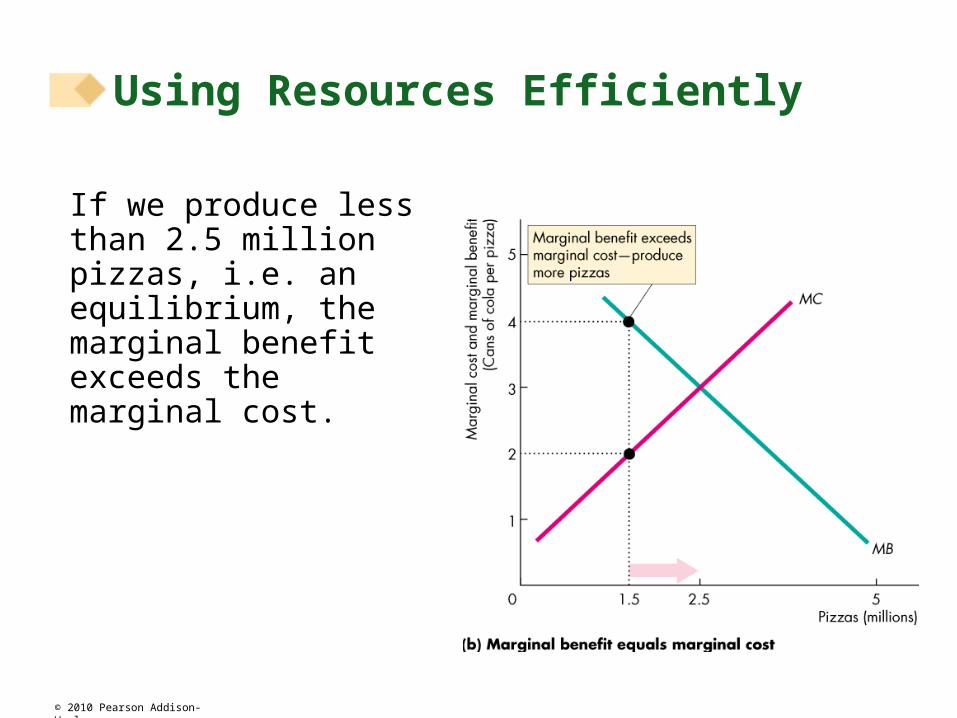
Figure 2.4 illustrates allocative efficiency.
The point of allocative efficiency is the point on the PPF at which marginal benefit equals marginal cost.
Using Resources Efficiently
© 2010 Pearson Addison-Wesley
If we produce less than 2.5 million pizzas, i.e. an equilibrium, the marginal benefit exceeds the marginal cost.
Using Resources Efficiently
© 2010 Pearson Addison-Wesley
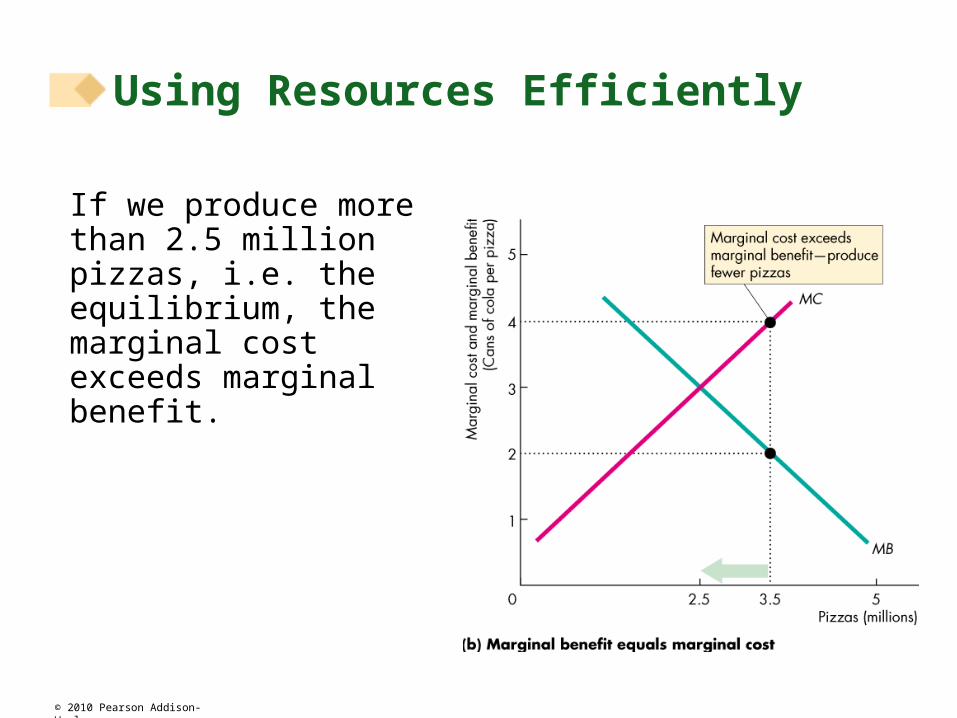
If we produce more than 2.5 million pizzas, i.e. the equilibrium, the marginal cost exceeds marginal benefit.
Using Resources Efficiently

© 2010 Pearson Addison-Wesley
If we produce exactly 2.5 million pizzas, i.e. at the equilibrium, the marginal cost equals marginal benefit.
Using Resources Efficiently
© 2010 Pearson Addison-Wesley
The expansion of production possibilities—and increase in the standard of living—is called economic growth.
Two key factors influence economic growth:
Technological change
Capital accumulation
Technological change is the development of new goods and of better ways of producing goods and services.
Capital accumulation is the growth of capital resources, which includes human capital.
Economic Growth
© 2010 Pearson Addison-Wesley
The Cost of Economic Growth
To use resources in research and development and to produce new capital, we must decrease our production of consumption goods and services.
So economic growth is not free.
The opportunity cost of economic growth is less current consumption.
Economic Growth
© 2010 Pearson Addison-Wesley
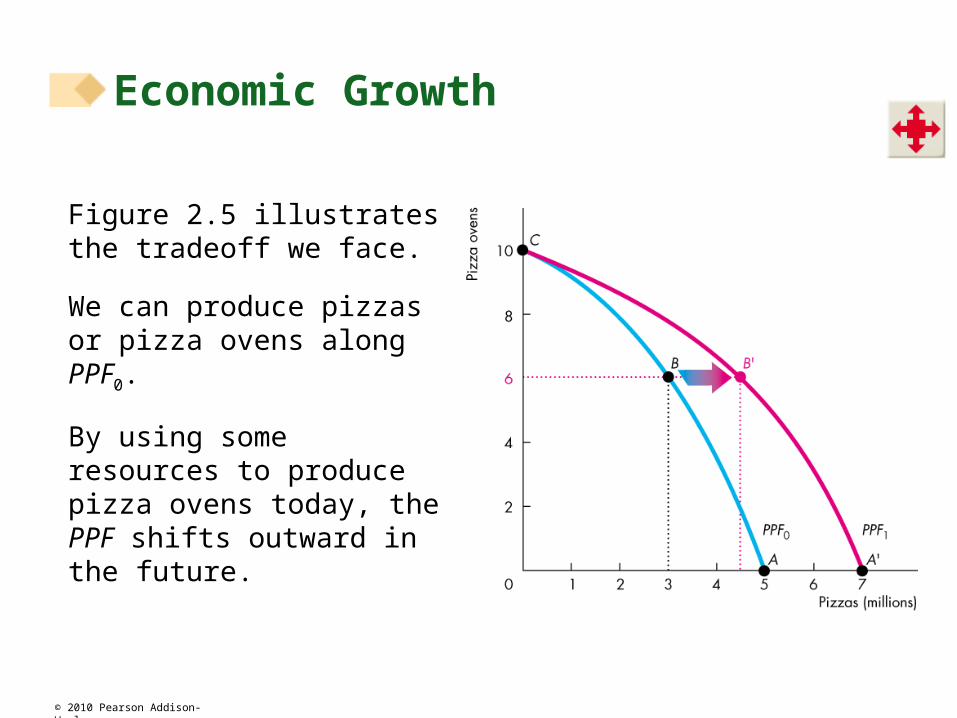
Figure 2.5 illustrates the tradeoff we face.
We can produce pizzas or pizza ovens along PPF0.
By using some resources to produce pizza ovens today, the PPF shifts outward in the future.
Economic Growth