© 2011 sulhee yoon - university of...
TRANSCRIPT

1
FINDING FOOD DESERTS BASED ON FOOD ACCESS INDEX AND TRANSPORTATION MODES: CASE STUDY OF SARASOTA COUNTY, FL
By
SULHEE YOON
A THESIS PRESENTED TO THE GRADUATE SCHOOL OF THE UNIVERSITY OF FLORIDA IN PARTIAL FULFILLMENT OF THE REQUIREMENTS FOR THE DEGREE
OF MASTER OF ARTS IN URBAN AND REGIONAL PLANNING
UNIVERSITY OF FLORIDA
2011

2
© 2011 Sulhee Yoon

3
To my mother and father, for all their support and myself

4
ACKNOWLDEGEMENTS
I would like to give a special thanks to my chair Dr. Ilir Bejleri, for his continued
patience and feedback. Ilir guided me in a right direction whenever I was having a
difficulty working on my thesis and my interest endeavor while studying in Urban and
Regional Planning department. He helped me to gain better understanding for the
bigger pictures. I would also appreciate my co-chair, Dr. Ruth Steiner, who provided me
valuable instruction, and guidance throughout this entire process. She is an admirable
professor and from her I have learned the importance of working with something that I
feel passionate about. Next, I also need to acknowledge staff in UF/IFAS Sarasota
County Extension Office. Specially, I would like to thank Dr. Charlie Vavrina, Dr. Robert
Kluson, and Evangeline "Van" Linkous for their belief in me and providing resources that
I can continue my research. Additionally I want to thank professor Dr. Sang-moon Lee
who gives me continuous moral and academic support from South Korea. I am very
lucky to have wonderful people in my life.
I would also likely to thank all the people who spent time with me in Urban and
Regional Planning (faculty, staff, and colleagues). It was great for me to live in ‗gator
nation‘. Plus I thank to my friends and colleagues both in United States and South
Korea who always listen to my complaints patiently.
Last but certainly not least, I would like to thank my parents in South Korea. I could
not be here without their love and endless support. I cannot wait to give them a huge
hug.

5
TABLE OF CONTENTS Page
ACKNOWLDEGEMENTS ............................................................................................... 4
LIST OF TABLES ............................................................................................................ 7
LIST OF FIGURES .......................................................................................................... 8
ABSTRACT ................................................................................................................... 10
CHAPTER
1 INTRODUCTION .................................................................................................... 12
Problem Statement ................................................................................................. 12
Research Objective and Questions ........................................................................ 13
2 LITERATURE REVIEW .......................................................................................... 15
Definition of Terms .................................................................................................. 16 Food Environment ............................................................................................ 16
Food Security and Insecurity ............................................................................ 17 Food Desert ...................................................................................................... 18
Geographic Measures of Food Accessibility ........................................................... 18
Socioeconomic Food Inequality in the U.S. ............................................................ 19 Low-Income Households .................................................................................. 19
Racial Segregation ........................................................................................... 21 Elderly Population ............................................................................................ 22
Transportation and Food Access ............................................................................ 23
Public Transportation Infrastructure ................................................................. 23 Vehicle Ownership ........................................................................................... 24
Types of Food Stores.............................................................................................. 25
Food Purchasing Behavior and its Associations with Health .................................. 26
Summary ................................................................................................................ 29
3 METHODOLOGY FOR MAPPING AND ANALYZING POTENTIAL FOOD DESERTS ............................................................................................................... 33
Establishing Case Study Area ................................................................................ 33 Food Access/ Desert Study of Sarasota County ..................................................... 34
USDA Food Desert Locator: Food Desert in Sarasota County ......................... 34 TRF Policy Map: Food Access in Sarasota County .......................................... 35 County Health Ranking 2011: Access to Healthy Food in Sarasota County .... 35
Place to Buy a Gallon of Milk Analysis, Sarasota County ................................. 36 Summary of Previous Studies .......................................................................... 36
Creating Food Access Index: Indicators for Analysis .............................................. 37 Indicator 1: Healthy Food Outlet ....................................................................... 38

6
Indicator 2-1: Proximity and Coverage to Healthy Food Outlet......................... 38 Indicator 2-2: Re-assessing Food Access Index with Proximity to Healthy
Food Outlets .................................................................................................. 39
Indicator 3: Network according to Transportation (walking and driving) Modes ........................................................................................................... 40
Distance from Residential Zone to Healthy Food Outlets ................................. 41 Application of Methodology: Using GIS to Measure Food Access .................... 41
4 FINDINGS AND RESULTS ..................................................................................... 45
Result from Previous Studies .................................................................................. 45
USDA Food Desert Locator: Food Desert in Sarasota County ......................... 45
TRF Policy Map: Food Access in Sarasota County .......................................... 46 County Health Ranking 2011: Access to Healthy Food in Sarasota County .... 46 Place to Buy a Gallon of Milk Analysis, Sarasota County ................................. 47
Food Access Index ................................................................................................. 47
Relationship between Food Access Index and Vehicle Ownership in each Transportation Network Boundary ....................................................................... 48
Food Deserts in Sarasota County ........................................................................... 50 Food Deserts for Pedestrian and Drivers ......................................................... 51 Food Deserts with Parcel Data ......................................................................... 52
Food Deserts Assessment with Socioeconomic Disparities .................................... 53
5 DISCUSSION ......................................................................................................... 76
Food Policy and Food Assistance Programs .......................................................... 77 Community Gardens ............................................................................................... 79
Limitation of this Study ............................................................................................ 80 Needs of Survey and Health Outcome ............................................................. 80 Transit Routes and Opportunity with Euclidean Distance ................................. 81
Definition of Healthy Food Outlets .................................................................... 82 Opportunity for Future Research ............................................................................ 82
6 CONCLUSION ........................................................................................................ 85
APPENDIX: METHODOLOGY OF COUNTY HEALTH RANKING 2011 ....................... 87
LIST OF REFERENCES ............................................................................................... 88
BIOGRAPHICAL SKETCH ............................................................................................ 92

7
LIST OF TABLES
Table Page
2-1 Examples of geographical accessibly measurement in previous studies ........... 31
3-1 2007 NAICS codes selected for healthy food outlets and its example of food services .............................................................................................................. 43
3-2 Data inventory used to measure food outlet street network ................................ 43
3-3 Types and number of parcel data defined in residential land uses ..................... 43
4-1 USDA Food Desert Locator result of Sarasota County ....................................... 55
4-2 Explanation of Table 4-1 ..................................................................................... 55
4-3 Summary of Sarasota County access to healthy foods from County Health Rankings ............................................................................................................ 56
4-4 Result of t-test between two variables: vehicle ownership and food access index in ½ miles walking network ....................................................................... 56
4-5 Result of t-test between two variables: vehicle ownership and food access index in 10 miles driving network ........................................................................ 56
4-6 Land uses from parcel data included in food desert ........................................... 57

8
LIST OF FIGURES
Figure page
2-1 A conceptual model of the link between age, food access, and health outcomes ............................................................................................................ 32
2-2 Types and definition of food stores. Source: Sharkey et al. (2010) .................... 32
3-1 Walking and driving distances from healthy food outlets (transportation network) .............................................................................................................. 44
4-1 Food desert locations in Sarasota County. Source: USDA Food Desert Locator ............................................................................................................... 59
4-2 TRF policy map of Sarasota County ................................................................... 60
4-3 Place to buy gallon of milk analysis, Sarasota County. ...................................... 61
4-4 Food access index from Census block centroid point to healthy food outlets in Sarasota County using Manhattan distance (without ‗No food outlet‘) ............ 62
4-5 Food access index from Census block centroid point to healthy food outlets in Sarasota County using Manhattan distance (without ‗No food outlet‘) ............ 63
4-6 Food access index of Sarasota County in walking network (1/2 mile) ................ 64
4-7 Food access index of Sarasota County in driving network (10 miles) ................. 65
4-8 Food deserts based on proximity to healthy food outlets and proximity and coverage to healthy food outlets ......................................................................... 66
4-9 Food deserts and EPLs ...................................................................................... 67
4-10 Food deserts, Sarasota County, FL (excluding EPLs) ........................................ 68
4-11 Food deserts for pedestrian ................................................................................ 69
4-12 Food deserts for drivers ...................................................................................... 70
4-13 Comparison between residential parcel and census block centroid point ........... 71
4-14 Food access index overlaid in residential land use parcel .................................. 72
4-15 Distribution of population with below poverty, and food deserts in Sarasota County, FL .......................................................................................................... 73
4-16 No vehicle ownership distribution, and food deserts in Sarasota County, FL ..... 74

9
4-17 Population 65 years older, and food deserts in Sarasota County, FL ................. 75
5-1 Community gardens in Sarasota County, FL Source: Sarasota County Green Map .................................................................................................................... 84

10
Abstract of Thesis Presented to the Graduate School of the University of Florida in Partial Fulfillment of the
Requirements for the Degree of Master of Arts in Urban and Regional Planning
FINDING FOOD DESERTS BASED ON FOOD ACCESS INDEX AND TRANSPORTATION MODES: CASE STUDY OF SARASOTA COUNTY, FL
By
Sulhee Yoon
December 2011
Chair: Ilir Bejleri CoChair: Ruth L. Steiner Major: Urban and Regional Planning
Access to healthy food has become a vital issue in urban and rural for better
quality of life, disease prevention, and an essential element for health growth. The areas
with limited access to food are examined as ‗food desert‘ and this area include physical
and socioeconomic disparities. This thesis evaluated the spatial accessibility of ‗healthy
food outlets‘ in relation to walking and driving transportation network.
This study created criteria to evaluate physical distance to healthy food outlets:
Food access index. (1) Geographic Information System (GIS) is applied to measure
Manhattan block distance to the nearest healthy food outlets for 204 Census block
neighborhoods in Sarasota County, FL. (2) Using street network analysis, walking (0.5
mile) and driving (10 miles) buffers around healthy food outlets are created to determine
residents‘ food accessibly and to assess food desert. (3) Additionally, t-test for each
transportation mode is used to understand the relationship between food access index
and vehicle ownership.
The findings from this study (1) illustrates three levels of demographical
distribution of food access (high, medium, and low) and (2) identifies there are about

11
34.1% of the total population live in food desert areas. (3) Additionally, statistical result
shows a positive relationship between vehicle ownership and food access when
residents drive to buy healthy foods. This basically implies population with low
percentage of vehicle ownership has less healthy food accessibly in the case study
area.
This study found that there is a noticeable disparity in geographic access to
healthy food outlets based on transportation mode, auto vs. walking. These findings
have implications for future transportation planning food policy planning.

12
CHAPTER 1 INTRODUCTION
Problem Statement
In early 2010, First Lady Michelle Obama brought Americas‘ health problems to
the forefront and initiated the ―Let‘s Move‖ campaign. As part of the campaign proposal
to combat the rise of Type-2 Diabetes among American youth, one of the United State‘s
goals was to decrease the rate of obesity by providing greater access to affordable,
healthy foods. In 2004, the Centers for Disease Control and Prevention (CDC) stated
that obesity increases when food consumption takes place far from people‘s homes
(CDC, 2004).
Areas that are isolated and lack easy access to wholesome foods have been
dubbed ―food desert,‖ the rate of diabetes and obesity are higher among racial/ethnic
minorities and lower-income individuals in these areas. Inhabitants of theses ―food
deserts‖ have fewer supermarket options, and must rely on smaller convenience stores.
A study in San Diego found that supermarket chains offer twice the average volume of
―heart-healthy‖ foods, compared to neighborhood stores, and sell four times the average
volume of these foods compared to convenience stores (Morland et al., 2002a).
Emphasizing the importance of supermarkets for better access to healthy food, the
―Let‘s Move‖ campaign‘s website explains:
More than 23 million Americans, including 6.5 million children, live in low-income urban and rural neighborhoods that are more than one mile from the nearest supermarket. These communities, where access to affordable, quality, and nutritious foods is limited, are known as ‗food deserts.‘ In these communities, grocery stores that sell healthy foods such as fresh fruit and vegetables are inaccessible or healthy foods are too expensive. (―Let‘s Move‖ Campaign, 2010)

13
Food access has become a critical issue in urban and rural areas for the
achievement of a better quality of life, disease prevention, and healthy childhood
growth. However, these problems may be worse in food deserts, which are also
influenced by particular neighborhood environments and transportation networks.
Therefore, the existence of food deserts and restricted access to wholesome foods
have been highlighted as features of the built and physical environment that have a
socioeconomic dimension, and this may influence a community‘s current health status.
Research Objective and Questions
The objective of this thesis is to address two factors related to food deserts:
importance of proximity to determine physical food access and the pedestrian‘ or
driver‘s perspective to acknowledge food deserts. More specifically this study looks at
how the network of roads and pedestrian walkways and paths that lead to neighborhood
stores where food can be purchased determines access to healthy foods.
For the objective, providing a spatial overview of where food deserts are located
in our local area is needed and Sarasota County has been selected as a case study
area. Sarasota County has been named one of a highest- ranked ―healthy counties‖ in
the State of Florida (2011 County Health Ranking1). According to 2011 County Health
Ranking, about 83% of total population has an access and resources to wholesome
foods, compared to other counties in Florida. Throughout this work, the following ―big
picture‖ questions have guided this research:
1 Access to healthy food is measured based on the percent of residential Zip codes in a county with a
healthy food outlet, defined as grocery stores or produce stands/farmers‘ markets

14
What is the definition of a ―food desert‖? Is it absolute or does it varies from case to case?
What types of factors would accurately determine food desert in terms of physical access to foods?
Where is spatial inequality with regard to food access based on physical proximity?
How can this study contribute to the solutions to reduce food deserts?

15
CHAPTER 2 LITERATURE REVIEW
The food environment is understood differently by every one of its stakeholders,
ranging from the government to industry leaders to general residents (Rex and Blair,
2003). It is influenced by interactive factors, such as social class, food culture, life style
of the population, and economic status insofar as it influences food purchasing
behavior.
This chapter provides an organized overview of the literature on spatial access to
the food environment and its potentially adverse health outcomes. The first section
introduces a measurement method from previous studies. Then, the chapter continues
with a review of food environment inequalities drawn from the consideration of
socioeconomic factors and the physical barriers that community residents experience
based on the automobile-dependent life style in the United States. Next, brief examples
of methodological approaches will be discussed to provide comparisons among the
latest studies, with the intention of identifying a variable related to geographic or
physical access that is based on physical distance, the variability of neighborhood
boundaries among different populations, and the difficulty of creating units of analysis in
spatial mapping. Thereafter, food access policy issues will be introduced, because
those organizations that are attempting to understand their local food environments
would benefit tremendously from the ability to analyze particular food disparity areas
spatially. To conclude this chapter, a recap offers insight into social inequities in the
distribution of affordable food sources and its relevance to a car-dependent culture.
Additionally, in the final section of this chapter, an examination of quantitative methods
and policies would suggest some possible models to follow.

16
Definition of Terms
Food Environment
What makes the food environment a current issue? The current interest in
improving American‘s food environment has been sparked by the steady rise in the
consumption of high calorie food since the 1970s. Physically, this increased
consumption appears to be linked to the distance between communities and their
sources of healthy foods (such as full-service grocery stores), consequently this may
promote the consumption of unhealthy foods and increase the need for a better-quality
food environment. The CDC, on their website, defines a ―food environment‖ as follows:
The physical presence of food that affects a person‘s diet (Babey, 2008),
A person‘s proximity to food store locations (Morland et al., 2002a),
The distribution of food stores, food service, and any physical entity by which food may be obtained, or (Morland et al., 2002a)
A connected system that allows access to food (Morland et al., 2002a).
Food environments that offer a greater variety of healthy food options at affordable
prices may promote healthier food choices, and could be called a ―healthy, nutritious
food environment‖. A healthy, nutritious food environment accompanied by increased
rates of physical activity, could help reduce the incidence of leading illnesses in the
U.S., such as obesity, heart disease, cancer, and diabetes (CDC, 2010). Although the
interaction between food and city planning is limited, planners and local governments
have suggested certain strategies for the creation and maintenance of healthy food
environments that relate to zoning, land use planning, transportation infrastructure,
community gardens, and so on (Clifton, 2004). With regard to planning, it is important to
define the important terms (such as food security/insecurity, and food deserts) to

17
promote greater understanding of the connection between planning and the food
environment (Reisig &Hobbiss, 2000).
Food Security and Insecurity
Food security refers to food environment in which people have physical access to
foods that meet the national standard for safety, freshness, and nutrition. However,
challenges for planners arise when some households do not get enough foods – in
other words, when food is unequally distributed. Food security is a complex issue
related to sustainable development, health, economic growth, the environment, and
trade (World Health Organization, 2011). ―Food insecurity‖ has been defined by the
United States Department of Agriculture‘s Economic Research Service (USDA ERS) as
a situation in which particular households are ―unable to have or unable to acquire
enough food to meet the needs of all their members because they have insufficient
money or sources for food‖ (2009). In Florida, one study found that 14.2 percent of
households, or over 1,000,000 households, are ―food insecure‖ according to the
USDA‘s definition (Nord, 2010). The percentage of food insecure was lower than the
national average, but it nonetheless constituted a significant number of households in
Florida. Some reports indicate a relationship between socioeconomic status and food
insecurity. For example, approximately 46.2 million Americans are classified as ―poor‖
and the poverty rate has now increased to 15.1%, the highest level since the early
1990s (Census Bureau, 2000). Many of these people rely on federal food programs,
such as Food Stamps. Bloch et al. (2009) provide evidence that food stamp use in
Florida has increased by a staggering 70% between 2007 and 2009, which may help us
to draw a conclusion about the relationship between individuals‘ economic status and
food insecurity. Another study examined the association between food insecurity and

18
obesity. Jyoti et al.(2005) reported that ‗children from persistently food insecure
households had a 0.35 kg (0.77lbs) /m2 greater gain in body mass index (BMI) and a
0.65kg (1.43lbs) greater gain in weight compared with children from persistently food
secure households.‘ Living in a food insecure environment potentially presents many
health and wellness challenges, and may be induced by inhabiting a food desert.
Food Desert
The term food desert implies the presence of some form of food insecurity. Wrigley
et al. (2002) elaborate on the subject of food deserts, including particular factors like
food availability, variety, and price. Those areas that are commonly indicated as food
deserts are often regions that experience socioeconomic disparities. The USDA‘s ERS
(2009) has defined food deserts as those areas in the U.S with limited access to
affordable and nutritious food, particularly areas composed of predominantly lower
income neighborhoods and communities. Morton et al. (2005) identified several
characteristics of a food desert; namely, that a food desert has a larger proportions of
residents without a high school degree, higher poverty rates, lower median family
incomes, a low rate of vehicle ownership, a larger older population, and higher numbers
of small grocery stores and convenience stores per capita. Because food desert
neighborhoods are believed to exhibit these extreme tendencies, their inhabitants may
experience more profound effects than simply a lack of food access to nutritious,
healthy food. Indeed, food deserts also appear to be, areas of worrying social isolation
(Furey et al, 2001).
Geographic Measures of Food Accessibility
What types of variables do we need to measure food accessibility? Firstly,
―accessibility‖ refers to the physical distance between a point of origin and a destination.

19
Geographic access or physical access is generally based on the physical distance and
travel time to a food store (Algert et al.,2006). Many of the studies in this area have
calculated the distance from a centroid ZIP code to a food store, from which healthy
foods can be purchased (Sharkey et al., 2010; Zenk et al., 2005; and Powell et al.,
2007), while other studies measure the density of the food stores in a defined area
(Block, 2004 ). For an actual distance, some studies have used grid distance to food
stores, which would reflect the street network more accurately (Larsen & Gilliland, 2008;
Zenk et al., 2005), while others have used the road network in their calculations instead
of measuring straight distances, because this would enable a more precise prediction of
actual travel time. Table 2-1 briefly shows the examples of geographical accessibility
measurement in previous studies.
Socioeconomic Food Inequality in the U.S.
According to a report by the Economic Research Service in 2009, the existence of
―food deserts‖ in United States has recently caused increasing concern, because of
their role in promoting health inequality though the amplification of deprivation; as we
saw earlier, minorities and low-income individuals are more likely to reside in food
deserts. Identifying the socio-demographic factors that affect the food environment of a
particular region can often help us dentify the barriers that communities encounter, e.g.,
the inability to afford wholesome food. This broad category of factors can be broken into
three sub-factors: low-income households, racial/ethnical disparities, and an aging
population.
Low-Income Households
Low-income areas are defined as food deserts when the individuals residing in
these communities do not have access to healthy food. A crucial dimension of the

20
designation ―food deserts‖ is access to ‗healthy foods‘, but in this section, the economic
status of a community‘s residents is emphasized. Factors influencing economic access,
such as a household‘s income level, are considered when evaluating that household‘s
food security (McEntee & Agyeman, 2010). It has been found that consumers with an
annual income of less than $8,000 paid about 1% more for their food, relative to those
with higher incomes of between $8,000 – $30,000 (Broda and Weinstein, 2009).
However, while Macintyre (2007) has not found a consistent pattern in which food
resources are located to the disadvantage of households in poorer European
communities, North American studies suggest that low-income communities may not
have equal access to a variety of healthy food choices compared to wealthy
communities (Morland et al, 2002a). In Canada, 35% of households classified as low-
income have experienced food insecurity, i.e., either reduced access to food or low
consumption of healthy food (Che & Chen, 2001). In New York City, those areas with
the lowest median household incomes (East and Central Harlem, and North and Central
Brooklyn) have the lowest scores for food access. In contrast, the highest scores for
food access belong to the Upper East Side, a predominantly upper-income area
(Gordon et al., 2010). There is a potential spatial mismatch between low-income
neighborhoods and access to full service grocery stores (USDA, 2009), which reflects
poorer community health, because higher-than-average numbers of convenience
stores, fast food restaurants, and liquor stores are concentrated in low-income areas as
well (Dannenberg et al., 2003, pp. 1500-1805). Thus, a low income level and poverty
are relevant when assessing physical access to wholesome food and overall health.

21
Racial Segregation
What racial group, if any, associated with low incomes, and does this have
relationship to that group‘s food access? In addition to a neighborhoods‘ wealth,
residential racial segregation is a socio-economic characteristic of current U.S. society.
In terms of food access, minority groups are present in unaffordable locations and
accompanied by a low number of healthy food stores, a low percentage of vegetable/
fruit intake, and abundant fast food restaurants (Morland et al, 2002a; Morland et al.,
2002b ). In essence, minority groups have fewer opportunities to obtain healthy foods.
African Americans are considered the largest minority group (nearly 13% of the
country‘s population), while Hispanics constitute 15% of the total population. A recent
study, conducted by Galvez et al.(2008), investigated East Harlem in New York City and
found that, while African Americans and Hispanics are both considered minority groups,
African Americans are less likely to have supermarkets and convenience stores in their
occupied census block, while the Latinos‘ block is more likely to offer access to food
stores and full-service restaurants. This implies there are differences among minority
groups based on dietary quality and eating habits. Research has shown that the
existence of food deserts is relevant to African American agglomeration, while food
affordability may differ according to the characteristics of a neighborhood‘s physical
environment. Baker (2006) found that African Americans, regardless of income level,
have reduced access to restaurants that provide healthy food choices. (Baker‘s case
study took place in St. Louis, MO.) A study conducted in New Orleans, LA, reported that
predominantly Black neighborhoods had 2.4 fast-food restaurants per square mile
compared to 1.5 fast-food restaurants per square mile predominantly White
neighborhoods (Block, 2004).
22
Elderly Population
Walking, driving, and using public transportation, such as rail and bus services,
provides access to food stores, but easy access to wholesome foods may present a
challenge to the elderly population (Burns & Inglis, 2007). Older individuals may
experience jeopardized access to food, i.e., greater difficulty in getting to the grocery
store and also in getting around the store itself. In the Public Health Management
Corporation‘s Household Health Survey for Philadelphia (2010), the elderly reported
their need for a meal program, which indicates that they were encountering problems
with shopping for their groceries and preparing their meals. To address the difficulties
that accompany aging, the Hartford Food System in Connecticut runs programs linked
to the local full-service supermarkets. The program provides free delivery for the aged
population, and offer shopping services at a reasonable price for elderly individuals who
do not own a car, so that they can have access to a variety of fresh food (Hartford Food
System Report, 2009). Physical or either financial limitations are often the reasons why
the aged population gives up access to food, and alternatives to public transportation
are not readily available to the aged population in many communities. Yamashita and
Kunkel (2011) created a conceptual model of the link between age, food access, and
health outcomes (Figure 2-1). There are two factors that we must consider with regard
to how people make the decision to buy food; namely, geographic and economic
access. For better health outcomes among the elderly, the interaction of wise food
choices for a nutritious diet, and geographic and economic access to good food is
crucial. Whelan et al. (2002) demonstrate that food consumption patterns may change
as people age. When purchasing food, the aged population tends to weigh convenience
and ease of preparation more heavily than price. Over the long term, poorer food
23
choices may result in greater problems for the older population, because nutritional
intake is particularly crucial to their health.
Transportation and Food Access
Public Transportation Infrastructure
Another obstacle to food access is the lack of public transportation infrastructure.
The barriers to healthy foods do not simply relate to price or the socioeconomic status
of customers, but also relate to transportation. Since, for the majority of Americans,
healthy food is not usually available in places other than full-service grocery stores, if
such a store is not easily accessible, those seeking good food must travel outside of
their neighborhoods. Residents who do not own a personal vehicle and who live in a
food desert are not particularly mobile, and have limited access to full-service grocery
stores. Over the long term, lack of access to healthy food may promote illness as a
result of poor dietary intake. The USDA National Food Stamp Program Survey (1996)
reported that a little less than half of low-income U.S. households are able to use a car
that they own (Morton et al., 2005). This means that many low-income families must rely
on other family members, friends, neighbors, and public transportation for their food
shopping trips.
Opportunities to purchase healthy food may be enhanced by transit-oriented
development (TOD), which would involve increasing the number of transportation stops
to enable easier access to fresh, wholesome food (Belzer & Autler, 2002). While TOD
focuses on future growth of bus and metro transportation, zoning and land use could
also be modified to encourage food retailing (Belzer & Autler, 2002). There is no direct
research that investigates the relationships between TOD and food access, but in El
Segundo, CA, a number of farmers‘ markets are located in areas that are accessible

24
from two bus lines. TOD could dramatically reduce the travel distances for families to
stores offering good food, and provide greater choices and more frequent travel
opportunities. Litman (2010) has argued along similar lines; in that study, TOD impacts
people‘s health beyond physical activity rates, as communities benefit from better
mental health, improved access to healthy food, and greater food affordability.
Vehicle Ownership
Private vehicles have become the primary form of transportation in American cities
and towns. Most settlements have grown alongside rapidly increasing auto-
dependence, and the automobile remains integral to the culture and everyday
functioning of American society (Conveney and O‘Dwyer, 2008). Common areas, such
as shopping districts, whole cities, and even suburbs, are designed and developed with
car ownership and mobility in mind (Burns and Inglis, 2007). Major cities in the U.S.
discourage the development of a public transportation infrastructure that alternates
automobile reliance with other forms of transport, such as walking, biking, or public
transit. Vehicle availability is a deciding factor in whether or not residents of these
communities can travel for grocery-shopping purposes (Morland, et al., 2002b). Owning
a personal vehicle, perhaps obviously, is linked to residents‘ economic status. Low-
income households are 6 to 7 times less likely than other U.S. households to own cars
(Murakami and Young, 1997). Nevertheless, most low-income households attempt to
use cars for food shopping, even though more than half cannot rely on a car that they
own.
While cities offer alternative public transportation opportunities, rural residents
mostly do own cars. Those families that do not or cannot afford a dependable
automobile have even greater problems with food access than their counterparts in

25
urban areas. About half of rural counties in the U.S., including the most isolated areas,
have no public transit system at all (Stommes and Brown, 2002). Because of limited
public transportation opportunities, rural areas are more exposed to food insecurity than
even those cities that have food deserts. Nord (2002) found that in agricultural areas,
13.5% of rural inhabitants faced food insecurity, compared to the nationwide figure of
10.5%. However, Sharkey (2010) catalogs the different types of food stores to which
people have access in rural areas, and the related distances: 9.9 miles to a full-service
supermarket, 6.7 miles to fresh fruits, and 7.4 miles to fresh vegetables in one case
study in Texas. In addition, this research proves that although these neighborhoods
may have low vehicle ownership, they could have better spatial access to a good variety
of fresh fruits and vegetables and may have greater shopping opportunities than those
in the cities.
In summary, vehicle ownership could influence the level and composition of one‘s
food environment. First, vehicles permit improved access to large-scale retailers, which
often offer lower prices. This should boost food expenditure and the quality of a
constant basket of food. Residents can also purchase larger quantities of food per
shopping trip, reducing the time costs associated with acquiring food and increasing
their opportunities for both labor and leisure. Since food deserts are related to food
safety and poor dietary intake, vehicle ownership can promote reduced expansion of
food deserts.
Types of Food Stores
An ERS report (2009) defined ―food deserts‖ as locations in which resident
households were unable to have or unable to acquire enough food to meet the needs of
all their members, because they have insufficient sources of food. People who live in

26
food deserts often have no options, so they rely on smaller stores where the quality and
variety of fresh foods are more limited (Wrigley, 2002). Many previous studies have
measured the nearest distance to grocery stores selling either healthy, unhealthy, or
both types of foods. The definition of a food store is broad, and Sharkey (2010)
separates the types of food stores as shown below, in Figure 2-2. Full-service
supermarkets are considered ―healthy‖ food stores, as they generally offer a variety of
nutritious, wholesome foods in addition to processed fare. Compared to other food
stores, these supermarkets tend to offer a variety of high-quality products at reasonable
prices (Chung and Myers, 1999). The California Center for Public Health Advocacy
(CCPHA, 2007) includes supermarkets, supercenters, and produce vendors as healthy
food stores based on the assumption that these locations have a wide variety of higher-
quality healthy foods. In contrast, convenience stores are generally considered
unhealthy food stores, since they offer mostly prepared, high-calorie food and little fresh
food (Zenk, 2006). The ERS (2009) includes fast food restaurants and convenience
stores in its category of unhealthy food stores, since these establishments sell more
high-calorie foods and less fresh produce, and the fresh produce they do sell tends to
be offered at higher prices than in full-service supermarkets. Assessing the food
resources in a community is significant in determining whether that area is a food desert
or not. Morland (2006) shows that the abundant presence of supermarkets is related to
a lower obesity rate, while the presence of convenience stores is associated with a
higher rate of obesity.
Food Purchasing Behavior and its Associations with Health
There are many cultures in the U.S., and the country‘s population can be
categorized into several socioeconomic groups. Indeed, food consumers have

27
purchasing habits that are unique to their individual groups. Yoo et al. (2006) found that
major food-purchasing patterns were a weekly big trip with a few small trips (34.9%), bi-
weekly big trips with a few small trips (21.9%), no big shopping trips (15.4%), a weekly
big trip without small trips (13.9%), a monthly big trip (8.3%), and biweekly big trips
without small trips (6.4%), while 67% of the U.S. population went to restaurants for fruits
and vegetables. By socioeconomic status, African-American families shopped for food
the least frequently, while Asian-American families shopped for food the most
frequently. Educational level was negatively associated with the use of convenience
stores, and was positively associated with obtaining take-away food from restaurants
(Yoo et al., 2006). From the perspective of the built environment, the distance to the
supermarket impacts residents‘ decisions as to where and when to buy food.
Most healthy foods are produced in suburban areas, and are sold in full-service
supermarkets, so when an individual does not have access to healthy food choices, the
only option available is the consumption of unhealthy foods that are high in fat and
calories. Several studies have shown that individuals living in food deserts have a
significantly lower consumption of fruits and vegetables than other residents of the
same community, which suggests that food deserts result in compromised diets (Smith
and Morton, 2009). Residents of these neighborhoods are faced with the burden of
traveling outside of their neighborhoods to purchase healthy foods, or staying in their
neighborhood and consuming unhealthy foods. Often, people tend to shop at
convenience stores, where food is typically more expensive and less healthy, which is a
problem from a planning perspective, as well a public health concern (Larsen, 2009, p.
1159).

28
The USDA Food Desert Study (2009) observes that several studies link unhealthy
behaviors to increased BMI and increased obesity rates. In recent years, there has
been a noticeable increase in obesity rates among adults (CDC, 2007). No precise
pattern has been observed for obesity and socioeconomic status, but many Americans
who are classified as obese are racial minorities and low-income individuals. The CDC
(2004) has also found evidence linking this epidemic to the increased consumption of
food away from home; to the increased consumption of salty snacks, soft drinks, and
pizza; and to increased portion sizes. The lack of nutritious food intake contributes to
obesity, but the disease can be more readily linked to unequal access to healthy food
sources. Morland (2006) found that the highest rates of adult obesity (32%– 40%) were
observed in census tracts with no supermarkets, with access only to grocery stores or
grocery and convenience stores (32%–40%). Research on adolescents indicates that
greater access to convenience stores may contribute to more unhealthy food choices,
and to a greater risk of obesity (Powell, 2007). Other factors that contribute to obesity,
combined with physical disparities in access to food sources, are race, income level,
and cultural characteristics that are associated with preferred food-purchasing habits
and patterns. A study conducted in Los Angeles found that lower-income ZIP codes with
a predominantly Black population had fewer healthy food options than higher-income
ZIP codes with a smaller Black population (Lewis et al., 2005). Additionally, The Office
of Minority Health (2009) reported that Black Americans were 1.4 times more likely, and
Hispanics were 1.1 times more likely, to be obese compared to non-Hispanic whites.
These studies indicate that better supermarket access is related to a reduced risk of
developing obesity.

29
Summary
Many factors contribute to our ability to identify and define food deserts. One of
those factors is the socioeconomic disparities of those communities situated within a
broader food environment. Research has suggested that low-income individuals
(Chung& Meyers, 1999; Zenk et al., 2006; Morland et al., 2002a), minority groups
(Morland et al., 2002a; Zenk et al., 2005), and the aged population (Whelan et al., 2002;
Yamashita and Kunkel, 2011) have limited access to supermarkets, chain stores, and
healthful foods. A limited built environment, especially related to the public
transportation infrastructure, potentially also decreases a community‘s chances of
obtaining healthy foods, while a vehicle-oriented culture (characterized by a high private
vehicle ownership rate) reduces food-access opportunities for groups experiencing
socioeconomic disparity. Most previous studies in this area have divided food sources
into two groups: healthy food stores and unhealthy food stores, and have scrutinized
food purchase habits related to socioeconomic status, and their influence on health
issues. The proposed socioeconomic, built-environment and food-environment variables
will help researchers and practical planners to understand the various definitions of food
deserts from their own perspective. By performing a review of the literature, however,
this study aims to address two limitations of previous studies. First, most studies have
applied both healthy and unhealthy food stores such as convenience stores, suggesting
a partial understanding of the built environment. Secondly, recent studies have
measured residents‘ proximity to food outlets based on socioeconomic factors alone,
and have not utilized a transportation network base.
The research presented in this thesis aims to bridge two gaps in the previous food
desert research in the category of healthy food outlets, and to evaluating a community‘s

30
proximity to its closest food outlets using two transportation methods: walking and
driving in the sample area of Sarasota County, FL. The next chapter provides a detailed
description of the methodology that will be used in these case studies
.

31
Table 2-1. Examples of geographical accessibly measurement in previous studies Author Target food stores Origin Transportation
method Study area
Unit Definition of access
Algert et al. (2006)
Stores with variety of fresh produce
Stores with limited variety of fresh produce
Location of food pantry client residences
Walking Pomona, CA
Road network distance
0.5 mile (0.8 Km)
Block et al. (2004)
Fast food restaurant
Census Track New Orleans, LA
Shopping area buffer 1/0.5 mile buffer (shopping area)
Burns and Inglis (2007)
Major supermarket
Major fast food outlets
Census block group boundary
Bus Walking
City of Casey, Australia
Travel cost time based on road network
Assessed in Minute
Larsen & Gilliland, (2008)
Local business supermarkets
Canadian Census tract
Bus Walking
City of London, Canada
Manhattan block distance
Powell et al. (2007)
Food outlet (supermarket, grocery, convenience store)
Food store (chain, non-chain)
28,052 ZIP Codes 2000 Census
Access by ethnicity, race, socioeconomic status and income
Sharkey et al. (2010)
Food stores with fruits and vegetables
2000 Census Block group
6-county rural regions in Texas
Distance to the nearest food store from the population-weighted center of each CBG
Coverage (number of shopping opportunities)
Zenk et al. (2005)
The nearest supermarket (national/regional chain)
2000 Census tract centroid
Not specified Detroit, MI
Manhattan block distance

32
Figure 2-1. A conceptual model of the link between age, food access, and health
outcomes.Source: Yamashita and Kunkel (2011)
Supercenters or superstores
Very large stores that primarily engage in retailing a general line of groceries in combination with general lines of new merchandise, such as apparel, furniture, and appliances (e.g., Super Wal-Mart, Super Kmart).
Supermarkets Primarily engage in retailing a general line of food, supermarkets are larger in size (>20,000 sq ft), number of employees, and sales volume.4 Chain store identification and number of parking spaces (>100) were used to distinguish supermarkets from grocery stores.5
Grocery stores Primarily engage in retailing a general line of food, grocery stores are smaller in size, not identified as a chain store and have fewer than 100 parking spaces.
Convenience stores or food marts
Primarily engage in retailing a limited line of goods that generally includes milk, bread, soda, and snacks. The convenience store category also included convenience stores with gasoline and gasoline stations with convenience stores.
Dollar stores Limited-price general merchandise ―value‖ stores, such as Dollar General or Family Dollar.
Pharmacies and drugstores
Pharmacies and drug stores that were part of national chains (e.g., CVS, Walgreens).
Figure 2-2. Types and definition of food stores. Source: Sharkey et al. (2010)
4 Moore LV, Diez Roux AV: Association of Neighborhood Characteristics With the Location and Type of
Food Stores. Am J Public Health 2006, 96:325-31.
5 Hale T: Dollar Store, No Frills: The New Retail Landscape. Consumer Insight 2004, Spring 2004:11-3,
42.

33
CHAPTER 3 METHODOLOGY FOR MAPPING AND ANALYZING POTENTIAL FOOD DESERTS
The goal of this chapter is to identify variables that can use to measure food
access and can be adopted to define a food desert for the case study area. The
methodologies are both quantitative and qualitative, and are intended to present a
spatial overview of the area where lack of food resources. This chapter is divided into
three sections. The first two sections offer an overview of Sarasota County, explain why
an attempt to assess this food environment is needed, and then demonstrate what
types of methodology other studies have applied to measure food access/food deserts
in Sarasota County. The last section presents a food access index that has been
created quantitatively, and which is an indicator of where to find food desert candidates.
Establishing Case Study Area
Sarasota County has a remarkable natural agricultural heritage, and its residents
anticipate sustainable agricultural growth. Sustainable agriculture emphasizes nutritious
and affordable food, while contributing to economic growth and healthy diets. However,
somewhat in opposition to the promotion of healthy food choices, the number of grocery
stores in which customers can buy fresh food appears to be on the decline in Sarasota
County, which now has a low density of grocery stores (1.81/10,000 population) in
comparison to state of Florida as a whole (2.04/10,000 population). These numbers are
expected to decrease even further in the coming years, as 83 number of grocery stores
closed their business from October 2010 to August 2011 while the total population
increases from 325,957 to 388,262 ( Sarasota County Economic Report, 2011).
Therefore, determining accessibility to healthy food stores is reinforced as an indicator
of the general affordability of food, which may in turn, influence a community‘s current

34
health status. It is important to understand the built and physical environment as they
relate to this food-access crisis.
Food Access/ Desert Study of Sarasota County
Previous studies in this area have each proposed their own definition of food
deserts and low access to food outlets, and have deemed Sarasota County one of the
highest-ranked ―healthy counties‖ for access to wholesome, nutritious foods in Florida.
Government studies and the literature on public health have promoted supermarkets as
the critical retail outlets for healthy food access, and have emphasized people‘s physical
access to supermarkets as a key factor in a community‘s ability to access affordable,
quality food. National research from the U.S. Department of Agriculture (USDA) and
The Reinvestment Fund (TRF) recognize that poor access to food outlets is strongly
correlated with socioeconomic problems, while the County Health Ranking 2011 and
Sarasota County‘s research to ―measure the distance to a gallon of milk‖ examined the
proximity to grocery stores as a vital element in determining a group‘s access to food.
USDA Food Desert Locator: Food Desert in Sarasota County
The objective of the food desert locator is to obtain a spatial dispersion overview of
low-income neighborhoods with high concentrations of people who live far away from
grocery stores. The first attempt to locate food deserts was initiated by the Healthy Food
Financing Initiative (HFFI), to assess the availability of nutritious food support (USDA,
2009). From the geographic perspective, 1km square grids were adopted as the base
spatial unit of analysis, and grids outside of a specified distance from a food source
were designated as ―low food access‖ areas. Grids with high concentrations of low-
income individuals that met the aforementioned criteria received particular attention as
food deserts. To improve its methodological approach, HFFI created a partnership with

35
the USDA, and two socioeconomic indicators were applied to explain food deserts, low-
income census tract, and residents with reduced access to supermarkets or large
grocery stores, as below:
Low-income community- A census tract must have either: 1) a poverty rate of 20 percent or higher, or 2) a median family income at or below 80 percent of the area's median family income
Low-access community- In urban area, at least 33 percent (or 500 people) of residents population(in census track) inhabit more than a mile from supermarket or large grocery store
TRF Policy Map: Food Access in Sarasota County
As an initial step towards a thorough assessment of the food environment, TRF
defined a Low Access Area (LAA) using a geographical and socio-economic approach
to identify those areas where residents faced a longer distance to the grocery store than
the average distance of a high-income area. Additional socioeconomic variables (e.g.,
concentration of neighborhood income, education level, and ridership of transit to work)
were prepared to observe whether there could be a relationship between LAA and the
aforementioned socioeconomic variables. Household population, residential land area
population, and vehicle ownership data were derived from the U.S. Census (2000), and
supermarket locations were obtained from Trade Dimensions (2009). This research
settled a hypothesis that block groups with a higher-income level (median household
income greater than 120% of their respective urban area) enjoyed reasonable distance
to food sources.
County Health Ranking 2011: Access to Healthy Food in Sarasota County
The final rankings are a combination of each health outcome and health factor
ranking, which are weighted under certain weights (Appendix A). The accessibility of
healthy foods, which is 2.5% weighted under the physical environment element, is

36
measured because residents consider the distance to grocery stores over which grocery
stores carry healthy foods. The lack of local access to healthy foods makes it difficult for
families in low-income urban communities to maintain a well-balanced, nutritious diet.
U.S. ZIP codes and healthy food outlets6 are used to calculate the percentage of
residential ZIP codes in a county without access to healthy food outlets.
Place to Buy a Gallon of Milk Analysis, Sarasota County
The goal of this study was to estimate the percentage of Sarasota County‘s 2010
population that had access to a gallon of milk within a quarter-mile drive. The analysis
was performed using the census block to estimate the 2010 population, and quarter-
mile drive distances to grocery stories were calculated based on the street networks,
with a quarter mile deemed a ―walkable‖ shopping distance. The criteria for grocery
stories were consistent with the North American Industry Classification System
(NAICS), and 228 stores were defined as food sources based on the criteria below:
NAICS 4451 Grocery Stores (Includes Grocery Stores and Convenience Stores)
NAICS 44611 Pharmacies and Drug Stores: Select WALGREENS and CVS PHARMACY
NAICS 446191 Food (Health) Supplement Stores: Select RICHARD'S WHOLE FOODS, GRANARY, and GRANARY NATURAL FOODS
NAICS 452 General Merchandise Stores: Select DOLLAR GENERAL, DOLLAR TREE, FAMILY DOLLAR STORE, KMART, SUPER TARGET, TARGET, WALMART, and WALMART SUPERCENTER
Summary of Previous Studies
When evaluating food deserts in Sarasota County, methodologies in each earlier
studies have limitations of factors they used; USDA, TRF policy map, and County
6 Healthy food outlets are identified by their North American Industry Classification System (NAICS) code.
Those food outlets considered ―healthy‖ include grocery stores (NAICS 445110) and produce stands or farmers‘ markets (NAICS 445230).

37
Health Ranking 2011 methodologies have linked low income households with
residential density; whereas Sarasota County‘s analysis only provides physical distance
where has an access to food. The first three studies shows that food deserts are
inherited from areas with low income level households but did not prove any relations
with physical distance, while the last study regards none of socioeconomic factors.
This thesis aims to address the gap in previous ―food desert‖ researches using
both socioeconomic and physical distance factors. It would start by narrowing down the
definition of ―‗food resources‖ to ―healthy food outlets‖ and evaluating physical
distances with socioeconomic disparities that mentioned in literature review. The types
of transportation modes residents use to get food in Sarasota County is an important
factor as well. The following section provides a detailed description of methodology to
create food access index.
Creating Food Access Index: Indicators for Analysis
The primary goal of this section is to create an index that can measure food
access. This sections is separated into three parts: 1) define healthy food outlets for the
purposes of this research; 2) create a food access index using proximity and coverage
to healthy food outlets; and 3) apply the food access index to the transportation network
then running t-test which would support whether there is a relationship between food
access and vehicle ownership in each walking and driving network. Using data from the
2000 U.S. Census Summary File 3, this study categorized census block groups in terms
of vehicle ownership composition. The proportion of the population with no vehicle
ownership has been calculated from each block‘s population. Additionally, when food
access index based on census block data has been developed, it is possible to predict
food access index using the distance from residential zones to healthy food outlets from

38
parcel 2009 data to better understand the relationship between land use and access to
healthy foods.
These analyses will help to assess potential food-desert candidates, which are
deprived of access to healthy food outlets, in Sarasota County and determine which
areas of Sarasota County have high, medium, and low access to food outlets.
Indicator 1: Healthy Food Outlet
In this paper, ‗healthy food outlets‘ are defined as those places where healthy,
fresh, and/or organic food is offered, that can enhance consumers‘ health status. While
convenience stores, food marts, gas-station food stores, and drug stores contribute to
the local food environment (Morland et al. 2002a). They are excluded from this study,
because convenience stores are often viewed as providing an abundance of unhealthy
food (Lucan et al., 2010). Farmers‘ markets and mobile stands are excluded as well,
since those food sources are operated on a seasonal basis and during limited hours
(Schafft, 2009).
In Sarasota County, 94 healthy food outlets met the criteria and were retrieved
from the 2007 North America Industry Classification System (NAICS) codes. Table 3-1
denotes the NAICS codes used to define a food desert in this study.
Indicator 2-1: Proximity and Coverage to Healthy Food Outlet
After defined healthy food outlets, two criteria are assessed to measure distance
to ―healthy food outlets‖, which is basically a food access: 1) Proximity (distance) to
healthy food outlets from Census block centroid points, constituting the balance point of
the polygon (Census Block, 2010); and 2) Coverage (number) of healthy food outlets
within a census block boundary and store size (square footage). The size of healthy
food outlets are assessed when determining food accessibility, because it can be

39
assumed that larger grocery stores provide various food choices. The calculation is
based on a Manhattan block distance to the nearest healthy food outlet in each census
block boundaries, as follows:
| | + | | * Size / n
Where is the distance between origin i and destination j, x and y are the
latitude and longitude coordinate points, and n is the number of healthy food outlets in
each of the 204 census blocks in Sarasota County. The Manhattan distance measure
assumes that residents travel to the food outlet via an angular route rather than in a
straight line (Gimpel and Schuknecht, 2003).
Indicator 2-2: Re-assessing Food Access Index with Proximity to Healthy Food Outlets
The food access index depends on the number, size, and distance from centroid
census block point to healthy food outlet and it reveals proximity to, and variety of, food
choices, but includes some of the limitations. For example, assume there are two food
outlets, A and B. A is five miles away from the census block centroid point, which is
included in the same block boundary, and B is two miles away, but it is included in the
block next to the centroid point block that includes A. In this case, the food access index
applied earlier would ignore B, while it is closer than A. To address this limitation, an
additional food access index has been created that calculates the distance to the closet
food outlet using spatial join tool in ArcMap 10 software (ESRI, Inc., Redlands, CA).
To determine those areas that suffer inequality of access to healthy food outlets,
each low access block in is selected in two types of index; one with proximity and
coverage (indicator 2-1); and the other only with proximity to the closest distance to

40
healthy food outlets (indicator 2-2), then overlaid into one demographic map to show
more accurate food deserts
Indicator 3: Network according to Transportation (walking and driving) Modes
American cities are designed in an auto-dependent manner, and the automobile
remains integral to the culture and everyday functioning of U.S. society (Clifton, 2004;
Conveney and O‘Dwyer, 2008). In other words, in terms of the food environment and
people‘s independent access to food stores, those who have their own vehicle drive to
the grocery store, while those who have the physical capacity to walk to nearby stores
may have independent food access as well. The importance of transportation for food
access among people with limited mobility is highlighted by the findings (Burns and
Inglis, 2007). This section aims to provide answers relating to the current aspects of life,
under the objective: Find food outlets within a half-mile walking distance and 10-miles
driving distance using street path to identify how food access is distributed.
The accessibility of healthy food outlets has been defined from two transportation
modes: that of the pedestrian, and that of the driver. The pedestrian‘s perspective is
focused on walking alone, and, according to the ERS report of 2009, the average
pedestrian‘s walking speed has been assessed as 2 miles/hr; thus high access would
equal a half-mile walking distance (or 15-minute walk, approximately). For driving
speed, 40 miles/hr has been calculated as the average speed from origin to destination;
thus a high access distance from a driver‘s perspective would be 10 miles (40 mph * ¼
hr drive). Table 3-2 illustrates each transportation street network source used to assess
these mobility measures.
Geographic or physical network is generally based on physical distance and travel
method to food stores (Algert et al., 2006). In order to determine whether a personal

41
vehicle or walking are related to the areas with low access to food outlets, the food
access index and the percentage of vehicle ownership must be examined then need to
investigate the relationships between food access index and vehicle ownership under
each transportation modes. The population number of ‗no vehicle ownership‘ from 2000
U.S. census Summary File 3 is calculated from total population and this percentage has
been grouped into two categories; census blocks with high and low percentage of
vehicle ownership under equal distribution. To determine whether there is a relationship
between vehicle ownership and food access index, T-test will be applied for both
walking and driving network to healthy foods.
Distance from Residential Zone to Healthy Food Outlets
Another spatial overview can be represented by the distance between residential
zones and healthy food outlets because residential zones indicate areas where actual
housing with actual residents, who are ultimately customers of healthy food outlets,
predominates. Using 2009 parcel data, categories under characteristics of residential
lands was selected and Table 3-3 shows the number of parcels for each housing type.
This is used to replicates the methods employed by indicator 2-2 which also sought to
determine the shortest distance between healthy food outlets and residential lands.
Application of Methodology: Using GIS to Measure Food Access
The Geographic Information System (GIS) is ―a computer based system for
integrating and analyzing geographic data‖ (Cromley and McLafferty, 2002), which can
be used to view, quantify, and analyze information within a geographic context, such as
spatial patterns and additional statistical information (Vine, Degnan, and Hanchette,
1997). This research used ArcMap 10 software (ESRI, Inc., Redlands, CA) to calculate
the Manhattan block distance from neighborhood centroid points (Census Block, 2000)

42
to healthy food outlets (NAICS 2007). This study conducted a block-by-block
assessment of proximity to healthy food outlets for the entire county of Sarasota. In this
sense, the GIS was also utilized to analyze the relationships between transportation
network variables and the food access index in the following chapter.
To determine the transportation network around healthy food outlets, the network
analysis extension tool in ArcMap 10 has been employed to create half-mile and ten-
mile network service areas around healthy food outlets. Each network is derived from
sidewalk and major road maps in Sarasota County respectively. This helps to determine
the proximity, or minimum distance, either for walking or driving, to the nearest healthy
food outlet(s). Figure 3-1 illustrates how these pedestrian (walking) and driver networks
are created around the local healthy food outlets.

43
Table 3-1. 2007 NAICS codes selected for healthy food outlets and its example of food services
NAICS Code Index
NAICS Code Definition Examples SIC Code
Index
NAICS 445110
Supermarkets and other groceries (except convenience store)
Whole Foods Market, Publix, Winn-Dixie, etc
SIC 5441105
NAICS 445210
Meat markets Herman meats, Butcher‘s block, etc
SIC 5144
NAICS 445220
Fish and seafood markets National fish& seafood Inc., etc
SIC 5146
NAICS 445230
Fruit and Vegetable Markets Osprey produce, Pioneer farmers market, etc
SIC 5148
Sources: Provided from Sarasota County GIS Department Table 3-2. Data inventory used to measure food outlet street network
Customer type
Method Service area Network sources
Pedestrian Walking 0.5 mile(15min walk) Sidewalk
Driver Personal vehicle
10 mile (15 drive) Major roads
Table 3-3. Types and number of parcel data defined in residential land uses
Residential lands from parcel data Number of parcel
Condominium 1871 Hoes for aged 47 Mobile homes 11643 Multi-family 203 Multi-family less than 10 units 4122 Retirement homes 11 Single family 128546

44
Figure 3-1. Walking and driving distances from healthy food outlets (transportation network)

45
CHAPTER 4 FINDINGS AND RESULTS
In order to evaluate any area that has no affordable access to food, the population,
the proximity to healthy food outlets, and the walkable/drivable distance network must
be examined. Based on the analysis conducted in Microsoft Excel using the GIS, taking
a statistical approach, this chapter illustrates three levels of demographical distribution
of food access (high, medium, and low) and evaluate the relationship between vehicle
ownership (which is a neighborhood inequality) and access to healthy foods.
Result from Previous Studies
USDA Food Desert Locator: Food Desert in Sarasota County
Seven census tracks in Sarasota County qualified the food desert criteria where
low income tract has less than 33 percentage of accessibility to grocery stores out of
residents‘ population (Figure 4-1). Food deserts are dispersed over the County and out
of seven tracts five are located along the coast. The total number of people living in the
identified tract groups is 28,920 and the total number of population outside of the one-
mile boundary is 17,598. High percentage of populations is above median income level;
however there are 5,738 of residents that are low income who have little food access
(20.0%). Two tract groups located North of City of Sarasota (#1,2) and one in City of
North Port (#6) have low-income with low access levels over average percentage. Two
of the food desert tract groups have a somewhat high percentage of households with no
vehicles (over 5%); each tracts located north of the City of Sarasota (#2) and City of
Inglewood (#3) have a percentage around 10% of no vehicle that lack of opportunity to
grocery stores. Table 4-1 reveals the numeric analysis of these findings of Sarasota
County.

46
TRF Policy Map: Food Access in Sarasota County
There are three food access indicators in this study; LAA overlays with density of
income; and density of workers who commute to work via public transit. LAAs (blue-
outlined polygon) are observed in North City of Sarasota, on North Siesta Key Island
and near the city of Inglewood (Figure 4-2.A). Figure 4-2.B illustrates that the location of
LAAs varies for high- (purple), medium- (blue), and low- (orange) income groups. The
darkest orange polygon in north Sarasota City shows that the residents are mostly low-
income, and inhabit areas commonly associated with poverty, while the residents of
LAAs adjacent to the Gulf of Mexico are medium- and high- income individuals. Lastly,
the result shown in Figure 4-2.C illustrate that residents in LAA block groups barely use
public transit when they commute to work (0.04 to 1.45% over the track population).
Compared to the USDA Food Desert Locator, the TRF research concludes that
there are fewer areas that have low accessibility to grocery stores. While no significant
correlation was found demographically among LAAs, income level, and public transit
usage, it appears nonetheless that there could be a relationship between low food
access areas and socioeconomic indicators.
County Health Ranking 2011: Access to Healthy Food in Sarasota County
The County Health Ranking 2011 placed Sarasota County among the highest -
ranked ―healthy communities‖ across 67 counties in Florida, with a; health outcome rank
placed in second ranking; and a health factor in forth ranking. Among Sarasota County
residents, 83% have access to healthy food outlets (Table 4-3), whereas the state as a
whole has 82% access to healthy foods.
Although this study proves that Sarasota County is one of healthiest counties in
Florida, it is uncertain to tell that the county really has high healthy food proximity, since

47
this study used ZIP codes alone to define neighborhood characteristics, and does not
specify the scope under track or either block group level. Because of these limitations, it
is difficult to compare where low access to food is concentrated in the county, or which
areas in the county possess the healthiest status from a broader perspective.
Place to Buy a Gallon of Milk Analysis, Sarasota County
The ESRI Business Analyst tool estimated that there were +/-390,472 people in
2010 in Sarasota County, while the number of residents in this quarter-mile grocery
boundary was estimated as +/-9,999 (+/- 2.6% of total population). With the quarter-mile
grocery stores identified, the spatial distribution of food access was represented, and
three substantial cities (Sarasota, Venice, and North Port) were identified as those with
the lowest potential to be food deserts in Sarasota County (Figure 4-3).
This analysis found that 2.6% of population has ―walkable‖ access to milk, but that
because of the broad food-source definition (including food supplement stores, gas
stations, and convenience stores with limited availability of fresh foods), the
investigation cannot draw conclusions about fundamental food accessibility, i.e., the
distance to healthy foods. Some of the ―food desert‖ literature includes in its analysis
food sites such as farmers‘ markets, community gardens, or farm stands, due to the fact
that such food sources sell seasonal, fresh foods.
Food Access Index
The food access index has been created using the 94 healthy food outlets
identified, and 204 census block groups in Sarasota County. Results show that there
are 143 block groups identified as having ―no food outlets;‖ in other words, if there is no
single healthy food outlet within a certain block boundary, that block is defined as
having ―no food outlet.‖ Apart from the ―no food outlet‖ blocks, others have been divided
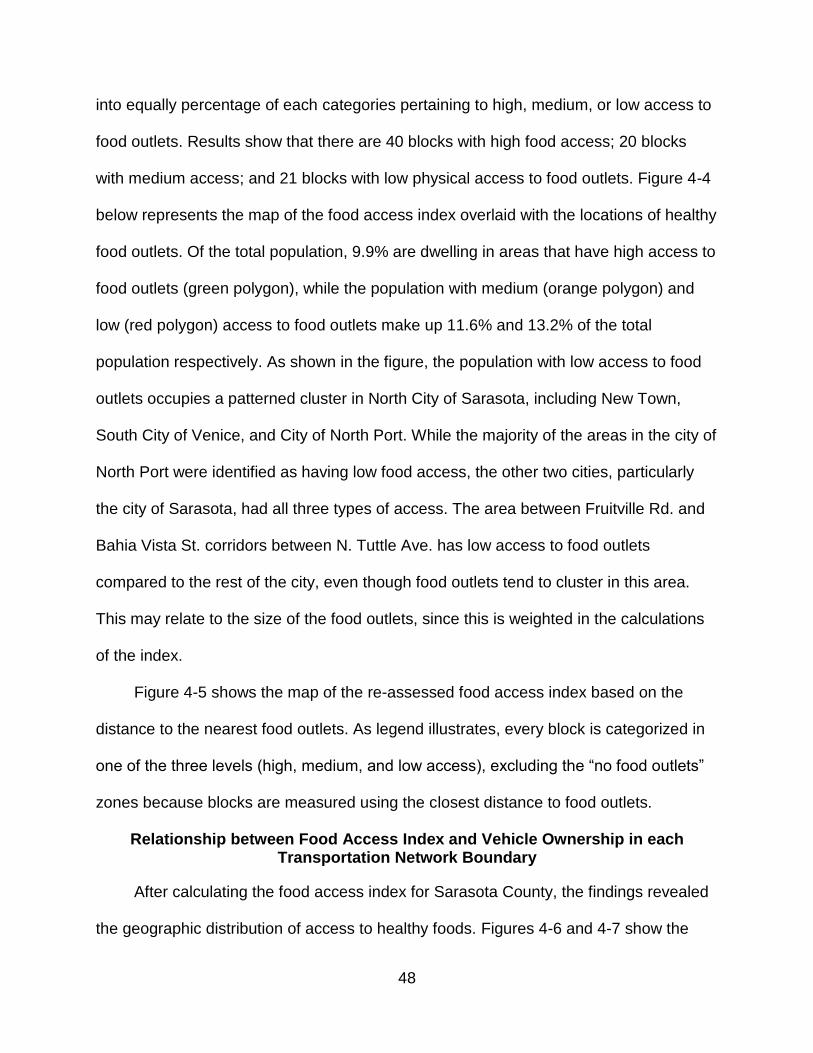
48
into equally percentage of each categories pertaining to high, medium, or low access to
food outlets. Results show that there are 40 blocks with high food access; 20 blocks
with medium access; and 21 blocks with low physical access to food outlets. Figure 4-4
below represents the map of the food access index overlaid with the locations of healthy
food outlets. Of the total population, 9.9% are dwelling in areas that have high access to
food outlets (green polygon), while the population with medium (orange polygon) and
low (red polygon) access to food outlets make up 11.6% and 13.2% of the total
population respectively. As shown in the figure, the population with low access to food
outlets occupies a patterned cluster in North City of Sarasota, including New Town,
South City of Venice, and City of North Port. While the majority of the areas in the city of
North Port were identified as having low food access, the other two cities, particularly
the city of Sarasota, had all three types of access. The area between Fruitville Rd. and
Bahia Vista St. corridors between N. Tuttle Ave. has low access to food outlets
compared to the rest of the city, even though food outlets tend to cluster in this area.
This may relate to the size of the food outlets, since this is weighted in the calculations
of the index.
Figure 4-5 shows the map of the re-assessed food access index based on the
distance to the nearest food outlets. As legend illustrates, every block is categorized in
one of the three levels (high, medium, and low access), excluding the ―no food outlets‖
zones because blocks are measured using the closest distance to food outlets.
Relationship between Food Access Index and Vehicle Ownership in each Transportation Network Boundary
After calculating the food access index for Sarasota County, the findings revealed
the geographic distribution of access to healthy foods. Figures 4-6 and 4-7 show the

49
food access index cropped within two types of transportation network (half-mile and 10-
miles). Compared to the food access index of the walking distance network, the driving
network covers a larger area, because using one‘s personal vehicle limits one‘s access
to food to a lesser extent than walking does. Based on the figure, pedestrians who
reside in the center and the eastern part of the city of Sarasota, west of the city of
Venice, and in the center of the city of North Port, have poor access to healthy foods.
For residents who drive to obtain healthy food parcels along I-75, the city of North Port
provides fewer chances to get healthy foods. However, since the majority of the areas
are defined as ―no food outlets‖ zones, customers‘ preferences may influence the
accessibility of healthy foods. Demographic findings improvise healthy food accessibility
in each network, but those do not prove whether vehicle access, or a lack thereof, is
related to one‘s food access.
Statistical Approach to find Relationship between Vehicle Ownership and
Food Access Index: 8,975 (2.8%) of total population in Sarasota County does not own
vehicle, whereas 69,282 (21.3%) and 56,989 (17.5%) own single and two vehicles
respectively. Table 4-4 shows the results of the t-test to determine whether a high
percentage of vehicle ownership would be relevant to food access. Two groups of
vehicle ownership were divided by average of no vehicle ownership (3.38%) that
interpreted areas with high (NOVEHPER (Less than 3.38%)) and where has less
(NOVEHPER (More than 3.38%)) vehicle ownership. Since the mean for the less-
vehicle-ownership group is higher than the other, the null hypothesis means that census
area blocks with less vehicle ownership have low food access in the walking network.
The results of the t-test suggest that there is no significant difference between the two

50
groups, because the significance level (0.09) is more than 0.05 with a 95% confidence
interval for the difference. Therefore, this proves that there is no relationship between
vehicle ownership and food access in the walking network.
Similar to Table 4-4, Table 4-5 shows the results of the t-test to assess the
relationship between food access and vehicle ownership in the driving network. Null
hypothesis suggests that census block areas with lower vehicle ownership have low
food access in the driving network. The results suggest that there is a significant
difference between the two groups, because the significance level (0.03) is more than
0.05 (95% confidence interval of the difference). Therefore, this proves that the
population with no vehicle ownership has lower food access in the driving network.
Food Deserts in Sarasota County
Figure 4-8 provides a geographical illustration of the finding where has low food
access from each index. A total of 145,322.363 acres have been identified as food
desert areas, and the total number of people living in identified block groups is 111,184,
which is about 34.1% of the total population. These areas are obviously clustered east
and south of the county, including the city of North Port and Venice. While there is a
clear concentration of healthy food outlets around the city of Sarasota, fewer food
deserts are designated because of the distance to, and coverage of, these food stores.
While this chapter clarified where food deserts exists in Sarasota County, a majority of
land in the east of the county include environmental protected lands (EPL) which do not
incorporate with people‘s access. Across the state of Florida, about 27% of the land is
protected environmental lands and Sarasota County has one of the most successful
natural land protection programs. As shown in Figure 4-9, EPLs and public lands are
located east of the county and west of the city of North Port, and it is forbidden to

51
develop these lands or reside on them. Figure 4-10 is a final food-desert candidate
map, excluding EPLs and public lands that have proximity to healthy food outlets.
Food Deserts for Pedestrian and Drivers
A visual examination of the map data, and a statistical analysis, revealed
disadvantaged areas where the people‘s access to healthy foods was poor. This study
bases the classification of food-desert candidates on block groups that are placed in the
transportation network category. Depending on the type of transportation that users
employ to reach their destination, the definition of food desert changes. In recent years,
―food desert‖ has been used to describe those areas that do not permit easy access,
within walking distance, to healthy foods in cities, or easy access, within reasonable
driving distance, to healthy foods in rural areas. This study‘s own definition of a ―food
desert‖ applies both to the walking (half-mile distance) and driving (10-mile distance)
criteria within the low food access index (Ploeg et al., 2009). Two types of food deserts
are derived from the general food desert map (Figure 4-8), and each half-mile/10-mile
transportation network was excluded respectively, because each polygon illustrates a
fairly accurate measurement using a street grid, to take into account how people
actually travel by walking and driving. Additionally, protected environmental lands are
excluded as well, because the area does not include a grid street connection to food
outlets. As shown in Figure 4-11, the cities of Venice, North Port, and Inglewood, and
north-central-south of the county fall within a range of food deserts when residents walk
to do their grocery shopping. Figure 4-12 shows the distribution of food-desert
candidates for drivers. Similar to the walking network food-desert candidate map, the
overall distribution is concentrated in the north-central-south areas rather than other
areas of the county. However, there are fewer food deserts in the city of North Port and

52
Venice, suggesting greater access to food outlets in the drivable network. It visually
proves the statistical results that there are relationships between vehicle ownership and
the food access index (see previous chapter) and represents the county‘s car-
dependent lifestyle, because there are more opportunities to access food outlets when
customers drive to those food outlets.
Food Deserts with Parcel Data
There are 216,910 parcels in the county and 110,277 of them parcels are within a
food desert boundary (Figure 4-10). The shortest distance from residential zones and
healthy food outlets measures 1.3m (0.0008mile) and the longest is 19683.41m (12
miles). Compared to the distance from census block centroid point to healthy food
outlets (2,713.6m to 141784.2m which is same as 1.69 to 88 miles), it becomes clrear
that using residential zone to healthy food outlets can more accurately represent
distance than using this centroid point of census block polygon approach though the
number of samples (parcel vs. census block) are different (Figure 4-13). Figure 4-14
shows the values of the aggregated level of food access index in each city in Sarasota
County. The comparison in Figure 4-5 shows that by determining food access with
residential parcel assessments the city of Sarasota has affordable access to wholesome
foods. In the city of Venice, it turns out that east of the city has medium and low access
to wholesome foods while west of the city has high access as shown earlier. The city of
North Port shows major differences in that residents in the east have high access to
wholesome foods whereas low access has been assessed in an earlier map. Table 4-6
shows the list of land uses in food deserts by numeric order of acres. It is evident that
the majority of land is either vacant or used as grazing lands but about 13.7% is
counted as single family land use.

53
Food Deserts Assessment with Socioeconomic Disparities
Sixty-five Census blocks are identified as food deserts out of 204 blocks according
to the criteria described in finding chapter. The overall distribution of healthy food outlets
is fairly random, but the City of North Port showed fewer healthy food outlets than other
municipalities. Each household population that is below poverty level, has no vehicle
ownership, and aged 65 and over is considered as socioeconomic disparities in
Sarasota County based on the literature reviews. Following maps (Figure 4-15 through
4-17) shows the spatial pattern of food deserts in each transportation modes and
overview of socioeconomic disparities distributions.
Figure 4-15 shows the distribution of below poverty population and overlay maps
of food deserts. Over the 325,957 residents, approximately 7.7% (24,817) fall below
poverty line in Sarasota County. Among this population, 6,156 or about 24% from total
below poverty population, are living in food deserts and isolated from food affordability.
A High concentration (6.24 - 9.6%) of below poverty level population was moderately
resides in two city centers (Sarasota and Venice) and adjacent areas, whereas fewer
below poverty population were observed in areas around Town of Longboat key and
City of North Port. In City of Sarasota, for customers who drive to healthy food outlets,
there was fewer concentration of below poverty population contrast to pedestrians. In
City of Venice and North Port, 3.2 to 6.5% of the population poverty level lives in areas
with food deserts. Compare to the City of Sarasota, these two cities represent that there
is not much relationship between poverty level and food desert observation.
Figure 4-16 shows the distribution of no vehicle ownership and food deserts for
each pedestrian (brown polygon) and drivers (purple polygon). As noted earlier chapter,
there is a relationship that Census blocks with less vehicle ownership have lower

54
access to healthy foods when customers drive to go grocery shopping. Notably, a high
density of no vehicle ownership was observed in food desert both for pedestrian and
drivers in City of Sarasota and Venice. However, similar to the below poverty level, City
of North Port‘s food deserts shows less density level of no vehicle ownership than other
areas.
Last, as shown in Figure 4-17, a high density of older population is concentrated in
adjacent areas of each municipality‘s core. Over the 102, 477 individuals over the age
of 65, about 37.3% (38,177) are living in identified food deserts and visually they are
concentrated in Town of Longboat and coast of City of Venice. In City of Sarasota, three
high density centroid tract (about 61 to 90%) of aged population blocks are included in
food deserts, whereas aged population are dispersed over the City. In the City of
Venice, it was easily identified that older populations are highly agglomerated in food
deserts and its adjacent areas. However, compared to other cities, there is less
concentration of aged population in food deserts in the City of North Port.
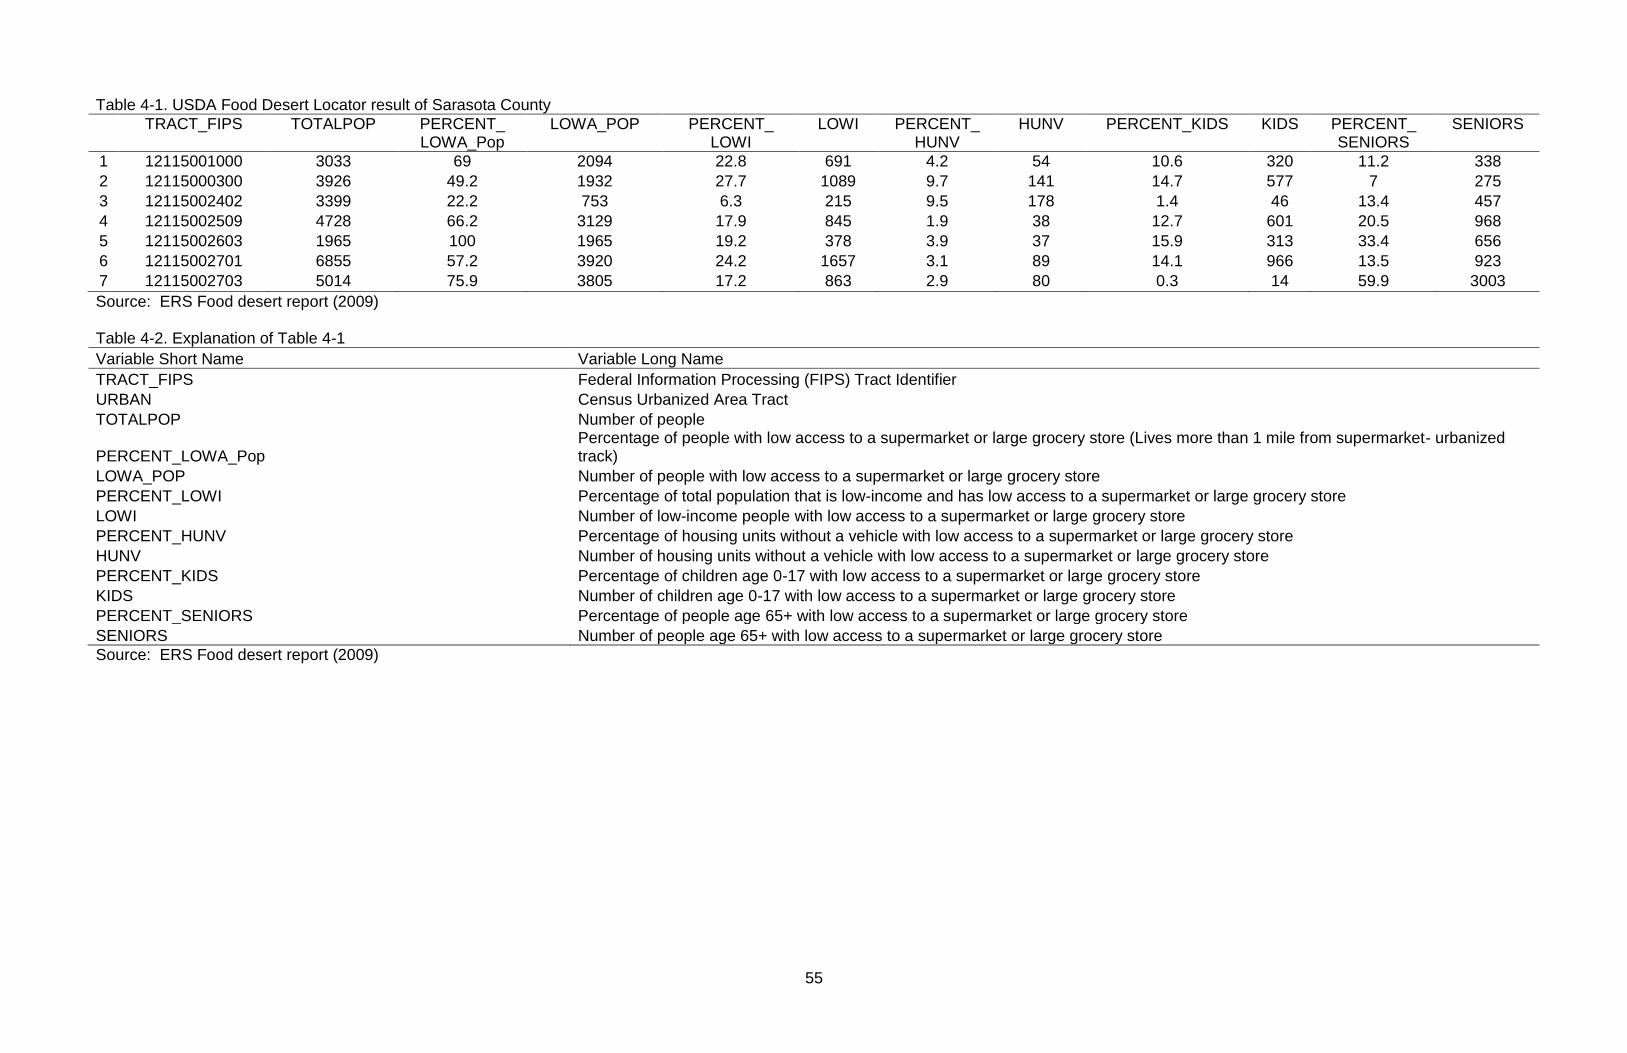
55
Table 4-1. USDA Food Desert Locator result of Sarasota County
TRACT_FIPS TOTALPOP PERCENT_ LOWA_Pop
LOWA_POP PERCENT_ LOWI
LOWI PERCENT_ HUNV
HUNV PERCENT_KIDS KIDS PERCENT_ SENIORS
SENIORS
1 12115001000 3033 69 2094 22.8 691 4.2 54 10.6 320 11.2 338
2 12115000300 3926 49.2 1932 27.7 1089 9.7 141 14.7 577 7 275
3 12115002402 3399 22.2 753 6.3 215 9.5 178 1.4 46 13.4 457
4 12115002509 4728 66.2 3129 17.9 845 1.9 38 12.7 601 20.5 968
5 12115002603 1965 100 1965 19.2 378 3.9 37 15.9 313 33.4 656
6 12115002701 6855 57.2 3920 24.2 1657 3.1 89 14.1 966 13.5 923
7 12115002703 5014 75.9 3805 17.2 863 2.9 80 0.3 14 59.9 3003
Source: ERS Food desert report (2009) Table 4-2. Explanation of Table 4-1
Variable Short Name Variable Long Name
TRACT_FIPS Federal Information Processing (FIPS) Tract Identifier
URBAN Census Urbanized Area Tract
TOTALPOP Number of people
PERCENT_LOWA_Pop Percentage of people with low access to a supermarket or large grocery store (Lives more than 1 mile from supermarket- urbanized track)
LOWA_POP Number of people with low access to a supermarket or large grocery store
PERCENT_LOWI Percentage of total population that is low-income and has low access to a supermarket or large grocery store
LOWI Number of low-income people with low access to a supermarket or large grocery store
PERCENT_HUNV Percentage of housing units without a vehicle with low access to a supermarket or large grocery store
HUNV Number of housing units without a vehicle with low access to a supermarket or large grocery store
PERCENT_KIDS Percentage of children age 0-17 with low access to a supermarket or large grocery store
KIDS Number of children age 0-17 with low access to a supermarket or large grocery store
PERCENT_SENIORS Percentage of people age 65+ with low access to a supermarket or large grocery store
SENIORS Number of people age 65+ with low access to a supermarket or large grocery store
Source: ERS Food desert report (2009)

56
Table 4-3. Summary of Sarasota County access to healthy foods from County Health Rankings
County Zip codes with healthy food
Number of Zip codes
Healthy foods percentage
Z-score*
Sarasota 19 23 83% -0.33
*Z-score= (Measure - Average of FL counties)/ (Standard Deviation) Source: County Health Rankings, Sarasota County
Table 4-4. Result of t-test between two variables: vehicle ownership and food access
index in ½ miles walking network
t-Test: Two-Sample Assuming Equal Variances
NOVEHPER
(Less than 3.38%) NOVEHPER
(more than 3.38%) Mean 62804844.19 89682935.43 Variance 7.91791E+15 8.81999E+15 Observations 100 48 Pooled Variance 8.20831E+15
Hypothesized Mean Difference 0 Df 146 t Stat -1.689512411 P(T<=t) one-tail 0.046627796 t Critical one-tail 1.655357345 P(T<=t) two-tail 0.093255591 t Critical two-tail 1.976345623
Table 4-5. Result of t-test between two variables: vehicle ownership and food access
index in 10 miles driving network
t-Test: Two-Sample Assuming Equal Variances
NOVEHPER (Less than 3.38%)
NOVEHPER (more than 3.38%)
Mean 43919471.46 70570178.7 Variance 6.35551E+15 8.28027E+15 Observations 143 61 Pooled Variance 6.92722E+15
Hypothesized Mean Difference 0 Df 202 t Stat -2.09385746 P(T<=t) one-tail 0.018760175 t Critical one-tail 1.652431964 P(T<=t) two-tail 0.037520349 t Critical two-tail 1.971777338

57
Table 4-6. Land uses from parcel data included in food desert
DESCRIPT Count Acres
GRAZING LAND SOIL CLASS 3 354 51739.449
FOREST, PARK, AND RECREATIONAL AREAS 187 23541.342
SINGLE FAMILY 55119 19804.464
VACANT RESIDENTIAL 45766 15596.051
SEWAGE DISPOSAL, BORROW PITS, AND WETLANDS 974 4837.683
GOLF COURSES 31 4458.451
ACREAGE NOT ZONED FOR AGRICULTURAL 76 2207.137
VACANT COMMERCIAL 337 1654.116
MULTI-FAMILY LESS THAN 10 UNITS 1072 1075.384
PARKING LOTS, MOBILE HOME SALES 65 1063.899
PUBLIC SCHOOLS 18 999.067
VACANT INSTITUTIONAL 41 931.763
UTILITIES 112 797.883
CHURCHES 121 612.458
ORCHARD, GROVES, CITRUS 10 513.132
AIRPORTS, MARINAS, BUS TERMINALS, AND PIERS 8 473.896
WAREHOUSES, AND DISTRIBUTION CENTERS 299 427.151
MORTUARIES, CEMETERIES 9 406.147
MINERAL PROCESSING 19 385.921
COMMUNITY SHOPPING CENTERS 70 337.652
VACANT INDUSTRIAL 115 324.052
MULTI-FAMILY 56 280.033
PARCELS WITH NO VALUES 1884 276.618
CLUBS, LODGES, AND UNION HALLS 30 266.094
ORNAMENTALS, MISC. AGRICULTURE 22 222.211
RETIREMENT HOMES 7 221.252
MOBILE HOMES 2099 218.711
LIGHT MANUFACTURING 90 207.391
STORES ONE-STORY 280 206.953
CROPLAND SOIL CLASS 2 1 169.264
AUTOMOTIVE REPAIR, SERVICE, AND SALES 144 165.714
RIGHTS-OF-WAY STREETS, ROADS, AND CANALS 68 165.468
DEPARTMENT STORES 11 147.991
OTHER COUNTIES 19 112.517
ORPHANAGES 19 108.98
RIVERS, LAKES, AND SUBMERGED LANDS 31 104.438
PROFESSIONAL SERVICE BUILDINGS 96 101.937
COLLEGES 2 101.585
OTHER MUNICIPAL 16 97.898
REGIONAL SHOPPING MALLS 5 93.959
TIMBERLAND 4 89.972

58
Table 4-6. Continued.
DESCRIPT Count Acres
HOMES FOR AGED 20 89.67
ONE-STORY NON-PROFESSIONAL OFFICES 159 88.886
INDUSTRIAL STORAGE (FUEL, EQUIP, AND MATERIAL) 67 82.028
CONDOMINIA 715 79.489
MULTI-STORY NON-PROFESSIONAL OFFICES 98 79.053
PRIVATE SCHOOLS 18 76.992
FINANCIAL INSTITUTIONS 64 73.564
PUBLIC HOSPITALS 1 63.692
SANITARIUMS, CONVALESCENT, AND BEST HOMES 7 60.74
LUMBER YARDS, SAWMILLS, PLANNING MILLS, 4 50.564
RESTAURANTS, CAFETERIAS 61 48.612
OTHER STATE 6 39.85
HOTELS, MOTELS 22 38.834
DRIVE-IN RESTAURANTS 34 29.107
PRIVATE HOSPITALS 1 28.188
FLORIST, GREENHOUSES 4 22.732
GOV. OWNED LEASED BY NON-GOV. LESSEE 14 21.654
RACE HORSE, AUTO, AND DOG TRACKS 4 19.57
BOWLING ALLEYS, SKATING RINGS, ENCLOSED ARENAS 3 16.424
OTHER FEDERAL 6 10.783
CAMPS 1 9.586
NIGHT CLUBS, BARS, AND COCKTAIL LOUNGES 11 9.527
REPAIR SERVICE SHOPS 20 9.393
CULTURAL ORGANIZATIONS 7 8.042
TOURIST ATTRACTIONS 2 5.396
SERVICE STATIONS 10 5.286
HEAVY MANUFACTURING 2 5.087
SUPERMARKET 2 4.822
ENCLOSED THEATERS, AUDITORIUMS 4 2.725
FRUIT, VEGETABLES, AND MEAT PACKING 1 2.278
Total 145322.363
Source: Sarasota County Parcel 2009

59
Figure 4-1. Food desert locations in Sarasota County. Source: USDA Food Desert Locator

60
A
B
C
Figure 4-2.TRF policy map of Sarasota County. A) Low Access Area(LAA) Status, as of
2010 B) TRF's 2007 Neighborhood Income Distribution Analysis C) Estimated percent of workers who commuted to work using public transit in 2005-2009.Source: TRF policy map
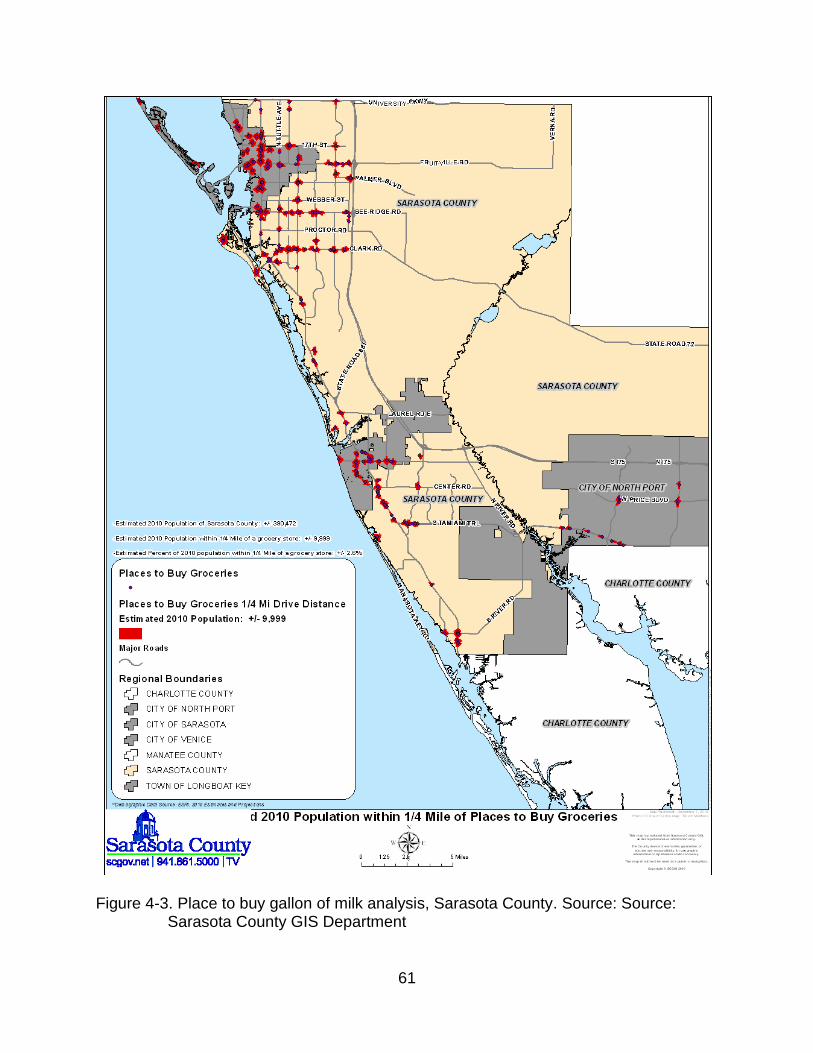
61
Figure 4-3. Place to buy gallon of milk analysis, Sarasota County. Source: Source: Sarasota County GIS Department

62
Figure 4-4. Food access index from Census block centroid point to healthy food outlets in Sarasota County using Manhattan distance (without ‗No food outlet‘)

63
Figure 4-5. Food access index from Census block centroid point to healthy food outlets in Sarasota County using Manhattan distance (without ‗No food outlet‘)

64
Figure 4-6. Food access index of Sarasota County in walking network (1/2 mile)

65
Figure 4-7. Food access index of Sarasota County in driving network (10 miles)

66
Figure 4-8. Food deserts based on proximity to healthy food outlets and proximity and coverage to healthy food outlets

67
Figure 4-9. Food deserts and EPLs

68
Figure 4-10. Food deserts, Sarasota County, FL (excluding EPLs)

69
Figure 4-11.Food deserts for pedestrian

70
Figure 4-12. Food deserts for drivers

71
A
B
Figure 4-13. Comparison between residential parcel and census block centroid point. A) Distance (the nearest distance) from residential parcel to healthy food outlets B) Distance (the nearest distance) from census block centroid point to healthy food outlets
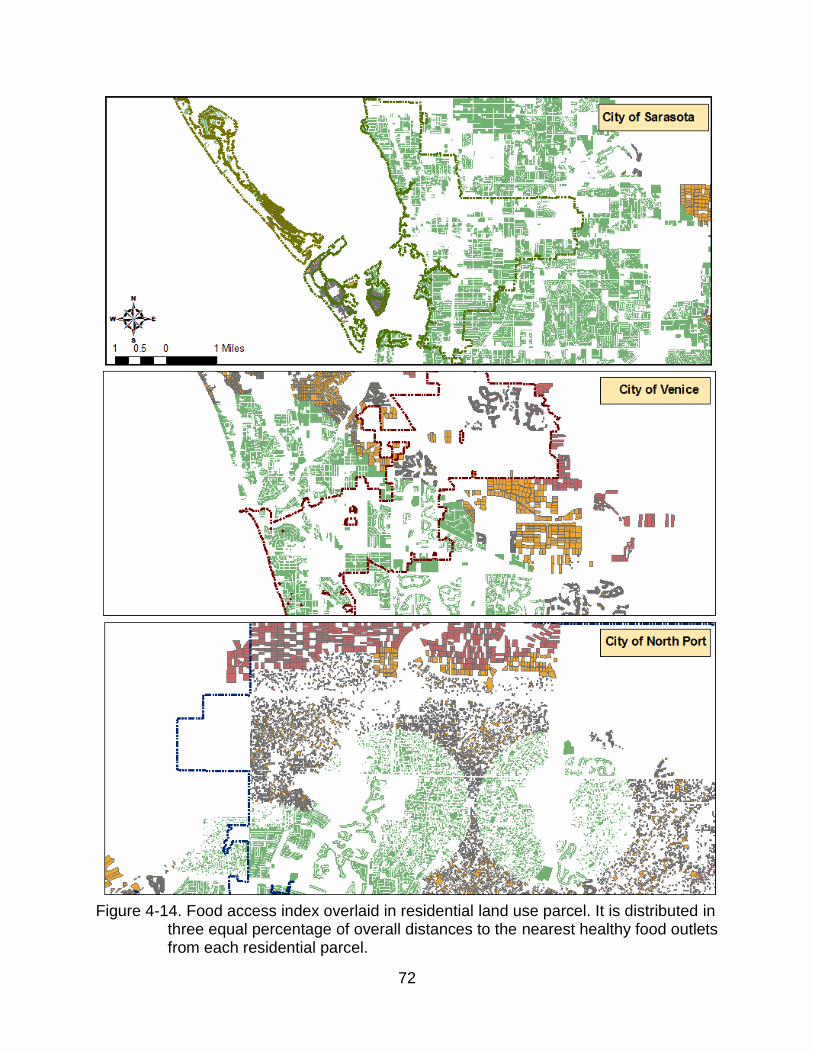
72
Figure 4-14. Food access index overlaid in residential land use parcel. It is distributed in three equal percentage of overall distances to the nearest healthy food outlets from each residential parcel.
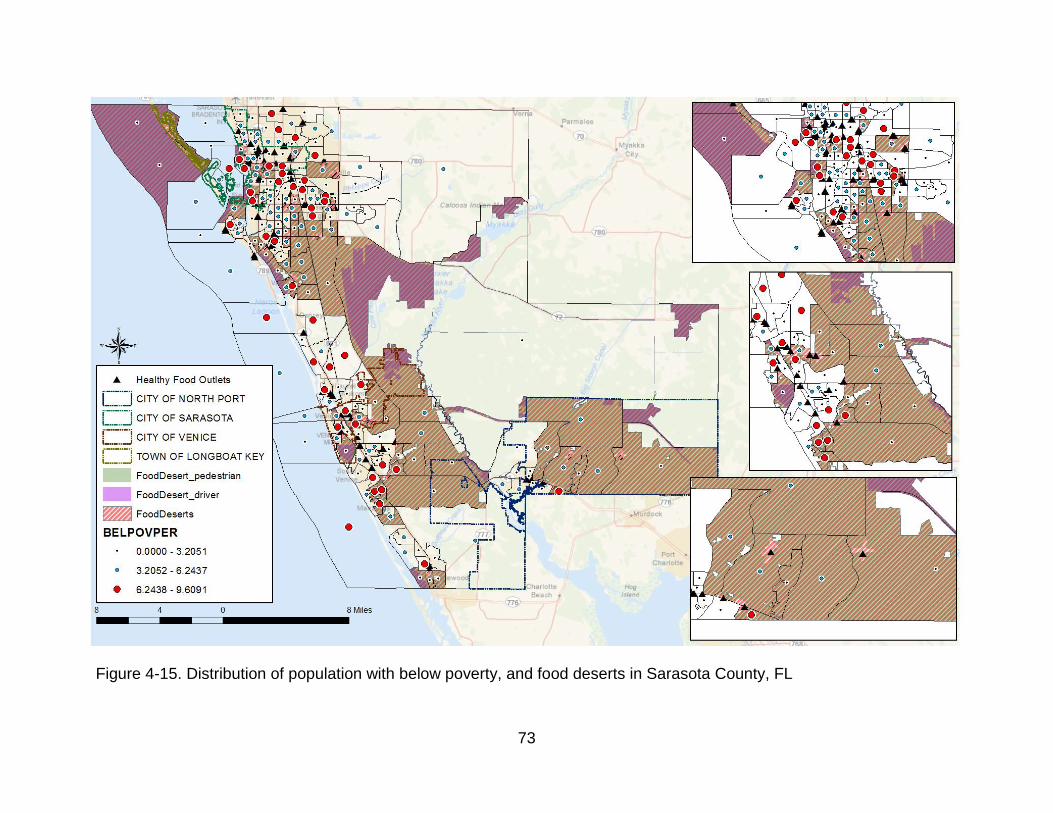
73
Figure 4-15. Distribution of population with below poverty, and food deserts in Sarasota County, FL

74
Figure 4-16. No vehicle ownership distribution, and food deserts in Sarasota County, FL

75
Figure 4-17. Population 65 years older, and food deserts in Sarasota County, FL

76
CHAPTER 5 DISCUSSION
This thesis demonstrates how GIS technology can effectively analyze local food
environments and benefit residents based on spatial analysis. Most importantly, the
overlay analysis and the creation of a food access index contribute to identify food-
desert candidates and address the research questions under examination in this study.
What is the definition of food desert? Is it absolute or does it varies from one
case to another? Yes, the definition of a food desert can be broad, because it
incorporates questions from social theory, and relating to the physical environment, the
residents‘ behavior, and human rights. For example, a widespread assertion from
human rights would be that access to safe, nutritious food is a fundamental concept
(Furey et al., 2001).
By all accounts, food deserts in Sarasota County have been distributed for
pedestrians and drivers separately, and then spatially illustrated under census block
scope, which is assessed by applying the food access index. Because residents who
may walk to healthy food outlets have a maximum of a half-mile eligible buffer to hold
products, excluding the walking buffer from Census blocks that had been assessed as
―low food access‖ yields food deserts. The same evaluation for the 10-miles buffer
(drivable distance to healthy food outlets) yields food deserts for drivers.
What areas in Sarasota County have spatial inequality of food access? Food
desert candidates in Sarasota County were explored in combining food access index
and transportation network. This study has found City of North Port, Venice and North
central South of County are the areas with spatial inequalities in access to food outlets
within both transportation network. It can be argued that food deserts underlay on
77
locations of food outlets and where street network are affordable for customers to reach
food outlets. A major contribution of this research resulted from the utilization and
evaluation of different measures to determine accessibility. For the residents without
personal vehicle while inhabit in transportation network, assessing public transit
lines/routes will be needed to more accurately measure food desert candidates. Since
drivable network was applied in this study, not only the residents currently live these
areas but population in 10 miles distance visit as well if there are related attractions
such as community garden which addresses the importance of fresh foods for healthier
life style. County should actively encourage food outlet development, increasing public
transit network and building community garden in areas currently identified as food
deserts.
Food Policy and Food Assistance Programs
Once physical food access assessment has been evaluated, one of the obvious
solutions is to implement policies that locate more full-service food retailers in identified
food deserts in the U.S. and across the globe. Morland et al.(2002a) and Wrigley et al.
(2002) supports this policy because introducing new food stores in British cities in low
food access areas has helped eradicate lack of food access while also promoting the
increase of healthy food consumption such as fruit and vegetable (U.S Census track).
Fresh Food Financing Initiative (FFFI) in Pennsylvania is represented as an example of
policy intervention. Over the six years of commitment, purpose of FFFI succeeded to
locate 83 new or improved grocery stores and food access has been encouraged for
400,000 residents (USDA 2009). Additionally 4,860 jobs have been created as well due
to this economic opportunity.

78
According to Conveney and O‘Dwyer (2009), living in food desert does not restrict
food access by itself but it is a matter of transportation form. Policies suggested in
several regions focus on developing more accessible transportation infrastructure as
another option. Expanding local bus routes or frequency is generally implied in providing
transportation needs for many socioeconomic disparity households. Other than that,
providing shuttle service that connects food retailers to residents was proposed in order
to supplement alternative transportation methods as well.
To provide more opportunity to purchase food, while physical limitations such as
food access exists, food assistance programs increased food security, a healthy diet,
and access to food. Generally Supplement Nutrition Assistant Program (SNAP7) from
USDA is well known all over the U.S. and each county or state has their own assistance
programs due to its environments. For example, New York City implemented Healthy
Bodegas which aimed to lessen access inequality for healthy foods. The program aimed
to increase the amount of healthy foods in small grocery stores to promote healthy
eating by improving the availability, quality and variety of healthy foods in targeted
areas.
To prevent forms of food desert, Sarasota County has included agricultural food
policy in Comprehensive Plan in 2006 and established Sarasota Food Policy Council
(SFPC) in UF/IFAS Sarasota County Extension Office to support the goals of
sustainable agriculture, reinforce County‘s distinctive character, and enhance food
environments to residents. For instance, SFPC programs include building community
7 In fiscal year 2010, about 40.3 million people living in 18.6 million U.S. households participated in the
Supplemental Nutrition Assistance Program (SNAP), on average, per month. SNAP households are a diverse group. Because benefits are available to most low-income households with few resources, regardless of age, disability status, or family structure, participants represent a broad cross-section of the Nation's poor.

79
gardens that emphasize the needs of healthy fresh foods and it is actively in process by
educational workshops. The UF/Sarasota County Extension Long Range Plan 2012-
2016 (2011) addresses the objective of programs that has been aimed to improve local
foods and agriculture as below:
Support provision of fresh and nutritious food options and nutrition education in schools
Generate increased awareness about locally-grown foods
Provide education on food safety issues
The residents of Sarasota County expect a sustainable food system and want to
buy local food which would be a catalyst healthy living. It is represented though the
online survey from April 14th to June 1st, 2011 with 257 responses; 71 percentages of
respondents pointed out the needs of fresh nutritious food option programs and; 61
percentages of responses were about priority issues of food safety. In the Listening
Session held on May 12, 2011, 15 votes from 62 attendees stressed County needs
make efforts on local foods and agricultural programs as priority as well (Sarasota
County Long Range Plan, 2011).
Community Gardens
Developing methods to distribute healthy foods to at-risk communities is not an
easy task. To solve this problem, as mentioned above, Sarasota County has initiated
building community gardens in urban areas. Forty-three of gardens already exist with
the city‘s boundary. Community gardens are clustered in City of Sarasota and Venice
where dense population has because designated urban agriculture area by property
criteria which do not necessarily show correlation with local food access and community
garden (Figure 6-1). These benefits like an urban agricultural purpose. Gardens

80
promote fresh and healthy products that offer population more choices for healthy
foods. In addition, when gardens locate near residential and institutional land uses, they
provide snacks and meals to schools and support communities. Overall it offers a better
quality of life and beautifies the populations and areas, all of which are health benefits.
This study suggests GIS can be helpful at creating spatial case-studies that can
identify unique characteristics about specific areas that may not follow the general
patterns found in other regions. Although some of the findings from this study contrast
with literatures and previous research, the proximity measures were able to effectively
identify vulnerable regions in Sarasota County. In terms of food policy, GIS may prove
to be extremely valuable for organizations concerned about the healthy eating of their
community. Once these at-risk areas are identified, it opens up the possibility for
targeting specific neighborhoods and implementing effective programs running in
County Extension office such as creating community garden and educating importance
of local foods.
Limitation of this Study
This study presents few limitations:
Needs of Survey and Health Outcome
First, data and methodology are limited to a qualitative method. Although the food
access index is derived from previous empirical studies, relying on quantitative data for
a sizable portion of this study means that the information does not represent residents‘
actual time, distance, and frequency to go grocery shopping. With more time and
resources, this limitation can be overcome by completing resident surveys or conducting
interviews with the criteria below:
How many fruit and vegetable servings do you consume a day?

81
Where do you go grocery shopping?
Do you either walk or drive to grocery?
Does anyone in the household suffer from a weight related disease such as obesity? If so, are they aware of how diet can contribute to its onset?
While the built food environment was used to examine the geographic distribution
of potential health disparities at the neighborhood level, the health outcome data was
unable to be incorporated into this study. Since it was not available to join within Census
block group scope, the potential access acts as a proxy for actual physical wellbeing.
Transit Routes and Opportunity with Euclidean Distance
Second, the methodology used two distinct measures to evaluate food access:
proximity to healthy food outlet and walking/driving network. In determining
walking/driving network, network analysis tool in ArcMap 10 computed potential walking
and driving boundary from healthy food outlets because this measurement has been
deemed sufficient by previous food proximity study (Larsen and Gilliland, 2008).
However more realistic determination for walking and driving distance could be made by
examining actual travel time, and the actual pedestrian network, which would consider
element such as sidewalks, crosswalks, speed limits, informal paths, and lanes of traffic
(Bejleri et al., 2009). This calculation also fails to account for the other alternative transit
transportation modes or routes that residents may use to visit these food locations.
Additionally, limitation from using Manhattan distance to measure proximity, from
census block centroid point to the nearest healthy food outlets, may occur because it
does not represents the minimum distance may be assessed as shortest path
(Euclidean distance).

82
Definition of Healthy Food Outlets
Last, because this study assessed healthy food outlets as places where residents
can reach constant fresh and organic food, farmers markets and food stands are
excluded due to their mobile characteristics.
The results show a majority of food deserts are near I-75 in Sarasota County, but
these areas also have an abundance of food stands. Food stands are one way to
increase access to healthy foods. Although food stands sometimes sell food that is
unhealthy and contaminated because they are often located near busy streets, these
businesses unlike grocery stores, adjust their inventory quickly to fit the fresh food
demands of the community. While conducting this study, food stands are not included in
the overall analysis due to limitation on the availability of GIS data but it is possible that
they could impact the findings of this study if they are included.
Opportunity for Future Research
While this thesis only limits transportation mode into walking and driving personal
automobile, future studies would benefit from incorporating measurements of public
transit transportation and trips relating to commuting to commute to work, school, and
shopping.
Additionally as shown in findings, physical environment (distance) plays an
important role to understand food deserts and guide decisions where healthy food
stores are needed to be placed. Additional revision of the definition of food deserts
using health related issue, such as obesity rate and with Body Mass Index (BMI) would
benefit analyzing food desert in reality. For example, using GIS in conjunction with
multivariate models to evaluate the relationship between obesity rate and food access

83
index to healthy or either unhealthy foods, may provide how these healthy and
unhealthy food outlets contribute to disparities in the obesity epidemic.

84
Figure 5-14. Community gardens in Sarasota County, FL Source: Sarasota County
Green Map

85
CHAPTER 6 CONCLUSION
This study aimed to explore the socioeconomic and physical factors that define
food deserts, assessing Sarasota County as a case study area. The first chapter
introduced the problem statement that highlights increasing food access/food desert,
and explained the objectives and questions related to this issue. The second chapter
reviewed previous studies, introduced food environment terms, and continued with a
review of food environment inequalities derived from socioeconomic factors and
physical barriers, all of which helped to create the food access index. Both empirical
and quantitative methods were applied to support and measure the food access index,
which is an indicator used to find food deserts. This study‘s findings and results
represent two steps toward finding food deserts:
Step 1. The findings confirmed that some areas of the county have comparatively
better food access than others; the southern portion of the city of Sarasota, the eastern
portion of the city of Venice, and the city center of North Port are food deserts.
Step 2. The results of the study suggest that the assessment of food deserts
should depend on the modes of transportation that residents of a given area employ to
reach areas where food is available.
The conclusion is that food deserts do exist in Sarasota County, FL. As shown in
the literature review, food deserts appeared in areas with a high density of low income
households, a low per capita vehicle ownership, and an older population. For example,
much of the population living in downtown Sarasota is at or below poverty level, has
very poor levels of pedestrian access to food outlets, and due to low vehicle ownership,
cannot access food by driving. This is true of the elderly population as well. Although

86
food deserts did appear more often in Sarasota County than in other counties with
similar socioeconomic disparities, it is still difficult to prove a strong correlation between
physical distance to food and the existence of food deserts.

87
APPENDIX METHODOLOGY OF COUNTY HEALTH RANKING 2011

88
LIST OF REFERENCES
Algert, S. J., Agrawal, A., & Lewis, D. S. (2006). Disparities in access to fresh produce in low-income neighborhoods in Los Angeles. American journal of preventive medicine, 30(5), 365-370.
Bejleri, I., Steiner, R. L., Provost, R. E., Fischman, A., & Arafat, A. A. (2009). Understanding and Mapping Elements of Urban Form That Affect Children's Ability to Walk and Bicycle to School. Transportation Research Record: Journal of the Transportation Research Board, 2137(-1), 148-158.
Bitto, E. A., Morton, L. W., Oakland, M. J., & Sand, M. (2003). Grocery Store Acess Patterns In Rural Food Deserts. Journal for the Study of Food and Society, 6(2), 35-48.
Block, J. P., Scribner, R. A., & DeSalvo, K. B. (2004). Fast food, race/ethnicity, and income:: A geographic analysis. American journal of preventive medicine, 27(3), 211-217.
Block, J. P., Scribner, R. A., & DeSalvo, K. B. (2004). Fast food, race/ethnicity, and income:: A geographic analysis. American journal of preventive medicine, 27(3), 211-217.
Broda, C., Leibtag, E., & Weinstein, D. E. (2009). The role of prices in measuring the poor's living standards. The Journal of Economic Perspectives, 23(2), 77-97.
Burns, C., & Inglis, A. (2007). Measuring food access in Melbourne: access to healthy and fast foods by car, bus and foot in an urban municipality in Melbourne. Health & place, 13(4), 877-885.
Casagrande, S. S., Whitt-Glover, M. C., Lancaster, K. J., Odoms-Young, A. M., & Gary, T. L. (2009). Built Environment and Health Behaviors Among African Americans:: A Systematic Review. American journal of preventive medicine, 36(2), 174-181.
Che, J., & Chen, J. (2001). Food insecurity in Canadian households. Health reports/Statistics Canada, Canadian Centre for Health Information= Rapports sur la santé/Statistique Canada, Centre canadien d'information sur la santé, 12(4), 11.
Chung, C., & Myers Jr, S. L. (1999). Do the poor pay more for food? An analysis of grocery store availability and food price disparities. Journal of consumer affairs, 33(2), 276-296.
Coveney, J., & O'Dwyer, L. A. (2009). Effects of mobility and location on food access. Health & place, 15(1), 45-55.

89
Dannenberg, A. L., Jackson, R. J., Frumkin, H., Schieber, R. A., Pratt, M., Kochtitzky, C., et al. (2003). The impact of community design and land-use choices on public health: a scientific research agenda. American Journal of Public Health, 93(9), 1500.
Furey, S., Strugnell, C., & McIlveen, M. H. (2001). An investigation of the potential existence of``food deserts''in rural and urban areas of Northern Ireland. Agriculture and Human Values, 18(4), 447-457.
Galvez, M. P., Morland, K., Raines, C., Kobil, J., Siskind, J., Godbold, J., et al. (2008). Race and food store availability in an inner-city neighbourhood. Public health nutrition, 11(6), 624-631.
Gimpel, J. G., & Schuknecht, J. E. (2003). Political participation and the accessibility of the ballot box. Political Geography, 22(5), 471-488.
Gordon, C., Purciel, M., Ghai, N. R., Kaufman, L., Graham, R., & Van Wye, G. (2011). Measuring food deserts in New York City's low-income neighborhoods. Health & place.
Jyoti, D. F., Frongillo, E. A., & Jones, S. J. (2005). Food insecurity affects school children‘s academic performance, weight gain, and social skills. The Journal of nutrition, 135(12), 2831.
Larsen, K., & Gilliland, J. (2008). Mapping the evolution of'food deserts' in a Canadian city: Supermarket accessibility in London, Ontario, 1961–2005. International Journal of Health Geographics, 7(1), 16.
Larson, N. I., Story, M. T., & Nelson, M. C. (2009). Neighborhood Environments:: Disparities in Access to Healthy Foods in the US. American journal of preventive medicine, 36(1), 74-81. e10.
Lewis, L. V. B., Sloane, D. C., Nascimento, L. M., Diamant, A. L., Guinyard, J. J., Yancey, A. K., et al. (2005). African Americans' access to healthy food options in South Los Angeles restaurants. American Journal of Public Health, 95(4), 668.
Litman, T., & Institute, V. T. P. (2010). Evaluating Public Transportation Health Benefits: Victoria Transport Policy Institute.
Lucan, S. C., Karpyn, A., & Sherman, S. (2010). Storing Empty Calories and Chronic Disease Risk: Snack-Food Products, Nutritive Content, and Manufacturers in Philadelphia Corner Stores. Journal of Urban Health, 87(3), 394-409.
Macintyre, S. (2007). Deprivation amplification revisited; or, is it always true that poorer places have poorer access to resources for healthy diets and physical activity? International Journal of Behavioral Nutrition and Physical Activity, 4(1), 32.

90
McEntee, J., & Agyeman, J. (2010). Towards the development of a GIS method for identifying rural food deserts: Geographic access in Vermont, USA. Applied Geography, 30(1), 165-176.
Moore, L. V., Diez Roux, A. V., Nettleton, J. A., & Jacobs, D. R. (2008). Associations of the local food environment with diet quality—a comparison of assessments based on surveys and geographic information systems. American Journal of Epidemiology, 167(8), 917.
Morland, K., Diez Roux, A. V., & Wing, S. (2006). Supermarkets, Other Food Stores, and Obesity:: The Atherosclerosis Risk in Communities Study. American journal of preventive medicine, 30(4), 333-339.
Morland, K., Wing, S., Diez Roux, A., & Poole, C. (2002a). Neighborhood characteristics associated with the location of food stores and food service places. American journal of preventive medicine, 22(1), 23-29.
Morland, K., Wing, S., & Roux, A. D. (2002b). The contextual effect of the local food environment on residents' diets: the atherosclerosis risk in communities study. American Journal of Public Health, 92(11), 1761.
Morton, L. W., Bitto, E. A., Oakland, M. J., & Sand, M. (2005). Solving the Problems of Iowa Food Deserts: Food Insecurity and Civic Structure*. Rural Sociology, 70(1), 94-112.
Murakami, E., & Young, J. (1997). Daily travel by persons with low income.
Nord, M. (2002). Rates of food insecurity and hunger unchanged in rural households. Rural America, 16(4), 42-47.
Ploeg, M., Breneman, V., Farrigan, T., Hamrick, K., Hopkins, D., Kaufman, P., et al. (2009). Access to affordable and nutritious food: measuring and understanding food deserts and their consequences. Report to Congress.
Powell, L. M., Slater, S., Mirtcheva, D., Bao, Y., & Chaloupka, F. J. (2007). Food store availability and neighborhood characteristics in the United States. Preventive Medicine, 44(3), 189-195.
Sharkey, J. R., Horel, S., & Dean, W. R. (2010). Neighborhood deprivation, vehicle ownership, and potential spatial access to a variety of fruits and vegetables in a large rural area in Texas. International Journal of Health Geographics, 9(1), 26.
Sharkey, J. R., Horel, S., & Dean, W. R. (2010). Neighborhood deprivation, vehicle ownership, and potential spatial access to a variety of fruits and vegetables in a large rural area in Texas. International Journal of Health Geographics, 9(1), 26.
Stommes, E. S., & Brown, D. M. (2002). Transportation in rural America: Issues for the 21st century. Rural America, 16(4), 2-10.

91
Wrigley, N. (2002). 'Food deserts' in British cities: policy context and research priorities. Urban studies, 39(11), 2029.
Yoo, S., Baranowski, T., Missaghian, M., Baranowski, J., Cullen, K., Fisher, J. O., et al. (2006). Food-purchasing patterns for home: a grocery store-intercept survey. Public health nutrition, 9(03), 384-393.
Zenk, S. N., Schulz, A. J., Israel, B. A., James, S. A., Bao, S., & Wilson, M. L. (2005). Neighborhood racial composition, neighborhood poverty, and the spatial accessibility of supermarkets in metropolitan Detroit. American Journal of Public Health, 95(4), 660.
Zenk, S. N., Schulz, A. J., Israel, B. A., James, S. A., Bao, S., & Wilson, M. L. (2006). Fruit and vegetable access differs by community racial composition and socioeconomic position in Detroit, Michigan. Ethnicity & disease, 16(1), 275.

92
BIOGRAPHICAL SKETCH
Sulhee Yoon was born in Seoul, South Korea in 1986 as an only daughter of
Kyungshin Kim and Hyun-mo Yoon. Sulhee was named as ―Sunny‖ when she started to
learn English in her childhood. She started her college life with urban design and
engineering major for two years, and later transferred to biotechnology/bioscience then
received her Bachelor of Science and Engineering degree at Sejong University, South
Korea, 2009. While in her senior summer vacation, Sulhee interned in Red Cross in Los
Angeles and wished to start her master‘s degree in United States. Toward the end of
Sulhee‘s undergraduate career, she decided to coming back to pursue a master‘s
degree in urban planning and focus on environmental planning in United States.
Sulhee began her master‘s in urban and regional planning at University of Florida
in fall, 2009. After her first semester, she had been worked as a research assistant in
‗Childhood Obesity GIS project‘ for a year and also embarked on an internship with
Alachua County Growth Management as a CRA project intern. In Summer 2011, Sulhee
completed an internship at the UF/IFAS Sarasota Extension office and conducted food
desert research for County.
Sulhee‗s main planning interests are in the collaboration between urban
design/form and transportation with applying GIS modeling. After graduation she hopes
to pursue a career in comprehensive planning, especially where she can use her GIS
skills.