© 2012 mcgraw-hill ryerson limitedchapter 11 -1 an example: a canadian pacific railway (cp) share...
TRANSCRIPT
© 2012 McGraw-Hill Ryerson Limited Chapter 11 -1
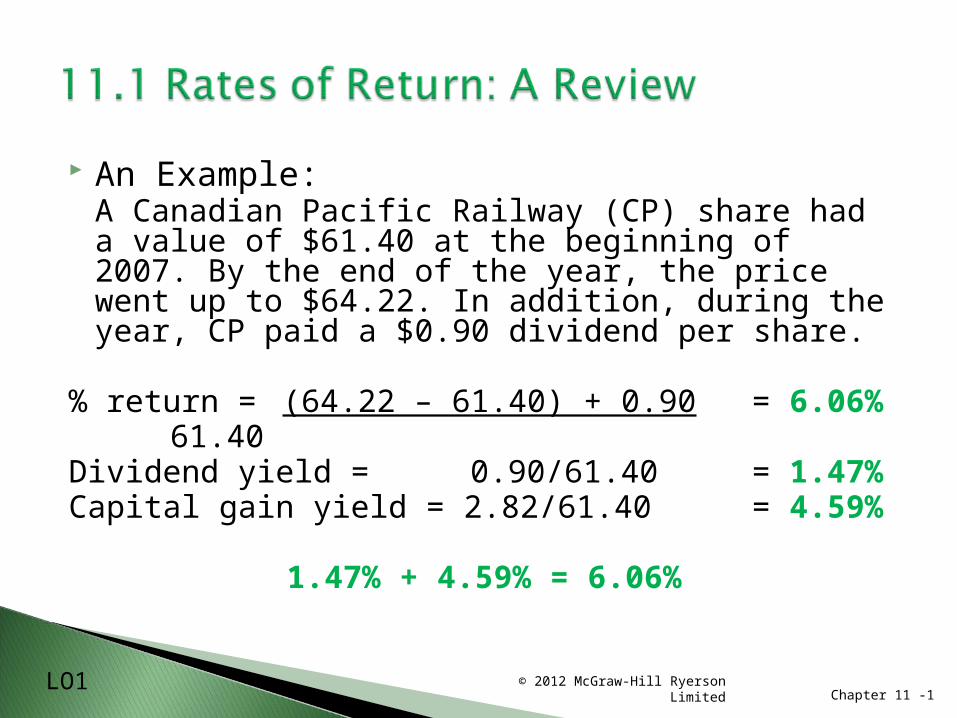
An Example:A Canadian Pacific Railway (CP) share had a value of $61.40 at the beginning of 2007. By the end of the year, the price went up to $64.22. In addition, during the year, CP paid a $0.90 dividend per share.
% return = (64.22 – 61.40) + 0.90 = 6.06% 61.40
Dividend yield = 0.90/61.40 = 1.47%Capital gain yield = 2.82/61.40 = 4.59%
1.47% + 4.59% = 6.06%
LO1
© 2012 McGraw-Hill Ryerson Limited Chapter 11 -2
Market index: A measure of the investment performance of the overall market
Canadian Market Indexes
◦S&P/TSX Composite Index Index of the investment performance of a portfolio of
the major stocks listed on the Toronto Stock Exchange
◦S&P/TSX Composite Total Return Index (TSXT) Measure of the Composite Index based on the prices
plus dividends paid by the stocks in the S&P/TSX Index
LO1
© 2012 McGraw-Hill Ryerson Limited Chapter 11 -3
U.S. Market Indexes ◦Dow Jones Industrial Average
Value of a portfolio holding one share in each of 30 large industrial (blue chip) firms
◦Standard & Poor’s Composite Index (S&P 500) U.S. Index of the investment performance of a
portfolio of 500 large stocks
LO1
© 2012 McGraw-Hill Ryerson Limited Chapter 11 -4
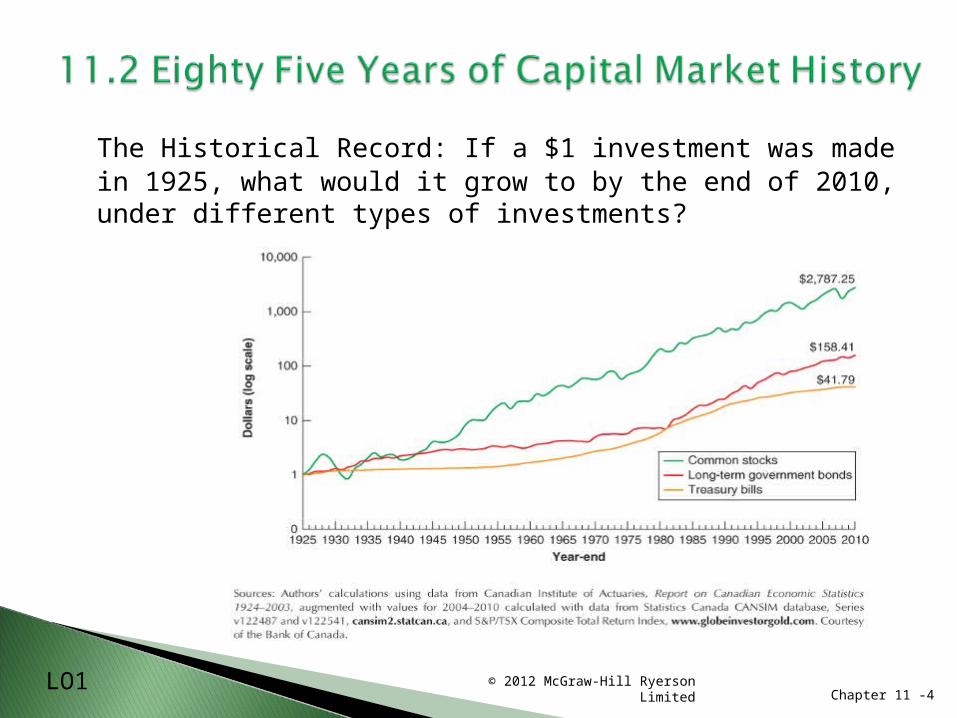
The Historical Record: If a $1 investment was made in 1925, what would it grow to by the end of 2010, under different types of investments?
LO1
© 2012 McGraw-Hill Ryerson Limited Chapter 11 -5
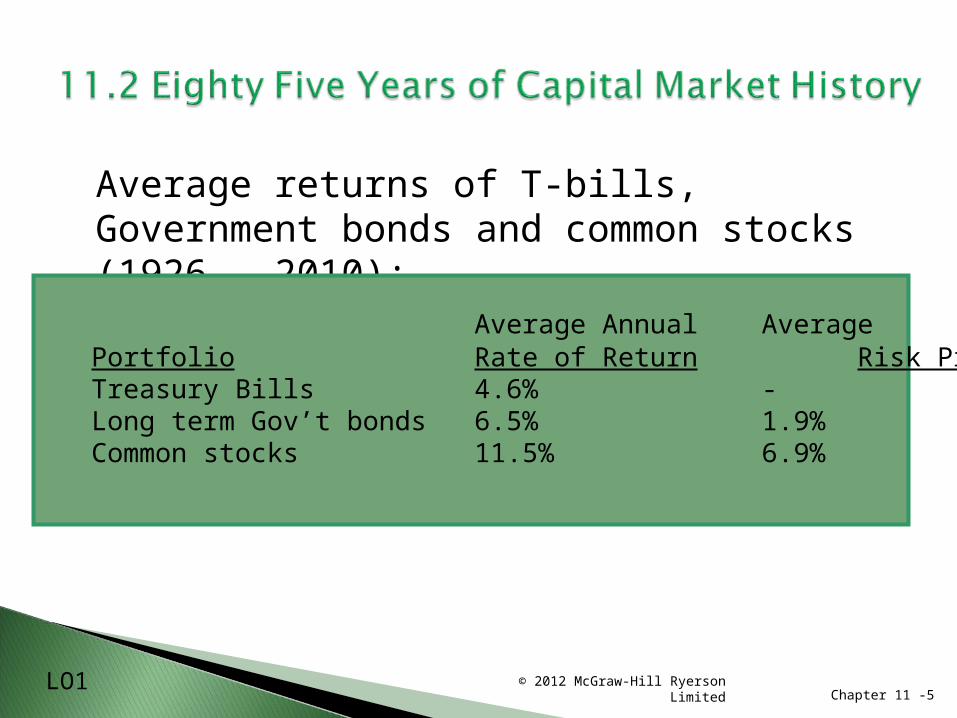
Average returns of T-bills, Government bonds and common stocks (1926 – 2010):
Average Annual Average Portfolio Rate of Return Risk PremiumTreasury Bills 4.6% - Long term Gov’t bonds 6.5% 1.9%Common stocks 11.5% 6.9%
LO1
© 2012 McGraw-Hill Ryerson Limited Chapter 11 -6
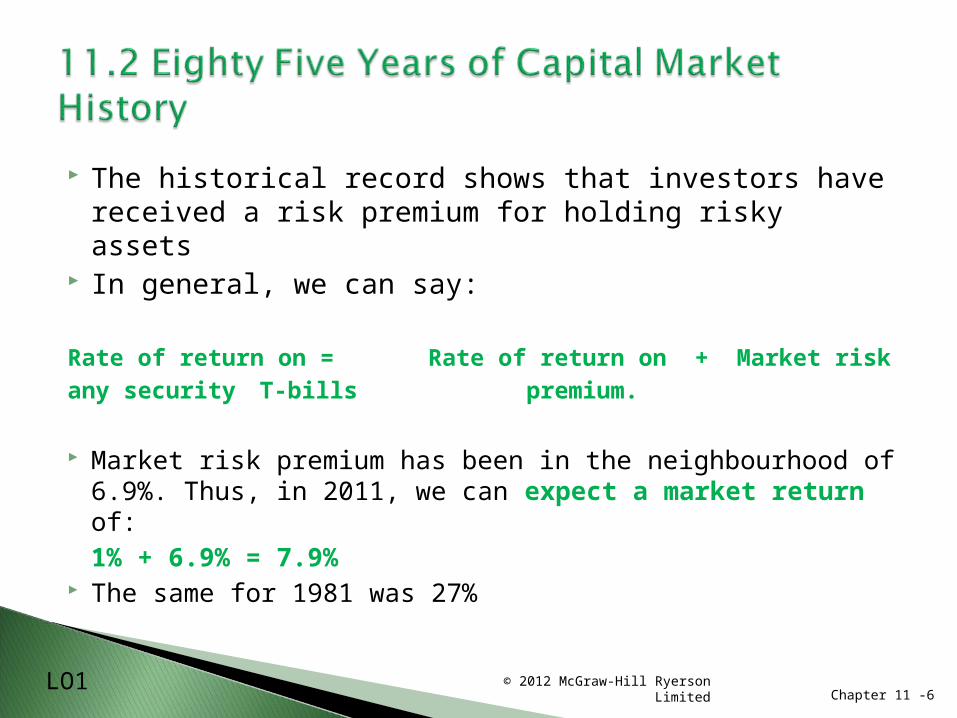
The historical record shows that investors have received a risk premium for holding risky assets
In general, we can say:
Rate of return on = Rate of return on + Market riskany security T-bills premium.
Market risk premium has been in the neighbourhood of 6.9%. Thus, in 2011, we can expect a market return of:
1% + 6.9% = 7.9% The same for 1981 was 27%
LO1