© 2013 pearson education, inc. respiratory volumes used to assess respiratory status –tidal...
TRANSCRIPT
© 2013 Pearson Education, Inc.
Respiratory Volumes
• Used to assess respiratory status– Tidal volume (TV) – Inspiratory reserve volume (IRV) – Expiratory reserve volume (ERV) – Residual volume (RV)

© 2013 Pearson Education, Inc.
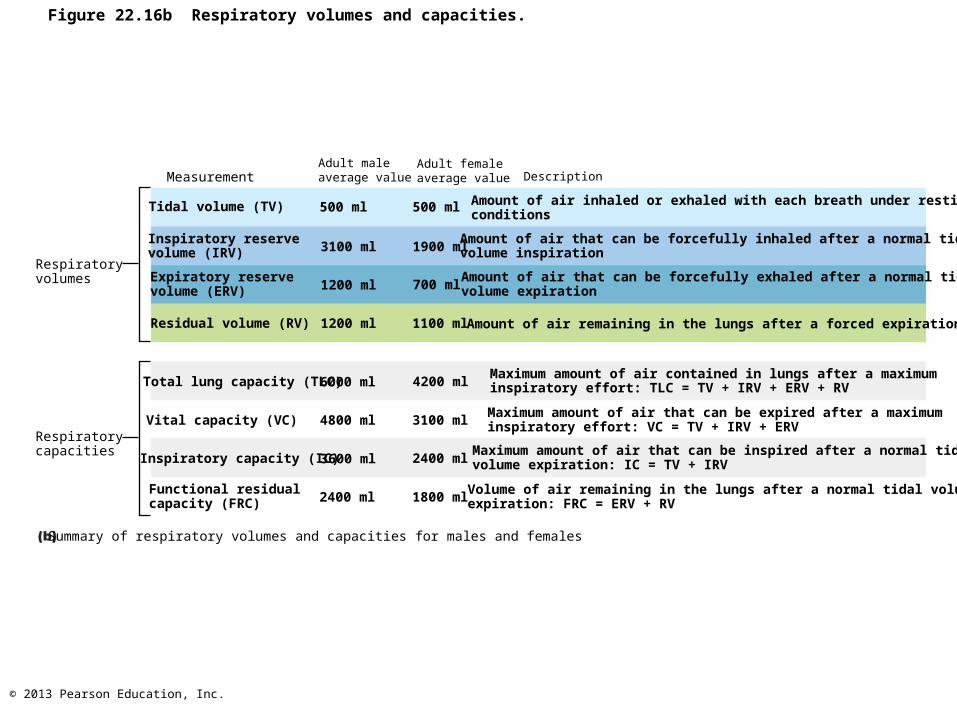
Figure 22.16b Respiratory volumes and capacities.
MeasurementAdult maleaverage value
Adult femaleaverage value Description
Respiratoryvolumes
Respiratorycapacities
Summary of respiratory volumes and capacities for males and females
Tidal volume (TV)
Inspiratory reservevolume (IRV)
Expiratory reservevolume (ERV)
Residual volume (RV)
500 ml 500 ml
3100 ml
1200 ml
1200 ml
1900 ml
700 ml
1100 ml
Amount of air inhaled or exhaled with each breath under restingconditions
Amount of air that can be forcefully inhaled after a normal tidalvolume inspiration
Amount of air that can be forcefully exhaled after a normal tidalvolume expiration
Amount of air remaining in the lungs after a forced expiration
Maximum amount of air contained in lungs after a maximuminspiratory effort: TLC = TV + IRV + ERV + RV
Maximum amount of air that can be expired after a maximuminspiratory effort: VC = TV + IRV + ERV
Maximum amount of air that can be inspired after a normal tidalvolume expiration: IC = TV + IRV
Volume of air remaining in the lungs after a normal tidal volumeexpiration: FRC = ERV + RV
6000 ml
4800 ml
3600 ml
2400 ml
4200 ml
3100 ml
2400 ml
1800 ml
Total lung capacity (TLC)
Vital capacity (VC)
Inspiratory capacity (IC)
Functional residualcapacity (FRC)
© 2013 Pearson Education, Inc.
Respiratory Capacities
• Combinations of respiratory volumes– Inspiratory capacity (IC) – Functional residual capacity (FRC)– Vital capacity (VC) – Total lung capacity (TLC)

© 2013 Pearson Education, Inc.
Figure 22.16a Respiratory volumes and capacities.
5000
4000
3000
2000
1000
0
Mill
ilite
rs (
ml)
Spirographic record for a male
6000
Inspiratoryreserve volume
3100 ml
Expiratoryreserve volume
1200 ml
Residual volume1200 ml
Inspiratorycapacity3600 ml
Functionalresidualcapacity2400 ml
Vitalcapacity4800 ml
Total lungcapacity6000 ml
Tidal volume 500 ml
© 2013 Pearson Education, Inc.
Figure 22.16b Respiratory volumes and capacities.
MeasurementAdult maleaverage value
Adult femaleaverage value Description
Respiratoryvolumes
Respiratorycapacities
Summary of respiratory volumes and capacities for males and females
Tidal volume (TV)
Inspiratory reservevolume (IRV)
Expiratory reservevolume (ERV)
Residual volume (RV)
500 ml 500 ml
3100 ml
1200 ml
1200 ml
1900 ml
700 ml
1100 ml
Amount of air inhaled or exhaled with each breath under restingconditions
Amount of air that can be forcefully inhaled after a normal tidalvolume inspiration
Amount of air that can be forcefully exhaled after a normal tidalvolume expiration
Amount of air remaining in the lungs after a forced expiration
Maximum amount of air contained in lungs after a maximuminspiratory effort: TLC = TV + IRV + ERV + RV
Maximum amount of air that can be expired after a maximuminspiratory effort: VC = TV + IRV + ERV
Maximum amount of air that can be inspired after a normal tidalvolume expiration: IC = TV + IRV
Volume of air remaining in the lungs after a normal tidal volumeexpiration: FRC = ERV + RV
6000 ml
4800 ml
3600 ml
2400 ml
4200 ml
3100 ml
2400 ml
1800 ml
Total lung capacity (TLC)
Vital capacity (VC)
Inspiratory capacity (IC)
Functional residualcapacity (FRC)
© 2013 Pearson Education, Inc.
Dead Space
• Anatomical dead space – No contribution to gas exchange– Air remaining in passageways; ~150 ml
• Alveolar dead space–non-functional alveoli due to collapse or obstruction
• Total dead space-sum of anatomical and alveolar dead space
© 2013 Pearson Education, Inc.
Pulmonary Function Tests
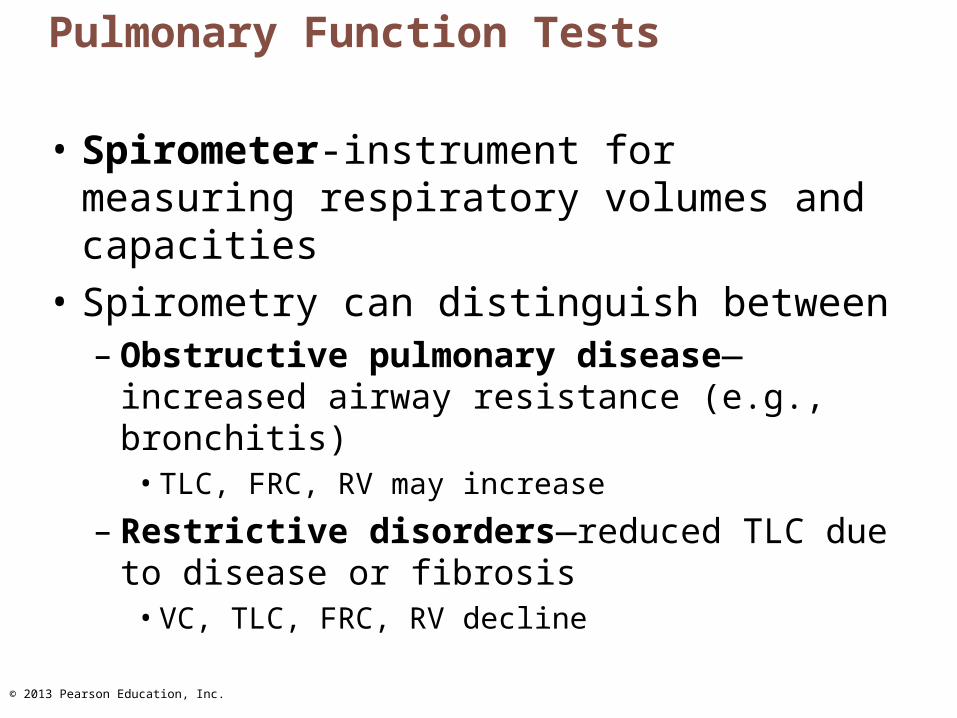
• Spirometer-instrument for measuring respiratory volumes and capacities
• Spirometry can distinguish between– Obstructive pulmonary disease—increased
airway resistance (e.g., bronchitis)• TLC, FRC, RV may increase
– Restrictive disorders—reduced TLC due to disease or fibrosis
• VC, TLC, FRC, RV decline
© 2013 Pearson Education, Inc.
Pulmonary Function Tests
• To measure rate of gas movement– Forced vital capacity (FVC)-gas forcibly
expelled after taking deep breath– Forced expiratory volume (FEV)-amount of
gas expelled during specific time intervals of FVC
© 2013 Pearson Education, Inc.
Alveolar Ventilation
• Minute ventilation-total amount of gas flow into or out of respiratory tract in one minute– Normal at rest = ~ 6 L/min– Normal with exercise = up to 200 L/min – Only rough estimate of respiratory efficiency
© 2013 Pearson Education, Inc.
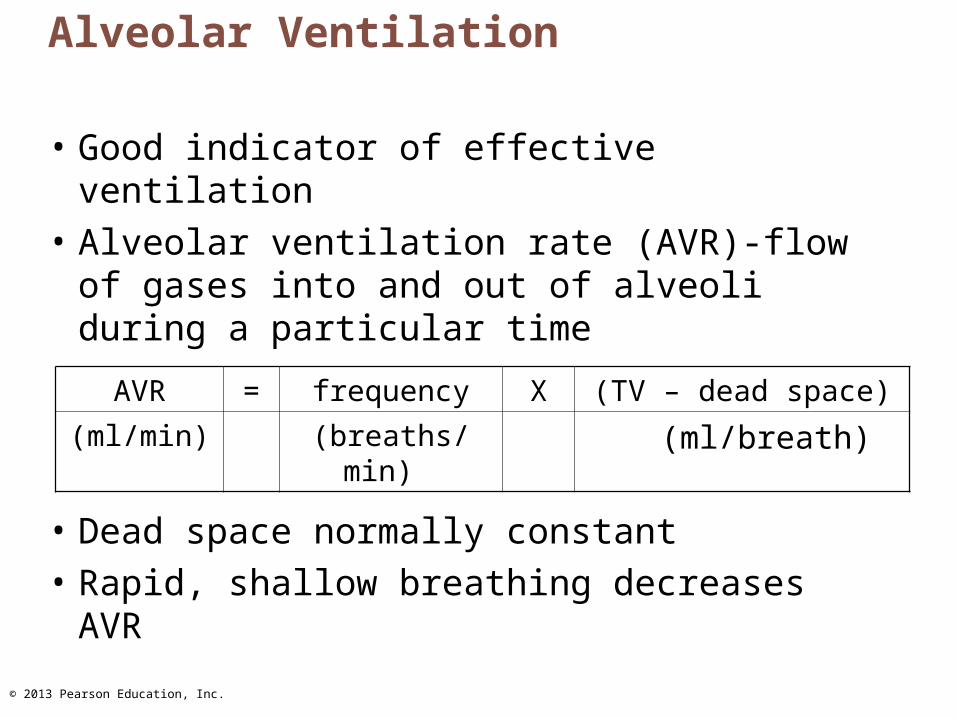
AVR = frequency X (TV – dead space)
(ml/min) (breaths/min) (ml/breath)
Alveolar Ventilation
• Good indicator of effective ventilation
• Alveolar ventilation rate (AVR)-flow of gases into and out of alveoli during a particular time
• Dead space normally constant
• Rapid, shallow breathing decreases AVR

© 2013 Pearson Education, Inc.
Table 22.2 Effects of Breathing Rate and Depth on Alveolar ventilation of Three Hypothetical Patients

© 2013 Pearson Education, Inc.
Nonrespiratory Air Movements
• May modify normal respiratory rhythm
• Most result from reflex action; some voluntary
• Examples include-cough, sneeze, crying, laughing, hiccups, and yawns

© 2013 Pearson Education, Inc.
Gas Exchanges Between Blood, Lungs, and Tissues
• External respiration–diffusion of gases in lungs
• Internal respiration–diffusion of gases at body tissues
• Both involve– Physical properties of gases – Composition of alveolar gas

© 2013 Pearson Education, Inc.
Basic Properties of Gases: Dalton's Law of Partial Pressures
• Total pressure exerted by mixture of gases = sum of pressures exerted by each gas
• Partial pressure – Pressure exerted by each gas in mixture– Directly proportional to its percentage in
mixture
© 2013 Pearson Education, Inc.
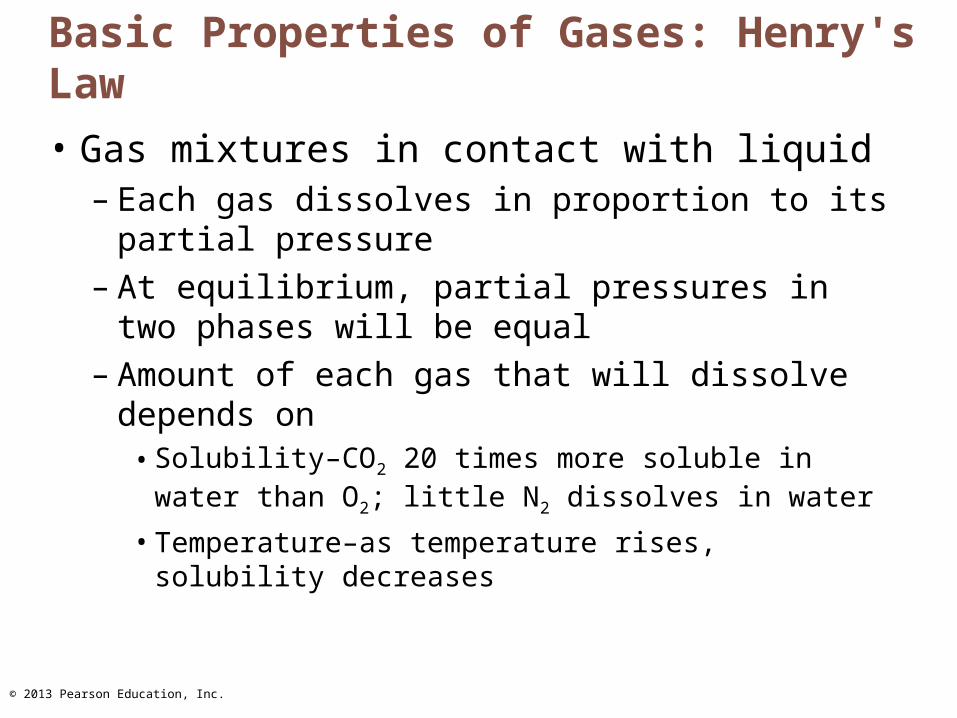
Basic Properties of Gases: Henry's Law
• Gas mixtures in contact with liquid– Each gas dissolves in proportion to its partial
pressure– At equilibrium, partial pressures in two phases
will be equal– Amount of each gas that will dissolve
depends on • Solubility–CO2 20 times more soluble in water than
O2; little N2 dissolves in water
• Temperature–as temperature rises, solubility decreases

© 2013 Pearson Education, Inc.
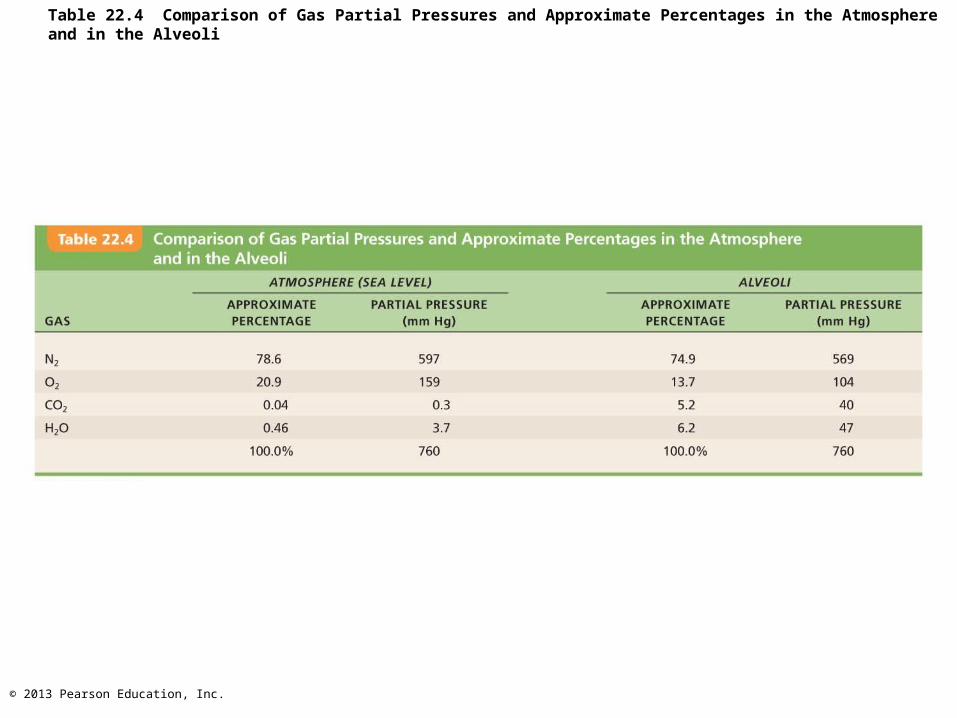
Composition of Alveolar Gas
• Alveoli contain more CO2 and water vapor than atmospheric air– Gas exchanges in lungs– Humidification of air – Mixing of alveolar gas with each breath
© 2013 Pearson Education, Inc.
Table 22.4 Comparison of Gas Partial Pressures and Approximate Percentages in the Atmosphere and in the Alveoli

© 2013 Pearson Education, Inc.
External Respiration
• Exchange of O2 and CO2 across respiratory membrane
• Influenced by– Thickness and surface area of respiratory
membrane– Partial pressure gradients and gas solubilities– Ventilation-perfusion coupling
© 2013 Pearson Education, Inc.
Thickness and Surface Area of the Respiratory Membrane
• Respiratory membranes– 0.5 to 1 m thick– Large total surface area (40 times that of skin)
for gas exchange
• Thicken if lungs become waterlogged and edematous gas exchange inadequate
• Reduced surface area in emphysema (walls of adjacent alveoli break down), tumors, inflammation, mucus
© 2013 Pearson Education, Inc.
Partial Pressure Gradients and Gas Solubilities
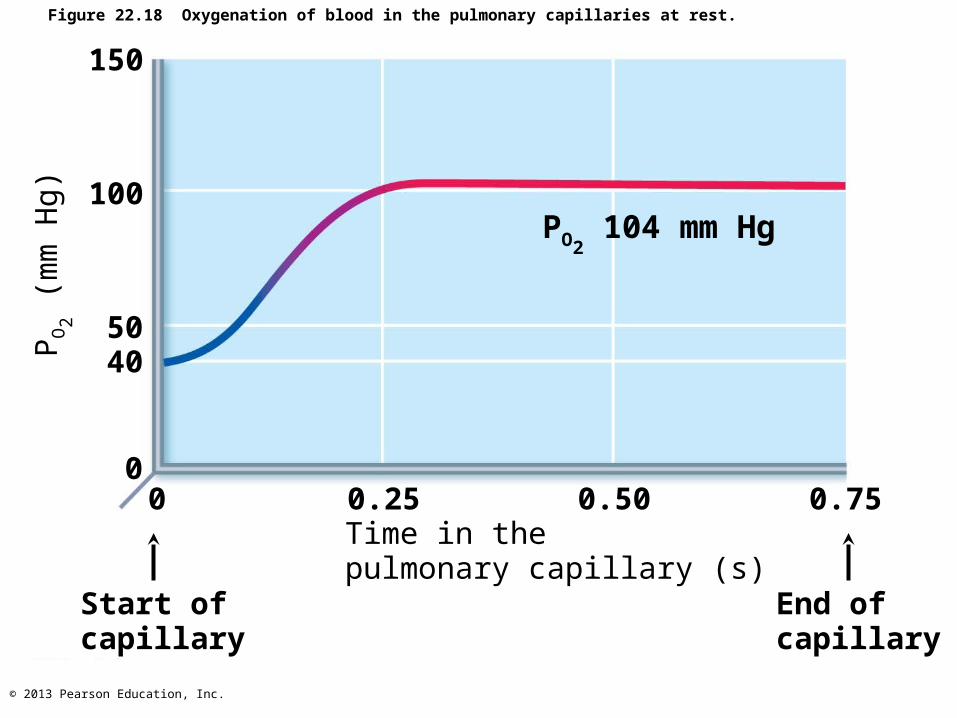
• Steep partial pressure gradient for O2 in lungs– Venous blood Po2 = 40 mm Hg
– Alveolar Po2 = 104 mm Hg• Drives oxygen flow to blood• Equilibrium reached across respiratory membrane
in ~0.25 seconds, about 1/3 time a red blood cell in pulmonary capillary
– Adequate oxygenation even if blood flow increases 3X
© 2013 Pearson Education, Inc.
Figure 22.18 Oxygenation of blood in the pulmonary capillaries at rest.
150
100
5040
00 0.25 0.50 0.75
PO2 104 mm Hg
Time in the pulmonary capillary (s)
End ofcapillary
Start ofcapillary
PO
2 (
mm
Hg
)
© 2013 Pearson Education, Inc.
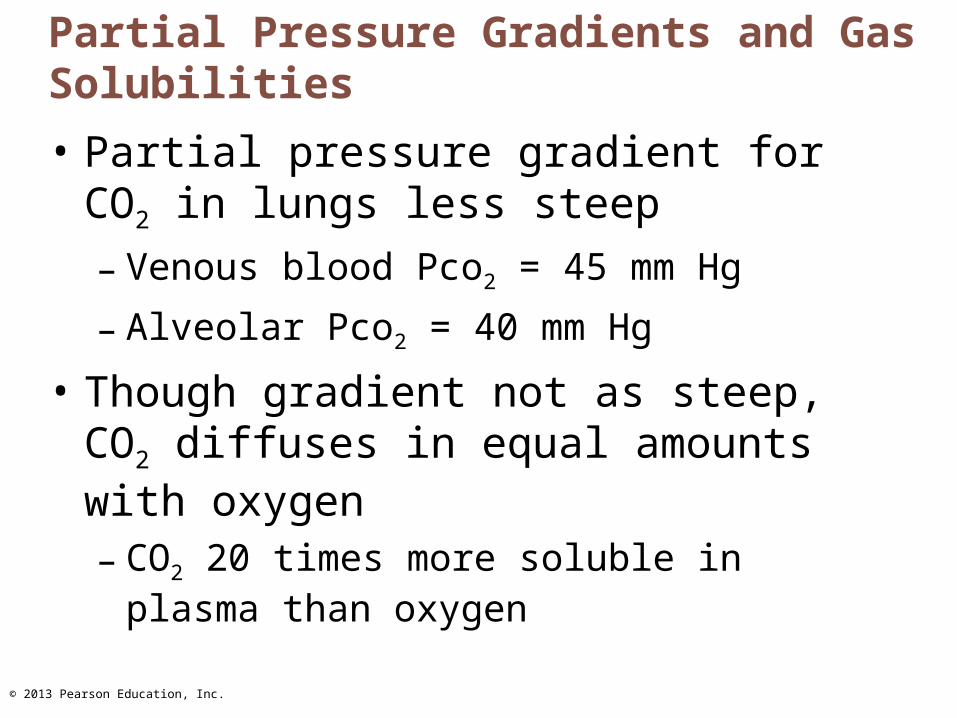
Partial Pressure Gradients and Gas Solubilities
• Partial pressure gradient for CO2 in lungs less steep– Venous blood Pco2 = 45 mm Hg
– Alveolar Pco2 = 40 mm Hg
• Though gradient not as steep, CO2 diffuses in equal amounts with oxygen – CO2 20 times more soluble in plasma than
oxygen
© 2013 Pearson Education, Inc.
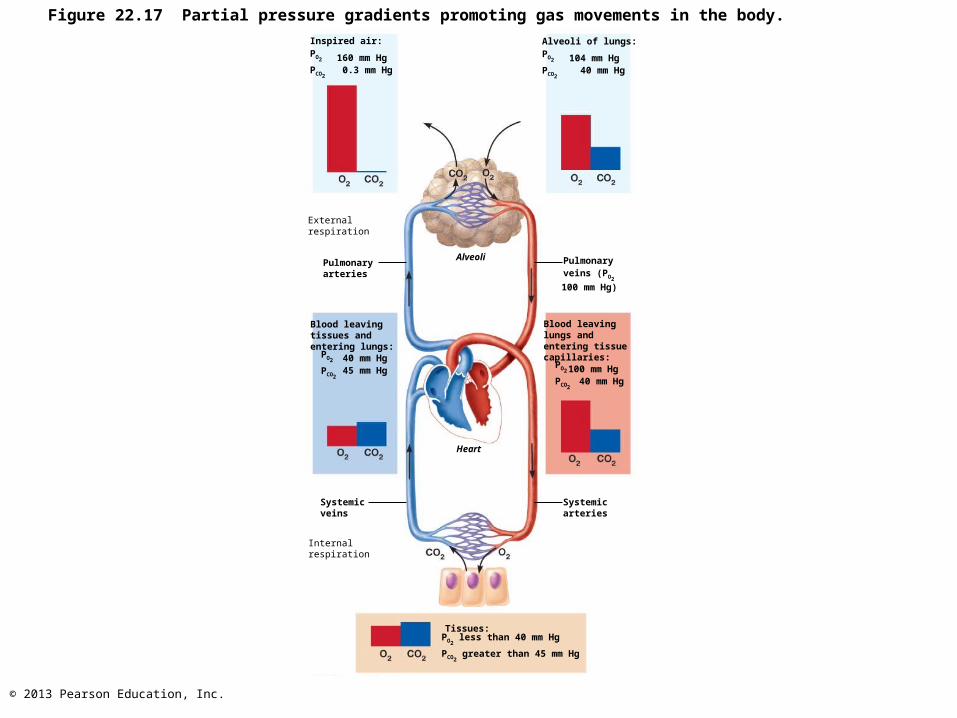
Figure 22.17 Partial pressure gradients promoting gas movements in the body.
Inspired air:PO2
PCO2
160 mm Hg 0.3 mm Hg
Alveoli of lungs:PO2
PCO2
104 mm Hg 40 mm Hg
Externalrespiration
Pulmonaryarteries
Alveoli Pulmonaryveins (PO2
100 mm Hg)
Blood leavingtissues andentering lungs:PO2
PCO2
40 mm Hg45 mm Hg
Blood leavinglungs andentering tissuecapillaries:PO2
PCO2
100 mm Hg 40 mm Hg
Systemicveins
Systemicarteries
Internalrespiration
Tissues:PO2
less than 40 mm Hg
PCO2 greater than 45 mm Hg
Heart
© 2013 Pearson Education, Inc.
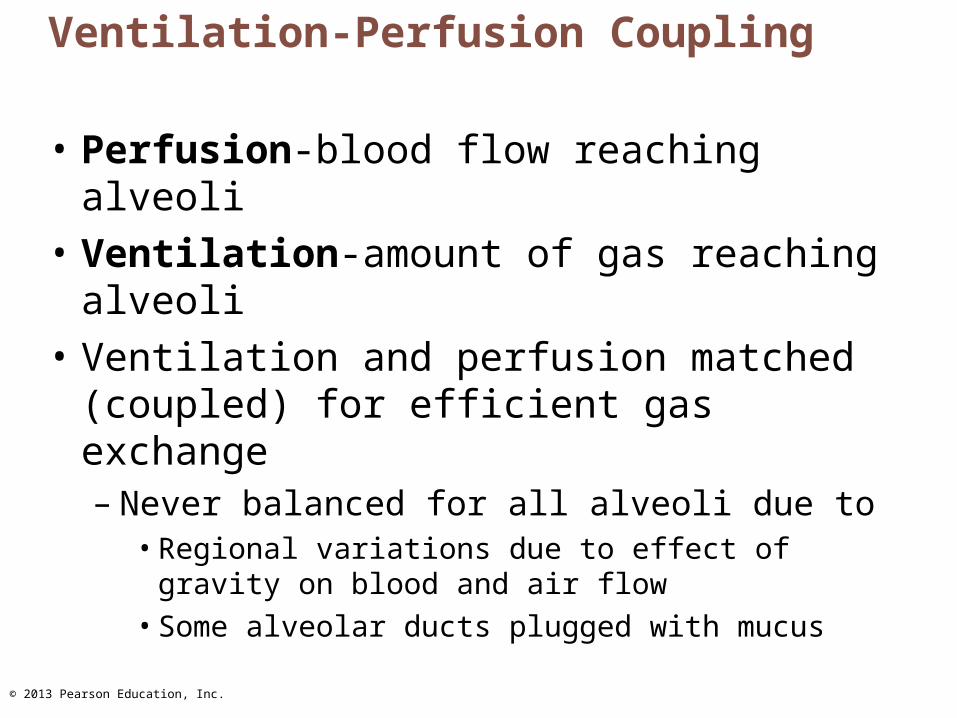
Ventilation-Perfusion Coupling
• Perfusion-blood flow reaching alveoli
• Ventilation-amount of gas reaching alveoli
• Ventilation and perfusion matched (coupled) for efficient gas exchange– Never balanced for all alveoli due to
• Regional variations due to effect of gravity on blood and air flow
• Some alveolar ducts plugged with mucus
© 2013 Pearson Education, Inc.
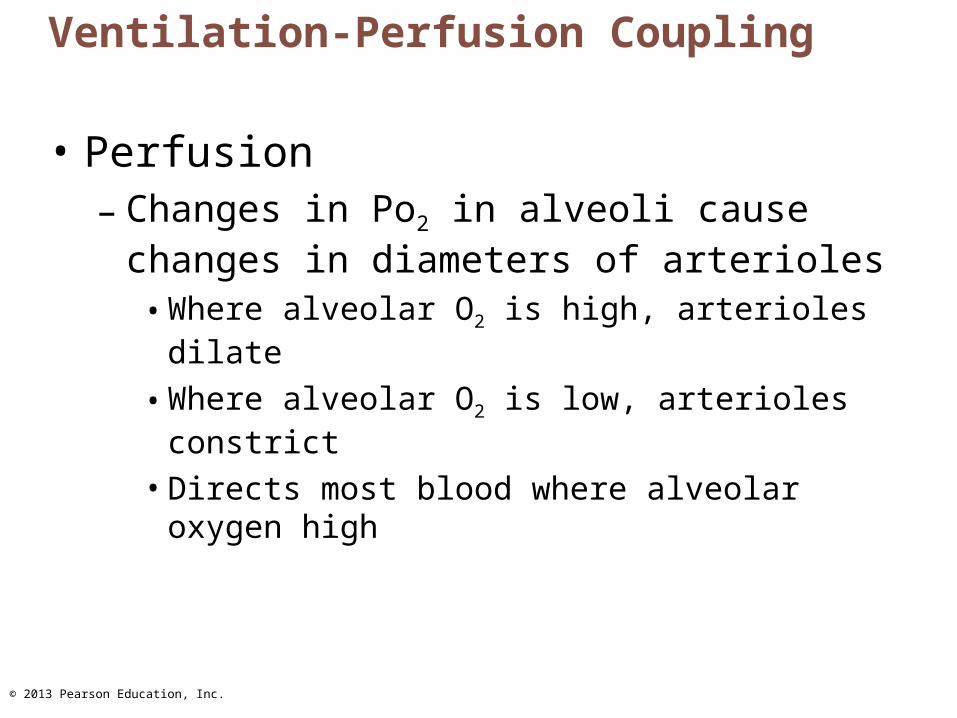
Ventilation-Perfusion Coupling
• Perfusion– Changes in Po2 in alveoli cause changes in
diameters of arterioles• Where alveolar O2 is high, arterioles dilate
• Where alveolar O2 is low, arterioles constrict
• Directs most blood where alveolar oxygen high

© 2013 Pearson Education, Inc.
Ventilation-Perfusion Coupling
• Changes in Pco2 in alveoli cause changes in diameters of bronchioles– Where alveolar CO2 is high, bronchioles dilate
– Where alveolar CO2 is low, bronchioles constrict
– Allows elimination of CO2 more rapidly
© 2013 Pearson Education, Inc.
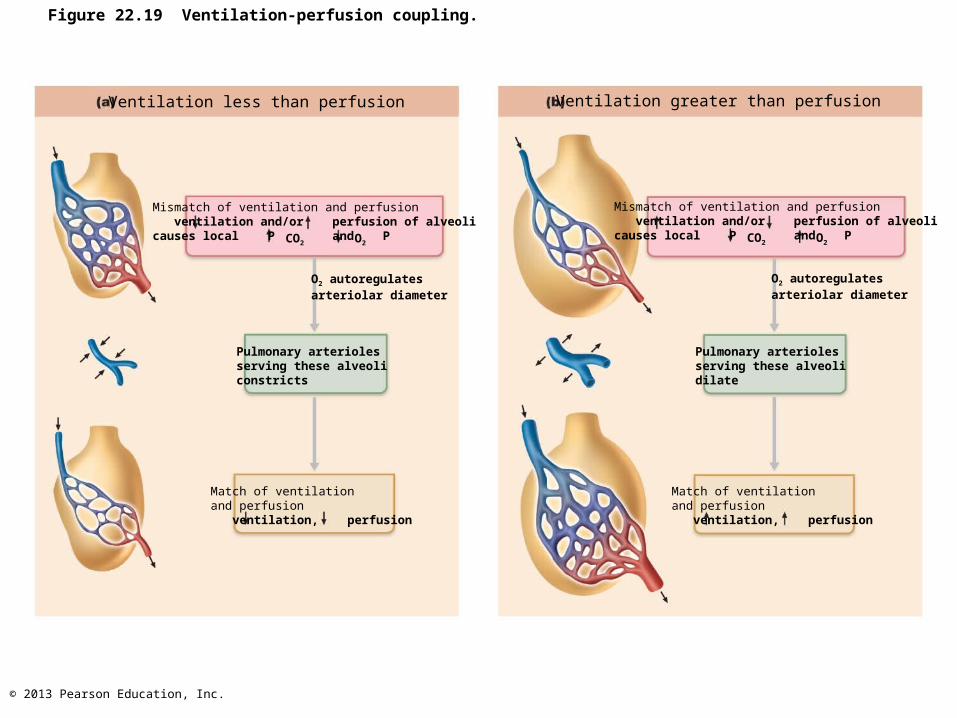
Figure 22.19 Ventilation-perfusion coupling.
Ventilation less than perfusion Ventilation greater than perfusion
Mismatch of ventilation and perfusion ventilation and/or perfusion of alveolicauses local P and PCO2 O2
Mismatch of ventilation and perfusion ventilation and/or perfusion of alveolicauses local P and PCO2 O2
O2 autoregulatesarteriolar diameter
O2 autoregulatesarteriolar diameter
Pulmonary arteriolesserving these alveoliconstricts
Pulmonary arteriolesserving these alveolidilate
Match of ventilationand perfusion ventilation, perfusion
Match of ventilationand perfusion ventilation, perfusion
© 2013 Pearson Education, Inc.
Internal Respiration
• Capillary gas exchange in body tissues
• Partial pressures and diffusion gradients reversed compared to external respiration– Tissue Po2 always lower than in systemic
arterial blood oxygen from blood to tissues
– CO2 from tissues to blood
– Venous blood Po2 40 mm Hg and Pco2 45 mm Hg

© 2013 Pearson Education, Inc.
Figure 22.17 Partial pressure gradients promoting gas movements in the body.
Inspired air:PO2
PCO2
160 mm Hg 0.3 mm Hg
Alveoli of lungs:PO2
PCO2
104 mm Hg 40 mm Hg
Externalrespiration
Pulmonaryarteries
Alveoli Pulmonaryveins (PO2
100 mm Hg)
Blood leavingtissues andentering lungs:PO2
PCO2
40 mm Hg45 mm Hg
Blood leavinglungs andentering tissuecapillaries:PO2
PCO2
100 mm Hg 40 mm Hg
Systemicveins
Systemicarteries
Internalrespiration
Tissues:PO2
less than 40 mm Hg
PCO2 greater than 45 mm Hg
Heart

© 2013 Pearson Education, Inc.
Transport of Respiratory Gases by Blood
• Oxygen (O2) transport
• Carbon dioxide (CO2) transport

© 2013 Pearson Education, Inc.
O2 Transport
• Molecular O2 carried in blood
– 1.5% dissolved in plasma– 98.5% loosely bound to each Fe of
hemoglobin (Hb) in RBCs• 4 O2 per Hb
© 2013 Pearson Education, Inc.
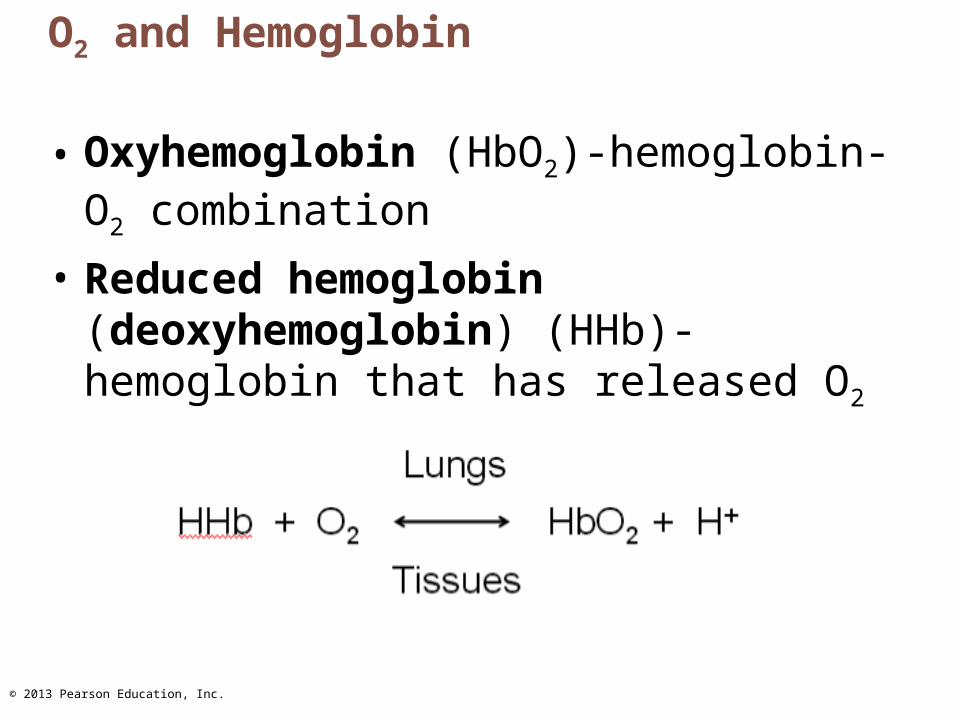
O2 and Hemoglobin
• Oxyhemoglobin (HbO2)-hemoglobin-O2 combination
• Reduced hemoglobin (deoxyhemoglobin) (HHb)-hemoglobin that has released O2

© 2013 Pearson Education, Inc.
O2 and Hemoglobin
• Loading and unloading of O2 facilitated by change in shape of Hb – As O2 binds, Hb affinity for O2 increases
– As O2 is released, Hb affinity for O2 decreases
• Fully saturated (100%) if all four heme groups carry O2
• Partially saturated when one to three hemes carry O2

© 2013 Pearson Education, Inc.
O2 and Hemoglobin
• Rate of loading and unloading of O2 regulated to ensure adequate oxygen delivery to cells– Po2
– Temperature– Blood pH
– Pco2
– Concentration of BPG–produced by RBCs during glycolysis; levels rise when oxygen levels chronically low
© 2013 Pearson Education, Inc.
Influence of Po2 on Hemoglobin Saturation
• Oxygen-hemoglobin dissociation curve
• Hemoglobin saturation plotted against Po2 not linear; S-shaped curve – Binding and release of O2 influenced by Po2

© 2013 Pearson Education, Inc.
Figure 22.20 The amount of oxygen carried by hemoglobin depends on the PO2 (the amount of oxygen) available
locally. (1 of 3)
This axis tells you how muchO2 is bound to Hb. At 100%,
each Hb molecule has 4 boundoxygen molecules.
In the lungs, where PO2 is high
(100 mm Hg), Hb is almostfully saturated (98%) with O2.
If more O2 is present,
more O2 is bound.
However, because ofHb’s properties (O2
binding strengthchanges with saturation),this is an S-shaped curve,not a straight line.
Hemoglobin
Oxygen
100
80
60
40
20
0
0 20 40 60 80 100
Perc
en
t O
2 s
atu
rati
on
of
hem
og
lob
in
P (mm Hg)
This axis tells you the relativeAmount (partial pressure) ofO2 disslolved in the fluid
Surrounding the Hb. In the tissues of other organs,
Where PO2 is low (40 mm Hg), Hb
is less saturated (75%) with O2.
•
•
O2

© 2013 Pearson Education, Inc.
Influence of Po2 on Hemoglobin Saturation
• In arterial blood– Po2 = 100 mm Hg
– Contains 20 ml oxygen per 100 ml blood (20 vol %)
– Hb is 98% saturated
• Further increases in Po2 (e.g., breathing deeply) produce minimal increases in O2 binding
© 2013 Pearson Education, Inc.
Influence of Po2 on Hemoglobin Saturation
• In venous blood– Po2 = 40 mm Hg
– Contains 15 vol % oxygen – Hb is 75% saturated– Venous reserve
• Oxygen remaining in venous blood

© 2013 Pearson Education, Inc.
Figure 22.20 The amount of oxygen carried by hemoglobin depends on the PO2 (the amount of oxygen) available
locally. (2 of 3)
In the lungs
100
80
60
40
20
00 20 40 60 80
Perc
en
t O
2 s
atu
rati
on
of
hem
og
lob
in
100PO2
(mm Hg)
At high PO2, large changes in PO2
cause only
small changes in Hb saturation. Notice that thecurve is relatively flat here. Hb’s propertiesproduce a safety margin that ensures that Hb is
almost fully saturated even with a substantial PO2
decrease. As a result, Hb remains saturated evenat high altitude or with lung disease.
At high altitude, there is less O2.
At a PO2 in the lungs of only 80
mm Hg, Hb is still 95% saturated.
At sea level, there is lots of O2.
At a PO2 in the lungs of 100 mm Hg,
Hb is 98% saturated.
98%
95%
© 2013 Pearson Education, Inc.
Other Factors Influencing Hemoglobin Saturation
• Increases in temperature, H+, Pco2, and BPG– Modify structure of hemoglobin; decrease its
affinity for O2
– Occur in systemic capillaries– Enhance O2 unloading from blood – Shift O2-hemoglobin dissociation curve to right
• Decreases in these factors shift curve to left– Decreases oxygen unloading from blood

© 2013 Pearson Education, Inc.
Figure 22.21 Effect of temperature, PCO2, and blood pH on the oxygen-hemoglobin dissociation curve.
Perc
en
t O
2 s
atu
rati
on
of
hem
og
lob
inPerc
en
t O
2 s
atu
rati
on
of
hem
og
lob
in
10ºC
20ºC38ºC
43ºC
0
20
40
60
80
100
0
20
40
60
80
100
Normal bodytemperature
Decreased carbon dioxide(PCO2
20 mm Hg) or H+ (pH 7.6)
Normal arterialcarbon dioxide(PCO2
40 mm Hg)
or H+ (pH 7.4)
Increased carbon dioxide
(PCO2 80 mm Hg)
or H+ (pH 7.2)
20 40 60 80 100P (mm Hg)O2
(a)
(b)

© 2013 Pearson Education, Inc.
Factors that Increase Release of O2 by Hemoglobin
• As cells metabolize glucose and use O2
– Pco2 and H+ increase in capillary blood
– Declining blood pH and increasing Pco2 • Bohr effect - Hb-O2 bond weakens oxygen
unloading where needed most
– Heat production increases directly and indirectly decreases Hb affinity for O2 increased oxygen unloading to active tissues

© 2013 Pearson Education, Inc.
Homeostatic Imbalance
• Hypoxia– Inadequate O2 delivery to tissues cyanosis
– Anemic hypoxia–too few RBCs; abnormal or too little Hb
– Ischemic hypoxia–impaired/blocked circulation
– Histotoxic hypoxia–cells unable to use O2, as in metabolic poisons
– Hypoxemic hypoxia–abnormal ventilation; pulmonary disease
– Carbon monoxide poisoning–especially from fire; 200X greater affinity for Hb than oxygen

© 2013 Pearson Education, Inc.
CO2 Transport
• CO2 transported in blood in three forms
– 7 to 10% dissolved in plasma – 20% bound to globin of hemoglobin
(carbaminohemoglobin)– 70% transported as bicarbonate ions
(HCO3–) in plasma
© 2013 Pearson Education, Inc.
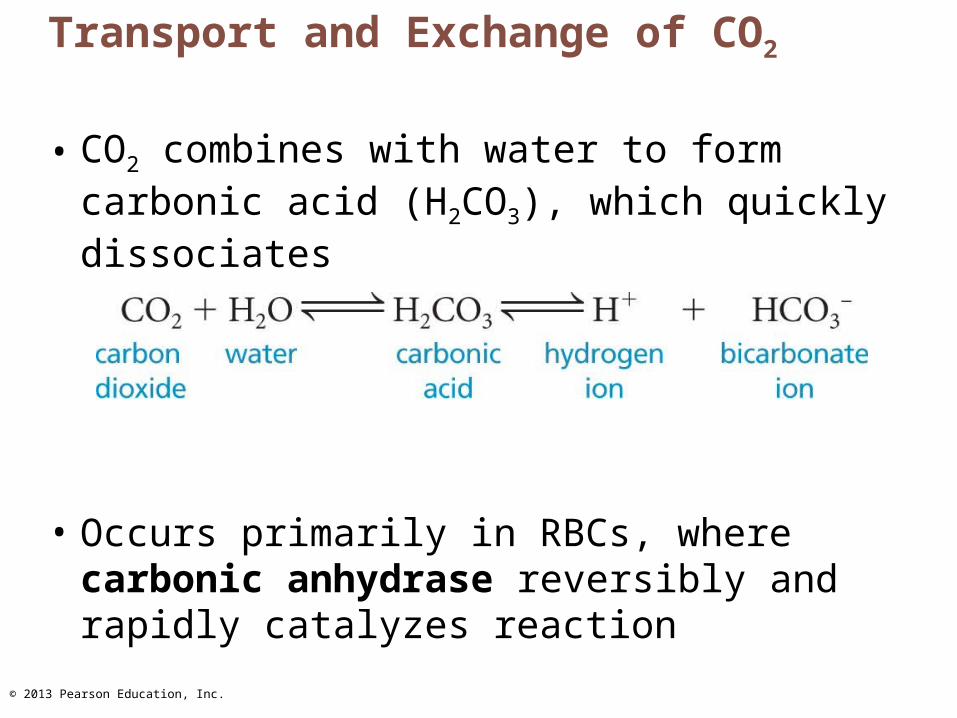
Transport and Exchange of CO2
• CO2 combines with water to form carbonic acid (H2CO3), which quickly dissociates
• Occurs primarily in RBCs, where carbonic anhydrase reversibly and rapidly catalyzes reaction
© 2013 Pearson Education, Inc.
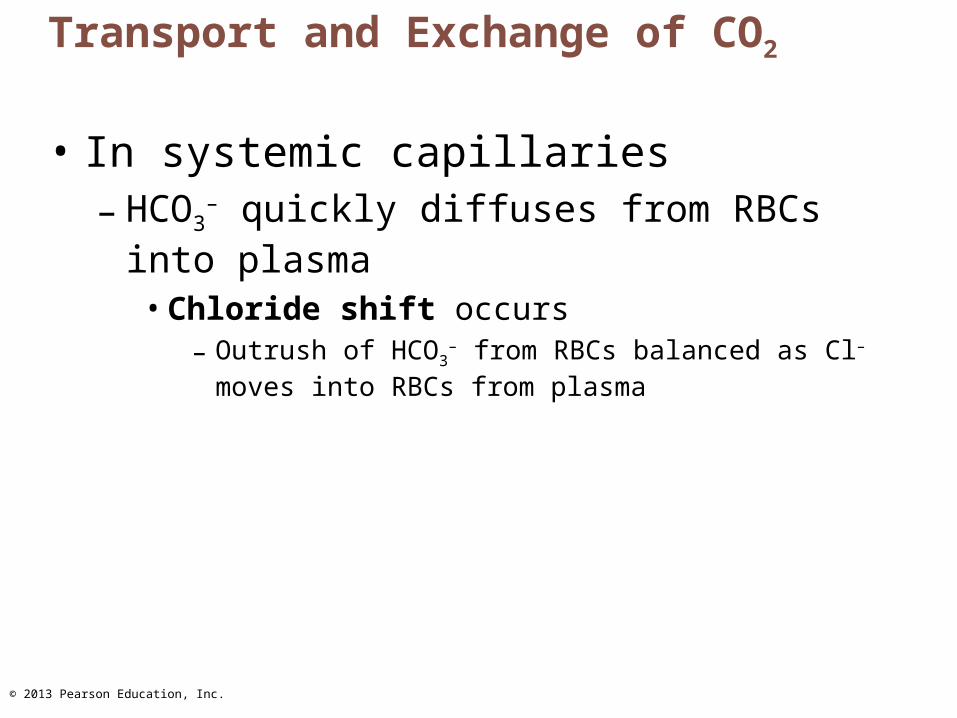
Transport and Exchange of CO2
• In systemic capillaries– HCO3
– quickly diffuses from RBCs into plasma• Chloride shift occurs
– Outrush of HCO3– from RBCs balanced as Cl– moves into
RBCs from plasma
© 2013 Pearson Education, Inc.
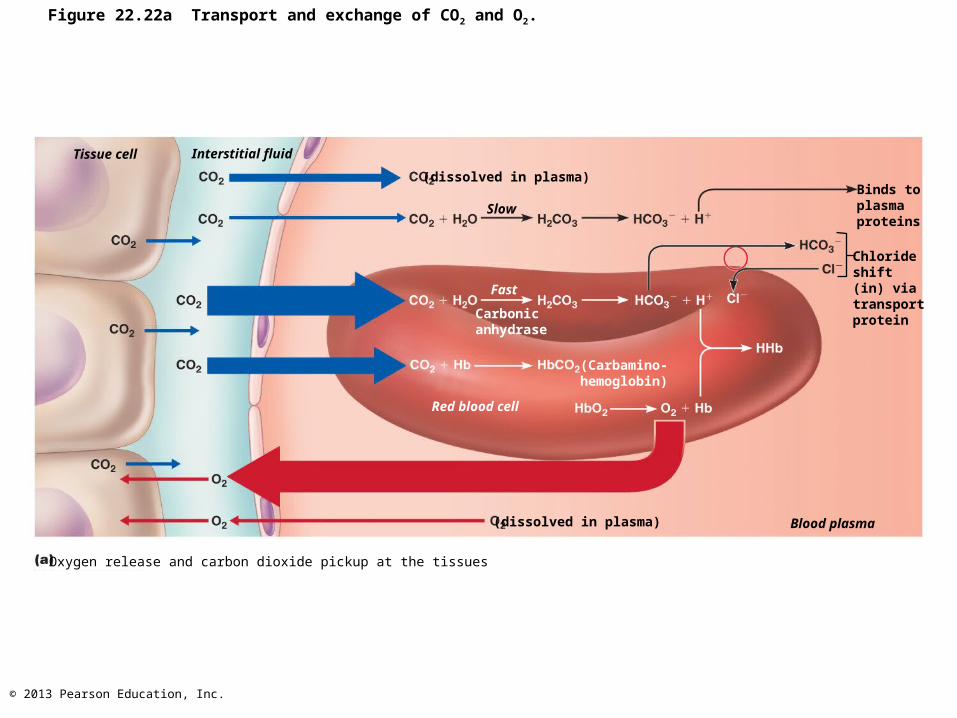
Figure 22.22a Transport and exchange of CO2 and O2.
Tissue cell Interstitial fluid
(dissolved in plasma)
Binds toplasmaproteins
Chlorideshift(in) viatransportprotein
Blood plasma
(dissolved in plasma)
Slow
Carbonicanhydrase
(Carbamino-hemoglobin)
Red blood cell
Fast
Oxygen release and carbon dioxide pickup at the tissues
© 2013 Pearson Education, Inc.
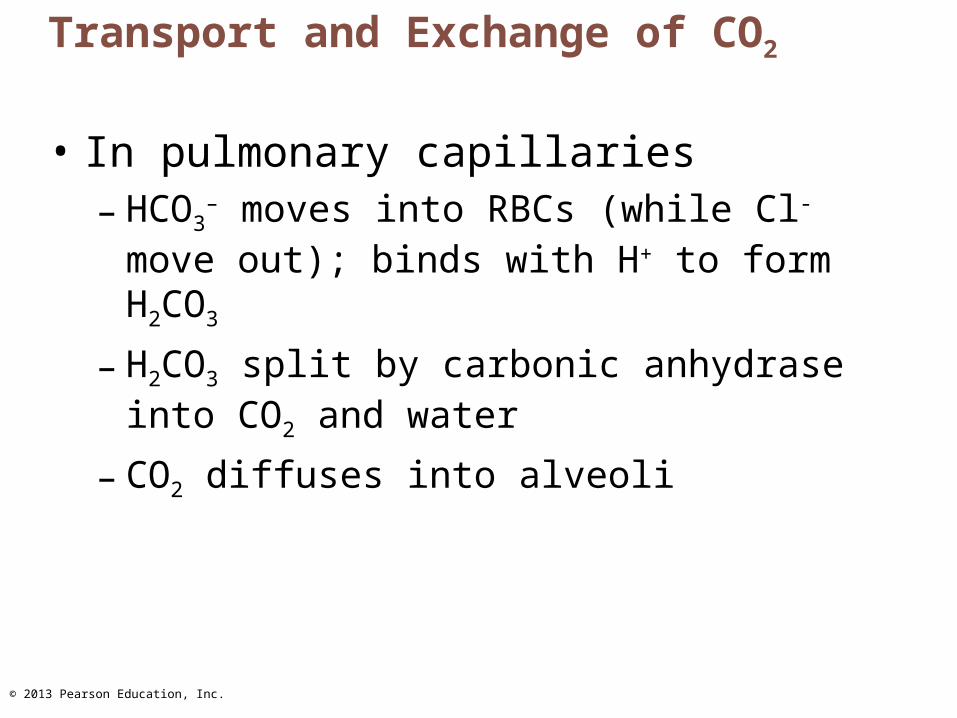
Transport and Exchange of CO2
• In pulmonary capillaries– HCO3
– moves into RBCs (while Cl- move out); binds with H+ to form H2CO3
– H2CO3 split by carbonic anhydrase into CO2 and water
– CO2 diffuses into alveoli

© 2013 Pearson Education, Inc.
Figure 22.22b Transport and exchange of CO2 and O2.
Fused basement membranesAlveolus
(dissolved in plasma)
Chlorideshift(out) viatransportprotein
Blood plasma(dissolved in plasma)
(Carbamino-hemoglobin)
Red blood cell
Carbonicanhydrase
Fast
Slow
Oxygen pickup and carbon dioxide release in the lungs

© 2013 Pearson Education, Inc.
Haldane Effect
• Amount of CO2 transported affected by Po2
– Reduced hemoglobin (less oxygen saturation) forms carbaminohemoglobin and buffers H+ more easily
– Lower Po2 and hemoglobin saturation with O2; more CO2 carried in blood
• Encourages CO2 exchange in tissues and lungs
© 2013 Pearson Education, Inc.
Haldane Effect
• At tissues, as more CO2 enters blood
– More oxygen dissociates from hemoglobin (Bohr effect)
– As HbO2 releases O2, it more readily forms bonds with CO2 to form carbaminohemoglobin
© 2013 Pearson Education, Inc.
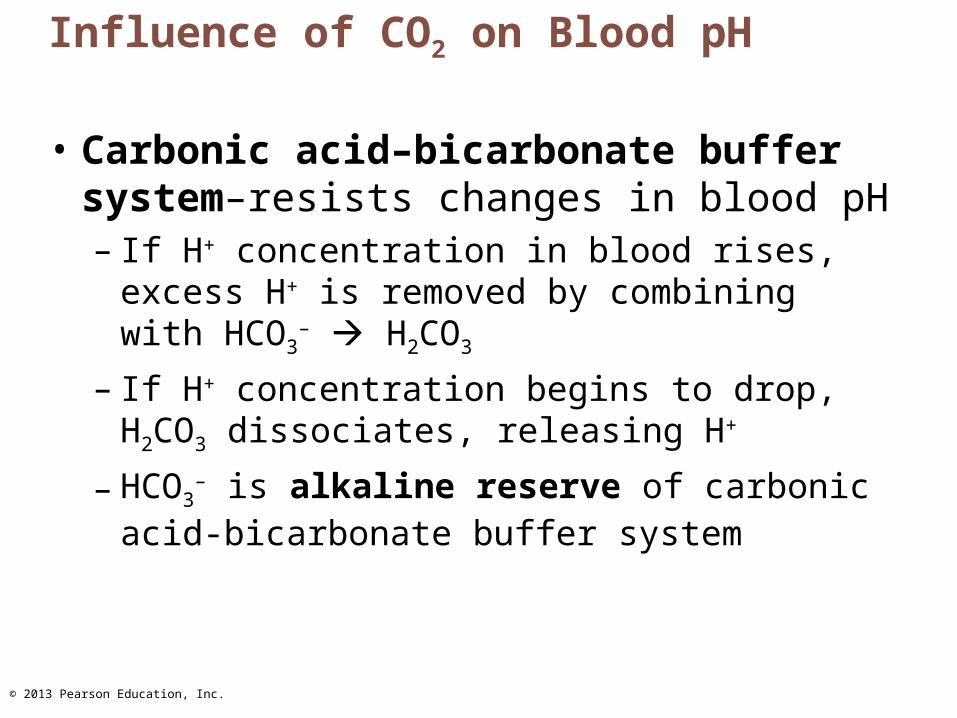
Influence of CO2 on Blood pH
• Carbonic acid–bicarbonate buffer system–resists changes in blood pH– If H+ concentration in blood rises, excess H+ is
removed by combining with HCO3– H2CO3
– If H+ concentration begins to drop, H2CO3 dissociates, releasing H+
– HCO3– is alkaline reserve of carbonic acid-
bicarbonate buffer system
© 2013 Pearson Education, Inc.
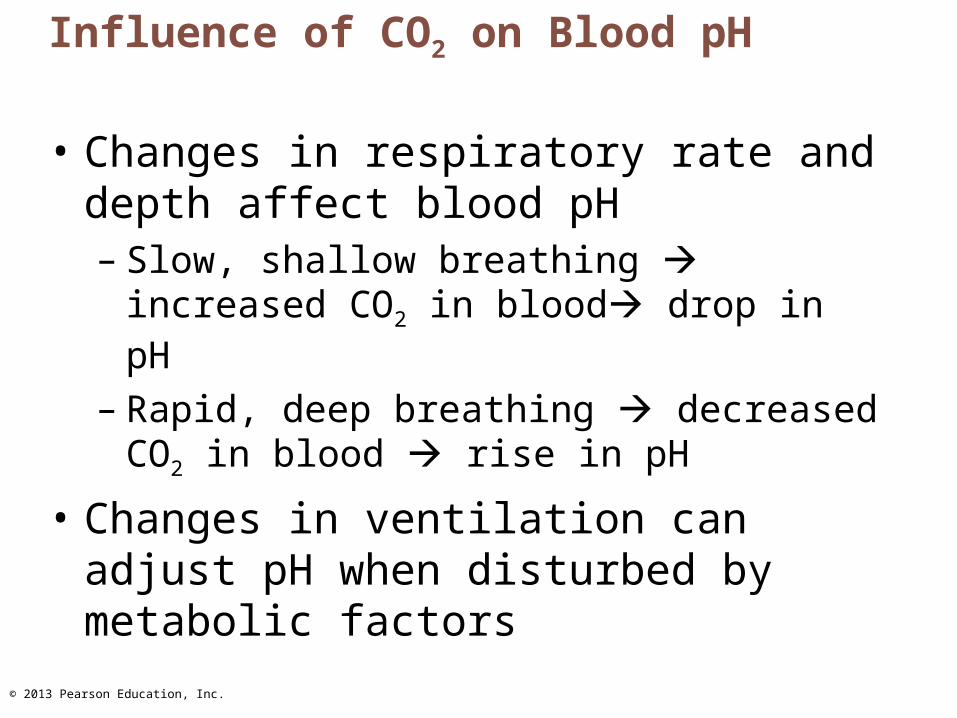
Influence of CO2 on Blood pH
• Changes in respiratory rate and depth affect blood pH– Slow, shallow breathing increased CO2 in
blood drop in pH
– Rapid, deep breathing decreased CO2 in blood rise in pH
• Changes in ventilation can adjust pH when disturbed by metabolic factors
© 2013 Pearson Education, Inc.
Control of Respiration
• Involves higher brain centers, chemoreceptors, and other reflexes
• Neural controls– Neurons in reticular formation of medulla and
pons– Clustered neurons in medulla important
• Ventral respiratory group• Dorsal respiratory group

© 2013 Pearson Education, Inc.
Medullary Respiratory Centers
• Ventral respiratory group (VRG)– Rhythm-generating and integrative center– Sets eupnea (12–15 breaths/minute)
• Normal respiratory rate and rhythm
– Its inspiratory neurons excite inspiratory muscles via phrenic (diaphragm) and intercostal nerves (external intercostals)
– Expiratory neurons inhibit inspiratory neurons
© 2013 Pearson Education, Inc.
Medullary Respiratory Centers
• Dorsal respiratory group (DRG)– Near root of cranial nerve IX – Integrates input from peripheral stretch and
chemoreceptors; sends information VRG
© 2013 Pearson Education, Inc.
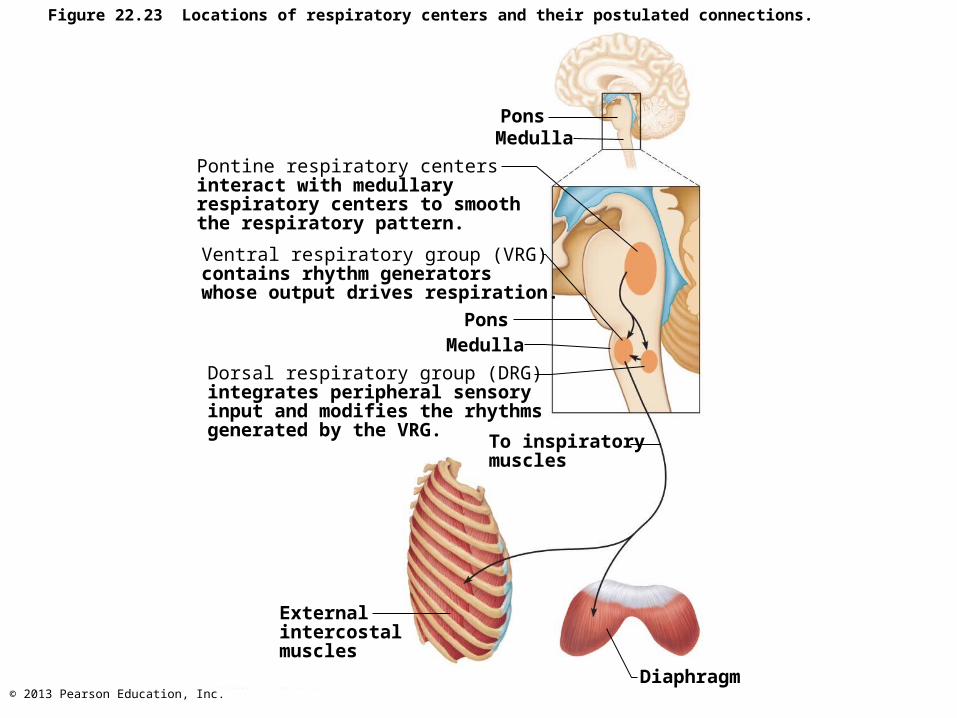
Figure 22.23 Locations of respiratory centers and their postulated connections.
PonsMedulla
Pontine respiratory centersinteract with medullaryrespiratory centers to smooththe respiratory pattern.
Ventral respiratory group (VRG)contains rhythm generatorswhose output drives respiration.
Pons
Dorsal respiratory group (DRG)integrates peripheral sensoryinput and modifies the rhythmsgenerated by the VRG.
To inspiratorymuscles
Externalintercostalmuscles
Diaphragm
Medulla
© 2013 Pearson Education, Inc.
Pontine Respiratory Centers
• Influence and modify activity of VRG
• Smooth out transition between inspiration and expiration and vice versa
• Transmit impulses to VRG modify and fine-tune breathing rhythms during vocalization, sleep, exercise
© 2013 Pearson Education, Inc.
Generation of the Respiratory Rhythm
• Not well understood
• One hypothesis– Pacemaker neurons with intrinsic rhythmicity
• Most widely accepted hypothesis– Reciprocal inhibition of two sets of
interconnected pacemaker neurons in medulla that generate rhythm
© 2013 Pearson Education, Inc.
Factors influencing Breathing Rate and Depth
• Depth determined by how actively respiratory center stimulates respiratory muscles
• Rate determined by how long inspiratory center active
• Both modified in response to changing body demands– Most important are changing levels of CO2,
O2, and H+
– Sensed by central and peripheral chemoreceptors
© 2013 Pearson Education, Inc.
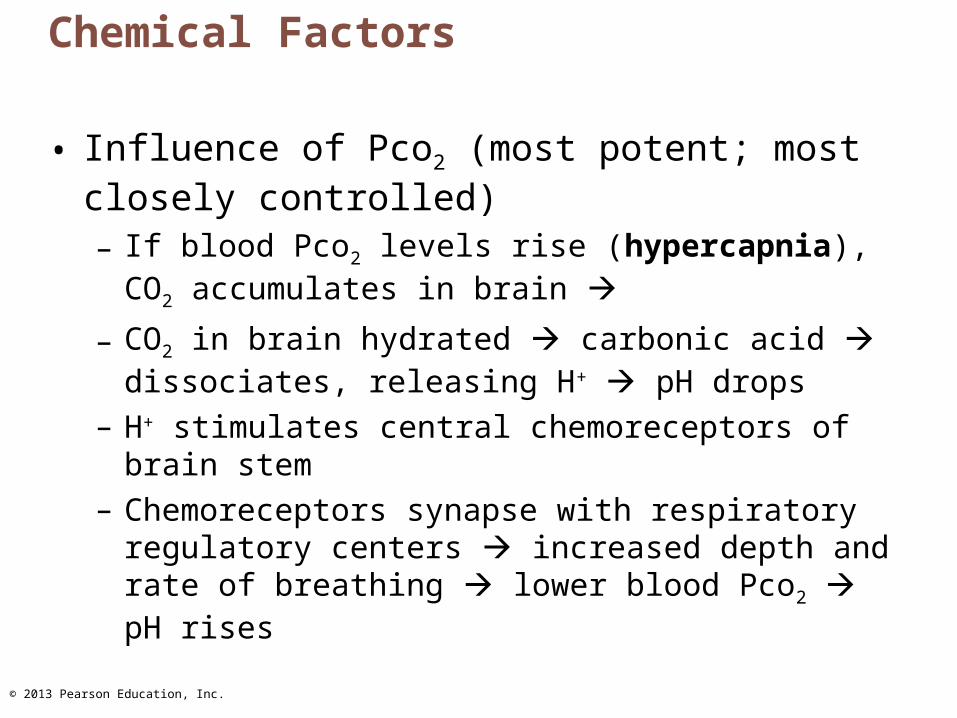
Chemical Factors
• Influence of Pco2 (most potent; most closely controlled)– If blood Pco2 levels rise (hypercapnia), CO2
accumulates in brain
– CO2 in brain hydrated carbonic acid dissociates, releasing H+ pH drops
– H+ stimulates central chemoreceptors of brain stem– Chemoreceptors synapse with respiratory regulatory
centers increased depth and rate of breathing lower blood Pco2 pH rises
© 2013 Pearson Education, Inc.
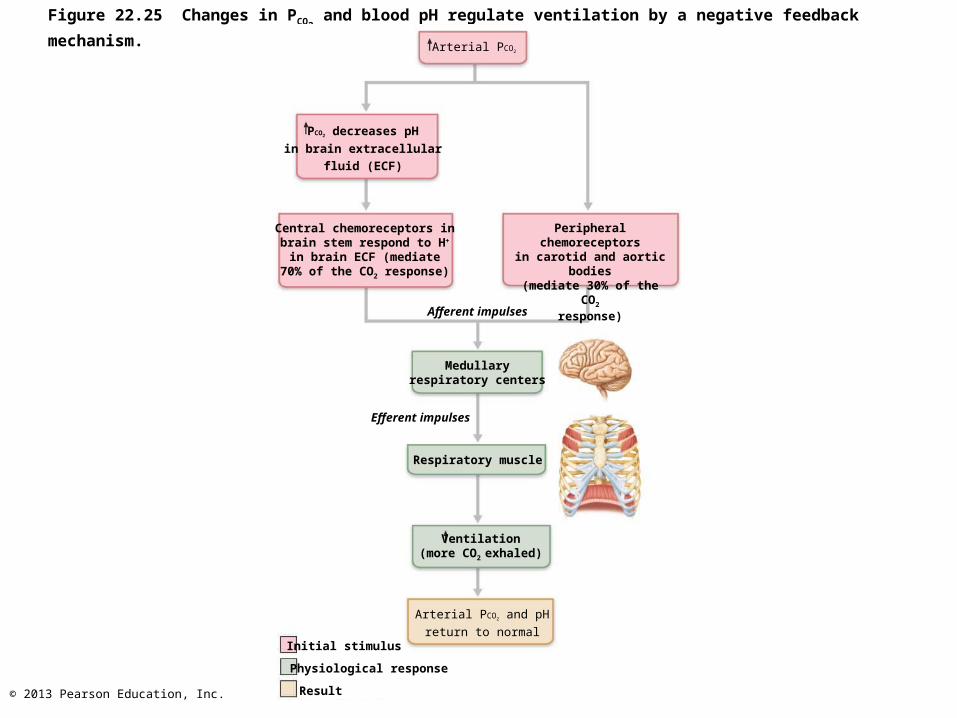
Figure 22.25 Changes in PCO2 and blood pH regulate ventilation by a negative feedback mechanism.
Arterial PCO2
PCO2 decreases pH
in brain extracellular
fluid (ECF)
Central chemoreceptors inbrain stem respond to H+
in brain ECF (mediate70% of the CO2 response)
Peripheral chemoreceptorsin carotid and aortic
bodies(mediate 30% of the CO2
response)
Afferent impulses
Medullaryrespiratory centers
Efferent impulses
Respiratory muscle
Ventilation(more CO2 exhaled)
Arterial PCO2 and pH
return to normalInitial stimulus
Physiological response
Result
© 2013 Pearson Education, Inc.
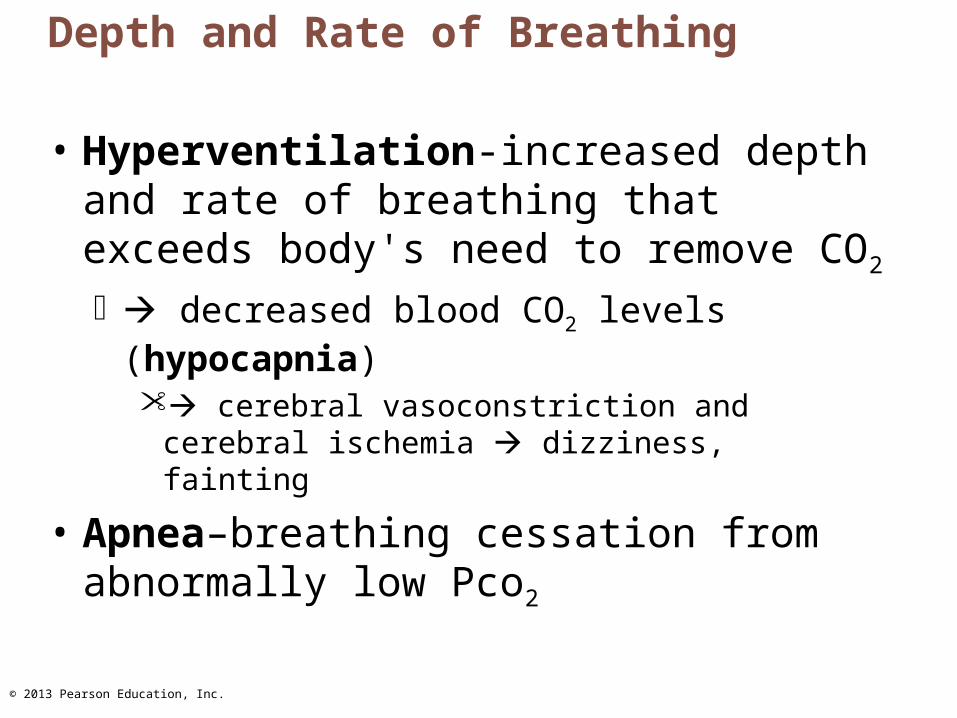
Depth and Rate of Breathing
• Hyperventilation-increased depth and rate of breathing that exceeds body's need to remove CO2
decreased blood CO2 levels (hypocapnia) cerebral vasoconstriction and cerebral ischemia
dizziness, fainting
• Apnea–breathing cessation from abnormally low Pco2
© 2013 Pearson Education, Inc.
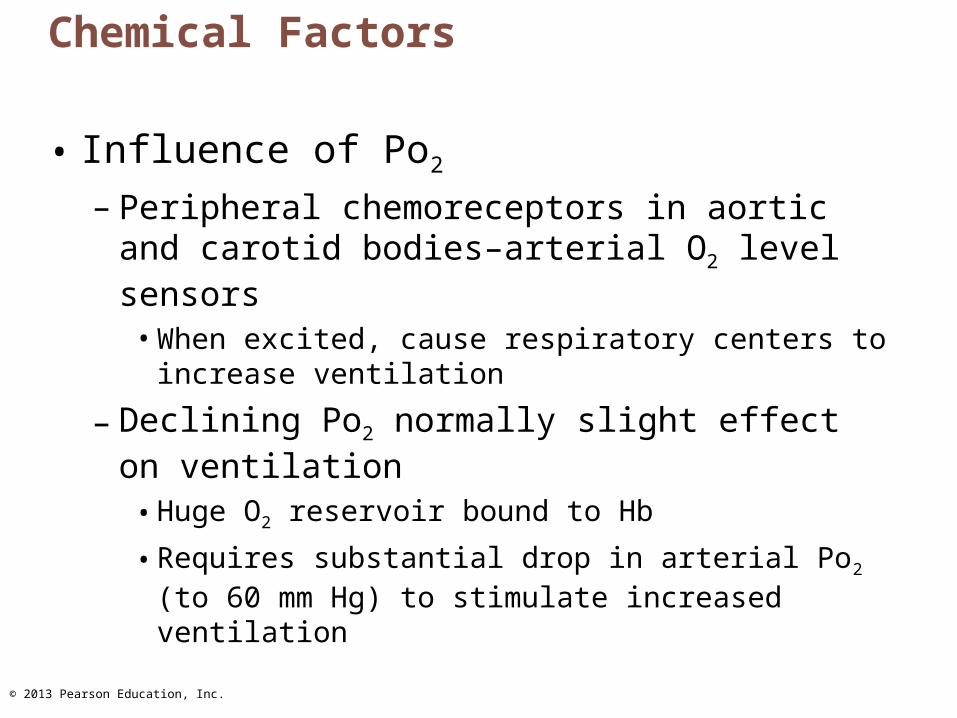
Chemical Factors
• Influence of Po2
– Peripheral chemoreceptors in aortic and carotid bodies–arterial O2 level sensors
• When excited, cause respiratory centers to increase ventilation
– Declining Po2 normally slight effect on ventilation
• Huge O2 reservoir bound to Hb
• Requires substantial drop in arterial Po2 (to 60 mm Hg) to stimulate increased ventilation

© 2013 Pearson Education, Inc.
Figure 22.26 Location and innervation of the peripheral chemoreceptors in the carotid and aortic bodies.
Brain
Sensory nerve fiber in cranial nerve IX(pharyngeal branch of glossopharyngeal)External carotid arteryInternal carotid arteryCarotid bodyCommon carotid arteryCranial nerve X (vagus nerve)
Sensory nerve fiber in cranial nerve X
Aortic bodies in aortic arch
Heart
Aorta
© 2013 Pearson Education, Inc.
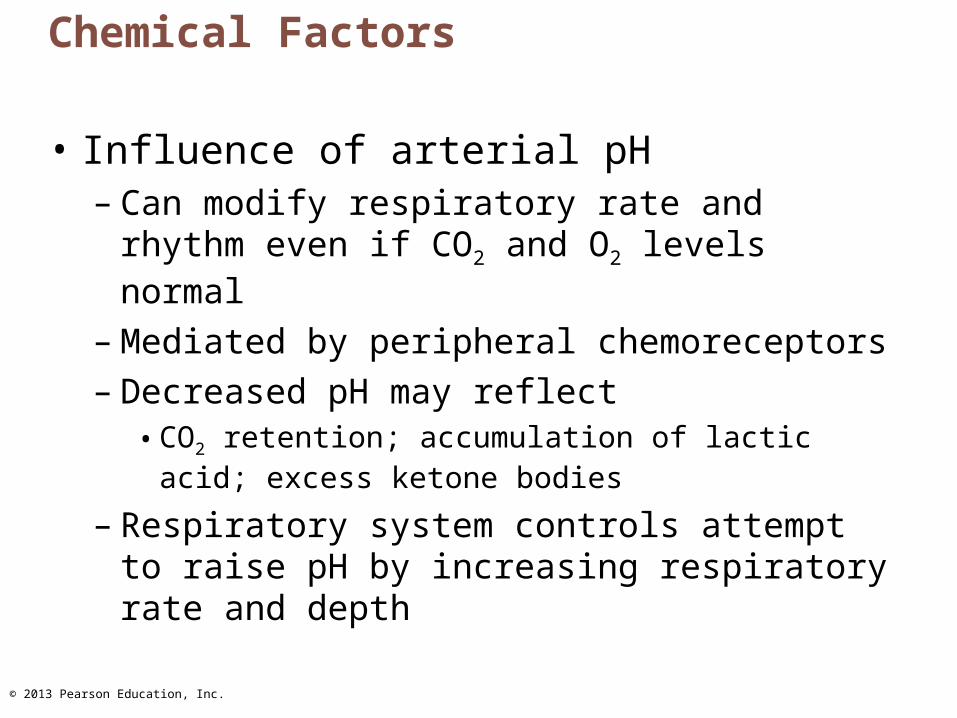
Chemical Factors
• Influence of arterial pH– Can modify respiratory rate and rhythm even
if CO2 and O2 levels normal
– Mediated by peripheral chemoreceptors– Decreased pH may reflect
• CO2 retention; accumulation of lactic acid; excess ketone bodies
– Respiratory system controls attempt to raise pH by increasing respiratory rate and depth

© 2013 Pearson Education, Inc.
Summary of Chemical Factors
• Rising CO2 levels most powerful respiratory stimulant
• Normally blood Po2 affects breathing only indirectly by influencing peripheral chemoreceptor sensitivity to changes in Pco2

© 2013 Pearson Education, Inc.
Summary of Chemical Factors
• When arterial Po2 falls below 60 mm Hg, it becomes major stimulus for respiration (via peripheral chemoreceptors)
• Changes in arterial pH resulting from CO2 retention or metabolic factors act indirectly through peripheral chemoreceptors
© 2013 Pearson Education, Inc.
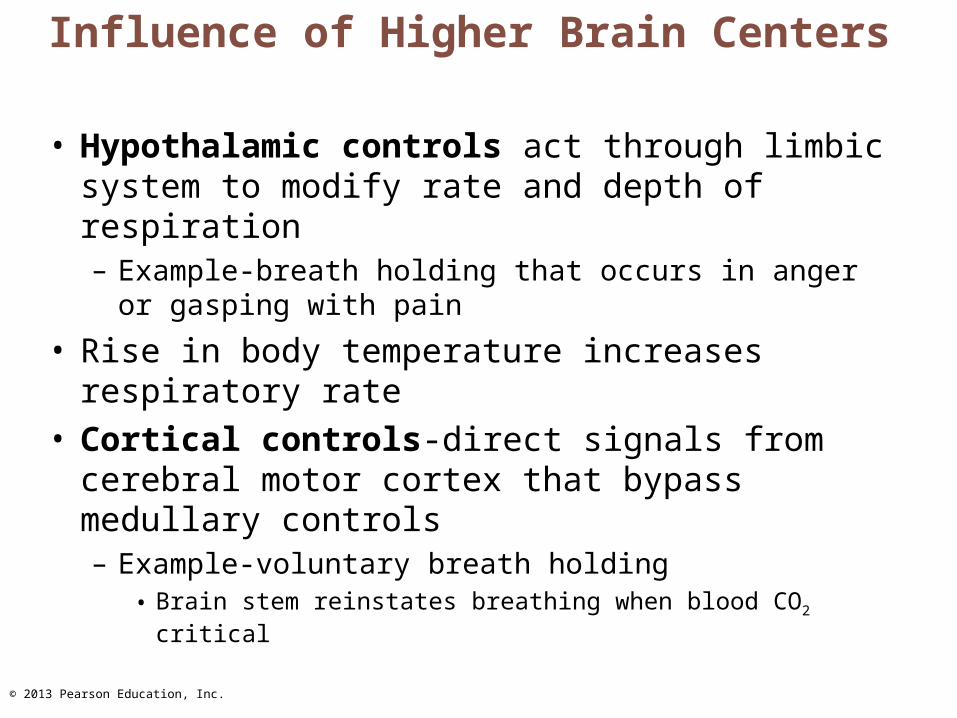
Influence of Higher Brain Centers
• Hypothalamic controls act through limbic system to modify rate and depth of respiration – Example-breath holding that occurs in anger or
gasping with pain
• Rise in body temperature increases respiratory rate
• Cortical controls-direct signals from cerebral motor cortex that bypass medullary controls– Example-voluntary breath holding
• Brain stem reinstates breathing when blood CO2 critical
© 2013 Pearson Education, Inc.
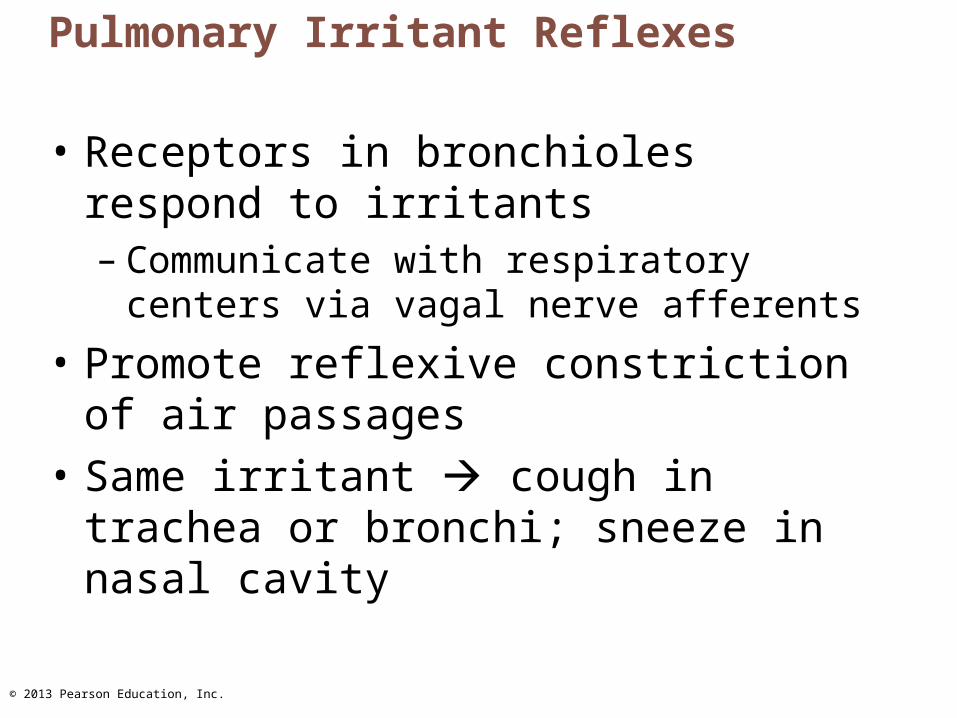
Pulmonary Irritant Reflexes
• Receptors in bronchioles respond to irritants– Communicate with respiratory centers via
vagal nerve afferents
• Promote reflexive constriction of air passages
• Same irritant cough in trachea or bronchi; sneeze in nasal cavity
© 2013 Pearson Education, Inc.
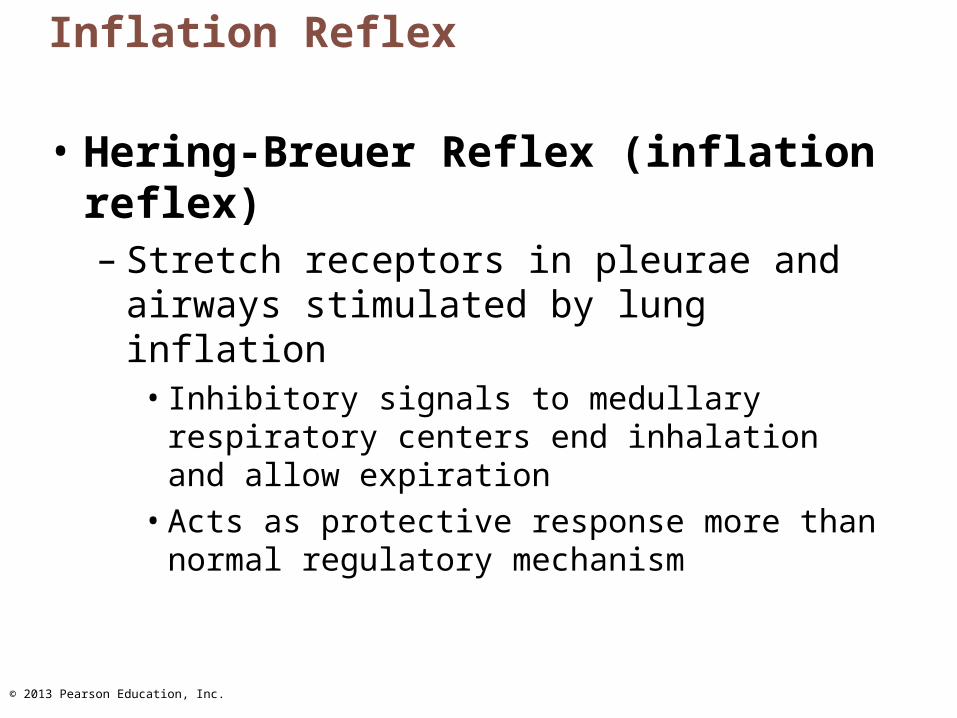
Inflation Reflex
• Hering-Breuer Reflex (inflation reflex)– Stretch receptors in pleurae and airways
stimulated by lung inflation • Inhibitory signals to medullary respiratory centers
end inhalation and allow expiration• Acts as protective response more than normal
regulatory mechanism

© 2013 Pearson Education, Inc.
Figure 22.24 Neural and chemical influences on brain stem respiratory centers.
Centralchemoreceptors
Other receptors (e.g., pain)and emotional stimuli actingthrough the hypothalamus
Peripheralchemoreceptors
Respiratory centers(medulla and pons)
Higher brain centers(cerebral cortex—voluntarycontrol over breathing)
Stretch receptorsin lungs
Irritantreceptors
Receptors inmuscles and joints
+–
+–
+
–+
+
–
© 2013 Pearson Education, Inc.
Respiratory Adjustments: Exercise
• Adjustments geared to both intensity and duration of exercise
• Hyperpnea– Increased ventilation (10 to 20 fold) in
response to metabolic needs
• Pco2, Po2, and pH remain surprisingly constant during exercise
© 2013 Pearson Education, Inc.
Respiratory Adjustments: Exercise
• Three neural factors cause increase in ventilation as exercise begins– Psychological stimuli—anticipation of exercise– Simultaneous cortical motor activation of
skeletal muscles and respiratory centers– Excitatory impulses to respiratory centers
from proprioceptors in moving muscles, tendons, joints

© 2013 Pearson Education, Inc.
Respiratory Adjustments: Exercise
• Ventilation declines suddenly as exercise ends because the three neural factors shut off
• Gradual decline to baseline because of decline in CO2 flow after exercise ends
• Exercise anaerobic respiration lactic acid– Not from poor respiratory function; from
insufficient cardiac output or skeletal muscle inability to increase oxygen uptake
© 2013 Pearson Education, Inc.
Respiratory Adjustments: High Altitude
• Quick travel to altitudes above 2400 meters (8000 feet) may symptoms of acute mountain sickness (AMS)– Atmospheric pressure and Po2 levels lower
– Headaches, shortness of breath, nausea, and dizziness
– In severe cases, lethal cerebral and pulmonary edema
© 2013 Pearson Education, Inc.
Acclimatization to High Altitude
• Acclimatization-respiratory and hematopoietic adjustments to long-term move to high altitude – Chemoreceptors become more responsive to
Pco2 when Po2 declines
– Substantial decline in Po2 directly stimulates peripheral chemoreceptors
– Result-minute ventilation increases and stabilizes in few days to 2–3 L/min higher than at sea level

© 2013 Pearson Education, Inc.
Acclimatization to High Altitude
• Always lower-than-normal Hb saturation levels– Less O2 available
• Decline in blood O2 stimulates kidneys to accelerate production of EPO
• RBC numbers increase slowly to provide long-term compensation

© 2013 Pearson Education, Inc.
Homeostatic Imbalances
• Chronic obstructive pulmonary disease (COPD)– Exemplified by chronic bronchitis and
emphysema– Irreversible decrease in ability to force air out
of lungs– Other common features
• History of smoking in 80% of patients • Dyspnea - labored breathing ("air hunger")• Coughing and frequent pulmonary infections• Most develop respiratory failure (hypoventilation)
accompanied by respiratory acidosis, hypoxemia

© 2013 Pearson Education, Inc.
Homeostatic Imbalance
• Emphysema– Permanent enlargement of alveoli; destruction
of alveolar walls; decreased lung elasticity • Accessory muscles necessary for breathing
exhaustion from energy usage
• Hyperinflation flattened diaphragm reduced ventilation efficiency
• Damaged pulmonary capillaries enlarged right ventricle

© 2013 Pearson Education, Inc.
Homeostatic Imbalance
• Chronic bronchitis– Inhaled irritants chronic excessive mucus
– Inflamed and fibrosed lower respiratory
passageways – Obstructed airways – Impaired lung ventilation and gas exchange
– Frequent pulmonary infections
© 2013 Pearson Education, Inc.
Homeostatic Imbalance
• COPD symptoms and treatment– Strength of innate respiratory drive
different symptoms in patients• "Pink puffers"–thin; near-normal blood gases• "Blue bloaters"–stocky, hypoxic
– Treated with bronchodilators, corticosteroids, oxygen, sometimes surgery
© 2013 Pearson Education, Inc.
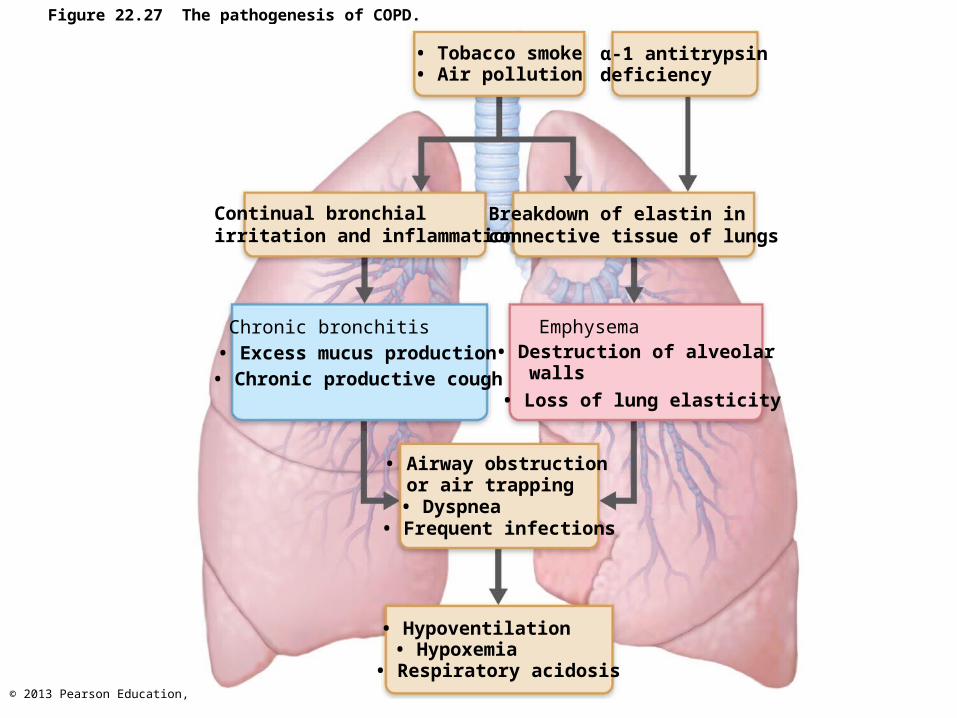
Figure 22.27 The pathogenesis of COPD.
• Tobacco smoke• Air pollution
α-1 antitrypsindeficiency
Continual bronchialirritation and inflammation
Breakdown of elastin inconnective tissue of lungs
• Chronic productive cough • Loss of lung elasticity
• Frequent infections
• Respiratory acidosis
Chronic bronchitis• Excess mucus production
Emphysema• Destruction of alveolar walls
• Airway obstruction or air trapping• Dyspnea
• Hypoventilation• Hypoxemia

© 2013 Pearson Education, Inc.
Homeostatic Imbalances
• Asthma–reversible COPD– Characterized by coughing, dyspnea,
wheezing, and chest tightness– Active inflammation of airways precedes
bronchospasms– Airway inflammation is immune response
caused by release of interleukins, production of IgE, and recruitment of inflammatory cells
– Airways thickened with inflammatory exudate magnify effect of bronchospasms
© 2013 Pearson Education, Inc.
Homeostatic Imbalances
• Tuberculosis (TB)– Infectious disease caused by bacterium
Mycobacterium tuberculosis – Symptoms-fever, night sweats, weight loss,
racking cough, coughing up blood– Treatment- 12-month course of antibiotics
• Are antibiotic resistant strains
© 2013 Pearson Education, Inc.
Homeostatic Imbalances
• Lung cancer– Leading cause of cancer deaths in North America– 90% of all cases result of smoking– Three most common types
• Adenocarcinoma (~40% of cases) originates in peripheral lung areas - bronchial glands, alveolar cells
• Squamous cell carcinoma (20–40% of cases) in bronchial epithelium
• Small cell carcinoma (~20% of cases) contains lymphocyte-like cells that originate in primary bronchi and subsequently metastasize
© 2013 Pearson Education, Inc.
Homeostatic Imbalance
• Lung cancer– Early detection key to survival– Helical CT scan better than chest X ray– Developing breath test of gold nanoparticles– If no metastasis surgery to remove
diseased lung tissue– If metastasis radiation and chemotherapy

© 2013 Pearson Education, Inc.
Homeostatic Imbalance
• Potential new therapies for lung cancer– Antibodies targeting growth factors required
by tumor; or deliver toxic agents to tumor– Cancer vaccines to stimulate immune system– Gene therapy to replace defective genes

© 2013 Pearson Education, Inc.
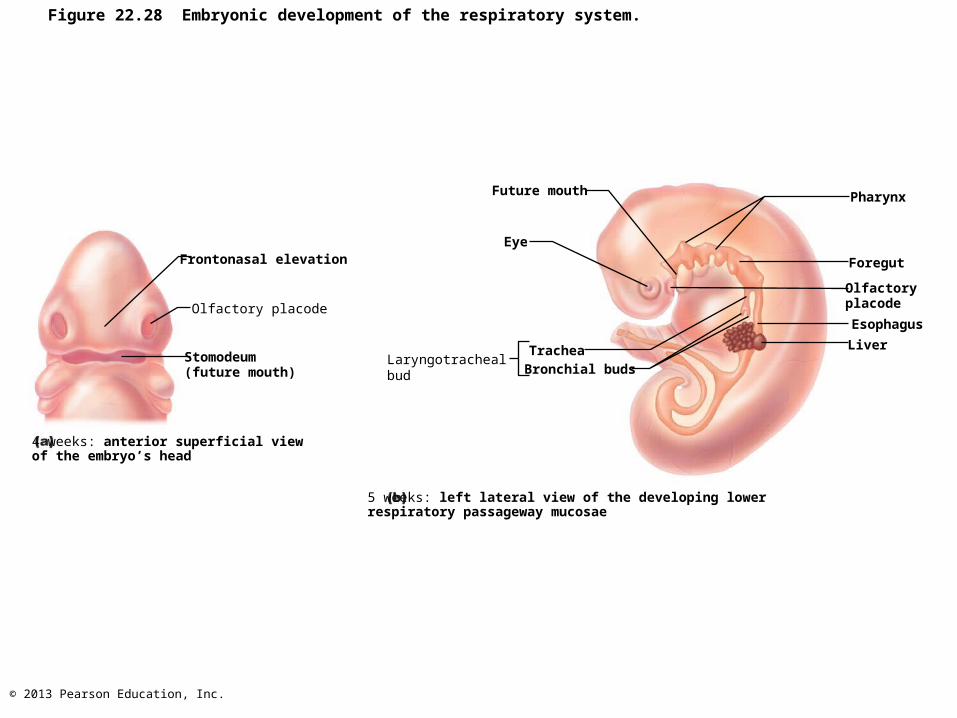
Developmental Aspects
• Upper respiratory structures develop first
• Olfactory placodes invaginate into olfactory pits ( nasal cavities) by fourth week
• Laryngotracheal bud present by fifth week
• Mucosae of bronchi and lung alveoli present by eighth week
© 2013 Pearson Education, Inc.
Figure 22.28 Embryonic development of the respiratory system.
Frontonasal elevation
Olfactory placode
Stomodeum(future mouth)
4 weeks: anterior superficial view of the embryo’s head
Future mouth
Eye
Laryngotrachealbud
Trachea
Bronchial buds
5 weeks: left lateral view of the developing lower respiratory passageway mucosae
Pharynx
Foregut
Olfactoryplacode
Esophagus
Liver
© 2013 Pearson Education, Inc.
Developmental Aspects
• By 28th week, premature baby can breathe on its own
• During fetal life, lungs filled with fluid and blood bypasses lungs
• Gas exchange takes place via placenta

© 2013 Pearson Education, Inc.
Homeostatic Imbalance
• Cystic fibrosis– Most common lethal genetic disease in North
America– Abnormal, viscous mucus clogs passageways
bacterial infections• Affects lungs, pancreatic ducts, reproductive ducts
– Cause–abnormal gene for Cl- membrane channel

© 2013 Pearson Education, Inc.
Homeostatic Imbalance
• Treatments for cystic fibrosis– Mucus-dissolving drugs; manipulation to
loosen mucus; antibiotics– Research into
• Introducing normal genes• Prodding different protein Cl- channel• Freeing patient's abnormal protein from ER to
Cl- channels• Inhaling hypertonic saline to thin mucus

© 2013 Pearson Education, Inc.
Developmental Aspects
• At birth, respiratory centers activated, alveoli inflate, and lungs begin to function
• Two weeks after birth before lungs fully inflated
• Respiratory rate highest in newborns and slows until adulthood
• Lungs continue to mature and more alveoli formed until young adulthood
• Respiratory efficiency decreases in old age