© 2015 krizia marie karry-rivera all rights reserved
TRANSCRIPT

© 2015
Krizia Marie Karry-Rivera
ALL RIGHTS RESERVED

FLEXIBLE CONTINUOUS MANUFACTURING PLATFORMS FOR SOLID
DISPERSION FORMULATIONS
by
KRIZIA MARIE KARRY-RIVERA
A dissertation submitted to the
Graduate School – New Brunswick
Rutgers, The State University of New Jersey
In partial fulfillment of the requirements
For the degree of
Doctor of Philosophy
Graduate Program in Chemical and Biochemical Engineering
Written under the direction of
Bozena Michniak-Kohn and Fernando J. Muzzio
And approved by
____________________________
____________________________
____________________________
____________________________
New Brunswick, New Jersey
OCTOBER, 2015
ABSTRACT OF THE DISSERTATION
Flexible Continuous Manufacturing Platforms for Solid Dispersion Formulations
By KRIZIA MARIE KARRY-RIVERA
Dissertation Directors:
Bozena Michniak-Kohn, Ph.D. and Fernando J. Muzzio, Ph.D.
In 2013 16,000 people died in the US due to overdose from prescription drugs and
synthetic narcotics. As of that same year, 90% of new molecular entities in the
pharmaceutical drug pipeline are classified as poor water-soluble. The work in this
dissertation aims to design, develop and validate platforms that solubilize weak acids and
can potentially deter drug abuse. These platforms are based on processing solid
dispersions via solvent-casting and hot-melt extrusion methods to produce oral
transmucosal films and melt tablets.
To develop these platforms, nanocrystalline suspensions and glassy solutions
were solvent-casted in the form of films after physicochemical characterizations of drug-
excipient interactions and design of experiment approaches. A second order model was
fitted to the emulsion diffusion process to predict average nanoparticle size and for
process optimization. To further validate the manufacturing flexibility of the
formulations, glassy solutions were also extruded and molded into tablets. This process
ii

included a systematic quality-by-design (QbD) approach that served to identify the
factors affecting the critical quality attributes (CQAs) of the melt tablets.
These products, due to their novelty, lack discriminatory performance tests that serve
as predictors to their compliance and stability. Consequently, Process Analytical
Technology (PAT) tools were integrated into the continuous manufacturing platform for
films. Near-infrared (NIR) spectroscopy, including chemical imaging, combined with
deconvolution algorithms were utilized for a holistic assessment of the effect of
formulation and process variables on the product’s CQAs. Biorelevant dissolution
protocols were then established to improve the in-vivo in-vitro correlation of the oral
transmucosal films.
In conclusion, the work in this dissertation supports the delivery of poor-water soluble
drugs in products that may deter abuse. Drug nanocrystals ensured high bioavailability,
while glassy solutions enabled drug solubilization in polymer matrices. PAT tools helped
in characterizing the micro and macro structure of the product while also used as a
control strategy for manufacturing. The systematic QbD assessment enabled
identification of the variables that significantly affected melt tablet performance and their
potential as an abuse deterrent product. Being that these glassy products are novel
systems, biorelevant protocols for testing dissolution performance of films were also
developed.
iii

ACKNOWLEDGEMENTS
I am very thankful to everyone who guided me throughout my stay at Rutgers
University, in particular my thesis advisors Bozena Michniak-Kohn and Fernando
Muzzio, and committee members Frank Romanski and Marianthi Ierapetritou. Equally
important are my colleagues at the New Jersey Institute of Technology with whom I
worked countless weeks and made me part of their “family” early on. I will never forget
our working harmony and everyone’s willingness in helping each other. Ramani Susarla,
Scott Krull, Meng Li and Zhonghui Huang, thank you for everything. This dissertation
would not be possible without you.
I also want to thank Rodolfo Romanach and Evelyn Erenrich for exposing me early-on
to the field of Real Time Analytics and the vast opportunities within Rutgers to pursue
graduate research, respectively. In that respect, I acknowledge Rutgers’ Research in
Science and Engineering (RiSE) and Research Experience for Undergraduates (REU)
programs for providing guidance that pushed me towards graduate school. I am grateful
for the financial support from the National Science Foundation’s Directorate for
Engineering’s Graduate Research Diversity Supplements (GRDS) and Engineering
Research Center for Structured Organic Particulate Systems (ERC-SOPS) that allowed
me to complete the work in this dissertation and to present it at numerous conferences.
I also want to thank my day-to-day professors: the students. The countless hours we
spent discussing data, current and new projects/ideas were what I enjoyed the most. I can
identify something I learned from each of you. I hope we continue these discussions
outside of academia and for years to come.
iv

Finally, I want to thank the immense support I received from my family. Thank you
for your faith in me and your constant prayers for my success. Mom, your never-ending
support has always pushed me to want more. You are my pillar. I am headed for
greatness and will make you proud.
v

TABLE OF CONTENTS
ABSTRACT OF THE DISSERTATION .................................................................... ii
ACKNOWLEDGEMENTS ......................................................................................... iv
TABLE OF CONTENTS ............................................................................................. vi
LIST OF TABLES ........................................................................................................ ix
LIST OF FIGURES ...................................................................................................... xi
CHAPTER 1 INTRODUCTION................................................................................. 1
1.1 Aims ........................................................................................................ 8
1.2 Strategy ................................................................................................... 9
1.3 Common drug active ingredients .......................................................... 10
CHAPTER 2 ROBUST EMULSION PRECIPITATION METHODOLOGY FOR PRODUCING NAPROXEN NANOPARTICLES ................. 12
2.1 Summary ............................................................................................... 12
2.2 Introduction ........................................................................................... 12
2.3 Materials and Methods .......................................................................... 17
2.3.1 Materials ............................................................................................... 17
2.3.2 Emulsion precipitation .......................................................................... 17
2.3.3 Particle size analysis ............................................................................. 18
2.3.4 Zeta potential ........................................................................................ 18
2.3.5 Scanning Electron Microscopy (SEM) ................................................. 19
2.3.6 Oral film manufacturing ....................................................................... 19
2.3.7 Experimental design.............................................................................. 19
2.4 Results and Discussion ......................................................................... 20
2.5 Conclusions ........................................................................................... 39
CHAPTER 3 BIORELEVANT IN VITRO DISSOLUTION PROTOCOLS FOR ORAL FILMS ..................................................................................... 41
3.1 Summary ............................................................................................... 41
3.2 Introduction ........................................................................................... 42
3.3 Materials and Methods .......................................................................... 46
3.3.1 Materials ............................................................................................... 46
3.3.2 Preparation of artificial saliva formulations ......................................... 46
3.3.3 Naproxen solubility in real and artificial saliva .................................... 47
vi
3.3.4 Preparation of drug nanosuspensions via wet stirred media milling .... 48
3.3.5 Preparation of films containing nanoparticles ...................................... 49
3.3.6 Film characterization ............................................................................ 50
3.3.7 Methods for comparing dissolution profiles ......................................... 53
3.4 Results and Discussion ......................................................................... 54
3.4.1 Naproxen solubility in real and artificial saliva .................................... 54
3.4.2 Characterization of naproxen particles in film...................................... 55
3.4.3 Mechanical Properties ........................................................................... 57
3.4.4 Dissolution ............................................................................................ 59
3.5 Conclusions ........................................................................................... 69
CHAPTER 4 PAT TOOLS FOR ORAL FILM CHARACTERIZATION .......... 71
4.1 Summary ............................................................................................... 71
4.2 Introduction ........................................................................................... 71
4.3 Materials and Methods .......................................................................... 73
4.3.1 Materials ............................................................................................... 73
4.3.2 Preparation of API micro and nanosuspensions ................................... 74
4.3.3 Preparation of film precursor solutions................................................. 74
4.3.4 Preparation of film precursor suspensions containing drug .................. 75
4.3.5 Batch and continuous film drying ......................................................... 75
4.3.6 Near-infrared spectra acquisition .......................................................... 77
4.3.7 Near-infrared chemical imaging ........................................................... 77
4.3.8 Thermogravimetric analysis (TGA) ...................................................... 79
4.4 Results & Discussion ............................................................................ 79
4.4.1 In-line NIR & TGA characterization .................................................... 79
4.4.2 Off-line NIR Chemical Imaging ........................................................... 87
4.5 Conclusions ........................................................................................... 96
CHAPTER 5 TRANSORAL FILMS FROM GLASSY SOLID DISPERSIONS FOR SOLUBILITY AND BIOAVAILABILITY ENHANCEMENT............................................................................................................... 98
5.1 Summary ............................................................................................... 98
5.2 Introduction ........................................................................................... 99
5.3 Materials & Methods .......................................................................... 103
5.3.1 Materials ............................................................................................. 103
vii

5.3.2 Solubilization capacity of polymers.................................................... 103
5.3.3 Oral film casting ................................................................................. 104
5.3.4 Physiochemical characterization ......................................................... 106
5.3.5 Drug release and transmucosal permeation ........................................ 108
5.4 Results & Discussion .......................................................................... 110
5.5 Conclusions ......................................................................................... 126
CHAPTER 6 A QUALITY-BY-DESIGN APPROACH TO GLASSY MELT EXTRUDED TABLETS FROM POOR-WATER SOLUBLE DRUGS............................................................................................... 128
6.1 Summary ............................................................................................. 128
6.2 Introduction ......................................................................................... 128
6.3 Materials & Methods .......................................................................... 133
6.3.1 Materials ............................................................................................. 133
6.3.2 Quality target product profile (QTTP) ................................................ 133
6.3.3 Qualitative risk assessment (RA) ........................................................ 134
6.3.4 Experimental Design ........................................................................... 134
6.4 Results ................................................................................................. 142
6.5 Conclusions ......................................................................................... 156
CHAPTER 7 CONCLUSIONS AND RECOMMENDATIONS FOR FUTURE WORK ............................................................................................... 158
7.1 Conclusions ......................................................................................... 158
7.2 Recommendations for Future Work.................................................... 159
APPENDIX I 163
APPENDIX II 164
REFERENCES 166
viii
LIST OF TABLES
Table 1-1. Types of Solid Dispersions (adapted from Kolter et al. [16]) ........................... 2
Table 1-2 Applications of Raman, NIR and Terahertz spectroscopy. ................................ 8
Table 1-3. Properties of naproxen and ibuprofen. Taken from [42, 43]. .......................... 10
Table 2-1. HLB Values and Properties. Modified from [56]. ........................................... 14
Table 2-2. Materials used for nanoemulsions ................................................................... 17
Table 2-3. Zeta potential of ethyl acetate NPX nanosuspensions ..................................... 24
Table 2-4. Results for experimental design on robustness ............................................... 31
Table 2-5. Estimated effects and interactions for average particle size. ........................... 32
Table 2-6. Analysis of variance (ANOVA) results for average particle size ................... 33
Table 2-7. Regression coefficients for average particle size ............................................ 35
Table 2-8. Prediction results for average particle size (nm) ............................................. 36
Table 3-1. Artificial saliva formulations ........................................................................... 47
Table 3-2. Film formulations and experimental parameters ............................................. 53
Table 3-3. Content Uniformity of Oral Film Formulations .............................................. 57
Table 3-4. Difference and similarity factors for comparing dissolution as a function of media and pH .................................................................................................................... 62
Table 3-5. Difference and similarity factors for saliva flow rate (ml/min) ...................... 65
Table 3-6. Difference and similarity factors for oral film thickness (μm) ........................ 66
Table 3-7. Difference and similarity factors for drug loading (polymer:nanosuspension, w/w) .................................................................................................................................. 67
Table 3-8. Difference and similarity factors for saliva volume (mL) ............................... 69
Table 4-1. Wet film compositions .................................................................................... 75
Table 4-2. PLS-DA GF abundance results in halves of micronized films........................ 92
Table 4-3. PLS-DA GF abundance results for nanosized films ........................................ 93
Table 5-1. Materials used for completing experiments .................................................. 103
Table 5-2. Accelerated stability test conditions .............................................................. 108
Table 5-3. Tested film components for transoral films................................................... 113
Table 5-4. Optimal formulation components for glassy transoral film dispersion ......... 118
Table 5-5. HPLC analysis of control and aged samples ................................................. 121
Table 6-1. Technologies for deterring drug abuse. Modified from [141]. ...................... 131
ix
Table 6-2. Materials used for completing experiments in Chapter 6 .............................. 133
Table 6-3. CQAs of an extended release abuse-deterrent melt tablet. ............................ 134
Table 6-4. Base formulation for experimental design .................................................... 136
Table 6-5. Design variables and initial recordings ......................................................... 143
Table 6-6. One-way ANOVA analyses for Young’s Modulus ....................................... 145
Table 6-7. Dissolution results for tablets and extrudates of Run 5 ................................. 147
Table 6-8. Drug release data for extrudates in PBS pH 6.8 ............................................ 149
Table 6-9. Korsmeyer-Peppas parameter estimates Run 3 ............................................. 151
Table 6-10. Exponent n of the Korsmeyer-Peppas model. Modified from [146]. .......... 152
Table 6-11. SMEC and SFL for experimental runs. ....................................................... 153
Table 6-12. Average results for experimental design ..................................................... 155
Table 6-13. Variables affecting response as per ANOVA tests...................................... 156
x

LIST OF FIGURES
Figure 1-1. FDA-approved products based on solid dispersion technologies. Image taken from [21]. ............................................................................................................................ 4
Figure 1-2. Continuous manufacturing of films via the solvent casting (SC) method. ...... 6
Figure 1-3. (a) Naproxen (NPX) and (b) ibuprofen (IBU). Both BCS Class II drugs with poor solubility and high permeability. .............................................................................. 11
Figure 2-1. Emulsion precipitation process for producing drug nanoparticles. ................ 17
Figure 2-2. Particle size data for IBU nanoparticles precipitated from-butyl lactate. ...... 21
Figure 2-3. Particle size data for IBU nanoparticles precipitated from ethyl acetate. ...... 22
Figure 2-4. Particle size data for NPX nanoparticles precipitated from ethyl acetate. ..... 22
Figure 2-5. Particle size data for NPX nanoparticles precipitated from triacetin. ............ 23
Figure 2-6. Zeta potential of NPX nanoparticles as a function of pH. The red marker represents the most unstable conditions, as near the isoelectric point of the molecule. ... 25
Figure 2-7. Centrifuged NPX particles precipitated from ethyl acetate and soy lecithin. Magnifications of (a) 1,500x, and (b) 8,000x. .................................................................. 26
Figure 2-8. Oral films containing the nanocrystalline NPX particles. .............................. 27
Figure 2-9. Steric HPMC polymer barrier around NPX particle embedded in oral film. . 28
Figure 2-10. Microscope images of unfiltered NPX nanoparticles. Quadrants are based on 5 and 10% for both NPX and lecithin concentrations. The small sub-plots are categorized by antisolvent temperature, 25 °C (STP) and 10 °C. ........................................................ 29
Figure 2-11. 23 full factorial design for testing robustness of the emulsion diffusion process............................................................................................................................... 30
Figure 2-12. Central composite response surface model for optimizing and testing process robustness. ......................................................................................................................... 30
Figure 2-13. Standardized Pareto chart for average particle size ..................................... 32
Figure 2-14. Interaction plot and the effect on average particle size. ............................... 34
Figure 2-15. Main effects plot for average particle size. .................................................. 35
Figure 2-16. Contours of estimated average particle size at T = 10.0 °C ......................... 37
Figure 2-17. Contours of estimated average particle size at T = 17.5 °C ......................... 37
Figure 2-18. Contours of estimated average particle size at T = 25.0 °C ......................... 38
Figure 2-19. Optimization results for the emulsion diffusion process.............................. 39
Figure 3-1. Naproxen solubility in real and artificial saliva formulations. ....................... 55
Figure 3-2. Redispersion particle size results for NPX nanosuspensions. ........................ 56
xi
Figure 3-3. Mechanical properties (a) tensile strength and (b) percent elongation of oral films embedded with NPX nanoparticles. ........................................................................ 58
Figure 3-4. Drug release from transmucosal oral films in 30 mL of artificial saliva and USP recommended media PBS pH 7.4. ............................................................................ 61
Figure 3-5. Parallel plot for oral film drug release (2 min intervals) in artificial saliva media and PBS. Each timepoint is represented by a black horizontal line. The Y-axis denotes % Drug Dissolved. ............................................................................................... 62
Figure 3-6. Hierarchical cluster analysis comparing dissolution curves for oral films dissolved in formulations of artificial saliva and USP recommended media. .................. 63
Figure 3-7. Effects of saliva flow rate on drug release from oral films. ........................... 65
Figure 3-8. Drug release as a function of oral film thickness. .......................................... 66
Figure 3-9. Effect of drug loading variations on film dissolution. ................................... 67
Figure 3-10. Effects of saliva volume on drug release from oral films. ........................... 69
Figure 4-1. Drying zones of the continuous film drying line. .......................................... 76
Figure 4-2. MicroNIR 1700 set-up for real-time characterization of film drying behavior in a continuous drier. Set-up in batch-mode on Zone 3. ................................................... 77
Figure 4-3. Oral film sample set-up for acquiring NIR chemical images. ....................... 78
Figure 4-4. OH overtone in the 1450 nm region was monitored over time. ..................... 80
Figure 4-5. PCA Scores Plot of pretreated k2b spectra grouped by a) drying time (mins) b) drying temperature. ....................................................................................................... 82
Figure 4-6. Eigenvectors (loadings) plot for k2b. The arrow shows the direction of spectral shift. ..................................................................................................................... 83
Figure 4-7. Line scores plot for PC-1. This PC accounts for water content differences. The x-axis are the sequential k2b samples as they were drying. ...................................... 84
Figure 4-8. TGA for k2b films showing free and bound water. ....................................... 85
Figure 4-9. Scores plot for the effect of drying temperature on rate of solvent removal. 86
Figure 4-10. Hotelling’s analysis for testing means and detecting outliers. ..................... 87
Figure 4-11. Raw spectra of micronized films (black) and pure GF drug (red). .............. 88
Figure 4-12. Absorbance spectra pretreated with background correction, spectral Fourier filters and removal of bad pixels. ...................................................................................... 88
Figure 4-13. Spectra of the Saviztky Golay 1st derivative in the region of 2100-2400 nm with 7 points and a 3rd order polynomial for nanosized films (black) and Griseofulvin (red) ................................................................................................................................... 89
Figure 4-14. Micronized film with mean abundance of 31.9% GF. ................................. 90
Figure 4-15. Abundance of Griseofulvin in the halves of Micronized Film 1 (m1). Half m1 (a) has an abundance of 28.9% whereas for m1 (b) the abundance is 35.0%. ............ 91
xii

Figure 5-1. Temperature-drug load diagram of naproxen-Soluplus® system. Image taken from [126]. ...................................................................................................................... 101
Figure 5-2. Convective drying system for batch oral film manufacturing ..................... 105
Figure 5-3. Franz diffusion set up for evaluating transmucosal drug permeation. ......... 110
Figure 5-4. a) Kinetic solubilities of NPX in gastric media, phosphate buffers and Soluplus solutions. b) Solubility enhancement of NPX in Soluplus solutions. .............. 111
Figure 5-5. Effect of PEG chain length on final film crystallinity ................................. 114
Figure 5-6. FTIR spectra of pure components and transoral film containing Soluplus, Kollidon VA 64 and PEG 400. ....................................................................................... 115
Figure 5-7. Monomer identification of pure polymers from FTIR spectra..................... 115
Figure 5-8. FTIR spectra in the region of 1670 to 1530 cm-1 to visualize Soluplus-NPX interactions. ..................................................................................................................... 116
Figure 5-9. Savitzky-Golay second derivative spectra showing split of carbonyl in vinyl caprolactam of Soluplus when H-bonds are formed. ...................................................... 116
Figure 5-10. XRD diffraction patterns for films manufactured with different drying regimes: air convection vs. oven conduction. ................................................................. 117
Figure 5-11. DSC thermogram for glassy transoral film ................................................ 118
Figure 5-12. TGA data for the optimized transoral film. ................................................ 119
Figure 5-13. Dynamic vapor sorption (DVS) isotherm for the transoral NPX film ....... 120
Figure 5-14. Accelerated stability test results for aged transoral films. ......................... 122
Figure 5-15. Boxplot of % LC as a function of temperature and relative humidity. ...... 122
Figure 5-16. PCA analysis of accelerated stability test (AST) program results. ............ 123
Figure 5-17. Hotelling’s T2 analysis of multivariate means ........................................... 124
Figure 5-18. Drug release from glassy transoral films ................................................... 125
Figure 5-19. Diffusion flux through buccal mucosa from optimizes transoral film. ...... 126
Figure 6-1. Stages of the Quality-by-Design (QbD) approach ....................................... 129
Figure 6-2. Experimental design for examining effect of formulation and process variables on an ADF ....................................................................................................... 135
Figure 6.3 Screw design used in this study ..................................................................... 137
Figure 6-4. Settings along the barrel for different temperature settings. a) 125 °C; b) 150 °C; c) 175 °C. .................................................................................................................. 137
Figure 6-5. Molded tablets from glassy melt extrudate .................................................. 138
Figure 6-6. Ultrasound setup in pitch-catch mode for evaluating TOF through melt tablets. Image modified from [143]. ............................................................................... 140
Figure 6-7. Qualitative risk assessment for melt productsbased on solid dispersions .... 142
xiii
Figure 6-8. Young modulus as a function of process and formulation parameters ........ 144
Figure 6-9. Breaking force of melt tablets ...................................................................... 145
Figure 6-10. Drug extraction in common aqueous solvents ........................................... 146
Figure 6-11. Dissolution for molded tablets in 900 ml of PBS pH 6.8 at 50 rpm .......... 148
Figure 6-12. Extrudate dissolution profiles for all runs .................................................. 149
Figure 6-13. Dissolution profiles of Run 3 for tablets (red) and extrudates (blue) ........ 151
Figure 6-14. Process diagram for increasing efficiency based on SMEC and SFL. ....... 154
Figure 6-15. Viable process window for an abuse deterrent melt tablet. ....................... 154
Figure 7-1. Hansen model space. Miscible solvents (green) have low distances relative to the other component (sphere). Image adapted from [155]. ............................................. 161
xiv
1
Chapter 1 Introduction
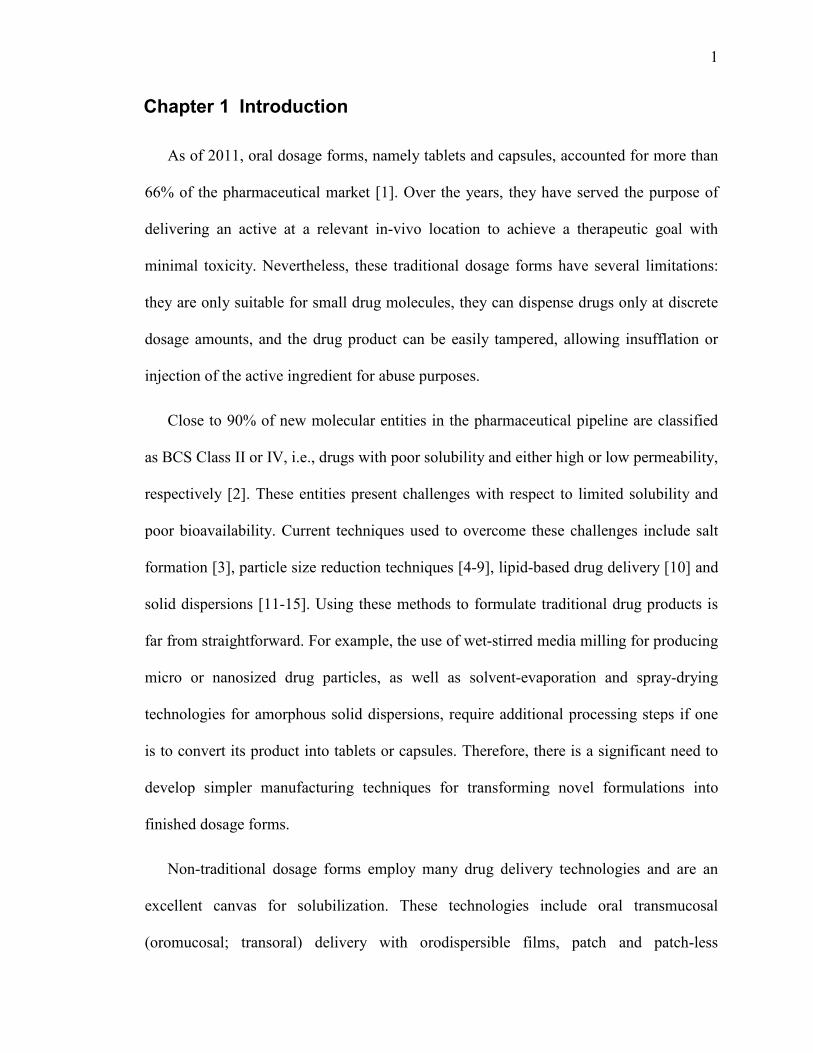
As of 2011, oral dosage forms, namely tablets and capsules, accounted for more than
66% of the pharmaceutical market [1]. Over the years, they have served the purpose of
delivering an active at a relevant in-vivo location to achieve a therapeutic goal with
minimal toxicity. Nevertheless, these traditional dosage forms have several limitations:
they are only suitable for small drug molecules, they can dispense drugs only at discrete
dosage amounts, and the drug product can be easily tampered, allowing insufflation or
injection of the active ingredient for abuse purposes.
Close to 90% of new molecular entities in the pharmaceutical pipeline are classified
as BCS Class II or IV, i.e., drugs with poor solubility and either high or low permeability,
respectively [2]. These entities present challenges with respect to limited solubility and
poor bioavailability. Current techniques used to overcome these challenges include salt
formation [3], particle size reduction techniques [4-9], lipid-based drug delivery [10] and
solid dispersions [11-15]. Using these methods to formulate traditional drug products is
far from straightforward. For example, the use of wet-stirred media milling for producing
micro or nanosized drug particles, as well as solvent-evaporation and spray-drying
technologies for amorphous solid dispersions, require additional processing steps if one
is to convert its product into tablets or capsules. Therefore, there is a significant need to
develop simpler manufacturing techniques for transforming novel formulations into
finished dosage forms.
Non-traditional dosage forms employ many drug delivery technologies and are an
excellent canvas for solubilization. These technologies include oral transmucosal
(oromucosal; transoral) delivery with orodispersible films, patch and patch-less

2
transdermal products, and gastrointestinal delivery using melt tablets. Since oral products
constitute such a high percentage of the pharmaceutical market, the development of oral
non-traditional dosage forms that contain solubilized poor water-soluble drugs are of
great interest.
Among many alternative approaches, oral solid dispersions have gained significant
attention in recent years. Solid dispersions can be defined as solid products having phases
consisting of 2 or more components [13]. There are different types of solid dispersions. If
categorized based on the state of both the dispersed and continuous phases, there are 6
main types. These are listed in Table 1-1.
Table 1-1. Types of Solid Dispersions (adapted from Kolter et al. [16]) Type of solid dispersion Matrix Drug Phases Stability
I Eutectics Crystalline Crystalline 2 + + +
II Amorphous precipitates in crystalline matrix Crystalline Amorphous 2 + +
III Solid solutions Crystalline Molecularly Dispersed 1 or 2 + +
IV Crystalline glass suspension Amorphous Crystalline 2 + +
V Amorphous glass suspensions Amorphous Amorphous 2 +
VI Glass solution (solid glassy solution) Amorphous Molecularly Dispersed 1 + +
The stability of solid dispersion systems is extremely dependent on the energetic state
of the drug. Crystalline drug systems have the highest stability. Molecules in a crystal
lattice are in a low energy state, and there is a low probability that they will
spontaneously overcome the lattice energy and transition to a metastable or amorphous
form. Correspondingly, crystalline forms typically display the lowest solubility for a
given molecule. Solid dispersions with crystalline matrices (Type I – III) do not
necessarily offer high solubility as crystallinity, in general, increases the bonding forces
3
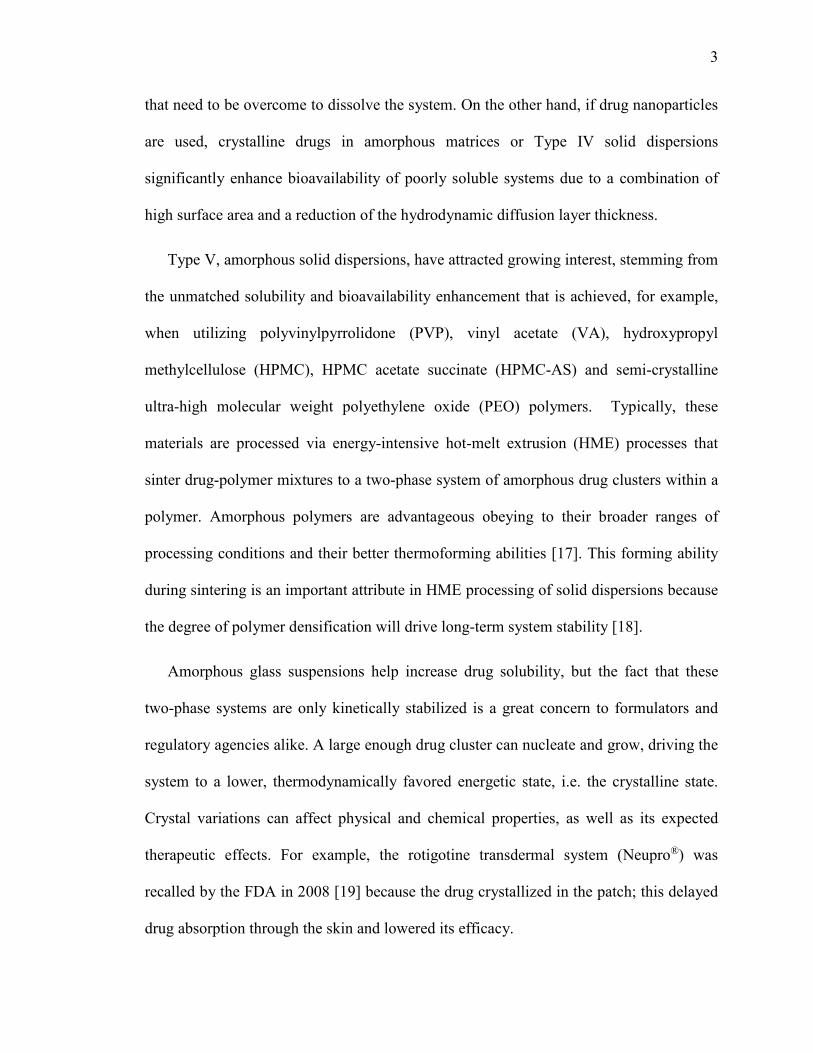
that need to be overcome to dissolve the system. On the other hand, if drug nanoparticles
are used, crystalline drugs in amorphous matrices or Type IV solid dispersions
significantly enhance bioavailability of poorly soluble systems due to a combination of
high surface area and a reduction of the hydrodynamic diffusion layer thickness.
Type V, amorphous solid dispersions, have attracted growing interest, stemming from
the unmatched solubility and bioavailability enhancement that is achieved, for example,
when utilizing polyvinylpyrrolidone (PVP), vinyl acetate (VA), hydroxypropyl
methylcellulose (HPMC), HPMC acetate succinate (HPMC-AS) and semi-crystalline
ultra-high molecular weight polyethylene oxide (PEO) polymers. Typically, these
materials are processed via energy-intensive hot-melt extrusion (HME) processes that
sinter drug-polymer mixtures to a two-phase system of amorphous drug clusters within a
polymer. Amorphous polymers are advantageous obeying to their broader ranges of
processing conditions and their better thermoforming abilities [17]. This forming ability
during sintering is an important attribute in HME processing of solid dispersions because
the degree of polymer densification will drive long-term system stability [18].
Amorphous glass suspensions help increase drug solubility, but the fact that these
two-phase systems are only kinetically stabilized is a great concern to formulators and
regulatory agencies alike. A large enough drug cluster can nucleate and grow, driving the
system to a lower, thermodynamically favored energetic state, i.e. the crystalline state.
Crystal variations can affect physical and chemical properties, as well as its expected
therapeutic effects. For example, the rotigotine transdermal system (Neupro®) was
recalled by the FDA in 2008 [19] because the drug crystallized in the patch; this delayed
drug absorption through the skin and lowered its efficacy.
4
Type VI solid glassy solutions have the highest energy of all solid dispersion types.
These solutions require miscibility of one component in another, in other words, the drug
must dissolve in the polymer via covalent or hydrogen bonding interactions. These
interactions lead to one-phase systems in which the drug is molecularly dispersed within
a polymer because the interaction forces are higher than the drug’s self-association forces
[16, 20]. Since the entrapped solubilized drug has a lower particle size than the
unprocessed material there is a dual increase in solubility and bioavailability.
Furthermore, glassy solutions are thermodynamically stable under saturation solubility,
and compared to amorphous solid dispersions, they offer the maximum solubility
enhancement.
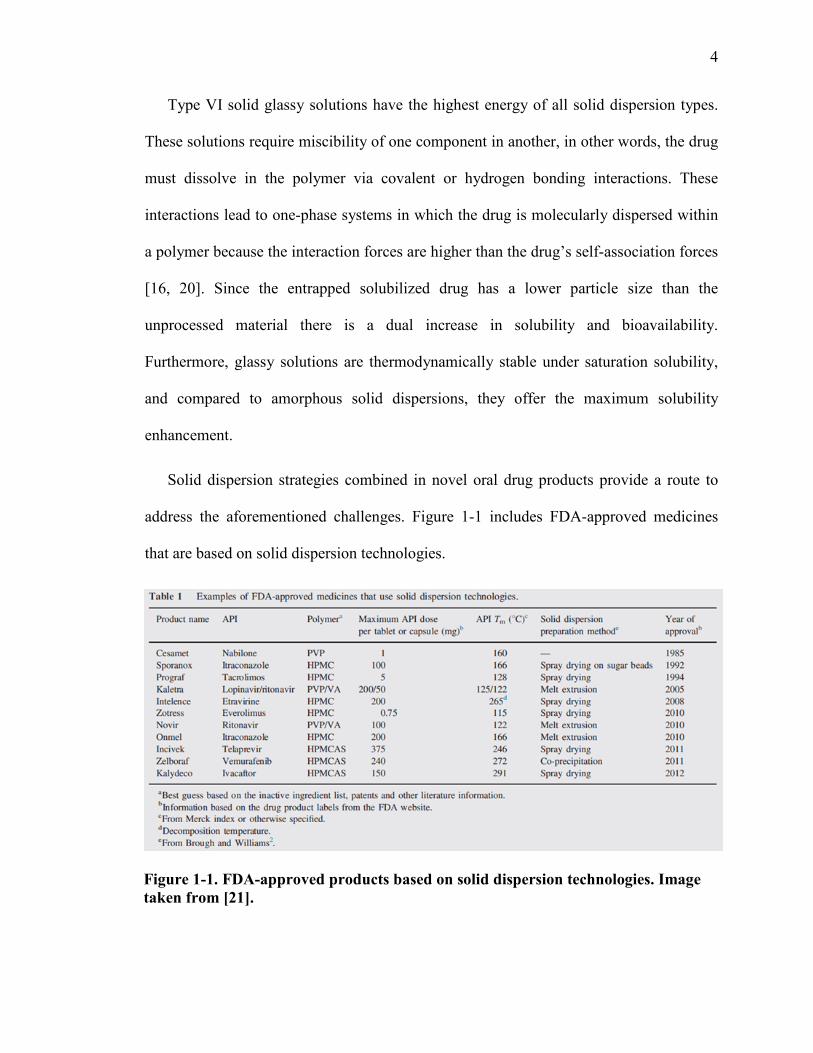
Solid dispersion strategies combined in novel oral drug products provide a route to
address the aforementioned challenges. Figure 1-1 includes FDA-approved medicines
that are based on solid dispersion technologies.
Figure 1-1. FDA-approved products based on solid dispersion technologies. Image taken from [21].
5
Products based on solid dispersion technologies may also be engineered to deter drug
abuse and thus comply with recent Food and Drug Administration (FDA) requirements
[22]. Two non-traditional products based on solid dispersions deserve mention, oral
transmucosal (transoral) films and melt tablets. Both these dosage forms may be
formulated as crystalline glass suspensions or solid glassy solutions containing
solubilized BCS II or IV drugs that are not easily tampered with. Undoubtedly,
challenges related to both solubility and drug abuse are isolated, but with the increasing
number of drug abuse deaths (16,000 in the US on 2013 [23]) and insoluble new
molecular entities in the drug pipeline (90% as of 2013 [2]) it is just a matter of time until
this combination of issues becomes commonplace. Thus, the development of flexible
formulation and manufacturing platforms that enable complete solubilization and deter
drug abuse are important to the future of pharmaceutical formulations.
Films and melt tablets can deter drug abuse in several ways. They possess intrinsic
physical and chemical barriers that limit drug extraction by chewing or grinding. The
polymer also acts as a gelling agent to discourage injection while delaying drug release
due to strong drug-polymer binding [24].
Films and melt tablets may be batch or continuously processed via HME methods.
HME employs thermal and mechanical energy to disperse the drug and excipients into
amorphous or glass dispersions that are extruded and molded. This allows for
manufacturing products with high drug loadings but questionable long-term stability
since the drug is not in its favored energetic state [25]. Films can also be manufactured
by a lower energy process known as solvent casting (SC). SC works by solvent
evaporation wherein the API is dissolved or suspended in solutions of volatile solvents.
6
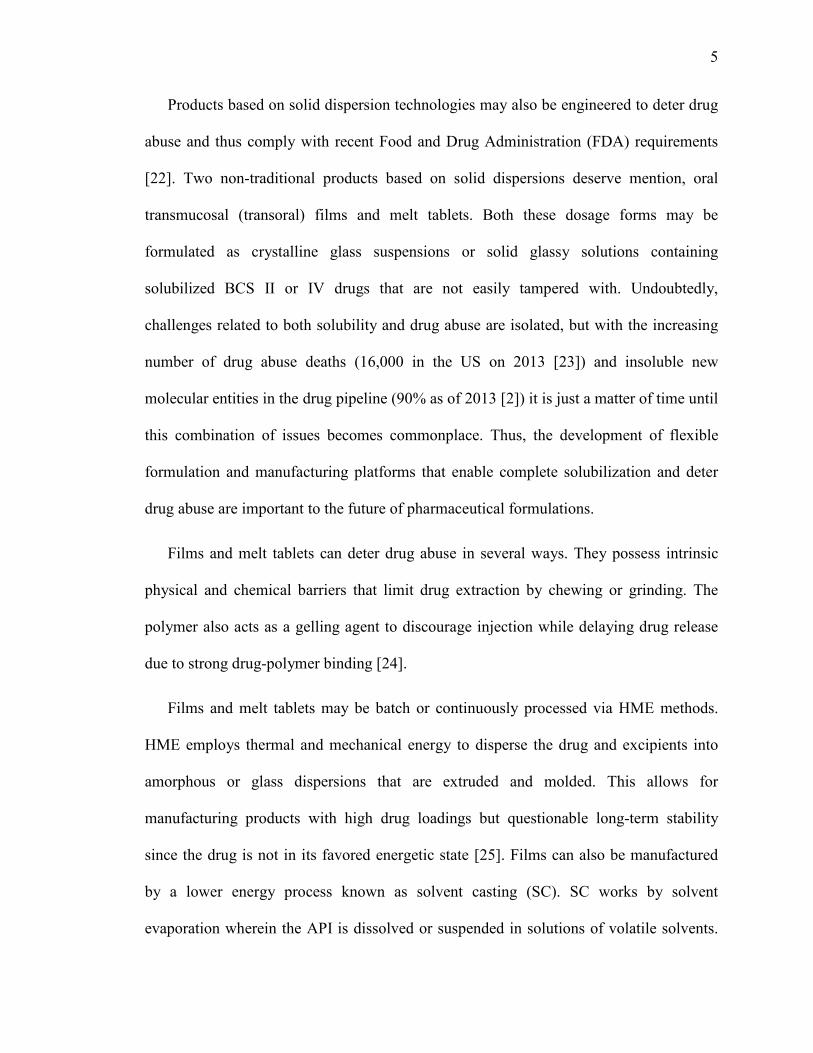
In a continuous SC process (Figure 1-2) the solution is spread onto a non-stick substrate
and dried by conduction and/or convection until a predefined residual solvent content is
achieved. This manufacturing technique is advantageous for producing films of
crystalline drugs and heat-labile APIs, but suffers from limitations in drug loading.
Figure 1-2. Continuous manufacturing of films via the solvent casting (SC) method.
The integration of Process Analytical Technology (PAT) tools into the manufacturing
process to monitor in real-time critical process parameters (CPPs) that affect product
attributes (drug crystallinity, impurities, viscosity, tensile strength, water content,
homogeneity and chemical distribution of all components) and process performance
(residence time, changes in feeding rate, screw speed and torque) can assure consistent
product quality when combined with feedforward/feedback control strategies [26].
Outputs can be used to construct process master curves and predict long-term product
stability and process robustness. Today most experiments focus on a posteriori trial and
error measurements of aged samples in order to predict stability. If a sample has a
7
compromised stability, formulators often go back to the drawing board. Moreover, if
these issues are not thoroughly assessed before commercialization and/or understood at
the manufacturing stage, the quality of the product can be compromised. The FDA has
stated that “increased testing does not improve product quality” [27], and as a response to
the aforementioned issues, the agency has introduced the Quality-by-Design (QbD)
initiative and supported the use of PAT tools.
The QbD initiative focuses on building quality into products by: (1) defining quality
target profiles for the product’s critical quality attributes (CQAs); (2) increasing process
understanding by comprehensive risk assessments; (3) implementing DOE strategies to
quantify the effect of material attributes and process parameters on CQAs; (4) designing
control strategies for the product’s critical process parameters (CPPs). QbD describes
“quality” as that product which is free of contaminants and reproducibly delivers its
advertised therapeutic benefits [27] (i.e., “fitness for use”). In this view, quality is a
function of raw material attributes, manufacturing, packaging, and most importantly,
process robustness. A process that does not consistently ensure quality product is a
process that is not in a “state-of-control” [26, 28].
PAT is supported by the QbD initiative as a tool that enables design, analysis and
control of manufacturing through timely measurements of CPPs that affect CQAs [29].
Raman, Near-infrared (NIR), and Terahertz (Thz) spectroscopy are non-destructive
analytical tools that have become essential to the pharmaceutical engineer. Table 1-2
summarizes the applications of each technique. Some examples of their use in the
pharmaceutical industry include: bioreaction and granulation monitoring [30, 31], content
uniformity predictions of blends [32], tablets [33] and films [34], crystallinity evaluation
8
[35, 36], polymorph identification [37], tablet coating thickness measurements [38], and
closed-loop control of continuous manufacturing processes [39]. These tools and their
corresponding multivariate chemometric models have been widely researched.
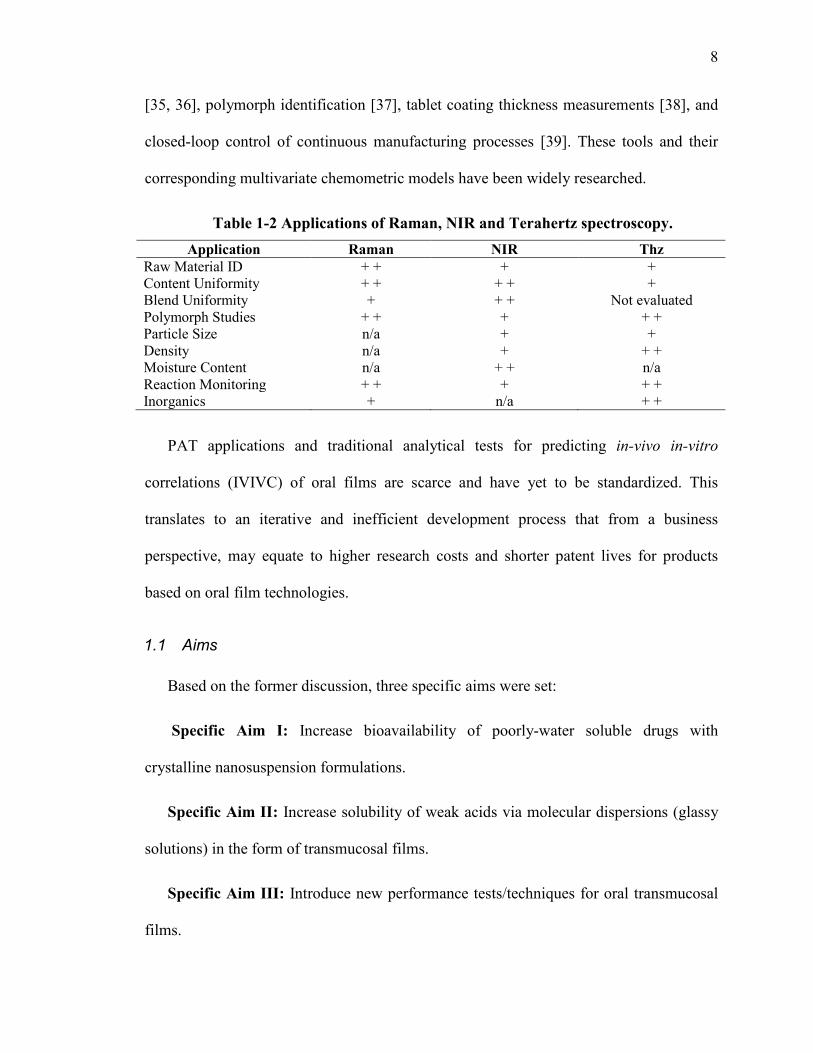
Table 1-2 Applications of Raman, NIR and Terahertz spectroscopy. Application Raman NIR Thz
Raw Material ID + + + + Content Uniformity + + + + + Blend Uniformity + + + Not evaluated Polymorph Studies + + + + + Particle Size n/a + + Density n/a + + + Moisture Content n/a + + n/a Reaction Monitoring + + + + + Inorganics + n/a + +
PAT applications and traditional analytical tests for predicting in-vivo in-vitro
correlations (IVIVC) of oral films are scarce and have yet to be standardized. This
translates to an iterative and inefficient development process that from a business
perspective, may equate to higher research costs and shorter patent lives for products
based on oral film technologies.
1.1 Aims
Based on the former discussion, three specific aims were set:
Specific Aim I: Increase bioavailability of poorly-water soluble drugs with
crystalline nanosuspension formulations.
Specific Aim II: Increase solubility of weak acids via molecular dispersions (glassy
solutions) in the form of transmucosal films.
Specific Aim III: Introduce new performance tests/techniques for oral transmucosal
films.
9
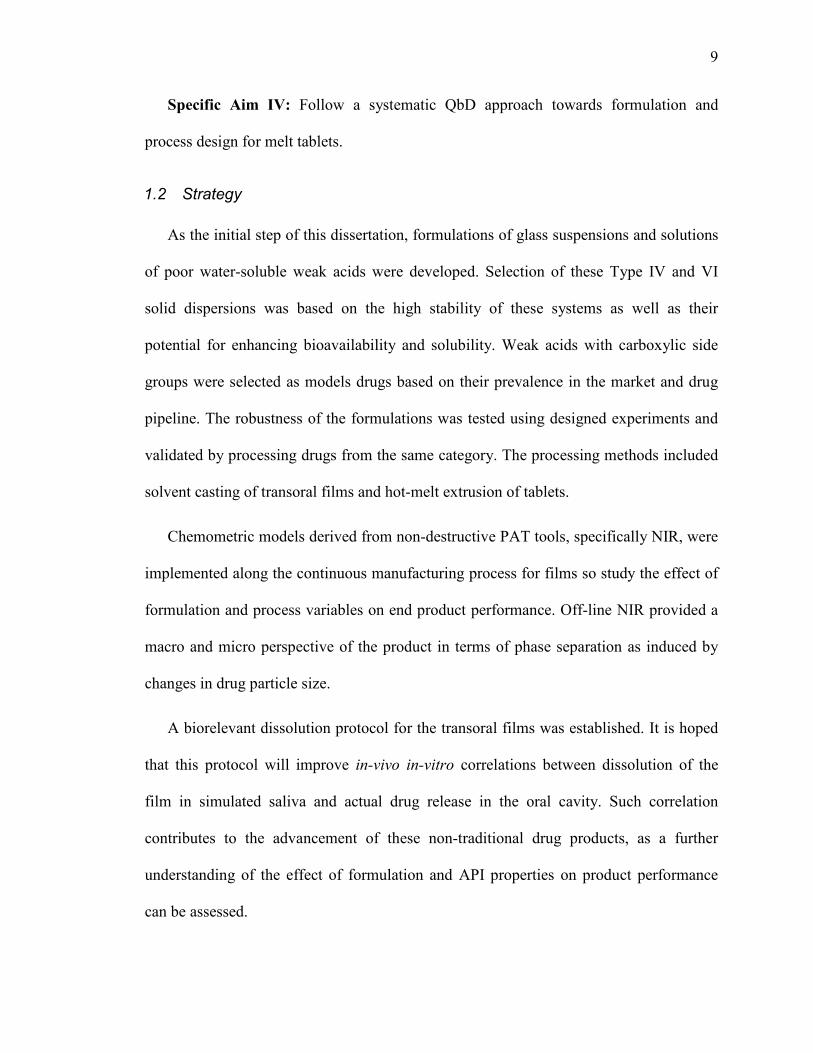
Specific Aim IV: Follow a systematic QbD approach towards formulation and
process design for melt tablets.
1.2 Strategy
As the initial step of this dissertation, formulations of glass suspensions and solutions
of poor water-soluble weak acids were developed. Selection of these Type IV and VI
solid dispersions was based on the high stability of these systems as well as their
potential for enhancing bioavailability and solubility. Weak acids with carboxylic side
groups were selected as models drugs based on their prevalence in the market and drug
pipeline. The robustness of the formulations was tested using designed experiments and
validated by processing drugs from the same category. The processing methods included
solvent casting of transoral films and hot-melt extrusion of tablets.
Chemometric models derived from non-destructive PAT tools, specifically NIR, were
implemented along the continuous manufacturing process for films so study the effect of
formulation and process variables on end product performance. Off-line NIR provided a
macro and micro perspective of the product in terms of phase separation as induced by
changes in drug particle size.
A biorelevant dissolution protocol for the transoral films was established. It is hoped
that this protocol will improve in-vivo in-vitro correlations between dissolution of the
film in simulated saliva and actual drug release in the oral cavity. Such correlation
contributes to the advancement of these non-traditional drug products, as a further
understanding of the effect of formulation and API properties on product performance
can be assessed.

10
1.3 Common drug active ingredients
The active pharmaceutical ingredients that are used throughout this work are
naproxen (NPX) and ibuprofen (IBU). Both actives are derivatives of propionic acid and
are classified as weakly acidic BCS Class II non-steroidal anti-inflammatory drugs
(NSAIDs). The properties of these two APIs are shown in Table 1-3. Like most weak
acids, they are soluble at alkaline (intestinal) pHs while poorly soluble at gastric pHs
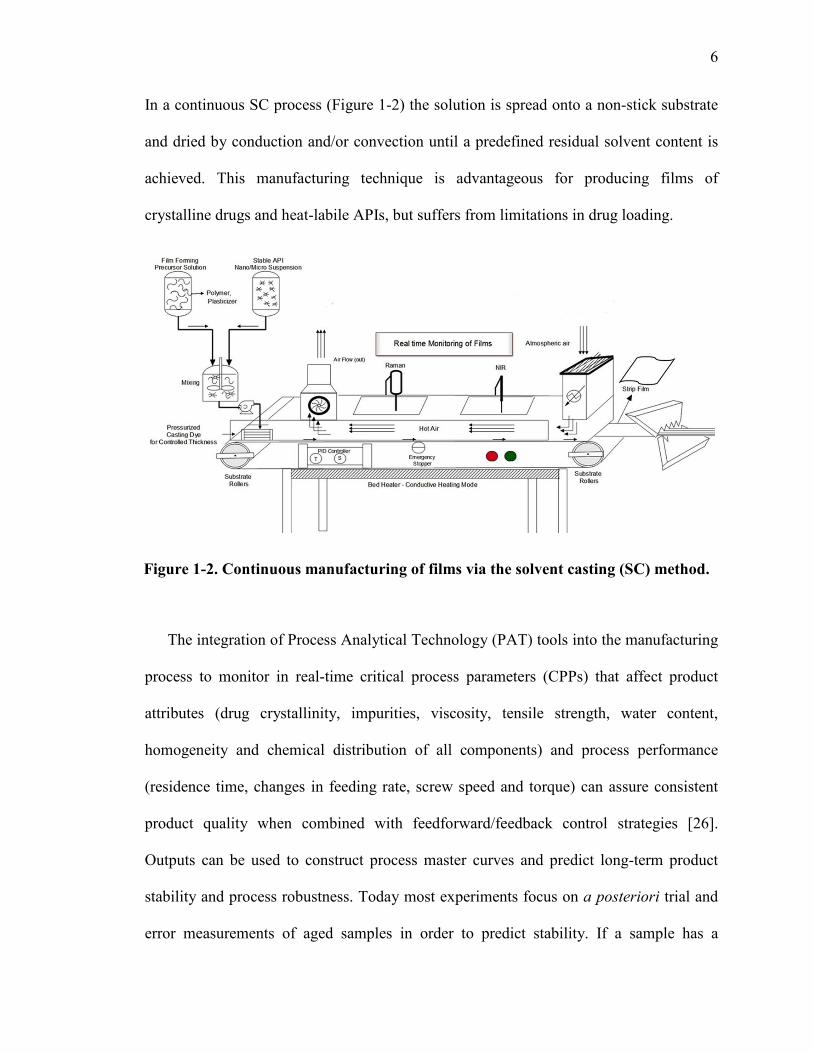
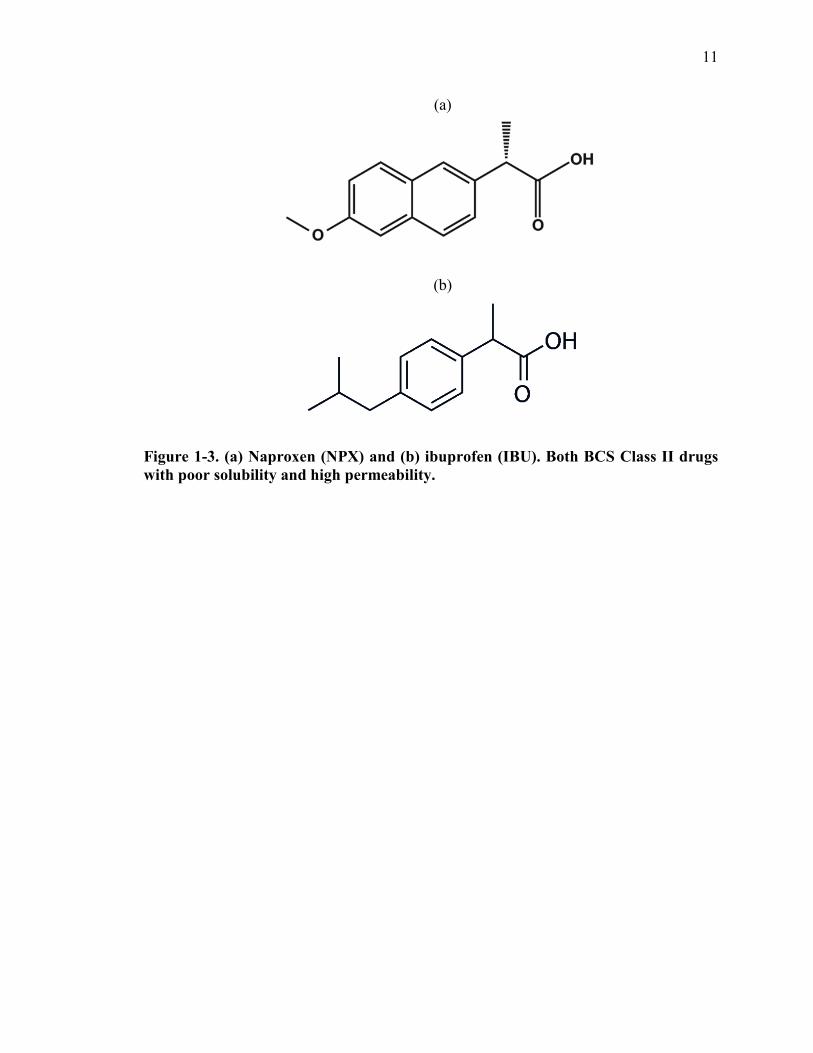
[40]. As seen in Figure 1-3a), the NPX drug molecule consists of two polar side groups,
namely methoxy and carboxylate, joined by a central hydrophobic naphthalene ring [41].
IBU, on the other hand (Figure 1-3b), is a more soluble molecule comprised of a benzene
ring conjugated to a propionic acid [42].
Table 1-3. Properties of naproxen and ibuprofen. Taken from [42, 43]. Naproxen (NPX) Ibuprofen (IBU) Water Solubility (at 25 °C) 15.9 mg/L 21 mg/L
logP 3.18 3.97 pKa 4.15 4.91
11
(a)
(b)
Figure 1-3. (a) Naproxen (NPX) and (b) ibuprofen (IBU). Both BCS Class II drugs with poor solubility and high permeability.

12
Chapter 2 Robust emulsion precipitation methodology for
producing naproxen nanoparticles
2.1 Summary
In this chapter, the Emulsion Diffusion technique was optimized for the production of
nanoparticles of weakly acidic drugs. Up to date, most of the published work related to
this technique requires that resultant nanosuspensions be homogenized at high pressures
so as to be able to process higher drug concentrations and further reduce the particle size
of the crystals by preventing coalescence and agglomeration [44]. After testing several
organic solvents and ionic and non-ionic surfactants within a wide HLB range, the
combination of ethyl acetate and amphoteric surfactant soy lecithin yielded stable
nanocrystals for which no further modification was required.
An experimental design based on DOE approaches was then executed to test the
robustness of formulation and process parameters. The models accurately predicted stable
nanoparticles at drug concentrations as high as 150 mg/ml for poor water-soluble drugs
NPX and IBU.
2.2 Introduction
The motivation in this first task was based on a thorough analysis of current bottom-
up particle size reduction techniques and noting that no statistically robust methodology
exists for producing nanoparticles. Specifically, it was found that for each drug, an
extensive physicochemical screening of the drug’s compatibilities [45, 46],

13
thermodynamic properties, as well as solubility in different organic solvents and
polymers [46-49], need to be assayed prior to engineering a particle size reduction
process. Other energy-intensive processes such as wet-stirred media milling and spray-
drying require careful scale-up considerations so as to ensure that there is no active
degradation by stored excess energy within the molecule that can lead to instability or
polymorphism of the resultant nanoparticles.
Several groups have published detailed processing steps for production of naproxen
(NPX) nanoparticles [9, 50-52] but these works have focused on utilizing an anionic
surfactant known as sodium dodecyl sulfate (SDS). Although this formulation seems to
work well for wet-stirred media milling applications, it has been reported that in order to
inhibit coagulation, high viscosity polymers need to be used so as to achieve adequate
content uniformity [9].
In this task there were two objectives; first, to engineer a flexible bottom-up process
for reducing particle size and second, to evaluate the robustness of the process using
designed experiments. The robustness of the process with respect to the drug substance
was validated by testing the formulation with a second poor water-soluble drug,
ibuprofen (IBU). The initial screening consisted of an assessment of differing drug
concentrations, organic solvents, continuous phase volumes, emulsification energies,
extraction temperatures, types of surfactant and surfactant concentrations, as these
parameters have been previously identified as main factors affecting nanoparticle yield
[44, 53, 54]. Surfactants, depending on their HLB (Hydrophile-Lipophile Balance),
reduce the interfacial tension between the continuous and discontinuous phases, while
also stabilizing emulsion droplets and precipitated drugs against coalescence and
14
coagulation [54]. The HLB system was designed for characterizing non-ionic surfactants
but accurate estimates can also be made for ionic surfactants if a correction factor is used
[55]. As a guideline, the higher the HLB of a surfactant the higher its solubility in water.
High HLB surfactants favor O/W emulsions while low HLB favor W/O. Consequently,
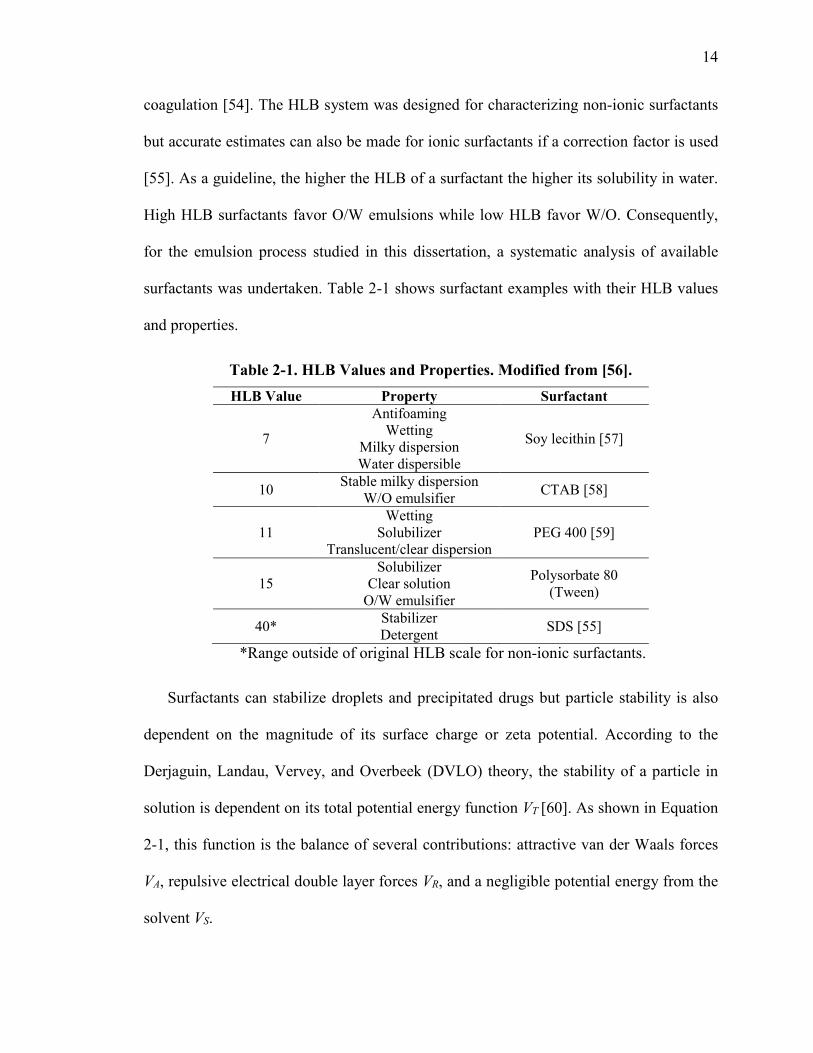
for the emulsion process studied in this dissertation, a systematic analysis of available
surfactants was undertaken. Table 2-1 shows surfactant examples with their HLB values
and properties.
Table 2-1. HLB Values and Properties. Modified from [56]. HLB Value Property Surfactant
7
Antifoaming Wetting
Milky dispersion Water dispersible
Soy lecithin [57]
10 Stable milky dispersion W/O emulsifier CTAB [58]
11 Wetting
Solubilizer Translucent/clear dispersion
PEG 400 [59]
15 Solubilizer
Clear solution O/W emulsifier
Polysorbate 80 (Tween)
40* Stabilizer Detergent SDS [55]
*Range outside of original HLB scale for non-ionic surfactants.
Surfactants can stabilize droplets and precipitated drugs but particle stability is also
dependent on the magnitude of its surface charge or zeta potential. According to the
Derjaguin, Landau, Vervey, and Overbeek (DVLO) theory, the stability of a particle in
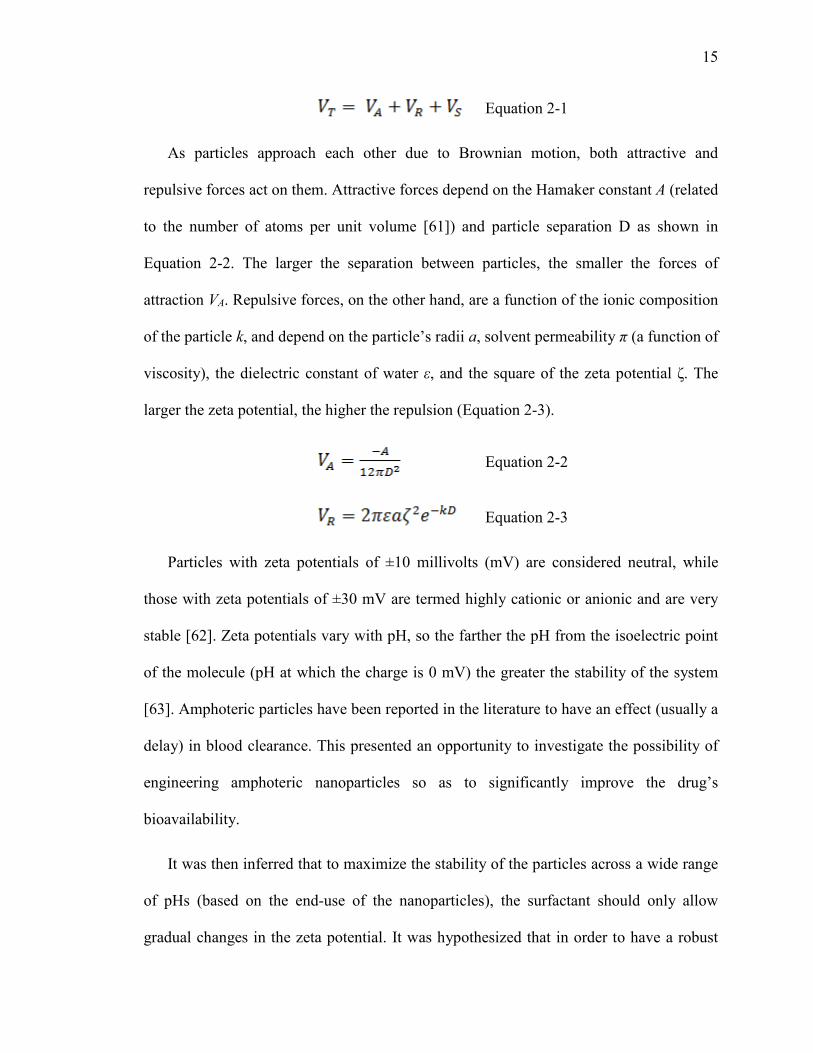
solution is dependent on its total potential energy function VT [60]. As shown in Equation
2-1, this function is the balance of several contributions: attractive van der Waals forces
VA, repulsive electrical double layer forces VR, and a negligible potential energy from the
solvent VS.
15
Equation 2-1
As particles approach each other due to Brownian motion, both attractive and
repulsive forces act on them. Attractive forces depend on the Hamaker constant A (related
to the number of atoms per unit volume [61]) and particle separation D as shown in
Equation 2-2. The larger the separation between particles, the smaller the forces of
attraction VA. Repulsive forces, on the other hand, are a function of the ionic composition
of the particle k, and depend on the particle’s radii a, solvent permeability π (a function of
viscosity), the dielectric constant of water ε, and the square of the zeta potential ζ. The
larger the zeta potential, the higher the repulsion (Equation 2-3).
Equation 2-2
Equation 2-3
Particles with zeta potentials of ±10 millivolts (mV) are considered neutral, while
those with zeta potentials of ±30 mV are termed highly cationic or anionic and are very
stable [62]. Zeta potentials vary with pH, so the farther the pH from the isoelectric point
of the molecule (pH at which the charge is 0 mV) the greater the stability of the system
[63]. Amphoteric particles have been reported in the literature to have an effect (usually a
delay) in blood clearance. This presented an opportunity to investigate the possibility of
engineering amphoteric nanoparticles so as to significantly improve the drug’s
bioavailability.
It was then inferred that to maximize the stability of the particles across a wide range
of pHs (based on the end-use of the nanoparticles), the surfactant should only allow
gradual changes in the zeta potential. It was hypothesized that in order to have a robust
16
nanosizing process for poor water-soluble weak acid drugs, a surfactant with both
cationic and anionic properties should be investigated, i.e., an amphoteric (zwitterionic)
surfactant such as soy lecithin. An added advantage of these surfactants is that at low pH
they act as cationic surfactants while at high pH as anionic ones. The carboxylic
dissociation of naproxen in water ensures that at higher pH the nanoparticles will be
stable, but at low pH the equilibrium solubility of pure weak acids, including NPX, is
practically zero. Thus, due to the surfactant’s zwitterionic properties and the increased
particle surface area, an enhanced drug dissolution rate at low pH is also expected.
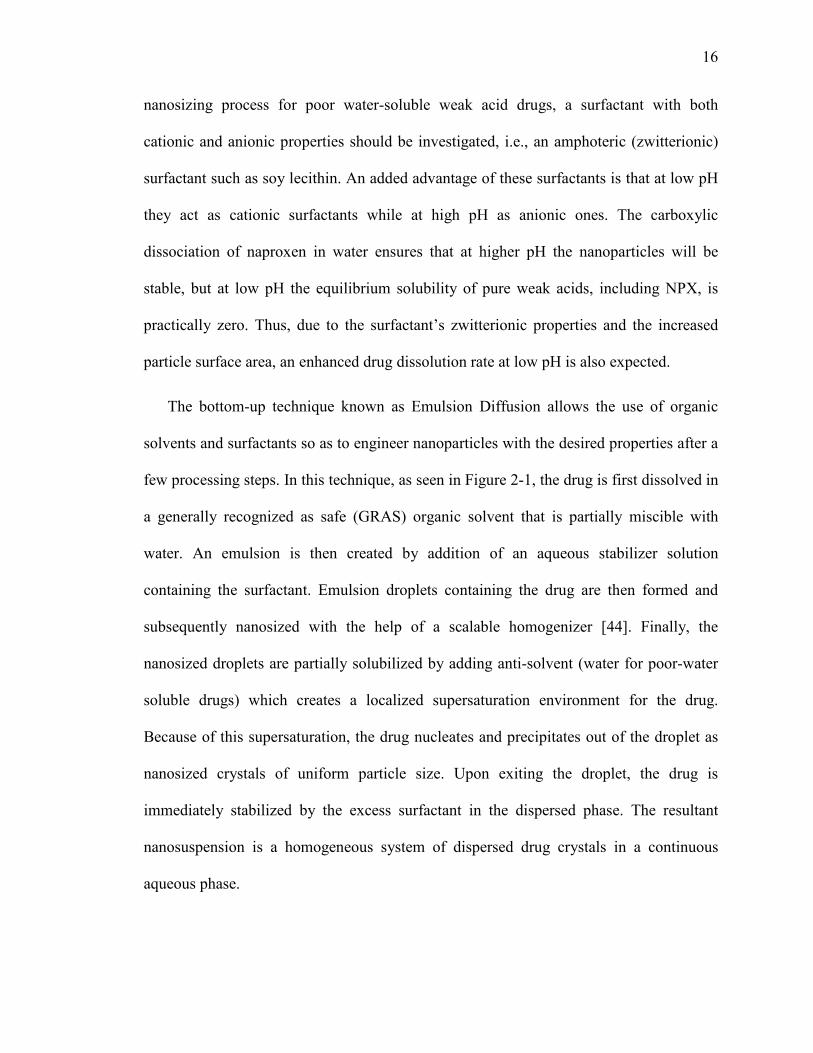
The bottom-up technique known as Emulsion Diffusion allows the use of organic
solvents and surfactants so as to engineer nanoparticles with the desired properties after a
few processing steps. In this technique, as seen in Figure 2-1, the drug is first dissolved in
a generally recognized as safe (GRAS) organic solvent that is partially miscible with
water. An emulsion is then created by addition of an aqueous stabilizer solution
containing the surfactant. Emulsion droplets containing the drug are then formed and
subsequently nanosized with the help of a scalable homogenizer [44]. Finally, the
nanosized droplets are partially solubilized by adding anti-solvent (water for poor-water
soluble drugs) which creates a localized supersaturation environment for the drug.
Because of this supersaturation, the drug nucleates and precipitates out of the droplet as
nanosized crystals of uniform particle size. Upon exiting the droplet, the drug is
immediately stabilized by the excess surfactant in the dispersed phase. The resultant
nanosuspension is a homogeneous system of dispersed drug crystals in a continuous
aqueous phase.

17
Figure 2-1. Emulsion precipitation process for producing drug nanoparticles.
2.3 Materials and Methods
2.3.1 Materials
The following materials were used:
Table 2-2. Materials used for nanoemulsions
Material Vendor Naproxen (NPX) Tokio Chemical Industry
Lecithin, from soybean Beantown Chemical BTC n-butyl lactate Acros Organics MS Ethyl acetate BDH Solvents - B&J
Triacetin Acros Organics MS Sodium dodecyl sulfate (SDS) MP Biomedicals
Polysorbate 80 (Tween 80) Alfa Aesar Cetyl trimethylammonium bromide (CTAB) Spectrum Chemical Mfg Corp
Hydroxypropyl methylcellulose (HPMC) Sigma Aldrich
2.3.2 Emulsion precipitation
For each run, two precursor solutions were gravimetrically prepared at room
temperature (unless otherwise noted) and stirred magnetically: (1) a NPX solution in 20
ml of GRAS organic solvent, and (2) an 80 g surfactant solution in deionized (DI) water.
An additional 200 g of DI water were also needed to promote drug precipitation from the

18
emulsion droplet. A high-shear Polytron PT 10/35 homogenizer (Kinematica Inc.,
Bohemia, NY) operating at 12,500 rpm was used for mixing/shearing the solutions and
preparing the nanoemulsions. The ratios for these solutions were iterated based on studies
by Romanski et al. [44] and saturation solubilities reported for naproxen and ibuprofen
(refer to Table 1-3).
A descriptive experimental protocol was generated and is attached in Appendix I.
2.3.3 Particle size analysis
Particle size data (d10, d50 and d90) and polydispersity index (PI) were recorded with a
Delsa NanoS Particle Analyzer (Beckman Coulter, Pasadena, CA) with no further sample
preparation. All results shown in figures 2-2 to 5 and used for the experimental design are
the average of three separate readings.
2.3.4 Zeta potential
Zeta potential measurements of filtered and unfiltered stock nanosuspensions
precipitated from ethyl acetate and triacetin were recorded in a Zetasizer Nano (Malvern
Instrument, Westborough, MA). Configuration parameters were optimized based on
water as a solvent. These parameters were fixed at:
• Viscosity = 0.8872 cP (at 25°C);
• Dispersant dielectric constant = 78.5 (at 20°C), and
• Co-average of 30 runs
Phosphate buffers (PBS) and sodium hydroxide (NaOH) solutions were prepared to
span a pH range from 4.4 to 11.0. After centrifuging the nanosuspensions, these were
19
combined with the solutions in an effort to record zeta potential ζ as a function of pH and
thus find the pH at which the particles were most stable.
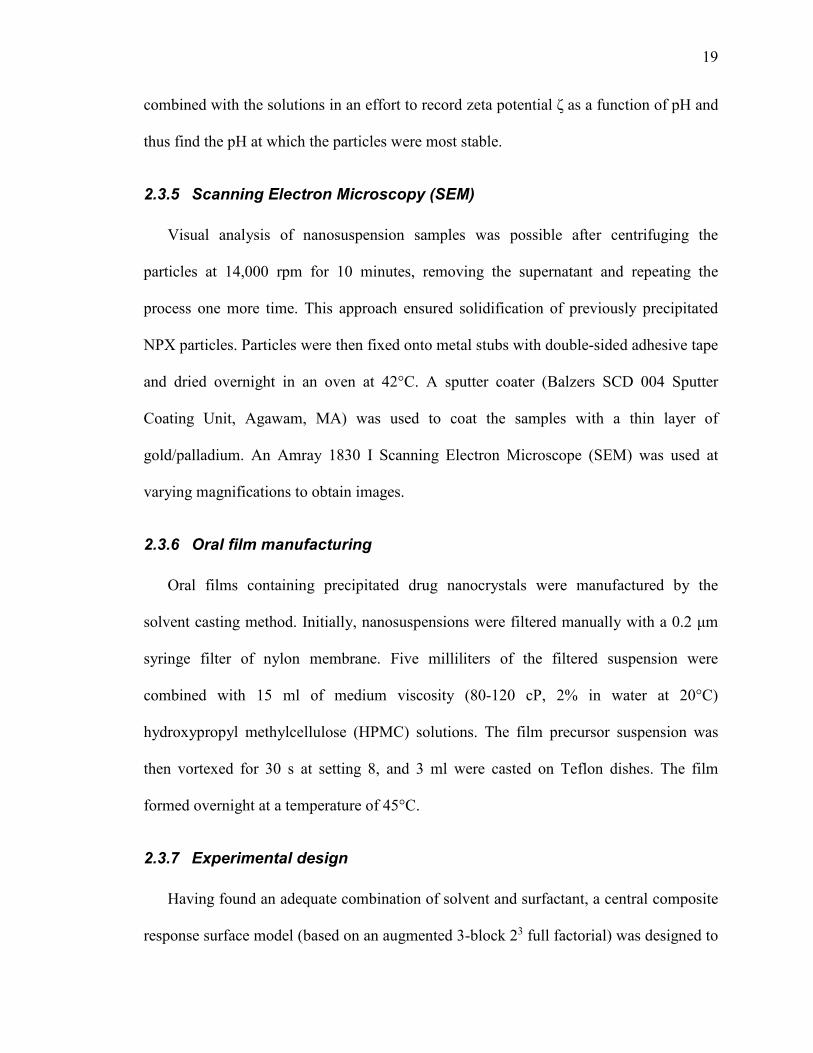
2.3.5 Scanning Electron Microscopy (SEM)
Visual analysis of nanosuspension samples was possible after centrifuging the
particles at 14,000 rpm for 10 minutes, removing the supernatant and repeating the
process one more time. This approach ensured solidification of previously precipitated
NPX particles. Particles were then fixed onto metal stubs with double-sided adhesive tape
and dried overnight in an oven at 42°C. A sputter coater (Balzers SCD 004 Sputter
Coating Unit, Agawam, MA) was used to coat the samples with a thin layer of
gold/palladium. An Amray 1830 I Scanning Electron Microscope (SEM) was used at
varying magnifications to obtain images.
2.3.6 Oral film manufacturing
Oral films containing precipitated drug nanocrystals were manufactured by the
solvent casting method. Initially, nanosuspensions were filtered manually with a 0.2 μm
syringe filter of nylon membrane. Five milliliters of the filtered suspension were
combined with 15 ml of medium viscosity (80-120 cP, 2% in water at 20°C)
hydroxypropyl methylcellulose (HPMC) solutions. The film precursor suspension was
then vortexed for 30 s at setting 8, and 3 ml were casted on Teflon dishes. The film
formed overnight at a temperature of 45°C.
2.3.7 Experimental design
Having found an adequate combination of solvent and surfactant, a central composite
response surface model (based on an augmented 3-block 23 full factorial) was designed to
20
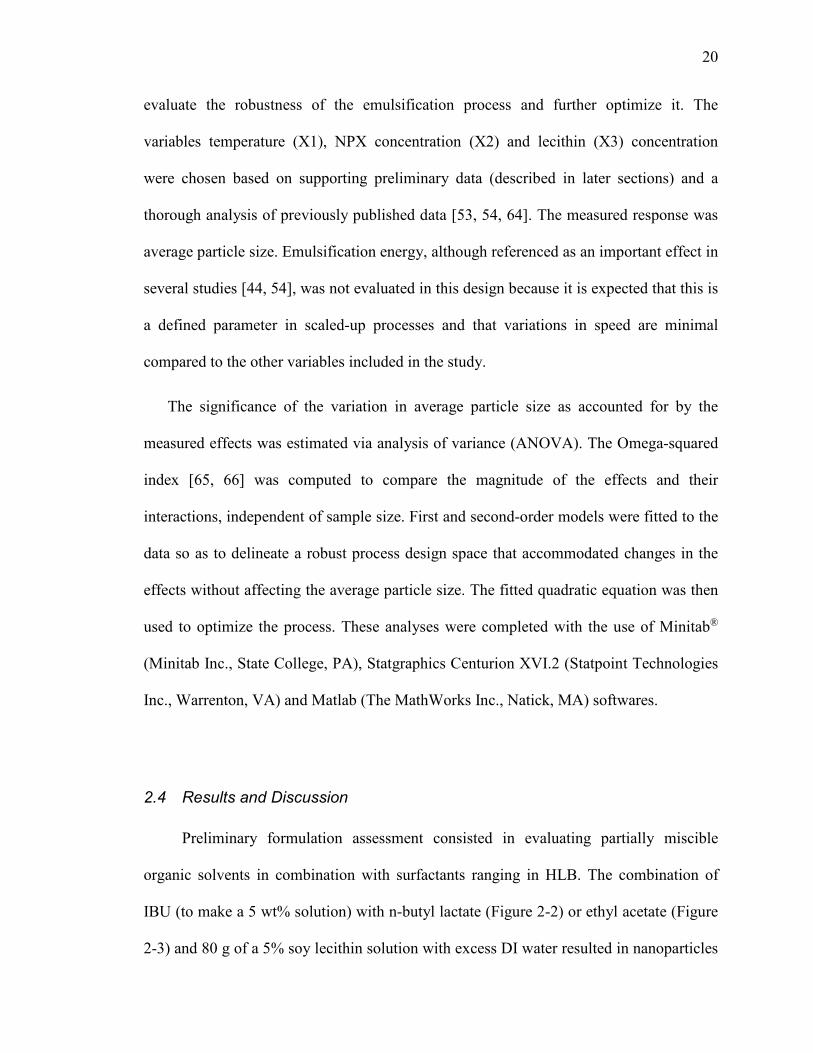
evaluate the robustness of the emulsification process and further optimize it. The
variables temperature (X1), NPX concentration (X2) and lecithin (X3) concentration
were chosen based on supporting preliminary data (described in later sections) and a
thorough analysis of previously published data [53, 54, 64]. The measured response was
average particle size. Emulsification energy, although referenced as an important effect in
several studies [44, 54], was not evaluated in this design because it is expected that this is
a defined parameter in scaled-up processes and that variations in speed are minimal
compared to the other variables included in the study.
The significance of the variation in average particle size as accounted for by the
measured effects was estimated via analysis of variance (ANOVA). The Omega-squared
index [65, 66] was computed to compare the magnitude of the effects and their
interactions, independent of sample size. First and second-order models were fitted to the
data so as to delineate a robust process design space that accommodated changes in the
effects without affecting the average particle size. The fitted quadratic equation was then
used to optimize the process. These analyses were completed with the use of Minitab®
(Minitab Inc., State College, PA), Statgraphics Centurion XVI.2 (Statpoint Technologies
Inc., Warrenton, VA) and Matlab (The MathWorks Inc., Natick, MA) softwares.
2.4 Results and Discussion
Preliminary formulation assessment consisted in evaluating partially miscible
organic solvents in combination with surfactants ranging in HLB. The combination of
IBU (to make a 5 wt% solution) with n-butyl lactate (Figure 2-2) or ethyl acetate (Figure
2-3) and 80 g of a 5% soy lecithin solution with excess DI water resulted in nanoparticles

21
with an average particle size lower than 250 nm and low polydispersity index (PI ˂ 0.25).
For the same solvent-to-surfactant ratio, NPX nanocrystals with an average particle size
of 179 nm and 98 nm were precipitated from ethyl acetate (Figure 2-4) and triacetin
(Figure 2-5), respectively. Fresh triacetin nanosuspensions were monodisperse with a
narrow PSD and a d90 = 167 nm. However, there was significant particle growth within
one week and ensuring complete solubilization of the API was problematic.
Figure 2-2. Particle size data for IBU nanoparticles precipitated from-butyl lactate.

22
Figure 2-3. Particle size data for IBU nanoparticles precipitated from ethyl acetate.
Figure 2-4. Particle size data for NPX nanoparticles precipitated from ethyl acetate.

23
Figure 2-5. Particle size data for NPX nanoparticles precipitated from triacetin.
Tween 80 and ionic surfactants SDS (anionic) and CTAB (cationic) were combined
with ethyl acetate and NPX to evaluate if further reductions in particle sized and PI were
possible. Tween 80 yielded relatively large unstable particles. Both SDS and CTAB gave
unsatisfactory results as large white agglomerates formed that impeded droplet formation.
Moreover, the CTAB suspension was a milky dispersion that when sheared, it foamed
excessively. Foam evaporation can cause pre-mature drug precipitation that leads to
uncontrollable particle growth. Even at lower 1% surfactant concentrations it did not
reduce NPX particle size or PI when compared to soy-lecithin results.
Additional particle stability studies consisted in evaluating the zeta potential of
nanocrystals precipitated from ethyl acetate – lecithin and ethyl acetate – Tween 80
combinations. Normally, colloidal systems with low zeta potential values have poor
24
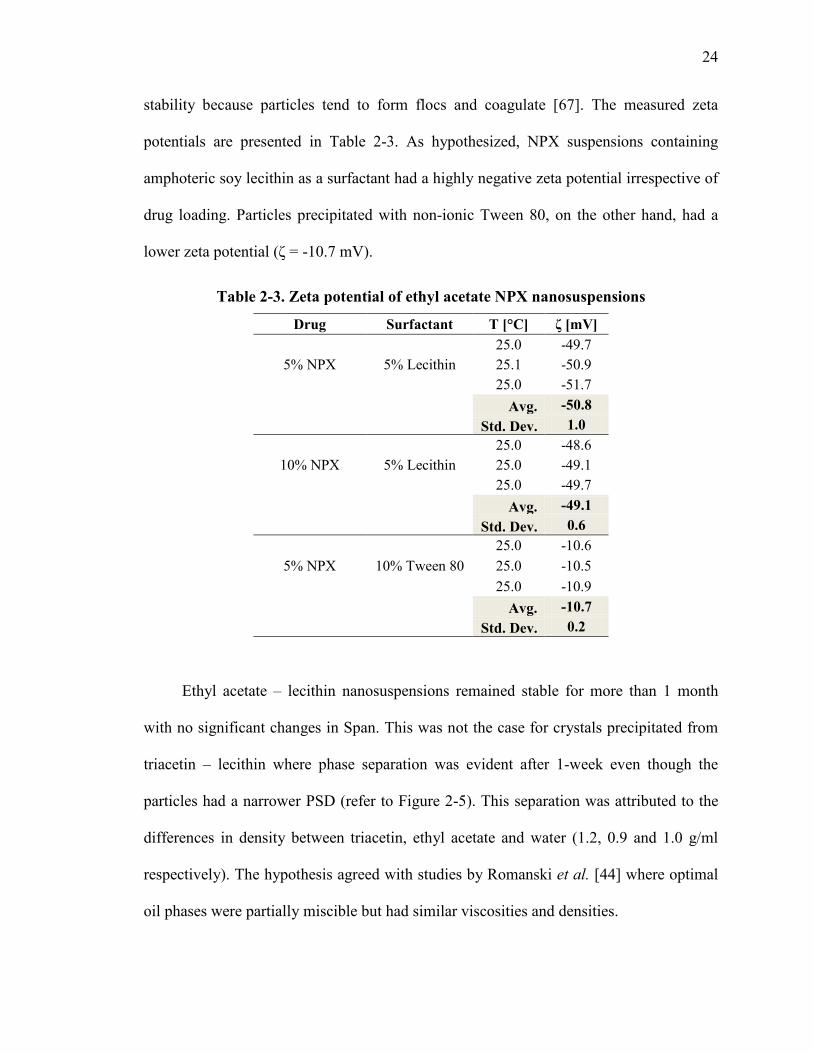
stability because particles tend to form flocs and coagulate [67]. The measured zeta
potentials are presented in Table 2-3. As hypothesized, NPX suspensions containing
amphoteric soy lecithin as a surfactant had a highly negative zeta potential irrespective of
drug loading. Particles precipitated with non-ionic Tween 80, on the other hand, had a
lower zeta potential (ζ = -10.7 mV).
Table 2-3. Zeta potential of ethyl acetate NPX nanosuspensions
Drug Surfactant T [°C] ζ [mV]
5% NPX 5% Lecithin 25.0 -49.7 25.1 -50.9 25.0 -51.7
Avg. -50.8 Std. Dev. 1.0
10% NPX 5% Lecithin 25.0 -48.6 25.0 -49.1 25.0 -49.7
Avg. -49.1
Std. Dev. 0.6
5% NPX 10% Tween 80 25.0 -10.6 25.0 -10.5 25.0 -10.9
Avg. -10.7
Std. Dev. 0.2
Ethyl acetate – lecithin nanosuspensions remained stable for more than 1 month
with no significant changes in Span. This was not the case for crystals precipitated from
triacetin – lecithin where phase separation was evident after 1-week even though the
particles had a narrower PSD (refer to Figure 2-5). This separation was attributed to the
differences in density between triacetin, ethyl acetate and water (1.2, 0.9 and 1.0 g/ml
respectively). The hypothesis agreed with studies by Romanski et al. [44] where optimal
oil phases were partially miscible but had similar viscosities and densities.

25
To further study this effect, nanocrystals from fresh triacetin suspensions (5% NPX
– 5% lecithin) were centrifuged and suspended in PBS and NaOH solutions of varying
pH. The aim was to evaluate surface charge as a function of ionic composition of the
media. Identifying the molecule’s isoelectric point (pH value at which the surface of the
NPX particles is zero, ζ = 0 mV) could then possibly prevent phase separation after
modifying surface charge. Zeta potential measurements of the stock suspension was ζ = -
50.8 mV in pH of 5.1.
Additional recordings were performed on the suspensions with triacetin-lecithin
nanocrystals at varying pHs. As expected, there was a pH (black full dot in Figure 2-6) at
which the NPX nanoparticles were most unstable and thus ζ = 0 mV.
Figure 2-6. Zeta potential of NPX nanoparticles as a function of pH. The red marker represents the most unstable conditions, as near the isoelectric point of the molecule.

26
The crystallinity of the glass suspension was evaluated visually using SEM. The
nanoparticles were centrifuged, mounted on stubs and oven dried overnight to remove
residual solvents prior to analysis. This processing led to an increase in the average size
of the crystals from 179 nm to more than 1 μm, due to the induced aggregation by
centrifugal forces. However, crystalline NPX particles are clearly visible in Figure 2-7.
(a)
(b)
Figure 2-7. Centrifuged NPX particles precipitated from ethyl acetate and soy lecithin. Magnifications of (a) 1,500x, and (b) 8,000x.

27
Crystalline glass suspensions in the form of oral films were produced by combining
filtered nanosuspensions with medium viscosity amorphous HPMC, mixing and casting,
as detailed in Section 2.3.6. After drying, flexible thin films were removed from the
plates (Figure 2-8). SEM analysis on the film, as seen in Figure 2-9, revealed that the
polymer formed a steric barrier around the NPX particles. This finding was advantageous
as the polymer seemed to bear two important functions in the formulation: matrix former
and particle stabilizer. In Chapter 3 it will be shown that this steric and kinetic
stabilization prevented particle growth and agglomeration, even on 5-month old
suspensions.
Figure 2-8. Oral films containing the nanocrystalline NPX particles.

28
Figure 2-9. Steric HPMC polymer barrier around NPX particle embedded in oral film.
After validating the utility of the Emulsion Diffusion process for producing glass
suspensions and further embedding these in oral films, the robustness of the technique
was evaluated. Initially, various concentration ranges based on preliminary studies were
assayed under the microscope so as to check whether there were obvious differences in
particle size as a function of NPX and lecithin concentrations and precipitating
temperature.
Figure 2-10 shows unfiltered microscope images of NPX particles of sub-micron
size. Visually, there seemed to be differences based on the three variables: drug (X-axis)
and surfactant (Y-axis) concentration, and temperature at 10°C and 25°C. However,
average particle size (upper-left hand side in sub-plots) did not differ much. At low
concentrations and standard temperature pressure conditions (STP) for the water
antisolvent particles seemed to be agglomerated. Precipitation at 10°C however, led to
more dispersed particles. At high NPX – low lecithin concentrations the particles were

29
clearly monodisperse. Still, at higher surfactant concentrations PSD remained
monodisperse but nanocrystals appeared larger. The significance of these differences
were tested via an experimental design.
Figure 2-10. Microscope images of unfiltered NPX nanoparticles. Quadrants are based on 5 and 10% for both NPX and lecithin concentrations. The small sub-plots are categorized by antisolvent temperature, 25 °C (STP) and 10 °C.
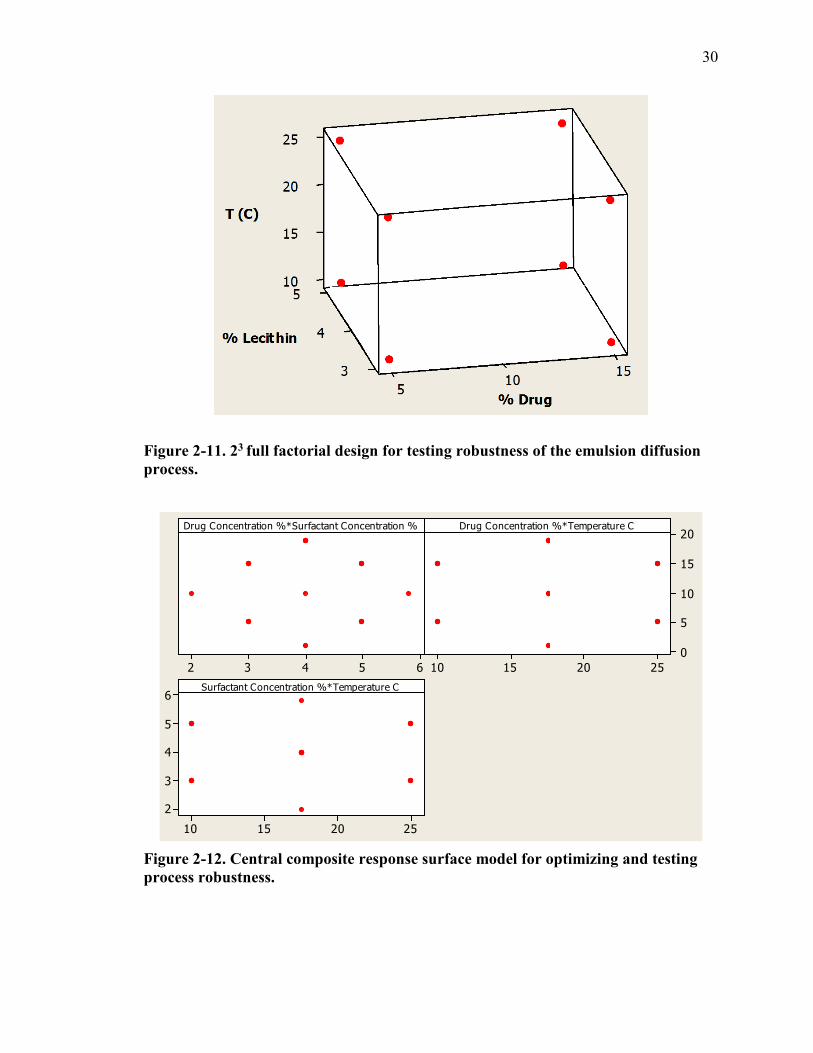
The initial design consisted of a three-factor two level (23) full factorial in 3
blocks (one block is presented in Figure 2-11). The design was then augmented to a
response surface model (RSM) by the addition of axial and center points. Figure 2-12
shows the Draftman’s plot with all tested variable combinations. This fuller design
required a total of 35 experimental runs, all of which were uniformly executed as
described in Appendix I. The results are shown in Table 2-4.
30
Figure 2-11. 23 full factorial design for testing robustness of the emulsion diffusion process.
65432 25201510
20
15
10
5
0
25201510
6
5
4
3
2
Drug Concentration %*Surfactant Concentration % Drug Concentration %*Temperature C
Surfactant Concentration %*Temperature C
Figure 2-12. Central composite response surface model for optimizing and testing process robustness.
31
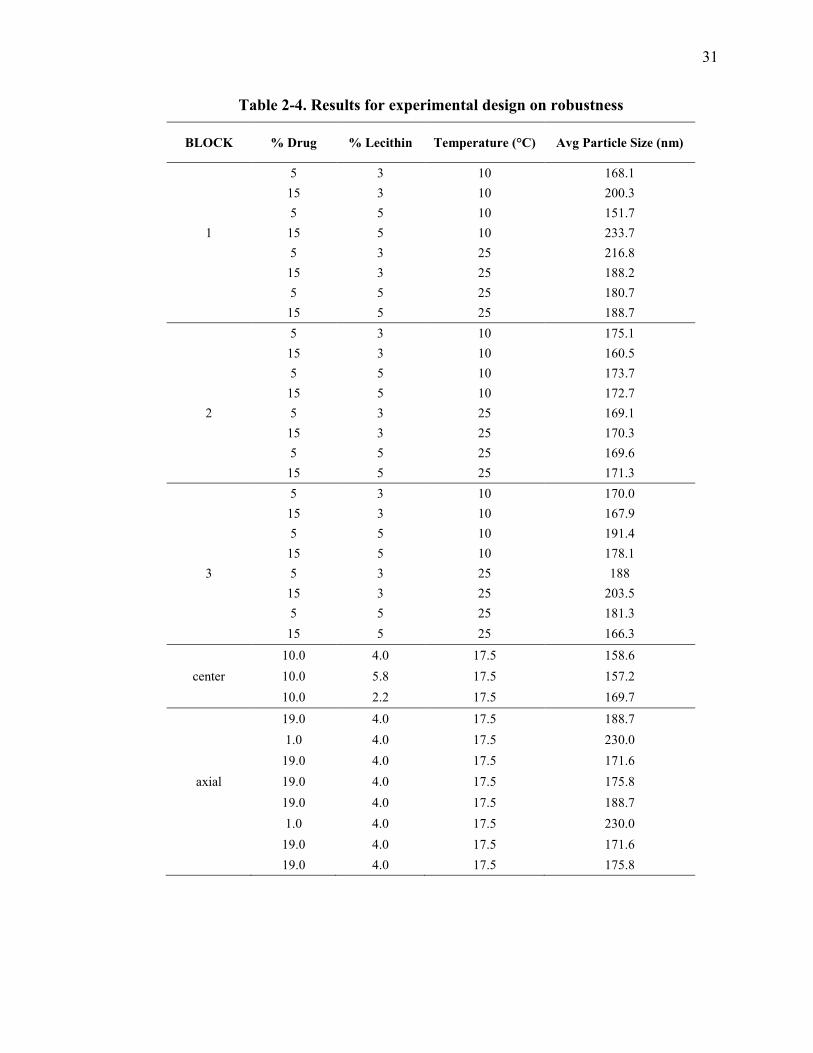
Table 2-4. Results for experimental design on robustness
BLOCK % Drug % Lecithin Temperature (°C) Avg Particle Size (nm)
5 3 10 168.1 15 3 10 200.3 5 5 10 151.7
1 15 5 10 233.7 5 3 25 216.8 15 3 25 188.2 5 5 25 180.7 15 5 25 188.7 5 3 10 175.1 15 3 10 160.5 5 5 10 173.7 15 5 10 172.7
2 5 3 25 169.1 15 3 25 170.3 5 5 25 169.6 15 5 25 171.3 5 3 10 170.0 15 3 10 167.9 5 5 10 191.4 15 5 10 178.1
3 5 3 25 188 15 3 25 203.5 5 5 25 181.3 15 5 25 166.3
10.0 4.0 17.5 158.6 center 10.0 5.8 17.5 157.2
10.0 2.2 17.5 169.7 19.0 4.0 17.5 188.7 1.0 4.0 17.5 230.0 19.0 4.0 17.5 171.6
axial 19.0 4.0 17.5 175.8 19.0 4.0 17.5 188.7 1.0 4.0 17.5 230.0 19.0 4.0 17.5 171.6 19.0 4.0 17.5 175.8

32
Table 2-5 shows the interactions and estimated effects with their standard error.
Absolute standardized effects were calculated by dividing the estimate (coefficient) by
the standard error. These were plotted in decreasing order of importance in the Pareto
chart shown in Figure 2-13, where the blue line limits an alpha of 0.05 for significant
effects.
Table 2-5. Estimated effects and interactions for average particle size. Effect Estimate Stnd. Error average 158.6 19.6 A:% Drug -17.5 10.7 B:% Lecithin -4.9 12.8 C:Temperature (C) 4.2 8.0 AA 74.6 41.9 AB 15.9 25.9 AC -15.1 14.4 BB 9.7 48.0 BC -20.6 14.4 CC 18.2 19.6
0 0.4 0.8 1.2 1.6 2 2.4Standardized effect
BB
B:% Lecithin
C:Temperature (C)
AB
CC
AC
BC
A:% Drug
AA +-
Figure 2-13. Standardized Pareto chart for average particle size
Analysis of variance (ANOVA) and omega-squared (ω2) results for the RSM are
presented in Table 2-6. As stated earlier, ANOVA tests the statistical significance of each

33
effect by comparing their mean square against an estimate of the experimental error. The
Omega-squared test, on the other hand, estimates the magnitude (or size) of these effects
in the variance of the response. Unlike the p-value, which will almost always demonstrate
a significant difference if sample size is sufficiently large, the ω2 statistic is independent
of sample size.
Table 2-6. Analysis of variance (ANOVA) results for average particle size
Source Sum of Squares Df Mean
Square F-Ratio p-Value ω2 Size Order - | +
A: % Drug 1025.08 1 1025.08 2.67 0.115 0.044
B: % Lecithin 55.4203 1 55.4203 0.14 0.707 -0.023 C: Temperature (C) 106.682 1 106.682 0.28 0.603 -0.019 AA 1216.34 1 1216.34 3.16 0.087 0.057 AB 144.06 1 144.06 0.37 0.546 -0.017 AC 420.007 1 420.007 1.09 0.306 0.002 BB 15.6817 1 15.6817 0.04 0.842 -0.025 BC 786.615 1 786.615 2.05 0.165 0.028 CC 331.969 1 331.969 0.86 0.362 -0.004 Total error 9608.94 25 384.357 Total (corr.) 14141.7 34
Drug concentration, its curvature, and the interaction between temperature and
surfactant had the largest effects according to ω2 however, no effects have p-values less
than 0.05 indicating that the difference in means for the response are not significantly
different from 0 at 95% confidence interval. The ω2 size order for the effects and
interactions matched the absolute standardized effects plotted in Pareto. Figure 2-14
presents the interaction plot for the effects.
Emulsion precipitation is fundamentally dependent on the super saturation of the
system or the degree of miscibility between the drug, the surfactant and both the organic
and continuous solvents. In principle, a higher NPX concentration leads to faster
precipitation because the system tends to thermodynamic equilibrium. A faster process
leads to uncontrolled nucleation (which depends on temperature) and particle growth that

34
result in higher average particle size and a wider PSD. On the other hand, very low NPX
concentrations may not promote droplet formation because the surfactant can solubilize
the drug. So for the emulsion diffusion technique, drug, surfactant and temperature
effects are not linear. Moreover, there exist two crossover interactions with the solvent
temperature. This fact is further validated in Figure 2-14 and from the main effects plot in
Figure 2-15 where at various drug levels a curvature emerges. Linear, linear with
interaction, linear with quadratic terms and full quadratic equations were fitted to the data
following the method of steepest descent [68] for 1.0 step decrease of the drug
concentration. This method fits the data starting from the center of the experimental
design and moving towards regions were minimal changes in the variables largely affect
the mean of the response. As expected, due to the important curvatures in the system, a
higher order polynomial function, specifically a quadratic equation (Equation 2-1) [68]
best describe the data. The truncated terms for the model are shown in Equation 2-1 and
the estimated β regression coefficients are listed in Table 2-7.
53 2510190
180
170190
180
170
% Drug
% Lecithin
T emperature (°C)
515
% Drug
35
% Lecithin
Figure 2-14. Interaction plot and the effect on average particle size.

35
1.0
% Lecithin
5.8 25.0
150
160
170
180
190
200
210
Avg
PS
(nm
)
% Drug
19.0 2.2
Temperature (C)
10.0
Figure 2-15. Main effects plot for average particle size.
Equation 2-1
The fitted β regression coefficients for the quadratic equation are listed in Table
2-7. The fitted model was validated internally and externally (Table 2-8) by predicting
the average particle size of the data inside the model (35 runs) and 5 new runs. The
average bias for particle size was 12 nm for both sets.
Table 2-7. Regression coefficients for average particle size Coefficient Estimate constant 234.975 A:Drug -10.1885 B:Lecithin -4.8654 C:Temp (C) -1.21223 AA 0.460456 AB 0.49 AC -0.111556 BB 1.49691 BC -0.763333 CC 0.161778

36
Table 2-8. Prediction results for average particle size (nm)
Runs in Model Observed Predicted Abs Error 1 168 177 9 2 200 171 29 3 152 181 30 4 234 185 49 5 217 201 15 6 188 178 10 7 181 182 2 8 189 169 20 9 175 177 2
10 161 171 11 11 174 181 8 12 173 185 12 13 169 201 32 14 170 178 8 15 170 182 13 16 171 169 2 17 170 177 7 18 168 171 3 19 191 181 10 20 178 185 7 21 188 201 13 22 204 178 25 23 181 182 1 24 166 169 3 25 159 159 0 26 157 161 4 27 170 166 4 28 189 187 2 29 230 205 25 30 172 187 16 31 176 187 11 32 189 187 2 33 230 205 25 34 172 187 16 35 176 187 11
New Runs Observed Predicted Abs Error 10 %A, 4% B, 17.5 C 159 159 0
10 %A, 4% B, 3.9 C 209 185 24 15 %A, 5.8 % B, 17.5 C 157 161 4 10 %A, 2.2 %B, 17.5 C 170 166 4
10 %A, 4 %B, 31.1 C 162 192 30
Since the temperature effect presented crossover interactions with drug and
surfactant concentrations, individual contours of the estimated response (figures 2-16, 17
and 18) were created for all levels of this variable. Within these designs, the optimal

37
regions for achieving low average particle sizes are enclosed in the blueish-green areas as
detailed in the figure legends. As shown from the plots, the variable combinations
generated in this study resulted in a robust emulsion diffusion technique for particle size
reduction. Process limits are in the lower regions of 1% NPX with 2 or 3% lecithin at 25
°C.
Temp (C)=10.0
0 4 8 12 16 20Drug
2
3
4
5
6
Leci
thin
Avg Size150.0175.0200.0225.0250.0
Figure 2-16. Contours of estimated average particle size at T = 10.0 °C
Temp (C)=17.5
0 4 8 12 16 20Drug
2
3
4
5
6
Leci
thin
Avg Size150.0175.0200.0225.0250.0
Figure 2-17. Contours of estimated average particle size at T = 17.5 °C
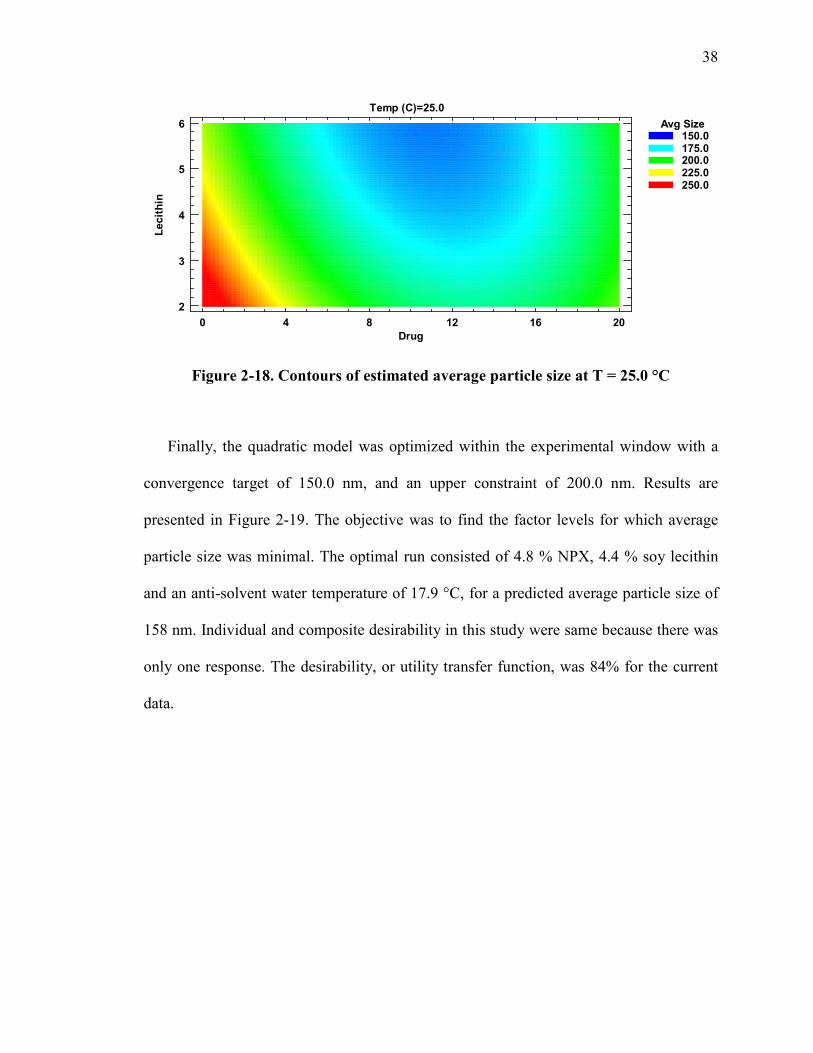
38
Temp (C)=25.0
0 4 8 12 16 20Drug
2
3
4
5
6
Leci
thin
Avg Size150.0175.0200.0225.0250.0
Figure 2-18. Contours of estimated average particle size at T = 25.0 °C
Finally, the quadratic model was optimized within the experimental window with a
convergence target of 150.0 nm, and an upper constraint of 200.0 nm. Results are
presented in Figure 2-19. The objective was to find the factor levels for which average
particle size was minimal. The optimal run consisted of 4.8 % NPX, 4.4 % soy lecithin
and an anti-solvent water temperature of 17.9 °C, for a predicted average particle size of
158 nm. Individual and composite desirability in this study were same because there was
only one response. The desirability, or utility transfer function, was 84% for the current
data.
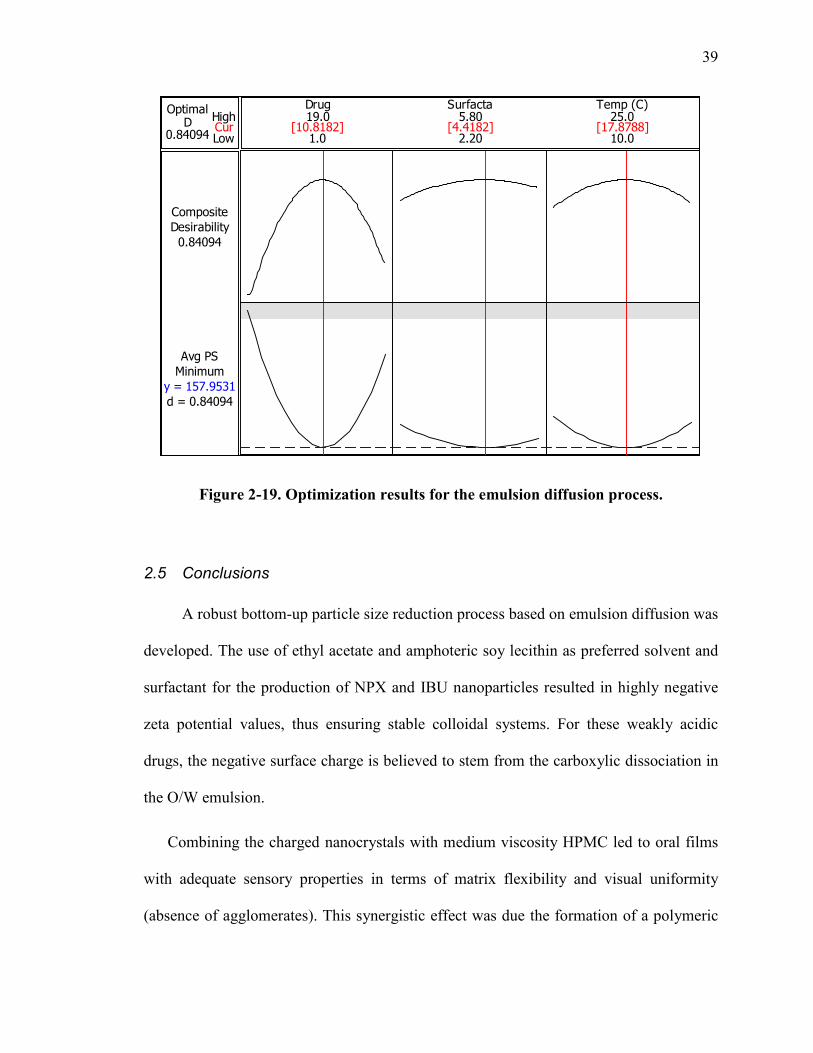
39
CurHigh
Low0.84094D
Optimal
d = 0.84094
MinimumAvg PS
y = 157.9531
0.84094DesirabilityComposite
10.0
25.0
2.20
5.80
1.0
19.0Surfacta Temp (C)Drug
[10.8182] [4.4182] [17.8788]
Figure 2-19. Optimization results for the emulsion diffusion process.
2.5 Conclusions
A robust bottom-up particle size reduction process based on emulsion diffusion was
developed. The use of ethyl acetate and amphoteric soy lecithin as preferred solvent and
surfactant for the production of NPX and IBU nanoparticles resulted in highly negative
zeta potential values, thus ensuring stable colloidal systems. For these weakly acidic
drugs, the negative surface charge is believed to stem from the carboxylic dissociation in
the O/W emulsion.
Combining the charged nanocrystals with medium viscosity HPMC led to oral films
with adequate sensory properties in terms of matrix flexibility and visual uniformity
(absence of agglomerates). This synergistic effect was due the formation of a polymeric
40
steric barrier around the particles. Undoubtedly, this layer increased particle size but
particle growth was minimized.
Formulation variables affecting bottom-up emulsion diffusion processes were
identified and the magnitude of their effects quantified. Among all the studied variables
(drug and surfactant concentration, and solvent temperature) drug concentration had the
largest effect on average particle size. Crossover interactions between drug and surfactant
with temperature were identified. These affected the super saturation ratio of the
emulsification process which eventually led to uncontrolled particle growth. A validated
second-order model that accurately predicts average particle size of weakly acidic drugs
from a formulation window of 1 - 20% drug, 2 – 6% surfactant, and 4 – 31°C antisolvent
temperature, with a bias of ±12 nm is presented. Finally, contour design spaces for
precipitating nanocrystals with average sizes of 150 – 250 nm via emulsion diffusion are
included in an effort to guide those interested in the technique.
41
Chapter 3 Biorelevant in vitro dissolution protocols for oral
films
3.1 Summary
A biorelevant dissolution protocol for assessment of drug release from oral films is
presented. The motivation for the study arose after a thorough evaluation of relevant
monographs and guidelines, and noting that currently, there is no established
methodology for testing the dissolution of oral transmucosal (transoral) films. The
development of a testing methodology that mimics the conditions of the human oral
cavity is expected to enhance understanding of the in vivo performance for improved in
vivo in vitro correlations (IVIVC) of oral film products.
To best simulate the physiological conditions in the mouth, a systematic approach
was undertaken to vary parameters that are known to affect oral film dissolution in a
flow-through cell USP IV apparatus. The selected parameters emulated changes in saliva
composition, pH, flow rate, volume, and finished product differences including film
thickness and drug content. The studies included: a) kinetic drug solubility measurements
in real and artificial saliva so as to optimize the biorelevant media used for further testing,
b) quantifying the effects of hydrodynamic changes on film dissolution, and c) evaluating
the discriminatory nature of the protocol in terms of product quality. The product
consisted of solvent-casted hydroxypropyl methylcellulose films embedded with poor
water-soluble drug naproxen (NPX) nanoparticles produced via wet-stirred media
milling.

42
NPX release from oral films was significantly affected by saliva pH and flow rate.
Neither the chemical composition nor volume of the artificial saliva effected major
differences in the dissolution curve. Curves were compared via difference f1 and
similarity f2 factors, and hierarchical cluster analysis. Furthermore, drug release was
proportional to media flow rate, but inversely proportional to film thickness and NPX
content.
Recommendations for future assessment of drug release from oral films are presented.
These include securing oral films in a specific pattern within the USP IV flow-through
cell; using Saliva A (pH 6.2) as a biorelevant media to simulate oromucosal fluid
independent of target population; setting media flow rate at 16 ml/min to achieve high
product discrimination in terms of drug onset and film thickness, and comparing two or
more dissolution curves with metrics other that f1 and f2.
3.2 Introduction
Dissolution or drug release tests are essential for most pharmaceutical products.
From the formulation perspective, intrinsic and apparent dissolution rate data is used for
predicting bioavailability by characterizing the solubility behavior and the total mass of
drug dissolved per unit time. For example, Abdou [69] reported that absorption of drugs
with intrinsic dissolution rates of 0.1 mg/(min cm2) or less were likely to be dissolution-
rate limited processes. As such, preprocesses for enhancing their dissolution rates, such
as particle size reduction techniques, complex formation, chemical modifications, etc.
needed to be taken into consideration. From the quality control perspective, drug release
testing serves the purpose of evaluating lot-to-lot quality, stability of drug product, and
assuring the regulatory agency that the manufactured product: (1) is not different from

43
the “golden batch” used to register the product, and (2) is within pre-established
performance specifications.
A dissolution method and its accompanying protocol thus constitute a vital test for
the development and manufacture of oral films. The first official “dissolution test” for
solid dosage forms was adopted in 1970 by the United States Pharmacopeia (USP) with
USP XVIII and NF XIII [70]. Forty-five years later in 2015, no standard method has yet
been proposed by the USP, European Pharmacopeia, Japanese Pharmacopeia, or any
other organization for evaluating the dissolution of oral films [71]. In 2012 solid and
semi-solid mucoadhesive preparations, e.g. oral films, were incorporated in the
“Oromucosal Preparations” Ph Eur monograph 1807 [72, 73]. Dissolution specifics were
left to the investigator by stating: “Unless otherwise justified and authorised, a suitable
test is carried out to demonstrate the appropriate release of the active substance(s)”.
An in vitro dissolution protocol that simulates the conditions of the oral cavity and
further elucidates the effect of formulation and test parameters on drug release from films
is needed. A biorelevant dissolution method can help discriminate between formulations
in terms of drug efficacy for different populations, drug release kinetics and IVIVC, and
allow routine control testing of finished products. Developing such a method is not an
easy task as the contributing variables that affect drug release (both from an equipment
and product perspective) must be identified a priori.
For transoral polymer films, drug absorption is dependent on the amount of drug
release per time and its passive diffusion through the buccal mucosa via the paracellular
or transcellular route to reach systemic circulation [74]. This in turn depends on a number
of factors: (1) temperature of the oral cavity, (2) saliva composition, pH and flow rate, (3)
44
mandible movement, and (4) amount of drug swallowed by the patient, etc. In
consequence, a dissolution protocol for oral films should take into account biorelevancy
in its design by systematically evaluating the effect of these factors.
Two relevant works by Lucas et al. [75] and Adrover et al. [71] evaluated drug
release from strip films. In the first, the authors studied the use of USP I (basket-type
apparatus) versus USP IV (flow-through cell) for testing the performance of HPMC-
based films containing BCS Class II nano and micro particles. The authors investigated
the impact of hydrodynamics, film position, flow rate, impeller speed, etc., and
demonstrated that the USP IV was a robust method to predict the in vitro dissolution of
oral films. They also concluded that the USP IV was more apt in differentiating the
dissolution profile of films containing nano versus micro particles than USP I. In the
second study, Adrover et al. [71] evaluated film dissolution from a patented millifluidic
flow-through device against USP I and USP II (paddle) apparatuses. The new device was
claimed to better mimic mouth physiological conditions with laminar tangential media
flow (compared to perpendicular in the USP IV) and low hold-up volumes. The authors
found that the instrument lead to more reproducible profiles, and that it was more
discriminating at earlier time points (0 – 15 min) than the USP I and II. However, drug
release was considerably slower (even at high flow rates of 20 ml/min) and the shape of
the dissolution curve seemed to be affected. In summary, both studies concluded that a
flow-through cell configuration was suitable to study oral film dissolution. However,
neither research team investigated the impact of biorelevant media composition, pH and
volume on drug release, nor proposed the development of a dissolution protocol for oral
films.
45
In view of above, the current work presents a novel biorelevant dissolution protocol
for assessment of drug release from transoral polymer films focused on the USP IV flow-
through cell apparatus. The impact of artificial saliva composition, pH, flow rate, volume,
drug loading and film thickness, on oral film dissolution were investigated. Naproxen
(NPX) was chosen as the model drug as it is a weak acid BCS Class II drug compound
whose solubility is known to vary with pH. Also, since NPX drug absorption through the
transcellular route is limited by its dissolution rate, particle size reduction techniques
were employed to nanosize the drug. Hydroxypropyl methylcellulose (HPMC) films
containing NPX nanoparticles were manufactured following the published protocols
described in Section 3.3.5 [9, 52, 76]. Film composition was varied by adjusting drug,
polymer and additive concentration in the precursor formulation.
Characterization techniques included drug redispersion and mechanical strength tests
to study nanoparticle recovery, and interactions between the HPMC matrix, NPX and
film precursor components. Film dissolution in artificial saliva of varying composition
and pH were compared against recommended USP phosphate buffer solutions (PBS) for
NPX [77] and aqueous sodium dodecyl sulfate (SDS) solutions in which the drug was
completely soluble. Both saliva flow rate and volume were varied so as to simulate
thickness changes in the salivary film that covers the oral surface, which are known to be
dependent on age, weight, and mouth size of the patient [78-80]. Then, deviations in drug
product properties, e.g. film thickness and NPX loading, and their effect on drug release
were assessed.
Statistical metrics based on model-independent similarity (f1) and difference (f2)
factors and hierarchical cluster analysis (HCA) were used for comparing dissolution

46
profiles. Finally, matrix-type tables were generated and utilized to develop the in vitro
biorelevant dissolution protocol for oral films.
3.3 Materials and Methods
3.3.1 Materials
Naproxen (NPX; Medisca, Plattsburgh, NY) was utilized as a model BCS Class II
drug. Hydroxypropyl methylcellulose (HPMC; Methocel E15 Premium LV, The Dow
Chemical Company, Midland, MI) was used as a film forming agent, and glycerin
(Sigma-Aldrich, St. Louis, MO) as a plasticizer. Sodium dodecyl sulfate (SDS; Fisher
Scientific, Pittsburgh, PA) is an anionic surfactant that increases wettability of the NPX
nanoparticles so as to enable faster dissolution. All other materials were used without
further processing.
3.3.2 Preparation of artificial saliva formulations
A review of published literature was completed so as to identify different
formulations of artificial salivas [81, 82]. Human saliva pH can vary within a day from
5.5 to 7.8 as a response to ingested food and drinks, emotional state, and even time of day
[80, 83]. There have also been reports of discrepancies in magnesium, phosphorus and
calcium concentrations in saliva between children, adults, and pregnant women [84-86].
In order to account for these differences in the biorelevant protocol, saliva formulations
with varying pHs and calcium concentrations, as listed in Table 3-1, were prepared and
used for dissolution testing. In summary, the chemical constituents of salivas A-B and
salivas C-D do not differ, but their pH ranges do. This was done in an effort to simulate
salivary pH changes throughout the day. Saliva E however, has no calcium ions. This

47
media was included to simulate two types of conditions: (1) pediatric patients with a high
propensity for dental caries as reported by Shannon and Feller [85], and (2) the lower
calcium ion concentration in non-pregnant women [84].
Five (5) artificial saliva formulations were prepared. Chemical constituents were
weighed, added to deionized water, and mixed with a magnetic stirrer until a solution was
formed. Drug release from oral films in all five artificial salivas was recorded. NPX
dissolution was also compared against a phosphate buffer solution (PBS) with pH 7.4, the
USP recommended media for this drug [77]. The pH of all media formulations was
adjusted (as necessary) with a 0.2 M sodium hydroxide solution.
Table 3-1. Artificial saliva formulations
Component Saliva A Saliva B Saliva C Saliva D Saliva E
Potassium Chloride --- --- 9.6 mM 9.6 mM ---
Calcium Chloride Dihydrate 1.5 mM 1.5 mM 1.5 mM 1.5 mM ---
Sodium Chloride 40 mM 40 mM 3.8 mM 3.8 mM 136.9 mM
Potassium Phosphate Monobasic 12 mM 12 mM 5.0 mM 5.0 mM 1.4 mM
Sodium Phosphate Dibasic --- --- 6.1 mM 6.1 mM 16.8 mM
Potassium Bicarbonate --- --- 15.0 mM 15.0 mM ---
Potassium Thiocyanate --- --- 0.62 mM 0.62 mM ---
Citric Acid --- --- 0.15 mM 0.15 mM ---
pH (adjusted with 0.2 M NaOH) 6.2 6.8 6.5 7.4 6.8
3.3.3 Naproxen solubility in real and artificial saliva
The kinetic solubility of NPX in real and artificial saliva was determined so as to
quantify intra- and inter-patient solubility differences due to chemical composition and
pH, and as recommended by USP <1092> for selecting adequate dissolution media [87].
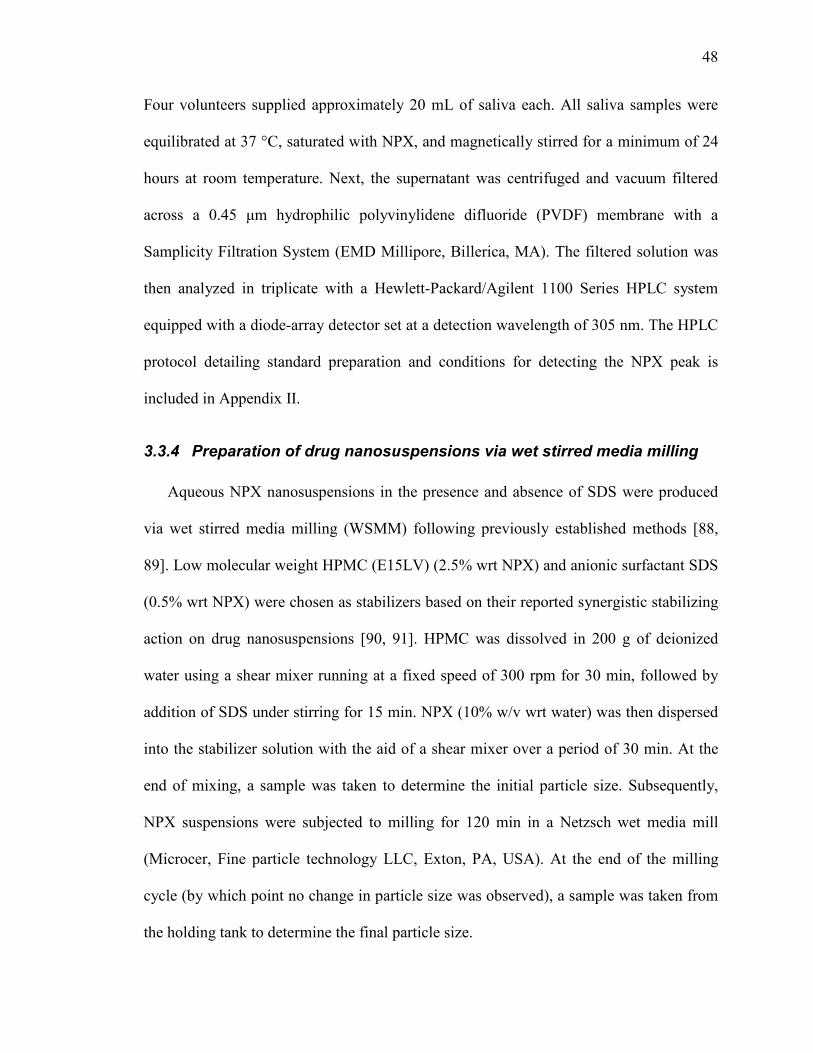
48
Four volunteers supplied approximately 20 mL of saliva each. All saliva samples were
equilibrated at 37 °C, saturated with NPX, and magnetically stirred for a minimum of 24
hours at room temperature. Next, the supernatant was centrifuged and vacuum filtered
across a 0.45 μm hydrophilic polyvinylidene difluoride (PVDF) membrane with a
Samplicity Filtration System (EMD Millipore, Billerica, MA). The filtered solution was
then analyzed in triplicate with a Hewlett-Packard/Agilent 1100 Series HPLC system
equipped with a diode-array detector set at a detection wavelength of 305 nm. The HPLC
protocol detailing standard preparation and conditions for detecting the NPX peak is
included in Appendix II.
3.3.4 Preparation of drug nanosuspensions via wet stirred media milling
Aqueous NPX nanosuspensions in the presence and absence of SDS were produced
via wet stirred media milling (WSMM) following previously established methods [88,
89]. Low molecular weight HPMC (E15LV) (2.5% wrt NPX) and anionic surfactant SDS
(0.5% wrt NPX) were chosen as stabilizers based on their reported synergistic stabilizing
action on drug nanosuspensions [90, 91]. HPMC was dissolved in 200 g of deionized
water using a shear mixer running at a fixed speed of 300 rpm for 30 min, followed by
addition of SDS under stirring for 15 min. NPX (10% w/v wrt water) was then dispersed
into the stabilizer solution with the aid of a shear mixer over a period of 30 min. At the
end of mixing, a sample was taken to determine the initial particle size. Subsequently,
NPX suspensions were subjected to milling for 120 min in a Netzsch wet media mill
(Microcer, Fine particle technology LLC, Exton, PA, USA). At the end of the milling
cycle (by which point no change in particle size was observed), a sample was taken from
the holding tank to determine the final particle size.

49
3.3.5 Preparation of films containing nanoparticles
The preparation of films containing nanoparticles has been previously discussed in
detail [9, 52, 76]. Briefly stated, the polymer solution, prepared by adding weighed
amounts of HPMC and glycerin to water (on w/w basis) at 90 °C, was allowed to cool
down to room temperature while being stirred continuously. This polymer solution (40 g)
was mixed with the NPX nanosuspension (20 g) in a 2:1 ratio [52] (unless otherwise
stated) along with additives (as necessary) in a Thinky ARE-310 planetary centrifugal
mixer (Thinky, Laguna Hills, CA) to form the film precursor suspension. Samples were
mixed at 2000 rpm for 30 seconds, followed by 7 minutes of deaeration at 2200 rpm. If
bubbles were still present after mixing and deaeration, the polymer solution was left
overnight to settle before casting. The compositions of the film precursor suspensions
were chosen based on previous studies [52]. A polymer concentration of 15 wt% and
plasticizer concentration of 5 wt% were selected such that the final viscosities of the film
precursor suspensions were greater than 6500 cP and a drug loading of 14 wt% was
obtained (unless otherwise stated). The viscosities were measured in duplicate at a shear
rate of 2.2 s-1 at 25 °C using an R/S plus Rheometer (Brookfield Engineering, USA).
Approximately 9 g of film precursor suspension was manually cast at room temperature
onto a stainless steel substrate using a casting knife (Elcometer, MI) with casting
thickness set at 1000 µm (unless otherwise stated). The height of the knife was changed
depending on the desired dry film thickness as per in-house developed equations that
accounted for total amount of solids in the film precursor suspension. The cast film
sample, about 8 cm x 9 cm, was placed inside a lab scale continuous drying system which
adopts both conductive and convective heat transfer mechanisms to dry the films at 50ºC

50
under laminar air flow (Lab-Cast Model TC-71LC Tape Caster, HED International, NJ)
[76]. The dried films were then sealed individually in plastic bags and kept at room
temperature prior to testing.
3.3.6 Film characterization
3.3.6.1 Particle size distribution
A major challenge with development of dry dosage forms from nanosuspensions is
the recovery of the nanosized drug particles in vitro and consequently in vivo [92]. Each
of the processing steps (e.g. mixing, drying, etc.) and even the formulation parameters
(e.g. concentration of stabilizers used, additives, etc.) can have a significant impact on
nanoparticle aggregation, which in turn impacts the dissolution profile of the product. To
confirm that neither the film fabrication process nor the additives led to aggregation,
redispersion tests were conducted. For each test, a circular film sample 0.712 cm2 in area
was dispersed in 3 mL of de-ionized water and vortex mixed for 3 min at 1500 rpm until
the HPMC was completely dissolved, leaving only the NPX particles suspended in water.
At this point, particle size was measured using laser diffraction (Coulter LS13320,
Beckman Coulter, Miami, FL).
3.3.6.2 Thickness
Film thickness was measured in 3 different locations for each film (from a total of 6
films) using a digital micrometer with an accuracy of 0.001 mm. The resulting average
thickness and standard deviation were used to compute the coefficient of variation or
relative standard deviation (% RSD) for each formulation.
51
3.3.6.3 Drug content
Circular films with a size of 1.98 cm2 were weighed and dissolved in 100 mL of SDS
media (5.4 mg/mL) by magnetic agitation. The solution was then analyzed by means of
UV spectroscopy at 272 nm.
3.3.6.4 Mechanical properties
The mechanical properties of pharmaceutical thin films are of significance for two
major reasons: (a) the tensile strength of films have a direct correlation to disintegration
time [93], and (b) pleasant product palatability is key to patient compliance [94].
In the current studies, a TA-XT Plus Texture Analyzer (Stable Microsystems, UK)
was used to measure the mechanical properties of the oral films, i.e. tensile and yield
strength, Young’s modulus, and percent elongation at break. Five strips with dimensions
50 mm × 15 mm were cut from a single film for every film formulation. Each strip was
held in place between the two grips and stretched at a test speed of 1 mm/s until breaking
point. Tensile and yield strengths were then computed by dividing the force by the initial
cross-sectional area. The average and standard deviation of five readings was reported.
This methodology follows published protocols [52].
3.3.6.5 Dissolution testing
Lucas et al. [75] discussed in detail the implications of using USP I versus USP IV
for testing the dissolution behavior of strip-films containing API nanoparticles. The
authors demonstrated that the use of the USP IV yielded reproducible results, while also
being able to discriminate drug release from films containing microparticles versus films
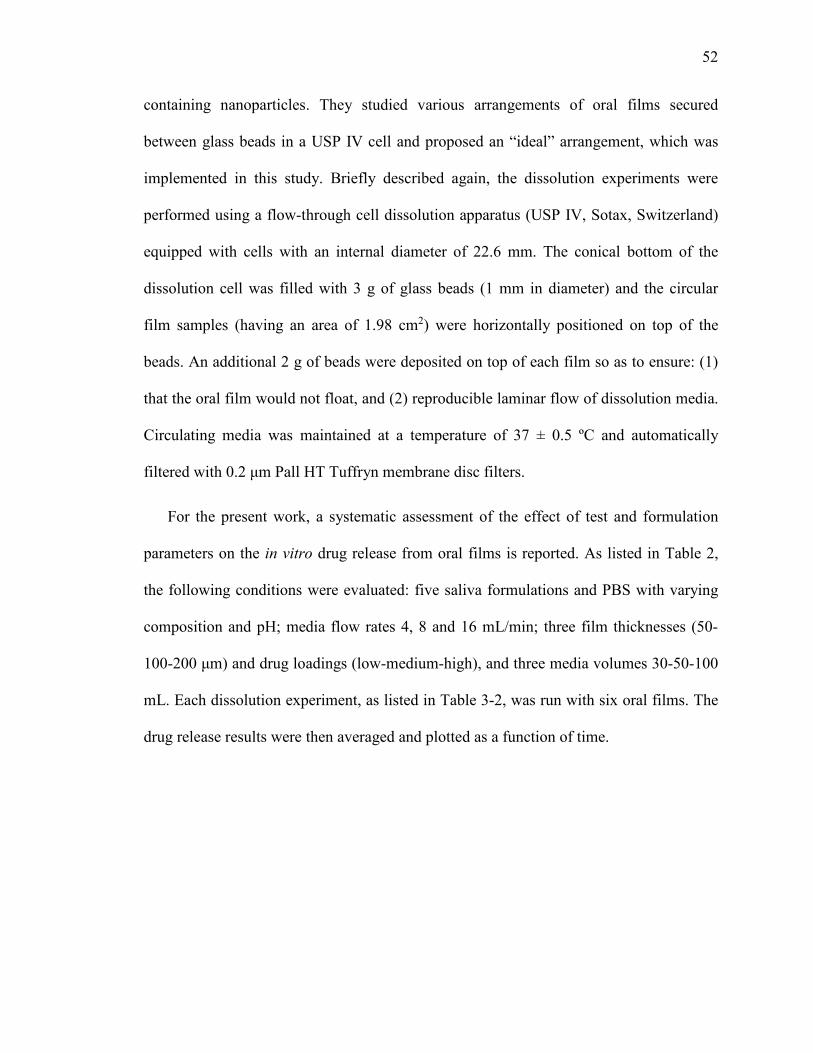
52
containing nanoparticles. They studied various arrangements of oral films secured
between glass beads in a USP IV cell and proposed an “ideal” arrangement, which was
implemented in this study. Briefly described again, the dissolution experiments were
performed using a flow-through cell dissolution apparatus (USP IV, Sotax, Switzerland)
equipped with cells with an internal diameter of 22.6 mm. The conical bottom of the
dissolution cell was filled with 3 g of glass beads (1 mm in diameter) and the circular
film samples (having an area of 1.98 cm2) were horizontally positioned on top of the
beads. An additional 2 g of beads were deposited on top of each film so as to ensure: (1)
that the oral film would not float, and (2) reproducible laminar flow of dissolution media.
Circulating media was maintained at a temperature of 37 ± 0.5 ºC and automatically
filtered with 0.2 μm Pall HT Tuffryn membrane disc filters.
For the present work, a systematic assessment of the effect of test and formulation
parameters on the in vitro drug release from oral films is reported. As listed in Table 2,
the following conditions were evaluated: five saliva formulations and PBS with varying
composition and pH; media flow rates 4, 8 and 16 mL/min; three film thicknesses (50-
100-200 μm) and drug loadings (low-medium-high), and three media volumes 30-50-100
mL. Each dissolution experiment, as listed in Table 3-2, was run with six oral films. The
drug release results were then averaged and plotted as a function of time.

53
Table 3-2. Film formulations and experimental parameters
Film precursor suspension Experimental conditions
Exp. wt% NPX
wt% HPMC
wt% glycerin
wt% SDS
Film thickness
(µm)
Dissolution media
Media pH
Media volume
(ml)
Media flow rate (ml/min)
1 3.0 10.7 3.3 0.15 100 PBS* 7.4 30 16 2 3.0 10.7 3.3 0.15 100 Saliva A* 6.2* 30 16 3 3.0 10.7 3.3 0.15 100 Saliva B* 6.8* 30 16 4 3.0 10.7 3.3 0.15 100 Saliva C* 6.5* 30 16 5 3.0 10.7 3.3 0.15 100 Saliva D* 7.4* 30 16 6 3.0 10.7 3.3 0.15 100 Saliva E* 6.8* 30 16 7 3.0 10.7 3.3 0.15 100 Saliva D 7.4 30 8* 8 3.0 10.7 3.3 0.15 100 Saliva D 7.4 30 4* 9 3.0 10.7 3.3 0.15 50* Saliva D 7.4 30 16
10 3.0 10.7 3.3 0.15 200* Saliva D 7.4 30 16 11 1.3* 13.2* 4.3* 0.06* 100 Saliva D 7.4 30 16 12 4.4* 8.6* 2.5* 0.22* 100 Saliva D 7.4 30 16 13 3.0 10.7 3.3 0.15 100 Saliva B* 6.8* 50* 16 14 3.0 10.7 3.3 0.15 100 Saliva D 7.4 100* 16
* Deviation from baseline formulation and experimental parameters
3.3.7 Methods for comparing dissolution profiles
Dissolution profiles were compared via model-independent approaches, namely the
similarity (f1) and difference factors (f2) described by Costa and Lobo [95], and
hierarchical cluster analysis. As suggested in the FDA Guidance for Dissolution Testing
of Immediate Solid Oral Dosage Forms Release [96], values of 0-15 for f1 and 50-100
for f2 ensure sameness or equivalence in dissolution profiles between reference and test
batches. However, since these metric factors are dependent only on the sampling points
and the mean difference between batches, they do not take into account large variances
within batch [97]. These variances were evaluated by computing the % RSD for all time
points.

54
Hierarchical cluster analysis was based on the non-standardized average linkage
method for which the distance between clusters (batches) is computed as the average
distance between pairs of observations, i.e. percent drug release for each time point until
steady-state. This analysis provided an additional metric for evaluating profile similarity
by taking into account the shape of the drug release curve.
3.4 Results and Discussion
3.4.1 Naproxen solubility in real and artificial saliva
USP <1092> recommends that saturation solubility be three times larger than drug
concentration in the dissolution media for adequate IVIVC. Sink conditions needed to be
ensured for all tests by evaluating the kinetic solubility of NPX and taking into account
the volume of the dissolution media. NPX solubility and its dissolution rate, as that of
other weak acid drugs, increases with increasing pH above its dissociation constant
(pKa); however, its absorption rate is not necessarily proportional to solubility in oral
mucosal fluid, e.g. saliva, according to studies by Beckett and Moffat [98]. This further
prompted the quantification of drug solubility as a function of artificial saliva
composition and pH against real saliva.
As seen in Figure 3-1, NPX solubility in real saliva matched artificial formulations
(less than 0.5 mg/ml difference) across all pH ranges. Chemical composition of the
artificial saliva affected NPX solubility, for example between Salivas B - E at pH 6.8,
where Saliva E was more similar to real saliva. These solubility discrepancies can be
attributed to the higher concentration of sodium chloride and/or the absence of calcium in
Saliva E formulation. One would expect that these differences translate to a faster drug
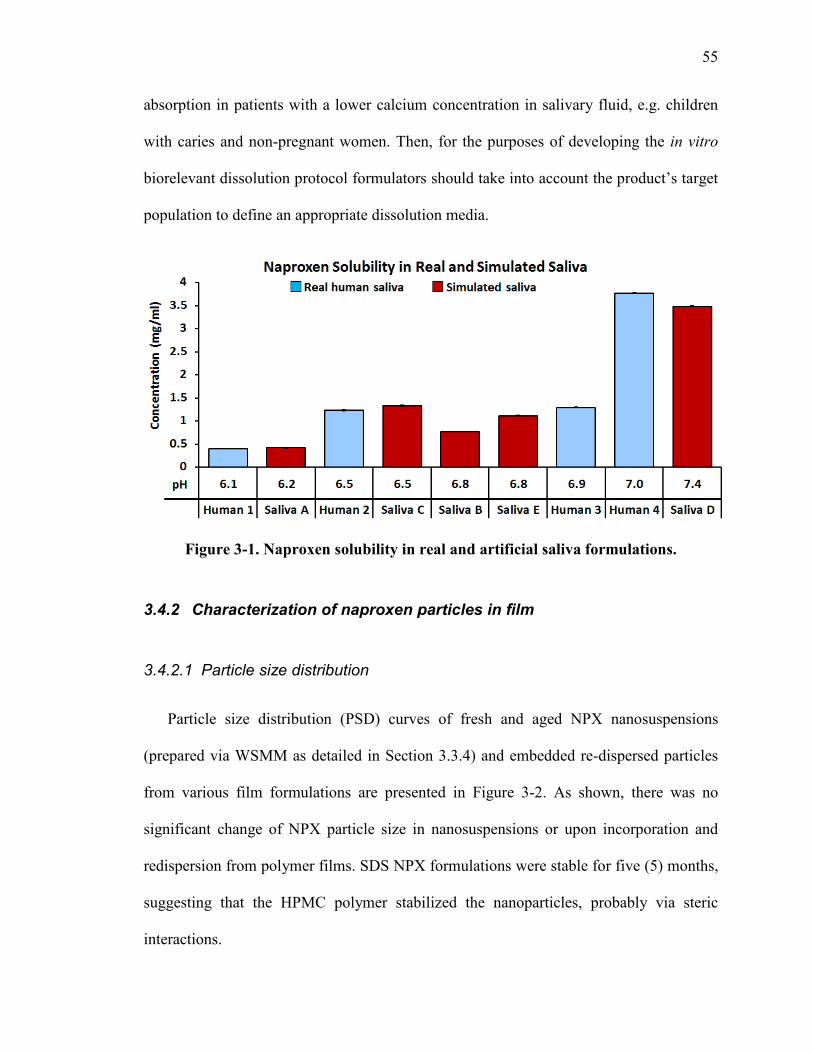
55
absorption in patients with a lower calcium concentration in salivary fluid, e.g. children
with caries and non-pregnant women. Then, for the purposes of developing the in vitro
biorelevant dissolution protocol formulators should take into account the product’s target
population to define an appropriate dissolution media.
Figure 3-1. Naproxen solubility in real and artificial saliva formulations.
3.4.2 Characterization of naproxen particles in film
3.4.2.1 Particle size distribution
Particle size distribution (PSD) curves of fresh and aged NPX nanosuspensions
(prepared via WSMM as detailed in Section 3.3.4) and embedded re-dispersed particles
from various film formulations are presented in Figure 3-2. As shown, there was no
significant change of NPX particle size in nanosuspensions or upon incorporation and
redispersion from polymer films. SDS NPX formulations were stable for five (5) months,
suggesting that the HPMC polymer stabilized the nanoparticles, probably via steric
interactions.

56
Figure 3-2. Redispersion particle size results for NPX nanosuspensions.
3.4.2.2 Film thickness
Film thicknesses and relative standard deviation (% RSD) for all formulations are
presented in Table 3-3. These ranged from 50 to 200 μm with maximum RSD of 9% for
the high drug loading formulation.
3.4.2.3 Determination of drug content in films
USP-NF provides detailed instructions for testing dosage uniformity by weight
variation and content uniformity. In solvent casted oral films, drug content can vary if
thickness and weight are not uniform and/or if there is preferential drug diffusion towards
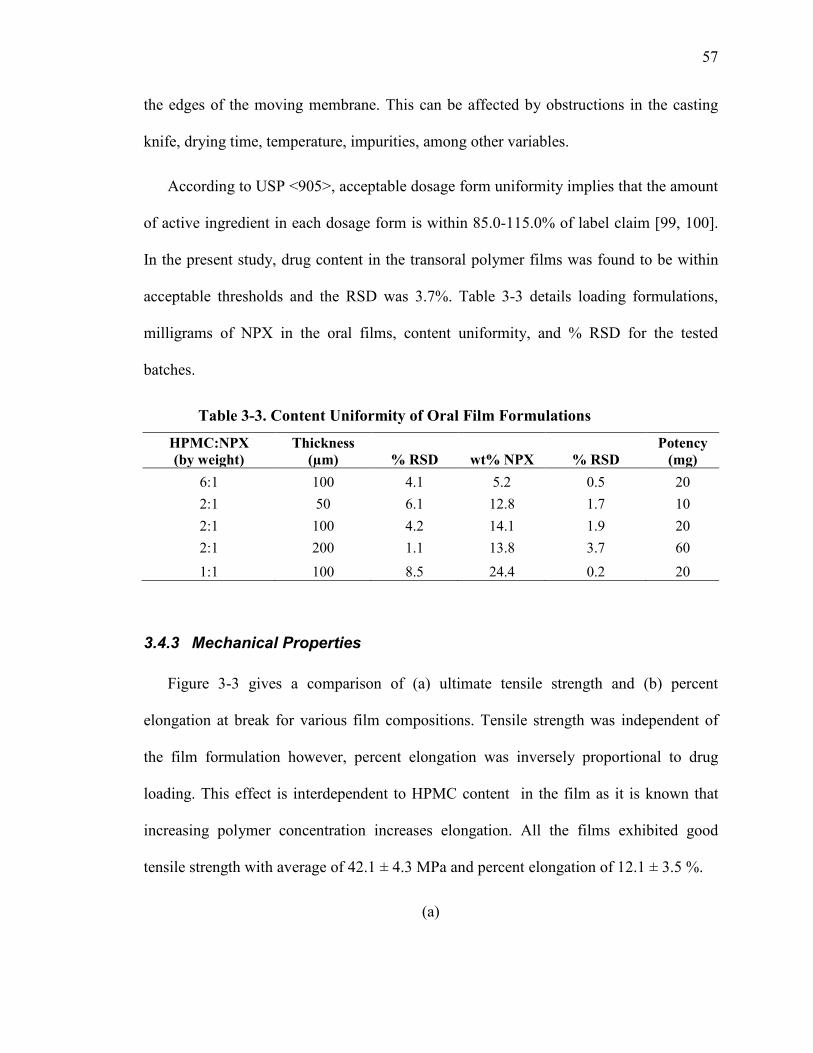
57
the edges of the moving membrane. This can be affected by obstructions in the casting
knife, drying time, temperature, impurities, among other variables.
According to USP <905>, acceptable dosage form uniformity implies that the amount
of active ingredient in each dosage form is within 85.0-115.0% of label claim [99, 100].
In the present study, drug content in the transoral polymer films was found to be within
acceptable thresholds and the RSD was 3.7%. Table 3-3 details loading formulations,
milligrams of NPX in the oral films, content uniformity, and % RSD for the tested
batches.
Table 3-3. Content Uniformity of Oral Film Formulations
HPMC:NPX (by weight)
Thickness (µm) % RSD wt% NPX % RSD
Potency (mg)
6:1 100 4.1 5.2 0.5 20 2:1 50 6.1 12.8 1.7 10 2:1 100 4.2 14.1 1.9 20 2:1 200 1.1 13.8 3.7 60 1:1 100 8.5 24.4 0.2 20
3.4.3 Mechanical Properties
Figure 3-3 gives a comparison of (a) ultimate tensile strength and (b) percent
elongation at break for various film compositions. Tensile strength was independent of
the film formulation however, percent elongation was inversely proportional to drug
loading. This effect is interdependent to HPMC content in the film as it is known that
increasing polymer concentration increases elongation. All the films exhibited good
tensile strength with average of 42.1 ± 4.3 MPa and percent elongation of 12.1 ± 3.5 %.
(a)

58
00.10.20.30.40.50.60.70.80.9
1
0 0 0
Tensile strength (MPa)
(b)
Figure 3-3. Mechanical properties (a) tensile strength and (b) percent elongation of oral films embedded with NPX nanoparticles.

59
3.4.4 Dissolution
3.4.4.1 Effects of dissolution media and pH
Initially, the effect of dissolution media composition and pH on drug release from the
film was evaluated. The volume was set at 30 ml with a transient flow rate of 16 ml/min
of saliva passing through the flow-through cylinder. As illustrated in Figure 3-4, drug
release varied according to both saliva composition and pH, with the fastest release
observed in Saliva D and Phosphate Buffer Solution pH 7.4 (PBS) > Salivas A and C >
Salivas B and E. Further deconvolution of the profiles via a parallel plot in Figure 3-5
shows that drug release was faster for Saliva D for all time points (represented by the
black horizontal lines) with the exception of an initial burst release at 2 minutes in PBS.
As a result, drug release in Saliva D and PBS exhibited the lowest t80 of all 6 dissolution
media studied (11 and 12 min, respectively) and similar dissolution curves as per the
difference and similarity factors. Factor calculations for all media are shown in Table 3-4.
The dissolution profiles for Salivas A (pH 6.2) and C (pH 6.5) with the lowest pH,
were equivalent to PBS (pH 7.4), the media with the highest pH. Saliva B and E (t80’s of
17 and 18 min, respectively), with intermediate pH 6.8 exhibited the slowest drug release.
These artificial salivas were similar to each other and to Saliva A. Interestingly, drug
release in Saliva A was equivalent to release in all other media except Saliva D at pH 7.4,
which was faster. Therefore, artificial Saliva A is a promising biorelevant dissolution
media that may enable a more robust IVIVC because it is not affected by external
uncontrollable factors in salivary fluid such pH and composition during the day and
between patients.

60
These results confirm that the pH of the biorelevant dissolution media should not be
overlooked. Nanosized NPX dissolution from oral films varied as a function of artificial
saliva pH from high (7.4) > low (6.2, 6.5) > intermediate (6.8). As expected the fastest
drug release was measured for media with pH 7.4 (Saliva D and PBS) due to the
dissociation of the API molecule (a weak acid) at higher pHs. No statistical difference
was evident in similar saliva formulations that differed in pH (Saliva A vs. B; Saliva C
vs. D). For these, difference and similarity factors contradicted themselves with one
giving passing results and the other giving failing results. Despite claims [101] that the
similarity factor f2 is more sensitive than the difference factor f1, in this study both values
were very close to the confidence limits of 50 and 15 (52,16 and 50,14 respectively). So
an additional analysis based on average linkage HCA was computed to evaluate the
interrelationship between dissolution media and pH, taking into account the shape of the
curve.
Figure 3-6 shows the computed clusters and their HCA similarity distances, d. In
average linkage clustering, the distance between two media X and Y is the mean of all
pairwise distances between items (% drug release) contained in X and Y. The smaller the
HCA distance (comparable to the difference factor f1) the more similar the clusters are.
The algorithm was set to converge at n-1 clusters with n being the number of media
evaluated. HCA output shows that the major factor affecting profile similarity was
dissolution media pH. Even more, three (3) major clusters with high similarities were
detected: (1) Salivas B - E, (2) Salivas A – C, and (3) Saliva D – PBS. The analysis
accurately clustered the media on the basis of their pH, then on additional similarities to
existing clusters. Media at low and high pH were more similar between themselves (d =

61
33) than compared to saliva of intermediate pH (d = 53). This result further validates the
finding that dissolution in Salivas B and E (intermediate pH 6.8) was statistically
different against other media. This may be due to the higher concentration of sodium in
both these salivas which can dehydrate and subsequently precipitate HPMC, affecting the
gel layer and hindering drug dissolution [102].
Figure 3-4. Drug release from transmucosal oral films in 30 mL of artificial saliva and USP recommended media PBS pH 7.4.

62
Figure 3-5. Parallel plot for oral film drug release (2 min intervals) in artificial saliva media and PBS. Each timepoint is represented by a black horizontal line. The Y-axis denotes % Drug Dissolved. Table 3-4. Difference and similarity factors for comparing dissolution as a function of media and pH
f1, f2 PBS 7.4 Saliva A Saliva B Saliva C Saliva D Saliva E PBS 7.4 0, 100 14, 50 28, 38 10, 62 6, 65 29, 38 Saliva A --- 0, 100 16, 52 6, 72 19, 43 17, 50 Saliva B --- --- 0, 100 17, 47 24, 34 2, 89 Saliva C --- --- --- 0, 100 14, 50 21, 21 Saliva D --- --- --- --- 0, 100 37, 33 Saliva E --- --- --- --- --- 0, 100

63
Figure 3-6. Hierarchical cluster analysis comparing dissolution curves for oral films dissolved in formulations of artificial saliva and USP recommended media.
3.4.4.2 Effects of saliva flow rate
Changes in drug release as a function of media flow rate were evaluated in 30 ml of
Saliva D pH 7.4 for each condition. Saliva flow rate was observed to have a significant
impact on the dissolution of NPX nanoparticle-loaded oral films. Figure 3-7 shows how
drug release decreased with decreasing flow rate. This resulted in a t80 increase from 10
min for 16 mL/min to 13 min for 8 ml/min and 22 min for 4 mL/min with all three
dissolution curves being different as per the difference factor (see Table 3-5).
The direct relationship between drug release from oral films and agitation rate is a
key finding for the development of an in vitro biorelevant dissolution protocol, as saliva
flow rate is known to vary with age [80, 85], sex [80, 103], body mass index (BMI) [80],
and especially for pregnant [84, 86, 104] and xerostomia patients [80, 103, 105]. For
example, Shannon and Feller [85] showed that for children with a median age of 8.9
years, there was no significant difference in saliva flow rate based on sex. In adults
however, flow rates of unstimulated and stimulated whole saliva was higher in males

64
(0.42 ml/min; 1.77 ml/min) than in females (0.37 ml/min; 1.38 ml/min) [103]. Even
more, saliva flow rates in female vary considerably when the patient is pregnant. In a
longitudinal study, Hugoson [84] reported that during pregnancy resting and stimulated
parotid saliva flow rate gradually decreases to a minimum of 0.04 and 0.4 ml/min
respectively, until two days post-partum.
Understandably, saliva flow rate is an important parameter in the dissolution protocol.
In addition to the factors above, Hamlin et al [106] found that in vivo results correlated
with in vitro data when these were obtained at low stirring rates. However, for scenarios
that require discriminating dosage forms that contain APIs with different PSD, low
agitation rates (flow rates) may not be adequate. At low flow rates the effect of particle
size is hindered as the effective surface area is reduced to the surface area of the
dissolving sample, which is a function of porosity and viscosity of the trapped fluids
[107]. On the other hand, a high flow rate may lack discriminative power and give
misleading results. Newton et al. [108] noted that the effects of pH changes on drug
solubility were negated at high agitation rates. This was not the case for the highest flow
rate evaluated in this study (16 ml/min) as adequate discrimination between formulations
at different pH was observed. Similarly, Lucas et al. [75] reported that at 16 ml/min there
was higher discrimination between nanoparticles and microparticle dissolution from
films.
In the present study drug release increased as a function of flow rate. At low flow
rates of 4 ml/min there was a lag in initial drug release and higher % RSD for all time
points. At higher flow rates of 8 ml/min and 16 ml/min dissolution curves were
equivalent as per the f2 factor. Based on these results, higher media flow rates at 8 or 16
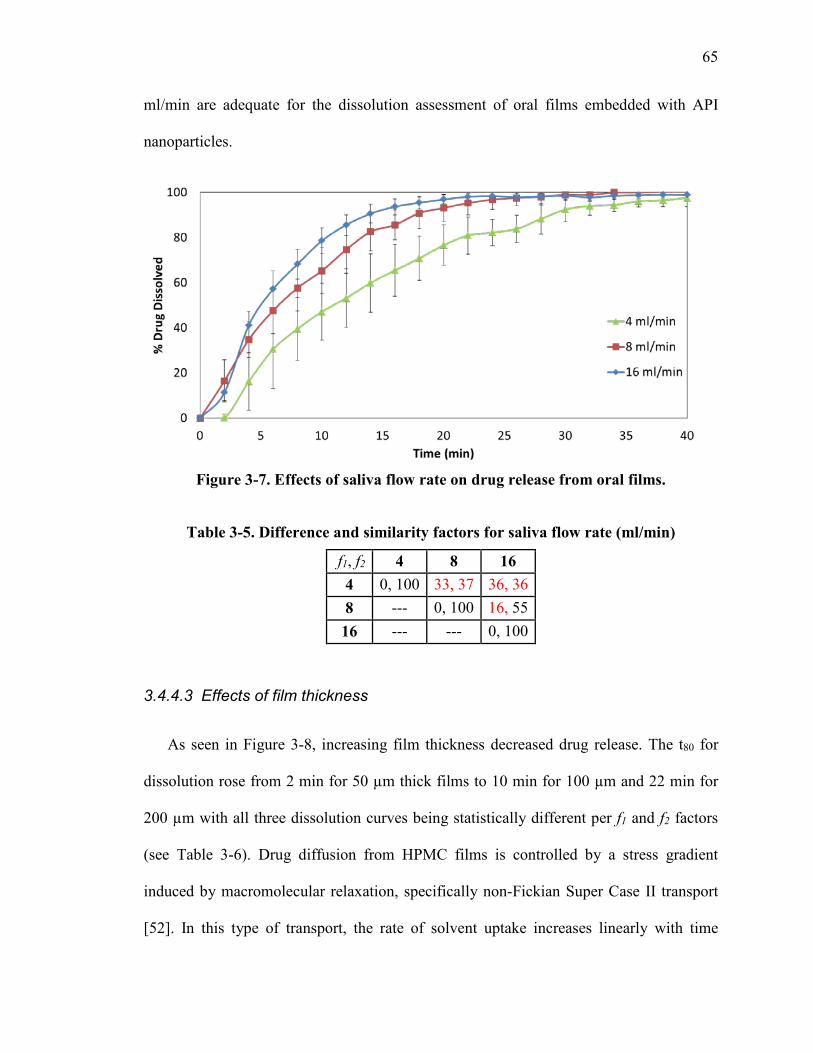
65
ml/min are adequate for the dissolution assessment of oral films embedded with API
nanoparticles.
Figure 3-7. Effects of saliva flow rate on drug release from oral films.
Table 3-5. Difference and similarity factors for saliva flow rate (ml/min)
f1, f2 4 8 16 4 0, 100 33, 37 36, 36 8 --- 0, 100 16, 55 16 --- --- 0, 100
3.4.4.3 Effects of film thickness
As seen in Figure 3-8, increasing film thickness decreased drug release. The t80 for
dissolution rose from 2 min for 50 µm thick films to 10 min for 100 µm and 22 min for
200 µm with all three dissolution curves being statistically different per f1 and f2 factors
(see Table 3-6). Drug diffusion from HPMC films is controlled by a stress gradient
induced by macromolecular relaxation, specifically non-Fickian Super Case II transport
[52]. In this type of transport, the rate of solvent uptake increases linearly with time

66
[109]. As such, it is likely that the physical mechanisms controlling NPX release are
polymer swelling and erosion. Accordingly, thicker films will require more time for the
polymer network to fully hydrate and erode, resulting in slower dissolution of the
embedded NPX nanoparticles.
Figure 3-8. Drug release as a function of oral film thickness.
Table 3-6. Difference and similarity factors for oral film thickness (μm)
f1, f2 50 100 200 50 0, 100 36, 15 20, 12 100 --- 0, 100 22, 29 200 --- --- 0, 100
3.4.4.4 Effects of drug loading
Figure 3-9 contains the dissolution profiles of oral films with various drug loadings.
Changes in drug loading had no significant effect on dissolution as calculated via the
similarity and difference factors (Table 3-7). The t80 for 5%, 13% and 24% (w/w) NPX
films were 13, 10 and 10 min, respectively, with the longest time for the lowest drug

67
loading. This event can be explained by the fact that these systems are erosion/swelling-
controlled, and as such, lower drug loadings translate into higher polymer concentrations
that necessitate more time to dissolve. Furthermore, these concentration changes were not
altered significantly so as to not affect the dissolution rate of the system by viscosity
and/or surface tension effects.
Figure 3-9. Effect of drug loading variations on film dissolution.
Table 3-7. Difference and similarity factors for drug loading (polymer:nanosuspension, w/w)
f1, f2 6:1 2:1 1:1 6:1 0, 100 14, 55 11, 57 2:1 --- 0, 100 2, 80 1:1 --- --- 0, 100
3.4.4.5 Effects of dissolution media volume
Figure 3-10 shows the dissolution profiles for 30, 50 and 100 ml of Saliva B (pH 6.8).
This media was chosen so as to ensure sink conditions irrespective of the volume. The

68
volumes evaluated in this study were selected based on the current system configuration
and apparatus limitations. The lowest volume was 30 ml of media in the solvent vessel,
which is considerably higher than physiological unstimulated saliva volumes that
generally do not exceed 1.0 ml. Specifically, saliva measurements based on potassium
and chloride ion concentrations have been previously estimated as 0.9 ml, 0.8 ml and 0.4
ml for adult males, females and a 5-year old child, respectively [78, 79, 110]. These
reported volumes are statistically different based on age, but not sex. Patient weight and
mouth size also correlated positively with saliva volume.
Total saliva volume and surface area can be combined to compute the thickness of the
salivary film covering the oral cavity. This thickness was measured as 0.07 – 0.1 mm
(100 μm) and is known to be invariant to age and sex [78, 79]. Within the oral cavity, the
salivary film is thicker near major saliva glands and thinner when mucosal layers are
separated, i.e. when speaking or mouth-breathing. This would suggest that strip film
wetting, and consequently dissolution, is more dependent on its place of administration in
the mouth, rather than saliva (or media) volume. In summary, changes in saliva volume
should not affect dissolution in the oral cavity as long as there is sufficient mucosal fluid
to wet the polymer film. Probable exceptions to this statement are dehydrated and
xerostomia.
As can be seen in Figure 3-10 and Table 3-8, dissolution media volume did not have a
significant impact on drug release from oral films. These results support the hypothesis
that saliva volume is not a major factor in oral film dissolution as long as there is
sufficient polymer wetting, and that at sink conditions the dissolution rate of a drug is
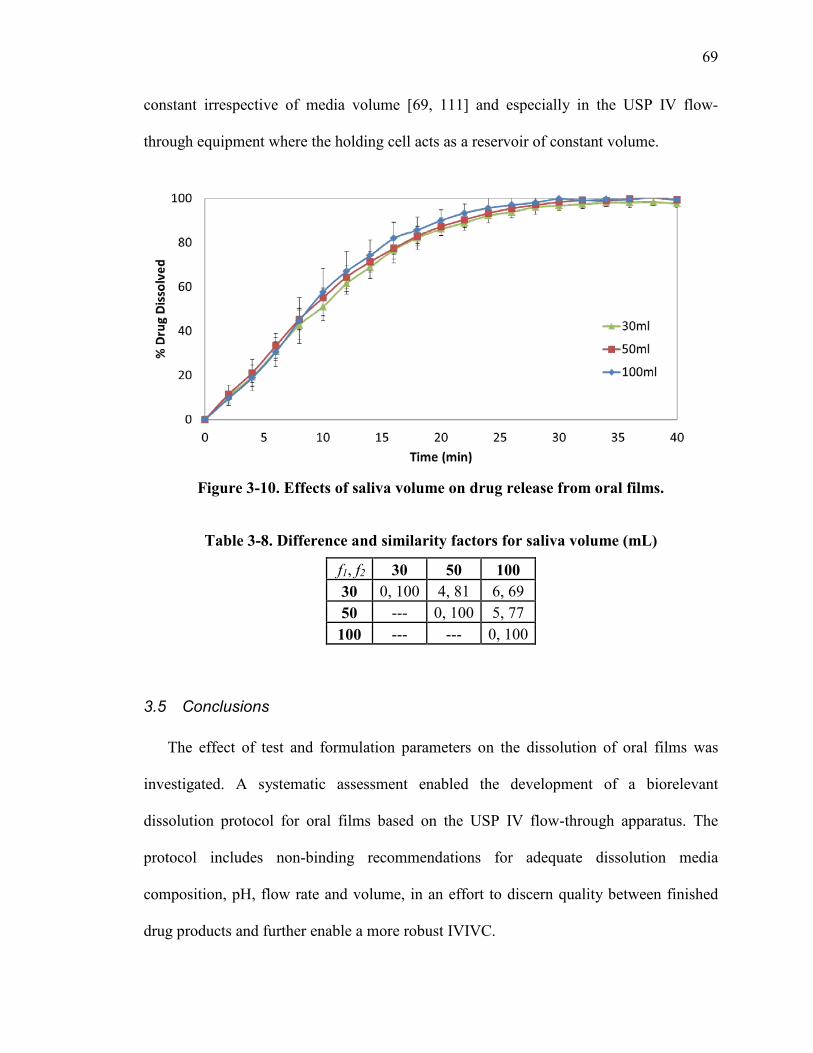
69
constant irrespective of media volume [69, 111] and especially in the USP IV flow-
through equipment where the holding cell acts as a reservoir of constant volume.
Figure 3-10. Effects of saliva volume on drug release from oral films.
Table 3-8. Difference and similarity factors for saliva volume (mL)
f1, f2 30 50 100 30 0, 100 4, 81 6, 69 50 --- 0, 100 5, 77 100 --- --- 0, 100
3.5 Conclusions
The effect of test and formulation parameters on the dissolution of oral films was
investigated. A systematic assessment enabled the development of a biorelevant
dissolution protocol for oral films based on the USP IV flow-through apparatus. The
protocol includes non-binding recommendations for adequate dissolution media
composition, pH, flow rate and volume, in an effort to discern quality between finished
drug products and further enable a more robust IVIVC.

70
The pH of human saliva can vary throughout the day from 5.5 to 7.8 as a response to
ingested food and drinks, emotional state, and even time of day [80, 83]. Its composition
also changes depending on whether it is stimulated or not [74]. Artificial Saliva A with a
pH of 6.2 was identified as the best biorelevant media because in it, oral film dissolution
was similar (by similarity f2 calculations) to others at different pHs. Media volume did
not affect drug release as the volume within the dissolution cell was always sufficient to
ensure sink conditions and uniform film wetting. Media flow rate however, was
proportional to drug release. A flow rate of 16 ml/min provided adequate discrimination
when testing films with different thickness. Thicker films take longer to hydrate, swell
and erode. These findings are supported by published literature whereas swelling and
erosion mechanisms were found to govern drug release from transmucosal HPMC films
[52]. In terms of drug loading, there was an increase in t80 with decreasing NPX content.
These drug release differences were minor and related to changes in polymer
concentration. Consequently, all dissolution curves were equivalent as per the difference
and similarity factors.

71
Chapter 4 PAT Tools for Oral Film Characterization
4.1 Summary
In this chapter, near infrared (NIR) spectroscopy is introduced as a PAT tool in oral
film manufacturing. The formulation and a process are assessed and key effects on
product quality are identified. Initially, changes in free and bound moisture, and the rate
of solvent removal are monitored in-line as a function of formulation variables
(plasticizer type and amount, surfactant concentration, drug type and drug concentration)
and process parameters (heating zone and temperature). Subsequently, chemical imaging
is briefly introduced to examine the effect of upstream process variables (API particle
size) on film uniformity.
4.2 Introduction
The integration of PAT tools to analyze and monitor in real-time both product
attributes and process performance is extremely beneficial for the development and
continued improvement of pharmaceutical products and processes. These tools can
monitor molecular changes, moisture content, drug uniformity and crystallinity of
pharmaceutical products. Changes in either formulation or process parameters for
manufacturing of oral films can have a significant impact on these attributes and thus on
final product quality. For example, trace amounts of a residual solvent can react with
anhydrate molecules to form acids or bases that will often affect the stability and
pharmacokinetic properties of the product. Similarly, interactions between particle size of
the active and the viscosity of the polymer solution need to be assessed as these will
affect the diffusivity of the drug in the matrix, i.e., content uniformity.

72
Near infrared (NIR) spectroscopy is the preferred PAT tool for those seeking to
gain both physical and chemical information from their samples. NIR is fast, non-
destructive and doesn’t require sample preparation for probing vibrational overtones and
combination bands within the electromagnetic spectrum region of 700 to 3000 nm [26].
NIR has been extensively used in solid dosage manufacturing for a range of applications
that include blend end-point detection [112], in-line blend uniformity monitoring in
continuous manufacturing processes [32, 39], and residence time distribution [113] and
drug content assessments in a HME process [114]. Nevertheless, to the bestof our
knowledge, NIR has yet to be fully utilized for oral film manufacturing.
Recent studies by Jerez-Rozo et al. [34] made use of NIR and Raman chemical
imaging to study griseofulvin (GF) drug distribution in HPMC oral films. Offline NIR
measurements allowed assessment of the spatial distribution of submicron GF particles at
the millimeter scale. Chemical spectral data within the hypercube was then extracted,
filtered, and fitted Partial Least Square regressions to estimate drug abundance and
cluster size within the analyzed region of the film. Raman mapping, on the other hand,
was used for assessing crystal form and particle size distribution at the micron level.
Zhang et al. [115] introduced point Raman spectroscopy to different drying zones
within a strip film manufacturing process. The objectives included in-line measurement
of film thickness, drug content, and identification of fenofibrate solid-state changes. The
authors concluded that chemometric models needed to be redeveloped whenever there
were extraordinary process changes but that overall, Raman was a flexible PAT tool that
had the potential to be used for feedback control strategies in a continuous oral film
manufacturing process.

73
The studies by Jerez-Rozo and Zhang show the potential of NIR and Raman
spectroscopy for measuring oral film CQAs, e.g., drug content, film thickness and
impurities. These attributes, which were tested on end products, are dependent on
upstream variables that have yet to be investigated. To this date, no author has published
on the use of NIR or Raman for film formulation screening or mechanical attribute
predictions. For example, how does API particle size affect content uniformity and final
moisture content? The rate of moisture removal, and the residual moisture, are both
critical in strip film manufacturing; in particular residual moisture has a detrimental effect
on product stability and quality, but methods for monitoring and analyzing their effects
are yet to be implemented.
The studies in this chapter are divided into two parts. First, a miniature NIR was
used to study the effect of plasticizers and additives on residual moisture content, rate of
solvent removal, and the film’s mechanical properties. The observations were
substantiated with thermogravimetric data. Then, films containing micro and nano
griseofulvin (GF) particles were evaluated to assess the effect of particle size and drug
diffusivity on film content uniformity.
4.3 Materials and Methods
4.3.1 Materials
Griseofulvin (GF; Sigma-Aldrich, Saint Louis, MO) and naproxen (NPX;
Medisca, Plattsburgh, NY) were utilized as model BCS Class II drugs. Hydroxypropyl
methylcellulose (HPMC; Methocel E15 Premium LV, The Dow Chemical Company,
Midland, MI) was used as a film forming agent, and glycerin (Sigma-Aldrich, St. Louis,
74
MO) as a plasticizer (unless stated otherwise). Sodium dodecyl sulfate (SDS; Fisher
Scientific, Pittsburgh, PA) was chosen as the surfactant, and Triacetin (Acros Organics,
Geel, BE) and polyethylene glycol 400 (PEG 400; Alfa Aesar, Ward Hill, MA) were used
as plasticizers without further processing.
4.3.2 Preparation of API micro and nanosuspensions
Aqueous NPX nanosuspensions were produced via wet stirred media milling
(WSMM) as described by Bhakay et al. [88]. HPMC (2.5% wrt NPX) was dissolved in
200 g of deionized water using a shear mixer running at a fixed speed of 300 rpm for 30
min, followed by addition of SDS (0.5% wrt NPX) under stirring for 15 min. NPX (10%
w/v wrt water) was then dispersed into the solution with the aid of a shear mixer over a
period of 30 min. At the end of the mixing stage, a sample was taken to determine the
initial particle size. Subsequently, NPX suspensions were milled for 120 min in a Netzsch
wet media mill (Microcer, Fine particle technology LLC, Exton, PA, USA). At the end of
the milling cycle a sample was taken from the holding tank to determine the final particle
size distribution. A similar methodology was followed for GF nanosuspensions.
4.3.3 Preparation of film precursor solutions
A weighed amount of HPMC polymer and varying plasticizer amounts (glycerin,
triacetin and PEG 400) were added to water (on a wt% basis) at 90 °C. The solutions
were allowed to cool down to room temperature while being stirred continuously. Table
4-1 gives the composition of formulations used in this study.
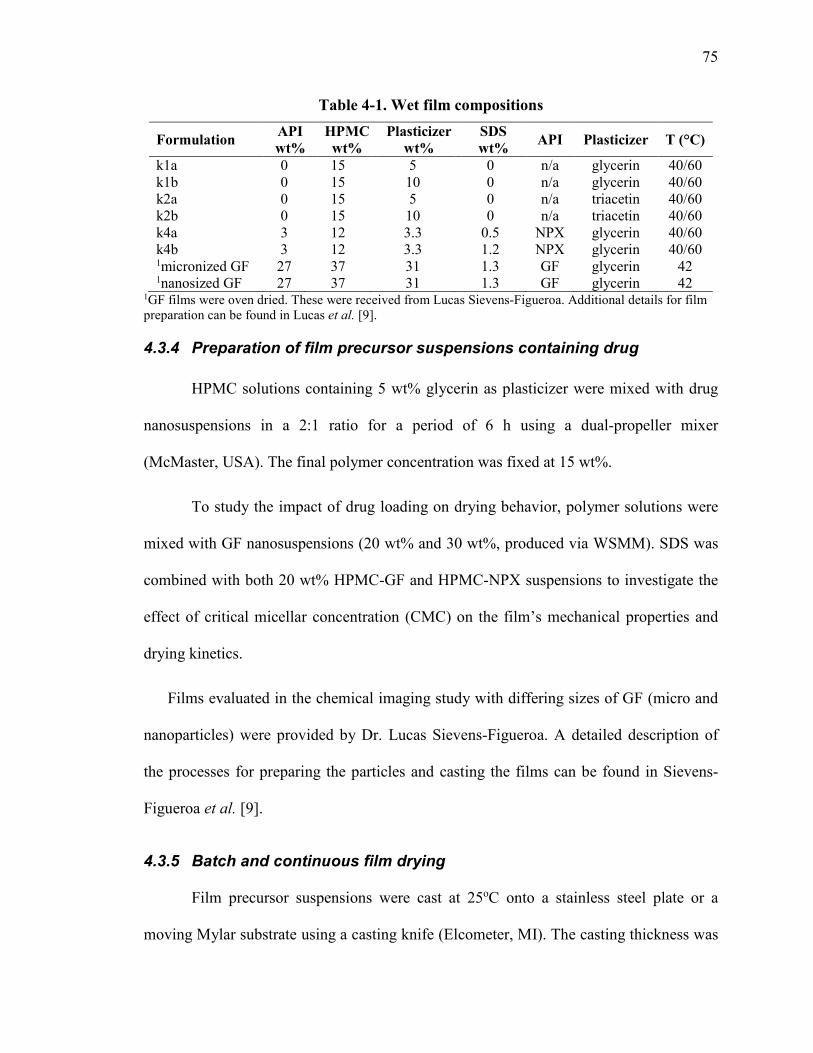
75
Table 4-1. Wet film compositions
Formulation API wt%
HPMC wt%
Plasticizer wt%
SDS wt% API Plasticizer T (°C)
k1a 0 15 5 0 n/a glycerin 40/60 k1b 0 15 10 0 n/a glycerin 40/60 k2a 0 15 5 0 n/a triacetin 40/60 k2b 0 15 10 0 n/a triacetin 40/60 k4a 3 12 3.3 0.5 NPX glycerin 40/60 k4b 3 12 3.3 1.2 NPX glycerin 40/60 1micronized GF 27 37 31 1.3 GF glycerin 42 1nanosized GF 27 37 31 1.3 GF glycerin 42
1GF films were oven dried. These were received from Lucas Sievens-Figueroa. Additional details for film preparation can be found in Lucas et al. [9].
4.3.4 Preparation of film precursor suspensions containing drug
HPMC solutions containing 5 wt% glycerin as plasticizer were mixed with drug
nanosuspensions in a 2:1 ratio for a period of 6 h using a dual-propeller mixer
(McMaster, USA). The final polymer concentration was fixed at 15 wt%.
To study the impact of drug loading on drying behavior, polymer solutions were
mixed with GF nanosuspensions (20 wt% and 30 wt%, produced via WSMM). SDS was
combined with both 20 wt% HPMC-GF and HPMC-NPX suspensions to investigate the
effect of critical micellar concentration (CMC) on the film’s mechanical properties and
drying kinetics.
Films evaluated in the chemical imaging study with differing sizes of GF (micro and
nanoparticles) were provided by Dr. Lucas Sievens-Figueroa. A detailed description of
the processes for preparing the particles and casting the films can be found in Sievens-
Figueroa et al. [9].
4.3.5 Batch and continuous film drying
Film precursor suspensions were cast at 25oC onto a stainless steel plate or a
moving Mylar substrate using a casting knife (Elcometer, MI). The casting thickness was

76
set at 1000 μm. The resting film suspension was placed inside the continuous film
manufacturing line (ProCast, HED International, Ringoes, NJ), and dried as per the listed
experimental conditions in Table 4-1 until no change in spectral absorbance was
observed.
The experiments were run in both batch and continuous mode. The drying line consists of
3 drying zones (Figure 4-1). In Zone 1 the only employed heating mechanism is
conduction. Zone 2 applies both conduction and convection mechanisms to dry the cast
film. Zone 3 dries via heated air convection which then exits through Zone 2.
For batch-drying mode, the film casted onto the steel plate was fixed in Zone 3.
The steel plate was then placed on top of the Mylar substrate to ensure comparable and
reproducible experimental conditions. For continuous-drying mode the film was cast
directly onto the Mylar substrate which was moving continuously through the different
drying zones. For all cases the air flowrate was set at 0.5 m/s.
Figure 4-1. Drying zones of the continuous film drying line.

77
4.3.6 Near-infrared spectra acquisition
A microNIR 1700 (JDSU Inc., Santa Rosa, CA) was used to acquire diffuse
reflectance spectra of the polymer strip films. The instrument was set at working distance
of 5 mm from the casted film inside the drier as seen in Figure 4-2. At this height, an area
of approximately 12.5 mm2 was analyzed. Unless otherwise noted, the instrument was
mounted in Zone 3. The spectra were acquired at 40°C or 60°C, depending on the study,
as detailed in Table 4-1. Raw spectra were evaluated, corrected and subsequently
modeled using Unscrambler X 10.3 (CAMO, Woodbridge, NJ) and SIMCA 13.0.3.0
(Umetrics AB, San Jose, CA) softwares. The employed multivariate algorithms included
Savitzky-Golay smoothing filters and derivatives, and Principal Component Analysis
(PCA).
Figure 4-2. MicroNIR 1700 set-up for real-time characterization of film drying behavior in a continuous drier. Set-up in batch-mode on Zone 3.
4.3.7 Near-infrared chemical imaging
A Spectral Dimension SyNIRgy chemical imaging spectrometer equipped with a
cooled InGaAs focal plane array detector, a liquid crystal tunable filter, a microscope
stage and computer-controlled illumination was used (Malvern Instruments,

78
Worcestershire, UK). NIR hyperspectral images were acquired in transflectance mode as
described by Sievens-Figueroa et al. [9]. Spectra were collected for pure griseofulvin
(GF) powder and for oral films. Films were placed over a white ceramic disk of 28 mm in
diameter and secured with a microscope glass slide as shown in Figure 4-3. Pure GF, on
the other hand, was deposited on top of the glass slide to limit reference contamination.
The optical magnification used was 17.5 µm and the lamp intensity was set at 77.5%.
With these settings approximately 43% of the film was analyzed. Spectra were obtained
with 1 scan in the spectral range of 1800 – 2400 nm. Pretreatments consisted of a low-
pass triangle squared Fourier filter to smooth the spectra, removal of non-uniform pixels
(bad pixel) [116] and Savitzky-Golay 1st derivative calculated with a 3rd order
polynomial and step size of 7. These pretreatments were computed for all the images to
minimize differences in sample presentation (powder vs films) and maximize
measurement sensitivity with respect to chemical dissimilarities that were of interest.
Figure 4-3. Oral film sample set-up for acquiring NIR chemical images.

79
4.3.8 Thermogravimetric analysis (TGA)
A TGA/DSC1/SF Stare system (Mettler Toledo, Inc., Columbus, OH) was used to
analyze the films with and without GF or NPX. A small film sample of approximately 3.0
mg was placed in a ceramic crucible and mounted on the system. The experimental
conditions consisted on a temperature ramp from 25 oC to 150 oC in nitrogen atmosphere
at a constant heating rate of 5 oC/min, isothermal condition at 150 oC for 15 min and then
ramping further to 300 oC at a rate of 5 oC/min. Finally, the sample was cooled at a rate
of -10 oC/min to room temperature (25 oC). Each measurement was duplicated for all the
film compositions.
4.4 Results & Discussion
4.4.1 In-line NIR & TGA characterization
Chemometric analysis focused in the first –OH overtone band in the region of
1450 nm and further elucidation into drying kinetics and mechanical properties of the
films was completed with the use of unsupervised PCA. Data pretreatment consisted of
reflectance to absorbance conversion by computing the logarithm log10(1/R), and an 11-
point Savitzky-Golay smoothing filter to reduce noise caused by external factors. When
stated, a second order polynomial Savitzky-Golay first derivative was calculated on the
spectra to remove constant baseline offsets due to inherent NIR effects.
Figure 4-4 shows the in-line first derivative spectra for films dried at 40 and 60 °C
for the k2b formulation with 10% triacetin as plasticizer. Although the time to dry the
films at a lower temperature was twice that for those dried at higher temperature, in both

80
cases spectra was acquired throughout the drying process until there was no evident
change in the baseline. Films dried at 40 °C were inside the dryer for 65 minutes vs. 35
minutes when dried at 60 °C. Regardless, a proportional relationship between absorbance
and water concentration [117] of the analyzed sample is evident in the figure.
Figure 4-4. OH overtone in the 1450 nm region was monitored over time.
PCA models were computed to examine the underlying relationship between the
samples and independent variables. The PCA method seeks to deconvolute the spectral
data by computing orthogonal vectors (principal components; PC) that account for the
major sources of variability. The algorithm then uses these vectors to create a new
coordinate system onto which it projects the samples. The distance between the samples
in a Scores Plot defines how different they are.

81
The Scores plot in Figure 4-5a shows that PC-1 accounts for 96% of the
variability in the spectra. The algorithm projected the samples sequentially (in the
direction of the drying process) along PC-1. This indicates that PC-1 explains the
differences in water content. PC-2 in Figure 4-5b explains 3% of the variability that was
not explained by the first principal component. PC-2 corresponds to the differences in
drying temperatures. The change in this process variable, as evidenced by the
eigenvectors (loadings) plot in Figure 4-6, induce a spectral shift of the 1450 nm band
when drying at higher temperatures. This shift has been previously reported in NIR
spectra of liquid water at higher temperatures and denotes the strength of the covalent –
OH bonds where strengthening of these molecular vibrations will cause shifts to higher
wavelengths (lower frequencies). Thus, spectral bands become narrower and stronger at
higher temperatures [118, 119].

82
(a)
Drying Time (min)
0-10
10-20
20-30
30-40
40-50
50-60
PC-1 (96%)-0.1 0 0.1
PC
-2 (3
%)
-0.03
-0.02
-0.01
0
0.01
0.02
0.03
(b)
Temperature
40 C
60 C
PC-1 (96%)-0.1 0 0.1
PC
-2 (3
%)
-0.03
-0.02
-0.01
0
0.01
0.02
0.03
Figure 4-5. PCA Scores Plot of pretreated k2b spectra grouped by a) drying time (mins) b) drying temperature.
Direction of drying process

83
PC-1
PC-2
X-variables (1-2)939. 1007 1075 1143 1211 1279 1347 1416 1484 1552 1620
-0.3
-0.2
-0.1
0
0.1
0.2
0.3
Figure 4-6. Eigenvectors (loadings) plot for k2b. The arrow shows the direction of spectral shift.
Line Scores plot for k2b also show very interesting features. Upon close
inspection of one dimensional PC-1 (Figure 4-7), a clear difference in the slope of the
plot of eigenvalues vs. time is seen. This negative slope is steeper for the spectra at higher
temperatures. Combining this knowledge with the two dimensional scores analysis of PC-
1 and PC-2, one can infer that this line plot can be used for control purposes so as to track
water content in the system at any time. The slope of this line is related to the rate of
solvent removal; where at higher temperatures, the rate is higher. The plot region where
the rate of water content change is zero (constant eigenvalues) indicates the time when
the film is dried (void of free moisture). This point represents the minimum residual
solvent (MRS) limit for the film formulation. Furthermore, if the drying process extends
in this region, films can enter the “antiplasticization” regime [120] where plasticizer-
polymer interactions dominate and films lose their elasticity resulting in brittle products.
Identifying the MRS limit is advantageous for prescreening formulation studies. If
product stability fails at MRS, this plot indicates that increasing process temperature, for

84
this plasticizer and those of similar molecular size affecting intermolecular H bonding,
will not result in lower MRS unless very high temperatures (~150 °C) are used to remove
bound moisture. This process would essentially “cook” the film. In this case, the
formulator should assume that residual moisture content is a function of formulation
parameters, so its components and their ratios should be reevaluated. NIR observations
can then be validated with TGA measurements that quantify free and bound water such as
those in Figure 2-8. For k2b dried at 40 and 60 °C, free water was ~ 3% and 0%, and
bound water 4% and 3%, respectively.
Figure 4-7. Line scores plot for PC-1. This PC accounts for water content differences. The x-axis are the sequential k2b samples as they were drying.

85
Figure 4-8. TGA for k2b films showing free and bound water.
Next, all spectra acquired at 40 °C (blue spectra) and 60 °C (red spectra) were
analyzed using PCA (Figure 4-9). Along PC-1 the process can be tracked (right to left) so
as to predict water content in real-time. PC-2 in this analysis explains a higher variability
(compared to the k2b formulation; 23% vs 3%). In this principal component, a distinct
change in slope is evident. The slope at low temperatures is approximately zero, while at
high temperatures the slope is higher, especially for those at the end of the drying process
at 60 °C (these films were over dried intentionally). Since these last films were different
from all others, the capabilities of the NIR analysis to identify bad product was assessed.
It is important to clarify that the change in direction along PC-1 and PC-2 do not
correspond to the film gaining water. Instead, as the film over dries it forms a thick
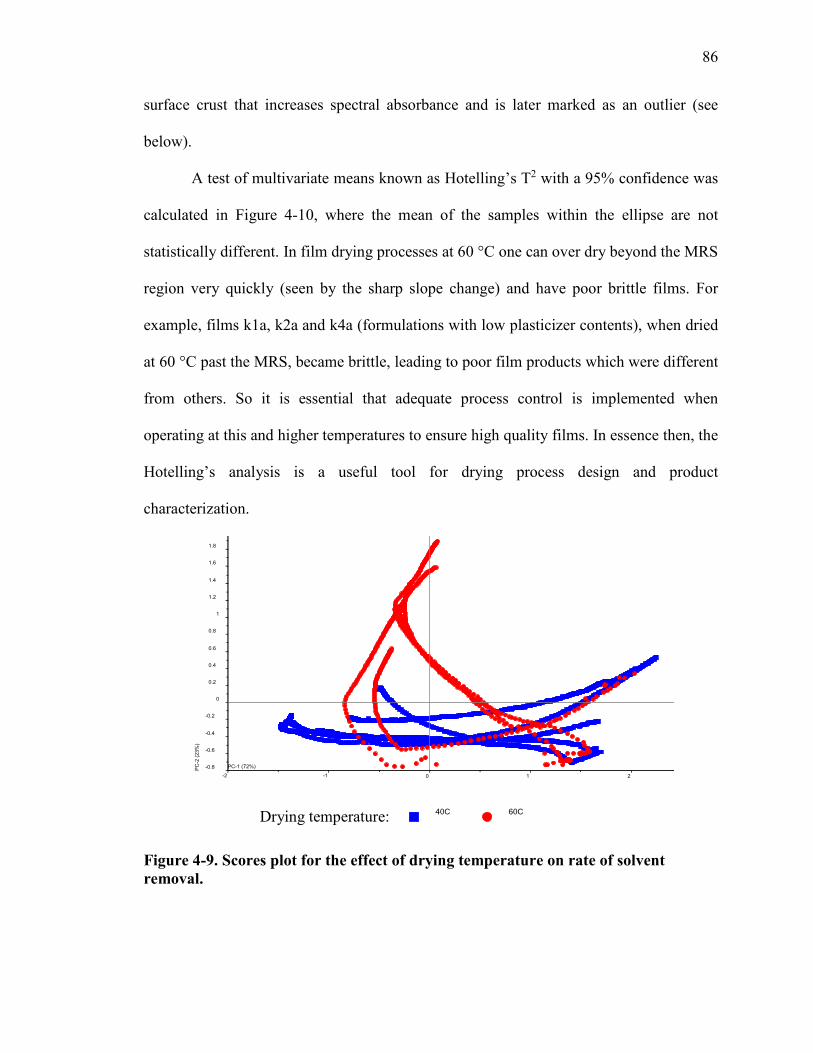
86
surface crust that increases spectral absorbance and is later marked as an outlier (see
below).
A test of multivariate means known as Hotelling’s T2 with a 95% confidence was
calculated in Figure 4-10, where the mean of the samples within the ellipse are not
statistically different. In film drying processes at 60 °C one can over dry beyond the MRS
region very quickly (seen by the sharp slope change) and have poor brittle films. For
example, films k1a, k2a and k4a (formulations with low plasticizer contents), when dried
at 60 °C past the MRS, became brittle, leading to poor film products which were different
from others. So it is essential that adequate process control is implemented when
operating at this and higher temperatures to ensure high quality films. In essence then, the
Hotelling’s analysis is a useful tool for drying process design and product
characterization.
40C 60C
PC-1 (72%)
-2 -1 0 1 2
PC-2
(23%
)
-0.8
-0.6
-0.4
-0.2
0
0.2
0.4
0.6
0.8
1
1.2
1.4
1.6
1.8
Figure 4-9. Scores plot for the effect of drying temperature on rate of solvent removal.
Drying temperature:

87
k1b k2a k4a k4b k1a
PC-1 (72%)
-2 -1 0 1 2
PC
-2 (2
3%)
-1
0
1
Figure 4-10. Hotelling’s analysis for testing means and detecting outliers.
4.4.2 Off-line NIR Chemical Imaging
The raw chemical imaging spectra for micronized griseofulvin (GF) films is shown in
Figure 4-11. The red spectrum corresponds to the pure GF drug. As stated earlier, several
filters were employed to enhance chemical differences and exclude bad pixels from the
image. An example of a filtered image is shown in Figure 4-12.

88
1800 1900 2000 2100 2200 2300 2400
1000
2000
3000
4000
5000
6000
7000
8000
9000
10000
g p ( , )
Wavelength (nm)
Ref
lect
ance
(Cou
nts)
Figure 4-11. Raw spectra of micronized films (black) and pure GF drug (red).
1800 1900 2000 2100 2200 2300 2400
0.15
0.2
0.25
0.3
0.35
0.4
0.45
0.5
0.55
0.6
g p p p ( )
Wavelength (nm)
Abs
orba
nce
Figure 4-12. Absorbance spectra pretreated with background correction, spectral Fourier filters and removal of bad pixels.
It was evident that there were differences in the baseline of the spectra for the
different films and pure drug. This could have been the result of changes in sample
presentation and/or lamp intensity. A first order Savitzky-Golay derivative in the region
of 2100 – 2400 nm with 7 points and a 3rd order polynomial was computed to address this
issue. The pretreatments enhanced chemical dissimilarities between the films as shown in

89
the absorbance changes of the GF band in Figure 4-13 for the nanosized films (black) and
pure drug (red).
2100 2150 2200 2250 2300 2350 2400
-0.06
-0.04
-0.02
0
0.02
0.04
0.06
Wavelength (nm)
Abs
orba
nce
Figure 4-13. Spectra of the Saviztky Golay 1st derivative in the region of 2100-2400 nm with 7 points and a 3rd order polynomial for nanosized films (black) and Griseofulvin (red)
The pre-treated GF spectrum was used to calculate a Partial Least Squares
Discriminant Analysis (PLS-DA) for both the micro and nanosized films. This analysis
yields quantitative predictions on the abundance of the drug in each of the pixels that
make up the 2D image. The predictions are then used to estimate the mean percentage of
API in the films, which can be validated, for example, by HPLC measurements for
content uniformity. Values of 0.0 and 1.0 mean that no drug and only pure drug where
found in the pixel, respectively.
Mean drug abundance was predicted for all micronized and nanosized films
provided by Lucas-Sievens Figueroa. An example of the analysis output for a micronized
film is shown in Figure 4-14. The color bar on the right-hand side of the score presents
the abundance of drug in each of the 81920 pixels. For the analyzed area, the algorithm

90
predicted that the mean abundance in this film was 31.9 % GF. Moreover, there seemed
to be a preferential drug distribution to the right side of the image as seen by the
increased red intensity. So as to evaluate the magnitude of this difference the
hyperspectral cube was halved and each partition analyzed separately to estimate drug
uniformity. The results of this analysis, truncated for visualization purposes using 10
bins, are shown in Figure 4-15.
Figure 4-14. Micronized film with mean abundance of 31.9% GF.

91
Figure 4-15. Abundance of Griseofulvin in the halves of Micronized Film 1 (m1). Half m1 (a) has an abundance of 28.9% whereas for m1 (b) the abundance is 35.0%.
PLS-DA predictions for the halved hypercubes (Figure 4-15 and Table 4-2) show that
films containing micronized drug with an expected potency of 27% w/w do not
necessarily have a uniform distribution of the active. Micronized film halves vary by at
least 6 %, with the right side (side b) containing a higher mean drug abundance. So as to
ensure that this was not an artifact, the cue was rotated and the GF abundance re-
estimated. Results were similar, i.e., the same side contained higher amounts of drug.

92
A similar analysis was undertaken for the hyperspectral images of the nanosized
films. PLS-DA results were truncated to 2 standard deviations to yield positive
abundances only. The results are summarized in Table 4-3.
Table 4-2. PLS-DA GF abundance results in halves of micronized films Micronized
Film Side (a) % GF
Side (b) % GF
Mean % GF
m1 28.8 35.0 31.9 m2 36.0 43.1 39.5 m3 35.6 41.8 38.7
The results for nanosized films evidenced a preferential drug separation in the films.
The identity of the analyte was investigated and it was found to be glycerol. In fact, for
these films, plasticizer concentration was 31%, which is much higher than those reported
in the literature [9, 52, 75, 121, 122]. Upon closer visual inspection these films exudated
the glycerin, thus indicating that at this high concentrations plasticizer-plasticizer
associations dominate [120] and thus nanosized free drug leaches from the matrix.
According to the Gel-Plasticizer theory by Aiken and others [120], plasticizer separate
polymer chains and increase the space between polymer molecules. If high enough
concentrations are used in the system, the increased free volume accelerates drug
leaching as function of particle size. Thus explaining why nanoparticles leached and
micro particles did not.
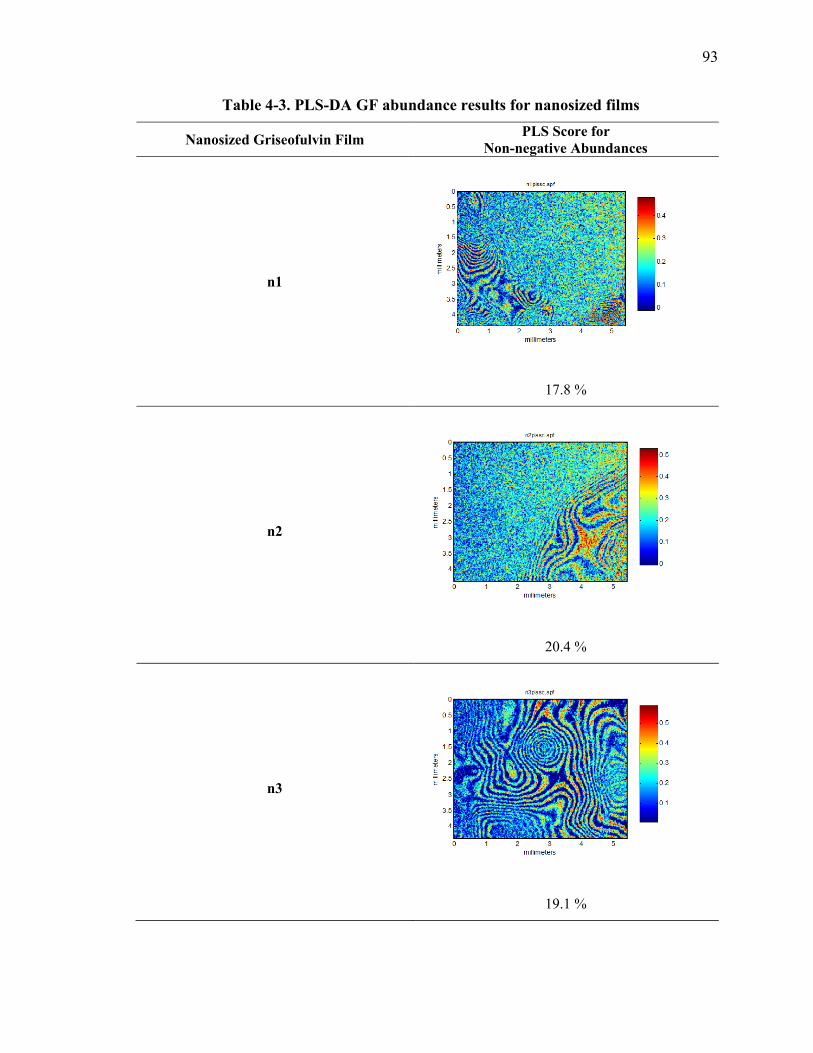
93
Table 4-3. PLS-DA GF abundance results for nanosized films
Nanosized Griseofulvin Film PLS Score for Non-negative Abundances
n1
17.8 %
n2
20.4 %
n3
19.1 %

94
n4
17.3 %
n5
19.1 %
n6
20.2 %
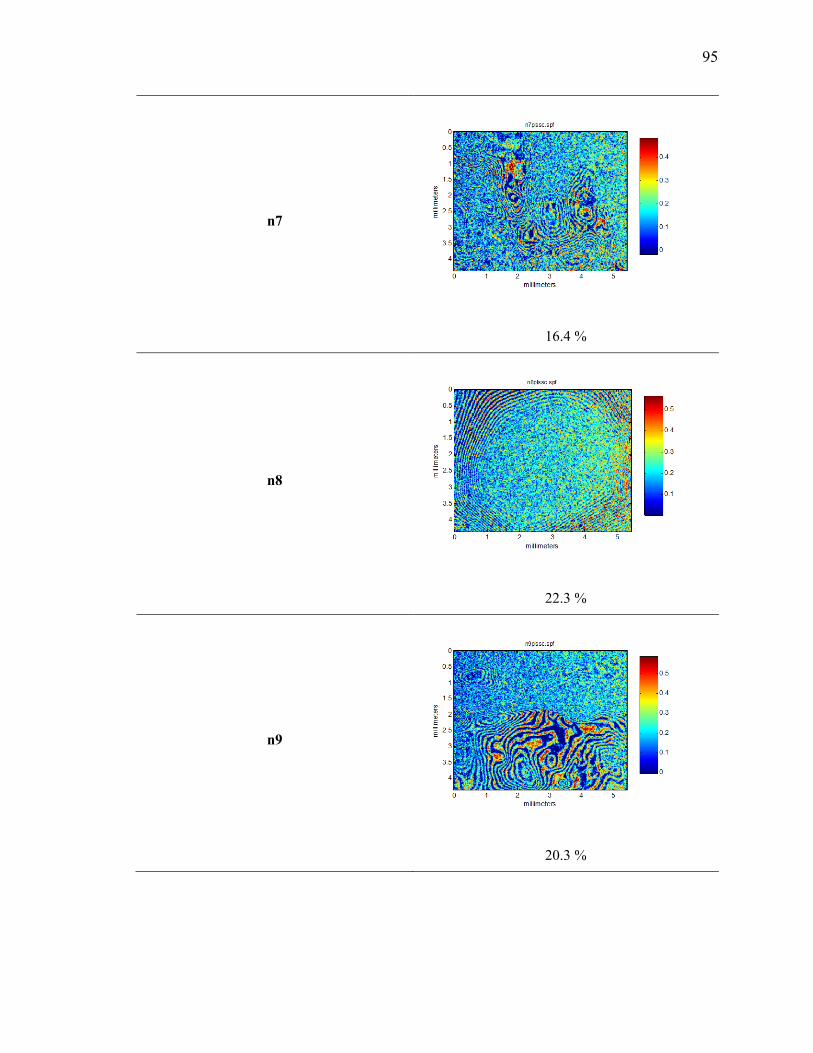
95
n7
16.4 %
n8
22.3 %
n9
20.3 %
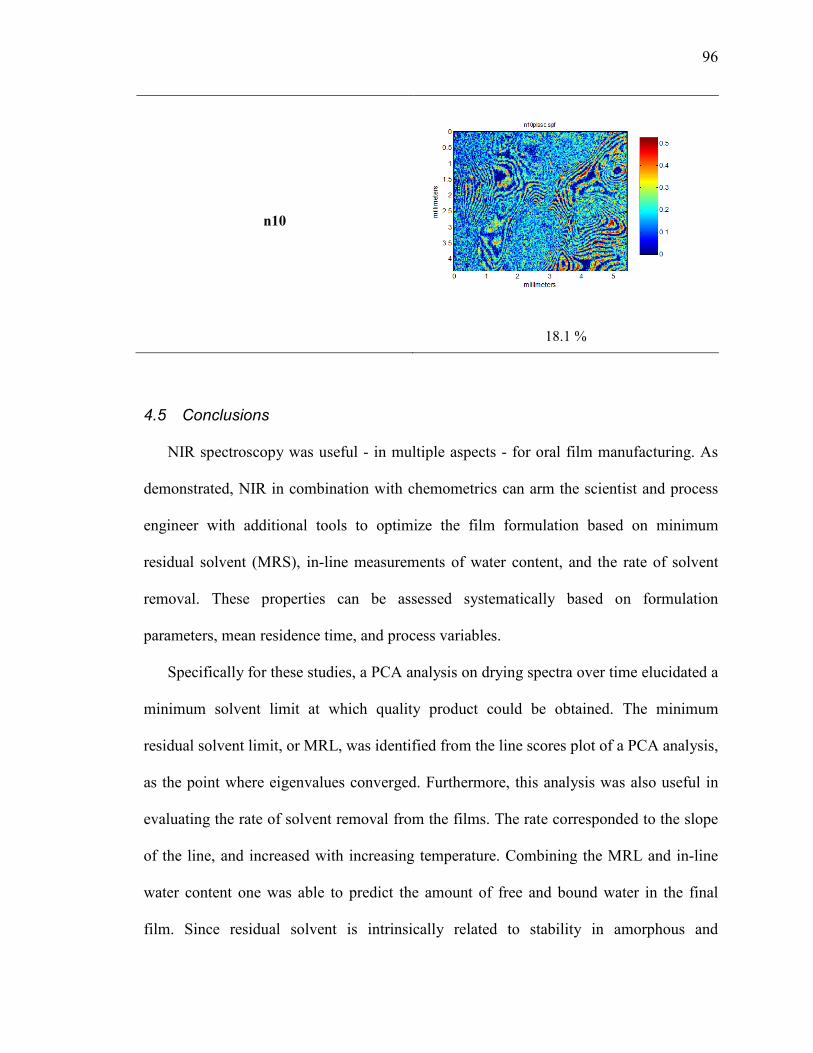
96
n10
18.1 %
4.5 Conclusions
NIR spectroscopy was useful - in multiple aspects - for oral film manufacturing. As
demonstrated, NIR in combination with chemometrics can arm the scientist and process
engineer with additional tools to optimize the film formulation based on minimum
residual solvent (MRS), in-line measurements of water content, and the rate of solvent
removal. These properties can be assessed systematically based on formulation
parameters, mean residence time, and process variables.
Specifically for these studies, a PCA analysis on drying spectra over time elucidated a
minimum solvent limit at which quality product could be obtained. The minimum
residual solvent limit, or MRL, was identified from the line scores plot of a PCA analysis,
as the point where eigenvalues converged. Furthermore, this analysis was also useful in
evaluating the rate of solvent removal from the films. The rate corresponded to the slope
of the line, and increased with increasing temperature. Combining the MRL and in-line
water content one was able to predict the amount of free and bound water in the final
film. Since residual solvent is intrinsically related to stability in amorphous and

97
molecular solid dispersions, NIR proved to be an effective tool for a priori optimization
of film formulation and drying process parameters
NIR chemical imaging as an off-line characterization tool elucidated unidentified
microscopic behaviors upon solid dispersion formation and drying. This allowed an a
priori assessment of the drug product that further complements the strategies presented
earlier. It was found that microparticles distributed more uniformly in the matrix than
nanoparticles. Even more, these nanoparticles particles further increased the system’s free
volume increasing segment mobility and thus exudating small glycerol molecules from
the films.
The novel introduction of these tools for oral film manufacturing will undoubtedly,
increase product/process understanding. Even more, when used in combination these
PAT tools can accelerate drug-to-market time as failure modes (as related to phase
separation, drying, and stability, for example), can be studied early on.

98
Chapter 5 Transoral Films from Glassy Solid Dispersions for
Solubility and Bioavailability Enhancement
5.1 Summary
This chapter introduces for the first time, the use of glassy solutions for direct
solubilization of poor water-soluble APIs in the form of a transoral (oromucosal) film.
The motivation in these studies originated from the immense potential altogether with the
lack of understanding of these solid dispersion formulations.
Initially, polymers known to promote intra and intermolecular H bonding were
systematically evaluated in terms of their solubilization capacity and compatibility with
NPX. Kinetic solubilities of the drug in Soluplus® solutions were measured and fitted to a
linear equation so as to ensure the system was below its saturation limit. Additional
components were added to increase the glass transition of the system, plasticize the film,
and accelerate drug dissolution. Several qualitative and analytical tests were run on the
solvent casted films to evaluate phase separation, NPX recrystallization, excipient
interactions, critical moisture uptake, and to predict long-term stability. The tests
included polarized light microscopy, Fourier transform infrared spectroscopy (FT-IR),
differential scanning calorimetry (DSC), TGA, dynamic vapor sorption (DVS), X-Ray
diffraction (XRD), dissolution, Franz diffusion, and accelerated stability tests.
99
5.2 Introduction
Appropriate selection of formulation components is a problem that all formulators
face. There needs to be physical and chemical compatibility between the components so
that phase separation and stability are not a big concern later on. Despite the
technological advances of recent years in product and process design, much of these
efforts are still based on trial and error optimizations and a posteriori measurements.
Recently, several modeling platforms have focused on molecular conformational changes
to predict the time-dependent behavior and miscibility of multi-component systems.
These platforms have yet to prove beneficial to real-life complex molecules and even if
they do, high computational costs and the need to estimate molecular forces a priori will
need to be taken into account [123]. Nonetheless, it has been proposed that molecular
dynamic models will solve most pharma issues, including enabling a faster route to drug
discovery and the ability to predict performance of formulations and products within the
next 25 years [124].
In earlier chapters, crystalline glass suspensions were developed as a mean to
deliver nanosized drug stabilized in oral films. This chapter introduces glassy solutions as
and effective option for achieving the highest rate of drug solubilization in a film product.
In these systems the API is fully solubilized and molecularly dispersed within the
polymer matrix. This leads to products with high dissolution rates but with questionable
chemical and physical stability if the drug is above its saturation solubility. Molecular
simulations and typical characterization methods are not adequate to predict the future
performance of these systems as they rely on estimates of forces and/or analyze very
small system domains. Phase separation of the components and final stability
100
specifically, are two parameters that lack a unified analytical tool. As such, formulation
optimization of complex glassy solutions still rely on combining polymer screening
strategies with several characterization tools.
As a review, the simplest oral film formulations for fast-dissolving applications
contain (in addition to the active): polymers, plasticizers, surfactants and flavors and/or
bitter masking agents. The polymers are used to freeze or embed the drug in a hydrophilic
matrix that gives rigidity to the dosage form. Plasticizers allow mobility of polymer
chains so as to reduce the strength required for elongation and the glass transition
temperature (Tg) of the system. Plasticizers may also decrease oxygen permeability of
the drug product by filing up the free film volume; water is one exception. Surfactants aid
in film wettability, while flavors and other additives are typically used for aesthetic
purposes.
Compared to typical oral film formulations, films derived from glassy solutions
incorporate polymers that serve as matrix formers while solubilizing the API, and
additional components that inhibit drug recrystallization. The model drug for this chapter
was NPX. Several studies had previously evaluated polymeric excipients that to a great
extent solubilized this and other drugs. One of these was Soluplus®, a graft amphoteric
copolymer of polyvinyl caprolactam (VCL), polyvinyl acetate (PVAc) and polyethylene
glycol (PEG).
Djuris et al. [125] prepared solid dispersions of carbamazepine (CBZ) and Soluplus®
at max drug loadings of 5% w/w. Higher drug loadings exceeded saturation solubilities
and resulted in microcrystalline dispersions of the drug that later induced micron-sized
CBZ polymorphs. In comparison, Kyeremateng et al. [126] studied IBU and NPX
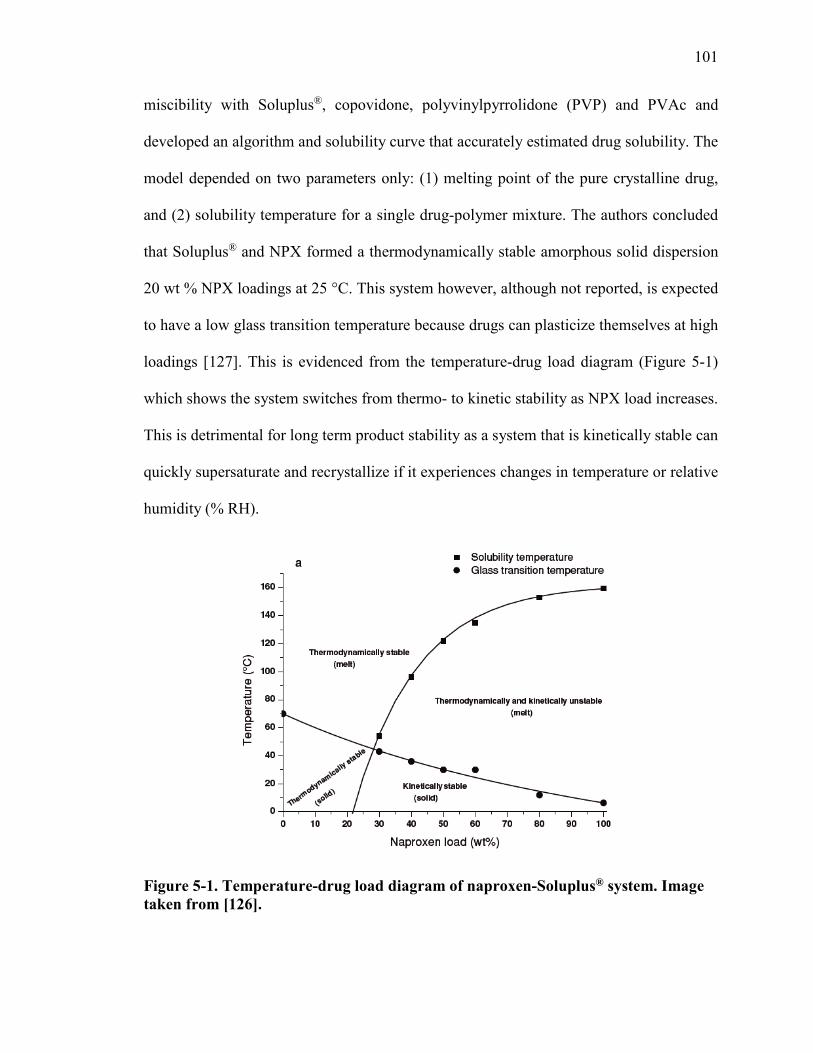
101
miscibility with Soluplus®, copovidone, polyvinylpyrrolidone (PVP) and PVAc and
developed an algorithm and solubility curve that accurately estimated drug solubility. The
model depended on two parameters only: (1) melting point of the pure crystalline drug,
and (2) solubility temperature for a single drug-polymer mixture. The authors concluded
that Soluplus® and NPX formed a thermodynamically stable amorphous solid dispersion
20 wt % NPX loadings at 25 °C. This system however, although not reported, is expected
to have a low glass transition temperature because drugs can plasticize themselves at high
loadings [127]. This is evidenced from the temperature-drug load diagram (Figure 5-1)
which shows the system switches from thermo- to kinetic stability as NPX load increases.
This is detrimental for long term product stability as a system that is kinetically stable can
quickly supersaturate and recrystallize if it experiences changes in temperature or relative
humidity (% RH).
Figure 5-1. Temperature-drug load diagram of naproxen-Soluplus® system. Image taken from [126].
102
Other solubilizing polymers and their effect on drug loading have also been studied.
Worku et al. [128] combined naproxen and Kollidon VA 64, a copolymer of polyvinyl
pyrrolidone (PVP) and PVAc, via spray drying to produce solid dispersions of 30 to 50
wt % drug loading. The authors also evaluated direct compression post spray-drying as a
technique to reduce crystallinity of the resulting solid dispersion.
Based on this previous work it seems that combining NPX with Soluplus® leads to
thermodynamically stable molecular dispersions at maximum 20 wt % drug loadings, but
that addition of Kollidon VA can further increase this loading to 50 wt %. For the studies
presented in this chapter, it is hypothesized that the combination of NPX with Soluplus®
and VA 64 will lead to molecular dispersions that are kinetically and thermodynamically
stable. Moreover, since solvent-casted films are limited in terms of drug loading the
glassy formulation will be optimized so that it can be processed by both solvent casting
and hot-melt extrusion. This would facilitate delivery of poorly-water soluble drugs with
flexible manufacturing platforms.
The methodology for this task will include excipient screening, stability assessment
of the formulation in terms of drug recrystallization and phase separation, and
performance studies of the final transoral film. The solubilization capacity of the selected
polymers will be evaluated in a manner feasible for manufacturing oral films and melt
products, i.e. via solvent-evaporated films.

103
5.3 Materials & Methods
5.3.1 Materials
The following materials were used:
Table 5-1. Materials used for completing experiments
Materials Vendor Naproxen (NPX) Tokio Chemical Industry, Tokyo, JA
Sodium dodecyl sulfate (SDS) MP Biomedicals, Santa Ana, CA Soluplus BASF, Florham Park, NJ
Kollidon VA 64 BASF, Florham Park, NJ PEG 400 Acros Organics, Geel, BE
Kollidon 90 F BASF, Florham Park, NJ PEG 1450 BASF, Florham Park, NJ
Kollidon SR BASF, Florham Park, NJ
Bubblegum Flavor Bell Flavors, Middletown, NY
5.3.2 Solubilization capacity of polymers
As stated earlier, based on extensive literature research Soluplus® appears to be
the best candidate for NPX solubilization. This polymer’s major mode of action is based
on the large dipole moment of its side groups that interact with other dipoles present in
the system. Naproxen is a weakly acidic drug that has two polar moieties, carboxylate
and methoxy, linked to a central hydrophobic naphthalene ring [129]. Since naproxen
possesses a large dipole, the polymer should interact with the drug via hydrogen bonding
to form a complex in which solids are acting as solutes, i.e. a solid dispersion.
Kinetic saturation solubilities of NPX in Soluplus were determined after preparing
15 g total of Soluplus polymer solutions of increasing concentration in PBS pH 7.0. PBS
was used to avoid ionic effects due to the drug being a weak acid for which solubility
104
depends on pH. The expected solubility enhancement was compared to NPX solubility in
other common media including simulated gastric juice with pH 0.3 and PBS pH 5.8, 7.0
and recommended USP media PBS pH 7.4. Two replicates were analyzed for each test.
PBS and Soluplus solutions were equilibrated at 25 °C prior to being saturated
with pure NPX. Upon drug addition, these were stirred magnetically for a minimum of 72
hrs. After this period, the suspension was centrifuged and the supernatant vacuum filtered
with 0.45 μm hydrophilic polyvinylidene difluoride (PVDF) membranes with a
Samplicity Filtration System (EMD Millipore, Billerica, MA). The filtered solution was
then analyzed with a Hewlett-Packard/Agilent 1100 Series HPLC system as detailed in
the protocol included in Appendix II.
5.3.3 Oral film casting
Polymer, plasticizer and additive(s) solutions were gravimetrically prepared with
DI water via magnetic stirring. These were then combined at the specified ratios to form
the film precursor solution. This final solution was either magnetically or mechanically
mixed for at least 8 hours before being syringe casted on a perfluoroalkoxy (PFA) petri
dish (Chemware, Raleigh, NC). If there were bubbles present, the solutions were
degassed for 5 minutes. For each formulation a linear equation relating casting weight
and final film thickness was developed so as to ensure uniform weight and dosage
potency in subsequent experiments.

105
5.3.3.1 Conduction
Petri dishes containing the precursor solution were dried overnight in an oven
(Isotemp Incubator Model 655D, Fisher Scientific Inc., Hampton, NH) at 42°C. Post
drying, flat tweezers were used to peel films from the plates.
5.3.3.2 Convection
A convection drying system was designed and built as shown in Figure 5-2. The
system was comprised of cardboard (corrugated for insulation) cut specifically to fit a
table box fan (Weather-Shield, Lasko, West Chester, PA). Opposite to the fan opening
there were two large flaps open at 135° degrees to allow cross ventilation and an air flow
of 200 ft/min. Four silica desiccant plates inside the system ensured low relative
humidities while drying. For making films, the dishes were arranged inside the cardboard
enclosing and left inside the dryer for a minimum of 8 hours at 20°C. It is important to
note that this system has no autonomous temperature control.
Figure 5-2. Convective drying system for batch oral film manufacturing

106
5.3.4 Physiochemical characterization
5.3.4.1 Polarized light microscopy
Qualitative experiments were performed at ambient conditions using a Confocal
Fluoresce microscope (Zeiss, Germany) equipped with a Leica digital camera (Leica
Microsystems, Wetzlar, Germany).
5.3.4.2 Fourier Transform Infrared (FT-IR) analysis
A 55 Bruker Equinox FTIR spectrometer (Bruker Optics, Billerica, MA) fitted
with a DuroScope (Smith’s Detection System, Danbury, CT) diamond ATR and equipped
with a DTGS (Deuterated Triglycine Sulfate) detector was used to measure the IR spectra
of films. Parameters for spectra acquisition consisted of 100 co-added scans in the range
of 4000 – 560 cm-1 at a resolution of 128 cm-1. A background was collected before every
sample was measured. After each sample analysis, the diamond ATR crystal was cleaned
with acetone.
5.3.4.3 X-Ray Diffraction (XRD)
A Panalytical X'Pert system was used with a Cu x-ray source at 45 kV and 40 mA
over a continuous scan range of 10° to 90° 2θ; at a virtual step size of 0.0131° and
counting time of 78.795 seconds. In the incident beam path, an anti-scatter slit of 1° and
divergent slit of 1/2° were used. The diffracted beam path had an anti-scatter slit of 9.1
mm. The film was rotated at a speed of 4 seconds per rotation in order to analyze a larger
region of the sample.

107
5.3.4.4 Differential Scanning Calorimetry (DSC)
A TGA/DSC1/SF Stare system (Mettler Toledo, Inc., Columbus, OH) was used to
analyze the films. A small film sample of approximately 10.0 mg was placed in an
aluminum pan, clamped with a vented lid and mounted on the system. The run set up
consisted on a heating step from 25 oC to 200 oC in nitrogen atmosphere at a constant
heating rate of 5 oC/min, isothermal condition at 200 oC for 1 min, cooling from 200 oC
to 25 oC at a rate of -5 oC/min, hold at 25 oC for 1 min, a second ramp from 25 oC to 200
oC at 5 oC/min, and a final cool to 25 oC at a rate of -50 oC/min. Samples were run in
triplicate unless stated otherwise.
5.3.4.5 Thermogravimetric analysis (TGA)
A square film sample was cut and placed into a platinum pan with a clamped lid.
The sample was weighed and placed in the TA Q250 (TA Instruments, New Castle, DE)
system where the temperature was increased from 25°C to 500°C at 5°C/min.
5.3.4.6 Intrinsic Dynamic Vapor Sorption (DVS) analysis
A manual lever punch (Recollections, Irving, TX) was used to cut circular film
samples of 0.64 cm2 in size. The samples were weighed and placed in aluminum sample
pans. Isothermal DVS run conditions consisted of drying and dynamic humidity steps.
Initially, the film was dried for 120 minutes for 25°C at 0% RH. Then a dynamic step of
600 min in duration increased the RH from 0 to 95% at a constant temperature of 25°C.
The mass of the film was recorded as a function of relative humidity and time.

108
5.3.4.7 Accelerated stability tests (AST)
The conditions chosen for these tests were based on results of TGA and DVS.
Saturated salt solutions were prepared in air-tight mason jars. These were allowed to
equilibrate in two separate ovens set at 45°C and 50°C temperatures. Films in dark-
colored heat-sealed Ziploc bags were then placed inside the jars. These were then
removed and analyzed for content uniformity in an HPLC as per the design suggestions.
Statistical analysis of the data included Principal Component Analysis (PCA) and
Hotelling’s T2 multivariate tests with the aid of SIMCA 13.0.3.0 (Umetrics AB, San Jose,
CA) software.
Table 5-2. Accelerated stability test conditions
Salt % RH T(°C) Days Sodium Bromide 51 50 8, 11, 14 Potassium Iodide 64 50 5, 9, 14 Sodium Nitrate 69 50 5, 8, 14 Sodium Nitrate 70 45 9, 11, 14
Sodium Chloride 74 50 4, 8, 14 Sodium Chloride 75 45 8, 11, 14
5.3.5 Drug release and transmucosal permeation
5.3.5.1 In vitro drug release
Drug release assessment was carried out in a fully automated Varian VK 7010
Dissolution Apparatus (Agilent Technologies, Santa Clara, CA) in a USP I basket
configuration. Five films were placed inside baskets and into round-bottom glass vessels
containing 900 ml of PBS pH 7.4 at 37±0.5 °C. Basket rotation was set at 100 rpm. A
peristaltic pump extracted 1 ml samples after filtering these with 35 μm cannula full flow

109
filters. Samples were deposited onto HPLC vials with 2 ml capacity and analyzed via
HPLC following the method in Appendix II.
5.3.5.2 Transmucosal drug diffusion
Drug diffusion through porcine cheek mucosa obtained from slaughtered pigs
(Tissue Source, West Lafayette, IN) was evaluated in vertical Franz cell set ups. The
thickness of the tissue was measured using a digital micrometer and layers of connective
tissue (lamina propia) were excised manually or with the help of a Leica CM 1850
cryosectioning microtome (Leica Biosystems, Buffalo Grove, IL) until a final thickness
of ~ 580 μm was achieved. This tissue thickness corresponds to the mean thickness for
human buccal mucosa [74].
Six Franz diffusion cells of 9 mm diameter corresponding to an area of 0.64 cm2
were set up to contain 5 ml of phosphate buffer (PBS) pH 7.4 as the receptor media. A
circular punch was used to cut films of 10 mm in diameter. These were placed on top of
the porcine cheek mucosa. Saliva A pH 6.2 (refer to Table 3-1) was used in the donor
chamber. Donor and receptor were clamped and 0.5 ml of simulated saliva was added to
the donor compartment at the beginning of the diffusion experiment. The cell was
magnetically stirred for the duration of the experiment and its temperature maintained at
37±0.5 °C to with the use of a heat block. Six replicates were run for each experiment.
The set-up is shown in Figure 5-3.

110
Figure 5-3. Franz diffusion set up for evaluating transmucosal drug permeation.
5.4 Results & Discussion
Initial screening of polymers consisted of assessing the solubilization capacity of
polymers and graft copolymers of polyvinylpyrrolidone (PVP), polyvinyl alcohols
(PVA), polyethylene glycols (PEG), polyvinyl acetate (PVAc) and polyvinyl caprolactam
on pure naproxen. These polymers are well researched in literature as having low Tgs,
capacity for crystal inhibition, solubilizing and plasticizing effects, thermoplastic
properties and high polarity, respectively. The trade names for the polymers used in study
were Kollidon K12 and K17, Kollicoat IR, PEG 400, Pluriol E 1450, Pluriol E 8000,
Soluplus and Kollidon VA 64, among many others.
The polymers that conferred the maximum solubilization of NPX were the
combination of Soluplus - an amphoteric graft copolymer of polyvinyl caprolactam:
PVAc: PEG, and Kollidon VA 64 - a copolymer of PVP-PVAc. Both of these polymers
function as H-bond acceptors that allow complex formation with non-polar drugs.
Specifically, Soluplus confines the hydrophobic drug in its core to form dispersed
micelles while VA 64 mainly functions as a matrix former and dry binder; this copolymer
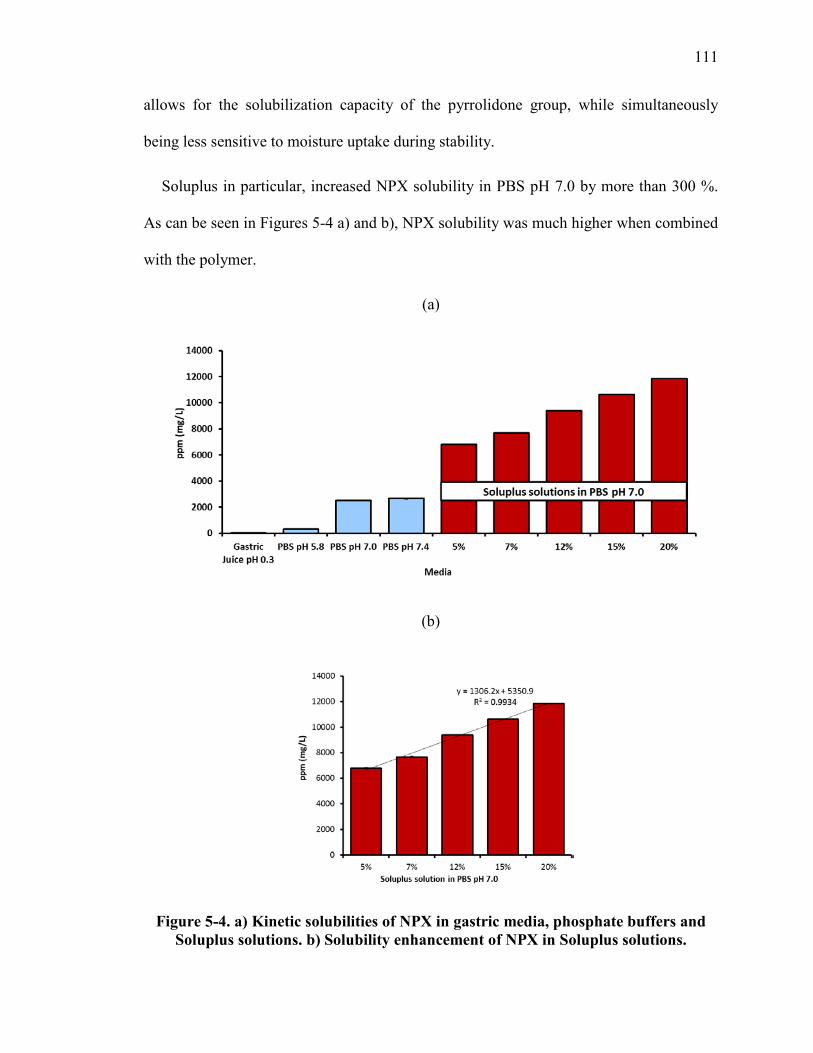
111
allows for the solubilization capacity of the pyrrolidone group, while simultaneously
being less sensitive to moisture uptake during stability.
Soluplus in particular, increased NPX solubility in PBS pH 7.0 by more than 300 %.
As can be seen in Figures 5-4 a) and b), NPX solubility was much higher when combined
with the polymer.
(a)
(b)
Figure 5-4. a) Kinetic solubilities of NPX in gastric media, phosphate buffers and Soluplus solutions. b) Solubility enhancement of NPX in Soluplus solutions.

112
Having found an adequate solubilizer, the rest of the film components needed to be
gauged. Kollidon VA 64 is a copolymer of polyvinyl acetate (PVAc) and polyvinyl
pyrrolidone (PVP). Its amide carbonyl monomer can serve as a hydrogen acceptor and
thus promote the molecular dispersion of NPX within the polymer system. This polymer
has another singularity; it has a high glass transition temperature of 104 °C.
Additional film components included functional plasticizers that imparted film
flexibility and inhibited drug recrystallization, and additives that enhanced dissolution.
Studies by Mura et al. [130] had reported the effects of SDS, Tween 80 and molecular
weight of PEG on the release rate of naproxen dispersions (not glass solutions). The
group concluded that at SDS concentrations of 5-10% w/w the molecular weight of PEG
was not significant on the drug release. These high SDS concentrations would definitely
drive the solubility of the system irrespective of drug and carrier properties. For oral drug
products the SDS concentration ranges of 5-10% w/w evaluated by Mura et al [130] are
well above the acceptable limits for SDS, a molecule that is considered an eye/skin
irritant. Furthermore, the maximum reported amount in the FDA Inactive Ingredient
Search for Approved Products [131] pertains to patent EP 1539144 A2 [132] for an
extended release oral osmotic tablet of 1000 total mg with an associated SDS content of
5% w/w.
The studies by Mura et al. served as the foundation for delimiting the SDS
concentration ranges in the transoral film formulation, and identifying PEG as a
compatible plasticizer. Historically, PEG has been used as a plasticizer, but it also has
solubilizing properties that may enhance wettability of some compounds consequently
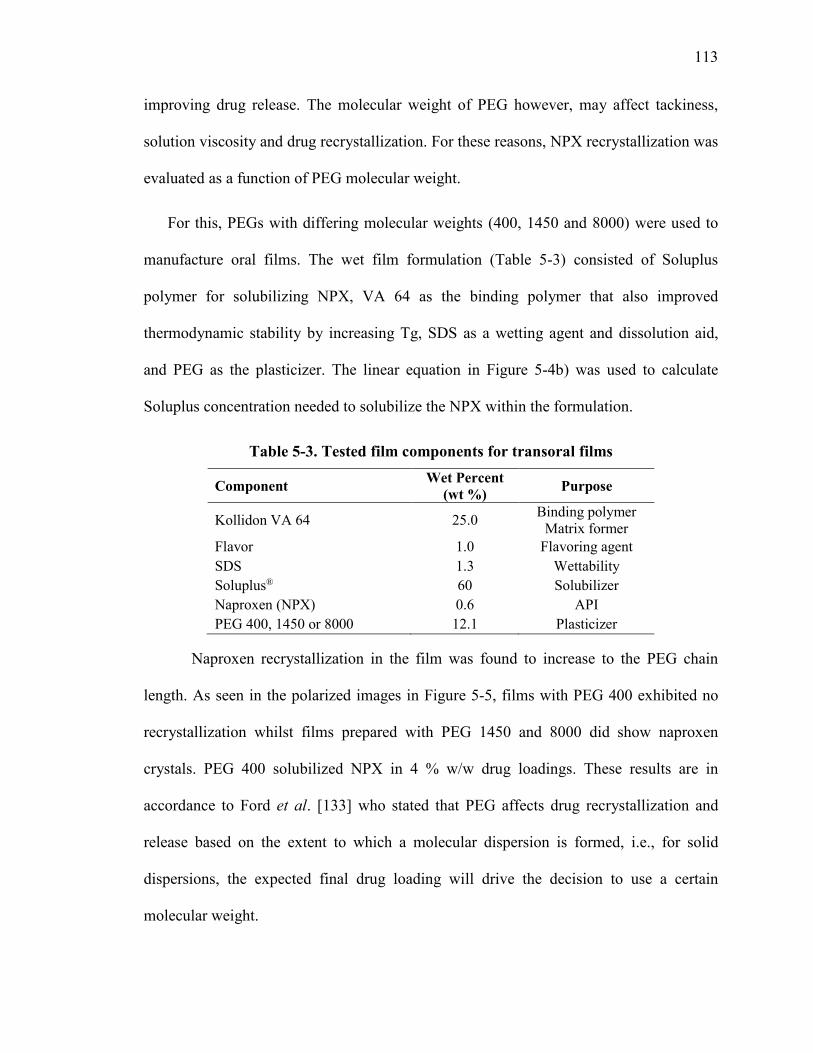
113
improving drug release. The molecular weight of PEG however, may affect tackiness,
solution viscosity and drug recrystallization. For these reasons, NPX recrystallization was
evaluated as a function of PEG molecular weight.
For this, PEGs with differing molecular weights (400, 1450 and 8000) were used to
manufacture oral films. The wet film formulation (Table 5-3) consisted of Soluplus
polymer for solubilizing NPX, VA 64 as the binding polymer that also improved
thermodynamic stability by increasing Tg, SDS as a wetting agent and dissolution aid,
and PEG as the plasticizer. The linear equation in Figure 5-4b) was used to calculate
Soluplus concentration needed to solubilize the NPX within the formulation.
Table 5-3. Tested film components for transoral films
Naproxen recrystallization in the film was found to increase to the PEG chain
length. As seen in the polarized images in Figure 5-5, films with PEG 400 exhibited no
recrystallization whilst films prepared with PEG 1450 and 8000 did show naproxen
crystals. PEG 400 solubilized NPX in 4 % w/w drug loadings. These results are in
accordance to Ford et al. [133] who stated that PEG affects drug recrystallization and
release based on the extent to which a molecular dispersion is formed, i.e., for solid
dispersions, the expected final drug loading will drive the decision to use a certain
molecular weight.
Component Wet Percent (wt %) Purpose
Kollidon VA 64 25.0 Binding polymer Matrix former
Flavor 1.0 Flavoring agent SDS 1.3 Wettability Soluplus® 60 Solubilizer Naproxen (NPX) 0.6 API PEG 400, 1450 or 8000 12.1 Plasticizer

114
Figure 5-5. Effect of PEG chain length on final film crystallinity
Drug-polymer interactions and molecular changes upon complexation of NPX with
polymers were investigated with FTIR spectroscopy. The spectra for the pure
components and one film (average spectrum of three spectra at different locations) are
shown in Figure 5-6. The attenuated total reflectance configuration of the spectrometer
gave way to intense product bands that were easily assigned. For pure polymers, in
Figure 5-7, the bands at 1733 cm-1 and 1634 cm-1 correspond to vinyl acetate and vinyl
caprolactam (VCL) monomers, respectively. The film spectrum contains strong bands in
this region due to the polymers being present in its formulation. Furthermore, the region
of 1670 to 1530 cm-1 contains many important bands that result from the molecular
complexation of amorphous NPX and Soluplus. The bands at 1634 and 1604 cm-1 in
Figure 5-8 correspond to the carbonyl of the VCL of Soluplus and the naphthalene ring of
naproxen, respectively. Upon forming an amorphous solid dispersion, Kyeremateng et al.
[126] reported that the VCL carbonyl band splits into two bands at 1634 and 1595 cm-1.
To identify these bands in the film spectrum, a Savitzky-Golay second derivative with a
second order polynomial and 15 smoothing points was calculated for all spectra.
Evidently, the maxima in the raw spectra correspond to minima in the second derivative
spectra in Figure 5-9. As expected, the band split as the VCL carbonyl in Soluplus

115
formed hydrogen bonds with the hydroxyl group of NPX. This finding further confirmed
the glassy nature (Type VI) of the oral film.
Figure 5-6. FTIR spectra of pure components and transoral film containing Soluplus, Kollidon VA 64 and PEG 400.
Figure 5-7. Monomer identification of pure polymers from FTIR spectra.
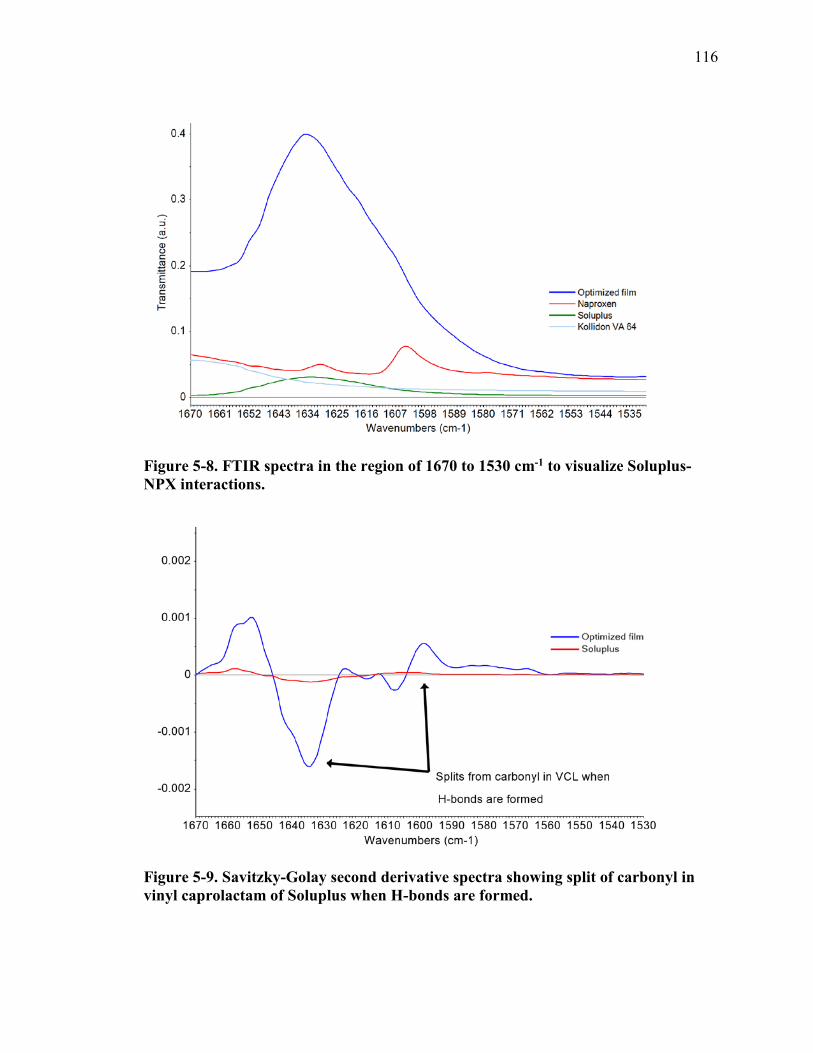
116
Figure 5-8. FTIR spectra in the region of 1670 to 1530 cm-1 to visualize Soluplus-NPX interactions.
Figure 5-9. Savitzky-Golay second derivative spectra showing split of carbonyl in vinyl caprolactam of Soluplus when H-bonds are formed.
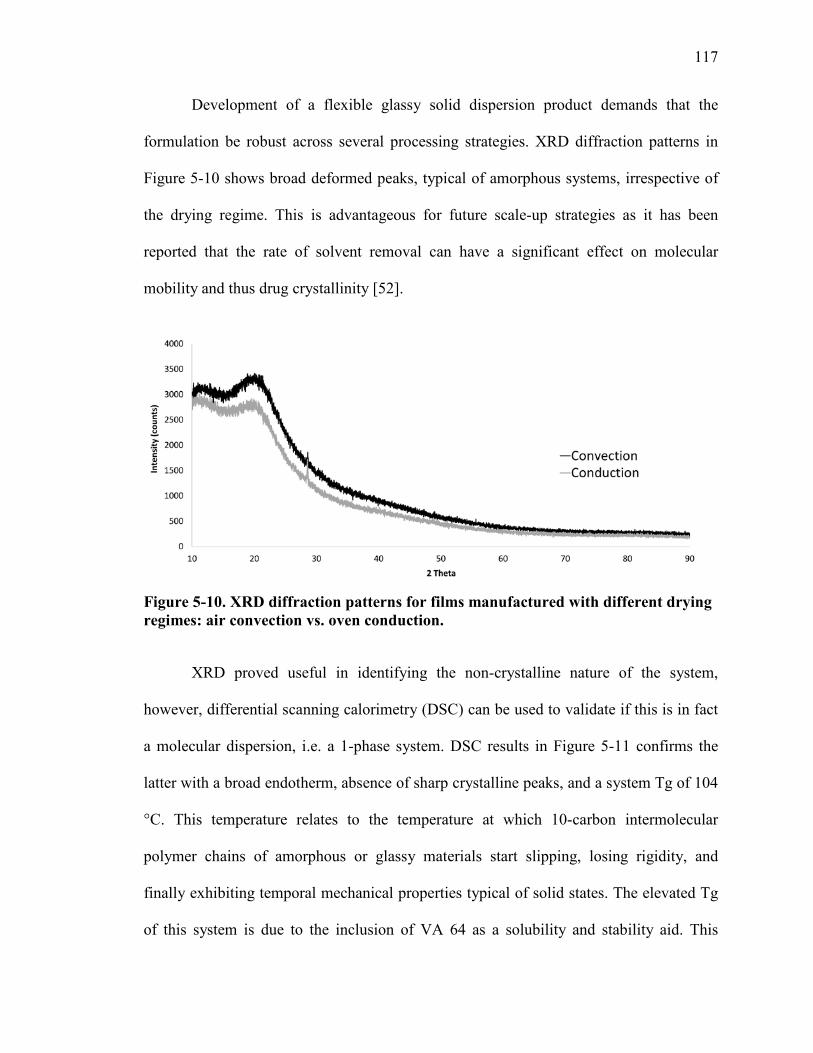
117
Development of a flexible glassy solid dispersion product demands that the
formulation be robust across several processing strategies. XRD diffraction patterns in
Figure 5-10 shows broad deformed peaks, typical of amorphous systems, irrespective of
the drying regime. This is advantageous for future scale-up strategies as it has been
reported that the rate of solvent removal can have a significant effect on molecular
mobility and thus drug crystallinity [52].
Figure 5-10. XRD diffraction patterns for films manufactured with different drying regimes: air convection vs. oven conduction.
XRD proved useful in identifying the non-crystalline nature of the system,
however, differential scanning calorimetry (DSC) can be used to validate if this is in fact
a molecular dispersion, i.e. a 1-phase system. DSC results in Figure 5-11 confirms the
latter with a broad endotherm, absence of sharp crystalline peaks, and a system Tg of 104
°C. This temperature relates to the temperature at which 10-carbon intermolecular
polymer chains of amorphous or glassy materials start slipping, losing rigidity, and
finally exhibiting temporal mechanical properties typical of solid states. The elevated Tg
of this system is due to the inclusion of VA 64 as a solubility and stability aid. This
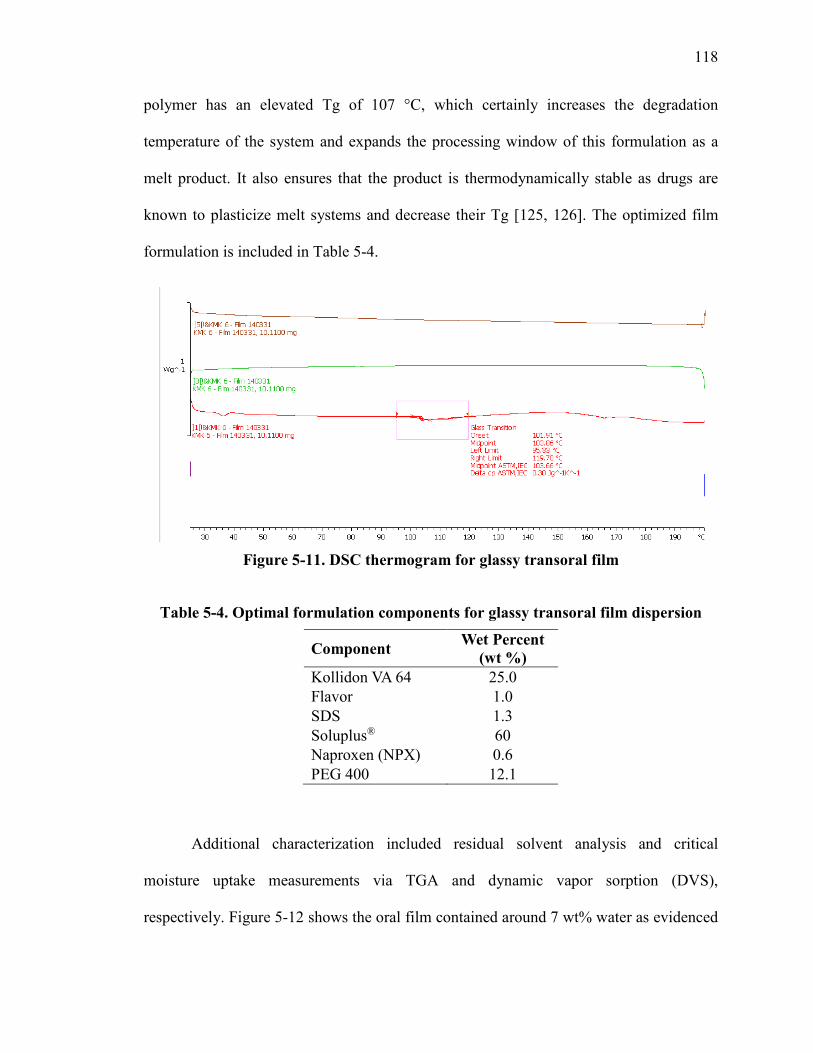
118
polymer has an elevated Tg of 107 °C, which certainly increases the degradation
temperature of the system and expands the processing window of this formulation as a
melt product. It also ensures that the product is thermodynamically stable as drugs are
known to plasticize melt systems and decrease their Tg [125, 126]. The optimized film
formulation is included in Table 5-4.
Figure 5-11. DSC thermogram for glassy transoral film
Table 5-4. Optimal formulation components for glassy transoral film dispersion
Additional characterization included residual solvent analysis and critical
moisture uptake measurements via TGA and dynamic vapor sorption (DVS),
respectively. Figure 5-12 shows the oral film contained around 7 wt% water as evidenced
Component Wet Percent (wt %)
Kollidon VA 64 25.0 Flavor 1.0 SDS 1.3 Soluplus® 60 Naproxen (NPX) 0.6 PEG 400 12.1
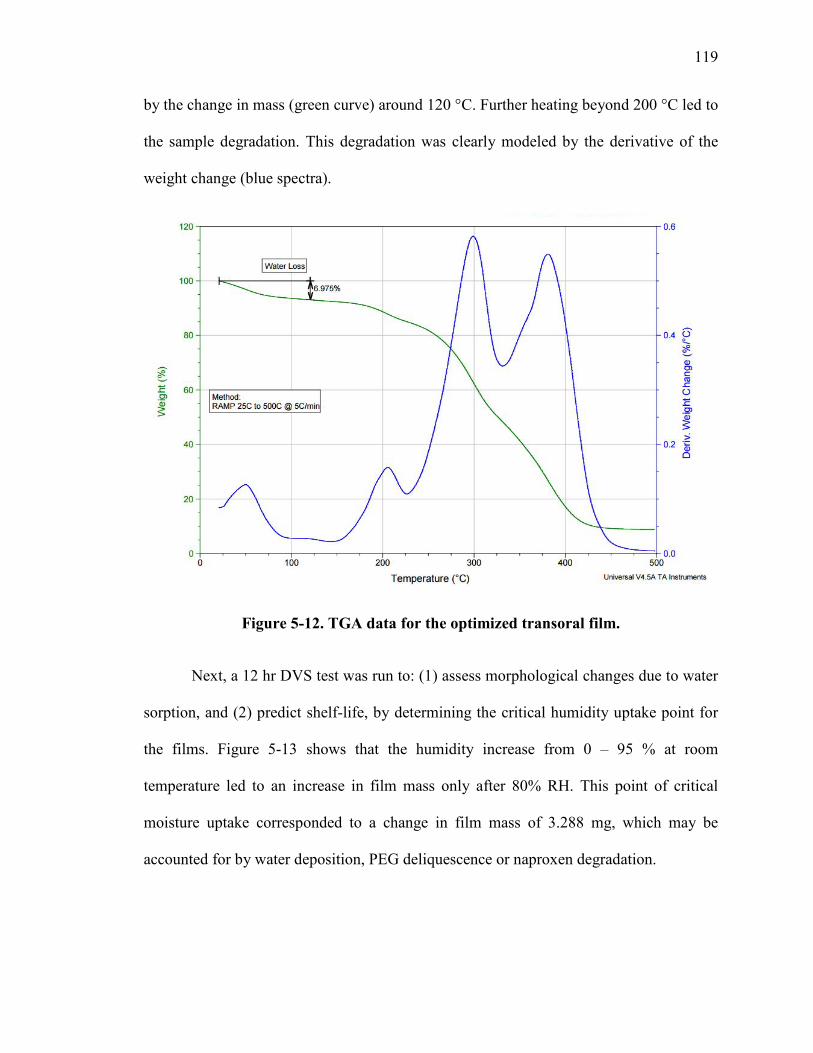
119
by the change in mass (green curve) around 120 °C. Further heating beyond 200 °C led to
the sample degradation. This degradation was clearly modeled by the derivative of the
weight change (blue spectra).
Figure 5-12. TGA data for the optimized transoral film.
Next, a 12 hr DVS test was run to: (1) assess morphological changes due to water
sorption, and (2) predict shelf-life, by determining the critical humidity uptake point for
the films. Figure 5-13 shows that the humidity increase from 0 – 95 % at room
temperature led to an increase in film mass only after 80% RH. This point of critical
moisture uptake corresponded to a change in film mass of 3.288 mg, which may be
accounted for by water deposition, PEG deliquescence or naproxen degradation.
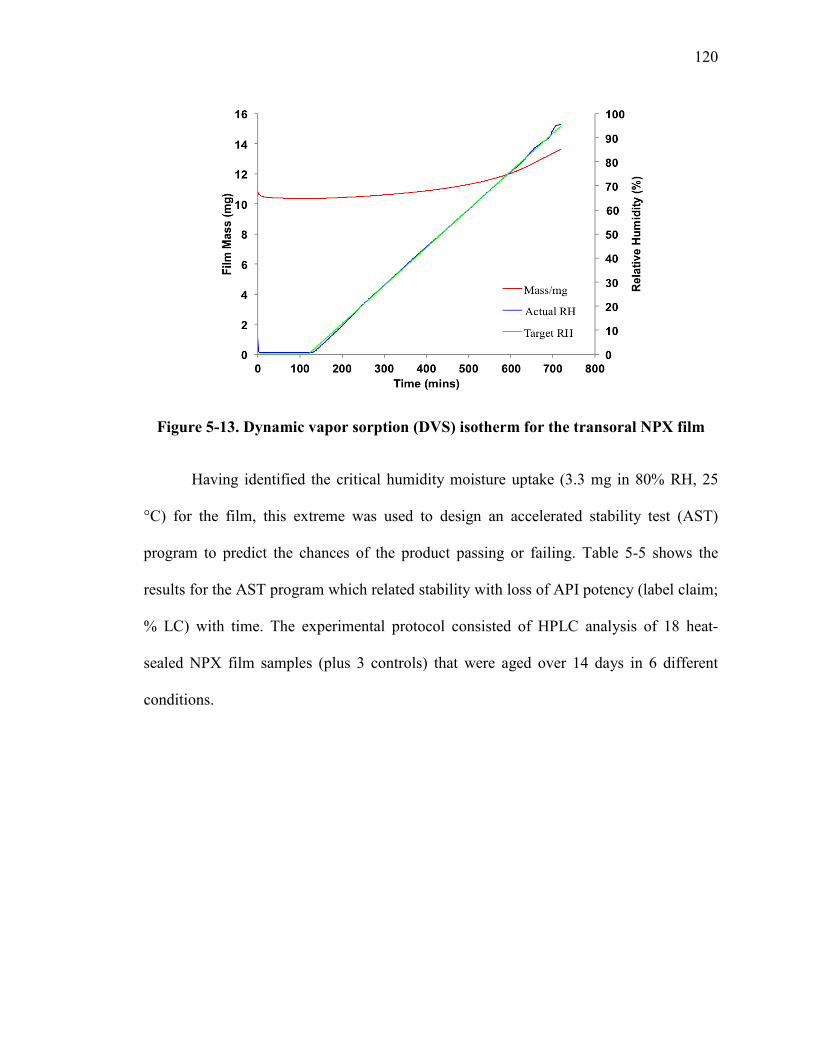
120
Figure 5-13. Dynamic vapor sorption (DVS) isotherm for the transoral NPX film
Having identified the critical humidity moisture uptake (3.3 mg in 80% RH, 25
°C) for the film, this extreme was used to design an accelerated stability test (AST)
program to predict the chances of the product passing or failing. Table 5-5 shows the
results for the AST program which related stability with loss of API potency (label claim;
% LC) with time. The experimental protocol consisted of HPLC analysis of 18 heat-
sealed NPX film samples (plus 3 controls) that were aged over 14 days in 6 different
conditions.

121
Table 5-5. HPLC analysis of control and aged samples Sample No. Salt % RH T(C) Day % LC % NPX
1 Sodium Bromide 51 50
8 100.9 0.36 2 11 114.3 0.41 3 14 100.2 0.36 4
Potassium Iodide 64 50 5 115.9 0.42
5 9 109.0 0.39 6 14 88.7 0.32 7
Sodium Nitrate 69 50 5 106.1 0.38
8 8 103.1 0.37 9 14 94.3 0.34
10 Sodium Nitrate 70 45
9 100.1 0.36 11 11 123.9 0.45 12 14 98.8 0.36 13
Sodium Chloride 74 50 4 92.6 0.33
14 8 115.6 0.42 15 14 99.8 0.36 16
Sodium Chloride 75 45 8 101.0 0.36
17 11 101.6 0.37 18 14 100.7 0.36 19
Controls 99.8 0.36
20 99.0 0.36 21 98.5 0.34
Stability results are graphed in Figure 5-14 and 5-15. The impact of time on label
claim was evaluated via one-way ANOVA and correlation analysis. ANOVA results
were p = 0.05 and thus indicated that the mean difference between the aged samples was
different from zero for all days. So label claim is changing with time, when all samples
are analyzed. This change was then further tested by correlation analysis. Following a
regression approach a model is fitted and used to describe the statistical relationship
between time and the response variable % LC, and to predict new observations. The
equation was fitted by minimizing the sum of the squared residuals. The data did not
follow a linear trend, i.e., label claim did not change proportionally with time.

122
Figure 5-14. Accelerated stability test results for aged transoral films.
% RHT(C)
757470696451504550455045504550455045
115
110
105
100
95
90
% L
C
Figure 5-15. Boxplot of % LC as a function of temperature and relative humidity.
As can be seen from the figures, the data did not follow a linear equation. For the
most part however, samples were consistently higher than expected (100 % LC). This
could be the result of an underlying variable not accounted for in the study (degradant
affecting HPLC peak shape, for example), or a systematic error with a non-zero mean.

123
One such error could be lower AUC values for HPLC standards (subpotent standards)
that give rise to lower slopes thus higher expected concentrations. This issue and/or
improper package heat seal of Film 11 could have led to recording 124 % LC for this
outlier.
A quadratic model best fitted the data but the relation between time and label claim
was not statistically significant for alphas of 0.05 or 0.10. PCA analysis of stability
results in Figure 5-16 show that the first principal component (PC) accounted for 99% of
the variation in % LC. This scatter scores plot shows the possible presence of outliers,
groups and hidden similarities in the data. Two and three standard deviations (SD) from
the mean, corresponding to 95% and 99.7% confidence intervals were also calculated.
The limits are computed from the variation of the PC as orthogonal vectors. Sample 11
was outside the two SD thresholds as it was 124 % LC. This large value may be due to an
ineffective heat seal of the package which can lead to film water sorption, or drug
degradant growth, which is not the focus of this study.
Figure 5-16. PCA analysis of accelerated stability test (AST) program results.

124
The multivariate means of the % LC of aged samples were evaluated via a
Hotelling’s T2 analysis (Figure 5-17). Sample 11 was the only one outside the critical
tolerance limit (T2Crit 95%), indicating that its distance from the origin in the PC model
plane is abnormally high compared to the other samples. In conclusion, the data suggests
that there is no correlation between film stability and time, if this sample is removed from
the analysis. A new one-way ANOVA analysis of time versus label claim for all samples
except Sample 11 confirmed this statement with a p = 0.08. A more thorough analysis of
stability should seek to examine the temperature dependence of degradant formation and
estimating shelf-life at ambient conditions. This can be accomplished by assuming that
these parameters and drug degradation follow Arrhenius kinetics [134].
Figure 5-17. Hotelling’s T2 analysis of multivariate means
NPX drug release in vitro and ex vivo was also evaluated. Dissolution studies (n =
6) in USP recommended media for naproxen, PBS pH 7.4, revealed more than 85% drug

125
release within the first 15 minutes, confirming that the product was immediate-release
(Figure 5-18).
Figure 5-18. Drug release from glassy transoral films
Ex vivo Franz diffusion results (Figure 5-18), confirmed the increase in NPX
bioavailability as drug diffused out of the film matrix, into the porcine cheek mucosa and
was detected “systemically” in less than 1 hr following product administration. The fast
onset of action of this hydrophobic acidic drug suggests that its main route for drug
diffusion is via the transcellular route which has short path lengths and is pertinent for
drugs with logP of 2-5 [74].
Moreover, in transoral products, drug flux, or the amount of drug permeating a
membrane per unit area and time, is dependent on the pH of the oral cavity and
formulation components. Buccal mucosa, although non-keratinized, is similar in structure
to other stratified epithelia in the body due to the presence of membrane coating granules

126
[74]. Many scientists thus decide to optimize oromucosal formulations by maximizing
this parameter. In Figure 5-19 the cumulative amount of permeated NPX per unit area
was plotted as a function of time. A fit in the linear portion was used to calculate the drug
flux (mg/cm2/hr) and lag time (h) from the slope and x-intercept, respectively [135].
These corresponded to 0.0665 mg/cm2/hr (or 67 μg/cm2/hr) and 29 mins. This flux is 13
times larger than reported values for oromucosal delivery of progesterone via hexosomes
[135].
y = 0.0665x - 0.0318R² = 0.999
0
0.05
0.1
0.15
0.2
0.25
0.3
0 1 2 3 4 5
Cum
ulat
ive
amou
nt o
f NPX
(mg/
cm2)
Time (hr)
Figure 5-19. Diffusion flux through buccal mucosa from optimizes transoral film.
5.5 Conclusions
In this chapter a novel transoral film formulation from glassy solid dispersions was
introduced. Systematic assessment of solubilizing and plasticizing excipients allowed the
fabrication of molecular dispersions of poorly-water soluble drug NPX. This glassy
solution is both kinetically and thermodynamically stable as it was shown that the

127
carboxyl in NPX formed H-bonds with the carbonyl component of the vinyl caprolactam
monomer of Soluplus and the vinyl acetate in Kollidon VA 64. Specifically, addition of
the latter polymer increased the glass transition temperature of the system to 104 °C,
which ensured high film stability in terms of loss of API potency over time.
The final film formulation contained polyethylene glycol (PEG) as its plasticizer.
This additive was optimized based on both its molecular size and concentration. The
larger the PEG molecule, more drug was recrystallizing from the film. On the other hand,
higher PEG concentrations decreased the glass transition temperature of the system
leading to films of poor stability.
The flexibility of the product in terms of processability was assessed. Two distinct
drying mechanisms were employed, both of which yielded positive results, i.e.
transparent films with no recrystallized naproxen and excellent sensory properties. Drug
release tests showed more than 85% drug release within 1 hr of product application and
an impressive diffusional flux across buccal mucosa 13 times larger than those reported
in literature. Finally, accelerated stability tests over 14 days at various humidity and
temperature conditions confirmed the long term stability of the films as no major
statistically significant correlation between change in label claim over time was recorded.
128
Chapter 6 A Quality-by-Design Approach to Glassy Melt
Extruded Tablets from Poor-Water Soluble Drugs
6.1 Summary
In this chapter, the flexibility of using solid dispersions for delivering poor-water
soluble APIs in a melt tablet with potential applications as an abuse deterrent formulation
is presented. The studies follow Chapter 5 where an optimal glassy solution for oral films
was formulated. Furthermore, in these studies, that base formulation was improved upon
in terms of drug loading by changing the processing methodology from solvent casting to
hot melt extrusion (HME).
A systematic approach to QbD is followed wherein both quality target product
profiles (QTTP) and CQAs were defined, a qualitative risk assessment listed the factors
affecting product performance, the impact of these factors was quantified via methodical
experimentation following DOE, and a process performance evaluation helped delineate
the viable processing window for this formulation. The novelty of the work lies in the
systematic approach undertaken to study the factors affecting glassy melt tablets, and the
novelty of the excipients, the latter being the first time these are used for molecularly
dispersed drug within glassy tablets that show potential for abuse deterrent strategies.
6.2 Introduction
Since the early 2000s both the International Conference on Harmonization (ICH)
and the FDA have made public statements supporting the use of Quality-by-Design

129
(QbD) for enhancing product quality and especially for abbreviated new drug
applications (ANDAs) and PAT [27, 28]. As presented in Figure 6-1 the QbD concept
revolves around four major stages: (1) defining quality target product profiles (QTPP)
and CQAs, (2) risk assessments (RA), (3) DoE-based screening to delineate a design
space, and (4) establishing a control strategy and continuous process/product
improvement.
Figure 6-1. Stages of the Quality-by-Design (QbD) approach
These stages define the accepted systematic approach towards implementing QbD
when formulating products (for example, orodispersible tablets [136]), designing
pharmaceutical processes [137] and analyzing output from varying analytical methods
such as dissolution [138]. HME products are no exception. QbD approaches towards
developing extruded granules have been previously reported.
Patwardhan et al. [139] published a comprehensive QbD assessment toward
developing IBU melt granules. Based on Ishikawa approaches and comprehensive Failure
130
Modes and Effects Analysis (FMEAs), the authors identified factors that affected the
QTTPs of the product and then studied these via DOE strategies. The measured responses
on their design were torque, glass transition, dissolution (for an immediate release
formulation) and phase change. These were then combined in a risk failure design space
that described the domain of the experimental variables that gave way to product within
95% specification limits.
Another example includes the work done by Brncic et al. [140] in investigating the
effect of screw speed, feed moisture, feed rate and die temperature on the mechanical
hardness of starch-based cereal extrudates. The authors found that feed rate did not have
a significant effect on hardness, but feed moisture content, screw speed and temperature
did.
The use of QbD towards evaluating melt extrusion products for both the
pharmaceutical and food industry has been documented. In this chapter their use in
evaluating glassy solid dispersions is presented. Specifically, a novel approach towards
design and process performance assessment of HME for manufacturing melt tablets that
show potential for limiting drug tampering are presented.
Abuse-deterrent formulations (ADFs) have gained significant interest in the last
few years due to the prevalence of opioid abuse and their increased prescriptions. In
response, the FDA has urged manufacturers of products with high abuse potential to
develop risk-mitigation strategies, add black box warnings to labels, and further enable
technologies that limit expected or known routes of abuse. However, even with all these
warnings and technologies in place, drug abuse is still rampage. Currently, manufacturers
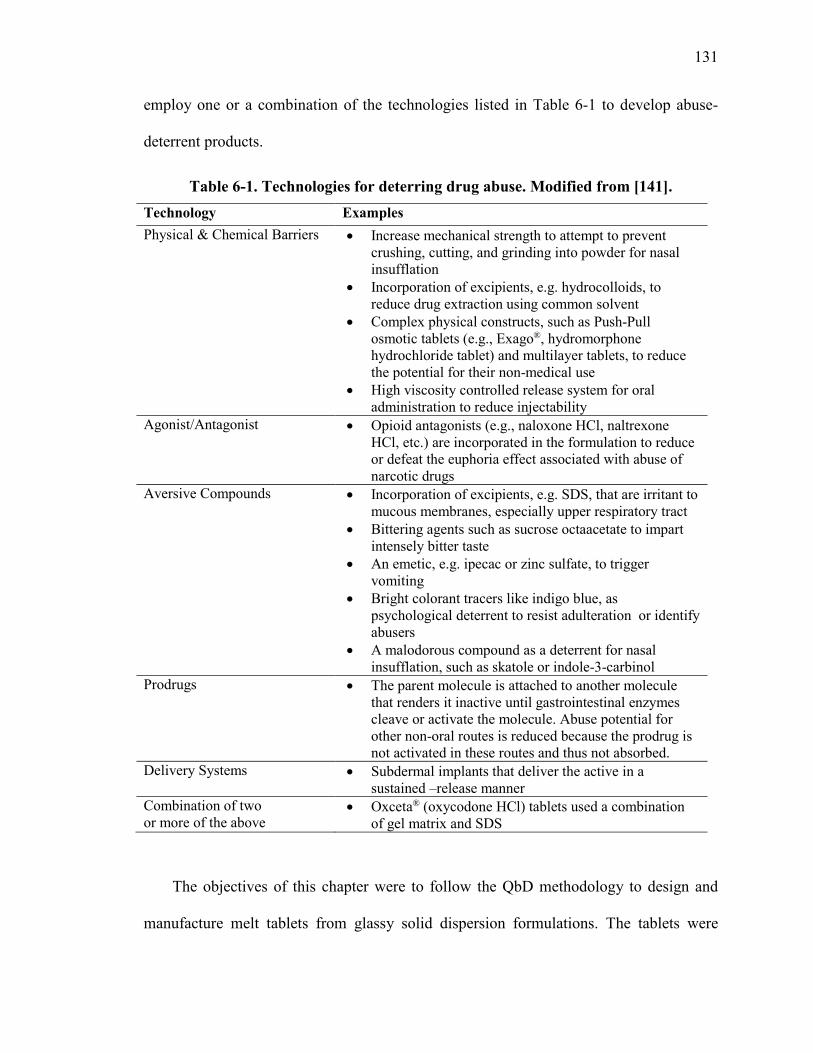
131
employ one or a combination of the technologies listed in Table 6-1 to develop abuse-
deterrent products.
Table 6-1. Technologies for deterring drug abuse. Modified from [141]. Technology Examples Physical & Chemical Barriers • Increase mechanical strength to attempt to prevent
crushing, cutting, and grinding into powder for nasal insufflation
• Incorporation of excipients, e.g. hydrocolloids, to reduce drug extraction using common solvent
• Complex physical constructs, such as Push-Pull osmotic tablets (e.g., Exago®, hydromorphone hydrochloride tablet) and multilayer tablets, to reduce the potential for their non-medical use
• High viscosity controlled release system for oral administration to reduce injectability
Agonist/Antagonist • Opioid antagonists (e.g., naloxone HCl, naltrexone HCl, etc.) are incorporated in the formulation to reduce or defeat the euphoria effect associated with abuse of narcotic drugs
Aversive Compounds • Incorporation of excipients, e.g. SDS, that are irritant to mucous membranes, especially upper respiratory tract
• Bittering agents such as sucrose octaacetate to impart intensely bitter taste
• An emetic, e.g. ipecac or zinc sulfate, to trigger vomiting
• Bright colorant tracers like indigo blue, as psychological deterrent to resist adulteration or identify abusers
• A malodorous compound as a deterrent for nasal insufflation, such as skatole or indole-3-carbinol
Prodrugs • The parent molecule is attached to another molecule that renders it inactive until gastrointestinal enzymes cleave or activate the molecule. Abuse potential for other non-oral routes is reduced because the prodrug is not activated in these routes and thus not absorbed.
Delivery Systems • Subdermal implants that deliver the active in a sustained –release manner
Combination of two or more of the above
• Oxceta® (oxycodone HCl) tablets used a combination of gel matrix and SDS
The objectives of this chapter were to follow the QbD methodology to design and
manufacture melt tablets from glassy solid dispersion formulations. The tablets were

132
designed to completely solubilize poor water-soluble drugs, be un-chewable, difficult to
cut, grind and extract the drug with common aqueous solvents, and have extended
dissolution profiles where t80 ~ 12 hrs as recommended in the FDA Guidance for Abuse-
Deterrent Opioids [142]. The mechanisms employed to potentially deter abuse included
physical-chemical barriers and aversion.
Since the studies within this dissertation aim to demonstrate the flexibility of solid
dispersions to deliver poorly-water soluble drugs, the optimized glassy film formulation
in Chapter 5 was repurposed and processed via HME methods. As stated and evaluated in
that chapter, differing processing technologies did not affect the amorphous nature of the
product. Even more, it was designed to have a moderate glass transition temperature (Tg)
of 100-150 °C with inclusion of Kollidon VA 64 so it was adequate for melt extrusion
whilst ensuring product stability at room temperature. Preliminary studies suggesting that
Soluplus® retarded API dissolution and extraction when processed via HME were taken
into account and validated in this study. These polymer traits and inclusion of SDS, an
irritant to mucous membranes, served as the mechanisms by which the product could
hypothetically deter abuse.
The effect of formulation and process parameters on the aforementioned physical-
chemical barriers and their relation to torque, glass transition, specific mechanical energy
consumption (SMEC), Young’s modulus, hardness, dissolution, and stability were
quantified via DOE strategies. Finally, a process design space that included actual
limitations to optimization was defined.
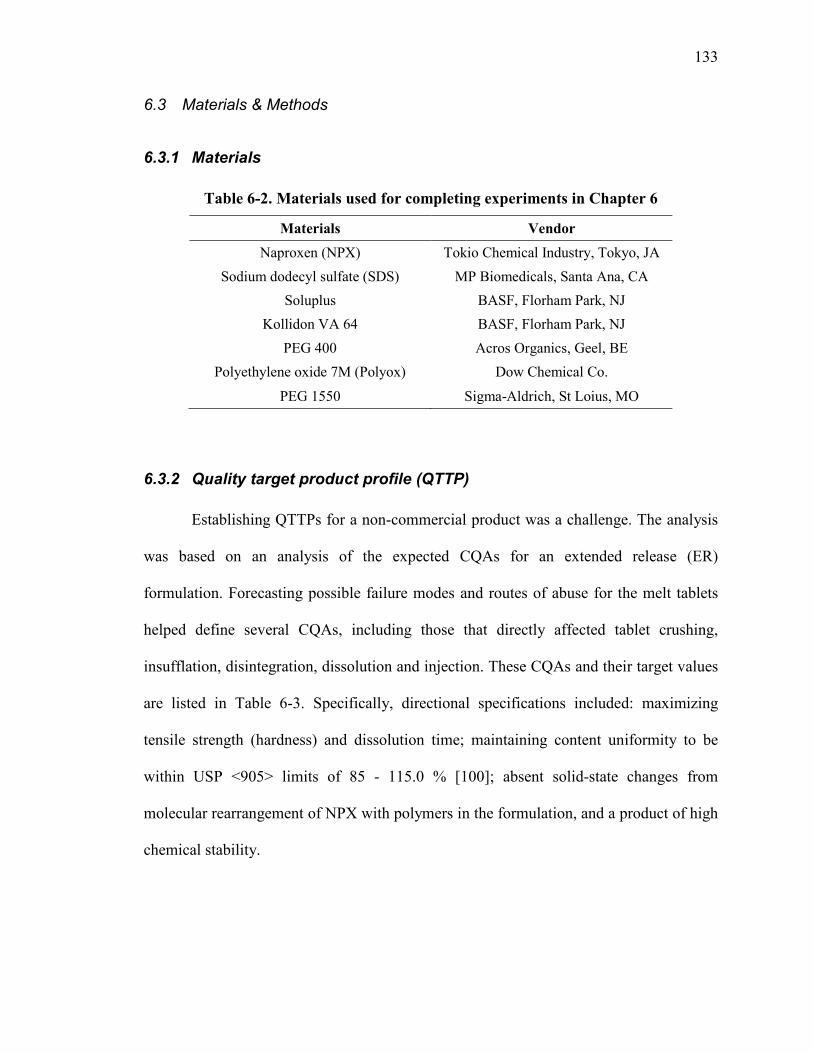
133
6.3 Materials & Methods
6.3.1 Materials
Table 6-2. Materials used for completing experiments in Chapter 6
Materials Vendor Naproxen (NPX) Tokio Chemical Industry, Tokyo, JA
Sodium dodecyl sulfate (SDS) MP Biomedicals, Santa Ana, CA Soluplus BASF, Florham Park, NJ
Kollidon VA 64 BASF, Florham Park, NJ PEG 400 Acros Organics, Geel, BE
Polyethylene oxide 7M (Polyox) Dow Chemical Co.
PEG 1550 Sigma-Aldrich, St Loius, MO
6.3.2 Quality target product profile (QTTP)
Establishing QTTPs for a non-commercial product was a challenge. The analysis
was based on an analysis of the expected CQAs for an extended release (ER)
formulation. Forecasting possible failure modes and routes of abuse for the melt tablets
helped define several CQAs, including those that directly affected tablet crushing,
insufflation, disintegration, dissolution and injection. These CQAs and their target values
are listed in Table 6-3. Specifically, directional specifications included: maximizing
tensile strength (hardness) and dissolution time; maintaining content uniformity to be
within USP <905> limits of 85 - 115.0 % [100]; absent solid-state changes from
molecular rearrangement of NPX with polymers in the formulation, and a product of high
chemical stability.

134
Table 6-3. CQAs of an extended release abuse-deterrent melt tablet.
Product Attribute Target
Tensile Strength Maximize
Content Uniformity 85.0% -115.0%
Time for 80% dissolution (t80)
≥ 12 hrs
Solid Arrangement Amorphous
Stability in 40°C, 75% RH No phase change
6.3.3 Qualitative risk assessment (RA)
Published Ishikawa diagrams for extended IBU melt granules described by
Patwardhan et al [139] were analyzed so as to list the possible factors that affected
abuse-deterrent melt products. Based on the diagram, the authors listed all the processing
steps from blending to extrusion, and the included factors for each. A Failure Modes and
Effects Analysis (FMEA) was then conducted to calculate risk priority numbers for these
factors based on the product of severity, occurrence and detectability values.
Those factors that had high risk priority numbers for melt products were chosen to be
further studied in this chapter. These included drug loading, barrel temperature, screw
temperature, and feeding rate.
6.3.4 Experimental Design
Design variables were selected based on the developed risk assessment and
published FMEAs failure effects with high risk priority numbers [139]. As mentioned in
the previous section, the variables included formulation and process parameters. These
were identified as: 10-30 wt% drug loading, 15 – 35 rpm feeder screw speed, 100-200
rpm extrusion screw speed, and 125-175 °C barrel temperature. The design, pictured in

135
Figure 6-2, was a two level half fractional factorial for 4 variables (24-1) with 3 replicated
center points to estimate curvature and maximize power. The design required 11
experimental runs to estimate main and second order effects. Uncommon third order
effects were confounded with main effects to give a design of resolution IV.
322416
30
25
20
15
10
200150100
30
25
20
15
10
160140120
30
25
20
15
10
200150100
35
30
25
20
15
160140120
35
30
25
20
15
160140120
200
175
150
125
100
Drug loading (%)*Feeder speed (rpm) Drug loading (%)*Screw Speed (rpm) Drug loading (%)*Barrel Temp (°C)
Feeder speed (rpm)*Screw Speed (rpm) Feeder speed (rpm)*Barrel Temp (°C) Screw Speed (rpm)*Barrel Temp (°C)
Figure 6-2. Experimental design for examining effect of formulation and process variables on an ADF
6.3.4.1 Powder blends
The formulation for this study (Table 6-4) was based on the optimized glassy film
formulation presented in Chapter 5. This further validates the flexibility of solid
dispersion formulations for enabling delivery of poor water-soluble drugs in a variety of
products, including ADFs.
Materials were weighed and transferred to a 6-qt. metal bowl of a Kitchen Aid
mixer. The metal whisk attachment was used to paddle mix for 30 sec at medium 2-
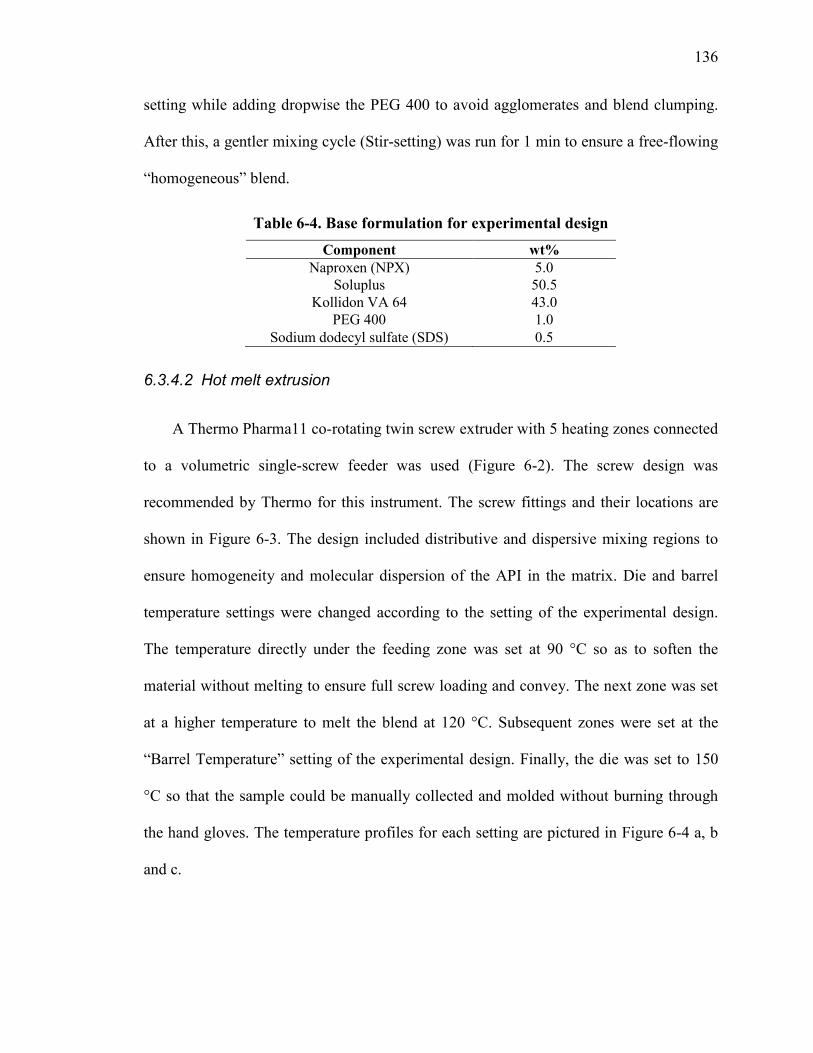
136
setting while adding dropwise the PEG 400 to avoid agglomerates and blend clumping.
After this, a gentler mixing cycle (Stir-setting) was run for 1 min to ensure a free-flowing
“homogeneous” blend.
Table 6-4. Base formulation for experimental design Component wt%
Naproxen (NPX) 5.0 Soluplus 50.5
Kollidon VA 64 43.0 PEG 400 1.0
Sodium dodecyl sulfate (SDS) 0.5
6.3.4.2 Hot melt extrusion
A Thermo Pharma11 co-rotating twin screw extruder with 5 heating zones connected
to a volumetric single-screw feeder was used (Figure 6-2). The screw design was
recommended by Thermo for this instrument. The screw fittings and their locations are
shown in Figure 6-3. The design included distributive and dispersive mixing regions to
ensure homogeneity and molecular dispersion of the API in the matrix. Die and barrel
temperature settings were changed according to the setting of the experimental design.
The temperature directly under the feeding zone was set at 90 °C so as to soften the
material without melting to ensure full screw loading and convey. The next zone was set
at a higher temperature to melt the blend at 120 °C. Subsequent zones were set at the
“Barrel Temperature” setting of the experimental design. Finally, the die was set to 150
°C so that the sample could be manually collected and molded without burning through
the hand gloves. The temperature profiles for each setting are pictured in Figure 6-4 a, b
and c.
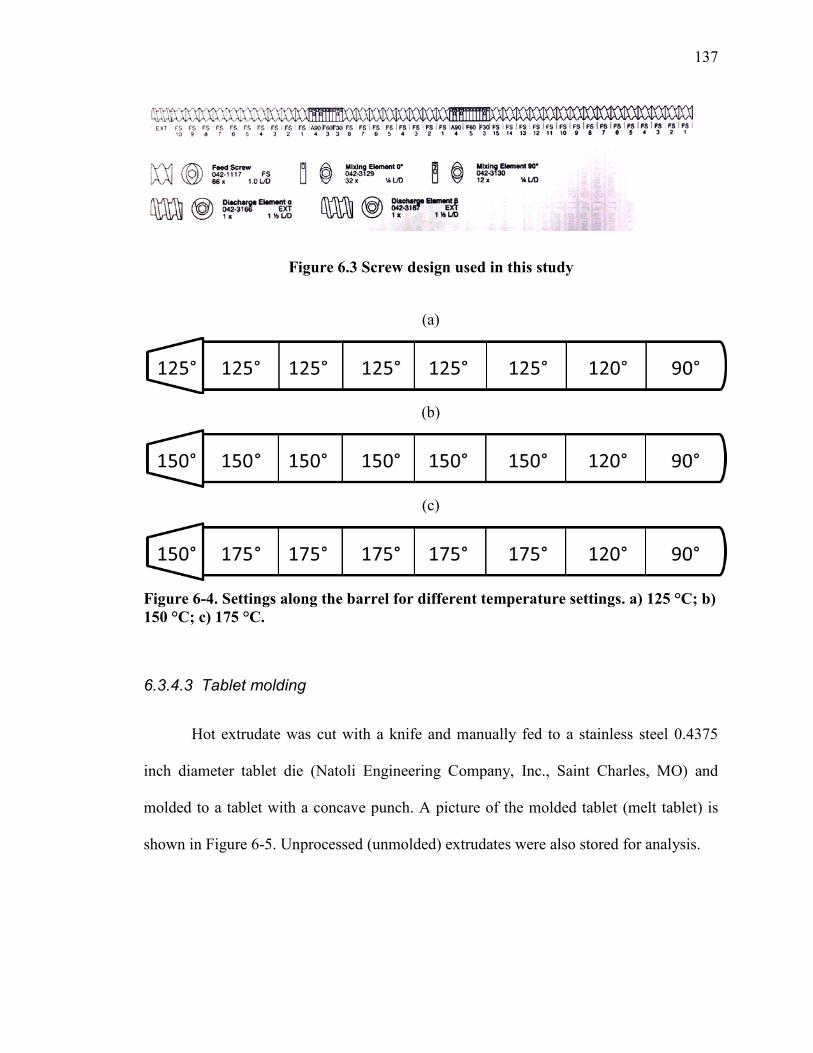
137
Figure 6.3 Screw design used in this study
(a)
(b)
(c)
Figure 6-4. Settings along the barrel for different temperature settings. a) 125 °C; b) 150 °C; c) 175 °C.
6.3.4.3 Tablet molding
Hot extrudate was cut with a knife and manually fed to a stainless steel 0.4375
inch diameter tablet die (Natoli Engineering Company, Inc., Saint Charles, MO) and
molded to a tablet with a concave punch. A picture of the molded tablet (melt tablet) is
shown in Figure 6-5. Unprocessed (unmolded) extrudates were also stored for analysis.

138
Figure 6-5. Molded tablets from glassy melt extrudate
6.3.4.4 Tablet volume
Tablet volume V was estimated as that of a cylinder (c) plus a hemisphere (h),
with radius r and h height (Equation 6-1). Volume estimates were verified following the
Archimedes Principle using vegetable oil (Wesson 100% Natural Canola Oil) as a non-
wetting fluid. Specifically, oil volume in a 10±0.1 ml graduated cylinder was initially
recorded. A tablet was dropped into the fluid and the displaced volume was calculated.
This “true” volume was compared against estimates of Equation 6-1.
Volume of cylinder
Volume of hemisphere
Volume of tablet
Volume of tablet (Equation 6-1)
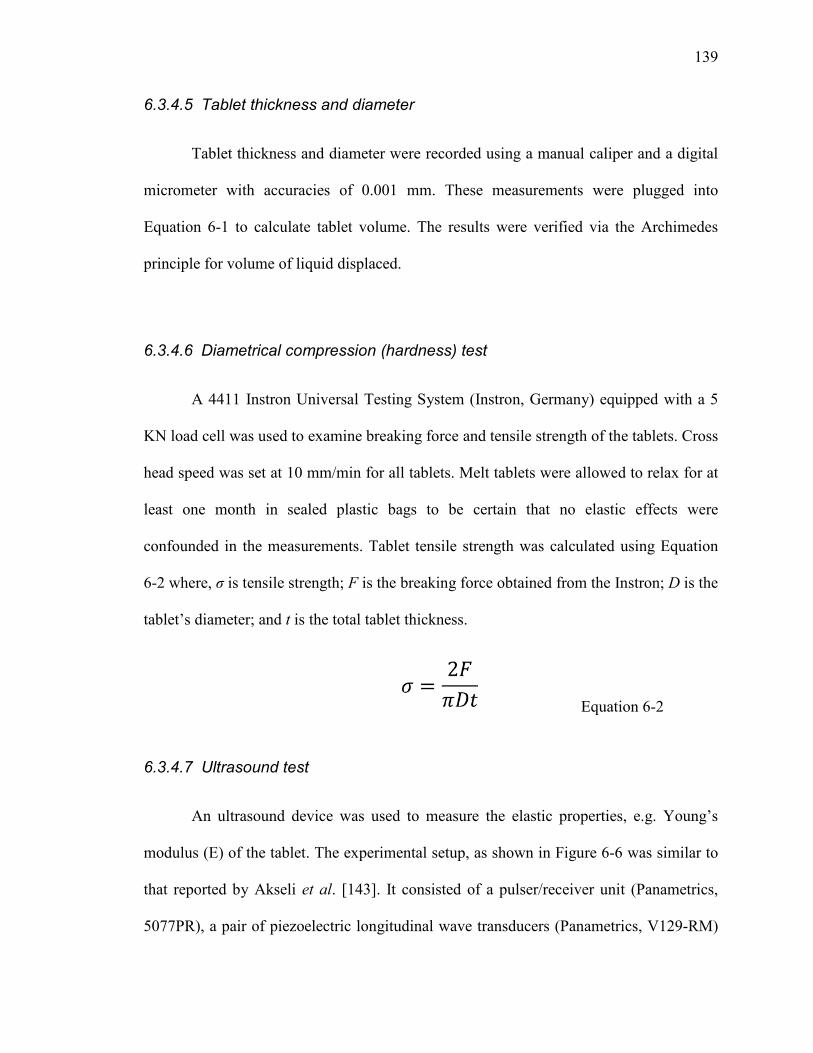
139
6.3.4.5 Tablet thickness and diameter
Tablet thickness and diameter were recorded using a manual caliper and a digital
micrometer with accuracies of 0.001 mm. These measurements were plugged into
Equation 6-1 to calculate tablet volume. The results were verified via the Archimedes
principle for volume of liquid displaced.
6.3.4.6 Diametrical compression (hardness) test
A 4411 Instron Universal Testing System (Instron, Germany) equipped with a 5
KN load cell was used to examine breaking force and tensile strength of the tablets. Cross
head speed was set at 10 mm/min for all tablets. Melt tablets were allowed to relax for at
least one month in sealed plastic bags to be certain that no elastic effects were
confounded in the measurements. Tablet tensile strength was calculated using Equation
6-2 where, σ is tensile strength; F is the breaking force obtained from the Instron; D is the
tablet’s diameter; and t is the total tablet thickness.
Equation 6-2
6.3.4.7 Ultrasound test
An ultrasound device was used to measure the elastic properties, e.g. Young’s
modulus (E) of the tablet. The experimental setup, as shown in Figure 6-6 was similar to
that reported by Akseli et al. [143]. It consisted of a pulser/receiver unit (Panametrics,
5077PR), a pair of piezoelectric longitudinal wave transducers (Panametrics, V129-RM)

140
with a central frequency and a diameter of 10 MHz and 3 mm, respectively, a pair of
piezoelectric longitudinal wave transducers (Panametrics, V111-RM) with a central
frequency and a diameter of 10 MHz and 13 mm, respectively, a digitizing oscilloscope
(Tektronix TDS3052), and a computer for data acquisition.
Figure 6-6. Ultrasound setup in pitch-catch mode for evaluating TOF through melt tablets. Image modified from [143].
6.3.4.8 Differential Scanning Calorimetry (DSC)
A TGA/DSC1/SF Stare system (Mettler Toledo, Inc., Columbus, OH) was used to
analyze the extrudates. Samples were cut and crimped hermetically in aluminum pans
fitted with lids and then examined from 25 oC to 220 oC in nitrogen atmosphere at a
constant heating rate of 10 oC/min. Samples were run in triplicate unless stated otherwise.
6.3.4.9 X-Ray Diffraction (XRD)
A Panalytical X'Pert system was used with a Cu x-ray source at 45 kV and 40 mA
over a continuous scan range of 10° to 90° 2θ; at a virtual step size of 0.0131° and
141
counting time of 78.795 seconds. In the incident beam path, an anti-scatter slit of 1° and
divergent slit of 1/2° were used. The diffracted beam path had an anti-scatter slit of 9.1
mm. Melt tablets were rotated at a speed of 4 seconds per rotation in order to analyze a
larger region of the sample.
6.3.4.10 Dissolution testing
Dissolution was carried out in a fully automated Varian VK 7010 Dissolution
Apparatus (Agilent Technologies, Santa Clara, CA) in both USP I (basket) and USP II
(paddle) configurations. Six pre-weighed tablets or extrudates were added to round-
bottom glass vessels containing 900 ml of media at 37±0.5 °C. For tablets, paddle
rotation speed was set at 50 rpm, while for extrudates, basket rotation was 100 rpm. A
peristaltic pump extracted 1 ml samples after filtering these with 35 μm cannula full flow
filters. Samples were deposited onto glass vials of 2 ml capacity and analyzed via HPLC
following the protocol for NPX in Appendix II.
Dissolution curves were fitted kinetic models with the use of the DDSolver Add-In to
MS Excel [144]. This macro add-in fits dissolution models using a non-linear least-
squares approach that minimizes the weighed sum of squares between observed and
predicted values. The statistical criteria for evaluating goodness of fit were the adjusted
coefficient of determination (R2_adj), Akaike Information Criterion (AIC) [145] and
Model Selection Criterion (MSC) as suggested elsewhere [144, 146].
6.3.4.11 Statistical analysis
The significance of the variation in the measured responses as accounted for by the

142
measured effects (drug concentration, barrel temperature, screw speed and feeding rate)
was estimated via analysis of variance (ANOVA). The Omega-squared Index [65, 66]
was also computed to compare the magnitude of the effects and their interactions,
independent of sample size. First and second-order models were fitted to the data so as to
model the effect of process and formulation variables on the critical quality attributes of
the melt tablets. These analyses were completed with the use of Minitab® (Minitab Inc.,
State College, PA), Statgraphics Centurion XVI.2 (Statpoint Technologies Inc.,
Warrenton, VA) and Matlab (The MathWorks Inc., Natick, MA) softwares.
6.4 Results
The qualitative risk analysis included evaluating a Fishbone diagram that listed the
parameters affecting melt products. Those parameters that had a high risk factor in
Patwardhan et al [139] FMEA’s were selected for further study. His diagram is presented
in Figure 6-7.
Figure 6-7. Qualitative risk assessment for melt productsbased on solid dispersions

143
The experimental HME runs were performed according to the design. Torque and
power effects were recorded when the material was flowing continuously from the feeder
to the extruder, the screws were full and molten extrudate was being ejected continuously
from the die. Initial recordings are shown in Table 6-5. An erratic feeder flow that led to
channeling was experienced when processing the 30% NPX blend. Small taps on the
feeder dislodged the cohesive material from the hopper walls.
Table 6-5. Design variables and initial recordings
Run No. Drug Loading (%)
Feeder Speed (rpm)
Screw Speed (rpm)
Barrel Temp (°C)
Torque (Nm)
Power (kW)
1 10 15 100 125 6.3 0.06 2 10 35 200 125 6.7 0.14 3 30 35 100 125 2.2 0.03 4 30 15 200 125 2.6 0.05 5 20 25 150 150 1.9 0.03 6 10 15 200 175 2.0 0.04 7 10 35 100 175 3.1 0.03 8 30 15 100 175 0.7 0.00 9 30 35 200 175 0.6 0.01 10 20 25 150 150 2.1 0.03 11 20 25 150 150 2.1 0.03
Ultrasonics was used as a non-destructive method to record time-of-flight (TOF)
for the pressure acoustic wave, i.e., sound wave, across all tablets. Longitudinal phase
velocity was then computed by dividing the tablets’ height with the TOF. The phase
velocity is a function of the tablet height and mass density of the propagation medium
[143], so the tablet’s volume and density was calculated. With these measurements, the
tablet’s elastic properties (Young’s modulus, E) were obtained. Figure 6-8 shows a Box
plot with the mean and distribution of the tablets according to the settings of the
variables. One-way ANOVA tests were computed to determine whether the experimental

144
run means for the Young’s Modulus - taking into account all tablets, differed
significantly.
Drug loading (%)Screw Speed (rpm)
302010200150100200150100200150100
9
8
7
6
5
Yo
un
gs
Mo
du
lus
(GP
a)
Figure 6-8. Young modulus as a function of process and formulation parameters
As shown in Table 6-6 the only effect which significantly affected the means, for
an alpha of 0.05, was drug concentration. Young’s modulus is the ratio of the stress along
an axis to the strain. In non-porous materials, this variable is intrinsically related to
formulation components because of its dependence on density. Both extrudates and
molded tablets had negligible porosity. As such, NPX drug which also aids as an internal
plasticizer in the formulation [120, 127], was expected to affect the strength of the melt
tablets more so than process variables. It is interesting to note in this case, that ultrasound
as a PAT tool for non-porous melt tablets did not provide sufficient discriminatory
power.

145
Table 6-6. One-way ANOVA analyses for Young’s Modulus
Effect in DOE Young’s Modulus (GPa) Drug Concentration p = 0.028 Feeder Speed p = 0.898 Screw Speed p = 0.604 Barrel Temperature p = 0.937
Next, tablet breaking force (n =3 ) was evaluated. The box plot in figure 6-9 shows
an increase in breaking force proportional to drug loading. Although this increase was not
significant at a 95% confidence level (p = 0.06) it is significant at above 90% confidence.
Furthermore, one of the goal of the chapter was to formulate melt tablets that showed a
potential for deterring drug abuse. In this case, its worth noting that the human bite force
has been recorded at 50 to 300 N [147]. These non-optimized melt tablets have a
breaking force of 300 to 1070 N. So the formulation has deterring potential as a non-
chewable tablet.
302010
1100
1000
900
800
700
600
500
400
300
200
Drug loading (%)
Bre
akin
g Fo
rce
(N)
Figure 6-9. Breaking force of melt tablets

146
Next, tablet and extrudate dissolution was evaluated. Extrudates from Run 5 (center
point) with 20% NPX loading were used to evaluate maximum drug extraction in various
solvents after 72 hrs of magnetic stirring at room temperature. Extrudates were used
instead of tablets because these were expected to allow higher drug diffusion since these
were not molded into compact polymer masses that slowly swelled and eroded. Table 6-7
and Figure 6-10 demonstrate that there was very little API extraction from the extrudates
in most common dissolution solvents.
Figure 6-10. Drug extraction in common aqueous solvents
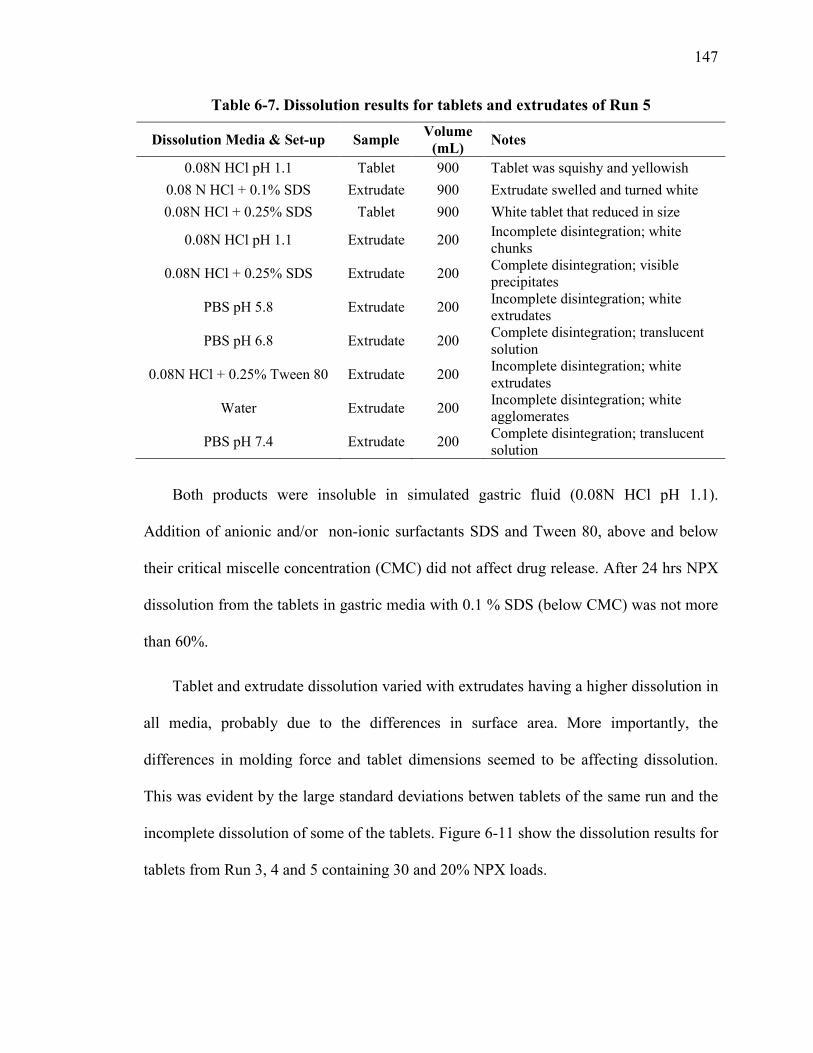
147
Table 6-7. Dissolution results for tablets and extrudates of Run 5
Dissolution Media & Set-up Sample Volume (mL) Notes
0.08N HCl pH 1.1 Tablet 900 Tablet was squishy and yellowish 0.08 N HCl + 0.1% SDS Extrudate 900 Extrudate swelled and turned white 0.08N HCl + 0.25% SDS Tablet 900 White tablet that reduced in size
0.08N HCl pH 1.1 Extrudate 200 Incomplete disintegration; white chunks
0.08N HCl + 0.25% SDS Extrudate 200 Complete disintegration; visible precipitates
PBS pH 5.8 Extrudate 200 Incomplete disintegration; white extrudates
PBS pH 6.8 Extrudate 200 Complete disintegration; translucent solution
0.08N HCl + 0.25% Tween 80 Extrudate 200 Incomplete disintegration; white extrudates
Water Extrudate 200 Incomplete disintegration; white agglomerates
PBS pH 7.4 Extrudate 200 Complete disintegration; translucent solution
Both products were insoluble in simulated gastric fluid (0.08N HCl pH 1.1).
Addition of anionic and/or non-ionic surfactants SDS and Tween 80, above and below
their critical miscelle concentration (CMC) did not affect drug release. After 24 hrs NPX
dissolution from the tablets in gastric media with 0.1 % SDS (below CMC) was not more
than 60%.
Tablet and extrudate dissolution varied with extrudates having a higher dissolution in
all media, probably due to the differences in surface area. More importantly, the
differences in molding force and tablet dimensions seemed to be affecting dissolution.
This was evident by the large standard deviations betwen tablets of the same run and the
incomplete dissolution of some of the tablets. Figure 6-11 show the dissolution results for
tablets from Run 3, 4 and 5 containing 30 and 20% NPX loads.

148
Figure 6-11. Dissolution for molded tablets in 900 ml of PBS pH 6.8 at 50 rpm
In comparison to the tablets, extrudate dissolution was more controlled and
predictable as seen in Figure 6-12. Based on these profiles, Run 1 had the highest
dissolution while Runs 2 and 5 were the lowest. The drug release data and content
uniformity results are included in Table 6-8. Further explanation as to the effect of
process parameters is provided later on in the section.
Since molding force was not a factor accounted for in the design, tablet dissolution
for all runs was not modeled; instead, extrudate was. Extrudate dissolution, although
faster, is expected to follow the same trend when corrected for surface area because it
was constructed from the same molten material, i.e., the formulation was same and the
material matched in specific energy consumption so there should not be a difference in
release mechanism, and there was ample time to allow elastic recovery of both products
before the test.

149
Figure 6-12. Extrudate dissolution profiles for all runs
Table 6-8. Drug release data for extrudates in PBS pH 6.8
Time (hr) \ Run No. 1 2 3 4 5 6 7 8 9 10 11
0 0 0 0 0 0 0 0 0 0 0 0 1 30 11 23 26 11 24 21 16 22 17 13 2 46 18 35 35 18 37 33 28 36 30 24 3 59 24 46 41 26 48 44 40 49 43 35 4 71 31 54 54 33 58 53 51 60 55 45 5 80 38 62 62 39 68 61 60 69 65 54 7 92 51 74 78 52 84 75 77 84 80 70 9 97 63 83 85 63 93 86 90 92 92 82
12 98 78 91 94 77 98 96 99 98 96 94 15 98 90 95 97 87 100 98 100 100 97 98 18 99 98 99 100 91 100 99 100 100 97 99
% NPX (EXPECTED) 10 10 30 30 20 10 10 30 30 20 20
% NPX (MEASURED - CU) 11.2 9.9 28.7 31.4 21.7 10.2 10.4 29.6 30.2 21.7 21.9
stdev 0.4 0.7 2.5 0.9 0.8 0.1 0.1 2.2 0.4 0.6 1.1
To further test the assumption that extrudate and tablet dissolution vary only in
surface area, kinetic parameters of Run 3 for tablets and extrudates were compared. Two

150
models were fitted to the data, Higuchi [148] and Korsmeyer-Peppas. The Higuchi
equation has been previously used to model guaifenesin release from hot-melt extruded
tablets, describing its diffusion based on Fick’s law and dependent on the suare root of
time [149]. On the other hand, the Korsmeyer-Peppas model also known as the power
law, is often used to describe controlled or sustained drug release from polymeric
products with different geometries. The model described by Equation 6-3 relates the
percentage of drug released F at time t to k, a constant that incorporates structural and
geometric properties of the product, and release exponent n which indicates the drug
release mechanism.
F = ktn Equation 6-3
When comparing Higuchi and Korsmeyer-Peppas models with different number of
parameters, the models with the highest R2_adj and MSC, and lowest AIC were
considered better models [144, 145]. Figure 6-13 contains the average dissolution profiles
of Run 3 for extrudates and tablets. A slower dissolution is evident for the tablets,
wherein 100% drug dissolution is achieved at 30 hrs. The early time points (F < 60%)
were used in kinetic fitting.
Drug release data in both products were better fitted to the Korsmeyer-Peppas model.
The parameter estimates for the individual samples and average are listed in Table 6-9.
Release exponent estimates of tablets and extrudates were 0.89 and 0.63 respectively.
Comparing these exponents taking into account the geometric properties of the products,
the identified drug release mechanism was anomalous transport, as seen from Table 6-10.
This type of transport is controlled by a stress gradient induced by solvent penetration. It

151
couples Fickian diffusion and macromolecular relaxation mechanisms (Case II transport);
typically of the same order in time. For this formulation, the relaxation of the polymer
from a glassy to a rubbery state is the swelling-limiting step.
0
20
40
60
80
100
0 10 20 30
% D
rug
Diss
olve
d
Time (hr)
Tablets
Extrudates
Figure 6-13. Dissolution profiles of Run 3 for tablets (red) and extrudates (blue)
Table 6-9. Korsmeyer-Peppas parameter estimates Run 3
Tablets Extrudates
k n k n
11.494 0.820 30.022 0.606
8.539 0.879 13.377 0.725
10.955 0.861 30.834 0.574
7.797 0.838 24.340 0.618
3.832 1.045 15.832 0.635
avg 8.523 0.889 22.881 0.631
stdev 3.053 0.090 8.006 0.057

152
Table 6-10. Exponent n of the Korsmeyer-Peppas model. Modified from [146].
Thin film Cylinder Sphere Drug Release Mechanism
0.5 0.45 0.43 Fickian diffusion
0.5 < n < 1.0 0.45 < n < 0.89 0.43 < n < 0.85 Anomalous transport
1.0 0.89 0.85 Case II transport
Since there was no noted difference in drug release mechanism between tablets and
extrudates, the t80 included in the analysis of the experimental design were from
Korsmeyer-Peppas estimates for extrudates. Content uniformity data were used from
infinity time points at the end of the dissolution run and transformed to percetage label
claim. Subsequent experiments included recording glass transition temperatures for the
extrudates and process performance meassurements using the Specific Mechanical
Energy Consumption (SMEC) term.
The SMEC of a hot-melt extrusion process refers to the amount of energy that a
material consumes in order to be processed. This total energy does not depend only on
shear forces, but also on the energy required to heat and pump the material. SMEC can be
calculated from Equation 6-4. It depends on the torque τ of the screw shafts (a function of
power), the throughput ṁ, and screw speed n.
For HME processes, one seeks to operate at autogenous conditions where the total
energy for conveying the molten material is provided by the screws, as such, heating and
cooling systems do not add more energy to the material. However, efficient proceses also
seek to minimize the amount of energy put into the product as shear stress as this may
lead to microheat generation, degradation products or impurities, and an overall product
integrity loss. SMEC can then be counterbalanced by changing process parameters such

153
as feeding rate and screw speed, all which are summarized by the specific feed load
(SFL; Equation 6-5) or the mass throughput per rotation. Furthermore, the volume-
specific feed load (VSFL; Equation 6-6) which is essentially the equipment’s fill-level,
takes into account the free volume of the extruder (Vfree; 32 cm3), and includes all process
parameters than can be changed [150]. SMEC, SFL and VSFL values (Table 6-11) were
calculated for all runs so as to evaluate process performance and devise design spaces for
the glassy melt formulation. Diagrams are presented in figures 6-14 and 15.
Equation 6-4
Equation 6-5
Equation 6-6
Table 6-11. SMEC and SFL for experimental runs.
Run Drug
loading (%)
Feeder speed (rpm)
Screw Speed (rpm)
Barrel Temp (°C)
Torque (Nm)
Throughput (kg/min)
SMEC (kWh/
kg)
SFL (g/rpm)
VSFL (mg/
cm3rev)
1 10 15 100 125 6.3 0.0033 0.3014 0.03314 0.001036 2 10 35 200 125 6.7 0.0079 0.2972 0.03921 0.001225
3* 30 35 100 125 2.2 0.0079 0.0637 0.07842 0.002451 4 30 15 200 125 2.6 0.0033 0.2511 0.01657 0.000518 5 20 25 150 150 1.9 0.0056 0.0895 0.03719 0.001162 6 10 15 200 175 2.0 0.0033 0.2009 0.01657 0.000518 7 10 35 100 175 3.1 0.0079 0.0637 0.07842 0.002451 8 30 15 100 175 0.7 0.0033 0.0050 0.03314 0.001036 9 30 35 200 175 0.6 0.0079 0.0212 0.03921 0.001225
10 20 25 150 150 2.1 0.0056 0.0895 0.03719 0.001162 11 20 25 150 150 2.1 0.0056 0.0895 0.03719 0.001162
*Bold run denotes best processing conditions for SMEC minimization. Marked red in figures.

154
Figure 6-14. Process diagram for increasing efficiency based on SMEC and SFL.
Figure 6-15. Viable process window for an abuse deterrent melt tablet.
As shown in Figure 6-14, the SMEC decreased with increasing specific feed load
(SFL). Run 3 (marked red) with 30% NPX, high feeding rate, low screw speed and 125
°C barrel temperature, had both low SMEC and SFL. For this process, these conditions
will be limited by the maximum torque of the instrument, as shown in Figure 6-15. In this
figure, process boundaries for this formulation have been delimited by a gray box. As

155
explained before, to the left of this boundary the process will be limited by the maximum
torque of the extruder; and to the right, by the maximum intake (volume of the extruder).
At low VSFL values, e.g., at high screw speeds or low throughputs; if operating at low
temperatures, adequate miscibility between the components (solubility) becomes a
concerning factor, on the other hand, increasing the temperature to extreme values to
ensure solubilization can lead to drug degradation.
The effect of the studied variables on the average responses needed to be further
evaluated. The results in Table 6-12 were analyzed with ANOVA and the estimated
effects of the variables were further assessed.
Table 6-12. Average results for experimental design
Run Drug
loading (%)
Feeder speed (rpm)
Screw Speed (rpm)
Barrel Temp (°C)
Torque (Nm)
Youngs Modulus
(GPa)
Hardness (Mpa)
Tg (°C)
t80 (hr)
% LC
SMEC (kWh/kg)
1 10 15 100 125 6.3 7.1 3.2 82.8 5.0 112.4 0.3014
2 10 35 200 125 6.7 7.4 3.1 84.2 12.8 99.1 0.2972
3 30 35 100 125 2.2 7.5 5.6 58.9 7.5 95.7 0.0637
4 30 15 200 125 2.6 7.6 6.7 57.5 8.0 104.6 0.2511
5 20 25 150 150 1.9 7.6 3.1 66.8 12.1 108.7 0.0895
6 10 15 200 175 2.0 7.3 4.2 85.2 6.5 101.6 0.2009
7 10 35 100 175 3.1 7.2 2.8 84.7 7.5 104.1 0.0637
8 30 15 100 175 0.7 7.6 3.8 62.6 7.0 98.7 0.0050
9 30 35 200 175 0.6 7.7 5.6 58.0 6.0 100.8 0.0212
10 20 25 150 150 2.1 6.8 61.3 6.4 108.6 0.0895
11 20 25 150 150 2.1 7.4 1.8 65.1 7.9 109.6 0.0895
The analysis confirmed the results described earlier for Torque, Young modulus,
content uniformity for label claim (% LC), SMEC, time for 80% dissolution and hardness
(n = 3). Table 6-13 below denotes which variables affected each response based on
ANOVA with alpha of 0.05. The experimental design confounded two-way interactions,

156
and main effects with three-ways interactions. The analysis was repeated to include 2 and
3 order terms in the model, including only main effects. Among these, drug loading
affected the most responses, with the exception of hardness, t80, and label claim. The size
of the effect however, was the largest for hardness. The variability in hardness was
affected by drug loading and screw speed, both of which had large size effects for Tg.
This relates to the plasticization of the blend at high drug loadings [127]. This
plasticization had no effect on the time for 80 % dissolution as feeder speed had the
largest effect. This effect is attributed to the dependence of the drug release mechanism
on polymer relaxation, which will consequently change if the polymer is processed
choked. Lastly, for content uniformity the largest effects were from the feeding rate and
drug loading. These are expected as with higher feeding rates and drug loadings, the
process was less in control due erratic flow.
Table 6-13. Variables affecting response as per ANOVA tests
Variable Torque (Nm)
Youngs Modulus
(GPa)
Hardness (Mpa)
Tg (°C) t80 (hr) % LC SMEC
(kWh/kg)
% Drug Loading x x 1 x 3 2 x Feeder rate (rpm) 4 1 1 x
Screw speed (rpm) 2 2 4 x Barrel Temp (°C) x 3 2 3 x
Numbers denote size of the effect in decreasing order.
6.5 Conclusions
A systematic analysis of the parameters affecting the CQAs of melt tablets was
completed. Ultrasonics was used to evaluate Young’s Modulus of the melt tablets, which
was found to be dependent on its drug loading. The method however, was not sufficiently
discriminatory for non-porous melt tablets. Molding force for making these non-porous
compacts was affecting their dissolution. Korsmeyer-Peppas kinetic models were fitted to

157
the curves of both tablets and extrudates and the mechanism(s) of drug release elucidated
for this formulation. The controlling mechanisms were an interplay between drug
diffusion and molecular relaxation as driven by a stress gradient. This gradient was
favored in solvents of high pH as neither tablets nor extrudates dissolved in common
dissolution solvents even after 72 hrs of magnetic agitation at standard room temperature.
Three parameters were introduced to facilitate assessment of process performance.
Calculations of SMEC, SFL and VSFL led to an enhanced process understanding with
respect to SMEC and autogenous conditions. Moreover, a temperature – VSFL diagram
was introduced as a design space for which the most relevant limitations for each
processing route were been mapped.
Finally, statistical validations of the reported observations were included after
computing ANOVA tests. The factor which most affected melt tablet CQA’s was drug
loading. As the loading increased the melt plasticized, so torque and glass transition
temperature were lower, and tablets were softer. Feeding rate seemed to mostly affect
time for 80% dissolution and content uniformity, as the combination of high feeding rates
and drug loadings led to erratic flow that affected melt composition.
158
Chapter 7 Conclusions and Recommendations for Future Work
7.1 Conclusions
The primary objective of this thesis was to present flexible manufacturing platforms
for delivering poorly-water soluble drugs. These platforms stemmed from solid
dispersion formulations in which crystalline drugs are suspended in amorphous matrices
(glass suspensions) or molecularly dispersed within the polymer (glass solutions).
A robust technique for preparing crystalline nanoparticles and embedding these in
cellulose based films was developed. The technique is based on bottom-up particle size
reduction approaches. Process design spaces and second order equations integrated
process and formulation variables to predict average particle size depending on drug and
surfactant concentration, and antisolvent temperature.
Transmucosal films embedded with drug nanoparticles were then manufactured
employing higher throughput dryers. In-vitro characterization of their expected in vivo
behavior was completed after establishing a biorelevant dissolution protocol. This
protocol included recommendations for instrument configuration, simulated saliva media,
and novel algorithms to test similarities of drug release profiles.
The manufacturing scheme for these films was scrutinized after inclusion of NIR as a
PAT tool during drying. The combination of NIR and chemometrics led to identification
of a region from which the minimum residual solvent (MRS) could be predicted a priori.
Even more, solvent removal rates, real-time water content measurements and the film’s
mechanical properties could also be gauged via PCA. These estimates were then

159
validated with TGA data and could potentially be used to optimize film formulations or
define process parameters.
Next, glassy solutions in the form of transoral films were introduced. These novel
products are thermodynamically stable systems that include molecularly dispersed drug
within an amorphous polymer matrix. For these systems, the cohesion forces between the
drug and polymer are greater than between the drug itself. This dispersion was propitiated
with solubilizing polymer Soluplus®. FTIR data showed that Soluplus complexed with
NPX via H-bonding from its carbonyl group within the vinyl caprolactam monomer. The
films were amorphous, had excellent stability and drug released to cross porcine buccal
mucosa 13 times faster than other published products.
Finally, the glassy solution was reprocessed via HME methodologies to yield melt
tablets with applications for abuse-deterrent strategies. A systematic QbD approach was
undertaken to establish quality target product profiles, identify CQAs, and estimate the
factors affecting drug release, tablet strength and hardness, glass transition temperature,
content uniformity, specific mechanical energy consumption (SMEC) and process torque.
Diagrams of viable processing windows (design spaces) constrained to SMEC, barrel
temperature and volume specific feed load were generated.
7.2 Recommendations for Future Work
As the number of drug candidates continues to increase, predictive tools for
assessing solubility and long-term interactions in complex systems are more scrutinized
as they relay the need for laborious and costly physical testing. Molecular simulations
and thermodynamic models based on Flory-Huggins theory and Hansen solubility
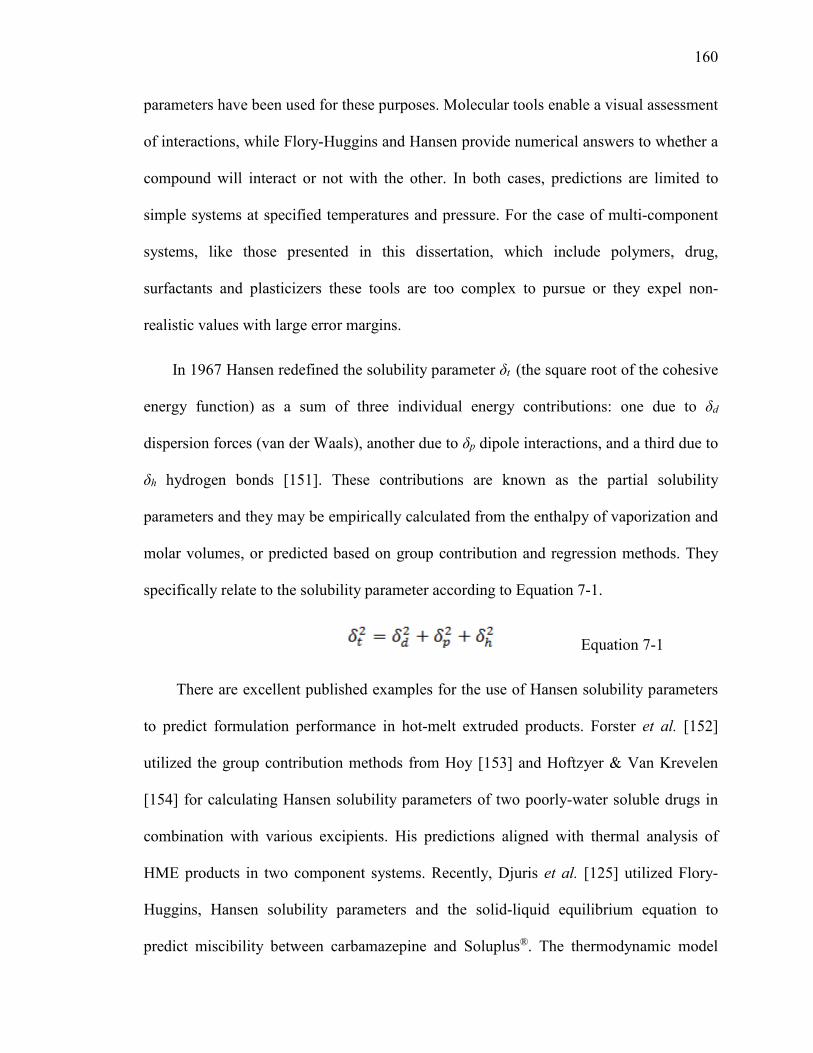
160
parameters have been used for these purposes. Molecular tools enable a visual assessment
of interactions, while Flory-Huggins and Hansen provide numerical answers to whether a
compound will interact or not with the other. In both cases, predictions are limited to
simple systems at specified temperatures and pressure. For the case of multi-component
systems, like those presented in this dissertation, which include polymers, drug,
surfactants and plasticizers these tools are too complex to pursue or they expel non-
realistic values with large error margins.
In 1967 Hansen redefined the solubility parameter δt (the square root of the cohesive
energy function) as a sum of three individual energy contributions: one due to δd
dispersion forces (van der Waals), another due to δp dipole interactions, and a third due to
δh hydrogen bonds [151]. These contributions are known as the partial solubility
parameters and they may be empirically calculated from the enthalpy of vaporization and
molar volumes, or predicted based on group contribution and regression methods. They
specifically relate to the solubility parameter according to Equation 7-1.
Equation 7-1
There are excellent published examples for the use of Hansen solubility parameters
to predict formulation performance in hot-melt extruded products. Forster et al. [152]
utilized the group contribution methods from Hoy [153] and Hoftzyer & Van Krevelen
[154] for calculating Hansen solubility parameters of two poorly-water soluble drugs in
combination with various excipients. His predictions aligned with thermal analysis of
HME products in two component systems. Recently, Djuris et al. [125] utilized Flory-
Huggins, Hansen solubility parameters and the solid-liquid equilibrium equation to
predict miscibility between carbamazepine and Soluplus®. The thermodynamic model

161
predictions also confirmed experimental results. These studies and many others show the
potential of Hansen solubility parameters to predict formulation performance upon
material processing. However, very few publications, if any, report the utilization of
Hansen’s parameters to predict performance of a multi-component formulation.
In view of the above, I suggest the work contained in this dissertation is extended by
developing a new multivariate approach to predict miscibility of multi-component
systems based on Hansen Solubility Parameters (HSP). Traditionally, the Hansen space is
given by a sphere with radius Ro and a center defined by the partial solubility parameters
in three-dimensional coordinates (2δd, δp, δh). Miscibility is expected if the Euclidean
distance over Ro is less than 1 (green components in Figure 7-1).
Figure 7-1. Hansen model space. Miscible solvents (green) have low distances relative to the other component (sphere). Image adapted from [155].
This traditional approach is advantageous for binary systems where one can easily
calculate these distances and visually compare the areas of the sphere. Nowadays, most

162
systems are multicomponent formulations that require further understanding in order to
predict not only compatibility but long-term stability of the products and drug integrity.
In fact, the use of polymeric solubilizers may increase the miscibility of a non-polar drug
and water if all three are taken into account.
The proposed approach is to utilize inlier and outlier statistics upon a PCA model
space to predict solubility of multi-component systems, taking into account attributes
such as viscosity, molecular weight, glass transition temperature, etc. as well as the
partial solubility parameters. Mahalanobis distance and Hotelling’s T2 can be evaluated
as inlier statistics for describing how a new component compares to a cluster or system,
and the similarity of the means. Q-Residuals can be used to describe outlier statistics, as
will quantify the residual or unexplained variation when a new sample is projected into
the model. In the end, this thermodynamic and chemometric model fitting of Hansen’s
solubility parameters will enable the prediction of solubility and stability of multi-
component systems. From thereon, designing the process and further evaluating its
sensitivity will be much more streamlined since the formulation will not be a failure
mode.
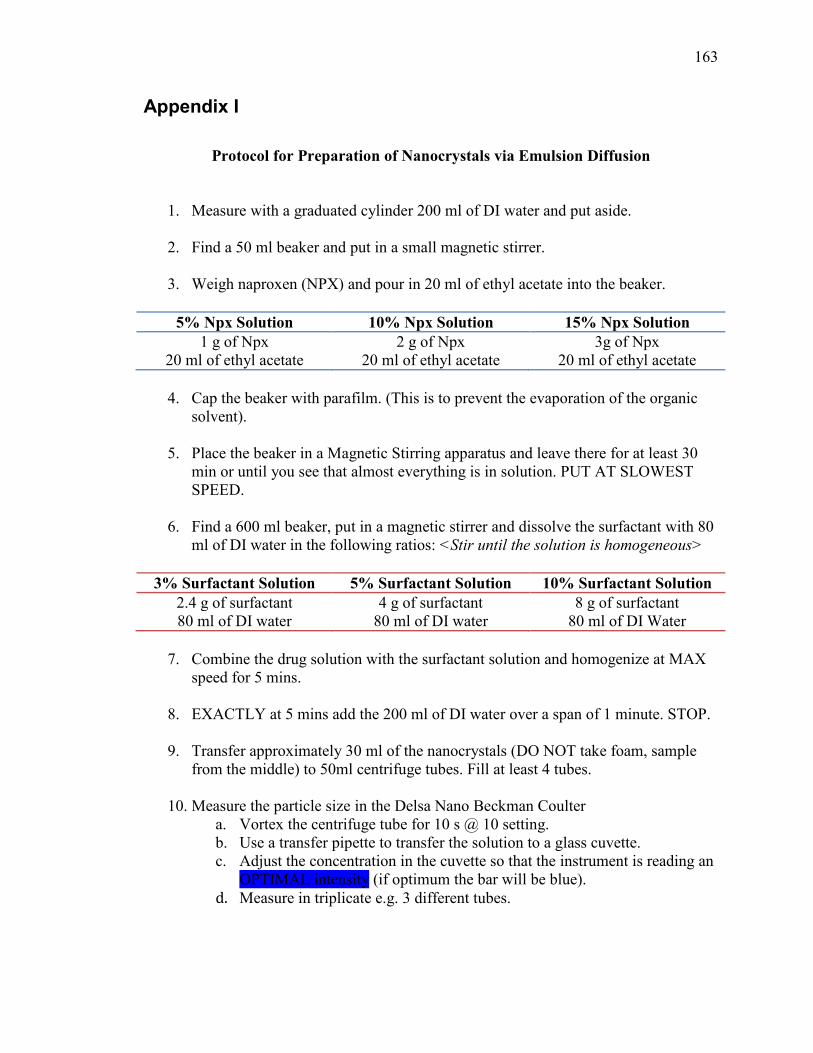
163
Appendix I
Protocol for Preparation of Nanocrystals via Emulsion Diffusion
1. Measure with a graduated cylinder 200 ml of DI water and put aside.
2. Find a 50 ml beaker and put in a small magnetic stirrer.
3. Weigh naproxen (NPX) and pour in 20 ml of ethyl acetate into the beaker.
5% Npx Solution 10% Npx Solution 15% Npx Solution
1 g of Npx 2 g of Npx 3g of Npx 20 ml of ethyl acetate 20 ml of ethyl acetate 20 ml of ethyl acetate
4. Cap the beaker with parafilm. (This is to prevent the evaporation of the organic
solvent).
5. Place the beaker in a Magnetic Stirring apparatus and leave there for at least 30 min or until you see that almost everything is in solution. PUT AT SLOWEST SPEED.
6. Find a 600 ml beaker, put in a magnetic stirrer and dissolve the surfactant with 80
ml of DI water in the following ratios: <Stir until the solution is homogeneous>
3% Surfactant Solution 5% Surfactant Solution 10% Surfactant Solution 2.4 g of surfactant 4 g of surfactant 8 g of surfactant 80 ml of DI water 80 ml of DI water 80 ml of DI Water
7. Combine the drug solution with the surfactant solution and homogenize at MAX
speed for 5 mins.
8. EXACTLY at 5 mins add the 200 ml of DI water over a span of 1 minute. STOP.
9. Transfer approximately 30 ml of the nanocrystals (DO NOT take foam, sample from the middle) to 50ml centrifuge tubes. Fill at least 4 tubes.
10. Measure the particle size in the Delsa Nano Beckman Coulter
a. Vortex the centrifuge tube for 10 s @ 10 setting. b. Use a transfer pipette to transfer the solution to a glass cuvette. c. Adjust the concentration in the cuvette so that the instrument is reading an
OPTIMAL intensity (if optimum the bar will be blue). d. Measure in triplicate e.g. 3 different tubes.
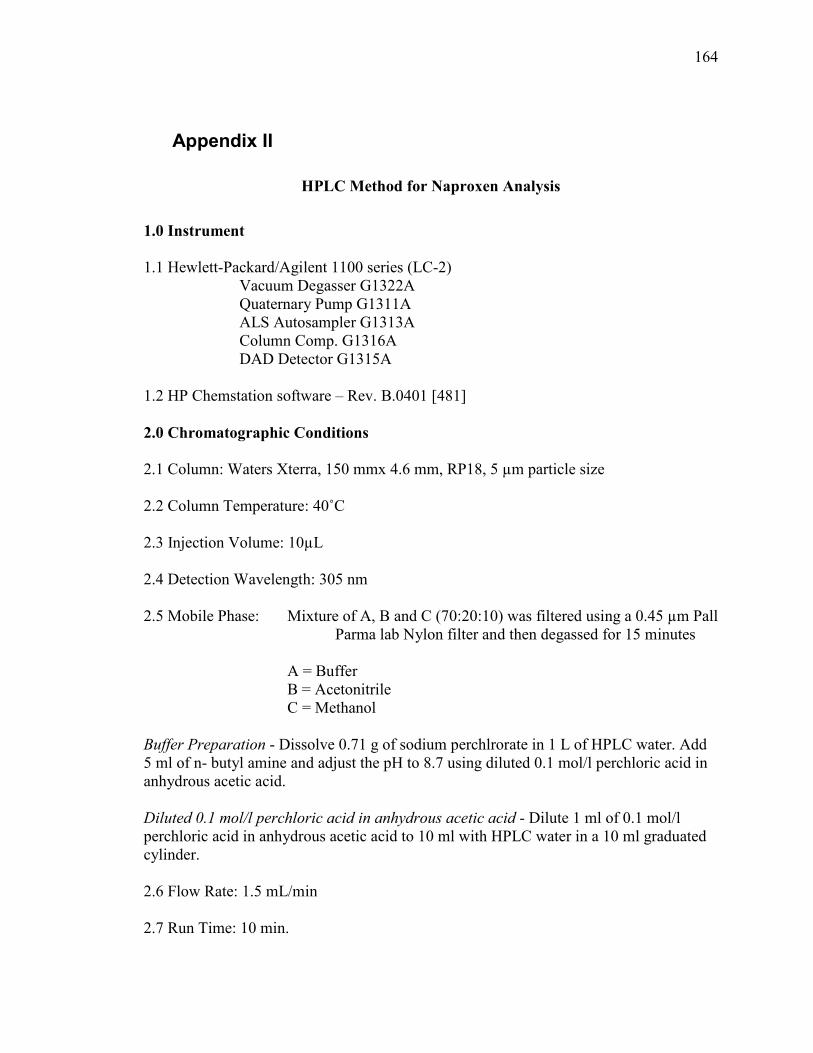
164
Appendix II
HPLC Method for Naproxen Analysis 1.0 Instrument 1.1 Hewlett-Packard/Agilent 1100 series (LC-2) Vacuum Degasser G1322A Quaternary Pump G1311A ALS Autosampler G1313A Column Comp. G1316A DAD Detector G1315A 1.2 HP Chemstation software – Rev. B.0401 [481] 2.0 Chromatographic Conditions 2.1 Column: Waters Xterra, 150 mmx 4.6 mm, RP18, 5 µm particle size 2.2 Column Temperature: 40˚C 2.3 Injection Volume: 10µL 2.4 Detection Wavelength: 305 nm 2.5 Mobile Phase: Mixture of A, B and C (70:20:10) was filtered using a 0.45 µm Pall Parma lab Nylon filter and then degassed for 15 minutes A = Buffer B = Acetonitrile C = Methanol Buffer Preparation - Dissolve 0.71 g of sodium perchlrorate in 1 L of HPLC water. Add 5 ml of n- butyl amine and adjust the pH to 8.7 using diluted 0.1 mol/l perchloric acid in anhydrous acetic acid. Diluted 0.1 mol/l perchloric acid in anhydrous acetic acid - Dilute 1 ml of 0.1 mol/l perchloric acid in anhydrous acetic acid to 10 ml with HPLC water in a 10 ml graduated cylinder. 2.6 Flow Rate: 1.5 mL/min 2.7 Run Time: 10 min.

165
3.0 Chemicals and Reagents Naproxen, meets USP testing specifications (Sigma-Aldrich) Acetonitrile, HPLC grade (Acros) Water, ultra-pure, HPLC Grade (Alfa Aesar) Methanol, ultra-pure, HPLC grade, 99.8% (Alfa Aesar) Sodium Perchlorate monohydrate, 85-90% ACS grade (Alfa Aesar) N-butylamine, 99% (Alfa Aesar) Perchloric acid, 0.1N in Glacial Acetic acid – Baker Analyzed Reagent (J.T. Baker) Triethylamine, 99% (Alfa Aesar) Sodium Hydroxide, certified A.C.S (Fischer) 4.0 Standard Preparation 4.1 Weigh about 127 mg of Naproxen in a small weighing boat. Pour sample into a clean 25 mL volumetric flask, add 15 ml of diluent-1, sonicate to dissolve the material completely, and dilute to volume with diluent-2 and mix. This solution is naproxen standard stock solution at 5.08 mg/ml. 4.2 Transfer 5ml of the solution above (naproxen stock solution) to a 50ml volumetric flask, dilute with mobile phase (Diluent 3) to volume, and mix well. This sample is 0.508 mg/ml. 4.3 Pipette 5 mL of 0.508 mg/mL standard and 5 mL of mobile phase into a 20 mL glass vial. Cap vial and swirl. This then becomes 0.254 mg/mL standard. Repeat the process sequentially resulting in calibration standards of 0.508, 0.254, 0.127, 0.0635, 0.03175, 0.0159, 0.0079, 0.00397 mg/mL standards. Diluent-1 - Mixture of 800 mL of methanol, 200 mL of HPLC water and 4 mL of triethyl amine Diluent-2 – 0.25N Sodium hydroxide (Dissolve 10 g of sodium hydroxide in 1 L HPLC water) Diluent-3 – Mobile Phase (Buffer, Acetonitrile, Methanol [700:200:100])

166
REFERENCES
1. GBI Research Report: Manufacturing of Solid Dosage Forms - Transformation in Manufacturing Concepts and Expanding Contract Manufacturers' Production Capacity May Force regulatory Bodies to Re-Design Guidelines on Quality Standards. 2011.
2. Lipp, R., The Innovator Pipeline: Bioavailability Challenges and Advanced Oral Drug Delivery Opportunities. American Pharmaceutical Review, 2013. 16(3).
3. Serajuddin, A.T., Salt formation to improve drug solubility. Adv Drug Deliv Rev, 2007. 59(7): p. 603-16.
4. Brakmane, G., M. Winslet, and A.M. Seifalian, Systematic review: the applications of nanotechnology in gastroenterology. Aliment Pharmacol Ther, 2012. 36(3): p. 213-21.
5. Calixto, G., et al., Nanotechnology-based drug delivery systems for treatment of oral cancer: a review. Int J Nanomedicine, 2014. 9: p. 3719-35.
6. Cevc, G. and U. Vierl, Nanotechnology and the transdermal route: A state of the art review and critical appraisal. J Control Release, 2010. 141(3): p. 277-99.
7. Gordon, E.M. and F.L. Hall, Nanotechnology blooms, at last (Review). Oncol Rep, 2005. 13(6): p. 1003-7.
8. Koo, O.M., I. Rubinstein, and H. Onyuksel, Role of nanotechnology in targeted drug delivery and imaging: a concise review. Nanomedicine, 2005. 1(3): p. 193-212.
9. Sievens-Figueroa, L., et al., Preparation and characterization of hydroxypropyl methyl cellulose films containing stable BCS Class II drug nanoparticles for pharmaceutical applications. Int J Pharm, 2012. 423(2): p. 496-508.
10. Tan, A., S. Rao, and C.A. Prestidge, Transforming lipid-based oral drug delivery systems into solid dosage forms: an overview of solid carriers, physicochemical properties, and biopharmaceutical performance. Pharm Res, 2013. 30(12): p. 2993-3017.
11. The use of amorphous solid dispersions: A formulation strategy to overcome poor solubility and dissolution rate. Drug Discov Today Technol, 2012. 9(2): p. e71-e174.
12. Alam, M.A., et al., Solid dispersions: a strategy for poorly aqueous soluble drugs and technology updates. Expert Opin Drug Deliv, 2012. 9(11): p. 1419-40.
13. Leuner, C. and J. Dressman, Improving drug solubility for oral delivery using solid dispersions. Eur J Pharm Biopharm, 2000. 50(1): p. 47-60.
14. Six, K., et al., Characterization of solid dispersions of itraconazole and hydroxypropylmethylcellulose prepared by melt extrusion, Part II. Pharm Res, 2003. 20(7): p. 1047-54.
15. Vasconcelos, T., B. Sarmento, and P. Costa, Solid dispersions as strategy to improve oral bioavailability of poor water soluble drugs. Drug Discov Today, 2007. 12(23-24): p. 1068-75.
16. Kolter, K., M. Karl and A. Gryczke, Hot-Melt Extrusion with BASF Pharma Polymers. 2 ed. 2012, Ludwigshafen, Germany: BASF SE.
17. High performance thermoforming materials. Penn Fibre/Ensinger Inc.: Bensalem, PA.
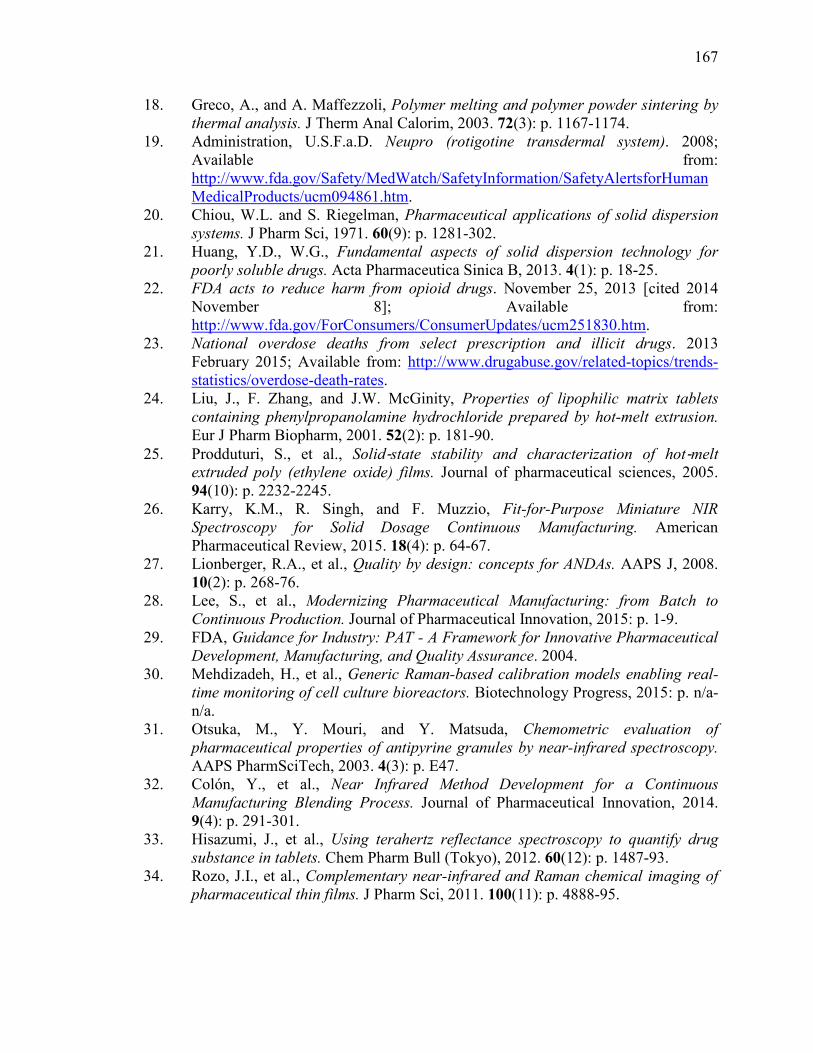
167
18. Greco, A., and A. Maffezzoli, Polymer melting and polymer powder sintering by thermal analysis. J Therm Anal Calorim, 2003. 72(3): p. 1167-1174.
19. Administration, U.S.F.a.D. Neupro (rotigotine transdermal system). 2008; Available from: http://www.fda.gov/Safety/MedWatch/SafetyInformation/SafetyAlertsforHumanMedicalProducts/ucm094861.htm.
20. Chiou, W.L. and S. Riegelman, Pharmaceutical applications of solid dispersion systems. J Pharm Sci, 1971. 60(9): p. 1281-302.
21. Huang, Y.D., W.G., Fundamental aspects of solid dispersion technology for poorly soluble drugs. Acta Pharmaceutica Sinica B, 2013. 4(1): p. 18-25.
22. FDA acts to reduce harm from opioid drugs. November 25, 2013 [cited 2014 November 8]; Available from: http://www.fda.gov/ForConsumers/ConsumerUpdates/ucm251830.htm.
23. National overdose deaths from select prescription and illicit drugs. 2013 February 2015; Available from: http://www.drugabuse.gov/related-topics/trends-statistics/overdose-death-rates.
24. Liu, J., F. Zhang, and J.W. McGinity, Properties of lipophilic matrix tablets containing phenylpropanolamine hydrochloride prepared by hot-melt extrusion. Eur J Pharm Biopharm, 2001. 52(2): p. 181-90.
25. Prodduturi, S., et al., Solid‐state stability and characterization of hot‐melt extruded poly (ethylene oxide) films. Journal of pharmaceutical sciences, 2005. 94(10): p. 2232-2245.
26. Karry, K.M., R. Singh, and F. Muzzio, Fit-for-Purpose Miniature NIR Spectroscopy for Solid Dosage Continuous Manufacturing. American Pharmaceutical Review, 2015. 18(4): p. 64-67.
27. Lionberger, R.A., et al., Quality by design: concepts for ANDAs. AAPS J, 2008. 10(2): p. 268-76.
28. Lee, S., et al., Modernizing Pharmaceutical Manufacturing: from Batch to Continuous Production. Journal of Pharmaceutical Innovation, 2015: p. 1-9.
29. FDA, Guidance for Industry: PAT - A Framework for Innovative Pharmaceutical Development, Manufacturing, and Quality Assurance. 2004.
30. Mehdizadeh, H., et al., Generic Raman-based calibration models enabling real-time monitoring of cell culture bioreactors. Biotechnology Progress, 2015: p. n/a-n/a.
31. Otsuka, M., Y. Mouri, and Y. Matsuda, Chemometric evaluation of pharmaceutical properties of antipyrine granules by near-infrared spectroscopy. AAPS PharmSciTech, 2003. 4(3): p. E47.
32. Colón, Y., et al., Near Infrared Method Development for a Continuous Manufacturing Blending Process. Journal of Pharmaceutical Innovation, 2014. 9(4): p. 291-301.
33. Hisazumi, J., et al., Using terahertz reflectance spectroscopy to quantify drug substance in tablets. Chem Pharm Bull (Tokyo), 2012. 60(12): p. 1487-93.
34. Rozo, J.I., et al., Complementary near-infrared and Raman chemical imaging of pharmaceutical thin films. J Pharm Sci, 2011. 100(11): p. 4888-95.
168
35. Strachan, C.J., et al., Using terahertz pulsed spectroscopy to quantify pharmaceutical polymorphism and crystallinity. J Pharm Sci, 2005. 94(4): p. 837-46.
36. Strachan, C.J.R., T.; Newnham, D. A.; Gordon, K. C.; Pepper, M.; Taday, P. F., Using terahertz pulsed spectroscopy to study crystallinity of pharmaceutical materials. Chemical Physics Letters, 2004. 390: p. 20-24.
37. Taday, P.F., et al., Using Terahertz pulse spectroscopy to study the crystalline structure of a drug: a case study of the polymorphs of ranitidine hydrochloride. J Pharm Sci, 2003. 92(4): p. 831-8.
38. Ho, L., et al., Effects of film coating thickness and drug layer uniformity on in vitro drug release from sustained-release coated pellets: a case study using terahertz pulsed imaging. Int J Pharm, 2009. 382(1-2): p. 151-9.
39. Singh, R., et al., Implementation of an advanced hybrid MPC-PID control system using PAT tools into a direct compaction continuous pharmaceutical tablet manufacturing pilot plant. Int J Pharm, 2014. 473(1-2): p. 38-54.
40. Sheng, J.J., et al., Solubilization and dissolution of insoluble weak acid, ketoprofen: effects of pH combined with surfactant. Eur J Pharm Sci, 2006. 29(3-4): p. 306-14.
41. Takeda, T., et al., Nonsteroidal anti-inflammatory drug naproxen destabilizes Abeta amyloid fibrils: a molecular dynamics investigation. J Phys Chem B, 2010. 114(46): p. 15394-402.
42. Ibuprofen. 2005 October 2013; 4.3:[Available from: http://www.drugbank.ca/drugs/DB01050.
43. Naproxen. 2005 October 2013; 4.3:[Available from: http://www.drugbank.ca/drugs/db00788.
44. Romanski, F.S., The production and stabilization of pharmaceutical nanosuspensions, in Chemical and Biochemical Engineering. 2011, Rutgers, The State University of New Jersey: New Brunswick, New Jersey.
45. Beyers, H., et al., Structure-solubility relationship and thermal decomposition of furosemide. Drug Dev Ind Pharm, 2000. 26(10): p. 1077-83.
46. Murtaza, G., et al., Comparative evaluation of various solubility enhancement strategies for furosemide. Pak J Pharm Sci, 2014. 27(4): p. 963-73.
47. Jouyban-Gharamaleki, A., et al., Solubility prediction for furosemide in water-cosolvent mixtures using the minimum number of experiments. Drug Dev Ind Pharm, 2001. 27(6): p. 577-83.
48. Bustamante, P., M.A. Pena, and J. Barra, Partial-solubility parameters of naproxen and sodium diclofenac. J Pharm Pharmacol, 1998. 50(9): p. 975-82.
49. Paudel, A., J. Van Humbeeck, and G. Van den Mooter, Theoretical and experimental investigation on the solid solubility and miscibility of naproxen in poly(vinylpyrrolidone). Mol Pharm, 2010. 7(4): p. 1133-48.
50. Liversidge, G.G.a.C., P., Drug particle size reduction for decreasing gastric irritancy and enhancing absorption of naproxen in rats. Int J Pharm, 1995. 125: p. 309-313.
51. Monteiro, A., A. Afolabi, and E. Bilgili, Continuous production of drug nanoparticle suspensions via wet stirred media milling: a fresh look at the Rehbinder effect. Drug Dev Ind Pharm, 2013. 39(2): p. 266-83.

169
52. Susarla, R., et al., Fast drying of biocompatible polymer films loaded with poorly water-soluble drug nano-particles via low temperature forced convection. Int J Pharm, 2013. 455(1-2): p. 93-103.
53. Sjostrom, B., B. Bergenstahl, and B. Kronberg, A method for the preparation of submicron particles of sparingly water-soluble drugs by precipitation in oil-in-water emulsions. II: Influence of the emulsifier, the solvent, and the drug substance. J Pharm Sci, 1993. 82(6): p. 584-9.
54. Sjostrom, B., B. Kronberg, and J. Carlfors, A method for the preparation of submicron particles of sparingly water-soluble drugs by precipitation in oil-in-water emulsions. I: Influence of emulsification and surfactant concentration. J Pharm Sci, 1993. 82(6): p. 579-83.
55. Approximate HLB values of SMA®Resins and Esters – Anionic Surfactants. Available from: http://www.crayvalley.com/docs/technical-paper/approximate-hlb-values-of-sma-resins-and-esters-.pdf.
56. Surfactant Basics - Definition of HLB, and How It Applies to Emulsions. Available from: http://dowac.custhelp.com/app/answers/detail/a_id/3277.
57. Soy Lecithin HLB. Available from: http://www.theherbarie.com/Soy-Lecithin-HLB-7.0.html.
58. Barut, K.D., F.C. Ari, and F. Oner, Development and Characterization of a Cationic Emulsion Formulation as a Potential pDNA Carrier System. Turk J Chem, 2005. 29: p. 27-40.
59. Emulsions: Preparation and Stabilization. Available from: http://pharmlabs.unc.edu/labs/emulsions/hlb.htm.
60. Zeta Potential An Introduction in 30 Minutes. Malvern Instruments Ltd. p. 1-6. 61. Lee, S. and W.M. Sigmund, AFM study of repulsive Van der Waals forces
between Teflon AF thin film and silica or alumina. Colloids Surf A, 2002. 204(1-3): p. 43-50.
62. Clogston, J.D. and A.K. Patri, Zeta potential measurement. Methods Mol Biol, 2011. 697: p. 63-70.
63. Júnior, J.A.A.a.B., J.B. , The behavior of zeta potential of silica suspensions. New Journal of Glass and Ceramics, 2014. 4: p. 29-37.
64. Shi, J. and H. Verweij, Synthesis and purification of oxide nanoparticle dispersions by modified emulsion precipitation. Langmuir, 2005. 21(12): p. 5570-5.
65. Wang, Y., et al., Statistical comparison of dissolution profiles. Drug Dev Ind Pharm, 2015: p. 1-12.
66. Sullivan, G.M. and R. Feinn, Using Effect Size—or Why the P Value Is Not Enough. Journal of Graduate Medical Education, 2012. 4(3): p. 279-282.
67. O'Brien, R.W., et al., Electroacoustic studies of moderately concentrated colloidal suspensions. Faraday Discuss Chem Soc, 1990. 90: p. 301-312.
68. Montgomery, D.C. and G.C. Runger, Designing experiments with several factors, in Applied Statistics and Probability for Engineers. 2007, John Wiley & Sons Inc.: Hoboken, NJ. p. 538-617.
69. Abdou, H.M., Chapter 14: Developing a New Dissolution Method, in Dissolution, Bioavailability & Bioequivalence, A. Gennaro, et al., Editor. 1989, Mack Publishing Company: Easton, PA. p. 285-292.

170
70. Soh, J.L.P. and P.S.W. Heng, In Vitro Dissolution of Pharmaceutical Solids, in Oral Bioavailability: Basic Principles, Advanced Concepts, and Applications, M. Hu and X. Li, Editors. 2011, John Wiley & Sons, Inc.: Hoboken, NJ. p. 39-49.
71. Adrover, A., et al., In vitro dissolution testing of oral thin films: A comparison between USP 1, USP 2 apparatuses and a new millifluidic flow-through device. Chemical Engineering Research and Design, 2015. 95: p. 173-178.
72. Preis, M.K. Film preparations for oral drug delivery. 2013 [cited 2015 July 28]; Available from: http://www.pssrc.org/component/k2/87.
73. Commission, E.P. Oromucosal Preparations 1807. [cited 2015 July 28]; Available from: http://www.newdruginfo.com/pharmacopeia/bp2003/British%20Pharmacopoeia%20Volume%20III%5CMonographs%5CFormulated%20Preparations%20Genearal%20Monographs%5COROMUCOSAL%20PREPARATIONS.htm.
74. Rathbone, M.J., Oral Mucosal Drug Delivery. 1 ed. Drugs and the Pharmaceutical Sciences. 1996, Boca Raton, FL: CRC Press.
75. Sievens-Figueroa, L., et al., Using USP I and USP IV for discriminating dissolution rates of nano- and microparticle-loaded pharmaceutical strip-films. AAPS PharmSciTech, 2012. 13(4): p. 1473-82.
76. Krull, S.M., et al., Polymer strip films as a robust, surfactant-free platform for delivery of BCS Class II drug nanoparticles. International Journal of Pharmaceutics, 2015. 489(1–2): p. 45-57.
77. USP29-NF27, Naproxen Tablets. p. 1483. 78. Collins, L.M. and C. Dawes, The surface area of the adult human mouth and
thickness of the salivary film covering the teeth and oral mucosa. J Dent Res, 1987. 66(8): p. 1300-2.
79. Watanabe, S. and C. Dawes, Salivary flow rates and salivary film thickness in five-year-old children. J Dent Res, 1990. 69(5): p. 1150-3.
80. Flink, H., Studies on the prevalence of reduced salivary flow rate in relation to general health and dental caries, and effect of iron supplementation. Swed Dent J Suppl, 2007(192): p. 3-50, 2 p preceding table of contents.
81. Marques, M.R.C., R. Loebenberg, and M. Almukainzi, Simulated Biological Fluids with Possible Application in Dissolution Testing, in Dissolution Technologies. 2011.
82. Hughes, L., and A. Gehris, A New Method of Characterizing the Buccal Dissolution of Drugs, R.a.H.R. Laboratories, Editor.: Spring House, PA.
83. Gittings, S., et al., Dissolution methodology for taste masked oral dosage forms. J Control Release, 2014. 173: p. 32-42.
84. Hugoson, A., Salivary secretion in pregnancy. A longitudinal study of flow rate, total protein, sodium, potassium and calcium concentration in parotid saliva from pregnant women. Acta Odontol Scand, 1972. 30(1): p. 49-66.
85. Shannon, I.L. and R.P. Feller, Parotid saliva flow rate, calcium, phosphorus, and magnesium concentrations in relation to dental caries experience in children. Pediatr Dent, 1979. 1(1): p. 16-20.
86. Rockenbach, M.I., et al., Salivary flow rate, pH, and concentrations of calcium, phosphate, and sIgA in Brazilian pregnant and non-pregnant women. Head Face Med, 2006. 2: p. 44.
171
87. USP <1092> The Dissolution Procedure: Development and Validation, G.C.-D.F.E. Committee, Editor. 2014, United States Pharmacopeia–National Formulary.
88. Bhakay, A., et al., Novel aspects of wet milling for the production of microsuspensions and nanosuspensions of poorly water-soluble drugs. Drug Development and Industrial Pharmacy, 2011. 37(8): p. 963-976.
89. Bilgili, E. and A. Afolabi, A combined microhydrodynamics-polymer adsorption analysis for elucidation of the roles of stabilizers in wet stirred media milling. International Journal of Pharmaceutics, 2012. 439(1-2): p. 193-206.
90. Knieke, C., et al., A study of the physical stability of wet media-milled fenofibrate suspensions using dynamic equilibrium curves. Chemical Engineering Research and Design, 2013. 91(7): p. 1245-1258.
91. Dave, R.N., et al., System and method for fabrication of uniform polymer films containing nano and micro particles via continuous drying process. 2014, Google Patents.
92. Bhakay, A., R. Davé, and E. Bilgili, Recovery of BCS Class II drugs during aqueous redispersion of core–shell type nanocomposite particles produced via fluidized bed coating. Powder Technology, 2013. 236: p. 221-234.
93. Liew, K.B., Y.T. Tan, and K.K. Peh, Effect of polymer, plasticizer and filler on orally disintegrating film. Drug Dev Ind Pharm, 2014. 40(1): p. 110-9.
94. Payne-Johnson, M., et al., An evaluation of the relative palatability of two commercial oral tablet formulations of carprofen and meloxicam in dogs using acceptance and preference tests. Revue Med Vet, 2007. 158(10): p. 519-524.
95. Costa, P. and J.M.S. Lobo, Modeling and comparison of dissolution profiles. European journal of pharmaceutical sciences, 2001. 13(2): p. 123-133.
96. FDA, Guidance for Industry: Dissolution Testing of Immediate Release Solid Oral Dosage Forms. 1997.
97. Saranadasa, H. Defining the similarity of dissolution profiles using Hotelling's T2 statistic. 2003 [cited 2015 July 30]; Available from: http://www.pharmtech.com/defining-similarity-dissolution-profiles-using-hotellings-t2-statistic.
98. Beckett, A.H. and A.C. Moffat, The influence of substitution in phenylacetic acids on their performance in the buccal absorption test. J Pharm Pharmacol, 1969. 21: p. Suppl:139S+.
99. Chow, S.C., Introduction, in Statistical Design and Analysis of Stability Studies. 2007, CRC Press: Boca Raton, FL. p. 16-17.
100. USP <905> Uniformity of Dosage Units. [cited 2015 August 9]; Available from: http://www.pharmacopeia.cn/v29240/usp29nf24s0_c905.html.
101. Shah, V.P., et al., In vitro dissolution profile comparison--statistics and analysis of the similarity factor, f2. Pharm Res, 1998. 15(6): p. 889-96.
102. Ford, J.L., Design and Evaluation of Hydroxypropyl Methylcellulose Matrix Tablets for Oral Controlled Release: A Historical Perspective, in Hydrophilic Matrix Tablets for Oral Controlled Release, P. Timmins, S.R. Pygall, and C.D. Melia, Editors. 2014, AAPS. p. 17-51.
103. Jehl-Pietri, C., et al., [Buccal dryness, xerostomia and measurement of salivary secretory activity]. Ann Med Interne (Paris), 1997. 148(3): p. 209-16.

172
104. Kullander, S. and B. Sonesson, Studies on Saliva in Menstruating, Pregnant and Post-Menopausal Women. Acta Endocrinol (Copenh), 1965. 48: p. 329-36.
105. Loesche, W.J., et al., Xerostomia, xerogenic medications and food avoidances in selected geriatric groups. J Am Geriatr Soc, 1995. 43(4): p. 401-7.
106. Hamlin, W.E., et al., Loss of sensitivity in distinguishing renal differences in dissolution rates due to increasing intensity of agitation. J Pharm Sci, 1962. 51: p. 432-5.
107. Abdou, H.M., Chapter 8: Effect of the Test Parameters on Dissolution Rate, in Dissolution, Bioavailability & Bioequivalence, A. Gennaro, et al., Editor. 1989, Mack Publishing Company: Easton, PA. p. 145-171.
108. Newton, J.M. and N.A. Muhammad, The influence of agitation intensity, particle size and pH of dissolution fluid on the in-vitro release of drug from hard gelatin capsules. J Pharm Pharmacol, 1984. 36(1): p. 42-4.
109. Hansen, C.M., Reinterpreting Case II Absorption in Polymers - An Examination of the Thomas and Windle Data. 2012, Hansen-Solubility. p. 1-24.
110. Lagerlof, F. and C. Dawes, The volume of saliva in the mouth before and after swallowing. J Dent Res, 1984. 63(5): p. 618-21.
111. Abdou, H.M., Chapter 2: Theory of Dissolution, in Dissolution, Bioavailability & Bioequivalence, A. Gennaro, et al., Editor. 1989, Mack Publishing Company: Easton, PA. p. 13.
112. Sulub, Y., M. Konigsberger, and J. Cheney, Blend uniformity end-point determination using near-infrared spectroscopy and multivariate calibration. J Pharm Biomed Anal, 2011. 55(3): p. 429-34.
113. Markl, D., et al., Supervisory control system for monitoring a pharmaceutical hot melt extrusion process. AAPS PharmSciTech, 2013. 14(3): p. 1034-44.
114. Tumuluri, S.V., et al., The use of near-infrared spectroscopy for the quantitation of a drug in hot-melt extruded films. Drug Dev Ind Pharm, 2004. 30(5): p. 505-11.
115. Zhang, J., et al., Raman spectroscopy for in-line and off-line quantification of poorly soluble drugs in strip films. Int J Pharm, 2014. 475(1-2): p. 428-37.
116. Burger, J., Bad pixel detection in hyperspectral staring camera systems. NIR news, 2009. 20(1): p. 9-12.
117. An introduction to Absorption / Transmission / Reflection Spectroscopy. Available from: http://www.andor.com/learning-academy/absorption-transmission-reflection-spectroscopy-an-introduction-to-absorption-transmission-reflection-spectroscopy.
118. Chaplin, M. Water Absorption Spectrum. Water Structure and Science 2000 August 2, 2015; Available from: http://www1.lsbu.ac.uk/water/water_vibrational_spectrum.html.
119. Prapotnik, M., D. Janezic, and J. Mavri, Temperature dependence of water vibrational spectrum: a molecular dynamics simulation study. J Phys Chem A, 2004. 108: p. 11056-11062.
120. Wojciechowska, P., The Effect of concentration and type of plasticizer on the mechanical properties of cellulose acetate butyrate organic-inorganic hybrids. 2012: INTECH Open Access Publisher.
121. Cilurzo, F., et al., Nicotine fast dissolving films made of maltodextrins: a feasibility study. AAPS PharmSciTech, 2010. 11(4): p. 1511-7.
173
122. Cilurzo, F., et al., Fast dissolving films made of maltodextrins. Eur J Pharm Biopharm, 2008. 70(3): p. 895-900.
123. Durrant, J.D. and J.A. McCammon, Molecular dynamics simulations and drug discovery. BMC Biol, 2011. 9: p. 71.
124. Borhani, D.W. and D.E. Shaw, The future of molecular dynamics simulations in drug discovery. J Comput Aided Mol Des, 2012. 26(1): p. 15-26.
125. Djuris, J., et al., Preparation of carbamazepine-Soluplus solid dispersions by hot-melt extrusion, and prediction of drug-polymer miscibility by thermodynamic model fitting. Eur J Pharm Biopharm, 2013. 84(1): p. 228-37.
126. Kyeremateng, S.O., M. Pudlas, and G.H. Woehrle, A fast and reliable empirical approach for estimating solubility of crystalline drugs in polymers for hot melt extrusion formulations. J Pharm Sci, 2014. 103(9): p. 2847-58.
127. De Brabander, C., et al., Characterization of ibuprofen as a nontraditional plasticizer of ethyl cellulose. Journal of Pharmaceutical Sciences, 2002. 91(7): p. 1678-1685.
128. Worku, Z.A., J. Aarts, and G. Van den Mooter, Influence of compression forces on the structural stability of naproxen/PVP-VA 64 solid dispersions. Mol Pharm, 2014. 11(4): p. 1102-8.
129. Chang, W.E., et al., Molecular dynamics simulations of anti-aggregation effect of ibuprofen. Biophys J, 2010. 98(11): p. 2662-70.
130. Mura, P., et al., Thermal behavior and dissolution properties of naproxen from binary and ternary solid dispersions. Drug Dev Ind Pharm, 1999. 25(3): p. 257-64.
131. Administration, U.F.a.D. Inactive Ingredient Search for Approved Drug Products. [cited 2014 December 7]; Available from: http://www.accessdata.fda.gov/scripts/cder/iig/getiigWEB.cfm.
132. Cardinal, J., et al., Multistage formulation containing a biguanide and a thiazolidinedione derivative. 2005, Google Patents.
133. Ford, J.L., A.F. Stewart and J.L. Dubois, The properties of solid dispersions of indomethacin or phenylbutazone in polyethylene glycol. Int J Pharm, 1986. 28(1): p. 11-22.
134. Waterman, K.C., J.T. Swanson, and B.L. Lippold, A scientific and statistical analysis of accelerated aging for pharmaceuticals. Part 1: accuracy of fitting methods. J Pharm Sci, 2014. 103(10): p. 3000-6.
135. Swarnakar, N.K., et al., Enhanced oromucosal delivery of progesterone via hexosomes. Pharm Res, 2007. 24(12): p. 2223-30.
136. Charoo, N.A., et al., Quality by design approach for formulation development: a case study of dispersible tablets. Int J Pharm, 2012. 423(2): p. 167-78.
137. Huang, J., et al., Quality by design case study: an integrated multivariate approach to drug product and process development. Int J Pharm, 2009. 382(1-2): p. 23-32.
138. Huang, J., C. Goolcharran, and K. Ghosh, A Quality by Design approach to investigate tablet dissolution shift upon accelerated stability by multivariate methods. Eur J Pharm Biopharm, 2011. 78(1): p. 141-50.
174
139. Patwardhan, K., et al., A quality by design approach to understand formulation and process variability in pharmaceutical melt extrusion processes. J Pharm Pharmacol, 2015. 67(5): p. 673-84.
140. Brncic, M., et al., Effect of twin-screw extrusion parameters on mechanical hardness of direct-expanded extrudates. Sadhana-Academy Proceedings in Engineering Sciences, 2006. 31: p. 527-536.
141. Chang, R.K., A.L. Chang, and W.H. Chong, Formulation and Regulatory Considerations for Development of a Drug Product with Abuse-Deterrent Properties. American Pharmaceutical Review, 2015. 18(4): p. 68-73.
142. Abuse-Deterrent Opioids - Evaluation and Labeling. 2015, Food and Drug Administration (FDA): Silver Springs, MD.
143. Akseli, I., et al., A quantitative correlation of the effect of density distributions in roller-compacted ribbons on the mechanical properties of tablets using ultrasonics and X-ray tomography. AAPS PharmSciTech, 2011. 12(3): p. 834-53.
144. Zhang, Y., et al., DDSolver: An Add-In Program for Modeling and Comparison of Drug Dissolution Profiles. The AAPS Journal, 2010. 12(3): p. 263-271.
145. Akaike, H., Citation Classic - a New Look at the Statistical-Model Identification. Current Contents/Engineering Technology & Applied Sciences, 1981(51): p. 22-22.
146. Zuo, J.Y., et al., Evaluation of the DDSolver Software Applications. Biomed Research International, 2014.
147. Koc, D., A. Dogan, and B. Bek, Bite force and influential factors on bite force measurements: a literature review. Eur J Dent, 2010. 4(2): p. 223-32.
148. Higuchi, T., Mechanism of Sustained-Action Medication. Theoretical Analysis of Rate of Release of Solid Drugs Dispersed in Solid Matrices. J Pharm Sci, 1963. 52: p. 1145-9.
149. Repka, M.A., et al., Pharmaceutical applications of hot-melt extrusion: Part II. Drug Dev Ind Pharm, 2007. 33(10): p. 1043-57.
150. Gryczke, A., Hot-Melt Extrusion Process Design Using Process Analytical Technology, in Melt Extrusion, M.A. Repka, Editor. 2013, AAPS. p. 397-431.
151. Hansen, C.M., The three dimensional solubility parameter and solvent diffusion coefficient - their importance in surface coating formulation. 1967, Copenhagen: Danish Technical Press.
152. Forster, A., et al., Selection of excipients for melt extrusion with two poorly water-soluble drugs by solubility parameter calculation and thermal analysis. Int J Pharm, 2001. 226(1-2): p. 147-61.
153. Hoy, K.L., Solubility parameter as a design parameter for water borne polymers and coatings. J. Coated Fabr., 1989. 19: p. 53-67.
154. Hoftyzer, P.J.a.V.K.D.W., Properties of polymers. 2nd ed. 1976, Amsterdam: Elsevier.
155. Confident Solvent Selection. [Web page] [cited 2014 October 26, 2014]; Available from: http://confidentsolventselection.com/about/solubility-parameters.html.