© 2015 the college board. the sat ® suite of assessments – modified for michigan using scores...
TRANSCRIPT
© 2015 The College Board.
The SAT® Suite of Assessments – Modified for MichiganUsing Scores and Reportingto Inform Instruction
6MODULE

© 2015 The College Board.
Module 1Key Changes
Module 2Words in Context and Command of Evidence
Module 3 Expression of Ideas and Standard English Conventions
Module 4Math that Matters Most ► Heart of Algebra► Problem Solving and Data Analysis
Module 5Math that Matters Most► Passport to Advanced Math► Additional Topics in Math
Module 6 The SAT Suite of Assessments: Using Scores and Reporting to Inform Instruction
Professional Development Modulesfor the Redesigned SAT®
© 2015 The College Board.
► Understand the reports and data provided by the SAT® Suite of Assessments
► Link data and reports to:
► Student support and intervention
► Monitoring of curriculum and instruction
► Development of school improvement goals
What is the Purpose of Module 6?
3

© 2015 The College Board.
Scores and Reporting Withinthe SAT® Suite of Assessments
CHAPTER
1
© 2015 The College Board.
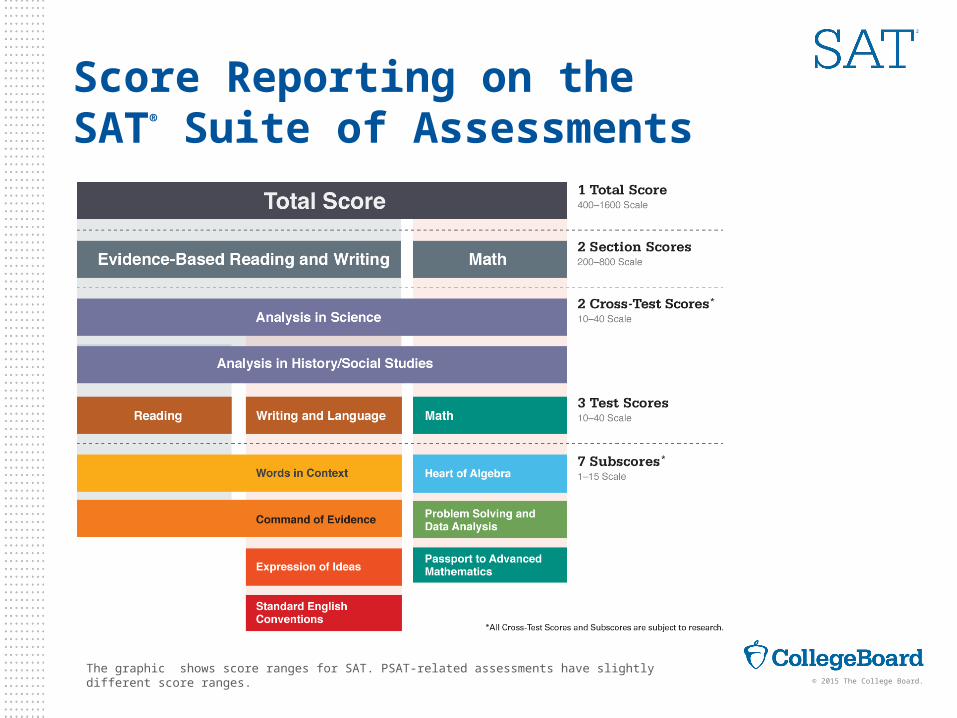
Score Reporting on theSAT® Suite of Assessments
The graphic shows score ranges for SAT. PSAT-related assessments have slightly different score ranges.
© 2015 The College Board.
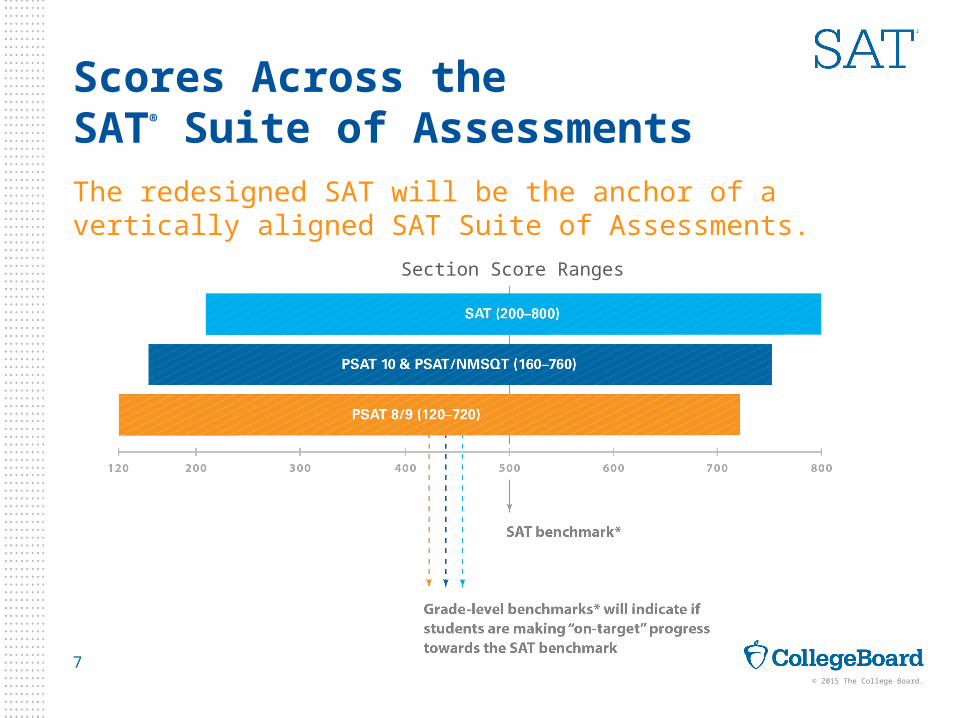
► Benchmarks indicating college and career readiness are determined usingSAT Suite data and first-year college performance data.
► The benchmark indicates that students who earn that score or higher have a 75% likelihood of earning a C or better in a first-year, credit-bearing course in the same subject area.
► The PSATTM 8/9 will provide benchmarks and norms for both 8th and 9th grades.
► PSATTM 10 will provide benchmarks and norms for 10th grade.
► The PSAT/NMSQT® will provide benchmarks and norms for 10th-and 11th-graders.
Working together, the tests in the SAT® Suite of Assessments provide college and career readiness benchmarks and consistent feedbackfor measuring student progress.
College and Career Readiness Benchmarks
6
© 2015 The College Board.
Scores Across theSAT® Suite of Assessments
The redesigned SAT will be the anchor of a vertically aligned SAT Suite of Assessments.
Section Score Ranges
7
© 2015 The College Board.
Vertical Score Scale
Total scores, section scores, test scores, and cross-test scoresare vertically scaled.
► Improved scores demonstrate growth from assessment to assessment.
► Vertical scaling allows educators to monitor growth across grades.
Subscores are not vertically scaled.
► Subscores provide information allowing students to pinpoint areas for improvement.
► Improved scores do not demonstrate growth from assessment to assessmentat the subscore level.
8
© 2015 The College Board.
Online Reporting Portal
New online reporting portal:
► Easy accessibility via your College Board account login to score reports for allSAT® Suite assessments
► Interactive features for educators (e.g., sorting, filtering)
► Counselor Registration and Score Roster access
► Ability to batch print:
► Student score reports
► Score labels
► SAT admission tickets
► Enhanced data and drill-down capabilities
► “Search” functionality and ability to configure groups of your students
9
© 2015 The College Board.
Using SAT® Suite of Assessments Standard Reports
► Reports for Student Intervention — Support and Acceleration
► Reports to Inform Curriculum and Instruction
► Reports for School Improvement Planning
10
© 2015 The College Board.
Reports for Student InterventionSupport and Acceleration
2CHAPTER
© 2015 The College Board.
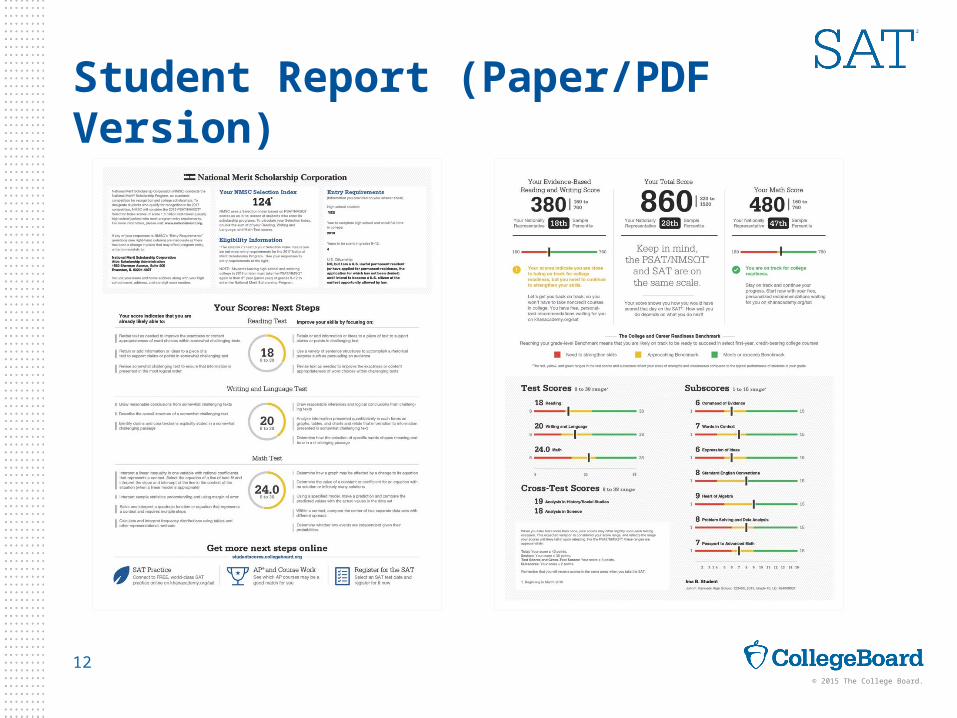
Student Report (Paper/PDF Version)
12
© 2015 The College Board.
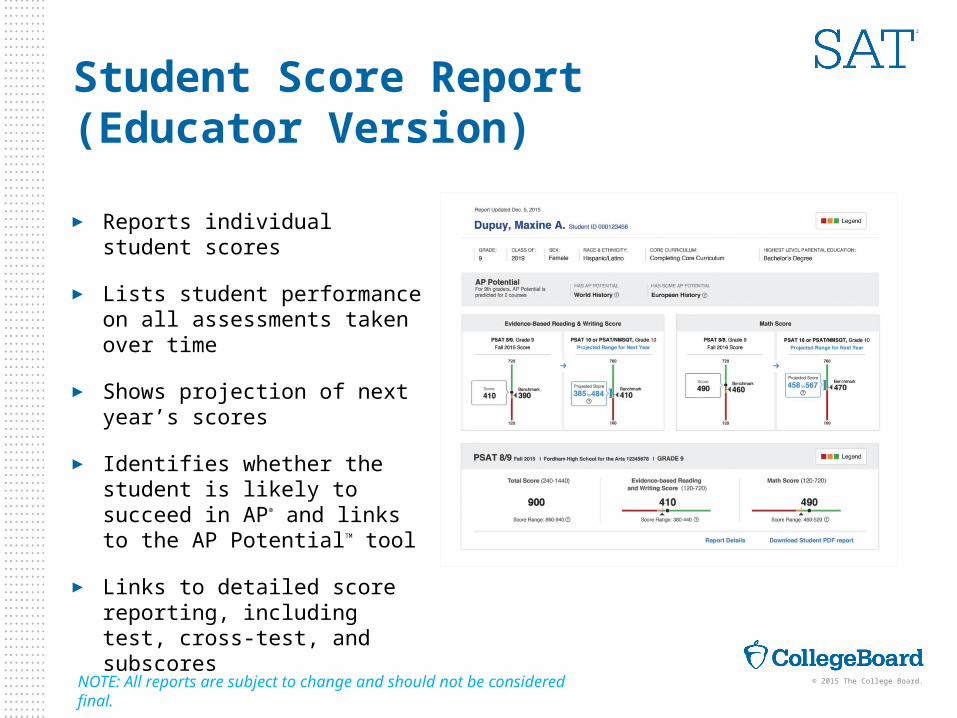
Student Score Report(Educator Version)
► Reports individual student scores
► Lists student performance on all assessments taken over time
► Shows projection of next year’s scores
► Identifies whether the student is likely to succeed in AP® and links to the AP PotentialTM tool
► Links to detailed score reporting, including test, cross-test, and subscores
NOTE: All reports are subject to change and should not be considered final.
© 2015 The College Board.
Use projection information in the report to categorize students based on the likelihood of meeting the benchmark.
► For those who need to strengthen skills to meet college and career benchmarks, develop an acceleration plan.
► For students who are close to meeting the benchmark, click through to the PDF version of the Student Report to identify particular areas to practice.
► For students who have met or exceeded the benchmark, ensure students are taking challenging courses, including Advanced Placement®, and provide challenging assignments to expand on their knowledge and skills.
Using the Student Score Report
14
© 2015 The College Board.
1. Determine students’ current status.
2. Set attainable goals toward meeting/exceeding benchmarks.
3. Guide students to targeted practice.
4. Measure progress.
5. Meet the benchmark!
Making Information Work for Youand Your Students
15
© 2015 The College Board.
Reports to Inform Curriculum and Instruction3
CHAPTER
© 2015 The College Board.
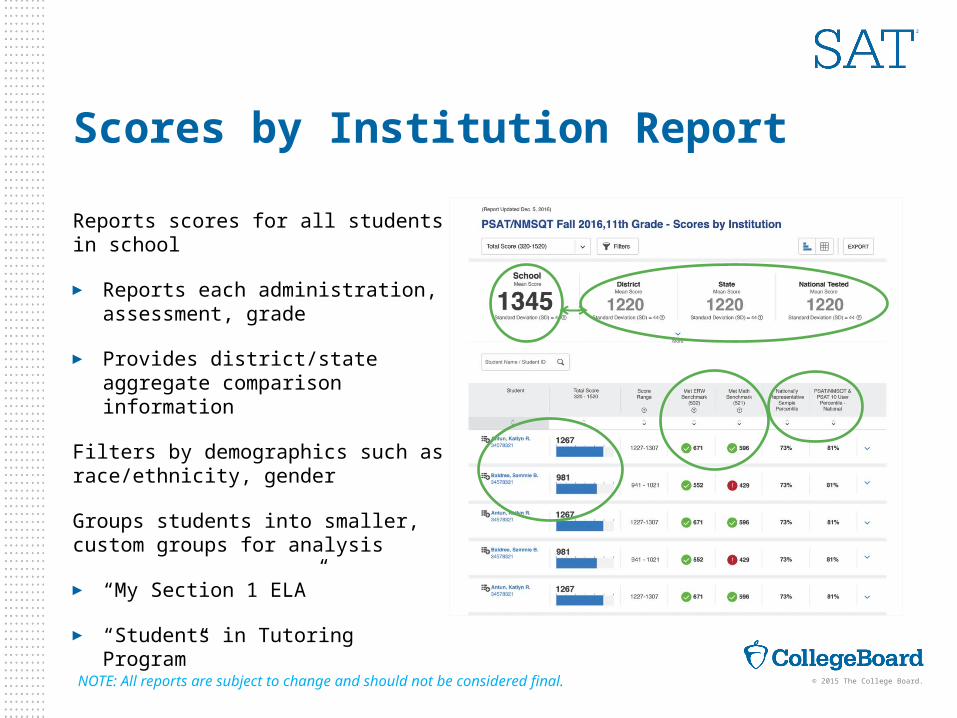
Scores by Institution Report
Reports scores for all students in school
► Reports each administration, assessment, grade
► Provides district/state aggregate comparison information
Filters by demographics such as race/ethnicity, gender
Groups students into smaller, custom groups for analysis
► “My Section 1 ELA”
► “Students in Tutoring Program”
NOTE: All reports are subject to change and should not be considered final.
© 2015 The College Board.
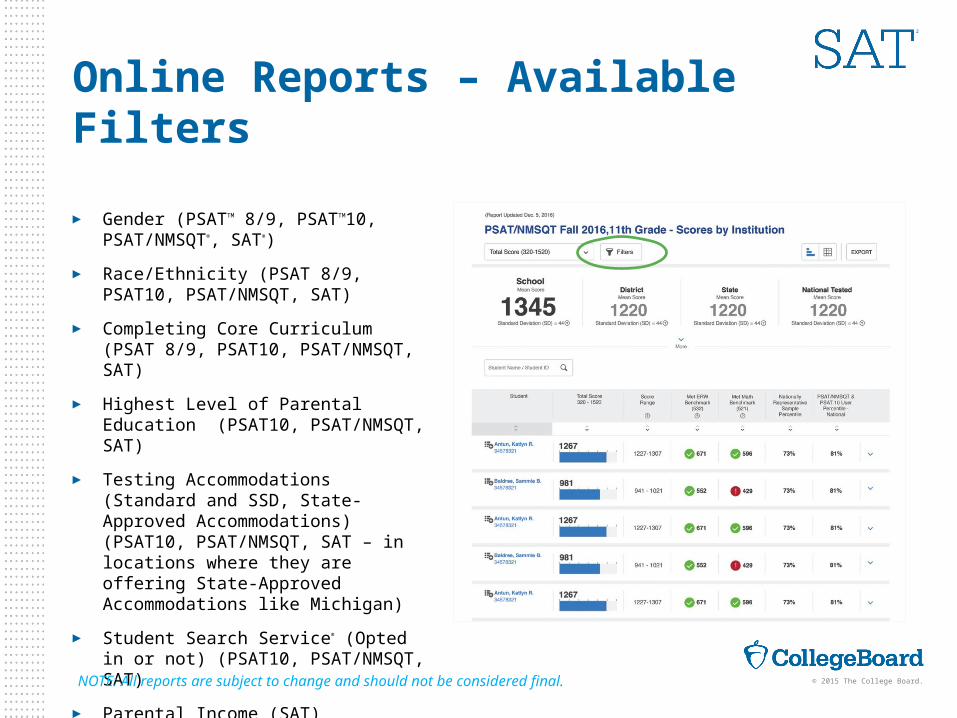
Online Reports – Available Filters
► Gender (PSATTM 8/9, PSATTM10, PSAT/NMSQT®, SAT®)
► Race/Ethnicity (PSAT 8/9, PSAT10, PSAT/NMSQT, SAT)
► Completing Core Curriculum (PSAT 8/9, PSAT10, PSAT/NMSQT, SAT)
► Highest Level of Parental Education (PSAT10, PSAT/NMSQT, SAT)
► Testing Accommodations (Standard and SSD, State-Approved Accommodations) (PSAT10, PSAT/NMSQT, SAT – in locations where they are offering State-Approved Accommodations like Michigan)
► Student Search Service® (Opted in or not) (PSAT10, PSAT/NMSQT, SAT)
► Parental Income (SAT)
► Fee Waiver Used (SAT)
NOTE: All reports are subject to change and should not be considered final.
© 2015 The College Board.
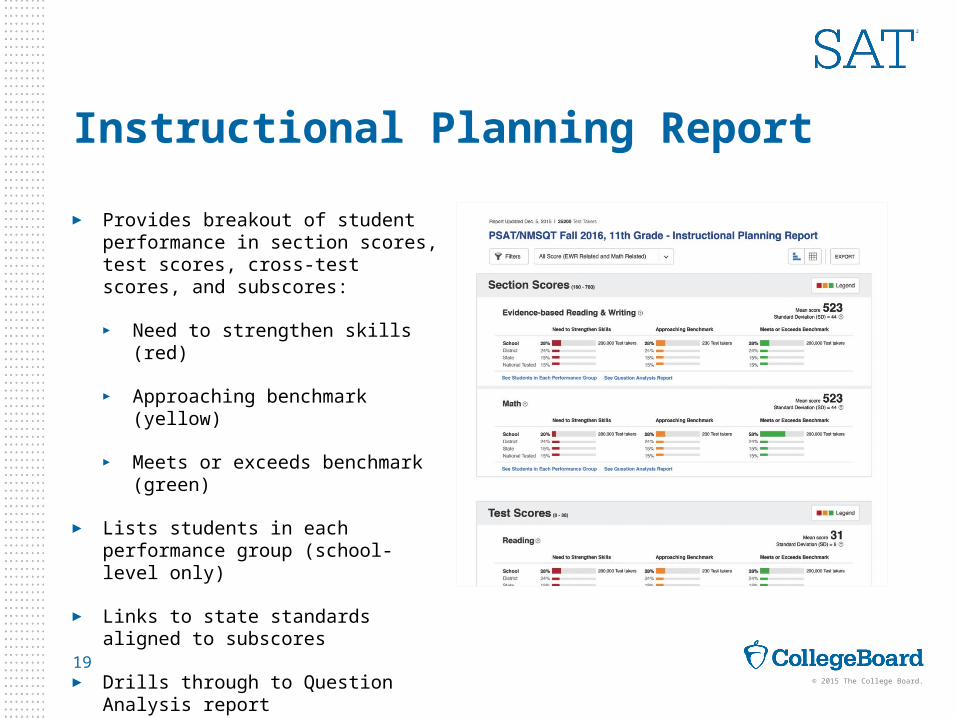
Instructional Planning Report
► Provides breakout of student performance in section scores, test scores, cross-test scores, and subscores:
► Need to strengthen skills (red)
► Approaching benchmark (yellow)
► Meets or exceeds benchmark (green)
► Lists students in each performance group (school-level only)
► Links to state standards aligned to subscores
► Drills through to Question Analysis report
► Exports reports to PDF or .xls files19

© 2015 The College Board.
Using the Instructional Planning Report
1. Determine areas in which students are meeting and exceeding college and career readiness benchmarks.
2. Compare areas to curriculum pacing maps, instructional strategies, and common assessments.
3. Consider what is helping students to be successful in these areas:
1. Time-on-task?
2. Spiraled learning opportunities?
3. Questions align to those used on common assessments for practice?
4. Compare these processes with those in content areas in which students are less successful as indicated by the reports. Identify possible processes for improvement in less successful areas.
5. Collaborate to design common activities, assignments, and assessments that build skills from year to year.
20

© 2015 The College Board.
Question Analysis Report
► Provides performance, by question
► For disclosed forms:*
► Provides individual answer choice performance
► Links to actual question content (including answer explanations)
► For nondisclosed forms:*
► Provides percent correct/incorrect
► Does not provide question content
► Links to individual student performance
► Links to subscores and state standards aligned to subscores
*PSATTM 8/9 is a nondisclosed form in 2015-16. PSATTM 10 and April SAT® School Day are disclosed forms.
NOTE: All reports are subject to change and should not be considered final.

© 2015 The College Board.
Using the Question Analysis Report
Understand what each question reveals about student learning.► Consider whether students struggle with particular types of questions.
► Diagnose errors in student choices by understanding the distractors.
Use difficulty indicators to determine the level of question with which students are struggling.► All types: Are students exposed to this content in class?
► Hard questions: How can you raise the level of challenge in class?
Look for opportunities for skill reinforcement in science andsocial studies courses. ► Identify questions linked to the cross-test scores.
► Ensure students have the opportunity to practice analysis skills in content-area courses.
22

© 2015 The College Board.
Reports for School Improvement Planning4
CHAPTER
© 2015 The College Board.
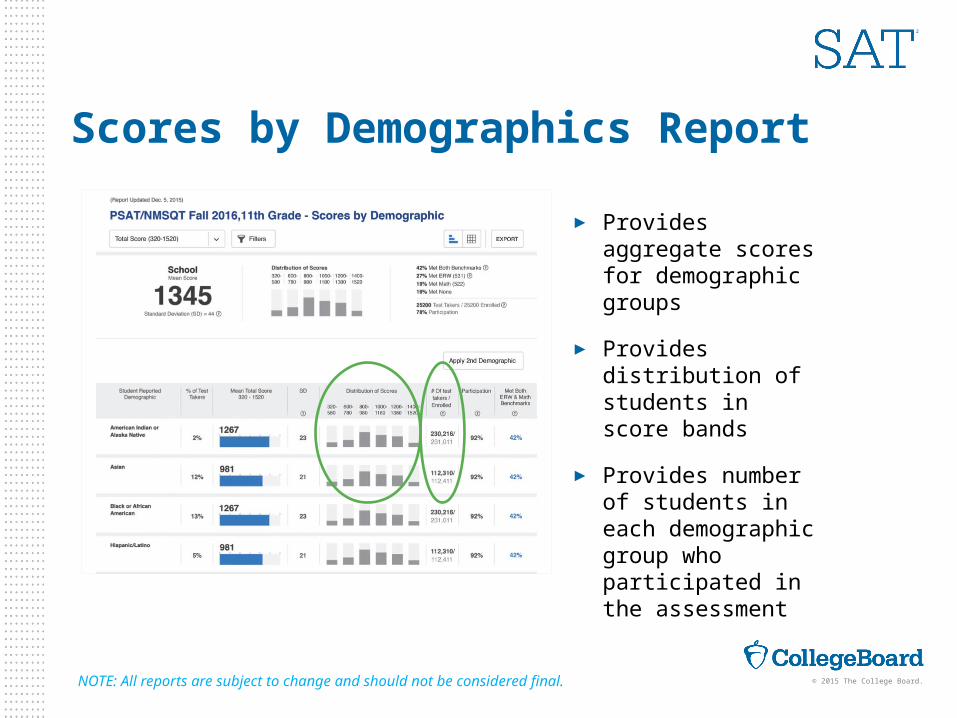
Scores by Demographics Report
► Provides aggregate scores for demographic groups
► Provides distribution of students in score bands
► Provides number of students in each demographic group who participated in the assessment
NOTE: All reports are subject to change and should not be considered final.
© 2015 The College Board.
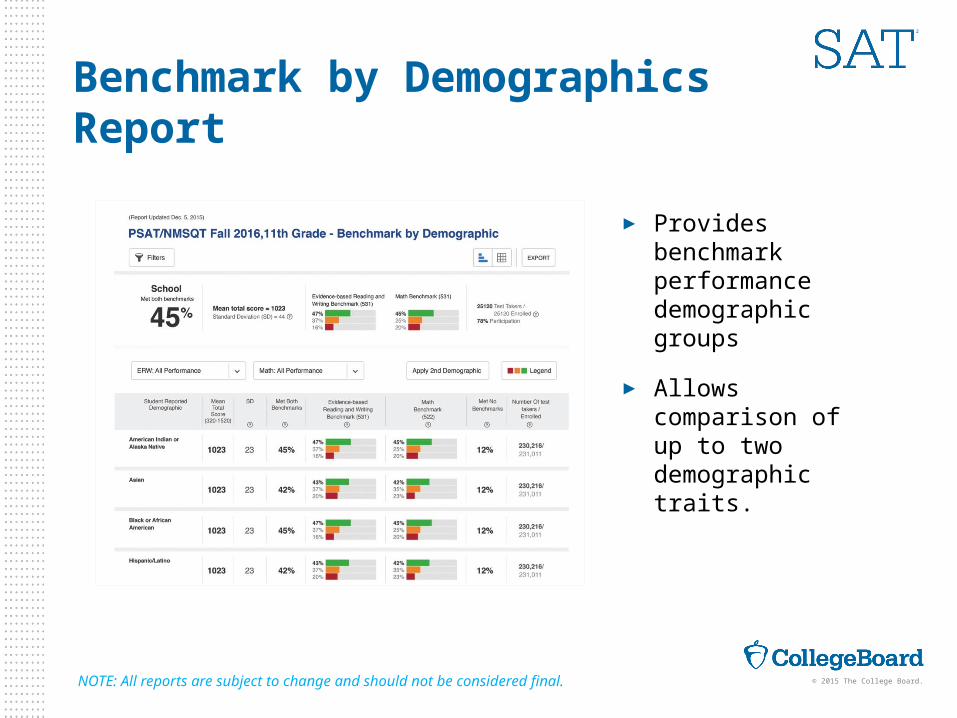
Benchmark by Demographics Report
► Provides benchmark performance demographic groups
► Allows comparison of up to two demographic traits.
NOTE: All reports are subject to change and should not be considered final.
© 2015 The College Board.
Determine whether any subgroups are underperforming:
► Compare average scores and benchmark performance for all students and each demographic group.
► Use the average score/benchmark performance as a baseline for developing school improvement goals.
Ensure that all students have similar participation rates and equalaccess to assessments.
► Develop school improvement goals focused on participation rates.
Using the Scores by Demographics and Benchmarks by Demographics Reports
26
© 2015 The College Board.
Protocols forData Analysis5
CHAPTER

© 2015 The College Board.
Protocols for Data Analysis
► Provide guidance and structure for data discussions
► Encourage every participant to share data insights
► Manage time
► Allow deep development of ideas
► Build collaboration
28
© 2015 The College Board.
29
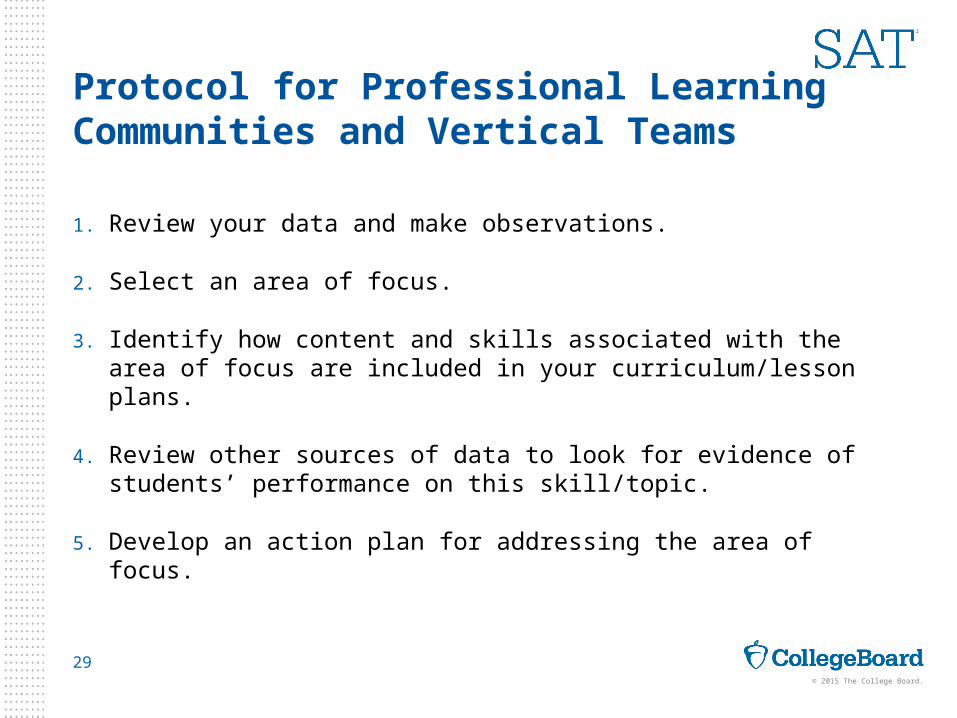
Protocol for Professional Learning Communities and Vertical Teams
1. Review your data and make observations.
2. Select an area of focus.
3. Identify how content and skills associated with the area of focus are included in your curriculum/lesson plans.
4. Review other sources of data to look for evidence of students’ performance on this skill/topic.
5. Develop an action plan for addressing the area of focus.
© 2015 The College Board.
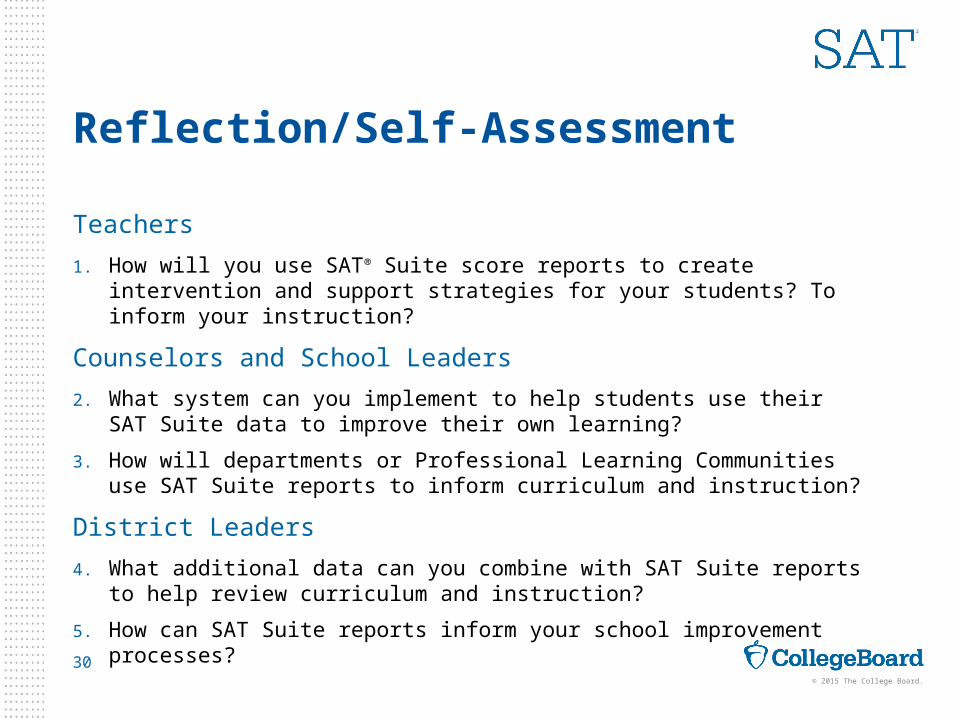
Reflection/Self-Assessment
Teachers
1. How will you use SAT® Suite score reports to create intervention and support strategies for your students? To inform your instruction?
Counselors and School Leaders
2. What system can you implement to help students use their SAT Suite data to improve their own learning?
3. How will departments or Professional Learning Communities use SAT Suite reports to inform curriculum and instruction?
District Leaders
4. What additional data can you combine with SAT Suite reports to help review curriculum and instruction?
5. How can SAT Suite reports inform your school improvement processes?
30
© 2015 The College Board.
More Information
► Redesigned SAT® Teacher Implementation Guide
► Using Scores and Reporting to Inform Instruction
See both guides at
collegereadiness.collegeboard.org/educators/k-12
31

© 2015 The College Board.
► surveymonkey.com/s/PD_Module_6
Exit Survey
32