· 2016-12-30 · store format selection (ebo vs mbo) for sportswear and sports accessories in...
TRANSCRIPT
ELK ASIA PACIFIC JOURNAL OF MARKETING AND RETAIL MANAGEMENT
ISSN 2349-2317 (Online); DOI: 10.16962/EAPJMRM/issn. 2349-2317/2015; Volume 7 Issue 4 (2016)
www.elkjournals.com
……………………………………………………………………………………………………………
OFFLINE RETAIL ENTRY STRATEGY: A STUDY ON THE FACTORS EFFECTING
STORE FORMAT SELECTION (EBO VS MBO) FOR SPORTSWEAR AND SPORTS
ACCESSORIES IN TIER-III CITY OF INDIA (SHILLONG)
Arnab Banerjee
Assistant Professor, National Institute of
Fashion Technology, Shillong, India
Corresponding Author email:
Nayanika Barman,
National Institute of Fashion Technology,
Shillong
Email: [email protected]
Abhilekh Aggarwal,
National Institute of Fashion Technology,
Shillong
Email: [email protected]
Deep Sagar Verma
Assistant Professor, National Institute of
Fashion Technology, Jodhpur, India
Email: [email protected]
ABSTRACT
Tier 3 cities of India are home to one of the fastest growing socio-economic powers in the world especially in the
fashion retailing sector. The current study investigates the factors that should be considered critical by new entrants
while entering a new Tier-III Indian market. The study carries out 129 successfully structured mall-intercept interviews
in the town of Shillong, Meghalaya in an attempt to understand the SBO and MBO shoppers. The research primarily
relies on Factor Analysis and Multivariate regression to comment on the similarities among the various types of
customers and critical variables for those customers that needs to be referred to by new entrants. Demographic
variables itself do not show any store format preference although discounts do attract the lower income group more
while clear difference is observed among genders when it comes to importance of ambience, and it is more pronounced
for SBO patrons. SBO patrons are more focused while MBO patrons are more into leisure shopping. Price is the most
important predictor of satisfaction especially for MBO shoppers. The market shows three basic segments i.e
experiential, relationship and value shoppers.
Key words: Store Format; EBO vs MBO; Factor Analysis
1. Introduction
Exclusive Brand Outlets (EBOs) is a retail
outlet format where the store only houses
products from a single brand or maker, on the
contrary Multi-Brand Outlet (MBO) is a
retail set up where various brands are stored.
These are two of the most preferred offline
store format, especially for fashion brands.
The retail industry, world over, accounts for
over USD 15 trillion in global revenues
(Global Retail Report, 2013) which is almost 8

ELK ASIA PACIFIC JOURNAL OF MARKETING AND RETAIL MANAGEMENT
ISSN 2349-2317 (Online); DOI: 10.16962/EAPJMRM/issn. 2349-2317/2015; Volume 7 Issue 4 (2016)
…………………………………………………………………………………………………………
times the nominal GDP of India (1.842 trillion
USD, 2012). India housing 17% of world
population only accounts for 3.25% of
Worldwide Retail revenues (Technopak
Analysis, 2013). Indian Fashion retail
(including apparel, jewelry/watches and
footwear) accounts for about 15% (8%, 6%
and 1% respectively) of the total retail
revenues in India i.e. approximately USD 73
billion per year (Technopak Analysis, 2013).
After adjusting for purchasing power an
average Indian just spends $88 on apparels,
which is only half of the world average. All of
it implies a tremendous potential in the
Fashion and Retail Sectors of India. While the
above has been well accepted globally, the
question on the correct entry strategy to the
Indian Market, especially the Tier III city
markets, which houses a majority of the
growing Indian Population, remains under
scrutiny. The current paper intends to throw
some light on the variables that needs to be
considered while entering Tier III cities of
India. Here we also try to understand the basis
on which the clientele can be divided, so that a
retailer may have a more focused approach
while deciding on the store format, that is
which format suits what kind of clients.
2. Objective
The objective of the current study is to
understand “As far as store format goes,
between SBOs and MBOs, which format
gives a greater scope for business in Tier III
cities?”
The comparison was made on the following
major aspects:
What demographic Profile is attracted
by each format? Is there any difference
between the two? Can we predict
based on the demographic profile,
what kind of store are they likely to
visit when they intend to buy a
product (purposive).
What are the most important factors
that customers consider while deciding
on the shop they want to visit? Are
they same or different for both the
retail formats?
What factors predict the customers
overall satisfaction levels greatest with
a retail outlet. Are they same or
different for both the retail formats?
3. Literature Review
Retail shopping has been studied from a
number of different perspectives. Messinger
and Narsimhan (1997) studied store choice
behavior and found that utility-maximization
in terms of the number of interdependent
variables are the core factors influencing the
store choice format. Sinha and Banerjee
(2004) found that the evolution of the markets
have a direct relation to store format choice
behavior, while Waterschoot et.al (2008)
ELK ASIA PACIFIC JOURNAL OF MARKETING AND RETAIL MANAGEMENT
ISSN 2349-2317 (Online); DOI: 10.16962/EAPJMRM/issn. 2349-2317/2015; Volume 7 Issue 4 (2016)
…………………………………………………………………………………………………………
found that it is the shopping situation that
impacts store selection. Marketing policies of
the retailer’s along with certain demographic
characteristics of the shoppers also affect store
choice (Fox et al., 2004). Among some of the
other variables that influences store selection
is availability of time for shopping, the
pressures perceived by the customer in the
store (Iyer, 1989) comparison of prices
(Kolodinsky, 1990) and number of categories
of the retail outlet vs the convenience in terms
of time saving (Messinger and Narsimhan,
1997). Thill and Thomas (2010) found that for
the customers who are sensitive to time and
money, location of the store heavily impacts
the store choice behaviour. Store choice
selection has a cognitive as well as affective
component to it (Sproles and Kendall, 1986).
This implies that consumers have different
styles of store selection for different products
since different products will have different
characteristics. Which in turn means that, their
attitude towards store format selection can not
be the same for different kinds of products?
Hence the demographics of the consumer play
an extremely significant role in store choices
(Kenhove et al., 1999). Thus, decision style
towards different products is very consumer
specific and reflects his mental orientation.
Gender has an important effect on consumer
choices. While males perceive threat from
intimacy females perceive threat from
separation (Prakash and Flores, 1985). There
is a psychological difference between gender
which may determine the extent of
involvement and attitude towards an
advertisement and subsequently attitude
towards the brand (Prakash and Flores,1985).
In terms of environmental factors, men are
more aware while making purchases
(Mohammed Mostafa,2007). In a separate
study (Basu, Sengupta and Guin, 2012) it was
found that males exhibit greater affinity
towards Multi Brand Outlet while females are
more inclined towards Single Brand outlets
and this phenomena has been explained by the
patriarchal society of India where the
shopping behavior are more leisure based
while that of females are more towards
specific needs based.
Age also has been found as a factor that causes
people not to select/ reject a particular retail
format-both online as well as certain physical
ones, especially among the older population
(Mącik, Mącik and Nalewajek, 2013). Age
wise analysis shows distinct choice pattern
and the distinction becomes more spelt with
older people as far as the choice between
single and multi brand outlet is concerned
(Basu, Sengupta and Guin, 2014). The above
45 years age category shows a higher
preference for the single brand store to the
multi-brand option (Basu, Sengupta and Guin,
2014).

ELK ASIA PACIFIC JOURNAL OF MARKETING AND RETAIL MANAGEMENT
ISSN 2349-2317 (Online); DOI: 10.16962/EAPJMRM/issn. 2349-2317/2015; Volume 7 Issue 4 (2016)
…………………………………………………………………………………………………………
As far as income is concerned Basu, Sengupta
and Guin (2014) found that the monthly
personal income has a great deal more impact
on store choice behavior. Also they found that
< 20,000 per month are the ones with lesser
affinity towards Multi Brand Formats, while
the 20,000 per month and above classes have
higher affinity towards Multi Brand Formats
than their respective SBPs.
In addition to demographics a number of
factors are to be considered to understand
what attracts and causes purchase from a
particular store format while rejecting the
others. The emotional status of a customer
such as pleasure, arousal or dominance (PAD)
subsequently leading to approach or avoidance
behavior can be explained using
environmental psychology which basically
deals with customer interaction with
environmental cues and stimulus (Mehrabian,
Russell and Russell, 1974; Donovan, 1994).
Factors such as store ambience consisting of
lighting, air quality, interior design, store
fragrance open space among others bring
about cognitive, affective, physiological and
behavioral reactions (Heide and Gronhaug,
2006).
Customer service also is a factor that has some
impact on the store format selection as it
determines the overall shopping experience.
After sales services, exchange return facility,
attending customer complaints,
knowledgeable staff was found to be some
major indicators of customer service (Jain and
Bagdare, 2009).
Interestingly through price discounts and
offers, perception of value and interests in
product also increases, although these
increases are no greater for prestigious stores
than that offered by less prestigious store,
which indicates that today’s savvy consumers
have become so price conscious and
knowledgeable about competitive pricing that
the image of the store and price discounts
from the past don’t have much of an effect on
their reference point and hence no effect on
their store selection(Wu, Petroshius and
Newell, 2004). The above also holds for
frequency of price discounts that is, a store
with seldom price discounts don’t hold an
edge over stores that frequently give price
discounts (Wu, Petroshius and Newell, 2004).
Conventionally, marketing places a high level
of importance on nature, type, quality and
variety of the product offered in store for the
success of any store format and in order to
fulfil basic shopping motives the store also
must have wide assortment of products from
preferred brand with latest style and design
(Jain and Bagdare, 2009).
Also the features of a great store include
visual simplicity and transparency including
navigational tools (Burke, 2005). A
framework for considering the various bases

ELK ASIA PACIFIC JOURNAL OF MARKETING AND RETAIL MANAGEMENT
ISSN 2349-2317 (Online); DOI: 10.16962/EAPJMRM/issn. 2349-2317/2015; Volume 7 Issue 4 (2016)
…………………………………………………………………………………………………………
and methods available for conducting
segmentation studies has been discussed by
Michel and Kamakura (2000).
Based on the above researches and the
mentioned objectives the following hypothesis
statements needs to be tested so as to
understand whether different store formats
attract different types of customers and if so
what are those differentiating factors, for
SBOs vs MBOs
1. Hoa : There is no impact of gender in
store format selection
2. Hob : Age groups do not impact store
format selection
3. Hoc : Employment status does not
impact store format selection
4. Hod: Annual Household income does
not impact store format selection
5. Hoe: Individuals patronizing a
particular format can be discriminated on the
basis of the factors on which they lay
greater importance
6. H0f : Individuals patronizing different
store formats lay greater importance on
differing factors when it comes to their
satisfaction levels
4. Methodology
This is a descriptive research study done in the
city of Shillong, Meghalaya which is
considered to be the fashion capital of India,
across two stores consisting of similar
merchandise that is sport wear with special
weightage to footwear. The stores that have
been selected primarily house similar products
so as to assure there is no major difference in
the clientele on the basis of the nature of the
product. The sampling method basically
followed is non-random sampling. At first a
quota for the various subgroups was pre-fixed
followed by mall intercept method wherein the
various subgroups were interviewed through
structured questionnaires.
There were essentially 3 subgroups formed
based on their patronization of a store and on
whether they were purposive or non
purposive. So the three subgroups that were
formed were Purposive patrons, Purposive non
Patrons, and Browsers. Purposive Patrons are
those who have purchased some product and
do so consistently from one of the two stores
(i.e SBO or MBO). Purposive non-patrons are
those customers who have purchased some
product, but do not patronize any one of the
two stores in particular and hence may
purchase from either one, based on some of
the factors affecting their purchase behavior.
Browsers are the customers who are visiting
the store just to browse through the
merchandise without making any purchase.
The framework of the design can be
understood through the following diagram: (as
suggested by Barman and Aggarwal, 2014)

ELK ASIA PACIFIC JOURNAL OF MARKETING AND RETAIL MANAGEMENT
ISSN 2349-2317 (Online); DOI: 10.16962/EAPJMRM/issn. 2349-2317/2015; Volume 7 Issue 4 (2016)
…………………………………………………………………………………………………………
The purpose of the classification is to actually
be able to differentiate between the customers
exhibiting varying patronage and understand
what causes their patronage to vary. Also
through the classification we may pin point the
factors which may predict the variation in
patronage and the factors a store should work
on to increase their patronage. (Refer Fig.1 or
2) (Refer Table 1)
Thus the total sample size is 129 across two
store formats and across 3 sub-groups. The
study dealt with understanding the impact of 8
carefully chosen variables on a consumer’s
patronage behavior towards either an SBO
(EBO) or an MBO, so as to accumulate vital
information on what causes format
patronization. Also these 8 variables have
been used to understand, which one of the
variables has a clear impact on the overall
satisfaction level of a consumer while
shopping. The variables have been evaluated
against a 5 point Likert scale, on agreeability
to understand the importance of each variable
on shopping choices (Completely Agree=1
and Completely Disagree=5); and in order to
understand the impact on overall satisfaction,
the variables are evaluated on a 5 point Likert
scale ranging from Extremely Satisfied (1) to
Not at All Satisfied (5)
5. Discussion
Each of the shoppers were asked their degree
of importance of 8 different factors on a Likert
scale indicating how important each of those
factors were in selecting the store for
shopping. The idea was to bottle down a few
types of shoppers and their shopping
preference. Hence a factor analysis was
performed to narrow in on those few
components that bring certain types of
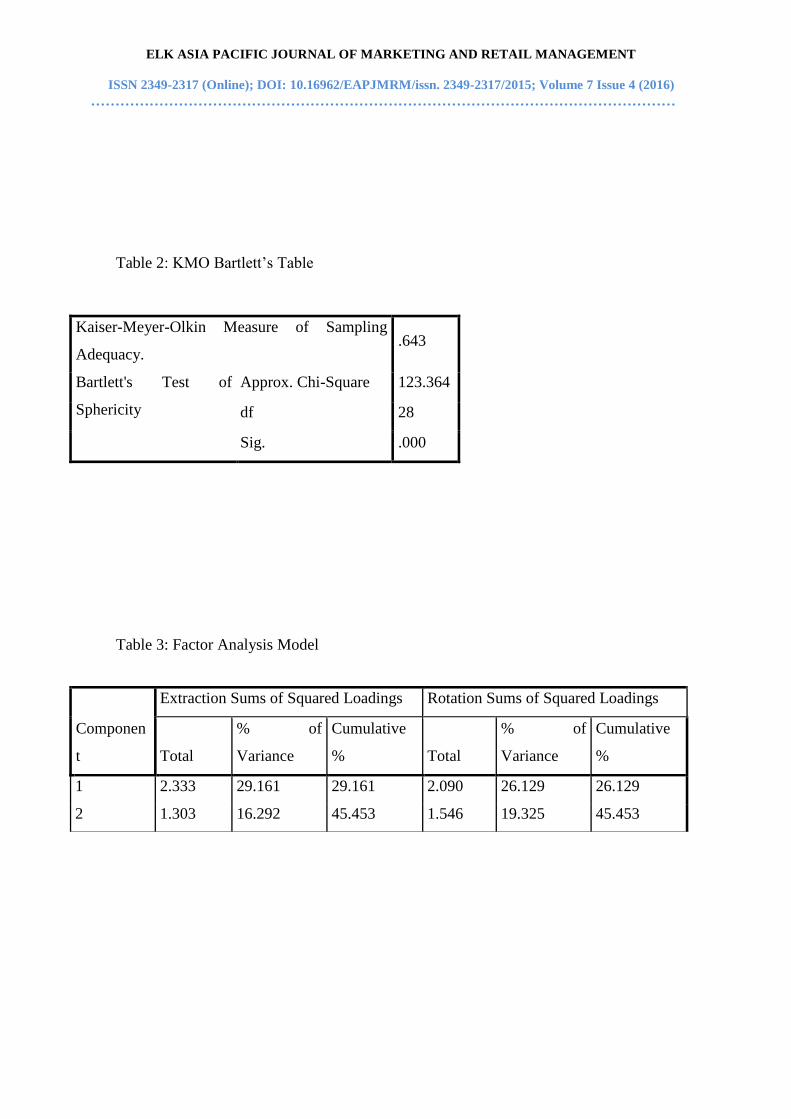
shoppers together. However at first to find the
appropriateness of a factor analysis on the
data, the KMO and Bartlett’s test was
performed: (Refer Table 2)
A value of 0.63 for KMO coupled with sig.
value of 0.000 for Bartlett’s clearly indicates
the appropriateness of Factor Analysis. (Refer
Table 3). The model clearly indicates the
emergence of two dominant components of
importance a consumer prefers. Both these
Components put together depict 45.45% of
variance with the first component accounting
for 29% and second component accounting for
19.32%. (Refer Table 4)
Component 1 depicts underlying variables
such as ambience, brand, assortment,
merchandise and sales staff attention thus all
having an inclination towards leisure
shopping. On the other hand Component 2
has a greater inclination towards utility
shopping with underlying variables such as
price, discount and quality of products.
Attitude Pattern
The attitude of the respondents were analysed
to understand on whether there is any

ELK ASIA PACIFIC JOURNAL OF MARKETING AND RETAIL MANAGEMENT
ISSN 2349-2317 (Online); DOI: 10.16962/EAPJMRM/issn. 2349-2317/2015; Volume 7 Issue 4 (2016)
…………………………………………………………………………………………………………
significant impact of demographic factors on
store format selection (patronage).
Hoa: There is no impact of gender on store
format selection or patronage as the
Pearson’s Chi Square Coefficient value is
0.237 which has a significance (p) of 0.994.
Hob: Age groups do not impact store format
selection: With a Chi square value of 27.425
and corresponding p value of 0.124 even age
fails to effect store patronage
Hoc: Employment status does not impact store
format selection: Chi square value for the test
between qualification and patronage shows p
value of 0.241 and hence here to there is no
statistically valid relation between the two.
Hod: Annual Household income did not
impact store format selection: For the annual
household income vs patronage cross tab
there appears to be a relationship at 10%
significance level as the p value turns out to
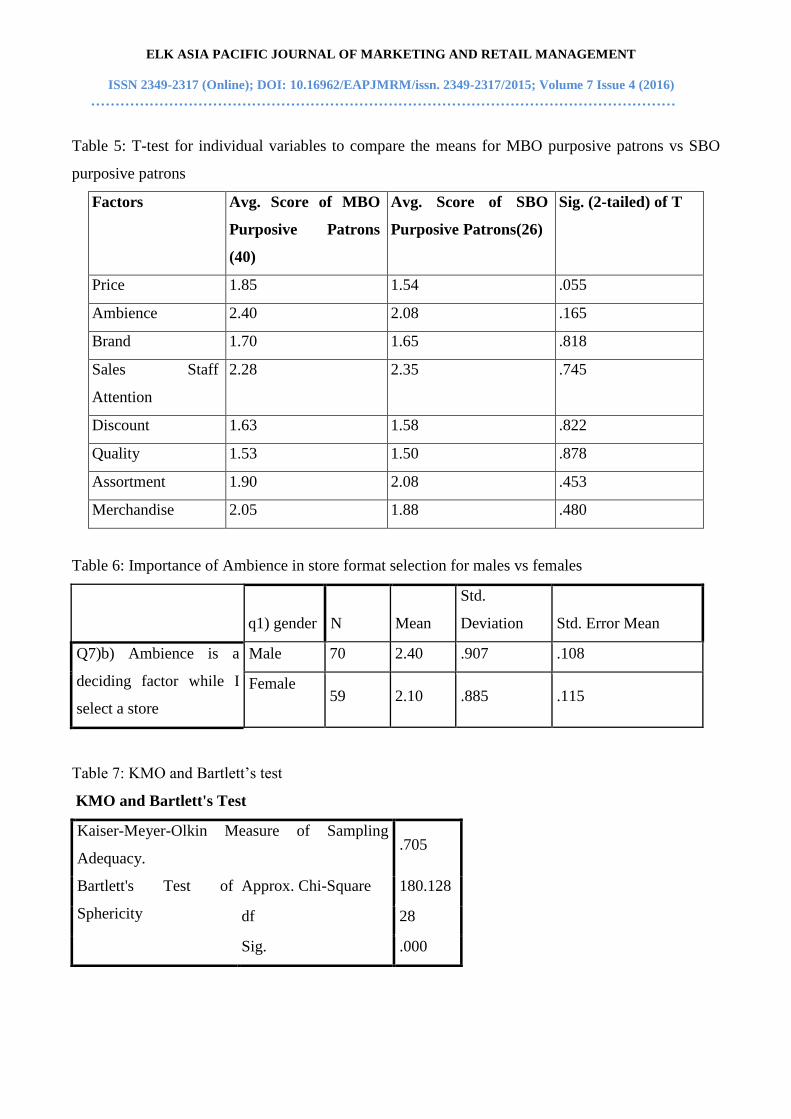
0.078. (Refer Table 5)
(1= Extremely Important; 2=Important; 3=
Neutral; 4=Not Important; 5= Not at all
Important)
In the above table, the comparison depicts
that there is marginal difference at 10%
significance level between SBO and MBO
Purposive Patrons for the variable price,
which means that MBO purposive patrons
give lesser importance to price than SBO
purposive patrons. This could be explained
by the assumption that people visiting MBO
are more into leisure shopping and those into
SBO are more into focused shopping and thus
are price sensitive.
Among the 8 variables under study only
ambience seems to be the factor that has
differential importance between the genders,
with the females showing a much
significantly greater importance at 10%
significant towards it with p equal to 0.062 as
depicted in the below table. This could
probably draw from the idea that peripheral
cues are more important for female shoppers.
This can indicate that stores which are mainly
designed for male visitors may focus a little
lesser on ambience than the once that are
predominantly designed for the females.
(Refer Table 6)
The above becomes more pronounced when
only the SBO purposive patrons are studied in
solitude. With a sig. value of 0.045 for
ambience, the females patronizing SBOs give
even greater importance to ambience than the
males patronizing SBOs. It thus is indicative
of the fact that for SBOs catering
predominantly to females, ambience becomes
all the more important than those serving to
males only. In addition to ambience, for SBO
purposive patrons, even quality of product
shows significantly (p= 0.067) different
importance among the genders with the

ELK ASIA PACIFIC JOURNAL OF MARKETING AND RETAIL MANAGEMENT
ISSN 2349-2317 (Online); DOI: 10.16962/EAPJMRM/issn. 2349-2317/2015; Volume 7 Issue 4 (2016)
…………………………………………………………………………………………………………
females giving significantly greater
importance to quality.
When it comes to discount or assortment,
there seems to be heterogeneity in the
variances among the various groups in terms
of patronage with the Levene statistic of 3.064
and 8.297 corresponding to significance of
0.019 and 0.000. This indicates that ANOVA
on the two parameters or variables of discount
and assortment across the patronage group
will not yield any useful results.
The one factor that reveals a great deal of
importance when it comes to the difference
between the various patronage groups is price
with the F value of 4.470 (p=.002).On
performance of a post hoc analysis by means
of a l.s.d, clear difference is observed by
between the Purposive Patrons of MBO and
Purposive patrons of SBO as well as
Purposive non-patrons of SBO. The means
plot for the same depicts that purposive non-
patrons SBO give least importance to price
while the purposive patrons of SBOs give the
greatest importance to price. This is an
interesting finding, considering the data was
collected from sportswear/ goods shops for
both SBO and MBO. This may indicate that
purposive patrons of SBOs may be more value
sensitive and feel that SBOs give them a
greater value for money. This also backs up
the idea that MBO patrons are more into
leisure shopping than SBO patrons who are
focused shoppers. Comparing the variables for
the SBO patron vs the MBO patron, there is
significant difference (p= 0.055) at 10%
significance level, between the importance
given to price for the two groups with a t value
of 1.957.
If we compare the various variables such as
price, discount etc. across income groups, it
appears that when it comes to price various
households belonging to various income
groups give differential importance to it,
however, if we look closer, Levene Test
indicates that there is far too much difference
among the variances of the various groups and
hence the observed difference across groups
are not reliable when it comes to price.
However, when it comes to discount, there
seems to be a clear difference across groups i.e
not all groups behave in the same way when it
comes to discounts. Means plot graph very
clearly depicts that people in the income
bracket of 1 to 2.5 lacs are a lot more sensitive
to discounts while its importance consistently
comes down among the higher income groups.
The above finding is a clear indicator that
higher prices with discount labels such as
“Sale” attracts the lower income strata a whole
lot more than merely giving low prices.
The Discriminating Variable
In order to understand which variables are
more important in discriminating the SBO and

ELK ASIA PACIFIC JOURNAL OF MARKETING AND RETAIL MANAGEMENT
ISSN 2349-2317 (Online); DOI: 10.16962/EAPJMRM/issn. 2349-2317/2015; Volume 7 Issue 4 (2016)
…………………………………………………………………………………………………………
the MBO patrons, a Discriminant analysis has
been performed. But before reading into the
Discriminant analysis we may look at the
variables such as Box’s M of 40.33 with p=
0.534 which tells us that the assumption of
covariance across groups is not true and hence
there is no problem with going ahead with the
Discriminant. The Discriminant analysis thus
performed gives a Discriminant function with
an Eigen value of 0.150 (p= 0.361) which
corresponds to a Canonical Correlation value
of 0.361, which means the that a meager 13%
of the variance of the dependent variable i.e
store patronage is explained by the given
model. Hence it won’t make much sense to
delve any deeper in the analysis. This is
supported by an insignificant Wilk’s Lambda
of 0.870 corresponding to significance of
0.398. Although the standardized canonical
Discriminant function coefficient as well as
the structure matrix point heavily towards
price as being the one determining variable for
patronage, along with ambience, we should
not rely on it as suggested by the previous
statistic of Eigen value, Wilk’s Lambda and
Cannonical Coefficient of the Discriminant
function. This could be an outcome of a
relatively small sample size.
The above finding about the data is further
supported by the classification matrix where
the model completely fails at predicting the
cross validated cases and in fact ends up
predicted with great deal of inaccuracy as the
proportion of off diagonal items exceed the
diagonal items, in spite of taking prior
probability measures that corresponds to
60.6% and 39.4% for MBO and SBO
purposive patrons respectively.
The Satisfaction factors
After a pilot survey, 8 variables were short
listed to gauge into the satisfaction levels of
the clients. Factor analysis was performed on
the eight variables to understand what is the
underlying factor binding the variables
together and also which of the variables play a
more important role in determining the
satisfaction levels of the customer. (Refer
Table 7)
KMO test gave a result of 0.705 and the
Bartlett’s test of sphericity gave a result of
180.128 with a significance of 0.000. Both the
results assure that running the factor analysis
will give good results. On extraction only 2
components of the eight gave an Eigen value
of greater than 1 and the corresponding
proportion of variance explained by these two
factors are 31.6% and 19.33% respectively. In
order to perform the Factor analysis to find out
the minimum number variables (dimension
reduction), Principal Component analysis was
used with Varimax rotation. (Refer Table 8)
Price, Quality, discount and assortment give
the highest factor loadings of 0.519, 0.660,
0.742 and 0.750 respectively. Hence they may
be assumed to be the more important factors.
ELK ASIA PACIFIC JOURNAL OF MARKETING AND RETAIL MANAGEMENT
ISSN 2349-2317 (Online); DOI: 10.16962/EAPJMRM/issn. 2349-2317/2015; Volume 7 Issue 4 (2016)
…………………………………………………………………………………………………………
On running a regression with all the eight
factors we get an adjusted R2 value of 12.5%;
that is all the eight variables put together just
explains 12.5% of the variance in the
independent variable. While if we consider
just the four above mentioned variables we are
still able to predict 11.6% of the variance in
the dependent variable. Although the model
does not give a great result, there is not much
predictability loss when we use just the four
variables instead of all eight. (Refer Table 9)
Out the four mentioned variables price has the
greatest Beta coefficient indicating that it has
the greatest impact on overall satisfaction
levels. However price also reflects a tolerance
towards collinerity of 87.9% which means that
about 12% of variance of price is impacted by
other variables, which is indicative of the fact
that price is not a completely independent
factor and hence retailers need to be careful
when it comes to deciding about the pricing as
it may lead to perceptions about other factors
such as quality (colinearity of -0.146).
However when regression for satisfaction is
run for the various patronage separately, the
model gives much diverse results. (Refer
Table 10) For MBOs the regression model
gives much better result than for SBO or even
all the variables put together. The model
explains 27.3% variance in the overall
satisfaction of the MBO patrons while the
variance explained by the same models for the
SBO patrons is insignificant. On running a
factor analysis in order to reduce the number
of predictors it is found that Assortment, price
and ambience itself accounts for 26.7% of the
variance in the overall satisfaction of the MBO
clientele and this is a significant result. Within
this model price with a Beta coefficient of
0.573 is the most significant predictor. No
such results are eminent for the SBO clientele.
This can mean that for the MBO clientele,
pricing is of great importance as they use
multiple reference point to get a good deal,
and often feel satisfied when they feel that
they have got the product at a reasonable
price. Ambience and assortment are the two
other factors that define the overall
satisfaction of the MBO patrons thereby
reconfirming the leisure shopping nature of
the patrons. Nothing concrete can be predicted
about the SBO patrons from the above model.
The above finding may appear to counter one
of the previous findings where the mean
importance of price for purposive patrons
MBO is much lower (1.85) than that of
purposive patrons SBO (1.54). However there
is a major difference between the two, as the
first question is on direct importance given to
each factor while store selection, while the
second question finds out which factor causes
greatest satisfaction and implies that getting a
good deal in terms of value and hence price in
an MBO is much more satisfying. (Refer
Table 11)
ELK ASIA PACIFIC JOURNAL OF MARKETING AND RETAIL MANAGEMENT
ISSN 2349-2317 (Online); DOI: 10.16962/EAPJMRM/issn. 2349-2317/2015; Volume 7 Issue 4 (2016)
…………………………………………………………………………………………………………
Factor analysis using Principal Axis Factoring
to find out the underlying parameters that are
common to each of the factor, indicates that
the people can be divided into three clear
categories that is, the people for whom
shopping is an experience and hence variables
like ambience, latest merchandise, brands and
assortment become extremely important. The
second category pays great importance to sales
staff attention and hence can be categorized as
relationship shoppers, while the third group
gives great importance to the value
proposition via price, discounts and quality of
product. This implies that retailers should
clearly be able to position its store for any one
or more of the above categories.
Conclusion
The study tries to focus on the differences
between the shoppers that patronize SBOs and
those who patronize MBOs in a Tier 3 Indian
town that is considered to be fashionably
aware. Demographic variables such as age,
gender, household income and employment
status does not impact the overall store format
selection however females tend to give greater
weightage to ambience and especially so in
SBOs. Discount impacts the store selection for
the lower income group, while price is not
considered that important when it comes to
store selection. But, when it comes to
satisfaction from purchases, price is the single
most important factor, and for MBO purposive
patrons it is the most important predictor.
Thus customer satisfaction which is important
for customer repeat purchase is immensely
impacted by correct pricing so one does not
feel cheated, more so for MBO purposive
patrons, since they have more choices and
more reference points. SBO patrons are more
focused shoppers while MBO patrons are
more into leisure shopping. There is no one
variable that clearly discriminates between the
SBO and MBO patrons when it comes to store
selection. Also, the clientele could be
segmented into 3 primary segments that is,
experiential, relationship and value shoppers.
7. References:
Basu, R., K. Guin, K., & Sengupta, K. (2014).
Do apparel store formats matter to Indian
shoppers?
International Journal of Retail & Distribution
Management, 42(8), 698–716.
Burke , R. R. (2005) ‘Retail shoppability : A
measure of the world’s best stores”, in Paula
Payton (ed), Future Retail Now : 40 of the
World’s Best Stores, Washington D. C., Retail
Industry Leaders Association, 206-219.
CIA World Factbook. 10 April 2013.
Donovan, R. (1994). Store atmosphere and
purchasing behavior. Journal of
Retailing, 70(3), 283–294
ELK ASIA PACIFIC JOURNAL OF MARKETING AND RETAIL MANAGEMENT
ISSN 2349-2317 (Online); DOI: 10.16962/EAPJMRM/issn. 2349-2317/2015; Volume 7 Issue 4 (2016)
…………………………………………………………………………………………………………
Fox, E. J., Montgomery, A. L., & Lodish, L.
M. (2004). Consumer shopping and spending
across retail formats. The Journal of
Business, 77(S2), S25–S60..
Heide, M., & GrØnhaug, K. (2006).
Atmosphere: Conceptual issues and
implications for hospitality
management. Scandinavian Journal of
Hospitality and Tourism, 6(4), 271–
286. International Monetary Fund: Report
2014-04-08.
Iyer, E.S. (1989). “Unplanned Purchasing:
Knowledge of Shopping Environment and
Time Pressure”, Journal of Retailing, 65, S40-
S57.
Jain, R. & Bagdare, S.(2009), ‘’Determinants
of Customer Experience in New Format Retail
Stores’’, Journal of Marketing and
Communication; 5 (2), 41.
Van Kenhove, P., De Wulf, K., & Van
Waterschoot, W. (1999). The impact of task
definition on store-attribute saliences and store
choice. Journal of Retailing, 75(1), 125–137.
Kolodinsky, J. (1990). Time as a direct source
of utility: The case of price information search
for groceries. Journal of Consumer
Affairs, 24(1), 89–109.
Luce Stephanie (2013), Global Retail Report.
Macik, R., Sktodowska, M.C., Macik, D., &
Nalewajek, M. (2013). Consumer Preferences
For Retail Format Choice – Case Of Polish
Consumers. Croatia International Conference
proceedings, June 2013.
MarketLine Industry Profile Global Apparel
Retail February 2013.
Mehrabian, A., Russell, J. A., & Russell, S. J.
(1974). An approach to environmental
psychology. Cambridge, MA: Cambridge,
M.I.T. Press [1974]
Messinger, P., & Narasimhan, C. (1997). A
Model of Retail Formats Based on Consumers'
Economizing on Shopping Time.Marketing
Science, 16(1), 1-23
Mostafa, M. M. (2007). Gender differences in
Egyptian consumers? Green purchase
behaviour: The effects of environmental
knowledge, concern and attitude. International
Journal of Consumer Studies, 31(3), 220–229.
Pankow. D, (2009). Taking Charge of Family
Finances: How Much Should We Spend.
Family Economics Specialist. North Dakota
State University, FE440 [2009].
Prakash, V., Flores, & Caeli, R. (1985). A
study of psychological gender differences:
Applications for advertising format by Ved
Prakash and R. Caeli Flores.
Sinha, P. K., & Banerjee, A. (2004). Store
choice behaviour in an evolving
market. International Journal of Retail &
Distribution Management, 32(10), 482–494.

ELK ASIA PACIFIC JOURNAL OF MARKETING AND RETAIL MANAGEMENT
ISSN 2349-2317 (Online); DOI: 10.16962/EAPJMRM/issn. 2349-2317/2015; Volume 7 Issue 4 (2016)
…………………………………………………………………………………………………………
Sprotles, G. B., & Kendall, E. L. (1986). A
methodology for profiling consumers’
decision-making styles. Journal of Consumer
Affairs, 20(2), 267–279.
Technopak Analysis, Fashion Retail Scenario
in India: Trends and Market Dynamics, 2013.
Thill, J.-C., & Thomas, I. (2010). Toward
conceptualizing Trip-Chaining behavior: A
review. Geographical Analysis, 19(1), 1–17.
Wedel, M., & Kamakura, W. A.
(2000). Market segmentation conceptual and
methodological foundations Second
edition (2nd ed.). Boston: Kluwer Academic
Publishers.
van Waterschoot, W., Kumar Sinha, P., Van
Kenhove, P., & De Wulf, K. (2008).
Consumer learning and its impact on store
format selection. Journal of Retailing and
Consumer Services, 15(3), 194–210.
Wu, B., Petroshius, S., & Newell, S. (2004).
The impact of store image, frequency of
discount, and discount magnitude on
consumers' value perceptions and search
intention. Marketing Management
Journal, 14(1), 14-29

ELK ASIA PACIFIC JOURNAL OF MARKETING AND RETAIL MANAGEMENT
ISSN 2349-2317 (Online); DOI: 10.16962/EAPJMRM/issn. 2349-2317/2015; Volume 7 Issue 4 (2016)
…………………………………………………………………………………………………………
LIST OF FIGURS:
Fig 1: The theoretical framework based on which the classification of the three groups is made is
explained in the diagram below
Step -1
Step - 1
CATEGORIZE the sample population into three
groups.
BROWSERS
PURPOSIVE NON-PATRON
PURPOSIVE PATRON
Step -2
ANALYSIS of these three groups on the basis
of various different factors that might
influence the Customer towards the store
Step – 3
Comparison of the two different store
formats from the results so obtained

ELK ASIA PACIFIC JOURNAL OF MARKETING AND RETAIL MANAGEMENT
ISSN 2349-2317 (Online); DOI: 10.16962/EAPJMRM/issn. 2349-2317/2015; Volume 7 Issue 4 (2016)
…………………………………………………………………………………………………………
Fig 2: Classification of Types of Consumers that were interviewed
:
PATRONAGE PURPOSE
PATRON NON- PATRON PURPOSIVE NON-PURPOSIVE
PURPOSIVE
PATRON
(Revenue
Generating
Customers)
PURPOSIVE
NON-
PATRON
BROWSERS BROWSERS
For Both SINGLE/ MULTI BRAND OUTLETS
ELK ASIA PACIFIC JOURNAL OF MARKETING AND RETAIL MANAGEMENT
ISSN 2349-2317 (Online); DOI: 10.16962/EAPJMRM/issn. 2349-2317/2015; Volume 7 Issue 4 (2016)
…………………………………………………………………………………………………………
LIST OF TABLES:
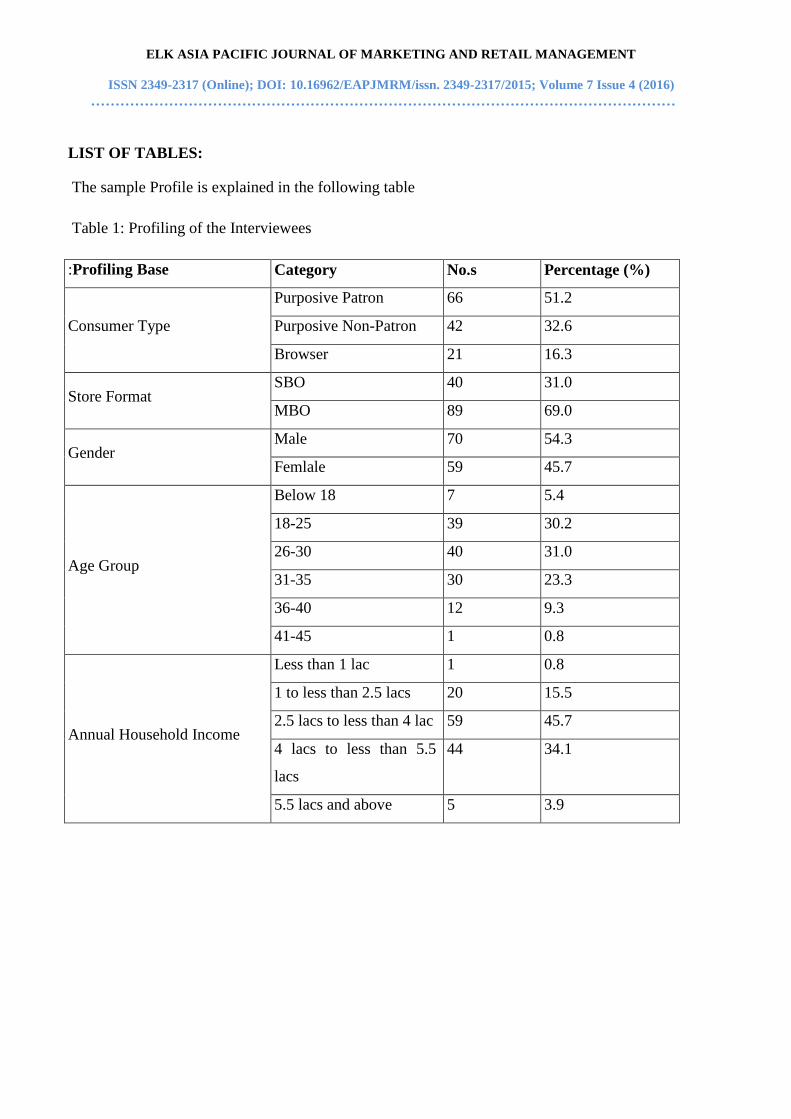
The sample Profile is explained in the following table
Table 1: Profiling of the Interviewees
:Profiling Base Category No.s Percentage (%)
Consumer Type
Purposive Patron 66 51.2
Purposive Non-Patron 42 32.6
Browser 21 16.3
Store Format SBO 40 31.0
MBO 89 69.0
Gender Male 70 54.3
Femlale 59 45.7
Age Group
Below 18 7 5.4
18-25 39 30.2
26-30 40 31.0
31-35 30 23.3
36-40 12 9.3
41-45 1 0.8
Annual Household Income
Less than 1 lac 1 0.8
1 to less than 2.5 lacs 20 15.5
2.5 lacs to less than 4 lac 59 45.7
4 lacs to less than 5.5
lacs
44 34.1
5.5 lacs and above 5 3.9
ELK ASIA PACIFIC JOURNAL OF MARKETING AND RETAIL MANAGEMENT
ISSN 2349-2317 (Online); DOI: 10.16962/EAPJMRM/issn. 2349-2317/2015; Volume 7 Issue 4 (2016)
…………………………………………………………………………………………………………
Table 2: KMO Bartlett’s Table
Kaiser-Meyer-Olkin Measure of Sampling
Adequacy. .643
Bartlett's Test of
Sphericity
Approx. Chi-Square 123.364
df 28
Sig. .000
Table 3: Factor Analysis Model
Componen
t
Extraction Sums of Squared Loadings Rotation Sums of Squared Loadings
Total
% of
Variance
Cumulative
% Total
% of
Variance
Cumulative
%
1 2.333 29.161 29.161 2.090 26.129 26.129
2 1.303 16.292 45.453 1.546 19.325 45.453

ELK ASIA PACIFIC JOURNAL OF MARKETING AND RETAIL MANAGEMENT
ISSN 2349-2317 (Online); DOI: 10.16962/EAPJMRM/issn. 2349-2317/2015; Volume 7 Issue 4 (2016)
…………………………………………………………………………………………………………
Table 4: The Factor Model
Rotated Component Matrixa
Component
1 2
Chronbach’s Alpha 64.7% 44.6%
While selecting a store, I place huge importance on price - .677
Ambience is a deciding factor while I select a store .707 -
While selecting a store, I place huge importance on brand .630 -
Sales staff attention is of utmost significance when i select a store .410 -
Discount is a major factor, when i am selecting a store. - .759
During store selection, I place much importance on the quality of
products. - .582
Assortment of the product in the store is the key factor when select a
store. .676 -
While selecting a store, I place huge importance on latest merchandise. .688 -
Extraction Method: Principal Component Analysis. Rotation Method: Varimax with Kaiser
Normalization.
Rotation converged in 3 iterations
ELK ASIA PACIFIC JOURNAL OF MARKETING AND RETAIL MANAGEMENT
ISSN 2349-2317 (Online); DOI: 10.16962/EAPJMRM/issn. 2349-2317/2015; Volume 7 Issue 4 (2016)
…………………………………………………………………………………………………………
Table 5: T-test for individual variables to compare the means for MBO purposive patrons vs SBO
purposive patrons
Factors Avg. Score of MBO
Purposive Patrons
(40)
Avg. Score of SBO
Purposive Patrons(26)
Sig. (2-tailed) of T
Price 1.85 1.54 .055
Ambience 2.40 2.08 .165
Brand 1.70 1.65 .818
Sales Staff
Attention
2.28 2.35 .745
Discount 1.63 1.58 .822
Quality 1.53 1.50 .878
Assortment 1.90 2.08 .453
Merchandise 2.05 1.88 .480
Table 6: Importance of Ambience in store format selection for males vs females
q1) gender N Mean
Std.
Deviation Std. Error Mean
Q7)b) Ambience is a
deciding factor while I
select a store
Male 70 2.40 .907 .108
Female 59 2.10 .885 .115
Table 7: KMO and Bartlett’s test
KMO and Bartlett's Test
Kaiser-Meyer-Olkin Measure of Sampling
Adequacy. .705
Bartlett's Test of
Sphericity
Approx. Chi-Square 180.128
df 28
Sig. .000

ELK ASIA PACIFIC JOURNAL OF MARKETING AND RETAIL MANAGEMENT
ISSN 2349-2317 (Online); DOI: 10.16962/EAPJMRM/issn. 2349-2317/2015; Volume 7 Issue 4 (2016)
…………………………………………………………………………………………………………
Table 8: Rotated Factor Matrix to reduce the number of variables
Component
1 2
PRICE .450 .519
DISCOUNT .065 .742
AMBIENCE .437 -.631
QUALITY .660 .308
BRAND .630 .012
SALES STAFF ATTENTION .535 -.059
ASSORTMENT .750 -.118
LATEST MERCHANDISE .629 -.523
Extraction Method: Principal Component Analysis.
Rotation Method: Varimax with Kaiser Normalization.a
a. Rotation converged in 3 iterations.
Table 9: Regression Model for overall satisfaction with individual satisfaction factors
Model Summary
Model R R Square Adjusted R Square
Std. Error of the
Estimate
1 .379a .144 .116 .551
a. Predictors: (Constant), Q9)D) QUALITY, Q9) b) DISCOUNT, Q9)a) PRICE, Q9)G) ASSORTMENT
Table 10: Regression models for SBO and MBO patrons separately
Model Summarya
Q6)
Patronage R R Square Adjusted R Square
Std. Error of the
Estimate
1 .650b .422 .273 .480
2 .530c .281 -.057 .543
Predictors: (Constant), Q9)H) LATEST MERCHANDISE, Q9)a) PRICE, Q9)E) BRAND, Q9) b) DISCOUNT,
Q9)F)SALES STAFF ATTENTION, Q9)D) QUALITY, Q9)C) AMBIENCE, Q9)G) ASSORTMENT

ELK ASIA PACIFIC JOURNAL OF MARKETING AND RETAIL MANAGEMENT
ISSN 2349-2317 (Online); DOI: 10.16962/EAPJMRM/issn. 2349-2317/2015; Volume 7 Issue 4 (2016)
…………………………………………………………………………………………………………
Table 11: Rotated factor matrix to find the underlying parameters
The Underlying parameters
Rotated Factor Matrixa
Factor
Experiential
Shoppers
Relationship
Shoppers
Value
Shoppers
While selecting a store, I place huge importance on
price .203 -.054 .707
Ambience is a deciding factor while I select a
store .611 .055 -.024
While selecting a store, I place huge importance on
brand .547 .035 .135
Sales staff attention is of utmost significance
when i select a store .196 .890 .106
Discount is a major factor, when i am selecting a
store. -.049 .107 .432
During store selection, I place much importance on
the quality of products. .175 .242 .288
Assortment of the product in the store is the key
factor when select a store. .481 .171 .044
While selecting a store, I place huge importance on
latest merchandise. .562 .129 .115
Extraction Method: Principal Axis Factoring.
Rotation Method: Varimax with Kaiser Normalization.
Rotation converged in 5 iterations.