© 2018 abhigyan ravula - ufdcimages.uflib.ufl.edu
TRANSCRIPT

PHARMACOKINETIC AND PHARMACODYNAMIC CHARACTERIZATION OF TETRAHYDROCANNABINOL INDUCED CANNABINOID DEPENDENCE IN RATS
By
ABHIGYAN RAVULA
A DISSERTATION PRESENTED TO THE GRADUATE SCHOOL OF THE UNIVERSITY OF FLORIDA IN PARTIAL FULFILLMENT
OF THE REQUIREMENTS FOR THE DEGREE OF DOCTOR OF PHILOSOPHY
UNIVERSITY OF FLORIDA
2018

© 2018 Abhigyan Ravula

This work is dedicated to my parents, brother and family for their love and support
4
ACKNOWLEDGMENTS
I would like to express my sincere gratitude to my research advisor Dr. Hartmut
Derendorf for accepting me into his research group and for his guidance and support
during my PhD training at University of Florida. I would also like to thank my committee
members Drs. Hartmut Derendorf, Adriaan Bruijnzeel, Shiong Song and Maureen Long
for their never-ending support during the course of the program. I am also thankful to
Drs. Barry Setlow and Marcelo Febo for giving me the opportunity to work on the
cannabis smoke exposure project that helped me shape my thesis. I would also like to
thank the office staff in the Department of Pharmaceutics for their constant support.
I am indebted to the Department of Pharmaceutics, Department of Psychiatry,
University of Florida Cricket Club and the University of Florida for my personal and
professional development.
I would like to express special appreciation to Drs. Li Li and Tong Shen for giving
me an opportunity to intern at Eli Lilly and which had a profound impact on the
development of my scientific acuity.
I would like to extend special thanks to the post-docs and my lab mates,
especially Drs. Hardik Chandasana and Satyawan Jadhav and Vipada
Khaowroongrueng and my fellow graduate students Drs. Tobias Heinrichs, Ameila
Deitchman, Johannes Kast and Wendy (Yu Yichao) and Abhinav Kurumaddali.
I am also very grateful to Dr. Shashank Rohatagi for his invaluable advices and
recommendation of this wonderful platform to build a successful career.
I would also like to thank my friends and University of Florida Cricket Club for
making my stay in Gainesville special and memorable. Finally, I would like to thank my
family from the bottom of my heart for their constant support, guidance and patience.

5
TABLE OF CONTENTS Page
ACKNOWLEDGMENTS .................................................................................................. 4
LIST OF TABLES ............................................................................................................ 8
LIST OF FIGURES .......................................................................................................... 9
LIST OF ABBREVIATIONS ........................................................................................... 11
ABSTRACT ................................................................................................................... 12
CHAPTER
1 INTRODUCTION .................................................................................................... 14
Clinical Pharmacokinetic and Pharmacodynamics of Tetrahydrocannabinol .......... 14
Government Regulation in United States ................................................................ 15 Pharmacokinetics of THC ....................................................................................... 16
Absorption ........................................................................................................ 16
Distribution ....................................................................................................... 19 Metabolism ....................................................................................................... 20
Elimination ........................................................................................................ 21 Pharmacodynamics of THC .................................................................................... 22 Discussion .............................................................................................................. 26
2 LC-MS/MS METHOD DEVELOPMENT AND VALIDATION ................................... 28
Background ............................................................................................................. 28 Materials and Methods............................................................................................ 30
Chemical and Reagents ................................................................................... 30
Instrumentation and Chromatographic Conditions ........................................... 30 Stock and Standard Quality Controls ............................................................... 31 Extraction Procedure ........................................................................................ 31
Assay Validation Procedure ............................................................................. 32 Selectivity and sensitivity ........................................................................... 32 Stability and recovery ................................................................................. 32 Intra-day and inter-day accuracy and precision ......................................... 33
Matrix effect ............................................................................................... 33 Results .................................................................................................................... 33
Method Development ....................................................................................... 33
Method Validation ............................................................................................. 34 Selectivity ................................................................................................... 34 Calibration curve and linearity .................................................................... 34 Extraction efficiency and matrix effect ........................................................ 34 Accuracy, precision and stability ................................................................ 34

6
Summary ................................................................................................................ 35
3 PHARMACOKINETICS OF TETRAHYDROCANNABINOL IN RATS ..................... 41
Background ............................................................................................................. 41 Materials and Methods............................................................................................ 42
Subjects............................................................................................................ 42 Drugs ................................................................................................................ 42 Drug Analysis ................................................................................................... 42
Experimental Design ........................................................................................ 43 Dose Metrics ........................................................................................................... 43 Data Analysis .......................................................................................................... 45 Results .................................................................................................................... 47
Non-Compartment Analysis of THC ................................................................. 47
Non-Compartment Analysis of THC when Co-administered with Rimonabant ................................................................................................... 47
Compartment Modelling for THC ............................................................... 48 Compartment Modeling for Rimonabant .................................................... 48
Discussion .............................................................................................................. 49
4 CHARACTERIZATION OF CANNABINOID ABUSE AND WITHDRAWAL............. 65
Cannabiniod Abuse ................................................................................................ 65
Materials and Methods............................................................................................ 67 Subjects............................................................................................................ 67
Drugs ................................................................................................................ 67 Cannabis Smoke Exposure .............................................................................. 68
ICSS Apparatus ................................................................................................ 68 Experimental Design ........................................................................................ 69
Blood Collection ............................................................................................... 69 Drug Analysis ................................................................................................... 70 Statistical Analysis ............................................................................................ 70
Intracranial Self Stimulation .............................................................................. 70 Results .................................................................................................................... 71
Effect of THC Dose and Duration on Baseline Reward Threshold ................... 71
Effect of Rimonabant Induced Precipitated Withdrawal on Brain Reward Threshold ...................................................................................................... 72
Discussion .............................................................................................................. 73
5 PHARMACOKINETIC AND PHARMACODYNAMIC MODELIING OF THC INDUCED CANNABINOID DEPENDENCE ............................................................ 82
Pharmacokinetic and Pharmacodynamic (PK/PD) Modeling .................................. 82 Methods .................................................................................................................. 84
PK/PD modeling of THC for animals which were exposed to cannabis smoke containing THC .................................................................................................... 84
PD Data Smoothing ................................................................................................ 85

7
There compartment PK with-effect-compartment indirect-link model (biophase equilibration model with a linear PD model) ......................................................... 86
There compartment PK with indirect response model using stimulation of the output (IDR-4) ...................................................................................................... 87
Results .................................................................................................................... 89 Discussion .............................................................................................................. 89
6 CONCLUSION ........................................................................................................ 99
LIST OF REFERENCES ............................................................................................. 101
BIOGRAPHICAL SKETCH .......................................................................................... 110

8
LIST OF TABLES
Table page 1-1 Clinical Studies to characterize the PK-PD of THC using various routes of
Administration (1980-2014) ................................................................................ 27
2-1 Optimized source and compound dependent parameters for THC, CBD, Rimonabant and THC-D3 ................................................................................... 36
2-2 Accuracy and Precision for within batch and between QC samples .................. 37
2-3 Mean extraction recovery of analytes in rat plasma ........................................... 38
2-4 Mean Stability of analytes in rat plasma ............................................................ 38
3-1 Phamramcokinetic Parameters of THC in rats reported in literature .................. 51
3-2 Phamramcokinetic Parameters obtained after performing NCA using Phoenix8.0.......................................................................................................... 51
3-3 Pharmacokinetic Parameters obtained after performing NCA using when Rimonabant was co-administered with THC ....................................................... 51
3-4 Phamramcokinetic Parameters of THC upon co-administration with Rimonabant obtained after performing NCA using Phoenix8.0 .......................... 51
3-5 Phamramcokinetic Parameters obtained after performing compartmental analysis for THC ................................................................................................. 52
3-6 Phamramcokinetic Parameters obtained after performing compartmental analysis for Rimonabant ..................................................................................... 52
3-7 Nicotine Chamber concentration vs TSP ............................................................ 53
4-1 Summary of the total amount of cannabis burnt for both the treatments,. ......... 81
5-1 Summary ok the PD parameters obtained after model fitting ............................. 98

9
LIST OF FIGURES
Figure page 2-1 Figure Structures of THC, CBD and Rimonabant Chemical structures of (a)
∆9-tetrahydrocannabinol (b) cannabidiol and (c) rimonabant. ............................. 39
2-2 Representative Chromatograms for the compounds .......................................... 40
3-1 One Compartment Pharmacokinetic Model ........................................................ 54
3-2 Two Compartment Pharmacokinetic Model ........................................................ 54
3-3 Three compartment pharmacokinetic model ...................................................... 55
3-4 TSP (mg/m3) vs Nicotine (ug/L) ......................................................................... 55
3-5 Plasma Concentration of THC after Intravenous Administration......................... 56
3-6 Plasma Concentration of THC after passive smoke inhalation (0.05 mg/kg) ...... 57
3-7 Plasma Concentration of THC after passive smoke inhalation (0.2 mg/kg) ........ 58
3-8 Plasma Concentration of THC after passive smoke inhalation in presence of Rimonabant (0.05 mg/kg) ................................................................................... 59
3-9 Plasma Concentration of Rimonabant (3 mg/kg) after smoke exposure ............ 60
3-10 Goodness of fit plots for THC PK model ............................................................. 61
3-11 VPC for THC PK model ...................................................................................... 61
3-12 Individual profiles for subject administered THC ................................................. 62
3-13 Individual profiles for subject administered rimonabant (i.p) ............................... 63
3-14 GOF’s rimonabant (i.p) ....................................................................................... 64
3-15 VPC rimonabant (i.p) .......................................................................................... 64
4-1 ICSS Set Up ....................................................................................................... 77
4-2 Experimental design ........................................................................................... 78
4-3 Experimental design-2 ........................................................................................ 78
4-4 Effect of THC Dose and Duration of Exposure on Brain Reward Threshold ....... 79
4-5 Effect of Rimonabant (i.p) on Brain reward Thresholds ...................................... 80

10
5-1 Placebo corrected PD response ......................................................................... 94
5-2 PK-PD model using hypothetical effect compartment ......................................... 95
5-3 PK-PD model using indirect response model (IDR4) .......................................... 95
5-4 Linear Emax model ............................................................................................. 96
5-5 Observed vs model prediction for THC induced cannabinoid dependence ........ 96
5-6 GOF’s PD Model ................................................................................................ 97

11
LIST OF ABBREVIATIONS
ACN Acetonitrile
CBD Cannabidiol
CE Collision energy
CXP Collision exit potential
DP Declustering potential
DSM The Diagnostic and Statistical Manual of Mental Disorders
EC50 Concentration producing half maximal effect
Emax Maximum effect
EP Entrance potential
GOF Goodness of fit
ICSS Intracranial self-stimulation
LC Liquid chromatography
MEOH Methanol
MS Mass spectrometry
PD Pharmacodynamics
PK Pharmacokinetics
THC Tetrahydrocannabinol
USFDA/FDA United States Food Drug Administration
VPC Visual Predictive check
WHO World Health Organization
ℽ Hill- coefficient

12
Abstract of Dissertation Presented to the Graduate School of the University of Florida in Partial Fulfillment of the Requirements for the Degree of Doctor of Philosophy
PHARMACOKINETIC AND PHARMACODYNAMIC CHARACTERIZATION OF
TETRAHYDROCANNABINOL INDUCED CANNABINOID DEPENDENCE IN RATS
By
Abhigyan Ravula
May 2018
Chair: Hartmut Derendorf Cochair: Adriaan Bruijnzeel Major: Pharmaceutical Sciences - Pharmacy
2.5% of earth’s population uses marijuana, making it the most commonly abused
recreational drug around globe. Delta-9-Tetrahydrocannabinol (THC) was recognized as
the active constituent, and the effects of THC have been well studied. Cannabinoids
have a vast variety of therapeutic applications such as in pain, nausea, vomiting,
appetite stimulant, however therapeutic advantages of cannabis is being counteracted
by its abuse potential, hence limiting its clinical application.
The aims of these studies were to verify and characterize the correlations among
tetrahydrocannabinol pharmacokinetics, physical dependence and withdrawal. We
intended to explore exposure-response relationships and to understand the underlying
mechanism of tolerance and withdrawal upon cannabis smoke inhalation as this is most
preferred way to consume cannabis in humans.
In order to study the concentration-effect relationship, an LCMS assay to quantify
THC in rat plasma was developed, animal experiments were chosen and conducted in
lab. Three doses (0.05, 0.2 and 1 mg/kg) of THC were tested through passive smoke
inhalation and intravenous administration for pharmacokinetic (PK) assessment. In the

13
dependence studies, two doses (0.05 and 0.2 mg/kg/day) of THC smoke or air only
exposure was performed for a total of four weeks to understand the effects after chronic
passive smoke exposure. A discrete-trial intracranial self-stimulation procedure was
used to quantify the extent of dependence and withdrawal.
The assay to quantify THC, CBD and rimonabant was developed and validated
according FDA guidelines.
The PK of THC could be well described with a linear three-compartment model.
For dependence studies, THC induced physical dependence which was CB1 receptor
mediated was verified after passive smoke inhalation and was characterized by PK/PD
models.
Results from these studies shows that exposure to even very low doses of
cannabis smoke over prolonged time can induce dependence. They provide insight into
the underlying mechanism of physical dependence. These animal models will open a
new therapeutic interest in the treatment of cannabis use disorders.

14
CHAPTER 1 INTRODUCTION
Clinical Pharmacokinetic and Pharmacodynamics of Tetrahydrocannabinol
Cannabis is one of the most commonly abused illicit drug in the United States
and around the world. According to WHO reports about 2.5% of earth’s population are
marijuana users, which is surprisingly high in contrast to cocaine (0.2%) and other
opiates (0.2%)(“WHO | Cannabis,” 2010). At the moment there are ongoing efforts for
legalization of marijuana in the United States and 6 states have legalized it for
recreational purpose, but it is still considered a schedule 1 substance under the federal
law. Cannabis is most commonly used a marijuana or hashish with the former being
dried leaves and flowers of the plant and later which is a resin that is extracted from
plant material. Prevalence and use of synthetic cannabis (spice) has increased over the
last decade(Panlilio et al., 2015). The cannabis plant contains more than 500
compounds of which at least 113 belong to the cannabinoids. Marijuana is commonly
administered orally or by inhalation after vaporizing the drug. Delta-9-
tetrahydrocannabinol (THC) was identified as the principal psychoactive constituent and
the effects of THC have been well studied. Cannabidiol (CBD) was identified as a non-
psychoactive constituent with a variety of therapeutic applications. Work is also going
on to understand the potential benefits of CBD due to the absence of psychotropic
effects(Niesink and van Laar, 2013). Other Cannabinoids present in the plant may have
different effects compared to pure THC and how they modulate the effect of THC is yet
to be fully explored. The psychotropic effects of THC are mediated through the
cannabinoid receptors (CBR). CBR’s function by inhibition of adenylyl cyclase and a
part of the G-protein receptors. THC is a partial agonist for the CB1 and CB2 receptor

15
and also acts on PPARy and GPR55 receptors, with the later contributing to the anti-
nociceptive effects(Izzo et al., 2009). Along with CBR’s, CBD acts on U-opioid, GRP55,
PPARy and Transient receptor potential (TRP) receptors. CBD has anxiolytic,
neuroprotective effects and can also antagonize the psychotropic effects of
THC(Niesink and van Laar, 2013)
Government Regulation in United States
Cannabis is an age old herb that has been known to have therapeutic value
throughout history. Some of the Indian and Chinese literature dates the use of this herb
almost 2000 years back in the history. By mid-1800’s the therapeutic potential of
cannabis and derived products was recognized and it was included in the United States
Pharmacopoeia from 1850 to 1941 for its medicinal value. The use of these products
had started to deplete with development of new chemicals (aspirin, opioids) for
treatment of pain and other conditions, leading to regulation of marijuana in 48 states by
1938. One of the first acts by the federal government was in 1937 the “Marijuana Tax
Act” which meant, that growing, selling and buying marijuana was taxable. This was
introduced when the ongoing efforts by the state government to bring drug abuse under
control was not fruitful. With the increasing use of marijuana the “Controlled Substance
Act” was introduced in 1970 which officially placed marijuana in the schedule 1
category. From 1970 to this date the U.S Department of Justice Drug Enforcement
Administration considers marijuana a Schedule 1 substance. This means that the use of
the substance and its products is strictly prohibited due to its high abuse potential. This
act does not differentiate the use of marijuana for medical or recreational purpose and
growing marijuana is considered a felony.

16
Pharmacokinetics of THC
Absorption
Smoking is one of the fastest and most efficient way of consuming marijuana, as
it is a rapid and efficient method of delivering the drug to the brain. The Lung is a highly
perfused organ and THC can be detected in the blood almost immediately after inhaling
the first puff(Huestis, 2007, 2009; Zuurman et al., 2008). Ohlsson et.al were one of the
earliest to report that peak plasma THC concentration were within 3 min after smoking
and the mean plasma concertation varied from 33-118 µg/L/ml(Ohlsson et al., 1980).
The systemic bioavailability after smoking varied a great deal (2% to 56%)(Huestis,
2005),(Heuberger et al., 2015), because of inter and intra individual differences in
smoking dynamics. Factors such as total puffs, duration of each puff, hold time, volume
inhaled and spacing between each puff will also impact the drug exposure (Huestis,
2009; Lindgren et al., 1981; Ohlsson et al., 1980; Zuurman et al., 2009). Mario et.al
compared the effects after smoking marijuana cigarettes of 3 different potencies
containing 1.32%,1.97%, 2.54% THC under controlled conditions, and concluded that
the cmax (94.3± 11.6 ng/ml, 107.4± 18.0 ng/ml, 155.1± 17.5 ng/ml) of THC was
depended on the amount of THC present in cigarette and the time taken to reach
maximum concentration was 7-8 min after smoking(Perez-Reyes et al., 1982). Further,
it was suggested that there is a direct relationship between concentrations of THC in
oral fulid and plasma, as THC present in the oral cavity would act like a depot
preparation after smoking and THC would be released into the bloodstream over a
period of time (Huestis and Cone, 2004). Another study which compared the kinetics of
THC in occasional vs heavy users concluded that there was no difference between the
groups when upon smoking a cannabis cigarette, but the concentrations of THC when

17
smoking a placebo cigarette were higher in regular users and almost zero (absent) in
case of the occasional users due to accumulation of THC in former group(Toennes et
al., 2008). The Cmax for regular users was higher (7.9-244.8 ug/l) in contrast to
occasional users (11.9-86 ug/l), even after adjusting for their respective initial plasma
THC concentrations. In another study conducted by Zuurman et.al to evaluate the
effects of intrapulmonary administration of increasing doses of THC using a volcano
vaporizer showed that maximum plasma concentration was seen at the highest dose.
The plasma levels reached peak within minutes after the administration with no
absorption delays(Zuurman et al., 2008)
A number of studies were done in order to characterize the disposition of
cannabinoids after oral administration. Thought smoking is an efficient way to consume
cannabis undesirable effects produced by smoke limits this practice in clinic, hence oral
administration is preferred for therapeutic applications of cannabinoids. One of the
earliest studies characterized the disposition of THC after eating a chocolate cookie
containing 20 mg of THC. In spite administering a high amount, the plasma levels
ranged between 4-11 µg/L with a lower systemic availability (6%) in contrast to smoking.
There was a clear delay to reach the maximum levels and this ranged from 1-5 hours
after eating the cookie(Ohlsson et al., 1980). The Vehicle in which THC is administered
also has an impact on the bioavailability of orally administered THC. This was seen in a
study which compared 5 different vehicles, and conclude that greater bioavailability was
seen when THC was administered in sesame oil(Huestis, 2007). Wall et.al compared
the effects of administering 15 mg and 20 mg THC capsules in sesame oil for women
and men respectively, and concluded that there were no sex differences in the kinetics

18
following oral administration. The peak plasma levels were observed at 1.75-2 h
following drug administration, and remained constant for the next 4-5 hours. There was
an increase in the amount of 11-OH-THC following oral administration due to excess
first pass metabolism(Wall et al., 1983). Another study compared the concentration of
THC after acute single oral administration of 10mg THC and cannabis extract containing
10 mg THC and 5.8 mg CBD to check how CBD affected the kinetics and disposition of
THC. The maximum plasma concentration after THC alone and cannabis extract were
3.20 µg/L and 4.05 µg/L respectively(Nadulski et al., 2005). The tmax reported in this
study was about 1 h for both the treatments. The concentrations of the metabolites 11-
OH-THC and THC-COOH were greater than the active drug as seen with oral
administration due to first pass metabolism. Oral bioavailability is mainly governed by
factors like variable absorption depending the formulation (vehicle used), excessive
hepatic first pass metabolism and degradation in the stomach due to acidic
environment. Hence there is generally some variability associated with maximum
plasma levels and time to reach Cmax. Pharmacokinetics of Namisol® a tablet containing
pure THC having a variety of applications was studied using different doses in healthy
volunteers after oral administration. The observed Cmax were dose dependent (4.69
ng/mL) for 8 mg/kgTHC and lower doses reaching lower concentrations in patients were
4.43 ng/mL and2.92 ng/mL for 6.5 mg and 5 mg respectively. The time taken to reach
the maximum concentration was faster (39-56 min) compared to other
formulations(Ahmed et al., 2014). Pharmacokinetics after administering 20 mg
Dronabinol® were reported to have a Cmax that ranged from (4.4-11.0 µg/L) and the tmax
ranged from 1.5-5 hours(Schwilke et al., 2009). This study also showed that there was

19
no increase in the concentration of THC for continuous dosing, but the concentration of
the metabolites increased steadily. No increase in plasma THC concentrations could be
due extensive GI metabolism. The drug Sativex® is a formulation containing equal
proportions of THC and CBD. There was no observed difference in the
pharmacokinetics of THC in studies comparing the plasma concentrations of pure THC
and Sativex suggesting no pharmacokinetic interactions(Karschner et al., 2011)
Distribution
Initial uptake of THC is high in organs like lung, brain and liver which are highly
perfused followed by storage and accumulation in less perfused fatty tissues.
It has been seen that the plasma concentrations of THC upon smoking marijuana
follows a bi-exponential curve with rapid distribution and a high peak within minutes and
slow elimination. This rapid distribution of THC is attributed to lipophilicity and
corresponding logP value of THC was reported to be 5.94-6.97(Thomas et al., 1990)..
The drug concentration in the tissue isn’t affected by specific transport processes or
barriers. It was shown that the amount of THC in present in brain is less than 1%, with
most of it getting retained in the fat after prolonged drug exposure. The ratio was shown
to be 27:1 and 64:1 after 7 and 27 days of exposure respectively(Huestis, 2009). The
volume of distribution of THC at steady state was determined to be about 3.4
l/kg(Huestis, 2005) and it mainly binds to lipoproteins. The permeability of THC-OH in
brain is greater than THC, hence it diffuses faster compared to THC and is also less
protein bound in contrast to THC. Distribution of THC in drug tolerant vs non-tolerant
animals was shown to be similar, with no decrease in the uptake of THC in the brain.
Further it was shown by Hunt and Jones (1980) that the total metabolic clearance
increases and volume of distribution (605 ml -997 and 2.6- 4.6 l/kg) after prolonged oral

20
administration of 30 mg of THC every 4 h for 10-12 days. There was a development of
tolerance to the effects, but it could not be explained by pharmacokinetic changes,
suggesting that the underlying mechanism might be a pharmacodynamic adaptation.
According to reports about 10% of pregnant women use cannabis regularly. Although
no prenatal death was observed, there were consequences like bodyweight reduction,
hyperactivity and inattention in the newborns(Little and VanBeveren, 1996; Park et al.,
2004; Syme et al., 2004). THC and metabolites also diffuse across the
placenta(Huestis, 2005). In early pregnancy, the transfer to fetus was high. Due to its
lipophilicity THC is present in breast milk(Perez-Reyes et al., 1982).
Metabolism
An insight into the metabolism of THC is essential as it provides understanding
on how pharmacology of THC can be altered by its metabolites. Preliminary studies
showed that 11-OH-THC formed thorough microsomal hydroxylation, which in turn is
converted to 11-nor-THC-COOH, with the former being an active metabolite. No sex
differences in the metabolism were observed upon oral and intravenous administration,
although the rate of formation of the 11-OH metabolite was higher when THC was
administered orally. The 11-OH-THC/THC ratio was 0.5 or 1:1 upon oral administration
in contrast to 1:10 or 1:20 after intravenous administration(Wall et al., 1983). Bornheim
et.al 1991 further concluded that CYP2C9 was responsible for the formation of active
11-OH metabolite using human liver microsomes. Although this is the major metabolite,
other metabolites like 8β-OH-THC, 8α-OH-THC and epoxyhexadhyrocannabinol were
also formed in trace amounts. CYP3A catalyzes the formation of minor metabolites. The
Oxidation of 11-OH-THC produces THC-COOH which is an inactive metabolite. There
are numerous single nucleotide polymorphisms (SNP) in the CYP2C9, which can alter

21
the metabolism and pharmacokinetics. One study which aimed to compare SNP’s of
CYP2C9 studied the pharmacokinetics of THC after orally administering THC in 43
healthy individuals. The plasma concentrations ranged from 0.52 ug/l to 10 ug/l. The
median was 2.7 ug/l and 6.3 ug/l for the CYP2C9*1 and CYP2C9*3 allele groups
respectively. The apparent clearance (CL/F) ranged from 200 to 4000 l/h. The group
with the highest plasma THC value had the lowest plasma THC-COOH/THC ratio and
reported maximum sedation. The results showed significant differences in the
pharmacokinetics of THC and its metabolites between the SNP groups. They concluded
that CYP2C9 plays a minor role in the formation of 11-OH but rather promotes the
conversion of 11-OH-THC to THC-COOH. The study also tested if other SNP’s like
CYP3A5*`1 vs CYP3A*3 had an impact on the pharmacokinetics of THC but there were
no statistical differences between these groups(Sachse-Seeboth et al., 2009). In a study
that tried to compare the activities of 12 humans recombinant UGT’s towards classic
cannabinoids, it was shown that THC is not a direct substrate for the UGT’s tested.
Responses for THC-OH, THC-COOH, CBN and CBD shown by UGT1A and UGT1B
family isoenzymes were variable. It was seen that THC-OH was specifically
glucoronidated by UGT1A9 and UGT1A10. UGT1A3 and UGT1A1 showed activity
towards THC-COOH. CBN which is formed by degradation of THC was glucoronidated
by UGT1A10, UGT1A7, UGT1A9 and UGT2B7. It can be said that the phase II
metabolism of THC depends on upstream processing including phase I metabolism by
CYP2C9 and CYP3A4(Mazur et al., 2009).
Elimination
About sixty five percent is excreted in the feces as hydroxyl metabolites and
twenty percentis excreted in the urine in the form of conjugated acid metabolites. There

22
are various metabolites which are conjugated with glucuronic acid to increase their
water solubility. Most of the 11-OH-THC is excreted through feces but the THC-COOH
glucuronic acid conjugate is eliminated through urine. The total amount of THC
eliminated unchanged is negligible(Strougo et al., 2008; Zuurman et al., 2008) . The
amount of THC-COOH excreted in the urine was shown to be directly dependent on the
dose of THC.
Pharmacodynamics of THC
It was in the late 1980’s when the first cannabinoid receptor (CB1) was cloned
and the effects of tetrahydrocannabinol were thought to be CB1 mediated. A few years
down the lane, existence of a second cannabinoid receptor (CB2) mainly present in the
immune system cells was unveiled. Most of the psychotropic effects of THC are
hypothesized to be CB1 receptor mediated. This is mainly due to the fact that CB1
receptors are densely located in the brain and the spinal cord regions. The CB1
receptors are located densely in the cerebral cortex, basal ganglia, limbic areas,
thalamus and brainstem regions of the brain. CB1 receptors are also present in the
periphery and exert some of its effects on the heart, urinary and the gastrointestinal
tracts. CB2 receptors are principally present in immune cells like leucocytes, spleen and
tonsils and there is more mRNA present for CB2 than for CB1 in the immune system.
Levels of CB1 and CB2 mRNA in human leucocytes have been shown to vary with cell
type in the following order B cells > natural killer cells > monocytes >
polymorphonuclear neutrophils, CD4+ and CD8+ cells(Ashton and Ashton, 2012; Cone,
1995). Both of the receptors are G-protein coupled receptors and function by the
inhibiting the release of junctional neurotransmitter. Cannabinoid receptor activation
inhibits the conversion of Adenylylcyclase to cyclicAMP, mainly through Gi-coupling

23
proteins. This leads to the suppression of the voltage gated calcium channels and
activation of the potassium channels resulting in hyperpolarization, as a consequence of
which there is a decreased neurotransmitter release. Different cannabinoids show
different types of effects to the cannabinoid receptors. It was shown that THC has
affinity for both, CB1 and CB2 receptor, with more affinity for the former one. It was also
shown that THC can act as an antagonist on the CB2 receptor(Colizzi et al., 2016;
Grotenhermen, 2004). There are also various synthetic cannabinoids which were
developed to be highly CB1 specific. Anandamide which is an endocannabinoid has
greater affinity for CB1 receptor than the CB2 receptor. It has been shown that cannabis
has a variety of properties like sedative, hypnotic, anxiolytic, analgesic, psychedelic,
and effects almost all the body systems. There haven’t been any cases of toxicity by
cannabis after smoking but the FDA is currently concerned over edible cannabis
products(Ashton and Ashton, 2012; Throckmorton, 2016). A few cases have been
reported that cannabis has induced psychosis and hallucinations after oral
consumption. However the amount of cannabis present in the preparations is unknown
and the rationale behind the unwanted effects is hypothesized to be due to the
metabolism of THC to THC-OH which is twice as potent. As mentioned above the
formation of THC-OH is high when THC is administered orally due to first pass effect.
Ernest Dixon in 1899 was the first to show that the dogs which inhaled cannabis smoke
failed to react to pin pricks. Herbal cannabis can be used for both neuropathic pain and
non-neuropathic pain(Lynch and Campbell, 2011). Evidence exists that the analgesic
efficacy of inhaled cannabis smoke can reduce neuropathic pain and there are about
five randomized controlled clinical trials(Savage et al., 2016). Most of the studies which

24
were carried out used Visual Analogue scores in order to access the pain. In general,
there was a decrease in the VAS indicating a reduction in pain perception. The effect
seemed to be dose dependent with the cannabis cigarette containing the highest
percentage of THC showing the maximum effect(Jensen et al., 2015; Manzanares et al.,
2006; Savage et al., 2016). However, uncertainty regarding relative analgesic actions of
different cannabinoids still persists. The two cannabinoids present in highest
concentration are THC and CBD and evidence suggests that they are both potentially
useful as analgesics. This is clinically relevant in that one (THC) has reward like effects
and the other (CBD) does not. A study conducted by Cooper et.al tried to compare the
effect of smoked marijuana and orally administered Dronabinol, in a randomized, well
controlled, double-blind, placebo study. The results show that both smoked cannabis
and Dronabinol produced analgesia and with Dronabinol producing long lasting
analgesic effect. There is also evidence that suggests the use of cannabinoids in the
treatment of spasticity associated with multiple sclerosis and stroke(Iversen, 2003;
Manzanares et al., 2006). The main reason for recreational use of cannabis is because
of the “high” that is induced after consumption of a marijuana cigarette. Cigarettes
containing as low as 2.5 mg THC can produce profound effects(Ashton and Ashton,
2012). This general high is usually described as a pleasant a relaxing effect with a
general decrease in anxiety, alertness and an increasing euphoria and laughter. The
high can be felt within minutes after smoking the first puff and usually lasts for a couple
of hours. The subjective high for whole cannabis products and THC were described to
be similar(Wachtel et al., 2002). The study conducted by Zuurman et al it showed that
THC was able to alter the feeling about external perceptions which is mainly related to

25
the surroundings but had limited effect on the internal perception scale which is more
related to feelings corresponding to unreality or the psychedelic and hallucinogenic
properties of a drug26. The study also showed that there is a decreased alertness with
increasing doses which is a well characterized effect of THC. The study also looked at
the effect of THC on body sway in a similar experimental setting and the effects of THC
on body sway was also dependent with the highest dose causing the maximum body
sway which was in accordance with the previous literature reports(Liguori et al., 2003).
It is not surprising that THC shares this effect on cognition and psychomotor
performance with other classes of centrally acting sedatives like alcohol and
benzodiazipines. It has also been shown that these effects are additive with other CNS
depressants(Ashton and Ashton, 2012). THC can affect learning, memory and impair
psychomotor coordination and the ability to drive(Kelly et al., 1993). In a study by J.G
Ramekers et.al a clear impairment in driving performance was observed after smoking
low and high doses of marijuana cigarettes compared to the placebo42. This impairment
worsened dramatically when alcohol was also consumed with the cigarettes. Such tests
have been tried before comparing the effects of various centrally acting drugs on driving
impairment using various computerized test and the similar conclusions can be made
from the studies(Kelly et al., 1993). It was shown that the heart rate increased with no
effect on blood pressure in a dose related manner (compared to placebo) in humans
after intrapulmonary administration of THC using a volcano vaporizer(Zuurman et al.,
2008). The heart rate decreased and no accumulation was observed when the dose
was escalated. This is consistent with previous results which showed that THC can
induce tachycardia which can be blocked by beta-blockers and can increase the oxygen

26
demand(Grotenhermen, 2004; Perez-Reyes et al., 1982). Tachycardia up to 160
beats/min can be observed and tolerance to this effect can be seen over chronic
use(Ashton and Ashton, 2012). Several previous studies have also reported orthostatic
hypotension and peripheral vasodilation.
Discussion
Since the public interest in the medical use of cannabis has risen sharply in
recent years one aim was to focus on important pharmacokinetic parameters which
deeply infect the dose-setting, especially multiple-dosing, during the therapy of multiple
sclerosis, AIDS or cancer. Because of THCs lipophilicity the drug accumulates in body
fat and rapidly penetrates in well-perfused organs like liver or heart. There is some
evidence that cannabinoids are hepatotoxic and can lead to liver diseases with regular
consumption and it also has an effect on the heart rate and may lead to a tachycardia.
Repeated cannabis consumption cannot only lead to serious illnesses, but also affects
the brain(Solimini et al., 2017). Thus repeated cannabis intake leads to dependence
and during abstinence to withdrawal symptoms it is important to understand the
metabolization and drug distribution in order to be able to control or antagonize these
effects. The Diagnostic and Statistical Manual of Mental Disorders (DSM-V) recognizes
these symptoms as cannabis use disorders (CUD’s). Hence it is very important to
understand the interactions between concentrations of THC and cannabinoids
receptors, to effectively optimize the dose and address some of the undesired effects
associated with this compound.
27
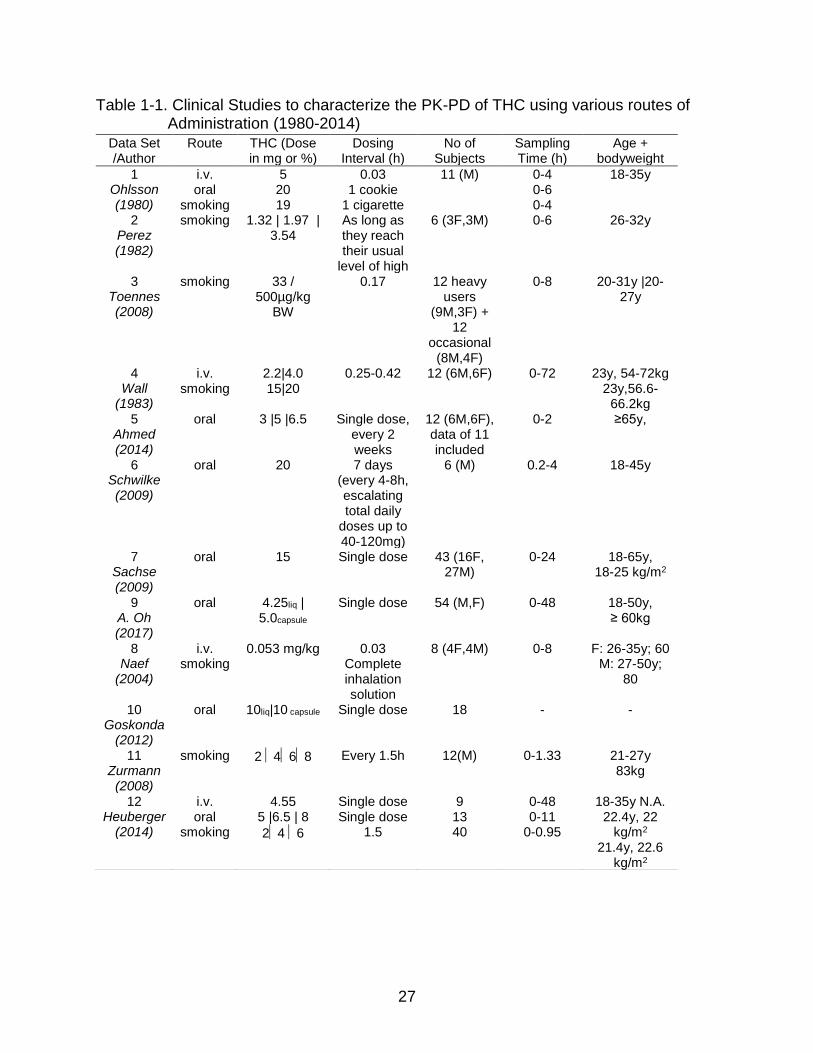
Table 1-1. Clinical Studies to characterize the PK-PD of THC using various routes of Administration (1980-2014)
Data Set /Author
Route THC (Dose in mg or %)
Dosing Interval (h)
No of Subjects
Sampling Time (h)
Age + bodyweight
1 Ohlsson (1980)
i.v. oral
smoking
5 20 19
0.03 1 cookie
1 cigarette
11 (M) 0-4 0-6 0-4
18-35y
2 Perez (1982)
smoking 1.32 | 1.97 | 3.54
As long as they reach their usual
level of high
6 (3F,3M) 0-6 26-32y
3 Toennes (2008)
smoking 33 / 500µg/kg
BW
0.17 12 heavy users
(9M,3F) + 12
occasional (8M,4F)
0-8 20-31y |20-27y
4 Wall
(1983)
i.v. smoking
2.2|4.0 15|20
0.25-0.42 12 (6M,6F) 0-72 23y, 54-72kg 23y,56.6-
66.2kg 5
Ahmed (2014)
oral 3 |5 |6.5 Single dose, every 2 weeks
12 (6M,6F), data of 11 included
0-2 ≥65y,
6 Schwilke (2009)
oral 20 7 days (every 4-8h, escalating total daily
doses up to 40-120mg)
6 (M) 0.2-4 18-45y
7 Sachse (2009)
oral 15 Single dose 43 (16F, 27M)
0-24 18-65y, 18-25 kg/m2
9 A. Oh (2017)
oral 4.25liq | 5.0capsule
Single dose 54 (M,F) 0-48 18-50y, ≥ 60kg
8 Naef
(2004)
i.v. smoking
0.053 mg/kg 0.03 Complete inhalation solution
8 (4F,4M) 0-8 F: 26-35y; 60 M: 27-50y;
80
10 Goskonda
(2012)
oral 10liq|10 capsule Single dose 18 - -
11 Zurmann (2008)
smoking 2 468 Every 1.5h 12(M) 0-1.33 21-27y 83kg
12 Heuberger
(2014)
i.v. oral
smoking
4.55 5 |6.5 | 8
24 6
Single dose Single dose
1.5
9 13 40
0-48 0-11
0-0.95
18-35y N.A. 22.4y, 22
kg/m2
21.4y, 22.6 kg/m2

28
CHAPTER 2 LC-MS/MS METHOD DEVELOPMENT AND VALIDATION
Background
Marijuana refers to the dried flowers and small leaves of the female hemp
(Cannabis sativa plant) and is among the oldest crops in the world. The plant is known
to contain more than 400 compounds of which at least 60 belong to the cannabinoids of
which Delta-9-tetrahydrocannabinol (THC) and cannabidiol (CBD) are most commonly
researched compounds(Huestis, 2007). THC is one of the most commonly abused illicit
drug across the globe and smoking is the most prominent method of
administration(Panlilio et al., 2015). Though it is considered a schedule 1 substance in
the United states, THC (Marinol®) is prescribed to stimulate appetite to treat AIDS
related anorexia’s In Europe, the drug Sativex® is on the market which contains a
combination of ∆9-tetrahydrocannabinol (THC) and Cannabidiol (CBD) as a spray
available for the therapy of multiple sclerosis(Karschner et al., 2011; Pharmaceuticals,
2006). Both THC and CBD bind to the Cannabinoid-1 (CB1) receptor, located primarily
in the central nervous system to elicit most of the pharmacological actions(Lupica et al.,
2004). SR141716A (rimonabant) which is highly selective for CB1 has antagonist and
inverse agonistic properties. It was developed by Sanofi Aventis to treat obesity and
was later withdrawn from the market for safety reasons(egan, Amy G; Colman, 2007;
Moreira and Crippa, 2009). Rimonabant has also shown to antagonize symptoms in the
cannabinod tetrad in mice(Wilson et al., 2006) and is one of the most commonly
administrated compound to study and compare effects of THC and other synthetic
cannabinoids with THC in various animal studies(Järbe et al., 2011; Katsidoni et al.,
2013; Niyuhire et al., 2007; Wilson et al., 2006). Rimonabant is typically administrated

29
intraperitoneal (i.p) to counter act the effects of THC and other synthetic cannabinoid
receptor 1 agonists and understanding the pharmacokincetics of rimoanabant would
help better understand and the dose at which the cannabinoid effects are antagonized.
Various bioanalytical methods have been reported to quantify cannabinoids in both rat
and human plasma. However, most methods developed for rats had 5-10 ng/ml as their
LLOQ(Valiveti and Stinchcomb, 2004; Zgair et al., 2015). THC is a compound which is
known to have long half-life due to its lipophilic nature, hence the redistribution from the
fat tissue becomes the rate limiting step which contributes to prolonged half-life. Having
a lower LLOQ will help characterize the distribution and elimination. Other methods
developed in rats were developed in blood and or more than 100 ul of the matrix which
would be challenging when performing a pharmacokinetic study(Deiana et al., 2012;
Manwell et al., 2014; Palazzoli et al., 2018; Zgair et al., 2015). Decreasing the volume
typically causes low sensitivity for effective quantification of the compound. The main
aim of this study was to develop a sensitive and specific analytical method using LC-
MS/MS with a short run time to determine the plasma concentrations of CB1 receptor
agonists THC,CBD and the antagonist Rimonabant simultaneously in rat plasma. The
primary reason for the development and validation of this new method despite
previously published methods is to apply it to develop an animal model for passive
cannabis smoke inhalation in rats, where we can expect low concentrations of
cannabinoids due to low and variable bioavailability. Most of the previously published
studies were able to quantify cannabinoids after systemic administration, where the
plasma concentrations are higher. In our study we aim to characterize the
pharmacokinetics of the molecules after rats were exposed to cigarette smoke

30
generated using cannabis cigarettes containing 5.3% THC (< 0.001% CBD) and freshly
prepared rimoanabant was injected (i.p) immediately upon removal from the smoke
exposure chamber.
Materials and Methods
Chemical and Reagents
Tetrahydrocannabinol, Cannabidiol, deuterium labeled Delta-9-THC (THC-D3) for
mass spectroscopy (~99% pure) were purchased from Ceriliant (Texas, USA). Double
distilled water was obtained in-house (Department of Pharmaceutics, University of
Florida). All other reagents and chemicals such as methanol, acetonitrile, ammonium
formate, and formic acid were purchased from Fisher Scientific (PA, USA).
Instrumentation and Chromatographic Conditions
Shimadzu UFLC-Nexera X2 system (Kyoto, Japan) consisted of an LC-30AD
pump, SIL-30AC autosampler, CTO-30A column oven and DGU-20ASR degasser. The
ionization and detection of the analytes were carried out on the ABSCIEX API 5500 Q-
Trap mass spectrometer (AB Sciex, Framingham, MA, USA). All data analysis was
performed with the Analyst 1.6 software (AB Sciex, Framingham, MA, USA).The mobile
phase A was 10mM Ammonium formate buffer with 0.1% formic acid and mobile phase
B consisted of methanol. Separations were achieved using isocratic elution at a flow
rate of 1 mL/min. The sample injection volume was 20 µL and the total analysis run time
of a single injection was six minutes.
Bioanalysis of the analytes was performed using an ABSCIEX API 5500 Q-Trap
mass spectrometer (AB Sciex, Framingham, MA, USA) coupled with a Turbo V Ion
Source operated in the positive electrospray ionization (ESI) mode. The mass
spectrometric detection of the analytes and the IS was performed in the multiple

31
reaction monitoring modes (MRM). Tuning by infusion the analytes (10 µL/min) and IS
was performed to determine various compound dependent and source dependent
parameters.
Stock and Standard Quality Controls
Stock solutions (1 mg/ml) of THC, CBD, THC-D3 and rimonabant were prepared
in methanol and DMSO respectively. A mixed stock containing THC, CBD and
Rimonabant were prepared in methanol at a concentration of 10 µg mL-1 From that
mixed stock working standards were freshly prepared and spiked (5 µl) into blank
plasma (45 µL) to obtain concentrations of 0.1-100 ng/mL. Five different quality control
(QC) samples viz, lower limit of quantification (LLOQ) low limit of quantification (LQC),
middle quality control 1 (MQC1), middle quality control 2 (MQC2) and high-quality
control (HQC) were prepared daily in 5 replicates. All the stocks were stored at the
freezer at 2-8 °C and found to be stable during the whole validation.
Extraction Procedure
The extraction of cannabinoids and rimonabant from rat plasma was done using
a 2 step process involving protein precipitation (PPT) followed by liquid-liquid extraction
(LLE). THC-D3 was diluted in acetonitrile to obtain a concentration of 100 ng/mL, and
100 µL of the solution was added in order to precipitate the proteins. The samples were
vortexed for 10 seconds, and 1000 µL of hexane was added to this. After vortexing for
another 30 seconds, the samples were centrifuged at 10000 rpm for 10 minutes. To
finish the extraction 900 µL of the supernatant was transferred into a new vial and dried
using nitrogen evaporator for 10 min. Dried samples were then reconstituted with 100
µL of methanol, and 20 µL was injected into the chromatographic system.

32
Assay Validation Procedure
The LC-MS/MS method was validated as per USFDA Bioanalytical Method
Validation guideline, covering validation parameters like linearity, specificity, and
selectivity, accuracy and precision, matrix effects, stability and extraction and recovery.
The calibration curve consists of a blank sample (blank plasma without analyte or IS), a
zero sample (plasma + IS) and 8 non-zero samples (0.1-100ng/ml). By using the peak
area ration of the analyses and the IS against the standard nominal concentration of
calibration standards in the matrix the calibration curve was plotted.
Selectivity and sensitivity
The selectivity was investigated by analyzing processed blank plasma collected
from six different batches with samples spiked with analytes at LLOQ. Specificity was
established as were no interfering peaks at the retention time of the analytes and IS.
Sensitivity was established as the lowest analyst concentration (LLOQ) which was
within the acceptable accuracy and precision limits.
Stability and recovery
Recovery was conducted at 3 QC levels (LQC, M2QC and HQC) in triplicates.
Where the peaks areas of the extracted samples were compared with non-extracted
acetonitrile and water samples to obtain relative recovery and absolute recovery. The
stability of all the analytes were done at LQC, M2QC and HQC in duplicates. Three
cycles of freeze thaw, bench top, short term and long term were performed. Samples
were considered stable if the accuracy and precision were within the acceptable limits.

33
Intra-day and inter-day accuracy and precision
The intra-, and inter-day accuracy and precision were determined by analyzing 5
replicates of QCs (LLOQ, LOQ, M1QC, M2QC and HQC) in rat plasma. The results
should be within 15% deviation except for the LLOQC, which should be within 20%
deviation from the nominal concentration value.
Matrix effect
Matrix effect on ion suppression or enhancement or extraction efficiency was
addressed by comparing peak areas of the QCs (LLOQ, LQC, M1QC, M2QC and HQC)
spiked in processed blank samples to QCs spiked in neat solutions performed in six
replicates.
Results
Method Development
Various LC conditions were optimized during the method development to get
peaks with best sensitivity and symmetrical. Mobile phases which were used to achieve
chromatographic separation consisted of methanol and 10 mM ammonium formate
buffer containing 0.1% formic acid. Robustness of the method was evaluated against
various columns from 50 µm to 150 µm in length. The best separation with good
sensitivity and peak shapes was achieved with Waters Symmetry, C18 column (150 mm
× 4.6 mm i.d. 5 µm) column. ESI positive mode was finalized for ionization after
comparison between electrospray ionization (ESI) and atmospheric pressure chemical
ionization source (APCI). Higher sensitivity was observed with ESI, relative to APCI.
The most abundant parent/daughter ions, compound dependent and source dependent
parameters were given in the Table2-1. A stable isotope labelled analyte or structural

34
analogue is desirable as IS in mass spectrometry, hence THC-D3 was chosen as the
internal standard.
Method Validation
Selectivity
The method showed good selectivity as no endogenous peaks interfered with the
peaks of analytes. The retention times of CBD , THC and Rimonabant were 2.6 , 4.8
and xx min respectively. The peaks of the IS and analytes showed little variability with
the relative standard deviation (R.S.D) within the acceptable +- 15%.
Calibration curve and linearity
A calibration curve cure for rat plasma ranging from 0.1 to 100 ng/ml was
constructed using 8 calibrators. The average intra-day and inter-day regression
coefficient was found to be >0.99. With this method the LLOQ with %R.S.D <20 and a
signal to noise ratio (S/N) > 10 was seen at 0.1 ng/ml.
Extraction efficiency and matrix effect
The % mean recovery of the analytes are shown in Table 3. This data suggest
that PPT followed by LLE provides efficient and reproducible recovery for all the three
analytes. No significant matrix effect was observed in all of the six-tested rat plasma lots
at the LLOQC, LQC, M1QC, M2QC and HQC concentration.
Accuracy, precision and stability
Accuracy and precision were calculated at 5 different QC levels LLOQ, M1QC,
M2QC and HQC (n=5) for 5 days. The intraday and interday variability was less than
15% at all the concentrations indicating the method was accurate and precise or the
given concentration range from 0.1-100 ng/ml.

35
Summary
A rapid, sensitive, reproducible and robust bioanalytical method was developed
for THC, CBD, and rimonabant in the rat plasma using LC-MS/MS. The present method
enables the quantification of analytes up to 0.1 ng/mL precisely which helps in
understanding the elimination phase in a better way. Moreover, this method requires
only 50 µL for the processing, and this low volume of sample requirement is helpful in
the rodent study. This method can be used in the routine analysis of THC, CBD or
rimonabant in the complex matrices such as plasma. To the best of our knowledge, this
is the first developed and validated sensitive method which enables the quantification of
cannabinoid-1 receptor agonist’s and antagonist in a single run with shown application
in an inhalation pharmacokinetic study.

36
Table 2-1. Optimized source and compound dependent parameters for THC, CBD, Rimonabant and THC-D3
Source Parameters Value Curtain Gas (psi) 10 Collision Gas (psi) Medium IonSpray Voltage (eV) 5500 Source Temperature (°C) 500 Ion Source Gas 1 (psi) 45
Ion Source Gas 2 (psi) 35
Compound Parameters THC CBD Rimonabant THC-D3
Q1 Mass (Da) 315.3 167.2 463.2 318.2 Q3 Mass (Da) 193.1 177.4 363.2 196.2 DP (ev) 74 74 90 74 CE (ev) 33 33 62 33 EP (ev) 13 13 13 13 CXP (ev) 9 9 9 9 Dwell Time (msec) 200 200 200 200

37
Table 2-2. Accuracy and Precision for within batch and between QC samples
Level Nominal Conc.
(ng/mL)
Intra-day Inter-day
CV (%) % Bias CV (%) % Bias
THC
LLOQ 0.1 3.76 8.00 4.40 7.11
LQC 0.3 4.48 -7.08 7.84 3.53
M1QC 5 4.34 4.52 6.57 -0.16
M2QC 40 6.17 6.93 6.45 3.93
HQC 80 7.00 3.27 6.37 2.93
CBD
LLOQ 0.1 5.16 13.60 6.58 10.33
LQC 0.3 6.54 2.80 7.10 7.24
M1QC 5 5.88 -1.24 8.29 -2.61
M2QC 40 8.35 5.30 10.24 1.74
HQC 80 7.73 10.55 9.68 0.62
Rimonabant
LLOQ 0.1 8.10 11.53 6.26 9.28
LQC 0.3 7.48 -7.33 7.68 -3.87
M1QC 5 5.86 -4.01 7.61 -1.40
M2QC 40 6.52 8.55 8.98 1.13
HQC 80 5.50 10.61 5.81 8.96

38
Table 2-3. Mean extraction recovery of analytes in rat plasma
Analytes LLOQ (%) LQC (%)
M1QC (%)
M2QC (%)
HQC (%)
THC 74.32 ± 6.50 79.23 ± 5.75 77.83 ± 4.26 75.84 ± 4.21 75.03 ± 3.89
CBD 77.85 ± 5.55 72.73 ± 5.92 74.79 ± 5.79 72.85 ± 7.77 76.02 ± 5.62
Rimonabant 83.75 ± 6.64 82.53 ± 7.24 85.16 ± 7.51 81.90 ± 5.55 82.08 ± 3.57
Table 2-4. Mean Stability of analytes in rat plasma
Level
Nominal Concentration (ng/mL)
Long-term Stability (At -70 ± 10 °C, 30 days) % Accuracy
Short-term Stability (At 20 °C, 24 hr) % Accuracy
Freeze-Thaw Stability (At, -70 ± 10 °C % Accuracy
Autosampler stability (At 20 °C, 24 hr) % Accuracy
THC LQC 0.3 108.30 103.20 112.80 105.30 HQC 80 97.20 104.40 109.20 99.97
CBD LQC 0.3 106.50 97.50 108.50 103.60 HQC 80 103.30 99.60 105.21 96.80
Rimonabant LQC 0.3 96.90 95.70 106.25 104.50 HQC 80 99.40 104.30 109.50 102.30

39
Figure 2-1. Figure Structures of THC, CBD and Rimonabant Chemical structures of (a)
∆9-tetrahydrocannabinol (b) cannabidiol and (c) rimonabant.

40
Figure 2-2. Representative Chromatograms for the compounds Representative MRM ion-chromatograms of (a) blank rat plasma (THC, CBD and IS), (b) blank rat plasma (Rimonabant & IS), (c) Calibration curve sample chromatogram THC (4.05 min) & CBD, (2.24 min) min), (d) Calibration curve sample chromatogram Rimonabant (2.63 min), (e) chromatogram of PK sample of THC, CBD and IS and (f) chromatogram of PK sample of Rimonabant & IS

41
CHAPTER 3 PHARMACOKINETICS OF TETRAHYDROCANNABINOL IN RATS
Background
THC is a lipophilic compound which readily gets distributed into excessively
perfused organs like the brain and spinal cord, followed by adipose tissue. It is mainly
metabolized by in the liver by cytochrome P450 2C9 and 3A4 enzymes. However, the
rate limiting steps in the metabolisms is diffusion of THC back from the tissues such as
fat, which contributes to its long half-life. The major metabolite is 11-OH
tetrahydrocannabinol which is an active metabolite. Smoking is the most preferred way
of abusing in humans due to dose titration. THC is most commonly administered
systemically in animal models and a the terminal half -life ranges from 1.3-7.3 (h) in
rats(Valiveti et al., 2007; Zgair et al., 2016, 2015). A summary of the pharmacokinetic
parameters observed in rats has been presented in Table 3-1. The dose-effect
relationships have been characterized after parenteral administration, but smoking
remains the most preferred way, and only a few studies have investigated the effects
after exposing rodents to crude marijuana smoke(Nguyen et al., 2016; Wilson et al.,
2006).The purpose of this study is that, since smoking is the most preferred route of
administration in humans, establishing an animal model of smoke exposure to predict
the pharmacokinetics of THC, would give a better insight into the underlying
mechanisms. This animal model can then be applied to study various behavioral effects
of THC.

42
Materials and Methods
Subjects
Male Wistar rats (Charles River, Raleigh, NC) with jugular vein characterization
weighing 300-350 g were used. The rats were shipped to the UF Animal Care Services
(ACS) center a week before the study started in order for acclimatization. Animals were
socially housed (2 per cage) in a temperature and humidity controlled vivarium and
maintained on a 12 hour light-dark cycle. All experiments were performed during the
light phase of the cycle. Food and water were available ad libitum in the home cages.
All subjects were treated in accordance with the National Institutes of Health guidelines
regarding the principles of animal care. Animal facilities and experimental protocols
were in accordance with the Association for the Assessment and Accreditation of
Laboratory Animal Care (AAALAC) and approved by the University of Florida
Institutional Animal Care and Use Committee.
Drugs
Cannabis cigarettes containing 5.3% THC and pure THC dissolve in methanol
were provided by NIDA. Rimonabant was purchased from Sigma Aldrich. THC was
dissolved in mixture of ethanol, PEG, HPBC and the volume was made up with saline to
attain the desired concentration. Rimonabant was dissolve in a mixture of DMSO and
TWEEN 80.
Drug Analysis
THC, Rmionabant plasma concentration were determined using the method
which was developed and validated in chapter 2. In brief, calibration curve sample and
quality control samples were prepared on the day of plasma analysis. 50 ul of plasma
which was collect from the subject was then spiked with 100 ul of ACN containing (IS).

43
To this mixture 1000 ul of hexane was added and 900 ul was separated out after
centrifugation of 10 min. The supernatant was dried and reconstituted in 100 ul of
methanol. 20 ul of the sample was injected in the LCMSMS system using 10 mm
Ammonium formate buffer containing 0.1% formic acid and methanol as the aqueous
and organic mobile phases.
Experimental Design
The study was performed with the approval of the Institutional Animal Care and
Use Committee (IACUC) of the University of Florida (Protocol #). All experiments were
conducted between 8:30 and 10:30 AM. Animals were randomly assigned to the three
treatments (1 mg/kg (i.v), 5 cigarettes, 10 cigarette, 5 cigarettes + rimonabant) n = 3-4
per group). For the first group THC was administered through intravenous (i.v) injection.
The second and third groups were exposed to 2 different durations of cannabis smoke
i.e 50 and 100 min respectively and for the fourth group rimonabant was administered
(i.p) immediately upon completion of smoke exposure. Each blood sample withdrawn
was replaced by an equal volume of heparinized 0.9% saline (20 IU heparin/mL). Serial
blood samples were collected in heparinized microtubes at 10, 20, 40, 60, 120, 240, 480
and 600 minutes after drug administration. Only for THC (iv) 1 mg/kg an additional 24 hr
time point was collected. Plasma (200 µL) was separated from the blood by
centrifugation at 10,000 rpm for 5 minutes and frozen at 80 °C until analysis.
Dose Metrics
Dose calculations for inhalation studies are usually not straight forward. Some of
the sources of variability include particle size, location of the deposited fraction and
mode of exposure. Typically a theoretical estimate can be obtained using various
approaches. Previous literature presented an indirect way of calculating the delta-9-thc

44
doses for marijuana inhalation studies. Only a fraction of the total amount of THC is
present is available for inhalation as a part of it is lost due to pyrolysis and also as side
stream smoke. Data suggested that about 50% of the THC is lost due to pyrolysis and
only 30-45% of the remaining drug is available for inhalation after accounting for loss of
drug due to side stream smoke(Rosenkrantz and Braude, 1974) and only about 80% of
the lung deposited dose will reach the systemic circulation. Hence all these factors must
be accounted for while calculating the delivered dose. The Teague enterprises smoke
machine characterized the content of the cigarettes smoke and provided the calibration
curves of nicotine cigarettes to under the amount of nicotine smoke exposure. The
concentration inside the exposure chamber was 12.5 ug/L when 125 was the TSP
(mg/m3) after 5 cigarettes, we calculated the ratio after each nicotine cigarette and this
showed a proportional increase with an r2 of 0.99 in the used the ratio (mean) of TSP
to Nicotine (0.09) to calculate the dose of TSP to delivered THC for concentrations
inside the chamber. The TSP values after 5 THC cigarettes was 134.6 mg/m3 which
would deliver a concentration of 13 ug/L. Based on these assumptions we calculated
the concentration of the drug which would be present in the exposure chamber (264L)
for the animals to inhale. After obtaining the concentration of THC inside the exposure
chamber (using both the indirect method and using tsp values) we calculated the lung
deposited dose using the following equation(Alexander et al., 2008):
𝐷𝑒𝑙𝑖𝑣𝑒𝑟𝑒𝑑 𝐷𝑜𝑠𝑒 (𝑚𝑔
𝑘𝑔) = 𝐶 ∗ 𝑇 ∗ 𝑅𝑀𝑉 ∗
𝐷𝐹
𝐵𝑊
𝑅𝑀𝑉 = 0.608 ∗ 𝐵𝑊(0.852)
(3-1)
(3-2)

45
Where C is Concentration of the drug (mg/L), T is Total time of exposure (min),
RMV is Respiratory mean volume, DF is the Fraction deposited, BW is Body weight
(kg).
The delivered dose was calculated to be 0.05 mg/kg and 0.2 mg/kg (using both
the methods) where 10% of the total drug was assumed to be the deposition factor.
Typically for rodent 10% is used and 25% is assumed for non-rodent species. Plots and
Tables used for dosimetry provided at the end of chapter Figure 3-4, Table3-7,
Table 3-8.
Data Analysis
Noncompartmental analysis (NCA) of the data was conducted with Phoenix
version 8 (Pharsight Corporation, Mountain View, CA). To determine the basic structural
PK for THC and Rimonabant, two and three compartment models were tested for THC
and one and two compartment models were tested for Rimonabant (Figure 3-1, 3-2, 3-
3). The purpose of the these structural models was to be able to simulate the
pharmacokinetics profiles for the given study design which involved repeated dosing
and relate this to the observed pharmacodynamics. Then population PK parameters
were estimated using nonlinear mixed-effects modeling as implemented in the
NONMEM software version 7.The population PK parameters of were estimated using
both was used for data processing and graphically presenting. The three compartment
model was parameterized in terms of the clearance (CL), Central Volume (V1),
Peripheral Volumes (V2 and V3) and clearance governing the distribution from V1 to V2
and V1 to V3 by Q1 and Q2 respectively. The Advan 6 and TOL=3 subroutines were
used in NONMEM for THC. Data obtained after smoke exposure studies was modeled

46
as an intravenous infusion where the total amount of calculated dose was delivered at
rate such that it was administered in 50 and 100 min respectively. The Two
compartment model for rimonabant was modeled using ADVAN 4 TRANS 4 subroutine,
which was parameterized for rate of absorption (ka), V1 and V2 for the central and
peripheral volume, CL and Q representing the total and inter compartmental clearance.
Assuming that the variability between subjects (ISV) follows log normal distribution,
exponential error model was used to account for ISV variability:
𝑇𝐻𝐸𝑇𝐴𝐼 = 𝑇𝐻𝐸𝑇𝐴𝑇𝑉 ∗ 𝐸𝑋𝑃(𝑛𝑖) (3-3)
Where, THETAi is Individual parameter ,THETATV= Typical values or population
means for the respective parameters, ήi= ISV value (normally distributed).
A proportional error model for THC and a combined error model for rimonabant
was used to explain residual error. Selection was done based on inspection of GOF’s.
The residual error model explains all the other error which the IIV does not
capture for example structural model misspecification or an analytical measurement
error.
Model selection and identification was based on the likelihood ratio test, PK
parameter point estimates and their respective confidence intervals, parameter
correlations, and GOF’s.
A decrease of 6.6 or 9.2 points in the OFV after addition of one or two
parameters respectively is considered significant difference of OFV assuming that the
difference between the OFV follows a chi squared distribution.
𝐴𝐼𝐶 = 𝑂𝐹𝑉 + 2 ∗ 𝑃 (3-4)

47
where p = total number of parameters in the model (structural + error). For
hierarchy model comparison, the model with lower value of AIC was considered better.
Over all model fitting was asses by plotting the observed plasma concentration of all
individuals and population prediction (PRED).GOF”s were also subjected to visual
inspection to detect systemic deviations from the model fits residuals (RES) versus
PRED, individual observed concentration (DV) versus PRED or individual predicted
(IPRED) values, and conditioned weighted residuals (CWRES) versus PRED. Finally
visual predictive check (VPC) were done for internal validation.
Results
Non-Compartment Analysis of THC
The pharmacokinetic profile of THC after intravenous and passive smoke
exposure is shown in Figure 3-5, 3-6. Upon obtaining the pharmacokinetic profile a non-
compartmental analysis was performed in order to estimate the pharmacokinetic
parameters for both the routes of administration. The maximum concentration of THC
(Cmax) was seen as soon as the rats were taken out from the exposure chamber and
the concentrations declines with a terminal half life of 3.7 hours. Total AUC0-t (h*ug/L)
of THC after 0.05, 0.2, 1 mg/kg was 12.2, 38.2 and 276. The calculated r2 for AUC was
0.99. The clearance was calculated to 1.2 (l/h) and the volume of distribution was 4 L.
Results from the NCA are presented in Table 3-1.
Non-Compartment Analysis of THC when Co-administered with Rimonabant
The pharmacokinetic profile of both the compounds are shown in Figure 3-8 and
Figure 3-9. Upon obtaining the pharmacokinetic profile a non-compartmental analysis
was performed in order to estimate the pharmacokinetic parameters for both the
compounds. THC declines with a terminal half-life of 3.7 hours, total AUC0-t(h*ug/L) of

48
THC after 0.05 mg/kg was 12.2. The clearance was calculated to 1.1 (L/h). The
maximum concentration (Cmax) of 88.6 +/-5.64 for rimoanbant was seen 10 minutes after
i.p administration and it declines with a terminal half life of 5.4 hours total AUC0-t(h*ug/L)
of Rimonabant after 3 mg/kg was 308.15 . The clearance (CL/F) was calculated to 2
(l/h). NCA results for THC with rimonabant and for Rimoanabant are present in the
Tables 3-2 and 3-3 respectively.
Compartment Modelling for THC
The PK compartmental analysis for THC was done using both two and three
compartmental models. The OFV with the two compartment model was 153.97 and with
the three compartment model was 113.88. This was highly significant change, also the
goodness of fit plots fit plots with the 3 compartment model were better compared to the
two compartment model which suggest that the structural model of THC follow 3
compartment distribution. A three compartment model with no between subject yielded
the best fit. An AIC value of 127.7 on the base model dropped down to 115.35 on
addition of 1 parameter (BSV on clearance), suggesting that the mode fitting showed
significant improvement, but the base model was retained as the final model due to
easy of application. The parameters for clearance (L/h) and compartmental volumes (L)
were 0.85 and .56, 0.49, 1.26 respectively. The parameters for THC population model,
goodness of fit plots ,VPC’s and individual fits for are presented in Table 3-5 and Figure
3-10, 3-11, 3-12 .
Compartment Modeling for Rimonabant
The PK compartmental analysis for rimonabant was done using both one and
two compartment models. The OFV with the one compartment model with absorption
(ka) was 178.19 and with the three compartment model was 157.79. This was highly

49
significant change, also the goodness of fit plots fit plots and the individual plots with the
2 compartment model were better compared to the one compartment model which
suggest that the structural model of rimonabant follows 2 compartment distribution. The
two compartment model with between subject variability on clearance from the central
compartment (CL/F) yielded the best fit. The AIC value (167.7) on the base model
dropped down to 157 on addition of 1 parameter, suggesting that the model was not
over parameterized. The parameters for apparent clearance (L/h) and compartmental
volumes (L) were 1.97 and 2.13, 13.36 respectively. The rate of absorption from the
dosing compartment to central compartment (ka) was estimated to be 2.8h-1. The R.S.E
of the predicted values was within the acceptable limits. The IIV for CL/F was 0.04. The
parameters for rimonabant population model, goodness of fit plots, visual predictive
checks and individual fits are presented in Table 3-6 and Figure 3-13, 3-14, 3-15.
Discussion
In this study the pharmacokinetics of Tetrahydrocannabinol in male wistar rats
with doses 0.05, 0.2, 1 mg/kg were investigated. And the pharmacokinetics of THC with
co-administration of rimonabant was also investigated. A population three compartment
linear model was proposed to describe the data for THC and a two compartment model
with first order absorption was used to describe the kinetics of rimonabant following
intraperitoneal injections. Validation suggests that the model is a robust model to predict
the population pharmacokinetics of the compounds in rats. Terminal elimination half-life
for THC that were obtained using NCA was consistent with the literature reported values
which ranges from 1.2-8 hours. The parameter estimates for clearance is also in the
range 0.3-4 (L/h). Previously a two compartment model was used to model the
pharmacokinetics of THC after intravenous administration in rats(Valiveti et al., 2007).

50
However, THC is a highly lipophilic drug and gets rapidly distributed in the highly
perfused organs such as the lung and brain, followed by the distribution into the adipose
tissue where it gets stored for a long period of time. Hence as three compartment model
would better explain the distribution of THC compared to a two compartment model.
The population pharmacokinetic in humans has also been described a 3 compartment
population model(Heuberger et al., 2015). The estimates for clearance which were
obtained is close the hepatic blood which is around 1.5 (L/h) for rats which indicates a
high extraction drug as reported in the literature. Therefore based on these results we
can say that the final three compartment model assuming linear PK is reasonably
powerful in order to predict the plasma concentration of tetrahydrocannabinol in rats.
Though numerous studies done in rodent models use rimonabant as a standard to
understand the CB1 receptor mediated effects, much information is not available on the
exposure to link it with the behavior observed in order to get reliable pharmacodynamic
parameters. This further implies that a whole body cannabis smoke exposure model can
be used to explain the exposure-response relationships and help to understand some of
the underlying mechanisms of cannabinoid dependence and withdrawal.

51
Table 3-1. Phamramcokinetic Parameters of THC in rats reported in literature
PK PARAMETER
THC IV THC IV THC IV THC Intranasal (PEG)
THC Intranasal (PEG+ Ethanol)
Dose (mg/kg) 1 4 5 10 10 Half-life 7.27±01.95 4.6±2 1.42 1.1±0.13 1.7±0.59 CL (l/h)/CL/F* 3.37±1.47 0.9±0.2 0.31 5.07±1.9* 3.60 ±0.59* VolumeSS (L) 9.69±5.5 2.37±0.1 0.29 - -
AUC0-t(h*ug/L) 331±119 1624±334 4679 212±79 301±100
Table 3-2. Phamramcokinetic Parameters obtained after performing NCA using
Phoenix8.0
PK PARAMETER THC IV THC Inhalation THC Inhalation
Dose (mg/kg) 1 0.05 0.2 Half-life 8.8±0.5 3±0.8 3.3±0.7 CL (l/h) 1.05±0.01 1.1±0.15 1.4±0.15 VolumeSS (L) 3.56±0.06 3.3±1.02
4.1±0.11
AUC0-t(h*ug/L) 276.06±4.5 12.4±1.75 38.2±3.8 AUCinf(h*ug/L) 285.05±3.3 13.1±1.6
41.4±4.7
Table 3-3. Pharmacokinetic Parameters obtained after performing NCA using when
Rimonabant was co-administered with THC
PK PARAMETER Rimonabant
Dose (mg/kg) 3 Half-life 5.4±0.85 CL (l/h) Volume (L) AUC0-t
2±0.3 15.5±1.06 308.15±55
Table 3-4. Phamramcokinetic Parameters of THC upon co-administration with
Rimonabant obtained after performing NCA using Phoenix8.0
PK PARAMETER THC Inhalation
Dose (mg/kg) 0.05 Half-life 3.7±1.3 CL (l/h) Volume (L) AUC0-t
AUC0-inf
1.1±0.26 3.9±2.07 12.2±3 13.9±3.8

52
Table 3-5. Phamramcokinetic Parameters obtained after performing compartmental analysis for THC
PK PARAMETER THC- IV RSE %
CL (L/h) 0.85 5 V1 (L) 0.56 15 V2 (L) Q2(L/H) V3(L) Q3(L)
0.49 0.46 1.26 0.14
16 24 10 12
Table 3-6. Phamramcokinetic Parameters obtained after performing compartmental
analysis for Rimonabant
PK PARAMETER Rimonabant-IP RSE %
CL/F (L/h) 1.97 9 V1/F (L) 2.13 3 V2/F (L) Q (L/H) Ka (h-1) IIV_CL
13.36 16.53 2.80 0.05
4 19 14 45

53
Table 3-7. Nicotine Chamber concentration vs TSP
Cigarette TSP (mg/m3) Nic (ug/L) (Chamber) Ratio(NIC/TSP)
1 25 2.5 0.1
2 40 5 0.12
3 50 7.5 0.15 4 100 10 0.1 5 125 12.5 0.1
6 150 13.5 0.09 7 175 15 0.08
8 200 16.5 0.08 9 250 18 0.07 10 325 20 0.06
Mean 0.09
Table 3-8. THC Delivered dose calculation.
Cig Weight(g) THC Amount of THC (g)
Toal THC (mg)
THC remaining after Pyrolysis (50%)
Available for animal inhalation(30%)
Volume of chamber (L) mg/L
Number of exposure cages
inside the chamber (4)
1 0.9 5.30% 0.047 47.7 23.85 7.155 264 0.027
0.006
5 3 0.14 143.1 71.55 21.465 0.08
0.02
10 7.2 0.34 343.44 171.72 51.516 0.19
0.047

54
Figure 3-1. One Compartment Pharmacokinetic Model
Figure 3-2. Two Compartment Pharmacokinetic Model

55
Figure 3-3. Three compartment pharmacokinetic model
Figure 3-4. TSP (mg/m3) vs Nicotine (ug/L)

56
Figure 3-5. Plasma Concentration Of THC after Intravenous Administration

57
Figure 3-6. Plasma Concentration of THC after passive smoke inhalation (0.05 mg/kg)

58
Figure 3-7. Plasma Concentration of THC after passive smoke inhalation (0.2 mg/kg)

59
Figure 3-8. Plasma Concentration of THC after passive smoke inhalation in presence of
Rimonabant (0.05 mg/kg)
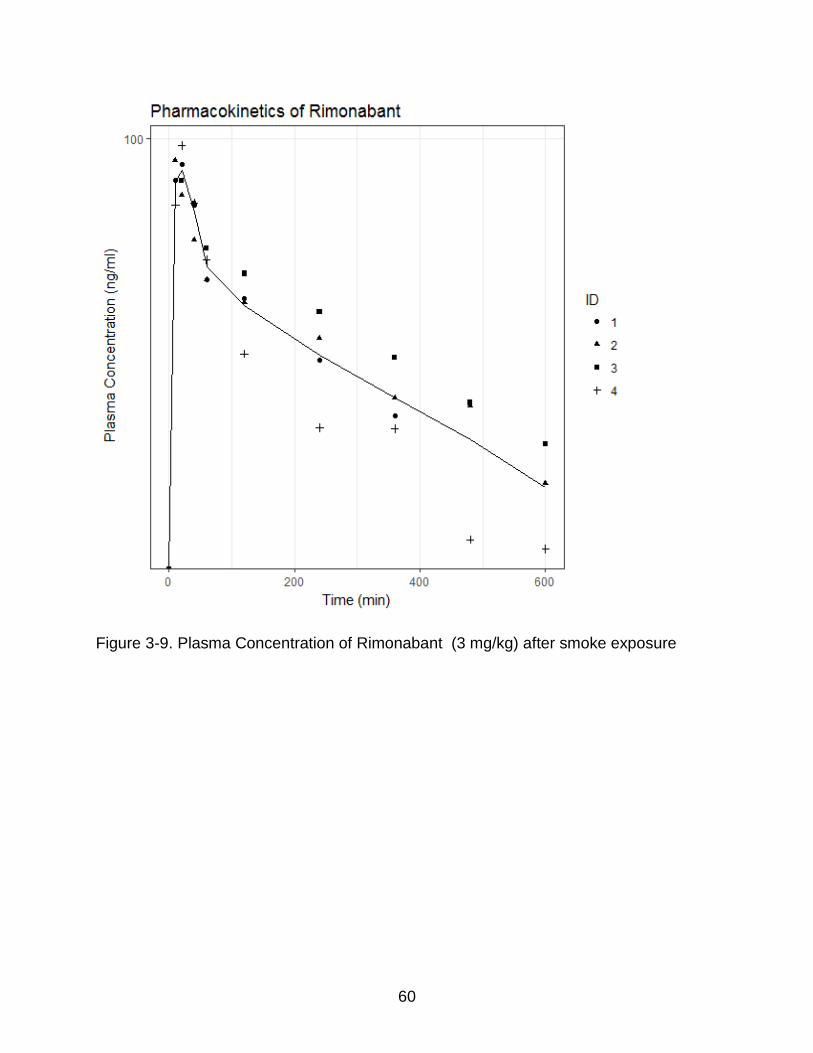
60
Figure 3-9. Plasma Concentration of Rimonabant (3 mg/kg) after smoke exposure

61
Figure 3-10. Goodness of fit plots for THC PK model
Figure 3-11. VPC for THC PK model
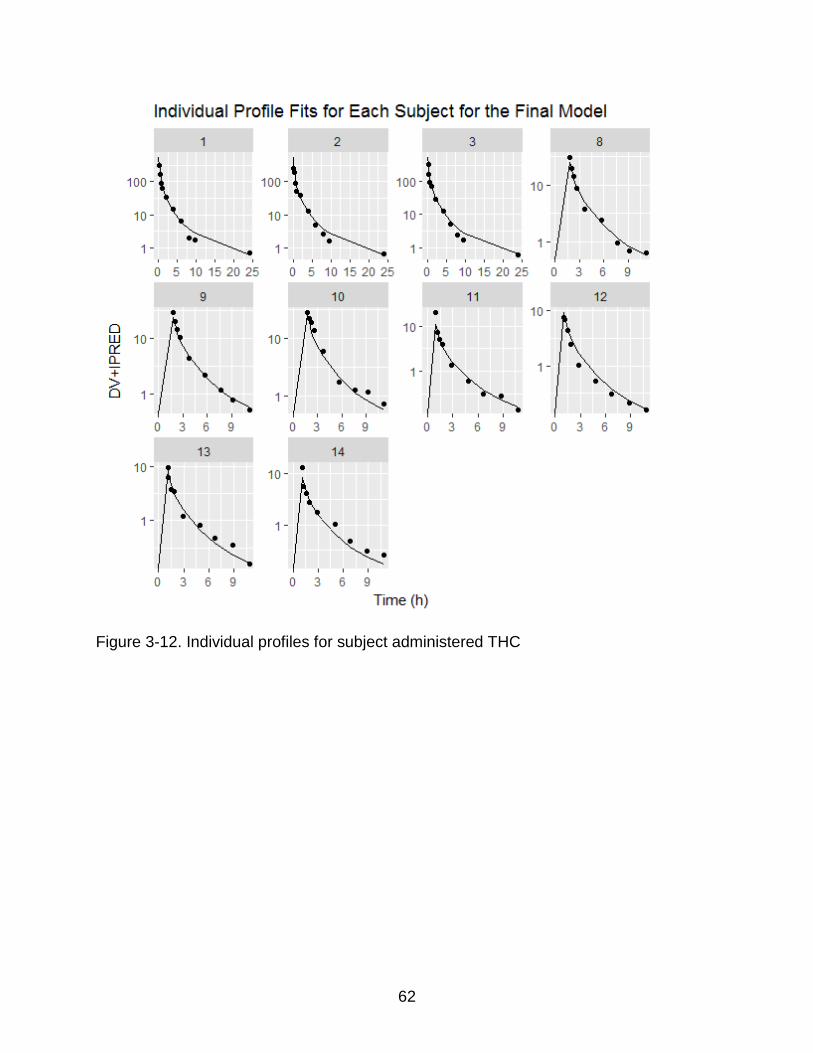
62
Figure 3-12. Individual profiles for subject administered THC

63
Figure 3-13. Individual profiles for subject administered rimonabant (i.p)

64
Figure 3-14. GOF’s rimonabant (i.p)
Figure 3-15. VPC rimonabant (i.p)

65
CHAPTER 4 CHARACTERIZATION OF CANNABINOID ABUSE AND WITHDRAWAL
Cannabiniod Abuse
Cannabis plant contains over 100 compounds that are cannabinoids and THC is
the psychoactive ingredient responsible for the psychopharmacological effects. The use
of cannabis and also synthetic cannabinoids such as spice is on a rise on a whole and
especially gaining popularity in young adults. It is estimated that over 8 million people
were using cannabis on a regular basis and more that 800 thousand people were treat
for cannabis use.(Panlilio et al., 2015) Recently FDA has also expressed concerns over
orally consumed cannabis products due to the number of deaths associated with over
dose which can lead psychosis and suicidal symptoms(Benjamin and Fossler, 2016).
Cannabis which is prescribed for medical use which is given orally has also shown to
develop dependence symptoms(Panlilio et al., 2010). Therefore the endocannabinoid
system can be considered as a double edged sword if considered as a potential target
in the process of drug discovery and hence it is important to understand the underlying
mechanism of cannabinoid addiction and abuse potential. Theories of cannabinoid
reward or dependence must be ultimately clinically validated but research in animals
can help understand effects in humans. Although behavioral effects can be conducted
in humans, results are very subject which typically leads to high variability or in
consistent trends. Some of the other advantages of laboratory animals include access
to brain areas which cannot be accessed in a clinical setting to study the underlying
mechanism of addiction due to ethical reasons. Various animal models have been used
to characterize the behavioral effects of cannabinoids. Self -administration studies in
rodents and non-human primates have suggested that THC like other drugs of abuse

66
has rewarding effects(Justinova et al., 2003; Tanda et al., 2000; Zangen, 2006). These
findings further pushed the research to test the effect of cannabinoid administration
under different paradigms such as Intracranial self- administration (IVSA), Intracranial
self- stimulation (ICSS) and Conditioned Place Preference(CPP) to evaluate and
understand different behavior exhibited by the animals under various conditions.,. The
effects were cannabinoid 1 receptor mediated as CB1 blockage antagonized THC’s
actions which resulted in withdrawal in THC dependent mice. (Järbe et al., 2011;
Katsidoni et al., 2013; Lichtman and Martin, 2002; Panagis et al., 2014; Wilson et al.,
2006). Most of the studies which investigated behavioral effects of THC have evaluated
using systemic administration of THC, however smoking in the most common route of
cannabis abuse and relatively few studies were done using inhalation model(Lichtman
et al., 2001b; Nguyen et al., 2016). While it is expected that inhalation of cannabis
smoke can lead to dependence, how other cannabinoids present in the plant material
might interact with THC or extent their own is yet to be fully understood. Studies done
using THC smoke inhalation have suggested that THC can induce dependence by
observing reversal of THC’s effects in the cannabinoid tetrad and somatic signs of
withdrawal when rimonabant was administered to cannabis smoke exposed animal
compared to navie animals(Bruijnzeel et al., 2016; Lichtman et al., 2001b; Wilson et al.,
2006). Studies comparing the effect of second hand smoke exposure in nonsmokers
concluded that the subjective effects were directly related to the amount of THC smoke
exposure and also concluded that passive exposure to high amounts of THC smoke can
mimic active smoking(Cone et al., 2015)Based on the information above, we

67
hypothesized that 2 weeks of cannabis smoke using the whole body exposure rodent
model can be applied in the ICSS setting to quantify the extent of dependence.
Materials and Methods
Subjects
Male Wistar rats (n=36), weight range 225 ± 50 g, were obtained from Charles
River. The animals were kept in an environmentally controlled breeding room for at least
one week acclimatization before the surgery. The animals were housed (2 per cage) in
a temperature and humidity-controlled vivarium and maintained on a 12-h reversed
light-dark cycle (lights off at 8 AM), had free access to food and water at all times.
Animal facilities and experimental protocols were in accordance with the Association for
the Assessment and Accreditation of Laboratory Animal Care (AAALAC) and approved
by the University of Florida Institutional Animal Care and Use Committee.
Drugs
Rimonabant hydrochloride (SR 141716A) was purchased from Tocris Bioscience
(Bristol, United Kingdom). Rimonabant was dissolved in a vehicle of Tween 80 (5%
volume/volume, v/v), DMSO (20% v/v), and sterile saline (75% v/v). Freshly prepared
rimonabant was administered in 3 different doses (0.3, 1, 3 mg/kg). High potency
cannabis cigarettes (5.3 % THC) were kindly provided by NIDA Drug supply program.
The cannabis cigarettes were stored at -20°C. About 24 h before being used, the
cigarettes were taken out and placed in an airtight humidity chamber with a small dish
containing saline and kept at room temperature (22–24°C). The cigarettes were used
within one hour of being removed from the humidity chamber.

68
Cannabis Smoke Exposure
Whole body smoke exposure chamber was used for cannabis smoke exposure.
The rats were transferred into fresh the exposure cages just before the smoke exposure
sessions and returned to their home cages after the exposure sessions, they were not
restrained anytime during the smoke exposure as this is a whole body smoke exposure.
Cannabis smoke was generated using a microprocessor-controlled cigarette smoking-
machine (model TE-10, Teague Enterprises, Davis, CA). Smoke was generated by
burning cannabis cigarettes which would mimic human puff pattern (35 cm3 puff
volume, 1 puff per minute, 2 seconds per puff). Mainstream and side stream smoke was
transported to a conditioning chamber. Smoke from condition chamber was then
transported to exposure chamber after diluting with air. Exposure conditions were
monitored for carbon monoxide (CO) and TSP levels. Carbon monoxide levels were
monitored using (Monoxor III, Bacharach, New Kensington, PA USA) a deceive that can
accurately measure between 0-2000 PPM. TSP was measured by passing the smoke in
the exposure chambers through a pre-weighed filter (Pallflex Emfab Filter, Pall
Corporation, Port Washington, NY USA) for 1-2 min. The total suspended particulate
matter per cubic meter was calculated by dividing the weight increase of the filter by the
volume of the airflow through the filter.
ICSS Apparatus
Twelve Plexiglas chambers (30.5 x 30 x 17 cm; Med Associates, Georgia, VT),
each housed in a sound-attenuating melamine chamber (Med Associates, Georgia, VT).
Stimulation parameters all the data and results was controlled by a computer. Each
chamber had a metal grid floor and a metal wheel (5 cm wide) centered on a sidewall. A
detector was attached the response wheel and recorded every 90 degrees of rotation.

69
Brain stimulation was delivered by constant current stimulators (Model 1200C, Stimtek,
Acton, MA). Rats were connected to the stimulation circuit through bipolar leads
(Plastics One, Roanoke, VA) attached to gold- contact swivel commutators (model
SL2C Plastics One, Roanoke, VA).
Experimental Design
The experiment was done in 3 groups of rats. The total duration of each
experiment from the start to completion is 3 months. Experiment began after 1 week of
acclimatization. Rats are said to be stable only when there is <±10% change in their
mean baseline threshold over a 5 day interval. After obtaining a stable baseline, the rats
are expose to cannabis smoke for the first two weeks and thresholds are recorded daily.
Following two weeks of smoke exposure, the rats were considered dependent based on
our previous research(Bruijnzeel et al., 2016) and freshly prepared Rimonabant (0.3, 1,
3 mg/kg) was administered (i.p) immediately upon completion of smoke exposure using
a latin square design. Figure 4-2 and Figure 4-3 shows the experimental design. Rats
were placed inside the ICSS chamber around 30 minutes after the smoke exposure.
Blood Collection
Blood samples were collected in heparinized microtubes at 60 minutes after
smoke exposure. Plasma was separated from the blood by centrifugation at 10,000 rpm
for 5 minutes and frozen at -80 °C until analysis. The blood samples were collected from
the dorsal pedal vein. This was done by anesthetizing the animal, to locate the dorsal
pedal vein which is present on top of the foot. The foot was sterilized using alcohol and
the dorsal pedal vein was punctured using a 23G needle.. Plasma samples were not
collected during the weeks of Rimonabant administration as it can it can affect the ICSS
thresholds.

70
Drug Analysis
THC plasma concentration were determined using the method which was
developed and validated in chapter 2. In brief, calibration curve samples and quality
control samples were prepared on the day of plasma analysis. 50 ul of plasma which
was collect from the subject was then spiked with 100 ul of ACN containing (IS). To this
mixture 1000 ul of hexane was added and 900 ul was separated out after centrifugation
of 10 min. The supernatant was dried and reconstituted in 100 ul of methanol. 20 ul of
the sample was injected in the LCMSMS system using 10 mm Ammonium formate
buffer containing 0.1% formic acid and methanol as the aqueous and organic mobile
phases.
Statistical Analysis
Statistical Analyses to compare the means prior to starting the threshold was
done using one factor anova with treatment as the between group factor. For, brain
reward thresholds and response latencies are expressed as a percentage of the mean
prior to starting the exposure for result 1 and pre-test day values for result 2. Percent
changes in brain reward thresholds and response latencies were analyzed using two-
way repeated-measures analyses of variance (ANOVA), For experiment one the
between subject effects were treatment and the within subject effect were days and for
the second part with the dose of Rimonabant as the within-subjects factor and cannabis
smoke exposure as the between-subjects factor.
Intracranial Self Stimulation
Rats were trained on a modified discrete-trial ICSS procedure(Kornetsky et al.,
1979) as described previously(Bruijnzeel et al., 2007) Figure 4-1 shows the setup, rats
are trained initially to turn the wheel on a fixed ratio 1 (FR1) schedule of reinforcement.

71
Each quarter turn results in delivery of a 0.5 second train of 0.1 millisecond cathodal
square-wave pulses at a frequency of 100 Hz. Upon obtaining successful acquisition of
responding, the rats were trained on a discrete-trial current-threshold procedure. Each
trial started with the delivery of a non-contingent stimulus, followed by a 7.5 second
response window during which response from the animal resulted in a second
contingent stimulus of the same intensity. A response during this 7.5 second response
window is called a positive response. The inter-trial interval (ITI), which follows either a
positive response or end of response window, has an average duration of 10 seconds
(7.5 - 12.5 seconds). A test session consisted of four alternating series of descending
and ascending current intensities which typically lasted 45 minutes and provided two
variables: brain reward thresholds and response latencies.
Results
Effect of THC Dose and Duration on Baseline Reward Threshold
Mean (± S.E.M.) absolute brain reward thresholds before starting cannabis
smoke exposure were for control and THC treated (0.05, 0.2 mg/kg/day 5 days a week
for 2 Weeks) rats were 129.68 ± 32.03, 103.39 ± 28.12, 125.15 ± 36.57 µA,
respectively. Mean (± S.E.M.) thresholds for control and THC treated (0.05, 0.2
mg/kg/day 5 days a week) rats were 126.57 ± 29.30, 97.66 ± 26.12, 125.46 ± 35.29 µA
after 2 weeks of smoke exposure. The mean latencies were 3.29 ± 0.28, 3.19 ± 0.22,
3.2 ± 0.19 seconds. The mean latencies after two weeks of treatment were 3.35 ± 0.48,
3.22 ± 0.32, 3.41 ± 0.23 seconds. The plasma THC levels both the treatments are
presented in Table 4-1. The plasmas THC concentrations around 45-60 min after
smoke exposure were identical during week 1 and week 2 for both the doses. No
difference due to the dose of THC administered was seen in the plasma levels.

72
Statistical Analyses was performed by doing a two way anova with repeated
measures between the three treatments and the change from baseline each day after
the start of the treatment as within subject factor indicated that there was no statistically
significant effect of THC smoke exposure on the baseline thresholds of subjects. Effect
of THC smoke exposure and the change from baseline are presented in Figure 4-1.
There was on change in the latencies of between the treatments.
Effect of Rimonabant Induced Precipitated Withdrawal on Brain Reward Threshold
Mean (± S.E.M.) thresholds and mean latencies for control and cannabis smoke
exposed (0.05, 0.2 mg/kg/day 5 days a week) rats, after 2 weeks of cannabis smoke
exposure were 126.57 ± 29.30, 97.66 ± 26.12, 125.46 ± 35.29 µA and 3.35 ± 0.48, 3.22
± 0.32, 3.41 ± 0.23 seconds respectively.
Statistical analysis indicated that rimonabant induced an elevation in the ICSS
thresholds in rats exposed to THC smoke compared to control animals. Statistical
analysis was performed using THC treatment was between subject factor and
rimonabant as within subject factor for two way anova with repeated measures. There
were significant elevations in the brain reward thresholds in the cannabis treated groups
compared to the control group which were not exposed to cannabis smoke containing
THC. All the doses of rimoanabnt administered in the THC treated animals was
significantly different compared to their respective control dose (0 mg/kg) (Treatment
1x3mg/kg, Treatment 1x0mg/kg, P<0.001). Treatment 2x3mg/kg, Treatment 2x0mg/kg,
P<0.001, Treatment0 (0.33 mg/kg) X Treatment1,2 (3mg/kg), P<0.001, Treatment0
(0.33 mg/kg) X Treatment2 (1mg/kg), P<0.05). There was no significant difference
between the two doses for changes from baseline reward threshold. Both,

73
0.05mg/kg/day and 0.2mg/kg/day were identical and post hoc analysis did not show
significant difference, however both the groups were significantly different from the
control group. So the rats which were treated with 0.05 mg/kg/day and 0.2 mg/kg/day
behaved similarly after rimonabant administrations. The results for rimonabant induced
precipitated withdrawal is presented in Figure 4-2.
Discussion
The present study investigated the effects of dose and duration of cannabis
smoke exposure on development of cannabinoid dependence. The results in the
present study indicate that chronic exposure to even low doses of cannabis smoke can
to the development of dependence as indicated by negative affective effects with
rimonabant induced precipitated withdrawal.
There was no change from the baseline thresholds of the animals which were
exposed to cannabis smoke vs control, although the trend suggesting some decrease
from baseline on day 5 and 8 of smoke exposure. Results from the two anova with
repeated measure using cannabis smoke exposure as between subject factor and time
as the within subject factor suggested that there no effect on the baseline threshold
values for both the doses and also the duration of smoke exposure. In other words it
suggests that THC did not have any synergistic effects on reducing the amount of
stimulation necessary to sustain responding by lowering the ICSS thresholds. This is in
agreement with the previously reported literature that THC and other synthetic
cannabinoid agonists acting of the CB1 receptors did not have an hedonic or anheodic
affects in the ICSS paradigm in rodents(Grim et al., 2015; Vlachou et al., 2007). The
plasma samples which were collected on (Day 4 and 11) at 60 min after smoke
exposure for both the doses had similar THC concentrations, which can mean THC gets

74
rapidly distributed to the highly perfused organs like the brain and slowly redistributed
back to the blood (rate limiting step) followed by elimination and suggesting that plasma
concentration might not be the best reflection of the true behavioral effects of THC. This
suggests that there might be greater exposure in the brain compared to plasma. This is
finding is consistent with the results which were presented in another study trying to
characterize the amount of dopamine efflux after intraperitoneal administration of THC.
The study results show that there is maximum increase in the dopamine levels at 60
min after the injection which can be correlated to the amount of THC in the brain on the
CB1 receptors in the VTA and nucleus accumbens to increase dopamine efflux(Chen et
al., 1991; Covey et al., 2015).
It has been suggested that repeated exposure to cannabis smoke can lead to
tolerance to the subject effects and also induce physical dependence. The prolonged
half-life of THC can mask the withdrawal experienced by people leading to a conclusion
that no withdrawal is experienced upon cessation. However, precipitated withdrawal is a
technique where an antagonist is administered to displace the agonist from the receptor
to study the withdrawal effects which would be experienced. Hence precipitated
withdrawal is technique which is commonly applied to study cannabinoid withdrawal in
animal models(Lichtman and Martin, 2002; Wilson et al., 2006). In order to determine if
chronic exposure to cannabis smoke lead to dependence we treated the rats with Cb1
receptor antagonist Rimonabant. Rimonabant induced a dose dependent increase in
change in the thresholds with the 3 mg/kg showing the maximum increase from
baseline reward threshold. This finding is consistent with the previous studies which
investigated the effects of rimonabant precipitated withdrawal in animal models

75
(Bruijnzeel et al., 2016; Schlosburg et al., 2009; Tsou et al., 1995; Wilson et al., 2006).
There no difference between the elevations in the thresholds for the cannabis smoke
treated groups, but the overall elevations in the cannabis smoke exposed rats were
significantly higher compared to the control rats.
Studies which were performed to understand the effect of Rimoanabant on
dopamine production in the brain reward pathway showed that Rimonabant significantly
decreased the production of dopamine in the nucleus accumbens. These effects were
antagonized by pre-treatment with Cb1 receptor agonists(Lichtman et al., 2001a; Melis
et al., 2007).
It was initially suggested that THC has rewarding like effects in the ICSS
paradigm by Gardner et al (Gardner et al., 1988) after which several cannabinoids were
tested in this paradigm to understand the abuse potential(Grim et al., 2015; Vlachou et
al., 2005). It was also shown that THC has no reward like properties in the ICSS
paradigm(Fokos and Panagis, 2010; Vlachou et al., 2007). It was not until recently that
a biphasic response of THC was suggested wherein THC showed reward-facilitating
effects in the when a low dose was administered and caused aversion when a high
dose was administered(Katsidoni et al., 2013). However one major question which is
still to be address is the effects of THC in the ICSS paradigm after THC smoke
exposure. The findings in our study showed that THC by itself did not change the
baseline thresholds of the animals at both the doses (0.05 mg/kg/day and 0.2
mg/kg/day). This can be related to the amount of DA efflux which might be substantial
enough to see a significant synergy with baseline threshold. This could be due to the
amount of thc entering the brain after administration is not sufficient enough to cause a

76
significant increase in the dopamine efflux which could be quantified based on the
change in threshold. There have also been some stain specific efflux in dopamine which
were suggested which could also add to the explanation of the current situation.
Another possible explanation of no change from baseline threshold after cannabis
smoke exposure is the rapid development of tolerance which is associated with
prolonged use of drugs of abuse. This is supported with the finding that there was
reduction in the dopamine efflux for Ex vivo preparations of brain slices containing VTA
neurons for rats which were chronically treated with THC compared to naive
rats(Panlilio et al., 2015).
In conclusion, there results from the present study indicate that chronic exposure
to even low doses of cannabis smoke can lead to the development of dependence. With
no currently approved medication and high relapse rates seen with motivation therapy
there is a need to understand and alleviate withdrawal as patients experience a wide
range of withdrawal symptoms like lack of motivation, appetite, restlessness and
depressed mood. The question about withdrawal associated with chronic cannabinoid
abuse has been answered in this study. Taken together this animals model can be used
to study the effects of cannabis smoke exposure on dependence and also aid to
develop potential candidates to treat cannabinoid withdrawal syndrome.

77
Figure 4-1. ICSS Set Up

78
Figure 4-2. Experimental design
Figure 4-3. Experimental design-2

79
Figure 4-4. Effect of THC Dose and Duration of Exposure on Brain Reward Threshold

80
Figure 4-5. Effect of Rimonabant (i.p) on Brain reward Thresholds

81
Table 4-1. Summary of the total amount of cannabis burnt for both the treatments, the total suspended smoke particulate inside the chamber, duration of smoke exposure and plasma concentration of THC during week 1 and week 2.
Number of Cigarettes
Total Amount of cannabis burnt (g)
TSP (mg/m3)
Carbon Monoxide (PPM)
Duration of Cannabis Smoke Exposure (min)
Plasma concentration of THC day 4(ng/ml)
Plasma concentration of THC day 11 (ng/ml)
5 3.18 145.78 270 50 - 6.51
10 6.4 226.23 393 100 4.43±1.65 6.82

82
CHAPTER 5 PHARMACOKINETIC AND PHARMACODYNAMIC MODELIING OF THC INDUCED
CANNABINOID DEPENDENCE
Pharmacokinetic and Pharmacodynamic (PK/PD) Modeling
Application of kinetics to drugs was called pharmacokinetics (PK) by F. H. Dost in
1953. So it can be called as the change in the amount of drug over time in the body. It
studies the fate of the drug in the body and often describes the concentration-time
course for the drugs or the metabolites in body fluids like plasma and urine(Derendorf,
1998). After a dose of drug is delivered it undergoes absorption, distribution,
metabolism and elimination, and is often called the ADME scheme.
Relation between concentration and effect are defined in pharmacodynamics. It
was first shown by levy who showed correlations between reversible drug effects and
drug concentrations. The interaction between drug and target leads to an effect which is
usually associated with some time delay and this due to the disposition of the drug to
the effect site or some underlying mechanism like transduction pathway leading to the
effect. Parameters like affinity, sensitivity, potency and efficacy are used to characterize
pharmacodynamics. Population pharmacodynamics evaluates effects of the drug
(physiological/biochemical) on disease causing agents at population level(Levy, 1986;
Sharma and Jusko, 1998; Unadkat et al., 1986).
PKPD modelling and simulation emerged as an important tool due to combining
underlying mechanisms with data and knowledge to make rational decisions in the
process of drug development(Upton and Mould, 2014, 2014). Models in a broad sense
are nothing but simple representation of the system and the usually simplified according
to the purpose or the intended use, hence are usually judged by “fitness for purpose”
rather than “right” or “true”. PKPD modelling was first introduced by Sheiner et al

83
(Holford and Sheiner, 1982). Modeling and simulation can aid in drug development
from pre-clinical to first in human dosing. It can further aid in selection of doses for
further evaluation and finally extend the selected doses to other populations. PKPD
modelling provides a frame work to understand the drug effects at different dose levels.
It can aid in understanding the variability in PK and PD between different subjects which
is seen with most of the drugs. Typically covariates such as gender, weight, physiology,
co-administration of other drugs, disease state which can lead to variability in the
exposure and response which can be explained by PKPD modelling and simulation.
The data obtained after modelling and simulation can be compared with other drugs
from the same class to evaluate its potential as a new therapeutic agent. Hence,
objective of population modelling is to able to understand the pharmacologic action of
the drug and to be able to develop a mathematical function to explain the
pharmacologic time course of the drug at various dose regimens. PKPD model always
include an observed response (PD) and these can be either continuous or categorical.
Models describing continuous pharmacodynamics typically explain the PKPD relations
using a continuous function like linear, Emax or sigmoidal emax model. The
concentration responsible for the observed effect can be directly linked to plasma
(usually assumed to be central compartment) or concentration at the effect site (other
site in the body) if the observed effect lags behind the exposure of drug in plasma. This
delay in effect can be due to the distribution of the drug to the site of action when it is
not readily accessible (rate limiting step for the effect) and maximal effect cannot be
seen at maximum concentration in the plasma. Also, many drugs induce pharmacologic
response not because of their interaction which the receptors but due to the causing the

84
changes in the endogenous compound via some kind of transduction mechanism. In
both the cases the pharmacological response might be seen if when there is no drug
present in plasma.
It was shown that the dose, durations of exposure, dosing frequency, use of
other cross dependent drugs and the physiology of the subject are the PKPK
parameters which explain the underlying mechanisms of dependence and tolerance.
Although physical dependence and tolerance are actions of drug administration which
can be predicted, the predictability of the current models can be called as empirical due
to due to lack of in depth understanding about the mechanisms of actions as a result of
which it is difficult to simplify the underlying complex physiological processes(Gårdmark
et al., 1999).
Methods
The methods and results of physical dependence time courses of THC were
described previously in Chapter 4. To describe the time course of physical dependence
for a given dose regimen, a sequential PK/PD modeling approach was applied after
subtracting the placebo response values at each time point from the mean response
values for the each of the treatments as one group of subjects served as
placebo/control which were exposed to air only. This will give us a better understanding
of the true response after exposure to smoke containing THC 5-1.
PK/PD modeling of THC for animals which were exposed to cannabis smoke containing THC
Although cannabinoids display many central nervous system induced effects
relatively little is understood about the functional relevance of the endocannabinoid
system. Hence tests or animal models that best reflect this relation can give a better

85
insight into the contribution and relevance of the endocannabinoid system in THC
induced dependence. The effect parameters used in this study were the ICSS
thresholds after exposure to cannabis smoke containing THC, i.e the change from
baseline in the ICSS thresholds. Most of the CNS active drugs have shown to induce
change from baseline threshold in this animal model which indicative hedonia or
anheodina. In case of drugs with an abuse potential, the ICSS thresholds in animals
after drug administration will be lower than the baseline value and the animal will self-
stimulate for currents at which it was previously unresponsive. This change in response
after drug administration can suggests an increase in the sensitivity of the underlying
neuronal mechanism (in brain reward pathway) and can be directly related to hedonic
effects of the drug(Kornetsky et al., 1979). As suggested in the literature the “high”
which is experienced by the subjects usually lags behind the plasma concentrations and
typically last for hours even when there is little or no THC detected in plasma (Chiang
and Barnett, 1984; Ohlsson et al., 1980; Perez-Reyes et al., 1982). To relate the
changes in THC concentrations to changes in affective dependence various structurally
different PKPD models were evaluated and since we were more interested in the basic
model structure mean data could provide true profile pattern, which was used for model
fitting. NONMEM software version 7.0 was used for the purpose of model fitting and
goodness of fit plots, objective function values were evaluated during model
development.
PD Data Smoothing
Any time series is usually associated with some pattern, which is the combination
of an underlying pattern and some random error. The goals is separate this random
error and the underlying pattern. Many method have been suggest such as moving

86
averages, linear regression with time, exponential sequencing etc. Exponential
smoothing is method or simple exponential smoothing is technique where predictions
are made based on the past and the current data. Smoothing is performed by assigning
exponentially decreasing weights as the observations keep getting older in the time
series. This is based on the assumption that the data will typically fluctuate around a
reasonably stable mean with no pattern for growth or no trend.
The equation used to calculate is:
𝑆(𝑡) = 𝛼 ∗ 𝑋(𝑡) + (1 − 𝛼) ∗ 𝑠(𝑡 − 1) (5-1)
An alpha value close to 1 would be close to completely ignoring the previous
observations and if it is close to zero, then the current observation is given much less
weight. The value of St plays an important role and it can either be the first observation
or the mean value of all the observations. The error measure mean squared error
(MSE) and mean absolute percentage error (MAPE) was used for model validation.
There compartment PK with-effect-compartment indirect-link model (biophase equilibration model with a linear PD model)
As shown in Figure 5-2, this model describes the dissociation between affective
dependence and plasma drug concentration with a biophase (i.e., the site of action)
distribution. Drug distribution to the effect site was characterized on the basis of a
hypothetical effect compartment model. Specifically, the rates of the changes in the
drug concentrations are described by the following differential equations:
𝑑(𝐶1)/𝑑𝑡 = −(𝐶𝐿 + 𝑄2 + 𝑄3) ∗ 𝐶1 + 𝐶2 ∗ 𝑄2 + 𝐶3 ∗ 𝑄3
𝑑(𝐶2)/𝑑𝑡 = (𝐶1 − 𝐶2) ∗ 𝑄2
𝑑(𝐶3)/𝑑𝑡 = (𝐶1 − 𝐶3) ∗ 𝑄3
(5-2)
(5-3)
(5-4)

87
𝑑(𝐶𝑒)/𝑑𝑡 = (𝐶1 − 𝐶𝑒) ∗ 𝑘𝑒0
(5-5)
Where ke0 is the first order elimination rate constant for the effect compartment,
C1,C2 and C3 are the concentration is in the central and 2 peripheral compartments
describing the pharmacokinetics of THC, Q2 and Q3 are the intercompartment
clearances. The addition of a hypothetical effect compartment will not alter the
pharmacokinetics of THC as the volume of this compartment is assumed to be
negligible. The final affective dependence which is induced by THC is characterized
using an Sigmoid Eman model using Equation:
𝐸 = 𝐵𝑎𝑠𝑒𝑙𝑖𝑛𝑒 (𝐸0) − 𝐸𝑚𝑎𝑥 ∗ (𝐶𝑒 ∗∗ (ℽ))/(𝐸𝐶50 ∗∗ (ℽ) + 𝐶𝐸 ∗∗ (ℽ))
𝐸 = 𝐵𝑎𝑠𝑒𝑙𝑖𝑛𝑒 (𝐸0) − 𝑆𝐿𝑂𝑃𝐸 ∗ 𝐶𝑒 ∗∗ (ℽ)
(5-6)
(5-7)
Where E0 represents the baseline response without the drug presence and is set
100 and the Emax is the maximum activity of the drug and EC50 is the concentrations
required to achieve half maximal effect and Ce is the concertation in the hypothetical
effect compartment which is responsible for the pharmacological action of the drug.
When the concentrations of the drug are relatively low comparted to the EC50 value of
the drug a linear model can be used (Figure 5-5). ℽ is the parameter which is used to
describe the steepness of the pharmacological action and is called as the hill factor.
There compartment PK with indirect response model using stimulation of the output (IDR-4)
The indirect response model which is shown in Figure 5-3 describes the
dissociation between affective dependence and hedonic effects via a hypothetical
neurotransmitter. Drugs can either stimulate or inhibit the synthesis of this and the
stimulation of this neurotransmitters will lower the amount of electrical stimulation which

88
is required to maintain minimum response in the ICSS paradigm. Specifically the rate of
change in the hypothetical neurotransmitter and the plasma concentration is described
by the following equations:
𝑑(𝐶1)/𝑑𝑡 = −(𝐶𝐿 + 𝑄2 + 𝑄3) ∗ 𝐶1 + 𝐶2 ∗ 𝑄2 + 𝐶3 ∗ 𝑄3
𝑑(𝐶2)/𝑑𝑡 = (𝐶1 − 𝐶2) ∗ 𝑄2
𝑑(𝐶3)/𝑑𝑡 = (𝐶1 − 𝐶3) ∗ 𝑄3
𝑑(𝑅)
𝑑𝑡= 𝐾𝑖𝑛 − 𝐾𝑜𝑢𝑡 ∗ 𝑅0
(5-8)
(5-9)
(5-10)
(5-11)
Where C1,C2 and C3 are the concentration is in the central and 2 peripheral
compartments describing the pharmacokinetics of THC, Q2 and Q3 are the
intercompartment clearances. Where zero Kin is the zero order constant (electrical
stimulation) and Kout is the first order production and R0 is the baseline intrinsic
response without the drug presence. Kout is the estimated parameters for these models
𝐾𝑖𝑛 = 𝐾𝑜𝑢𝑡 ∗ 𝑅0
𝑅0 =𝐾𝑖𝑛
𝐾𝑜𝑢𝑡= 100 𝑎𝑡 𝑠𝑡𝑒𝑎𝑑𝑦 𝑠𝑡𝑎𝑡𝑒, 𝑡 = 0
(5-12)
(5-13)
Kout is stimulated in the presence of THC leading to a decrease in the amount of
electrical stimulation as a result of which there is a decrease from baseline current.
Hence response in present of the drug is:
𝐸 = 𝐸𝑚𝑎𝑥 ∗ (𝐶𝑝 ∗∗ (ℽ))/(𝐸𝐶50 ∗∗ (ℽ) + 𝐶𝑝 ∗∗ (ℽ))
𝐸 = 𝑆𝐿𝑂𝑃𝐸 ∗ 𝐶𝑝 ∗∗ (ℽ)
𝑑(𝑅)
𝑑𝑡= 𝐾𝑖𝑛 − 𝐾𝑜𝑢𝑡 ∗ 𝑅0 ∗ (1 + 𝐸)
(5-14)
(5-15)
(5-16)

89
Results
The observed plasma concentration-time course for THC can be described by three
compartment pk model constructed in chapter 3. The population mean parameters were
used to and based on this pk model the affective dependence was quantitatively
investigated. The effect compartment model described the data best. Figure 5-5 shows
the observed vs model predictions to characterize THC induced dependence. Table 5-1
shows the summary of the PK/PD parameters. Results suggests an increase in amount
of hedonia experienced in a dose dependent way (for the given dose range of 0.05-0.2
mg/kg) with the 0.2 mg/kg dose producing greater decrease from baseline threshold
current and that there is delayed distribution of THC into the effect compartment and the
hedonic effects can be experienced for prolonged periods (equilibration half-life around
20 hours and hill factor of 0.3). The indirect response model was also able to account
for the delay but could not capture the step decline after the first smoke exposure
session. This suggest that the hedonic feeling experienced by the subjects is immediate
and returns to baseline (gradually) upon stopping drug administration. The goodness of
fit plots for the model are presented in Figure 5-6.
Discussion
THC is the psychoactive cannabinoid whose effect have been well characterized.
However smoking remains the primary route of consumption in humans and the
pharmacodynamic effects of THC are yet to be fully understood in this setting. It was
first suggest by Hollister et al that plasma concentrations might not be the best predictor
for the pharmacological effect after smoking cannabis cigarettes containing 19 mg
THC(Hollister, 1981). The conversion of THC to active metabolite further complicates

90
the understanding of the hedonic effects which are being produced after smoking or oral
administration.
Various different structural model have been proposed to describe the
pharmacokinetics of THC. These include both 2 and 3 compartment disposition model
for intravenous, oral and intrapulmonary administration, as thc readily gets distributed
into the highly perfused organs followed by prolonged storage in adipose
tissue(Heuberger et al., 2015). The plasma or serum concentration of THC has shown
to increase in a dose dependent manner and so do the pharmacological effects(Hunault
et al., 2014).
A recent attempt to characterize the PK/PD relation of subject high which is
experienced after smoking was done by (Strougo et al., 2008) where THC was
administered intrapulmonary using a volcano vaporizer. THC was administered in
increasing doses and both central effects and peripheral effect (cardiovascular) were
assessed using VAS’s scales. It was seen that the subjective high on the VAS rating
increased with increasing doses of THC which was delivered. (Strougo et al., 2008) and
colleges used a two compartment disposition model to characterize the
pharmacokinetics of THC and hypothetical effect compartment model to relate the
plasma concentrations of THC to reported subjective high using VAS scales. The
pharmacological actions in this study were assumed to be purely by THC as the ratio of
metabolite/thc was very low after intrapulmonary administration. The pharmacokinetics
of THC in this study were modelled as an IV bolus admiration as the authors propose
that lung is highly perfused organ and concentrations of THC in plasma are detected
immediately after the first puff suggesting no delay in the absorption. Recently (Awasthi

91
et al., 2018) related the psychoactive effects to the plasma concentrations of THC
using an effect compartment approach. The pharmacokinetics of THC was explained
using three compartment disposition model and the contribution of both the parent drug
and the active metabolite were included to characterize the observed psychotopic
effects after intravenous admisntration of THC. Awasthi and colleges used a
competitive interaction model on the same receptor where both the parent and the
metabolite (which was assumed to be equipotent to THC) act together to produce the
pharmacological effect. Equation shows the simplified version of this approach:
𝐸(𝑡𝑜𝑡𝑎𝑙) = 𝐸𝑚𝑎𝑥(𝑡𝑜𝑡𝑎𝑙) ∗𝐶(𝑇𝐻𝐶) + 𝐶(𝑇𝐻𝐶 − 𝑂𝐻)
𝐸𝐶50 + (𝐶(𝑇𝐻𝐶) + 𝐶(𝑇𝐻𝐶 − 𝑂𝐻)
(5-17)
In the present study we used similar approaches to understand the extent of
hedonic effect which are being produced by THC was exposure to cannabis smoke
containing THC.
After development and validation of THC pk model the exact study dosing
regimen was used to understand the pharmacodynamic effects. Various outcomes have
different equilibration half lives indicating that different systems which are involved with
the production of response, an equilibration half-life of about 20 hours was calculated
based on the estimated parameters. This can be attributed to the lipophilicity of the drug
and the location of CB1 receptors. THC being a lipophilic compound can cross the
blood brain barrier and can get accumulated in the brain for long durations. This
suggest that the hedonic effects of THC can be present even with no drug detected in
plasma after single dose administration. Since the ICSS paradigm assumes synergy
92
between the electrical stimulation and drug, it can be said that THC dose dependably
increase the amount of dopamerginic neuronal firing leading to stable responses even
at lower current threshold. This is in agreement with the reported literature where DA
administered in directly in NA and VTA caused an increase in the amount of
extracellular dopamine(Chen et al., 1993, 1991) and it was suggested that THC
administration increases the dopamine neuronal firing rates and increase the synthesis
of dopamine. Other rodent studies which tried to observe the somatic withdrawal signs
in rats exposed to cannabis smoke containing THC also observed a clear change in the
somatic scores in the animals 4 hours after smoke exposure, further providing evidence
that the hedonic effects of cannabis are developed slowly and last for a long duration
because anhedonia in these rodents were studied 4 hours later(Bruijnzeel et al., 2016).
Another recent study also showed similar results where subject smoked cannabis
cigarettes containing from 0-23% THC and the reported euphoric effect were dose
dependent and could be felt until 5-6 hours after completion of the joint. And the
reported high lasted longer durations with higher doses of THC was inhalation i.e
cigarettes containing more amount THC were smoked by the subjects(Hunault et al.,
2014). Imaging studies further showed the there is decreased dopamine brain activity in
chronic cannabis users which is associated with anhedonia(Volkow et al., 2014)
suggesting the involvement of dopamine in THC mediated rewarding effects.
One disadvantage with this approach is that the placebo data was not modelled
since no specific patterns were observed over the time course to be able to use a
mathematical function to capture that trend. Hence we lose the power to simulate
placebo response for future studies in order to make a direct comparison between the

93
placebo/vehicle treated subjects vs drug treated subjects in the ICSS paradigm. Another
drawback is that, based on the model prediction the hedonic effects can last up to 6
hours but we had only one PD data point per dose administered at each dose taken
around 30-45 min after cannabis smoke exposure, which might be an under prediction
of the true effect leading to bias when simulating with entirely different trial design or
dosing regimens.
The developed PK-PD model used a 3 compartment disposition model for
pharmacokinetics similar pharmacokinetic models proposed for humans and is useful
during the development of novel compounds with similar underlying mechanisms, such
that concentration-effect relationships of other agonists can be compared to THC, using
THC as the “gold standard”. In the present study we tried to understand the effect of
cannabis smoke exposure on hedonia which is experienced after inhalation but various
other end points could also be assessed. Finally, PK-PD models may enable prediction
of the time course of the analyzed effects, after co-administration of THC and antagonist
leads in pharmacological proof-of-mechanism counteraction studies. With all these
features, this integrated modelling approach offers insights into underlying mechanism
of the endocannabinoid system. In this way, PK-PD modelling can contribute to the
development of novel cannabinoid agonist, antagonists and eventually lead to the
development of therapies to treat cannabis use disorders (CUD’s).

94
Figure 5-1. Placebo corrected PD response

95
Figure 5-2. PK-PD model using hypothetical effect compartment
Figure 5-3. PK-PD model using indirect response model (IDR4)

96
Figure 5-4. Linear Emax model
Figure 5-5. Observed vs model prediction for THC induced cannabinoid dependence

97
Figure 5-6. GOF’s PD Model

98
Table 5-1. Summary ok the PD parameters obtained after model fitting
Parameter Estimate RSE %
Ke0 (h-1
) 0.03 34
E0 100 FIXED -
SLOPE 19.1 9.3
GAMMA 0.23 2

99
CHAPTER 6 CONCLUSION
The Diagnostic and Statistical Manual of Mental Disorders, Fifth Edition (DSM-V
2013), now recognizes cannabis abuse, withdrawal and other cannabis related
disorders under cannabis use disorders. In the United states alone about 845,000
people were treated for CUD’s and this number being higher than other drugs of abuse
and currently there are no therapies approved by the FDA for treatment and relapse
rates with motivation therapy or family based therapies are high (greater than 70%
relapse rates). THC which the psychoactive constituent of marijuana is a lipophilic
molecule and is known to have a prolonged half-life. Previous studies done in rodents to
characterize the acute effects of THC used parenteral administration of the compound
which in reality might not reflect the true effects after smoking cannabis. At present
about 20 states have legalized cannabis for medicinal purpose and 10 states have
legalized it for recreational purposes Hence with these ongoing efforts to legalize
marijuana it is although more important to understand the underlying mechanism of
cannabinoid dependence and withdrawal. Understanding dependence is a complex
process which has to be finally evaluated and tested in clinic but establishing an animal
model to study these effects can be useful to address questions prior to testing in
clinical setting. The overall objective of the thesis was to study thc induced cannabinoid
dependence and withdrawal mechanisms after exposure to cannabis smoke exposure.
Highly sensitive LCMS method was developed in rat plasma to quantify, THC,
CBD and Rimoanabant. The method was then validated in terms of parameters like
sensitivity, accuracy, stability etc and other parameters which are given in the USFDA
guidance for bioanalytical method validation for the industry (chapter 2).The fully

100
developed and validated method was then successfully applied to understand the
exposure of THC after cannabis smoke inhalation and intravenous administration
(chapter 3). We tried to evaluate the effect of dose and treatment duration on
development of cannabinoid dependence and results from (chapter 4) have shown thc
induced affective dependence as seen by rimonabant precipitated withdrawal. A dose
dependent elevations in thresholds were observed upon administration of the CB1
receptor antagonist.
In conclusion, these studies demonstrated the connections among thc plasma
levels, drug-exposure duration and the development of physical dependence. Finally
PK/PD model (chapter 5) was built to characterize the affective dependence after
cannabis smoke exposure, which suggested that the hedonic effects produced by THC
are mild (for the given doses in the study) and will increase in a dose dependent
manner and will last for prolonged durations. The PK/PD model developed in these
studies were able to describe the overall time courses of affective dependence. We
expect that the modeling exercises presented will profitably contribute to the formulation
of hypotheses of physical dependence. From a clinical perspective, these studies
suggest that: 1) When cannabis is smoked the development of dependence is slow; 2)
increasing the treatment period does not further increase the hedonic effects as these
are dose dependent which mean high potency cannabis products can induce greater
dependency; and 3) the withdrawal associated with cannabinoid abuse is very sharp,
which eventually leads to drugs seeking behavior and relapse.

101
LIST OF REFERENCES
Ahmed, A.I.A., van den Elsen, G.A.H., Colbers, A., van der Marck, M.A., Burger, D.M., Feuth, T.B., Rikkert, M.G.M.O., Kramers, C., 2014. Safety and pharmacokinetics of oral delta-9-tetrahydrocannabinol in healthy older subjects: A randomized controlled trial. Eur. Neuropsychopharmacol. 24, 1475–1482. https://doi.org/10.1016/j.euroneuro.2014.06.007
Alexander, D.J., Collins, C.J., Coombs, D.W., Gilkison, I.S., Hardy, C.J., Healey, G., Karantabias, G., Johnson, N., Karlsson, A., Kilgour, J.D., McDonald, P., 2008. Association of Inhalation Toxicologists (AIT) working party recommendation for standard delivered dose calculation and expression in non-clinical aerosol inhalation toxicology studies with pharmaceuticals. Inhal. Toxicol. 20, 1179–89. https://doi.org/10.1080/08958370802207318
Ashton, C.H., Ashton, C.H., 2012. Pharmacology and effects of cannabis : a brief review Pharmacology and effects of cannabis : a brief review { 101–106. https://doi.org/10.1192/bjp.178.2.101
Awasthi, R., An, G., Donovan, M.D., Boles Ponto, L.L., 2018. Relating Observed Psychoactive Effects to the Plasma Concentrations of Delta-9-Tetrahydrocannabinol and Its Active Metabolite: An Effect-Compartment Modeling Approach. J. Pharm. Sci. 107, 745–755. https://doi.org/10.1016/j.xphs.2017.09.009
Benjamin, D.M., Fossler, M.J., 2016. Edible Cannabis Products: It Is Time for FDA Oversight. J. Clin. Pharmacol. 56, 1045–1047. https://doi.org/10.1002/jcph.778
Bruijnzeel, A.W., Qi, X., Guzhva, L. V., Wall, S., Deng, J. V., Gold, M.S., Febo, M., Setlow, B., 2016. Behavioral characterization of the effects of cannabis smoke and anandamide in rats. PLoS One 11, 1–24. https://doi.org/10.1371/journal.pone.0153327
Bruijnzeel, A.W., Zislis, G., Wilson, C., Gold, M.S., 2007. Antagonism of CRF receptors prevents the deficit in brain reward function associated with precipitated nicotine withdrawal in rats. Neuropsychopharmacology 32, 955–963. https://doi.org/10.1038/sj.npp.1301192
Chen, J., Marmur, R., Pulles, A., Paredes, W., Gardner, E.L., 1993. Ventral tegmental microinjection of ??9-tetrahydrocannabinol enhances ventral tegmental somatodendritic dopamine levels but not forebrain dopamine levels: evidence for local neural action by marijuana’s psychoactive ingredient. Brain Res. 621, 65–70. https://doi.org/10.1016/0006-8993(93)90298-2
Chen, J., Paredes, W., Lowinson, J.H., Gardner, E.L., 1991. Strain-specific facilitation of dopamine efflux by Delta9-tetrahydrocann binol in the nucleus accumbens of rat: An in vivo microdialysis study. Neurosci. Lett. 129, 136–140.

102
Chiang, C.W., Barnett, G., 1984. Marijuana effect and delta-9-tetrahydrocannabinol plasma level. Clin. Pharmacol. Ther. 36, 234–8. https://doi.org/0009-9236(84)90275-3 [pii]
Colizzi, M., McGuire, P., Pertwee, R.G., Bhattacharyya, S., 2016. Effect of cannabis on glutamate signalling in the brain: A systematic review of human and animal evidence. Neurosci. Biobehav. Rev. 64, 359–381. https://doi.org/10.1016/j.neubiorev.2016.03.010
Cone, E.J., 1995. Pharmacokinetics and pharmacodynamics of cocaine. J. Anal. Toxicol. 19, 459–478. https://doi.org/10.1093/jat/19.6.459
Cone, E.J., Bigelow, G.E., Herrmann, E.S., Mitchell, J.M., LoDico, C., Flegel, R., Vandrey, R., 2015. Nonsmoker exposure to secondhand cannabis smoke. III. Oral fluid and blood drug concentrations and corresponding subjective effects. J. Anal. Toxicol. 39, 497–509. https://doi.org/10.1093/jat/bkv070
Covey, D.P., Wenzel, J.M., Cheer, J.F., 2015. Cannabinoid modulation of drug reward and the implications of marijuana legalization. Brain Res. 1628, 233–243. https://doi.org/10.1016/j.brainres.2014.11.034
Deiana, S., Watanabe, A., Yamasaki, Y., Amada, N., Arthur, M., Fleming, S., Woodcock, H., Dorward, P., Pigliacampo, B., Close, S., Platt, B., Riedel, G., 2012. Plasma and brain pharmacokinetic profile of cannabidiol (CBD), cannabidivarine (CBDV), ?? 9-tetrahydrocannabivarin (THCV) and cannabigerol (CBG) in rats and mice following oral and intraperitoneal administration and CBD action on obsessive-compulsive beha. Psychopharmacology (Berl). 219, 859–873. https://doi.org/10.1007/s00213-011-2415-0
Derendorf, H. and B.M., 1998. Modeling of Pharmacokinetic/Pharmacodynamics (PK/PD) Relationships: Concepts and Perspectives. Pharm. Res. 16, 176–185.
egan, Amy G; Colman, E.G., 2007. FDA Briefing Document NDA 21-888 Zimulti ( rimonabant ) Tablets , 20 mg Sanofi Aventis Advisory Committee – June 13 , 2007. Int. J.
Fokos, S., Panagis, G., 2010. Effects of delta9-tetrahydrocannabinol on reward and anxiety in rats exposed to chronic unpredictable stress. J. Psychopharmacol. 24, 767–777. https://doi.org/10.1177/0269881109104904
Gårdmark, M., Brynne, L., Hammarlund-Udenaes, M., Karlsson, M.O., 1999. Interchangeability and predictive performance of empirical tolerance models. Clin. Pharmacokinet. 36, 145–167. https://doi.org/10.2165/00003088-199936020-00005
Gardner, E.L., Paredes, W., Smith, D., Donner, a, Milling, C., Cohen, D., Morrison, D., 1988. Facilitation of brain stimulation reward by delta 9-tetrahydrocannabinol. Psychopharmacol. 96, 142–144.
103
Grim, T.W., Wiebelhaus, J.M., Morales, A.J., Negus, S.S., Lichtman, A.H., 2015. Effects of acute and repeated dosing of the synthetic cannabinoid CP55,940 on intracranial self-stimulation in mice. Drug Alcohol Depend. 150, 31–37. https://doi.org/10.1016/j.drugalcdep.2015.01.022
Grotenhermen, F., 2004. Pharmacology of cannabinoids. Neuroendocrinol. Lett. 25, 14–23. https://doi.org/NEL251204R01 [pii]
Heuberger, J.A.A.C., Guan, Z., Oyetayo, O.O., Klumpers, L., Morrison, P.D., Beumer, T.L., van Gerven, J.M.A., Cohen, A.F., Freijer, J., 2015. Population Pharmacokinetic Model of THC Integrates Oral, Intravenous, and Pulmonary Dosing and Characterizes Short- and Long-term Pharmacokinetics. Clin. Pharmacokinet. 54, 209–219. https://doi.org/10.1007/s40262-014-0195-5
Holford, N.H.G., Sheiner, L.B., 1982. Kinetics of pharmacologic response. Pharmacol. Ther. 16, 143–166. https://doi.org/10.1016/0163-7258(82)90051-1
Hollister, L.E., 1981. DoPlasma Concentrations Reflectthe Degreeof Intoxication ? J. Clin. Pharmacol. 21, 171–177.
Huestis, M.A., 2007. Human cannabinoid pharmacokinetics. Chem. Biodivers. 4, 1770–1804. https://doi.org/10.1002/cbdv.200790152
Huestis, M. a, 2009. NIH Public Access. Shock 4, 1770–1804. https://doi.org/10.1002/cbdv.200790152.Human
Huestis, M. a, 2005. Pharmacokinetics and metabolism of the plant cannabinoids, delta9-tetrahydrocannabinol, cannabidiol and cannabinol. Handb. Exp. Pharmacol. 657–690. https://doi.org/10.1007/3-540-26573-2-23
Huestis, M. a, Cone, E.J., 2004. Relationship of Delta 9-tetrahydrocannabinol concentrations in oral fluid and plasma after controlled administration of smoked cannabis. J. Anal. Toxicol. 28, 394–399. https://doi.org/10.1093/jat/28.6.394
Hunault, C.C., Böcker, K.B.E., Stellato, R.K., Kenemans, J.L., De Vries, I., Meulenbelt, J., 2014. Acute subjective effects after smoking joints containing up to 69 mg ??9-tetrahydrocannabinol in recreational users: A randomized, crossover clinical trial. Psychopharmacology (Berl). 231, 4723–4733. https://doi.org/10.1007/s00213-014-3630-2
Iversen, L., 2003. Cannabis and the brain. Brain 126, 1252–1270. https://doi.org/10.1093/brain/awg143
Izzo, A.A., Borrelli, F., Capasso, R., Di Marzo, V., Mechoulam, R., 2009. Non-psychotropic plant cannabinoids: new therapeutic opportunities from an ancient herb. Trends Pharmacol. Sci. 30, 515–527. https://doi.org/10.1016/j.tips.2009.07.006
104
Järbe, T.U.C., Gifford, R.S., Makriyannis, A., 2011. Antagonism of Δ9 -THC induced behavioral effects by rimonabant: time-course studies in rats 648, 133–138. https://doi.org/10.1016/j.ejphar.2010.09.006.Antagonism
Jensen, B., Chen, J., Furnish, T., Wallace, M., 2015. Medical Marijuana and Chronic Pain: a Review of Basic Science and Clinical Evidence. Curr. Pain Headache Rep. 19, 1–9. https://doi.org/10.1007/s11916-015-0524-x
Justinova, Z., Tanda, G., Redhi, G.H., Goldberg, S.R., 2003. Self-administration of Δ9-tetrahydrocannabinol (THC) by drug naive squirrel monkeys. Psychopharmacology (Berl). 169, 135–140. https://doi.org/10.1007/s00213-003-1484-0
Karschner, E.L., Darwin, W.D., Goodwin, R.S., Wright, S., Huestis, M.A., 2011. Plasma cannabinoid pharmacokinetics following controlled oral Δ 9-tetrahydrocannabinol and oromucosal cannabis extract administration. Clin. Chem. 57, 66–75. https://doi.org/10.1373/clinchem.2010.152439
Katsidoni, V., Kastellakis, A., Panagis, G., 2013. Biphasic effects of Δ9-tetrahydrocannabinol on brain stimulation reward and motor activity. Int. J. Neuropsychopharmacol. 16, 2273–84. https://doi.org/10.1017/S1461145713000709
Kelly, T.H., Emurian, C.S., Foltin, R.W., Fischman, M.W., 1993. Performance-Based Testing for Drugs of Abuse: Dose and Time Profiles of Marijuana, Amphetamine, Alcohol, and Diazepam. J. Anal. Toxicol. 17, 264–272. https://doi.org/10.1093/jat/17.5.264
Kornetsky, C., Esposito, R.U., McLean, S., Jacobson, J.O., 1979. Intracranial self-stimulation thresholds: a model for the hedonic effects of drugs of abuse. Arch. Gen. Psychiatry 36, 289–292. https://doi.org/10.1001/archpsyc.1979.01780030055004
Levy, G., 1986. Kinetics of drug action: An overview. J. Allergy Clin. Immunol. 78, 754–761. https://doi.org/10.1016/0091-6749(86)90057-6
Lichtman, A.H., Fisher, J., Martin, B.R., 2001a. Precipitated cannabinoid withdrawal is reversed by ??9-tetrahydrocannabinol or clonidine. Pharmacol. Biochem. Behav. 69, 181–188. https://doi.org/10.1016/S0091-3057(01)00514-7
Lichtman, A.H., Martin, B.R., 2002. Marijuana withdrawal syndrome in the animal model. J. Clin. Pharmacol. 42, 20S–27S. https://doi.org/10.1177/0091270002238790
Lichtman, A.H., Poklis, J.L., Poklis, A., Wilson, D.M., Martin, B.R., 2001b. The pharmacological activity of inhalation exposure to marijuana smoke in mice. Drug Alcohol Depend. 63, 107–116. https://doi.org/10.1016/S0376-8716(00)00205-2

105
Liguori, A., Gatto, C.P., Jarrett, D.B., McCall, W.V., Brown, T.W., 2003. Behavioral and subjective effects of marijuana following partial sleep deprivation. Drug Alcohol Depend. 70, 233–240. https://doi.org/10.1016/S0376-8716(03)00008-5
Lindgren, J.E., Ohlsson, A., Agurell, S., Hollister, L., Gillespie, H., 1981. Clinical effects and plasma levels of delta 9-tetrahydrocannabinol (delta 9-THC) in heavy and light users of cannabis. Psychopharmacology (Berl). 74, 208–212. https://doi.org/10.1007/BF00427095
Little, B.B., VanBeveren, T.T., 1996. Placental transfer of selected substances of abuse. Semin. Perinatol. 20, 147–53. https://doi.org/10.1016/S0146-0005(96)80082-6
Lupica, C.R., Riegel, A.C., Hoffman, A.F., 2004. Marijuana and cannabinoid regulation of brain reward circuits. Br. J. Pharmacol. 143, 227–234. https://doi.org/10.1038/sj.bjp.0705931
Lynch, M.E., Campbell, F., 2011. Cannabinoids for treatment of chronic non-cancer pain; a systematic review of randomized trials. Br. J. Clin. Pharmacol. 72, 735–744. https://doi.org/10.1111/j.1365-2125.2011.03970.x
Manwell, L.A., Charchoglyan, A., Brewer, D., Matthews, B.A., Heipel, H., Mallet, P.E., 2014. A vapourized ??9-tetrahydrocannabinol (??9-THC) delivery system part I: Development and validation of a pulmonary cannabinoid route of exposure for experimental pharmacology studies in rodents. J. Pharmacol. Toxicol. Methods 70, 120–127. https://doi.org/10.1016/j.vascn.2014.06.006
Manzanares, J., Julian, M., Carrascosa, A., 2006. Role of the cannabinoid system in pain control and therapeutic implications for the management of acute and chronic pain episodes. Curr. Neuropharmacol. 4, 239–57. https://doi.org/10.2174/157015906778019527
Mazur, A., Lichti, C.F., Prather, P.L., Zielinska, A.K., Bratton, S.M., Gallus-Zawada, A., Finel, M., Miller, G.P., Radomińska-Pandya, A., Moran, J.H., 2009. Characterization of human hepatic and extrahepatic UDP-glucuronosyltransferase enzymes involved in the metabolism of classic cannabinoids. Drug Metab. Dispos. 37, 1496–1504. https://doi.org/10.1124/dmd.109.026898
Melis, T., Succu, S., Sanna, F., Boi, A., Argiolas, A., Melis, M.R., 2007. The cannabinoid antagonist SR 141716A (Rimonabant) reduces the increase of extra-cellular dopamine release in the rat nucleus accumbens induced by a novel high palatable food. Neurosci. Lett. 419, 231–235. https://doi.org/10.1016/j.neulet.2007.04.012
Moreira, F.A., Crippa, J.A.S., 2009. The psychiatric side-effects of rimonabant. Rev. Bras. Psiquiatr. 31, 145–153. https://doi.org/10.1590/S1516-44462009000200012

106
Nadulski, T., Sporkert, F., Schnelle, M., Stadelmann, A.M., Roser, P., Schefter, T., Pragst, F., 2005. Simultaneous and sensitive analysis of THC, 11-OH-THC, THC-COOH, CBD, and CBN by GC-MS in plasma after oral application of small doses of THC and Cannabis extract. J. Anal. Toxicol. 29, 782–789. https://doi.org/10.1093/jat/29.8.782
Nguyen, J.D., Aarde, S.M., Vandewater, S.A., Grant, Y., Stouffer, D.G., Parsons, L.H., Cole, M., Taffe, M.A., 2016. Inhaled delivery of ??9-tetrahydrocannabinol (THC) to rats by e-cigarette vapor technology. Neuropharmacology 109, 112–120. https://doi.org/10.1016/j.neuropharm.2016.05.021
Niesink, R.J.M., van Laar, M.W., 2013. Does Cannabidiol Protect Against Adverse Psychological Effects of THC? Front. psychiatry 4, 130. https://doi.org/10.3389/fpsyt.2013.00130
Niyuhire, F., Varvel, S. a, Martin, B.R., Lichtman, A.H., 2007. Exposure to marijuana smoke impairs memory retrieval in mice. J. Pharmacol. Exp. Ther. 322, 1067–1075. https://doi.org/10.1124/jpet.107.119594
Ohlsson, A., Lindgren, J.E., Wahlen, A., Agurell, S., Hollister, L.E., Gillespie, H.K., 1980. Plasma delta-9-tetrahydrocannabinol concentrations and clinical effects after oral and intravenous administration and smoking. Clin. Pharmacol. Ther. 28, 409–416. https://doi.org/10.1038/clpt.1980.181
Palazzoli, F., Citti, C., Licata, M., Vilella, A., Manca, L., Zoli, M., Vandelli, M.A., Forni, F., Cannazza, G., 2018. Development of a simple and sensitive liquid chromatography triple quadrupole mass spectrometry (LC–MS/MS) method for the determination of cannabidiol (CBD), Δ9-tetrahydrocannabinol (THC) and its metabolites in rat whole blood after oral administration of. J. Pharm. Biomed. Anal. 150, 25–32. https://doi.org/10.1016/j.jpba.2017.11.054
Panagis, G., Mackey, B., Vlachou, S., 2014. Cannabinoid Regulation of Brain Reward Processing with an Emphasis on the Role of CB1 Receptors: A Step Back into the Future. Front. psychiatry 5, 92. https://doi.org/10.3389/fpsyt.2014.00092
Panlilio, L. V., Goldberg, S.R., Justinova, Z., 2015. Cannabinoid Abuse and Addiction: Clinical and Preclinical Findings. Clin. Pharmacol. Ther. 97, 616–627. https://doi.org/10.1002/cpt.118
Panlilio, L. V., Justinova, Z., Goldberg, S.R., 2010. Animal models of cannabinoid reward. Br. J. Pharmacol. 160, 499–510. https://doi.org/10.1111/j.1476-5381.2010.00775.x
Park, B., McPartland, J.M., Glass, M., 2004. Cannabis, cannabinoids and reproduction. Prostaglandins Leukot. Essent. Fat. Acids 70, 189–197. https://doi.org/10.1016/j.plefa.2003.04.007

107
Perez-Reyes, M., Di Guiseppi, S., Davis, K.H., Schindler, V.H., Cook, C.E., 1982. Comparison of effects of marihuana cigarettes to three different potencies. Clin. Pharmacol. Ther. 31, 617–24. https://doi.org/10.1038/clpt.1982.86
Pharmaceuticals, U., 2006. Marinol® CIII (dronabinol) Capsules Rx only. 3–14.
Rosenkrantz, H., Braude, M.C., 1974. Acute , Subacute Inhalation and 23-Day Toxicities Chronic in the Marihuana 441, 428–441.
Sachse-Seeboth, C., Pfeil, J., Sehrt, D., Meineke, I., Tzvetkov, M., Bruns, E., Poser, W., Vormfelde, S. V, Brockmöller, J., 2009. Interindividual variation in the pharmacokinetics of delta9-tetrahydrocannabinol as related to genetic polymorphisms in CYP2C9. Clin. Pharmacol. Ther. 85, 273–276. https://doi.org/10.1038/clpt.2008.213
Savage, S.R., Romero-Sandoval, A., Schatman, M., Wallace, M., Fanciullo, G., McCarberg, B., Ware, M., 2016. Cannabis in Pain Treatment: Clinical & Research Considerations. J. Pain 17, 654–668. https://doi.org/10.1016/j.jpain.2016.02.007
Schlosburg, J.E., Carlson, B.L. a, Ramesh, D., Abdullah, R. a, Long, J.Z., Cravatt, B.F., Lichtman, A.H., 2009. Inhibitors of endocannabinoid-metabolizing enzymes reduce precipitated withdrawal responses in THC-dependent mice. AAPS J. 11, 342–352. https://doi.org/10.1208/s12248-009-9110-7
Schwilke, E.W., Schwope, D.M., Karschner, E.L., Lowe, R.H., Darwin, W.D., Kelly, D.L., Goodwin, R.S., Gorelick, D.A., Huestis, M.A., 2009. ??9-tetrahydrocannabinol (THC), 11-hydroxy-THC, and 11-nor-9-carboxy-THC plasma pharmacokinetics during and after continuous high-dose oral THC. Clin. Chem. 55, 2180–2189. https://doi.org/10.1373/clinchem.2008.122119
Sharma, A., Jusko, W.J., 1998. Characteristics of indirect pharmacodynamic models and applications to clinical drug responses. Br J Clin Pharmacol 45, 229–239.
Solimini, R., Rotolo, M.C., Ricci, S., Mastrobattista, L., Mortali, C., Graziano, S., Pellegrini, M., Luca, N.M.D.I., Palmi, I., 2017. Hepatotoxicity associated to synthetic cannabinoids use 21, 1–6.
Strougo, a, Zuurman, L., Roy, C., Pinquier, J.L., van Gerven, J.M. a, Cohen, a F., Schoemaker, R.C., 2008. Modelling of the concentration--effect relationship of THC on central nervous system parameters and heart rate -- insight into its mechanisms of action and a tool for clinical research and development of cannabinoids. J. Psychopharmacol. 22, 717–726. https://doi.org/10.1177/0269881108089870
Syme, M.R., Paxton, J.W., Keelan, J. a, 2004. Human Placenta. Clin. Pharmacokinet. 43, 487–514. https://doi.org/10.1161/01.HYP.0000119191.33112.9c

108
Tanda, G., Munzar, P., Goldberg, S.R., 2000. Self-administration behavior is maintained by the psychoactive ingredient of marijuana in squirrel monkeys. Nat. Neurosci. 3, 1073–1074. https://doi.org/10.1038/80577
Thomas, B.F., Compton, D.R., Martin, B.R., 1990. Characterization of the lipophilicity of natural and synthetic analogs of delta 9-tetrahydrocannabinol and its relationship to pharmacological potency. J. Pharmacol. Exp. Ther. 255, 624–630.
Throckmorton, D.C., 2016. FDA Regulation of Marijuana : Past Actions , Future Plans.
Toennes, S.W., Ramaekers, J.G., Theunissen, E.L., Moeller, M.R., Kauert, G.F., 2008. Comparison of Cannabinoid Pharmacokinetic Properties in Occasional and Heavy Users Smoking a Marijuana or Placebo Joint. J. Anal. Toxicol. 32, 470–477. https://doi.org/10.1093/jat/32.7.470
Tsou, K., Patrick, S.L., Walker, J.M., 1995. Physical withdrawal in rats tolerant to delta 9- tetrahydrocannabinol precipitated by a cannabinoid receptor antagonist. Eur J Pharmacol 280, R13–R15.
Unadkat, J.D., Bartha, F., Sheiner, L.B., 1986. Simultaneous modeling of pharmacokinetics and pharmacodynamics with nonparametric kinetic and dynamic models. Clin. Pharmacol. Ther. 40, 86–93. https://doi.org/10.1038/clpt.1986.143
Upton, R.N., Mould, D.R., 2014. Basic concepts in population modeling, simulation, and model-based drug development: part 3-introduction to pharmacodynamic modeling methods. CPT pharmacometrics Syst. Pharmacol. 3, e88. https://doi.org/10.1038/psp.2013.71
Valiveti, S., Agu, R.U., Hammell, D.C., Paudel, K.S., Caroline Earles, D., Wermeling, D.P., Stinchcomb, A.L., 2007. Intranasal absorption of ??9-tetrahydrocannabinol and WIN55,212-2 mesylate in rats. Eur. J. Pharm. Biopharm. 65, 247–252. https://doi.org/10.1016/j.ejpb.2006.08.009
Valiveti, S., Stinchcomb, A.L., 2004. Liquid chromatographic-mass spectrometric quantitation of ??9-tetrahydrocannabinol and two metabolites in pharmacokinetic study plasma samples. J. Chromatogr. B Anal. Technol. Biomed. Life Sci. 803, 243–248. https://doi.org/10.1016/j.jchromb.2003.12.024
Vlachou, S., Nomikos, G.G., Panagis, G., 2005. CB1 cannabinoid receptor agonists increase intracranial self-stimulation thresholds in the rat. Psychopharmacology (Berl). 179, 498–508. https://doi.org/10.1007/s00213-004-2050-0
Vlachou, S., Nomikos, G.G., Stephens, D.N., Panagis, G., 2007. Lack of evidence for appetitive effects of Delta 9-tetrahydrocannabinol in the intracranial self-stimulation and conditioned place preference procedures in rodents. Behav. Pharmacol. 18, 311–319. https://doi.org/10.1097/FBP.0b013e3282186cf2

109
Volkow, N.D., Wang, G.-J., Telang, F., Fowler, J.S., Alexoff, D., Logan, J., Jayne, M., Wong, C., Tomasi, D., 2014. Decreased dopamine brain reactivity in marijuana abusers is associated with negative emotionality and addiction severity. Proc. Natl. Acad. Sci. U. S. A. 111, E3149-56. https://doi.org/10.1073/pnas.1411228111
Wachtel, S., ElSohly, M., Ross, S., Ambre, J., De Wit, H., 2002. Comparison of the subjective effects of ??9-tetrahydrocannabinol and marijuana in humans. Psychopharmacology (Berl). 161, 331–339. https://doi.org/10.1007/s00213-002-1033-2
Wall, M.E., Sadler, B.M., Brine, D., Taylor, H., Perez-Reyes, M., 1983. Metabolism, disposition, and kinetics of delta-9-tetrahydrocannabinol in men and women. Clin. Pharmacol. Ther. 34, 352–363. https://doi.org/10.1038/clpt.1983.179
WHO | Cannabis, 2010. . WHO.
Wilson, D.M., Varvel, S.A., Harloe, J.P., Martin, B.R., Lichtman, A.H., 2006. SR 141716 (Rimonabant) precipitates withdrawal in marijuana-dependent mice. Pharmacol. Biochem. Behav. 85, 105–113. https://doi.org/10.1016/j.pbb.2006.07.018
Zangen, A., 2006. Two Brain Sites for Cannabinoid Reward. J. Neurosci. 26, 4901–4907. https://doi.org/10.1523/JNEUROSCI.3554-05.2006
Zgair, A., Wong, J.C.M., Lee, J.B., Mistry, J., Sivak, O., Wasan, K.M., Hennig, I.M., Barrett, D.A., Constantinescu, C.S., Fischer, P.M., Gershkovich, P., 2016. Dietary fats and pharmaceutical lipid excipients increase systemic exposure to orally administered cannabis and cannabis-based medicines. Am. J. Transl. Res. 8, 3448–3459. https://doi.org/10.1007/s11095-013-1127-z
Zgair, A., Wong, J.C.M., Sabri, A., Fischer, P.M., Barrett, D.A., Constantinescu, C.S., Gershkovich, P., 2015. Development of a simple and sensitive HPLC–UV method for the simultaneous determination of cannabidiol and 9 -tetrahydrocannabinol in rat plasma. J. Pharm. Biomed. Anal. J. Pharm. Biomed. 114, 145–151. https://doi.org/10.1016/j.jpba.2015.05.019
Zuurman, L., Ippel, A.E., Moin, E., Van Gerven, J.M.A., 2009. Biomarkers for the effects of cannabis and THC in healthy volunteers. Br. J. Clin. Pharmacol. 67, 5–21. https://doi.org/10.1111/j.1365-2125.2008.03329.x
Zuurman, L., Roy, C., Schoemaker, R.C., Hazekamp, a, den Hartigh, J., Bender, J.C., Verpoorte, R., Pinquier, J.L., Cohen, a F., van Gerven, J.M., 2008. Effect of intrapulmonary tetrahydrocannabinol administration in humans. J Psychopharmacol 22, 707–716. https://doi.org/10.1177/0269881108089581
110
BIOGRAPHICAL SKETCH
Abhigyan Ravula was born in Hyderabad, India in 1992. In 2013, he received his
bachelor’s in pharmacy from the Manipal College of Pharmaceutical Sciences, Manipal,
India. In August 2013, he began his graduate studies in the Department of
Pharmaceutics at the University of Florida, Gainesville under the direction of Dr.
Hartmut Derendorf. His research interests include POPPK, PBPK and PK/PD modeling
of cannabinoids. In his dissertation, Abhigyan focuses on evaluating the
pharmacokinetics and pharmacodynamics of tetrahydrocannabinol to characterize
tetrahydrocannabinol induced cannabinoid dependence. In addition, Abhigyan gained
industry experience as an Academic Contractor in the Global PK/PD and
Pharmacometrics group at Eli Lilly. He gave several poster presentations at various
international conferences. He is an active member of ACCP. Abhigyan was also a
member of the University of Florida and South East All Stars (American College Cricket,
2018) Cricket Team. He received his Ph.D. from University of Florida in the spring of
2018.