nairobi.mapping4.aug25.doc 7 pages 4,60 word0s
TRANSCRIPT
Nairobi .mapping4.aug25.doc 7 pages 4,600 words
Participatory Mapping for Good Change
Abstract
In recent years, changes in participatory methodologies (PMs) may have been even more rapid than those in spatial technologies. Local people's abilities to make maps only became widely known and facilitated in the early 1990s. Participatory mapping has spread like a pandemic with many variants and applications not only in natural resource management but also in many other domains. With mapping as one element, there are now signs of a new pluralist eclecticism and creativity in PMs. The medium and means of mapping, whether ground, paper or GIS, and the style and mode of facilitation, influence who takes part, the nature of outcomes and power relationships. Much depends on the behaviour and attitudes of facilitators and who controls the process. Many ethical issues present troubling dilemmas, and lead to overarching questions about empowerment and ownership. Questions to be asked, again and again, are:
Who is empowered and who disempowered? and
Who gains and who loses?
Contents
Our context of change A bit of history Participatory maps: purposes and uses Medium, process and power Behaviour, attitudes and facilitation Ethics Ownership and use References and some sources
Appendix: A participation ladder with roles and relationships
Our Context of Change
We are living through an age when there is a sense, and perhaps a reality, of change accelerating. Perhaps the most obvious domain is communications technology and its applications. Specifically, in the context of this conference, the development and spread of GIS and GPS immediately stand out. Much has happened since the workshop to discuss participatory research and the potential for participatory Geographic Information Systems convened at the University of Durham in the UK in January 1998 (Abbott et al 1998). The range of experience that could be brought together then was quite limited. In the seven years since, the technology has evolved and become more accessible and adaptable, and applications have multiplied. This may tempt us to focus on the technology. But to do so could overlook or undervalue the explosive multiplication of participatory approaches, methods and their combinations during the same period1. With participatory methodologies (PMs) we have entered a phase of increasingly inventive and eclectic pluralism with borrowing and cross-fertilisation between participatory streams, in which the old labels - PRA, Appreciative Inquiry, Participatory Technology Development, the more inclusive PLA (Participatory Learning and Action), and the like - are still used but less and less refer to anything that could be described as schools. So in the focus of this conference we have two intermingling streams, GIS and PMs, both evolving and changing fast, and as they combine perhaps also accelerating the potential for learning how to do things differently and better. I cannot judge well, but it may even be that more has changed and is changing faster and more creatively, in PMs than in the technology.
Much has indeed evolved in the theory and practice of participation. Ladders have been developed to show different forms and degrees of participation (see appendix). Participatory approaches have been applied to fields as diverse as intra household gender relations, local government budgeting, workshops, rights-based approaches to development, downward accountability, monitoring and evaluation, agricultural extension and research, seed breeding, and learning and teaching. A phase of not always well-informed academic criticism of the many misuses and abuses of participation has peaked, with a shift now from talk of the "tyranny" of participation (Cooke and Kothari 2001) to "from tyranny to transformation" (Giles and Mohan 2004). The focus has continued to shift from methods to behaviour and attitudes. Language use has also evolved. "Spaces" is now widely used in a largely, though not entirely, metaphorical sense in discussions of participation and power, distinguishing spaces to which people are invited from those that people claim. Power and relationships, and individual behaviour and attitudes, have continued to move from the radical wings closer to centre stage in the discourse and practice of participation and of development more generally.
Of all the visual methods, sometimes referred to as PRA methods, that have taken off and been widely adopted, participatory mapping has been the most widespread. Participatory modelling has also made a breakthrough through the work of Rambaldi and his colleagues in the Philippines and elsewhere (Rambaldi and Callosa-Tarr 2000, 2002 and 2005). Other methods, like matrix scoring, seasonal diagramming, Venn diagramming, causal-linkage and flow diagramming, and wealth or wellbeing ranking, have been adopted and used, one can almost say "all over the world"1'. But the versatility and power of participatory mapping, the relative ease with which it can be facilitated, the fun, fulfilment and pride which people derive from it, and its multiple uses by so many stakeholders, have helped it to spread more than the others and as a pandemic.
A bit of history

It is astonishing and sobering to see how far we have come and how fast, and how ignorant we were just a few years ago.
Before the late 1980s and early 1990s when some of us were so excited at what we were finding local people could do, much indigenous, local and participatory mapping had already taken place in different regions, countries and continents. Mapping and various forms of spatial representation by local people on their own have a long history, and very likely a prehistory. Some remarkable examples are shown in the delightful book Maps are Territories by David Turnbull (1989). The earliest is a wall painting dating to 6,200 BC, from Catal Huyuk. There are coastal charts carved in wood and carried in their kayaks by the Greenland Inuit. There is a manuscript map of the Mississippi by Non Chi Ning Ga, an Iowa Indian Chief, presented in 1837 in Washington as part of a land claim. And most remarkable of all are stick charts from the Marshall Islands in which shells represent islands, and sticks show currents and lines of swell. Yet other examples in the book express cultural knowledge and senses of place of Australian Aborigines and the San of the Kalahari.
Mapping facilitated by outsiders is more recent. More remarkable than what local people had already done in mapping and other forms of spatial representation was "our" educated professional ignorance of their mapping abilities. Not even social anthropologists appear to have facilitated mapping1". We simply did not know what people could do. There were isolated initiatives. In Kingston, Jamaica, in the 1970s, Frances Madden (pers comm.) asked youths to draw a map to show where waste bins should be located; but when she showed the map to her supervisor he told her to go away and do a proper one. Robert Rhoades (pers. comm.) around the same time facilitated 3D modelling by farmers in the Andes. Reportedly, World Vision facilitated mapping in Tamil Nadu in the early 1980s. And doubtless there were others who did likewise. But in general, we ("educated" professionals) were so fixed on our own cartography and ideas of what were "proper" maps, and on the belief that only "we" could make them, that we did not realise how well and how usefully local "uneducated" people did, and could, make their own. So these earlier initiatives remained isolated and did not spread.
Even if personal journeys give distorted views of events, they may help understand process, timing and sequence. I was lucky to be a participant-observer through the enthralling revolution which took place. First, before it began, in the early 1970s, I spent much time being, as I thought, rather clever, filling in a map of much of the Northeast of Kenya by asking pastoralists how many hours it would take them to walk to places they could name but which were not on the map from named places which were on the map, and then triangulating to fill in the big blanks of the cartographic maps of those days. It never occurred to me to ask them to draw the map themselves! Agro-ecosystem analysis (Gypmantasiri et al 1980; Conway 1985) was then a methodological breakthrough of the 1980s, and contributed the practice of sketch mapping to RRA (rapid rural appraisal). But the maps were made "by us" and often had serious inaccuracies and omissions. In about 1988 a group of "us" over two days made a sketch map of a Sudanese village during an RRA training, and were embarrassed, as were the villagers, when we checked it out with them: "You have only one bakery on the map, but we have three". It was also in 1988 in an AKRSP (India) RRA training involving Jennifer McCracken, Anil Shah, Parmesh Shah and others, that a headman, asked to present to the villagers the map the outsiders had draw, had difficulty until he turned it "upside down", which was the way he and the villagers saw their village. In parallel came the discovery that local people could readily interpret black and white aerial photographs, often at 1:5000 (Dewees 1989; Mearns 1989; Sandford 1989). We were teetering on the brink of learning that "They can do it".
The revolutionary breakthrough was the discovery during the evolution of PF5A (participatory rural appraisal) that local people could themselves make their own often brilliant maps. A contrast can illustrate. In 1974,1 spent two hot days in a South Indian village trying and failing to make a map to show all the wells. In late 1989, during the second PRA event in India in Kistagiri village in Andhra Pradesh, when Sam Joseph invited farmers to make their own map they plotted all their wells with much animated crosschecking and correction, and then indicated which were in good condition, and which bad or dry. They did the plotting in just 25 minutes! There were other Eureka! moments. In the first PFtA event, in Kalmandargi village, led by Jimmy Mascarenhas, farmers built a remarkable coloured 3D model of their village watershed. In Kistagiri the first social and resource maps were made. In this dawn, as with hindsight it seems, facilitators kept wondering whether these were near-miraculous one-off anomalies and hardly dared to hope that they could be repeated. But they were, again and again, and they sparked an explosion of participatory mapping in India which quickly spread to other countries. Colourful illustrations of maps with slides were one reason why PRA spread there so quickly and so easily and overwhelmed educated scepticism'". I look back now on the 1980s with something close to disbelief and shame that we could have been so ignorant for so long before discovering what local people could do. Now, with the spread of PRA and PMs hundreds of thousands, possibly even over a million, of such maps have been made.
Participatory maps: purposes and uses
In this conference the papers focus mainly on natural resource management (NRM), and on indigenous and cultural knowledge. There are now innumerable examples of mapping for NRM, covering forestry, watersheds, irrigation, coastal management, fishing, pastoralism, traditional territories, parks and conservation, biodiversity, distribution of species and so on, as variously represented in the papers being presented. Such maps range from comprehensive resource mapping to mapping of just one resource like for example livestock forage (Conroy 2005:51,55) or the distribution of a species. Uses include land use and resource planning and management, wildlife conservation, identifying tenure and rights, negotiating boundaries and resource uses, resolving conflicts, and participatory monitoring and evaluation (PM and E).
Participatory spatial mapping has been used for a whole range of other purposes, some of which can combine with or complement uses for NRM and indigenous cultural knowledge. Some of these are:
» Social mapping, identifying people", livestock, children who do and do not go to school, people in different livelihood and other social categories, wealth and wellbeing groups...
• Health mapping, for people with health problems, disabilities, special knowledge etc in communities. In the UK participatory mapping by women has shown the location and concentrations of breast cancer (Lynn et al n.d.)
• Mobility mapping, showing who goes where for what and how often • Education, in schools, by school children, with varying degrees of creative or didactic style, (e.g. Govinda
1999) ° Mapping in Reflect circles for empowerment, awareness and literacy (Archer and Goreth 2004) • Water and sanitation, for example in rural villages in India (Joseph 1994), and in Da es Salaam
(Gloeckner et al 2004). Mapping areas of open defecation is a key element in the spreading movement for Community-Led Total Sanitation in Bangladesh, Cambodia, India, Indonesia, Mongolia, and Nepal (Kar 2003, 2005)
9 Farm mapping, combined with mapping of nutrient flows within the farm and over the farm boundaries (as undertaken by many organic farmers in Karatina, Nyeri District, Kenya in 1996)
• Prevention of crime - in South Africa (Liebermann and Coulson 2004), and in Tanzania with the identification of locations of molestation, assault and rape and their degrees of risk by women in villages in Mwanza Region in Tanzania.
• Calibrating and correcting a census. In Malawi this pointed to a rural population of 11.5 million compared with the official census figure of 8.5 million, implying plausibly an undercount of some 35 per cent (Barahona and Levy 2003)
• Participatory monitoring and evaluation (PM and E)
PM and E deserves special note. Maps were used for impact monitoring of soil and water conservation and changes in farming practices at least as early as 1990 by AKRSP (India) in Gujarat (Shah et al 1991): farmers made baseline and impact maps which could be compared, analysed and presented to other farmers. Participatory monitoring of progress towards total community sanitation in hamlets in Bangladesh has been recorded and updated on social maps in public places where all can see them (Kar 2003,2005). Experience to date with the use of participatory and other maps for monitoring and evaluation deserves its own review study".
Many more applications of participatory mapping can be expected.
Medium, process and power
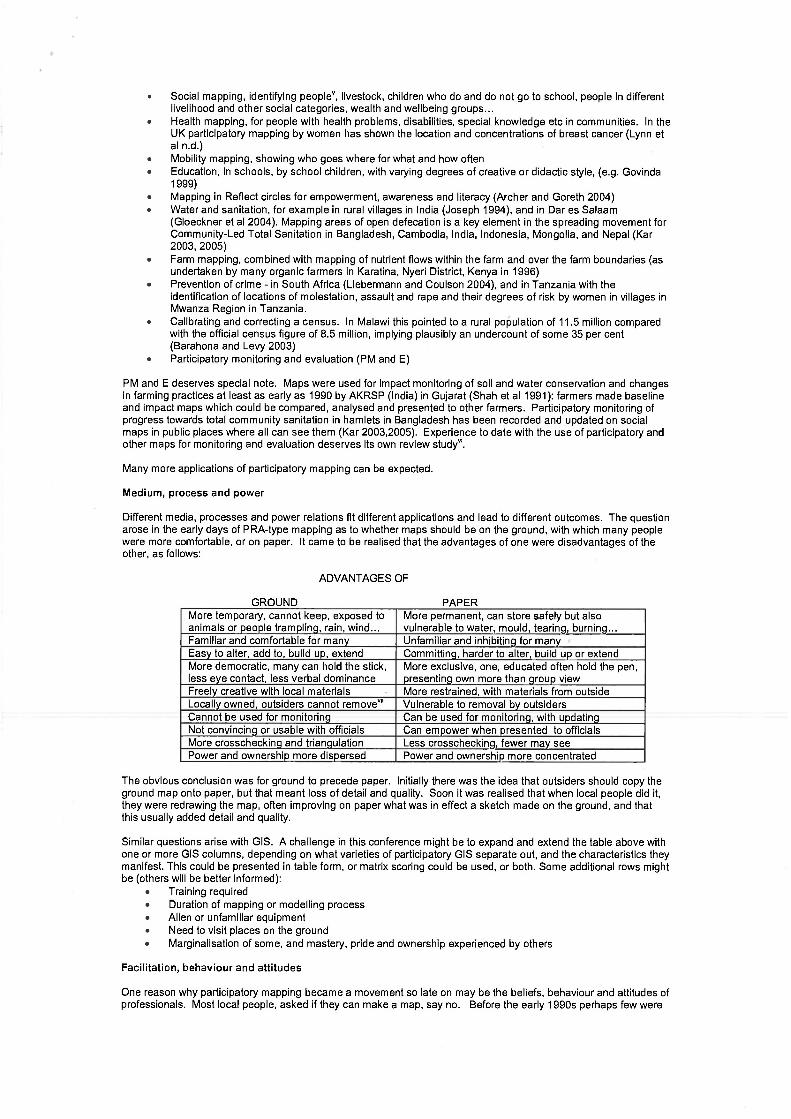
Different media, processes and power relations fit different applications and lead to different outcomes. The question arose in the early days of PRA-type mapping as to whether maps should be on the ground, with which many people were more comfortable, or on paper. It came to be realised that the advantages of one were disadvantages of the other, as follows:
ADVANTAGES OF
GROUND PAPER More temporary, cannot keep, exposed to animals or people trampling, rain, wind...
More permanent, can store safely but also vulnerable to water, mould, tearing, burning...
Familiar and comfortable for many Unfamiliar and inhibiting for many Easy to alter, add to, build up, extend Committing, harder to alter, build up or extend More democratic, many can hold the stick, less eye contact, less verbal dominance
More exclusive, one, educated often hold the pen, presenting own more than group view
Freely creative with local materials More restrained, with materials from outside Locally owned, outsiders cannot remove™ Vulnerable to removal by outsiders Cannot be used for monitoring Can be used for monitoring, with updating Not convincing or usable with officials Can empower when presented to officials More crosschecking and triangulation Less crosschecking, fewer may see Power and ownership more dispersed Power and ownership more concentrated
The obvious conclusion was for ground to precede paper. Initially there was the idea that outsiders should copy the ground map onto paper, but that meant loss of detail and quality. Soon it was realised that when local people did it, they were redrawing the map, often improving on paper what was in effect a sketch made on the ground, and that this usually added detail and quality.
Similar questions arise with GIS. A challenge in this conference might be to expand and extend the table above with one or more GIS columns, depending on what varieties of participatory GIS separate out, and the characteristics they manifest. This could be presented in table form, or matrix scoring could be used, or both. Some additional rows might be (others will be better informed):
• Training required • Duration of mapping or modelling process • Alien or unfamiliar equipment • Need to visit places on the ground
• Marginalisation of some, and mastery, pride and ownership experienced by others
Facilitation, behaviour and attitudes One reason why participatory mapping became a movement so late on may be the beliefs, behaviour and attitudes of professionals. Most local people, asked if they can make a map, say no. Before the early 1990s perhaps few were
asked anyway, and if they were, their responses were taken at face value. What we learnt was that the facilitator had to believe that "They can do it", and also allow people time to work out for themselves how to do it. A little initial help drawing with a stick on the ground was sometimes needed to start things off, leading quickly to "handing over the stick" and then shutting up and letting the process take off. These were not normal professional behaviours, and induced disability - the inability of "lowers" to do things because of "uppers'" behaviour, is still widespread in development.
In PRA practice, behaviour and attitudes1"", and by implication ethics, have been again and again neglected by some and again and again emphasised by others. The fascination of the methods has almost mesmerised some facilitators but this seems to be becoming less common. It can be asked whether with GIS and GPS there is a danger of disempowering people because, unlike ground mapping, there may need to be a period of training which puts the outsider in a dominant, knowledgeable role. A question for the conference is whether this is so, what the experience has been, and what should be done.
Ethics
Ethical issues have received increasing prominence with the use of PRA methods with visuals and tangibles. A code of ethics has been drafted for those who use such methods to obtain numbers." Some of the main abuses have been:
• Taking people's time. The time of poor people is, contrary to common professional belief, often very precious, especially at difficult times of the year (often during the rains). Rural people are often polite, hospitable and deferential to outsiders, who do not realise the sacrifices they are making. A day of weeding lost at a critical time can have high hidden costs in a smaller harvest.
• Raising expectations. Any process of analysis facilitated by an outsider is liable to raise expectations of some benefit, even when the outsider goes to pains to explain that they have nothing to offer and nothing will follow from their visit. Disappointment, and reinforced disillusion with visitors and organisations outside the community then follow.
• Extracting information only for the outsiders' benefit without this being clear to those who provide it. This is familiar and can apply to almost any professionals. The information may take various forms such as a map which is taken away, or local knowledge, for example of medicinal or other plants. This is a major issue with knowledge of commercial value, which will surely come up in this conference.
• Extracting information which will be used against people. I cannot cite cases but this must surely occur • Exposing people to danger. Street children who made maps of their parts of Cairo in all innocence showed
where the drug dealers operated, which could have got them in trouble if the authorities learnt and took action. Urban dwellers in Jamaica analysing violence had to be stopped for their own safety when local thugs began to take a suspicious interest. Children in a refugee camp inadvertently showed the market where they went with their parents to sell relief food illegally....
• Repeating activities. Some (doubtless accessible) villages in Malawi are said to have been "carpet-bombed" with PRA, and reportedly intercept visitors before they enter and negotiate with them, while more "remote" villages are never visited. Maps may be drawn, and taken away by outsiders, again and again. Before even entering a village in Nepal (probably close to Kathmandu), a visitor was met by a man who came out and started drawing a map. "Have you ever done this before?" "At least a hundred times" (pers. comm. Ram Yalla)
• Causing tensions or violence in a community. This has occurred especially with women who take part in participatory activities, and then when the outsider has left are abused or beaten by their husbands. This can apply to any "lower" group in a community.
This is illustrative and makes no pretence to be complete. Participatory GIS and other information management and communication present their own ethical challenges, which we may wish to share and explore in the conference.
Ownership and Use.
Ownership and use are pervasive issues related to context, purpose, medium, process, facilitation, behaviour, attitudes and relationships as discussed above. The challenges are there in every process.
Photography is an illustrative case, heightened and changed by technology. There is a new ease with digital cameras of "capturing" a map. On the positive side, this can mean that the original map stays with a community, and that prints of the photographs can be returned to them as thanks. On the negative side, it can mean that information is much more easily extracted and removed than before. If the original map was only on the ground, and no photographs are returned, people in the community are left with nothing. Here, as ever, it comes back to personal awareness, commitment, and responsibility.
The Durham workshop concluded by asking questions (Abbott et al 1998:32-33). One was
"Is a GIS really necessary? Would GIS add anything that cannot better be achieved through PRM [participatory resource management]?"
Its list of other questions bears repeating. The authors urged:
"Repeatedly ask:
Who participates in whose mapping? Whose knowledge, categories, perceptions and reality are expressed? What is missed (e.g. micro environments like home gardens)?
Who owns the map? Where is it kept? Who has access and why? Who understands it? Who updates it? Who uses it? For what purposes?
And ask again and again:
Who is empowered and who disempowered? Who gains and who loses?"
Are these questions as pertinent as ever? Are there others we should add?
24 August 2005 Robert Chambers
References and some sources (not all referred to in the text)
Abbott, Jo, Robert Chambers, Christine Dunn, Trevor Harris, Emmanuel de Merode, Gina Porter, Janet Townsend and Daniel Weiner 1998 "Participatory GIS: opportunity or oxymoron" PLA Notes 23 :27-34, October
Alcorn, Janis B. 2000 Borders, Rules and Governance: Mapping to catalyse changes in policy and management. Gatekeeper Series 91, MED London
Archer, David and N.M.Goreth 2004 "Participation, literacy and empowerment: the continuing evolution of Reflect" Participatory Learning and Action [formerly PLA Notes, formerly RRA Notes] 50: 35-44
Asean Biodiversity 2002 GIS and the Fingertips, Asean Biodiversity vol 2 no 1 January-March
Barahona, Carlos and Sarah Levy 2003 How to Generate Statistics and Influence Policy Using Participatory Methods in Research: Reflections on Work in Malawi 1999-2002. IDS Working Paper, IDS Sussex [also an article forthcoming in World Development!
Brody, Hugh 1981 Maps and Dreams: Indians and the British Columbia Frontier, Faber and Faber. London. Boston
Chambers, Robert 1997 Whose Reality Counts? Putting the First Last. Intermediate Technology Publications, London
Chambers, Robert 2003 "Participation and numbers" PLA Notes 47: 6-12
Chambers, Robert 2005 Ideas for Development. Earthscan, London and Sterling VA
Conroy, Czech 2005 Participatory Livestock Research: a guide. ITDG Publishing, Bourton-on Dunsmore, Warwickshire UK
Conway, G., 1985 "Agro-ecosystem Analysis", Agricultural Administration 20: 31-55
Cooke, Bill and Uma Kothari eds 2001 Participation: The New Tyranny?. Zed Books, London
CSDMS n.d. Mapping the Neighbourhood: The Great Arc 200 Years Celebrating the Quest, Centre for Spatial Database Management and Solutions, G-4 Sector 29, Noida, UP 201301, India
Chattopadhyay, Srikumar, P.Krishna Kumar and K. Rajalakshmi 1999 Panchavat Resource Mapping to Panchavat-level Planning in Kerala: an Analytical Study. Discussion Paper No 14, Kerala Research Programme for Local Level Development, Centre for Development Studies, Thiruvananthapuram, Kerala, December
Dewes, Peter 1989 "Aerial photography and household studies in Kenya" RRA Notes 7 :9-12
Flavelle, Alix 1995 "Community-based mapping in Southeast Asia". Cultural Survival Quarterly, Geomatics: Who needs it?. Winter 1995 : 72-3 makes point that process, bringing people together, can be as important as the rsulting maps
Gloeckner, Heike, Meki Mkanga and Timothy Ndezi 2004 "Local empowerment through community mapping for water and sanitation in Dar es Salaam" Environment and Urbanization 16: 185-198, April
Gonzalez, Rhodora M. 2002 "Joint learning with GIS: multi-actor resource management", Agricultural Systems 73: 99-111
Gould, Peter and Rodney White 1974 Mental Maps. Penguin Books, Harmondsworth, UK

Govinda, R. 1999 Reaching the Unreached through participatory planning: school mapping in Lok Jumbish, India, International Institute for Educational Planning, Paris and National Institute of Educational Planning and Administration, New Delhi
Gypmantasiri et al and Gordon Conway 1980 An Interdisciplinary Perspective of Cropping Systems in the Chiang Mai Valley. Key Questions for Research. Multiple Cropping Project, Faculty of Agriculture, University of Chian Mai, Thailand, June
Hickey, Samuel and Giles Mohan eds 2004 Participation: from tyranny to transformation?, ZED Books, London
Joseph, Sam 1994 "Mapping a Relationship" [planning village water and sanitation} Participation in Action. ActionAid, Bangalore, Issue 1, September
Kar, Kamal 2003 and 2005 Subsidy or Self-Respect? Participatory Total Community Sanitation in Bangladesh. Working Paper 184, IDS Sussex, September 2003 with update insertion 2005
KKU 1987 Proceedings of the 1985 International Conference on Rapid Rural Appraisal. Rural Systems Research and Farming systems Research Projects, University of Khon Kaen, Thailand
Liebermann, Susan and Justine Coulson 2004 "Participatory mapping for crime prevention in South Africa - local solutions to local problems" Environment and Urbanization 16: 125-134, October
Lightfoot, Clive, Nancy Axinn, Pal Singh, Anthony Bottrall and Gordon Conway, compilers 1989 Training Resource Book for Agro-Ecosystem Mapping, process documentation of an experiential learning exercise in agro-ecosystem mapping held at Rajendra Agricultural University, Pusa, Bihar, India 7-10 1989, International Rice Research Institute, Philippines and Ford Foundation India
Lynn, Helen, Diana Ward, Cathy Nugent, Laura Potts, Liz Skan and Nicola Conway n.d. Putting Breast Cancer on the Map, The Women's Environment Network, 87 Worship St, London EC2A 2BE [email protected] www.gn.apc.org/wen
McKinnon, John 2005 "Mobile Interactive GIS: Bringing indigenous knowledge and scientific information together. A narrative account" in Andreas Neef ed Participatory approaches....: 217-231
Mearns, Robin 1989 "Aerial photographs in rapid land resource appraisal, Papua New Guinea" RRA Notes 7: 12-14A
Neef, Andreas ed 2005 Participatory approaches for sustainable land use in Southeast Asia. White Lotus Press GPO Box 1141, Bangkok
Poole, Petered. 1995 Cultural Survival Quarterly: Geomatics: Who Needs it?
Rambaldi, Giacomo and Jasmin Callosa-Tarr 2000 Manual on Participatory 3-D Modeling for Natural Resource Management. Essentials of Protected Area Management in the Philippines, vol 7, NIPAP, PAWB-DENR, Philippines
Rambaldi, Giacomo and Jasmin Callosa-Tarr 2002 Participatory 3-Dimensional Modelling: Guiding principles and applications. ASEAN Regional Center for Biodiversity Conservation, Los Banos, Philippines
Rambaldi, Giacomo and Jasmin Callosa-Tarr 2005 "Participatory 3-D Modelling: Bridging the gap between communities and GIS technology" in Andreas Neef ed Participatory approaches....: 205-216
Rambaldi, Giacomo, Sahlee Bugna, Angela Tiangco and Dave De Vera 2002 "Bringing the Vertical Dimension to the Negotiating Table: preliminary assessment of a conflict resolution case in the Philippines", Asean Biodiversity vol 2 no 1:17-26
Rambaldi, Giacomo, Peter A.Kwaku Kiem, Peter Mbile, Mike McCall and Daniel Weiner 2005 Participatory Spatial Information Management and Communication in Developing Countries, paper for Mapping for Change International Conference, Nairobi, 7-10 September 2005-08-25
Robinson, Mike, Terry Garvin and Gordon Hodgson 1994 Mapping How We Use Our Land using participatory action research. Partnership Agreement in Forestry, Alberta, Canada
Sandford, Dick 1989 "A note on the use of aerial photographs for land use planning on a settlement site in Ethiopia" RRA Notes 6: 18-19
Shah, Parmesh, Girish Bharadwaj and Ranjit Ambastha 1991 "Participatory impct monitoring of a soil and water conservation programme by farmers, extension volunteers and AKRSP in Gujarat", Proceedings of the February 1991 Bangalore PRA Trainers Workshop. RRA Notes 13: 128-131
Turnbull, David 1989 Maps are Territories: Science is an Atlas, Deakin University Press, Australia
Tuan, Yi-Fu 1974 Topophilia: a study of environmental perception, attitudes and values. Columbia University Press, New York and Oxford

1 For an overview see Chambers 2005 : pages " The only major countries in the South where I have never heard of anything called PRA being used are Algeria, Iraq, North Korea, and Saudi Arabia. And this may simply show my ignorance. PRA practices have also spread in countries of the North, especially the UK. "' I am making this assertion in the hope of being contradicted with chapter and verse. IV When I showed slides of the Kalmandargi model and the Kistagiri maps, all of them created by villagers in at most a few hours with only light facilitation, at the Remote Sensing Centre in Hyderabad, the Director asked me "And how long did it take you to train the villagers to do that? One year? Two years?" v A remarkable example from Malawi was the calibration of the national census using participatory mapping to identify households, which led to raising the estimate for the rural population from 8.5 to 11.5 million (Barahona and Levy 2004 check) v' Such a study may exist. I shall be grateful for information on this v" Ground maps can, however, be "removed" as photographs, and reproduced now more easily than in the past Vl" I hesitate to self-reference, but there is a fuller treatment of behaviour, attitudes and beyond in chapter 6 of my book Ideas for Development (2005) together with references to sources which I am not repeating here lx Participatory numbers is an expanding area. I have attempted an overview (Chambers 2003) which is rapidly being put out of date