digitool.library.mcgill.cadigitool.library.mcgill.ca/thesisfile28846.pdf · • • abstract a new...
TRANSCRIPT

1+1 Nalionallibrary01 Canada
Bibliothèque nationaledu Canada
Acquisitions and Direclion des acquisilions elBibliographie selVices Branch dèS selVices bibliographiques
395 Wellinglon Street 395. Ne WellingtonOttawa,Onlar)() Ottawa (Onlano)K1AON4 K1AON4
NOTICE AVIS
The quality of this micrcfcrm isheavily dependent upon thequality of the original thesissubmitted for microfilming.Every effort has been made toensure the highest quality ofreproduction possible.
If pages are missing, contact theuniversity which granted thedegree.
Some pages may have indistinctprint especially if the originalpages were typed with a poortypewriter ribbon or if theuniversity sent us an inferiorphotocopy.
Reproduction in full or in part ofthis microform is governed bythe Canadian Copyright Act,R.S.C. 1970, c. C-30, andsubsequent amendments.
Canada
La qualité de cette microformedépend grandement de la qualitéde la thèse soumise aumicrofilmage. Nous avons toutfait pour assurer une qualitésupérieure de reproduction.
S'il manque des pages, veuillezcommuniquer avec l'universitéqui a conféré le grade.
La qualité d'impression decertaines pages peut laisser à .désirer, surtout si les pagesoriginales ont étédactylographiées à l'aide d'unruban usé ou si j'université nousa fait parvenir une photocopie dequalité inférieure.
La reproduction, même partielle,de cette mlcroforme est soumiseà la Loi canadienne sur le droitd'auteur, SRC 1970, c. C-30, etses amendements subséquents.
•
•
Thermal Analysis of Aluminum Foundry Alloys
by a Novel Beat Pipe Probe
by
Mahmood MERATIAN ISFAHANI
A Thesis Submitted to the Faculty of Graduate Studies and
Res~arch in Partial Fulfilment of the Requirements
fGr the Degree of Doctor of Philosophy
Department of Mining and Metallurgical Engineering
McGill University
Montreal, Canada
Jan., 1995
C M. Meratian, 1995

1+1 National Ubraryo'Canada
Bibliothèque nationaledu Canada
Acquisitions and Direction des acquisitions etBiblIOgraphie services Branch des servicas bibliographiques
39S Wellinglon St,eet 395. rue WelhngtonOttawa. Ontario Ottawa (Onlario)K1A 0N4 K1A ON4
THE AUTHOR HAS GRANTED ANIRREVOCABLE NON-EXCLUSIVELICENCE ALLOWING THE NATIONALLffiRARY OF CANADA TOREPRODUCE, LOAN, DISTRmUTE ORSELL COPIES OF mSIHER THESIS BYANY MEANS AND IN ANY FORM ORFORMAT, MAKING TffiS THESISAVAILABLE TO INTERESTEDPERSONS.
THE AUTHOR RETAINS OWNERSHIPOF THE COPYRIGHT IN mSIHERTHESIS. NEITHER THE THESIS NORSUBSTANTIAL EXTRACTS FROM ITMAY BE PRINTED OR OTHERWISEREPRODUCED WITHOUT mSIHERPERMISSION.
ISBN 0-612-05756-9
Canad~
L'AUTEUR A ACCORDE UNE LICENCEIRREVOCABLE ET NON EXCLUSIVEPERMETTANT A LA BffiLIOTHEQlT5NATIONALE DU CANADA DEREPRODUIRE, PRETER, DISTRIBUEROU VENDRE DES COPIES DE SATHESE DE QUELQUE MANIERE ETSOUS QUELQUE FORME QUE CE SOITPOUR METTRE DES EXEMPLAIRES DECETTE THESE A LA DISPOSITION DESPERSONNE INTERESSEES.
L'AUTEUR CONSERVE LA PROPRIETEDU DROIT D'AUTEUR QUI PROTEGESA THESE. NI LA THESE NI DESEXTRAITS SUBSTANTIELS DE CELLECI NE DOIVENT ETRE IMPRIMES OUAUTREMENT REPRODUITS SANS SONAUTORISATION.

•
•
-_......--------...,-_.~ ........~-... ..... '....~.~, ..• "'.~ ........._......__......_-_.._--

•
•
ABSTRACT
A new application of heat pipes is introduced. The pre3ent research deals
with the development of a heat pipe for the on-line quality control of liquid
aluminum silicon foundry alloys.
Thermal analysis is a technique whereby a small quantity of a melt is
allowed to solidify while its cooling curve is recorded. Analysis of the cooling
curve with standard mathematical algorithms allows one to determine a number of
useful parameters that characterize the liquid and solid states of the material. In
aluminum-silicon casting alloys thermal analysis is often used to assess the grain
size and degree of eutectic modification of the alloy before pouring.
A novel probe has been developed for conducting thermal analysis of
aluminum alloy melts. The probe, which resides in the melt, need not be
withdrawn as it solidifies a small sample (i.e. button) at a predetermined cooling
rate. Once the cooling curve results have been acquired, the probe can be
instructed to remelt the frozen button and await instrJctions for analyzing a fresh
sample.
The operating principle of Ibis novel device is based on heat pipe
technology. In simple terms, a heat pipe consists of a condenser and an evaporator
which contain a relatively small quantity of working substance fluid. As heat is
absorbed by the evaporator, the liquid phase of the working substance is vaporized
and subsequently condensed on the condenser walls from which heat is extracted.
Il has been shawn that the designed probe, which is classified as agas
loaded annular thermosyphon, is completely workable in the range of conditions

• ABSTRACT ii
•
typically encountered in the thermal analysis of aluminum alloys. Tht: thermal
analysis results obtained with this new technique are in a good agreement with
those of conventional thermal analysis. In addition, the new method is applicable
to a wider range of operating conàitions and i~ easier to use. Based on the semi
continuous nature of the new method, it does not need pre-preparation (materials,
labour, pre-heating, thermocouple installation for each test, isolation of the
sampling cup, etc.) to start thermal analysis. Also, from a cooling rate point of
view, the system is weIl controllable. Moreover, it is shown that the probe is
simple in construction, easy to use, and intelligent enough to provide semi
continu.Jus thermal analysis. There are no consumable mat.,rials and mcving parts.
Thermal analysis results are reported for pure aluminum, hypoeutectic
aluminum silicon (356) and eutectic aluminum silicon (413) casting alloys.
Agreement in the results between the new and conventional systems is shown to
be excellent. Finally, a heat transferlsolidification model of the heat pipe thermal
analysis probe is derived and validated.
•
•
RÉsUMÉ
Une nouvelle application des caloducs est introduite. Les travaux de
recherche présentés dans cet ouvrage concernent le développement d'un caloduc
pour le contrôle de qualité sur le site des alliages de fonderie Al-Si à l'état liquide.
L'analyse thermique est une technique qui permet d'enregistrer la courbe
de refroidissement d'un petit échantillon pris dans la coulée. Le traitement de cette
courbe avec des algorithmes standards permet de déterminer plusieurs paramètres
utiles qui caractérisent les états liquide et solide du matériau. Dans les alliages de
fonderie Al-Si, l'analyse thermique est souvent utilisée pour estimer la taille des
grains et le degré de modification de l'alliage avant la coulée.
Une nouvelle sonde a été développée pour faire des analyses thermiques des
coulées d'alliages d'aluminium. Placée dans la coulée, la sonde n'a pas à être
retirée lorsqu'elle solidifie un petit échantillon (par exemple un pion) à une vitesse
de refroidissement prédéterminée. Une fois que les résultats de la courbe de
refroidissement sont obtenus, on peut commander à la sonde de fondre à nouveau
le pion solidifié et d'attendre les instructions pour analyser un nouvel échantillon.
Le principe d'opération de cet équipement innovateur est basé sur la
technologie du caloduc. En termes simples, un caloduc se compose d'un
condenseur et d'un évaporateur qui contiennent une quantité relativement petite
d'un fluide comme substance de travail. Lorsque la chaleur est absorbée par
l'évaporateur, la phase liquide de la substance de trl1~lail est vaporisée et condensée
par la suite sur les parois du condenseur à partir desquelles la chaleur est extraite.
TI a été montré que la sonde conçue, qui est classée comme un
thermosyphon annulaire contenant un gaz, est entièrement utilisable dans le
domaine des conditions typiquement rencontrées dans les analyses thermiques des
alliages d'aluminium. Les résultats des analyses thermiques obtenus par cette
nouvelle technique sont en accord avec ceux obtenus par la technique
conventionnelle d'analyses thermiques. De plus, cette nouvelle méthode s'applique
dans un domaine plus large de conditions d'opérations et est plus facile à utiliser.
Etant donnée la nature semi-continue de cette nouvelle méthode, aucune
préparation est nécessaire (matériaux, main-d'oeuvre, pré-chauffage, installation
d'un thermocouple pour chaque essai, isolation du creuset d'échantillonnage, etc
...) pour commencer l'analyse thermique. Aussi, en ce qui concerne la vitesse de
refroidissement, le système se contrôle très bien. En outre, il a été montré que la
sonde est simple à construire, facile à utiliser, et assez intelligente pour produire
des analyses thermiques semi-continues. il n'y a aucun matériau qui se consumme,
ni aucune pièce en mouvement.
Les résultats des analyses thermiques pour l'aluminium pur, les alliages de
fonderie Al-Si hypoeutectique (356) et eutectique (413) sont présentés. La
concordance entre les résultats obtenus par les deux techniques, conventionnelle
et de type caloduc, se trouve être excellente. Finalement, un modèle de transfert
de chaleur/solidification de la sonde d'analyse thermique de type caloduc en a été
tiré et a été validé.
•
•
RÉSUMÉ iv
•
•
ACKNOWLEDGEMENTS
This reptJrt would not be complete without an acknowledgement of those
indivirluals who helped me a10ng dUr.dg the course of my work. ln particular, 1
would like to thank the following:
~1y wife, Dr. B. Hami, for her love, continuous emotional support,
understanding, and encouragement during those periods when my work
required much of my time and attention. Without her sacrifices, this work
could not have been accomplished.
My supervisors, Professors John E. Gruzleski and Frank Mucciardi
for their unending patience, constant encouragement and enthusiasm. Their
guidance and keen interest on the topic supplied both engaging and
iIIuminating diversions from the occasionally frustrating task of scientific
research.
One and ail of my compatriots to whom 1 owe this opportunity to
study abroad. In particular, the personal financial support of the Iranian
Ministry of Culture and Higher Education through a Post-Graduate
Scholarship is gratefully acknowledged.
1 would also like to acknowledge the technical personnel of the depnrtment
particularly Mr. Robert Paquette, Mr. Martin Knoepfel and O;Jr computer
Iaboratory manager Mr. François Dallaire.
During my stay here at McGiII 1 enjoyed a friendly multinational
environrnent. Special thanks to Peter Botos, Jon Kay, and Ms. Gail Stephen from
Canada, Wittaya LaOrchan from Thailand, Ning Jin from China, Musbah Mahfoud

and Hussein Aboulwefa from Libya, Anantha Lakhshmanan, Pranansu. S.
Mohanty alld, Ramany Sankaranarayanan from India, Ms. Guler Yamanoglu and
Hasim Mulazimoglu from Turkey, Masashi Ikezawa from Japan, Ms. Tatiyana
Luganova from Ghazaghistan and Ms. Florence Paray from France. 1 especially
wish to thank Florence for the Frencl: translation of the abstract. 1 also gratefully
acknowledge the support and encouragement from my lranian friends
1 gratefully acknowledge the Natural Sciences and Engineering Research
Council of Canada (NSERC) for materials and equipment support, and thr- Fonds
Concertés d' Action pour la Recherche (FCAR), and the McGiII Metals Processing
Centre (MMPC) for partial financial support of this project.
Many thanks go to David Sparkman of Foundry Information Systems, Inc.,
John T. Carter of General Motors Research Laboratories of Canada, and Ichizo
Tsukuda of Showa A1uminum Corporation of lapan for showing interest in this
work.
• ACKNOWLEDGEMENTS vi
•
Finally, but most importantly, 1 would Iike to express my deep gratitude to
my family in Iran for their love and moral support. My pursuit of higher education
is a product of their encouragement. Thousands of kilometres OOtween us never
existed in our hearts. As modest a work as this may 00, fust and foremost this
work is dedicated to them.

•TABLE OF CONTENTS
ABSTRACT
RÉSUMÉ
ACKNOWLEDGEMENTS
TABLE OF CONTENTS
LIST OF FIGURES
LIST OF TABLES
LIST OF SYMBOLS
Hi
v
vii
xii
xviii
xx
CHAPrERONE
INTRODUCTION 1
1.1 Scope of the Present Study . . . . . . . . . . . . . . . . . . . . . . ., 1
1.2 Overview of the Present Work 4
CHAPrERTWO
2.1 Introduction .•HEAT PIPE . . . . . . . . . . . . . . . . . . . . . . . . . . . . . . . . . . . 6
6

2.2 History 7
2.3 Operating Principles 8
2.4 Heat Pipe Types 9
2.4.1 Thermosyphon Il
2.4.2 Gas-Loaded Thermosyphon . . . . . . . . . . . . . .. 12
2.5 Heat Pipe Theory , 16
2.5.1 Thermodynamics 17
2.5.2 Fluid Flow , 18
2.5.3 Heat Transfer . . . . . . . . . . . . . . . . . . . . . .. 20
2.6 Design Considerations , 30
2.6.1 Working Substance . . . . . . . . . . . . . . . . . . .. 30
2.6.2 The Container . . . . . . . . . . . . . . . . . . . . . .. 33
2.7 Heat Pipe Applications. . . . . . . . . . . . . . . . . . . . . .. 35
• TABLE OF CONTENTS viii
•
CHAPfER TIlREE
METALLURGICAL ASPECTS 44
3.1 Introduction 44
3.2 Grain Refinement , 45
3.2.1 Grain Refinement Principles 46
3.2.2 Chemical Grain Refinement of Al Alloys 49
3.2.3 Thermal Behaviour During Heterogeneous
Nucleation 52
3.3 Modification . . . . . . . . . . . . . . . . . . . . . . . . . . . .. 53
3.3.1 The Fundamentals of Modification 54
3.3.2 Chemical Modification of Aluminum Alloys 56
3.4 Thermal Analysis . . . . . . . . . . . . . . . . . . . . . . . . .. 59

3.4.1 Thermal Analysis Control of Grain Size . . . . . .. 62
3.4.2 Thermal Analysis Control of Eutectic
Modification . . . . . . . . . . . . . . . . . . . . . . .. 64
3.4.3 Thermal Analysis Equipment . . . . . . . . . . . . .. 67
• TABLE OF CONTENTS IX
•
CHAPTER FOUR
THE HEAT PIPE PROBE 70
4.1 Introduction 70
4.2 Characteristics of the Probe 70
4.3 Probe Design 72
4.3.2 Materials Selection , 73
4.3.2.1 Working substance selection ., . . . . . .. 73
4.3.2.2 Inert gas selection 77
4.3.2.3 Container material selection 78
CHAPfER FIVE
EXPERIMENTAL 80
5.1 Introduction 80
5.2 Experimental Set-up 80
5.2.1 Probe Elements " 80
5.2.2 Sensors . . . . . . . . . . . . . . . . . . . . . . . . . .. 83
5.2.3 Peripheral Equipment 84
5.3 Experimental Procedure . . . . . . . . . . . . . . . . . . ., " 87
5.3.1 Cooling (Solidification) 88
5.3.2 Heating (Remelting) 88

•
•
TABLE Of CONTENTS X
CIlAPTER SIX
MODELLING HEAT TRANSFER . . . .. 90
6.1 Introduction 90
6.2 Heat Transfer Model of the Heat Pipe Probe . . . . . . . .. 91
6.2.1 Model Construction 91
6.2.1.1 Nodes . . . . . . . . . . . . . . . . . . . . . .. 91
6.2.1.2 Heat pipe types ... . . . . . . . . . . . . .. 94
6.2.1.3 Variables and equations . . . . . . . . . . .. 94
6.2.2 Input 95
6.2.3 Output 97
6.2.4 Evaluation of Model Results 97
6.3 Heat Transfer Model of Soîidification 102
6.3.1 Model Construction 102
6.3.2 Initial and Boundary Conditions " 104
6.3.3 Numerical Solution Techniques 105
6.3.4 Solution Procedure . . . . . . . . . . . . . . . . . .. 107
6.3.5 Examples . . . . . . . . . . . . . . . . . . . . . . . .. 108
CIlAPTER SEVEN
RESULTS AND DISCUSSION 119
7.1 Introduction 119
7.2 Typical Results 121
7.2 Parametric Results 135
7.2.1 Grain Refinement . . . . . . . . . . . . . . . . . . .. 136
7.2.2 Modification . . . . . . . . • . . . . . . . . . . . . .. 143
• TABLE OF CONTENTS
CHAPTER EIGIIT
xi
8.1 Concluding Remarks .
8.2 Claims to Originality .
8.3 Future Studies .
CONCLlTSIONS . . . . . . . . . . . . . . . . . . . . . . . . . . . . . . . 150
150
152
153
•
BmLlOGRAPHY
•
•
LIST OF FIGURES
CHAPTER TwO
Figure 2.1 Components and principle of operation of a conventional heat
pipe 8
Figure 2.2 A two-phase closed thennosyphon . . . . . . . . . . . . . . . . . .. 10
Figure 2.3 Concentric annular thennosyphon . . . . . . . . . . . . . . . . . .. 12
Figure 2.4 Schematic diagram and temperature distribution of a gas loaded
heat pipe 13
Figure 2.5 Schematic of a gas-loaded thermosyphon in three different
cooling rate modes 15
Figure 2.6 Comparison of actual and idealized flow in a thennosyphon ., 19
Figure 2.7 Pool boiling regimes 21
Figure 2.8 Film condensation on a vertical surface . . . . . . . . . . . . . . . 23
Figure ~.9 Sodium charged heat pipe dryout . . . . . . . . . . . . . . . . . .. 27
Figure 2.10 Comparison of sonic limits in Na, K, and.Cs heat pipes 29
Figure 2.11 Operating temperature ranges of various heat pipe fluids 31
Figure 2.U Liquid transfer factor at boiling point versus boiling point . .. 32
Figure 2.13 A lypical heat pipe used for deicing 36
Figure 2.14 The use of heat pipe to reduce die wall temperature
gradients 37
Figure 2.15 Two configurations of heat pipe and chill . . . . . . . . . . . .. 39

Figure 2.16 Cooling of electrodes with water cooling and heat pipe
cooling ,.................. 40
Figure 2.17 Measurement of steel temperature with a heat pipe-sheathed
thermocouple . . . . . . . . . . . . . . . . . . . . . . . . . . . . . . . . . . . 41
Figure 2.18 Thermosyphon injection lance vs. normal injection lance . . . . 42
• LIST OF FIGURES xiii
•
CHAPTES THREE
Figure 3.1 Aluminum rich part of aluminum-silicon phase diagram ..... 45
Figure 3.2 Surface energy relations affecting the wetting of heterogeneous
nuc1ei by the liquid metal . . . . . . . . . . . . . . . . . 47
Figu.\'l! 3.3 The interfacial energy interaction between nuc1eant and
nucleus 48
Figure 3.4 Aluminum rich part of the aluminum- titanium phase
diagram' " 50
Figure 3.5 Nucleation by the peritectic reaction in the AI-Ti system 51
Figure 3.6 Schematic representation of the growth of silicon 55
Figure 3.7 Microstructural rating system for modification of Al-Si alloys . 58
Figure 3.8 A typica1 cooling curve of an off-eutectic Al-Si alloy ..... " 61
Figure 3.9 Typica1 cooling curve and ils first derivative of a 356 alloy at
approximately 0.8°C/s " 62
Figure 3.10 The cooling curve at the beginning of solidification 63
Figure 3.11 A comparison of the eutectic regions of the cooling curves of
modified and unmodified alloys 65
Figure 3.12 Relationship between eutectic structure and eutectic
temperature, apparent eutectic supercooling and period of
supercooling .. . . . . . . . . . . . . . . . . . . . . . . . . . . . . . . . .. 66
Figure 3.13 Two typica1 sampling cups used for thermal analysis 68

CRAPTER FOUR
Figure 4.1 The basic appearance of the thermosyphon probe . . . . . . . .. 71
Figure 4.2 The cross section of the evaporator elements . . . . . . . . . . . . 79
• LIST OF FIGURES xiv
•
CHAPTES FM:Figure S.l Dimensions and materials of the laboratory scale thermosyphon
probe container 81
Figure S.2 The probe positioning inside the liquid metal bath . . . . . . . .. 84
Figure S.3 The experimental set-up . . . . . . . . . . . . . . . . . . . . . . . .. 85
Figure S.4 The data acquisition monitor during a routine test . . . . . . . .. 86
CHAPTES SIX
Figure 6.1 Vertical sections and allocation of nodes in the HEATPIPE model92
Figure 6.2 Cross section of a nodal ring in the HEATPIPE model . . . . .. 93
Figure 6.3 Main menu screen for HEATPIPE 1.0 98
Figure 6.4 Working substance screen for HEATPIPE 1.0 98
Figure 6.S Boundary condition screen for HEATPIPE 1.0 99
Figure 6.6 Configuration screen for HEATPIPE 1.0 99
Figure 6.7 Temperature profile screen for HEATPIPE 1.0 100
Figure 6.8 System parameter screen for HEATPIPE 1.0 " lOI
Figure 6.9 System limits screen for HEATPIPE 1.0 " lOI
Figure 6.10 Geometry and configuration of the sample " 102
Figure 6.11 Schematic of the computational domain " 104
Figure 6.12 A typical control volume for 2-D situation. . . . . . . . . . .. 105
Figure 6.13 The flow cbart of the solidification program . . . . . . . . . .. 108
Figure 6.14 Temperature distribution through the centre line for a slow
cooling case 110
Figure ~.15 The cooling curve of an AI-7% Si sample for a slow cooling
rate . . . . . . . . . . . . . . . . . . . . . . . . . . . . . . . . . . . . . . .. III
Figure 6.16 The cooling curve of an AI·7%Si sample for a fast cooling rate 112
Figure 6.17 Slow cooling solidification patterns at different times during
solidification . . . . . . . . . . . . . . . . . . . . . . . . . . . . . . . . .. 114
Figure 6.18 Fast cooling solidification patterns at different times during
solidification . . . . . . . . . . . . . . . . . . . . . . . . . . . . . . . . .. 114
Figure 6.19 A comparison of solidification rates for slow and fast cooling
rates . . . . . . . . . . . . . . . . . . . . . . . . . . . . . . . . . . . . . .. 118
• LIST OF FIGURES xv
•
CHAPTES SEYEN
Figure 7.1 The cooling curve obtained by the conventional method for pure
Al 121
Figure 7.2 The general view of the results for a pure AI test by the probe 122
Figure 7.3 The cooling curve obtained by the thermosyphon probe for pure
Al 124
Figure 7.4 Quasi-equilibrium solidification with the thermosyphon probe. 125
Figure 7.5 The cooling curve obtained by the conventional method for a
413 alloy 126
Figure 7.6 The cooling curve obtained by thermosyphon probe for a 413
alloy . . . . . . . . . . . . . . . . . . . . . . . . . . . . . . . . . . . . . " 127
Figure 7.7 The cooling and heating curves of 413 alloy 128
Figure 7.8 Effect of cooling rate on depression of eutectic temperature of
an Al-7% Si illoy " 129
Figure 7.9 The Meltlab screen for a 356 alloy obtained by the
thermosyphon probe in low cooling rates 132
Figure 7.10 The Meltlab screen for a 356 alloy obtained by the

•
•
LIST OF FIGURES xvi
thermosyphon probe in medium cooling rates . . . . . . . . . . . . .. 133
Figure 7.11 The Meltlab screen for a 356 aIloy obtained by the
thermosyphon probe in higher cooling rates . . . . . . . . . . . . . .. 134
Figure 7.12 Comparison of cooling curves of an unrefined and grain
refined 356 aIloy at the liquidus portion of solidification obtained by
the probe . . . . . . . . . . . . . . . . . . ., 136
Figure 7.13 Effect of Ti concentration on the liquidus portion of the
cooling curve for an Al 6%Si alloy . . . . . . . . . . . . . . . . . . .. 137
Figure 7.14 The microstructure of an unrefined Al-Si aIloy of Figure
7. 13(a) 140
Figure 7.15 The microstructure of a partially refined Al-Si alloy of Figure
7.13(b) 140
Figure 7.16 The microstructure of a partially refined Al-Si alloy of Figure
7.13(c) 141
Figure 7.17 The microstructure of the grain refined Al-Si alloy of Figure
7.13(d) 141
Figure 7.18 Effect of Ti concentration on the liquidus portion of the
cooling curve 142
Figure 7.19 The effect of modification on eutectic temperature of a 356
alloy . . . . . . . . . . . . . . . . . . . . . . . . . . . . . . . . . . . . . .. 143
Figure 7.20 Effect of Sr concentration on eutectic temperature of a 356
alloy . . . . . . . . . . . . . . . . . . . . . . . . . . . . . . . . . . . . . .. 144-
Figure 7.21 Effect of Sr content on eutectic temperature for 356 alloy .. 145
Figure 7.22 Effect of graduai increase of modifier agent (Sr) on eutectic
temperature of an Al-7%Si alloy . . . . . . . . . . . . . . . . . . . . .. 146
Figure 7.23 The microstructure of an unmodified Al-6%Si alloy . . . . .. 147
Figure 7.24 The microstructure of an Al-6%Si a110y modified by 40 ppm
•
•
LIST OF FIGURES xvii
Sr 147
Figure 7.25 The microstructure of an AI-7%Si alloy modified by 85 ppm
Sr 148
Figure 7.26 The microstructure of an Al-7%Si alloy modified by 130 ppm
Sr 148

•
•
LIST OF TABLES
CHAPTER nBEE
Table 3.1 Comparison of sorne mechanical properties of non-modified and
modified Al-Si casting a1loys o. 53
CHAPfER FouRTable 4.1 Constants in the pressure-temperature equation for saturated
vapor 75
Table 4.2 Selected properties of potassium and cesium as heat pipe
working fluids . . . . . . . . . . . . . . . " 76
CHAPrERSJX
Table 6.1 Variables employed in HEATPIPE model 94
Table 6.2 Equations employed in HEATPIPE model 96
Table 6.3 Results from experimental data and computed simulation 102
Table 6.4 Solidification and sample specifications used in the model . . .. 109
CHAJ'TER SEVEN
Table 7.1 Nominal chemical composition of the Al alloys tested . . . . .. 120
Table 7.2 Variations of cooling rate and eutectic temperature with inner
pressure for the curvc;s of Figure 7.8 . . . . . . . . . . . . . . . . . .. 130

•
•
LIST OF TABLES xix
Table 7.3 Summary of grain refinement results . . . . . . . . . . . . . . . .. 142
Tahie 7.4 Summary of eutectic modification results . . . . . . . . . . . . .. 149
•
a
A
~
Cc
Cp,l
cp,sas
CI,f .
D
l)(X)
e
f.
F
g
go
G
• li
LIST OF SYMBOLS
Fluid parameter for a given material. Governs relationship between
gas phase pressure and temperature at equilibrium.
Cross sectional area of the vapor space, m2.
Area exposed for heat transfer at probe tip=7t (r?-r/).
Cross-sectional area of fluid flow in pipe, m2.
Cross-sectional area available to reagent gas flOW=7trb2.
Fluid parameter for a given material. Governs relationship between
gas phase pressure and temperature at equilibrium.
Stefan-Boltzmann constant=5.669x 10⁻⁸ W/(m2_K4).
Molar density of gas/vapor mixture, kgmol/m3•
Specific heat of saturated liquid at constant pressure, Jlkg-K.
Heat capacity of reagent gas, J/kg-K.
Coefficient ofEq. 2.4, depends on surface liquid combination.37
Diameter, m.
Condensate thickness over a distance (direction) x, m.
Surface emissivity.
Solid fraction.
View factor for radiative heat transfer.
Gravitational acceleration=9.Slm/s2.
Proportionality constant= 1 kgmN-l.s-2.
Mass of working substance in pipe, kg.
Average condensation heat transfer coefficient over a distance

LIST OF SYMBOLS•hbollom
hrg
hgas
h,cxtl,
hi,ws
htip,ws
H
ka
k"kl
le.la
1.
1.~
~g,rr
Il
mm
M
M'
Il,
n
•
xxi
(direction) x, W/(m20C).
Heat transfer coefficient, environment with probe tip, W/(m20C).
Latent heat of vaporization of working substance, J/kg.
Heat transfer coefficient, reagent gas with inner pipe, W/(m20C).
Heat transfer coefficient, ith node, outer periphery of pipe with
ambient enviromnent, W/(m20C).
Heat transfer coefficient, ith node, heat pipe shen with working
substance, W/(m20C).
Heat transfer coefficient at probe tip, heat pipe shen with working
substance, W/(m20C).
Total enthalpy, J.
Boltzmann's constant= 1.38 X 10⁻²³, JIK.
Thermal conductivity of the protective coating, W1(mK).
Thermal conductivity of saturated liquid, W/(mK).
Thermal conductivity of the heat pipe shen, W/(mK).
Length of adiabatic section, m.
Length of active condenser, m.
Length of evaporator section, m.
Vertica1length of ith axial segment, m.
Length of blocked off region predicted by fiat front model =It-I.,m.
Total condenser length including blocked off region, m.
Mass flow rate, kg/s.
Mass of molecule.
Merit number for a heat pipe.
Ment number for a thermosyphon.
Viscosity of saturated liquid, kg/sm
Coefficient of Eq. 2.4, depends on surface liquid combination.37

LIST OF SYMBOLS• II;g
P
Pgas
Py
Prl
"q crit,b
q",
<Ii"
<Ii,b
lhipR
rb
rc
ri
fi,e
r· f1,
ri,g
PI
Pr
Py
(J
t
tet.T
T.mb,i
Tb,••
xxii
Moles of inert gas contained in the pipe.
System pressure, Pa.
Pressure in reagent gas line, Pa.
Vapor pressure, Pa.
Prandtl number of saturated liquid, tJ.Cp/k.
Critical heat flux of boiling("boiling limita), W1m2•
Heat flux in nucleate pool boiling regime, W1m2•
Energy transfer from environment to working substance,ith node, W.
Energy expelled from working substance to reagent gas,ith node, W.
Energy transfer from environment to working fluid, probe tip, W.
Gas constant=8.314 Nm/(molK).
Inner radius of inner pipe; m.
Outer radius of inner pipe, m.
Internal radius of heat pipe outer shell, m.
Inner radius of outer pipe, ith nodal ring, m.
Outer radius of outer pipe, ith nodal ring, m.
Outer radius of protective refractory, ith nodal ring, m.
Liquid density, kg/m3•
Density of ~gent gas, kg/m3•
Vapor density, kg/m3•
Surface tension, N/m.
Time, s.
Thickness of coating at probe tip,m.
Thickness of pipe shell at probe tip,m.
Temperature, K.
Temperature of external environment, ith node, K.
Temperature of pipe bottom, exposed coating surface, K.

LIsT OF SYMBOLS•
•
Tcnv,tip
Ti ,&
Ti-l,.
T' b"Ti.:
T· f"
T.ol
T.Tw
Tws
u(y)
Vg
Vig
xxiii
Temperature of pipe bottom, inner edge of protective coating, K.
Temperature of pipe bottom, inner edge in contact with working
substance, K.
Temperature of ambient environment, probe tip,K.
Bulk temperature of reagent gas, ith node, K.
Bulk temperature of reagent gas, node i-l (node above ith node), K.
Temperature of inner wall of inner pipe, ith node, K.
Temperature of outer wall of inner pipe, ith node, K.
Temperature of inner wall of outer pipe, ith node, K.
Temperature of inner wall of protective coating 1outer wall of outer
pipe, ith node, K.
Temperature of outer wall of protective coating, ith nodfi, K.
Temperature of reagent gas, K.
Liquidus temperature, K.
Solidus temperature (Eq. 6.21), K.
Saturated vapor temperature, K.
Wall temperature, K.
Temperature of working substance, K.
Velocity profile in the condensate film, mIs.
Velocity of reagent gas, mIs.
Volume consumed by inert gas plug, m3•

•
•
CHAPTER1
INTRODUCTION
1.1 Scope of the Present Study
The heat pipe is an innovative engineering structure characterized by its
high capacity to transfer thennal energy through relatively small cross-sectional
areas over minimal temperature gradients. A heat pipe contains no moving parts
and requires no external power or mass input during operation. More importantly,
the heat transfer rate is also controllable. A heat pipe is basica11y a closed chamber
with a material inside called the working substance (or fluid). Its ability to transfer
energy is based on the large latent heat of vaporization and condensation of the
working fluid. Heat is absorbed over the evaporator, vaporizing sorne of the
working fluid. The vapour travels to the condenser portion and condenses by
giving off the latent heat of condensation. This fluid is then returned to the
evaporator and the cycle continues. In agas loaded heat pipe the presence of an
inert gas leads to the control of the rate of heat absorption from the evaporator.
The principle of the heat pipe was conceived in 1942,1 and since then, heat
pipes in various fonns and designs have found a wide variety of applications. For
metallurgical applications, one can only find a few papers dealing with heat pipes,
mostly on the use of heat pipes in the cooling of casting molds(see 2.7).
• CHAPTER ONE 2
•
At present, one of the newest methods for quality control of Iiquid
aluminum alloys is "the thermal analysis technique". Conventional thermal analysis
techniques graphically monitor the temperature changes in a sample as it cools
through a phase transformation interval giving the so called "cooling curve". The
proper chemical analysis of a melt is a necessary but not a sufficient parameter to
produce quality castings since it does not indicate the size, shape, proportion, or
distribution of the phase features that affect the mechanical and physical properties
of a multiphase alloy. Analysis of the temperature-time cooling curve allows the
metailurgist to monitor the progress ofcertain metailurgical phase transformations.
More specifically, thermal analysis can provide an evaluation of the potential
nucleation and modification state of the melt prior to casting. Thermal analysis can
thus estimate the potential of the melt to solidify with a specifie microstructure.
The microstructure developed during solidification depends not only on the
nucleation potential and modification potential of the melt, but also on the thermal
gradient imposed during solidification. The characteristic cooling curve parameters
are correlated with the proper state of nucleation and modification in the melt
required to produce the desired microstructure in a specifie casting section size.2
Thermal analysis is carried out by pouring a relatively smallliquid sample
of the melt into a sampling cup. The liquid metal is then allowed to solidify with
a thermocouple fixed in the centre of the cup and connected to a data acquisition
system. The physical and thermal characteristics of the sampling cup in any one
given test determine the effective cooling rate.
Upon completion of successful design and manufacture of a self cooled heat
pipe injection lance3 and significant contributions to the understanding of the
conventional thermal analysis of aluminum silicon casting alloys4.s.6.7 at McGiII
University, the novel idea of thermal analysis of aluminum alloys using a heat pipe
• INTRODUCTION 3
•
probe was initiated. It was realized that since solidification by nature is a heat
removal process from a liquid sample, a heat pipe might be used to force
solidification. The idea was to develop a heat pipe probe to permanently reside in
the liquid metal bath and to solidify a small volume of liquid (button shaped
sample) in a large ladle of molten metal. The gas loaded feature of the heat pipe
probe enables the system to:
i) Reverse the freezing process and remelt the solidified sample after
completion of a thermal analysis test. This allows the thermal
analysis technique to be semi-continuous.
ii) Impose a desired cooling rate on the freezing sample.
Consequently, a wide range of cooling rates from extremely low to
those typical of cooling rates in die casting can be obtained with the
same set-up and for the same batch of liquid metal.
iii) Computerize and automate the entire quality control process.
Since no sample is manually taken and the desired cooling rate is
adjusted by the inner pressure, no sampling cup is needed and the
cooling rate may be set automatically.
This research work contains two distinct aspects: 1) heat transfer (solidification
and melting) with a heat pipe, and 2) thermal analysis of aluminum-silicon alloys.
The objective of the present research work was to develop a probe usable in liquid
aluminum alloys to perform improved thermal analysis and to compare the results
of the new method with those of the conventional thermal analysis technique,
emphasizing grain refinement and eutectic modification treatments. The new
technique to be elaborated upon in this thesis is, semi-continuous, applicable to a
wide range of solidification rates, computerized and automated. These features are
not found in the conventional thermal analysis technique.
After developing and proving the viability of the heat pipe probe for the

• CHAPTERONE 4
•
thennal analysis of aluminum foundry alloys, a research effort is now underway
on development of the next generation of the probe (intelligent heat pipe probe) at
McGill University through a strategie grant. The next generation will be focused
on further quantification of the metallurgical aspects of cooling rates, grain
refinement, and eutectic modification that were investigated semi-quantitatively in
the present work.
1.2 Overview of the Present Work
As mentioned earlier, heat transfer by a heat pipe and thennal analysis of
aluminum silicon alloys are two distinct aspects that are combined in the present
work. This thesis elaborates on the connection between these two distinct
principles. This work details the author's experimental and computational efforts
to develop the new thennal analysis method for aluminum silicon alloys by a heat
pipe based probe.
Chapter Two reviews briefly the literature on heat pipes. The history,
operating principles, various types, brief theory, and applications of the heat pipe
are discussed. Emphasis is placed on the type of heat pipe used in this work Le.
the gas loaded annular two phase thermosyphon.
In Chapter Three, the metallurgical background of the work, including
liquid metal treatrnents such as grain refinement and eutectic modification is
discussed. The chapter ends with a review of the conventional thennal analysis
technique and equipment that is currently used.
Chapter Four describes the steps that were undertaken in the developrnent
of the heat pipe probe. It elaborates on the probe design including the critical step
of materials selection and also specifies the characteristics of the probe.
Chapter Five details the experimental part of the work. The set-up of the

• INTRODUCTION 5
•
components and the expt:rimental procedure for the new method of thermal
analysis by the heat pipe probe is explained.
Chapter Six deals with modelling of the heat transfer. It contains two
computational models; one is a software package called HEATPIPE 1.0 used to
perform rapid, easy simulation of the heat pipe probe. This model was initially
developed to simulate the heat pipe injection lance, but it is adapted to the heat
pipe probe by applying the proper boundary conditions. The other mathematical
model simulates general solidification behaviour of the freezing sample during a
thermal analysis test by the probe. Good agreement is found between the computed
and experimental results. Aiso, sorne parameters which are difficult to obtain in
practice such as solidification rate (temperature/distance) are evaluated. For the
sake of brevity, a limited number of results from the mathematical model are
presented in Chapter Six.
Chapter Seven details the results obtained by the new method and discusses
them. This chapter is divided into two parts. The first part illustrates typical results
regarding a general view of the cooling curves obtained by the probe. Comparisons
are made between the cooling curves of the conventional and the new mt;thods.
Features of the new method in terms of cooling rate adjustments, are shown in this
section. The next part includes results from sorne parametric studies and features
a discussion on the grain refinement and modification of one of the most
commOlùY used aluminum silicon alloys (356). The results presented in this
chapter are basically semi-quantitative.
The thesis cornes to an end with a set of conclusions summarizing the
results of the work. Finally, concluding remarks, claims to originality, and
suggestions for future work are the basic elements of Chapter Eight.

•
•
·c.•·..•••• RAP'fE..•..•....• >( ···R. ' .. _. ' "
..~.
~
HEATPIPE
2.1 Introduction
The worldwide emphasis on energy conservation with regard to exhaustible
energy sources such as gas and oïl has 100 scientists to focus on the development
of new methods and devices with higher efficiencies, less waste of consumable
materials and lower maintenance costs.
The heat pipe is such a device that meets these criteria. The heat pipe is an
innovative engineering device with a capacity to transfer large quantities of heat
from one point to another. In a heat pipe, thermal energy is absorbed at one end
and is dissipated at the other. Its ability to transfer heat is basOO on the large latent
heat of vaporization and condensation of the material sealOO inside: the so called
"working substance". In a heat pipe, the working substance lasts indefinitely and
no extemal inputs are needOO for the operation of the device.
A heat pipe can transfer heat at high rates over considerable distances with
ooly a relatively small temperature gradient. More importantly, especially with
regard to this research work, the rate of heat transfer can he well-controlled.
Additionally, the heat pipe is simple in structure, relatively inexpensive, contains
no moving parts and is reliable in its operation.

• HEATPlPE 7
•
2.2 History
In 1944 R. Gaug1er, an automotive engineerB, patented a heat transfer
device to he used in refrigeration systems.9 It was not until 1963 that Graver et
al. 10 ofLas Alamos Scientific Laboratory independently invented the idea and built
prototypes. He also named the device a "Heat Pipe". Grover used water as the
working substance in bis first heat pipe prototype for ambient temperature regimes
and shortly thereafter, he expanded the application to bigh temperatures by using
sodium at 11OOK,92.
The idea of a gas-Ioaded heat pipe was first explored by Hall of ReA in a
patent application :ln 1964. Nevertheless, although the effect ofa non-condensable
gas was shown in Grover' s original publication, its significance for acbieving
variable conductance was not immediately recognized. In the subsequent years, the
theory and techno10gy of gas-Ioaded variable conductance heat pipes was greatly
advanced, MOSt notably by Bienert and Brennan at Dynathermll and Marcus at
TRWI2•
Aside from the advances realized from the various heat pipe applications,
basic research and development have also continued. Analytical techniques and
computer programs have been developed to predict performance and design
parameters for Many applications13 •
In terms of the literature, the first Heat Pipe Design Handbook was
published in 1972. Since then several international heat pipe conferences have been
conducted, and numerous papers and books on heat pipes have been published.93
Our latest patent search in January 1994 shows about five thousands patents
worldwide on different heat pipe applications. Research and deve10pment on heat
pipes for different applications is increasing rapidly. As a result, revo1utionary
advances on new heat pipe applications are anticipated.

• CHAPTER. Two 8
2.3 Operating Principles
The heat pipe is a thennal device for transporting heat from one location to
another over a relatively small temperature gradient. 10.14 It is typically an evacuated
closed tube or chamber, varying in shape and size9 (Fig. 2.1). In its simplest fonn,
a heat pipe consists of a container, a material inside commonly called the working
substance and, possibly a capillary wick structure.
Hest output
t t t t
Uquid f10w \lapor f10w'Mck
Heat input
++++
Container
~~ tL ,...~ __ ~:"":,+section section section
Fig. 2.1 Components and principle of operation of a conventional heat pipe.
•
Heat is supplied at one section, called the evaporator or hot section, thereby
vaporizing the internal working substance. Due to a pressure gradient established
within the chamber, the vapor travels to another part of the pipe called the
condenser or cold section, where it is condensed on the walls thus releasing the
absorbed latent heat of vaporization. This energy transport is accomplished by
means ofliquid vaporization in the evaporator, vapor flow in the core region and
vapor condensation in the condenser. The condensate, then, returns to the
evaporatorl4• The condensate return mechanism depends on the type of heat pipe.
In a wicked heat pipe, capillary action is employed to pump the condensate back
to the evaporator. In a wick1ess heat pipe, usually called a thennosyphon,

• HEAT PIPE 9
•
gravitational force is used and a wick structure is not necessarily needed. The
cycle of evaporation and condensation will continue if the flow passage for the
fluid is not blocked.10 Sometimes an intermediate adiabatic (no heat transfer)
section lies between the heat source (evaporator) and sink (condenser). This
adiabatic region is created by externally insulating the appropriate section of the
heat pipe.
Since there is ooly a very small pressure drop over the length of the pipe
(order of 1% or less1S), the evaporation-condensation cycle is essentially an
isothermal process where the temperature may be considered equal to the saturated
vapor temperature corresponding to the vapor pressure of the working substance.
However, according to the second law of thermodynamics, no heat pipe can ever
be considered to be perfectly isothermal18•
The tremendous heat transfer ability of a heat pipe is due to the large
quantity of energy absorbed and released by the phase change. The amount of
thermal energy that can be transported as latent heat of vaporization is usually
several orders of magnitude greater than that which may be transported as sensible
heat in either convective cooling or conductive cooling. For a given cross-sectional
area, a heat pipe cao transport fifty to a thousand times more heat than a copper
conducting bar. For this reason a heat pipe is sometimes called a "super
conductor" 8,14,17,18,19 of heat.
Heat pipes cao be used at many different temperatures. When heat transfer
is a dominant problem heat pipes are often amenable to the task. The proper
selection of the working substance material for a given application is an important
consideration.
2.4 Beat Pipe Types
To date, many different types of heat pipes have emerged. Heat pipes may
• CHAPTER Two 10
he classified by various means. The more common aspects are:
.Working temperature range: High, moderate, low (sub-zero and
cryogenic) temperatures.
• Method used to transport the working substance from the condenser to the
evaporator: Capillary force is used in the standard wicked heat pipe and
~
~r ~
"r ~
~
~r .."r ~
~
~~ ..~r
..
~k)-~- - -- - -
1- - -
....-
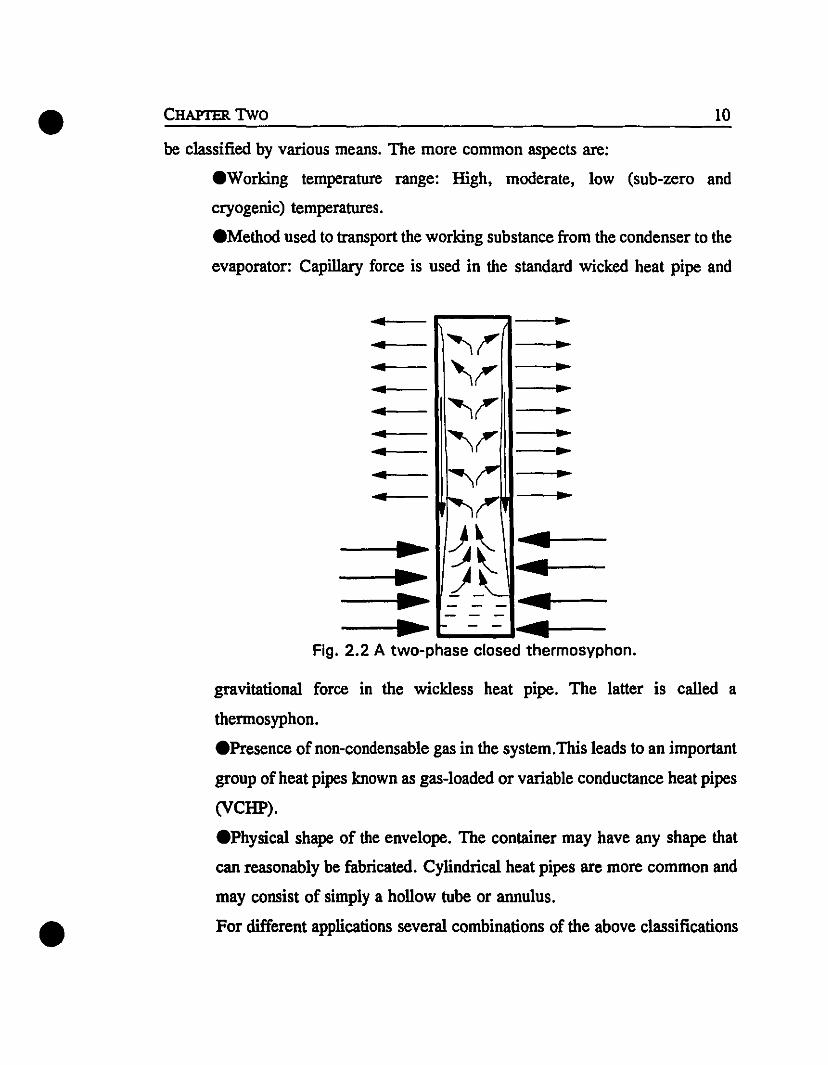
..---. ..-Fig. 2.2 A two-phase closed thermosyphon.
..
..
•
gravitational force in the wickless heat pipe. The latter is called a
thermosyphon.
• Presence of non-condensable gas in the system.This leads to an important
group of heat pipes known as gas-Ioaded or variable conductance heat pipes
(VCHP).
• Physical shape of the envelope. The container may have any shape that
can reasonably be fabricated. Cylindrical heat pipes are more common and
may consist of simply a hollow tube or annulus.
For different applications severa! combinations of the above classifications

• BEAT PIPE 11
•
may he employed.
For the sake of brevity, the topic of concentration for the balance of this
volume will be that particular kind of heat pipe utilized in this research work,
unless otherwise stated.
2.4.1 Thermosyphon: "... A thermosyphon is a prescribed
circulating fluid system driven by thermal buoyancy forces. This
definition inclut/es ail basic studies to which the name thermosypJwn
has been applied in the literatur~9 . . . ".
The two-phase thermosyphon is essentially a gravity- assisted heat pipe. The
wick structure is not compulsory. Since it uses gravity to return condensate to the
evaporator, it requires the heat source to be located below the heat sink, Le., the
evaporator must be below the condenser. Fig. 2.2 shows a typical thermosyphon
schematically. In fact, a thermosyphon uses gravitational forces, thermal buoyancy
(either locally or in a general sense) forces and vapor pressure forces to transport
the liquid phase of the working fluid. 19•2O The generated vapor in the evaporator
moves up the pipe to regions of lower pressure. In the condenser, the vapor is
condensed to a liquid, lowering the density and pressure. The condensate, then,
returns to the evaporator via gravity. Since the condensate return is in the body
force direction, the system is restricted to the upward heat transfer direction and
therefore, acts as a thermal rectifier1•( ... thermal diode22).
Comparing the maximum heat flux in a standard (wicked) heat pipe versus
thermosyphon, it has been shown that in a thermosyphon, the critica! heat fluxes
are about 1.2-1.5 times larger than for the equivalent wicked heat pipe12.
Additionally, the thermosyphon is simpler in construction, has wider operating
limits and the fabrication cost is lower23 than in the case of a wicked heat pipe.
One type of heat pipe is the " concentric annular thermosyphon" which is,

• CHAPTER Two 12
•
schematically depicted in Fig. 2.3. This kind is constructed from Iwo pipes of
different diameters. One pipe is placed inside the other and then sealed at the ends
by end caps to create an annular vapor space. The advantage of this type over the
conventional thermosyphon is the increased area for heat transfer into and out of
the pipe without any increase in the outside pipe diameter, Le., the heat transport
per unit length in an annular thermosyphon will be more than is the case for a
conventional design. AIso, the cor:centric design will be as easy to manufacture as
Fig. 2.3 Concentric annular thermosyphon.
a standard one, requiring no expensive tooling or other special treatment2".
2.4.2 Gas-Loaded Thermosyphon In many applications, adequate thermal control
of the thermosyphon is essential. The operating state of a conventional
thermosyphon is, in fact, governed by heat source and sink conditions14, e.g., with
an increase in heat load the operating temperature of the thermosyphon rises.
Likewise, a drop in heat load will result in decreased operating temperature. In
practice, it is often desirable to maintain the thermosyphon within a set temp
erature range. AIternatively, as in this research work, it is desirable to control the

rate of heat absorption and dissipation into and from the thennosyphon with a
constant heat source temperature. There are severa! methods to produce such beha
vior. One of the most important consists of loading a portion of the condenser with
a non-condensable (inert) gas.
A gas-Ioaded thennosyphon also known as a two-component heat pipe14
• BEAT PIPE
1 Evaporator 1 Adive condenser
......
13
1Gas-blocked condenser
..
•
AxIal positionFig. 2.4 Schematic diagram and temperature distribution of agas loaded heatpipe. 99
(thennosyphon) involves a non-condensable gas and a gas reservoir attached to the
conventional thennosyphon shen. When a non-condensable gas is present in such
a system, it moves with the vapor* toward the condenser. Since the gas does not
condense, it concentrates at the condenser end fonning a agas plug"2S. The
presence of this gas plug in a portion of the condenser prevents the vapor from
*) 'The tenn vapor is used ta denole the gaseous phase of working substance for the balance of Ibisvolume.

condensing in that section and acts as a diffusion barrier to the flowing vapor. In
fact, the gas plug tends to ·shut-off" the portion of the condenser which it fills,
leading to an axial temperature gradient along the thermosyphon as shown
schematically in Fig. 2.4. By varying the length of the gas plug, one varies the
active condenser area and, therefore, the heat rejection of the system. The non
condensable gas section allows the operator to have control over the operating
pressure and temperature of the pipe.
Regarding the controllability of a gas-loaded thermosyphon, two types may
be considered;
i) Fixed quantity of inert gas inside the pipe with variable source
temperatures.
li) Variable quantity (pressure) of inert gas with a fixed heat source
temperature.
The former is more popular and has been widely studied whereas no
publications were found concerning the latter type. The latter type is investigated
in this research work and will be discussed in some detail.
The fixed mass of gas introduced into the system occupies a certain portion
of the condenser. The size of this portion depends on the operating temperature of
the pipe's active region and the environmental conditions. If the heat source
temperature increases, the working substance vapor pressure increases, resulting
in the compression of the· non-condensable gas into a smaller volume, thus
providing a greater active condenser area. On the other hand, once the heat source
temperature decreases, the vapor pressure of the working substance decreases and
the gas inventory expands to a greater volume, thus blocking a longer portion of
the condenser area. This reduces the temperature response of the active zone to
extemal conditions.94,9S
In the case of a fixed temperature hot medium with a variable mass of non-
•
•
CHAPTER Two 14

condensable gas, a given quantity of gas will produce sorne defined set of
equilibrium conditions, i.e., a certain length of inactive condenser. Adding more
gas into lite system enhrges the shut-off length of the condenser and reduces the
area available to heat transfer in the thermosyphon thus raising the working
substance temperature. Removing gas from the system, reduces the blocked part
of the condenser, increases the area available to heat tI'l'..nsfer and, as a result,
• HEATPlPE 15
T Il: Inerl gas 1(Q
Z -:>~ .l:
" Gravily en~(..
c
"'QC y8 Vaporflow
'1(''Ir'" Uquld film
l("'y"
J l fi..
Jt •.J_"- • etlnetln qln
~(a) (b) (c)
Fig. 2.5 Schemalic of agas loaded thennosyphon in three different cooling rate modes;
a) AJmost no heal transfer correspondlng to remelllng perlod,
b) Law heat transfar rate corresponding to Iow rate of cooOng,
c) H1gh heat transfer nale corresponding 10 h1gh nale of cooOng,16,80
•reduces the working substance temperature. Fig. 2.5 illustrates a gas-Ioaded
thermosyphon in three different heat transfer modes. Note that the bounding
conditions for the three modes are identical. In mode (a), the pressure of the gas
• CHAPTER Two 16
•
is gre&ter than the equilibrium vapor pressure of the working substance 'lt the
evaporator temperature. Thus, the gas plug fills the whole available condenser
length (volume) and there is no room for condensation. This statement is valid if
diffusion of the working substance vapor phase in the inert gas phase is relatively
smal1. Generally, this is a valid assumption and it implies a very limited rate of
vaporization and condensation of the working substance with the inherent result of
minimal heat transfer between the evaporator and the condenser. Consequently,
this mode can be seen as a "turned-off" mode. In case (b), the pressure of the gas
is smal1er than the equilibrium vapor pressure of the working substance at the
same temperature. Here, the condenser is divided into a hot (active) zone and a
cold (inactive) zone and sorne heat transfer by vaporization and condensation
occurs (two-component thermosyphon). In mode (c), a larger amount of absorption
and dissipation into and from the system exists (conventional thermosyphon).
2.5 Beat Pipe Theory
Heat pipe theory encompasses the fundamental laws of thermodynamics,
heat transfer, fluid dynamics and materials science. Despite its simple appearance,
a theoretical analysis of the heat pipe cycle involves the complex, multidimensional
conjugate effects of transport phenomena, interfacial phenomena and
thermodynamics. Generally, the circulation process in a heat pipe is weIl described
by hydrodynamic theory. The most important function of the working fluid
circulation is to establish heat transfer within the heat pipe. Therefore, the
maximum heat transfer capability of a heat pipe arises from the maximum possible
circulation!8. On the other hand, the circulation process is affected by sorne
interfacial phenomena inside the pipe such as surface tension, wettability,
capillarity and the liquid/vapor shear force. Furthermore, the internaI heat
transport process within a heat pipe is a cycle subject to the first and second laws

of thennodynamics.
Several Ph.D. level research studies have been conducted on the
investigation of tubular thennosyphons. 26,27,28,29,30 A detailed theory of heat pipe
operation is beyond the scope of this experimental effort. However, to successfully
design and use a heat pipe in a given application, a general knowledge of heat pipe
theory is essential. Hereafter, in this volume, a macroscopic approach to the
thennosyphon cycle and the dominant factors affecting it will be utilized.
2.5.1 Thermodynamics: From the thennodynamics point of view, a
thennosyphon involving liquid/vapor phase transition can only operate between the
triple point" and critical point""" of the working substance. These two bounding
points are rarely approached in practice, but represent the theoretical limits of
operating temperature.
Il ...The fact that thermodynamic equilibriwn exists at
the liquid/vapor interface is central to the
understanding of the thermodynamic state of the
worldng fluid in the heat pipe . . . wU
Therefore, the phase equilibrium conditions must be satisfied at the liquid
Ivapor interface. Using the Clausius-Clapeyron equation, it can be shown that:
• HEAT PIPE
hp=c exp(-~
17
2.1
•
In the above equation, a constant latent heat of vaporization and ideal gas
behavior have been assumed.
At temperature Tl' a certain amount of heat is applied to the system and
at temperature T2 <Tl the same amount is rejected. In titis system "work" is
**) Triplo point-Tho cœdition wbo!e saUd, liquid and gasoous phases cooxist in oquilibrium•
***) CritiCli point- Tho cœditiODS (T,P) al wbich tbe vapor ancIliquid arc indistingWshablo61.

• CHAPTER Two 18
internally generated and then totally consumed. The energy conversion arising
from the phase change occurs across the liquid/vapor interface where sorne thermal
energy is converted to mechaJùcal energy with the appearance of the pressure
head18.
In the general case, regarding the first law of thermodynamics, the
difference between the aJOount of heat input (in the evaporator zone, QJ and the
heat output (from the condenser zone, QJ is the work that is produced:
2.2
The thermal efficiency of the thermodynamic cycle ofany heat pipe can be defined
as:
2.3
•
Regarding the thermal efficiency, heat pipes can be classified into three
groups as follows:
i) llT > 0, heat pipes employed basically for converting thermal energy into
other kinds of energy.
ü) llT = 0, classical heat pipe as a heat transfer device.
ili) llT < 0, active control heat pipe31.
2.5.2 F1uid Flow: Flow in a thermosyphon is a rather complex process.
During normal operation, there is a continuous flow of working substance from
the evaporator to the condenser in vapor state and from the condenser to the
evaporator in liquid state. The vapor rises along the central core of the pipe
whereas downward liquid movement occurs along the pipe surface to the liquid

pool. Fig. 2.6 illustrates the actual and ideal flow in a thennosyphon
schematically. Also, there is continuous interchange of mass between the liquid
and vapor phases in the evaporator (liquid to vapor) and condenser (vapor to
liquid) sections. In the evaporator, the heat input causes a net flux of working
substance molecules to move from the liquid pool surface and possibly from the
wetted surface of the evaporator.
• HEAT PIPE
....""
- 1\( c-on
1 1
,jl
j L
fttn-
) \ r-b
1pool .E-
Z
f-I
!
19
•
(a) (b)
Fig. 2.6 Comparison of actual and idealized flow in a thermosyphon;(a) actual, (b) ideal.
The velocity of the bulk vapor flow is detennined by the rate of heat flow into the
evaporator plus the total pressure of the chamber. On the other hand, in the
condenser, a lower temperature causes subcooling of vapor and a net flux of
molecules enters the liquid surface. Similarly, the velocity of the bulk liquid flow
is detennined by the localized rates of condensation. Consequently, the liquid film
thickness is not unifonn, not smooth, and may be covered by a complex system
of waves32•
The addition of mass to the downward liquid stream increases the
momentum flow rate (mass flow rate times velocity) thus causing a pressure drop.
• CHAPTER Two 20
•
Finally, a liquid pressure gradient occurs along the flow of condensed liquid
flowing back from the condenser to the evaporator. Removal of the mass from a
flow stream reduces the momentum flow rate, causing a pressure rise that leads
to a bulk pressure gradient through the vapor flow passage. In a thermosyphon,
an additional pressure drop by gravity also exists. Also, d pressure drop in both
liquid and vapor phases is produced due to frictional resistance at the liquid/vapor
interface. Since vapor flow velocity is normally much higher than liquid stream
velocity, pressure changes resulting from variations in the momentum flow rate are
generally significant for the vapor stream. Additionally, in terms of body force
action on the flow streams, pressure change is ooly significant in the liquid flow
stream because of the liquid's much greater density. The liquid friction pressure
drop is added to the pressure change due to gravity in order to obtain the total
liquid pressure rise.96,97
2.5.3 Beat Transfer: Transmission of heat is the dominant principle in any
thermosyphon application. Reat can enter and leave the pipe by several different
heat transfer mechanisms such as conduction into and out of the pipe,
environmental convection, boiling (vaporization) and condensation and/or
radiation. An electrical analogy of the equivalent thermal resistance, R, can be
stated with the associated heat flows and temperature drops, ÔTI4.
Reat transfer mechanisms inside a thermosyphon are govemed by the
following processes:
.Evaporation in the heat source zone.
• Condensation in the sink zone.
• Vaporlliquid interfacial heat and mass transfer in the transport zone.
• Some thermosyphon parameters such as heat flow rate, nature and state of
working substance, and system geometry affect these parameters and, thus, the
performance of the thermosyphon.

• HEAT PiPE 21
In the most general case, investigation of thermosyphon operation may be
classified into two groups22.42:
i) Investigation of heat transfer mechanisms inside the pipe such as
evaporation, condensation and convection heat transfer coefficients.
ü) Investigation of heat transfer limits characterized by a decrease in
total heat transfer due to a blockage of the fluid flow.
If the maximum heat transfer capacity has not been exceeded, the heat transfer
mechanisms are nucleate boiling in the evaporator and film condensation in the
condenser.
Heat transfer in the evaporator originates from standard "boiling heat
transfer" described in heat transfer texts. Consider a heating surface (with surface
E
A log âT=T...T.Fig. 2.7 Pool boiling regimes;
q=heat input, Tw=surface temperature. Ts=pool temperature.
...j
•temperature Tw) immersed in a liquid pool whose temperature (T~ is kept at the
boiling point corresponding to the pressure of the system. The different regimes
ofboiling for such a system are shown in Fig. 2.7. In the region A-B, convection
is responsible for the movement of fluid to the evaporating surface. By increasing
the input flux, bubbles hegin to form at the surface. As the temperature difference
increases, bubbles form more rapidly and rise to the surface of the liquid. The heat
transfer rate is intensified (region B-C). This region shows nucleate or pool
boiling. In the pool boiling regime, high heat transfer rates are associated with
small values of the excess temperature. The heat flux in pool boiling cannot be
increased indefinitely. At point C, bubbles are formed so quickly that they blanket
the heating surface and it hecomes difficult for the liquid to reach the hot surface.
A vapor film forms. Heat transfer from the surface to the liquid occurs by
conduction through the vapor. The temperature difference increases rapidly and
this condition is known as the bumout boiling crisis, or critical heat flux. The
region C-D is called partial film boiling in which boiling is unstable, Le.. the
surface is altemately covered by vapor and liquid. In region D-E the vapor film
is stable34.
Boiling heat transfer is characterized by several distinct parameters
associated with bubble initiation, formation and growth. The process is not as
thorough1y understood as other heat transfer mechanisms3S. Boiling heal transfer
is described in more detail in other heat transfer texts,3S,36,37
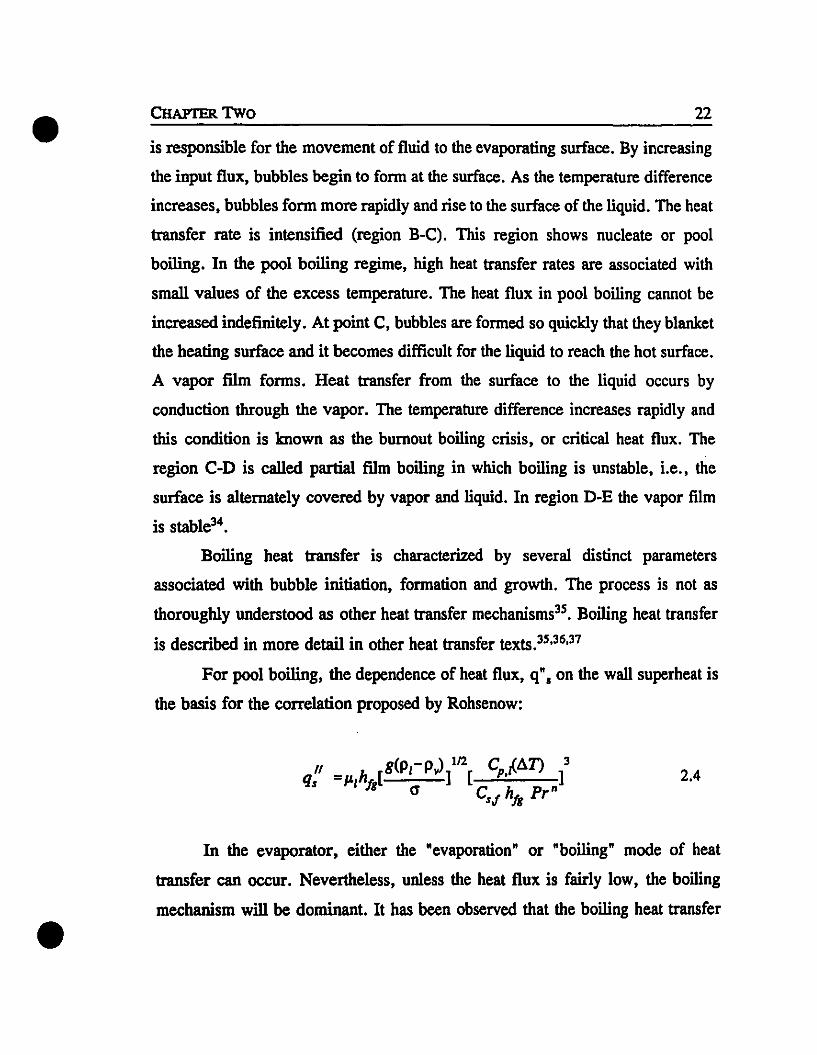
For pool boiling, the dependence of heat flux, q". on the wall superheat is
the basis for the correlation proposed by Rohsenow:
• CHAPTER Two 22
2.4
•In the evaporator, either the "evaporation" or "boiling" mode of heat
transfer can occur. Nevertheless, unless the heat flux is fairly low, the boiling
mechanism will he dominant. It has been observed that the boiling heat transfer

• HEAT PIPE 23
regime in thermosyphons is generally pool boiling. Therefore, Rohsenow's pool
boiling correlation appears to be satisfactocy38.
Heat transfer in the l;~ndenser98 of a thermosyphon is approximated by
Nusselt's laminar, nonrippling film condensation model. The condensation process
on a vertical wall is depicted in Fig 2.8.
Bird et al39 provide a fitting explanation for condensation of pure vapors on
..
•m{x)
. ~.dm _ imnlnlnl q •
dq=hfg+dm . _liii!iiWii!i-..........t!J
J. .m+dm
Vapor movement
Fig. 2.8 Film condensation on a vertical surface.
•a vertical solid surface: (p. 415)
w...Vapor flows over the condensing surface and is moved
toward it by the small pressure gradient near the liquid

• CHAPTER Two 24
•
surface. Note that there occur small abrupt changes in
pressure and temperature at the interface. These dis
continuities are essential to the condensation process but are
generally ofnegligible importance in engineering calculations
for pure fluids, Some of the mo/ecules from the vapor phase
strike the liquid surface and bounce off; others penetrate the
surface and give off their latent heat of condensation. The
heat thus released must then flow through the condensate to
the wall, At the same time the condensate must drain from
the surface by gravity flow, . . ",
Despite the complexities associated with film condensation, sorne useful
correlations can be derived by making assumptions that originate from the Nusselt
analysis:
i) Constant Iiquid properties.
ii) Laminar downward flow of condensate.
iii)The '/apor temperature at the edge of the film is equal to the saturation
temperature of the vapor with no temperature gradient in the vapor,
iv) Negligible shear stress between the vapor and the film.
v) Linear temperature distribution between the wall and the vapor
conditions,
Regarding the Nusselt theory, the average value of the heat transfer
coefficient, h, over a distance x is given by:
and the condensate thickness:

• HEAT PIPE 25
An improved analysis of film condensation is presented by Rohsenow6• He
recommended using a modified latent heat of vaporization as:
in equation 2.6. In this case, allliquid properties should be evaluated at the film
temperature Tr=(Ts+Tw)/2 and hrg should be evaluated at Ts.
The total condensation rate may be derived from the equation:
2.8
and the velocity profile in the film is calculated as:
2.9
•
Although Nusselt's film condensation model was initially developed for a
vertical plate, the above expressions may be used for condensation on the inner or
outer surface of a vertical tube ofradius R, if R»li.3S•36,37,39
In terms of heat (and mass) transfer in a thermosyphon, consider a liquid
surface in a liquid/vapor system. If the liquid is in equilibrium with the vapor at
the interface, the flux of molecules leaving the surface will be equal to the flux of
molecules returning to the liquid and there will be no 1055 or gain of mass. If the
surface gains mass by condensation, the vapor pressure and temperature must be
higher than the equilibrium values. In the vaporization mode, similarly, the vapor

• CHAPTER Two 26
pressure and substance temperature are less than the equilibrium values.
The average velocity of vapour, Va., is given by kinetic theory as:34
8k T 112V =(_8_)
av nm2.10
In the regular cycle of a thermosyphon, there is net mass transfer from the
liquid phase to the vapour phase in the evaporator and from the vapour phase to
the liquid phase in the condenser. Therefore, a true state of equilibrium does not
exist. However, the departure from equilibrium is generally small. If the
interchange of molecules between the phases exists, the phase from which the
molecules are lost must be hotter. Therefore, a temperature gradient develops.
An interface heat transfer coefficient, hi' characterlzes the heat transfer
process along the interface between phases:
2.11
•
Where ~Ti is the temperature difference across the interface and 'li is the interface
heat flux.
In a thermosyphon assuming the "critical heat transport capacity" is not
exceeded, the condensation heat transfer coefficient is generally much smaller than
those associated with the other mechanisms. Therefore, the heat transport
resistance is dominated by the condensation process.40,41,42
Thermosyphon limitations: For a given working substance (fluid) and
thermosyphon design, a temperature range exists over which the thermosyphon
will be functional. This operating temperature range is dictated by several heat
transport limits. AlI of the limits for successful operation of a thermosyphon are
associated in one way or another with the interruption of mass circulation43• Based
on experimentaI studies, it is well established that performance limits of a
thermosyphon depend on the heat addition to the evaporator (radial evaporator
• BEAT PIPE 27
Vaportemperature
Wall -/temperature
e 0 e
•
heat flux, axial heat flux), geometry of the thermosyphon, liquid filling and fluid
characteristics. Heat pipe (and thermosyphon) limits have been studied
extensively.15,18,32,43,44,45,46,47,48,49
In a thermosyphon, operating limits are described in the literature as the
dry-out limit, burnout or critical heat flux limit, flooding or entrainment limir2 and
the sonic limit. A continuous circulation of working fluid is required for the proper
functioning ofa thermosyphon. When the liquid charge (pool height) is insufficient
and/or when a given heat flux to the evaporator causes the liquid to evaporate
faster than it can he supplied by gravity, the evaporator becomes dry43 (dry-out
limit). Once the evaporator reservoir dries-out, its surface is no longer subjected
to the high cooling rate provided by a wetted surface. As a result, the wall
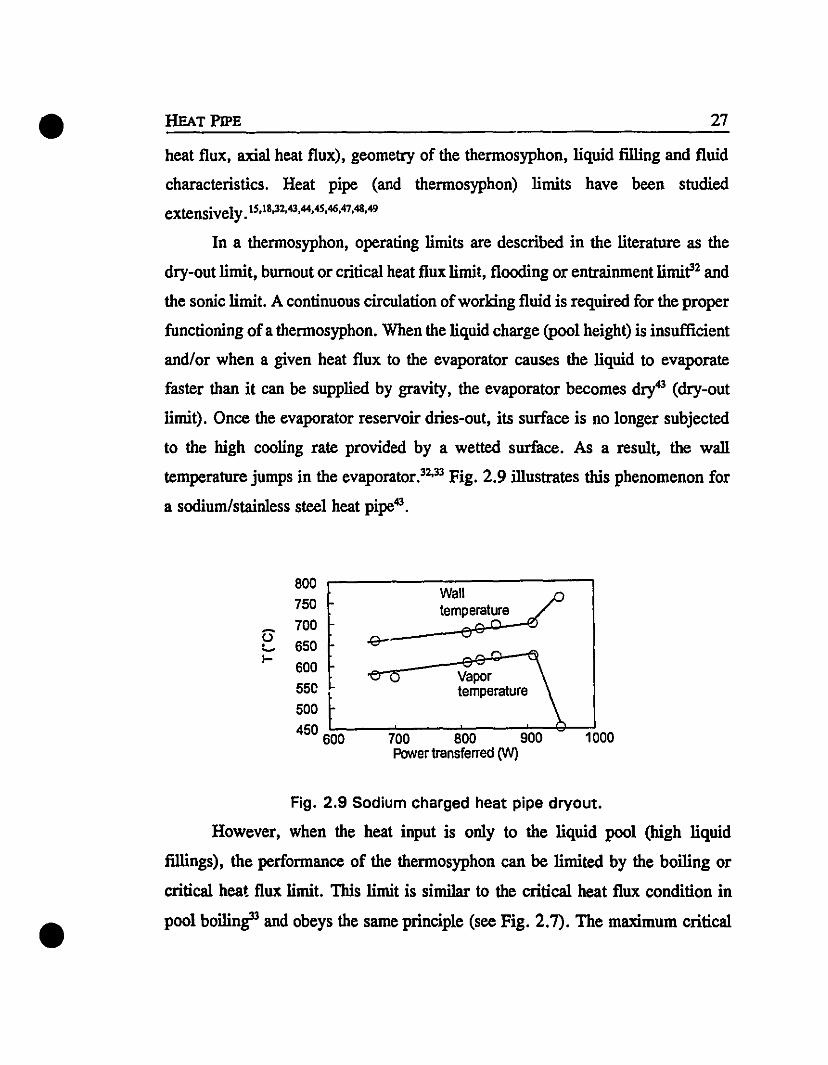
temperature jumps in the evaporator.32,33 Fig. 2.9 illustrates this phenomenon for
a sodium/stainless steel heat pipe43.
SOO750
~ 700e. 6501- 600
550500
450 6L...00:----:7"="00:---..,S:':0-:'0---::90:-::0..,.-.(,~7.1000Power transferred fY'l)
Fig. 2.9 Sodium charged heat pipe dryout.
However, when the heat input is only to the liquid pool (high liquid
fillings), the performance of the thermosyphon can he limited by the boiling or
critical heat flux limit. This limit is similar to the critical heat flux condition in
pool boiling33 and obeys the saroe principle (see Fig. 2.7). The maximum critical
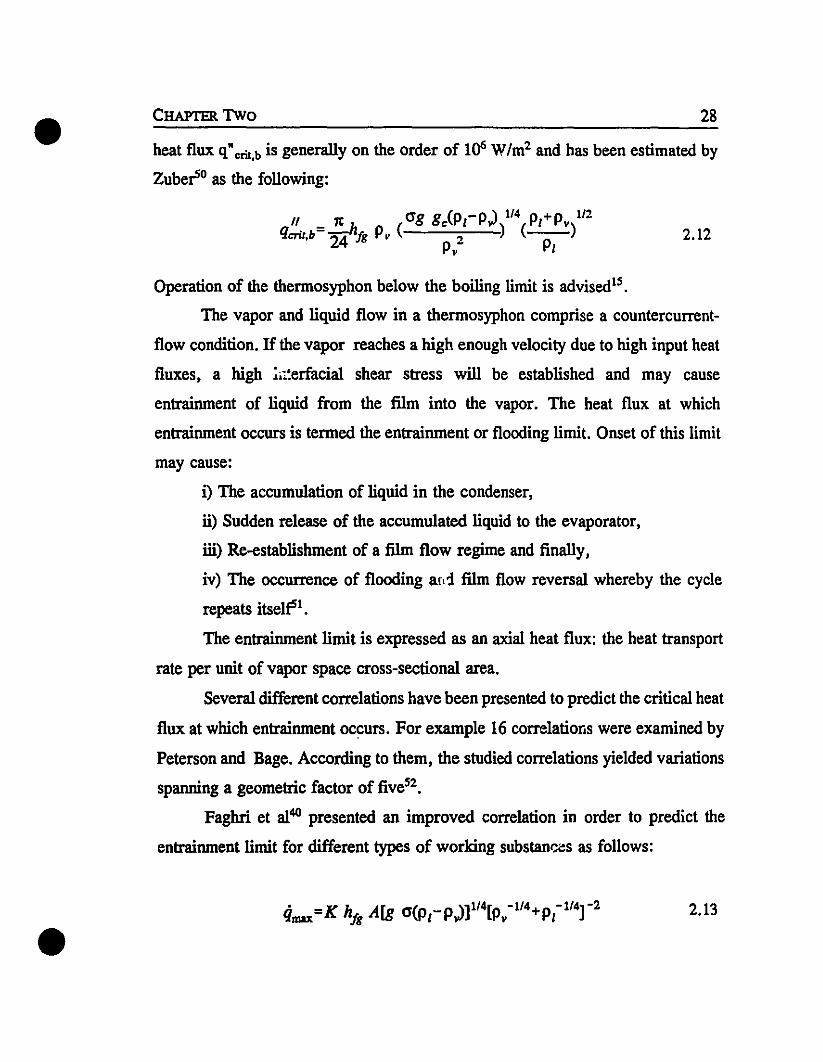
heat flux q"cril,b is generally on the order of 1()6 W/m2 and has been estimated by
Zubero as the following:• CHAPTER Two 28
2.12
Operation of the thermosyphon below the boiling limit is advisedls .
The vapor and liquid flow in a thermosyphon comprise a countercurrent
flow condition. If the vapor reaches a high enough velocity due to high input heat
fluxes, a high ~ii.~erfacial shear stress will be established and may cause
entrainment of liquid from the film into the vapor. The heat flux at which
entrainment occurs is termed the entrainment or flooding limit. Onset of this limit
may cause:
i) The accumulation of liquid in the condenser,
ii) Sudden release of the accumulated liquid to the evaporator,
iii) Re-establishment of a film flow regime and finally,
iv) The occurrence of flooding atd film flow reversal whereby the cycle
repeats itselpl.
The entrainment limit is expressed as an axial heat flux: the heat transport
rate per unit of vapor space cross-sectional area.
Several different correlations have been presented to predict the critical heat
flux at which entrainment occurs. For example 16 correlations were examined by
Peterson and Bage. According to them, the studied correlations yielded variations
spanning a geometric factor of fiveS2•
Faghri et al40 presented an improved correlation in order to predict the
entrainment limit for different types of working substanœs as follows:
•2.13

• HEAT PIPE
where
and
P 0.14K=(-I) tanh2Bo1/4
Pv
29
2.14
2.15
In a thermosyphon with a constant diameter for vapor flow, the process of
vapor addition in the evaporator and vapor removal in the condenser causes the
vapor stream to first accelerate and then decelerate as it moves upward. Therefore,
the velocity variation results from a variable mass flow through a constant area.
At an extremely high heat input rate, the vapor velocity leaving the evaporator
may be extremely high. When the vapor velocity becomes sonic at the evaporator
exit, the "sonic limit" is encountered. Any further heat load added to the system
Fig. 2.10 Comparlson of sonie Iimits in Na, K, and Cs heat pipes.•
,.. 3.0E~~"" 2.5x:>~ 2.0
~~ 1.5~
S~ 1.0
~~ 0.5ï=:5 ft ,
400 500 600MAXIMUM EVAPORATOR TEMP. (Ocl
Experimental
- - - - - Calculated

• CHAPTER Two 30
does not increase the mass flow of vapor but causes an increases in the working
substance temperature in the evaporator and, finaUy, a high axial temperature
gradient is established in the thermosyphon. Fig 2.10 displays the sonic limit effect
for different (liquid metal) fluids. 43
The simplest correlation for the sonic limit is given as34•49
q" =0 474h (p .p\ll2s· :tg.'" 2.16
•
It has been observed that the heat transfer limits in closed two-phase
thermosyphons depend on many factors such as the rate of heat input to the
evaporator, working fluid material, liquid inventory, and operating pressure
(temperature) of the fluid. 32 Among aU the limits, the effective heat transport limit
in a heat pipe is the one with the smaUest magnitude. In a tw<:>-phase closed
thermosyphon, it is generally believed that the entrainment limit is dominant over
the other limits.32,33,40
2.6 Design Considerations
The first step in thermosyphon design is to identify the temperature range of the
heat source to which the evaporator is exposed. From titis, a proper working
substance and shell may he selected. By judicious selection of materials, it is
possible to build heat pipes for use at temperatures ranging from 4K to about
23ooK.34 In titis sense, the vapor pressure corresponding to the operating
temperature is a factor that has to be accounted for. A desirable vapor pressure
generally lies in the range between 6900 and 690000 N/m2 CO.07 to 7 atm.).ls
2.6.1Working Substance: Working substance selection is the first and the most
important step in designing a thermosyphon (heat pipe). It determines the
thermosyphon' s operating temperature range. Fig. 2.11 shows different heat pipe

• HEAT PIPE 31
fluids with their respective operating temperature ranges. These ranges correspond
to a pressure range of 6900 to 690000 N/m2 C 0.07 to 7 atm.). Once the operating
temperature range is identified, the working substance may he selected.
1200
T 1000am ·800pa
600rat 400ur 200a
(C) 0
-200
Soclum Potaulumi--
,.--
Callum
Mercury
Naphtlllane
.Water.i:
•
Fig. 2.11 Operating temperature ranges of various heat pipe fluids.
Usually, within the approximate temperature range band, several possible working
substance materials may exist. In order to pick the most acceptable material, sorne
other criteria have to he considered such as:
i) Compatibility with the container material,
il) Thermal stability.
iii) Wettability,
iv) Vapor pressure in the operating temperature range,
v) Law melting point in the case that the working fluid is in the sond state
at ambient temperature,
vi) High thermal conductivity,
vii) High latent heat of vaporization,

• CHAPTER Two 32
viii) High liquid and vapor densitiess3,
ix) High surface tension,
x) Low liquid and vapor viscosities.
The effects of the last four factors are gathel'ed together as a 'liquid
Li
Cs
H20
10la
12la
11la
13 r--------{f------...---,la
...o
.oJUco.....oJ...oI:l.alC
~.oJ
'0....6-....o-'l
-N
e......~
a 100 200 300 400 1000 1200 1400 1600
Boiling point (K)Fig. 2.12 Liquid transfer factor at boiling point versus boiling point.
transport factor,ls or 'Merit number'34. In a heat pipe, the ioerit number for a
given working substance is defined as:
2.17
•Fig. 2.12 illustrates the value of a material' s liquid transport factor versus
its boiling point for a variety of working substance materials. IS In a thermosyphon,
the thermal conductivity of the liquid working substance has a more pronounced
• HEATPlPE
effect than surface tension. Thus, the merit number may be defined as34:
3 2..1/4M' = (hlg k/ Po
J.L/
33
2.18
Additionally, the ideal fluid should be not easily contaminated in storage,
readily available and inexpensiveS3 • The quantity of working substance inventory
greatly affects the normal behavior of a thermosyphon. The amount must be
enough to wet all internai surfaces during normal cycling. However, an excessive
quantity is also not desirable. The fluid inventory in a thermosyphon has been
extensively studied.21,23,32,33,34,4O,48 Il has been observed that a quantity which is
too small may result in the dry-out limit6 and leads to a reduction in the maximum
heat flux of the system21 • For liquid fillings which are too large, it has been found
that the liquid is carried up to the cooled section and subcooled there.
Consequently, periodic burst boiling occurs, which causes vibration of the
thermosyphon accompanied by a bursting noise12 and in the Most severe case,
steady-state operation may not be possible because of the entrainment of the liquid
film by the vapor core33 • Bezrodnyi and Alekseenko recommended that the liquid
fill should be at least 50 per cent of the volume of the evaporator4• Also,
according to Streltsov analysis, the following equation yields the optimum fluid
inventory for a thermosyphon.S2
2.19
•2.6.2 The Container: The thermosyphon container isolates the working
substance from the outside environment. Therefore, to maintain the pressure seal
and working substance purity, no leaks should exist. Selection of the container
• CHAPTER Two 34
•
material is based on severa! factors. A major factor is the compatibility of th~
envelope with both the working fluid and the external environment. Caution must
be observed, particularly in high temperature thermosyphons since corrosion at
high temperature can be especially problematic. Other factors affecting the
container material selection are as follows:
• Temperature characteristics,
.Thermal conductivity,
• Ease of fabrication (weldability, machinability, ductility ... ),
• Strength to weight ratio,
• Porosity,
.Wettability,
.Cost.
The material should be non-porous to prevent the diffusion of gas inlo the
pipe34. Good wettability insures avoiding hot spots on the thermosyphon's wall, a
phenomenon that can cause failure in normal cycling.
It is highly recommended that the container be extremely clean and free of
any contamination such as oil or oxide layer. This is due to the fact that when the
evaporated working fluid condenses, the condensate is highly purified and hence
has maximum capacity to dissolve low-solubility solids and gases. As the
condensate flows down to the ev~porator, it may dissolve a small quantity of
impurities from the wall before reaching the evaporator. In the evaporator, the
solute (impurities) will remain and concentrate there. This can detract from the
normal performance of the thermosyphon.15
Severa! cleaning procedures have been proposed. Generally, cleaning
procedures include the following stages;
• Degreasing
• Solid particle removal

• HEAT PIPE 35
•
• Deoxidizing
• Degassing
A sarnple cleaning for stainless steel parts is as follows:
1. Clean in 1,1,1, -trichloroethane
2. Rinse with cold trichloroethane and force dry with filtered air
3. Immerse in passivating solution-sodium dichromate (7.5- 30 Kg/m3) ant
nitric acid (15-30% by volume) at room temperature for 30 minutes to 2
hours
4. Two minutes tap wRter rinse
5. Thoroughly dry with forced filtered air
6. Rinse with isopropyl alcohol
7. Force dry with clean, filtered, dry nitrogen heated to 70°C
2.7 Beat Pipe Applications
The heat pipe has been used in a large variety ofapplications. Theoretica11y,
the heat pipe may he applied to an almost limitless number of thermal transport
problems, i.e., the heat pipe application range covers almost the complete
spectrum of temperatures encountered in heat transfer processes. With regard to
the working fluid, liquid helium (with au eful temperature range between -271 to
-269°C) and lithium (with a useful range between 1000 to 1800°C)17 represent the
two bounding limits of the operating temperature range for heat pipe applications
(Fig. 2.11).
As for typical applications, cryogenic heat pipes have been used for cooling
infrared sensors, arnplifiers and laser systems and in medicine for cryogenie eye
and tumour surgery. Moderate temperature heat pipes have been applied to cool
electronie elements. They have been used to cool shafts, turbine blades,

• CHAPTER Two 36
•
generators, motors and transformers. In heat recovery systems, they are employed
to collect heat from exhaust gases, solar energy and geothermal energy. In
spacecraft, moderate temperature heat pipes have served to control the vehicle's
temperature instruments and space suits. Finally, liquid metal heat pipes have been
widely applied for cooling nuclear and isotope reactors and for heat recovery in
gasification plants. 10 An interesting example of heat pipe application is road
deicing, extensively used in Japan18•
Concrete Surface
1%" Caver
Fig. 2.13 A typical heat pipe used for deicing.
In such a sy,tem, heat is transferred from underground regions, where
temperatures are still above the freezing point, to the grcund level. This deices
critical sections of highways, bridges, and airport runways. Fig 2.13 depicts a
cross section of a heat pipe used for road deicing1o•
Applications of heat pipes in metaBurgy-Among the thousands of different
applications of heat pipes in various engineering fields, only a limited number have
been found in the metaliurgical engineering field. In die casting and injection
moulding processes, heat pipes have been used in two manners. First, heat pipes

• HEAT PIPE 37
may he inserted into the main body of a die to equalize the temperature field in the
die. For example, a die used to produce a cylindrical shaped component may have
a significant temperature gradient along its length. Using a heat pipe in the mold
could minimize the temperature gradient as shown in Fig 2.14.
Hea~es
r x
\'\. Wattr;, ·····,:c ln
d2\......
I~ J,,....·::c Wattr.......
aut", ,
\ \1
ca\ting LxDie
Water
Die
~&:;~/""-Heat pipes
/Casting
View on XX
•
Fig. 2.14 Thil use of heat pipe to reduce die wall temperature gradients.
In the other case, a heat pipe is used in conjunction with a water cooling system.34
Kunes et alS4 employed sodium heat pipes in combination with a c1assical
passive chill in different steel casting sand mold systems to form an active dynamic
chill. Their main goal was to check the applicability of the heat pipe in foundry
technology, especiaIly during solidification and cooling of large steel castings.
Forced air flow and water were applied to the condenser in order to control the
heat flux removed by the heat pipe. They observed that the active chill provided
a substantiaIly higher and more controllable cooling effect on the various steel sand
mold castings.

BahadoriSS proposed a simple one dimensional analytic approach to
solidillcation in a cylindrical mold peripherally inserted with severnl stabilizing
gas-Ioaded heat pipes. In such a system, liquid metal heat pipes (sodium or
potassium) and argon or helium could be used as working fluids and inert gases.
The latent heat of fusion of the liquid metal casting provides heat input to the heat
pipe. By changing the inert gas temperature stored in the reservoir, the occupied
volume of inert gas may he modified. This, in tum, affects the effective condenser
area and the heat transported by the heat pipe may he controlled. Bahadori used
bis model for 81uminum, cast iron and tin. He concluded that different solid
ification rates may be maintained for various sections of a casting by proper design
and operation of a heat pipe.
ZuzanaJcS6 developed a smple numerical model to examine the effect of heat
pipes on casting solidification and defined fundamental parameters to control the
solidification process during the extraction of the latent heat of fusion. He
simulated steel casting solidification at constant temperature (freezing point) in a
sand mold by using a sodium heat pipe attached to the chill. Zuzanak ran the
simulator in a sand mold with chill both with and without the heat pipe. He
concluded that during solidification, a heat pipe in contact with the chill in the
mold yields the same effect as cooling the chill by forced convection. Fig. 2.15
shows the physical model of Zuzanak's work.
Wells et 8144 81so developed a computer program to study the effect of a
heat pipe on the temperature distribution throughout a solidifying alloy. Their two
dimensional numerical model was run for a 6040 lead-tin alloy by using a heat
pipe to influence the solidification process by controlling the rates of heat transfer
from the casting. They found that a heat pipe can effectively influence the
temperature gradients, solidification rates, and the shape of the solid-liquid
interface during solidification. These effects agreed favourably with experimental
•
•
CHAPTER. Two 38

• BEAT PIPE
Casting
Ica
Casting
Ica
Adiabatic wall
Chili
Ich
Chili(ch
Heatpipe
39
hco
•
h ; taFig. 2.15 Two configurations of heat pipe and chili.
results.
Bullerschen and WilhelmiS7 suggested a gravity-assisted heat pipe replace
the water circulating system used in cooling of arc furnace electrodes. Generally
in VHP furnaces cooling of graphite electrodes are essential in order to reduce the
electrode consumption. Traditionally water cooling shanks are employed for
cooling purposes. These present the danger ofvapor explosions in case of rupture.
Heat pipes are highly efficient two phase conductors which could provide a safer
alternative to water cooling shanks, since they contain only a small amount of
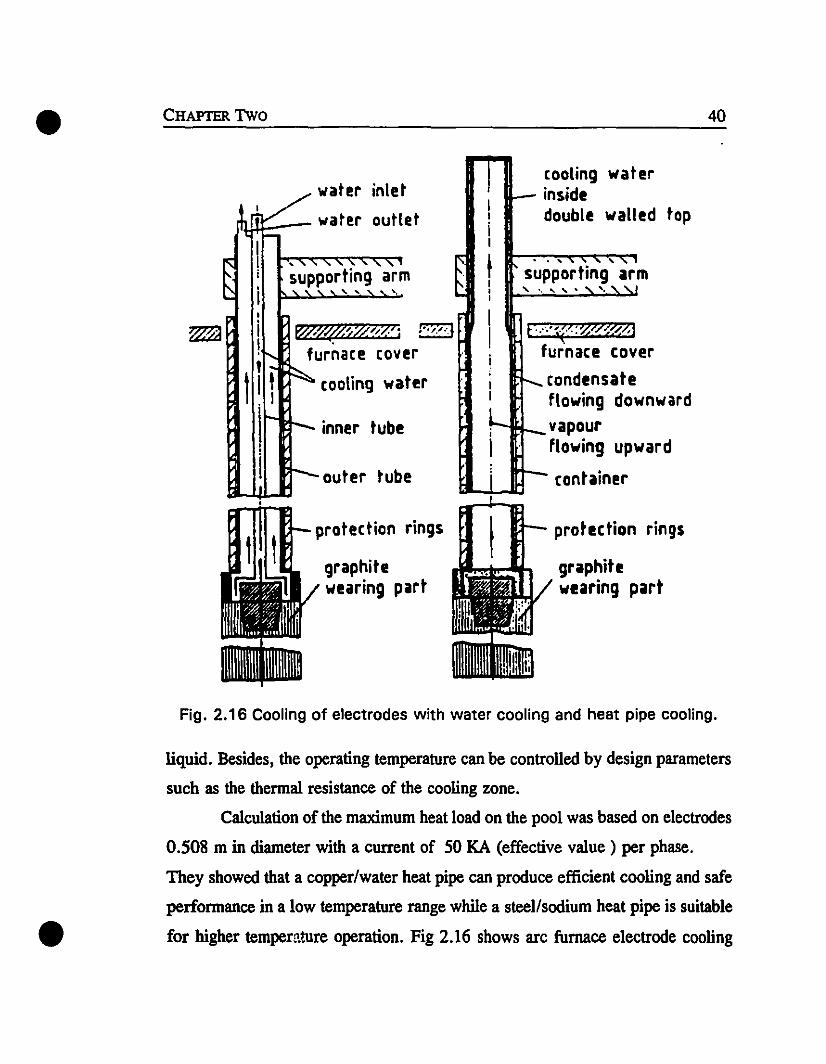
• CHAPTER Two 40
cooting waterinsidedouble walled top
t·····~,t~:ZW1%'j
furnace covercondensatef10wing downwardvapourflowing upward
container
- . ... "supporting arm, " ... '" '.
~111
e
er
ter
m
water inld
et~~~ W'ater out!-t
( , , , , '- ~ , " , ,i supportmg ar
b i '" ~" "... .... "'.1
i WW4?~~*?';1....... furnace cov
t'l, ~ cooling wa~ 1
I~ - inner tube•11 j-- outer tub
protection rings
graphitewearing part
protection rings
graphitewearing part
Fig. 2.16 Cooling of electrodes with water cooling and heat pipe cooling.
•
liquid. Besides, the operating temperature can be controlled by design parameters
such as the thermal resistance of the cooling zone.
Calculation of the maximum heat load on the pool was based on electrodes
0.508 m in diameter with a current of 50 KA (effective value) per phase.
They showed that a copper/water heat pipe can produce efficient cooling and safe
performance in a low temperature range while a steel/sodium heat pipe is suitable
for higher tempemture operation. Fig 2.16 shows arc furnace electrode cooling

• HEAT PIPE 41
with forced convection water cooling and with a heat pipe.
ChoisB innovated a technique for continuous temperature measurement of
Thermocouple wite
g11111111 131
Oeta acquisition
•
TundlshFig. 2.17 Measurement of steel temperature with a heat pipe-sheathedthermocouple.
liquid steel by means of a stainless steel sodium thermosyphon. The molten steel
temperatlJr.~, especially during the continuous casting operation, greatly affects the
quality of the final product. However, conventional thermocouples employed to
measure the temperature generally do not tolerate the severe corrosion around the
slag line. In bis proposed technique, a thermosyphon protects the thermocouple
wire from the harsh, corrosive region. The thermosyphon provides a colder
surface and solidifies and maintains a thin layer of slag on the thermosyphon, thus
producing a protective solid barrier against chemical attack from the slag. Fig.
2.17 illustrates the fundamentals of the technique.
Botos9 investigated a new thermosyphon lance for use with the Mitsubisbi
Process for copper production. In this process the liquid copper matte (CUzS) is
converted to blister copper by top air blowing. The conventionallance used for
blowing incurs the following problems:
• The harsh combination of bigh temperatures and chemical attack
causes continuous dissolution (consumption) of the lance tip during
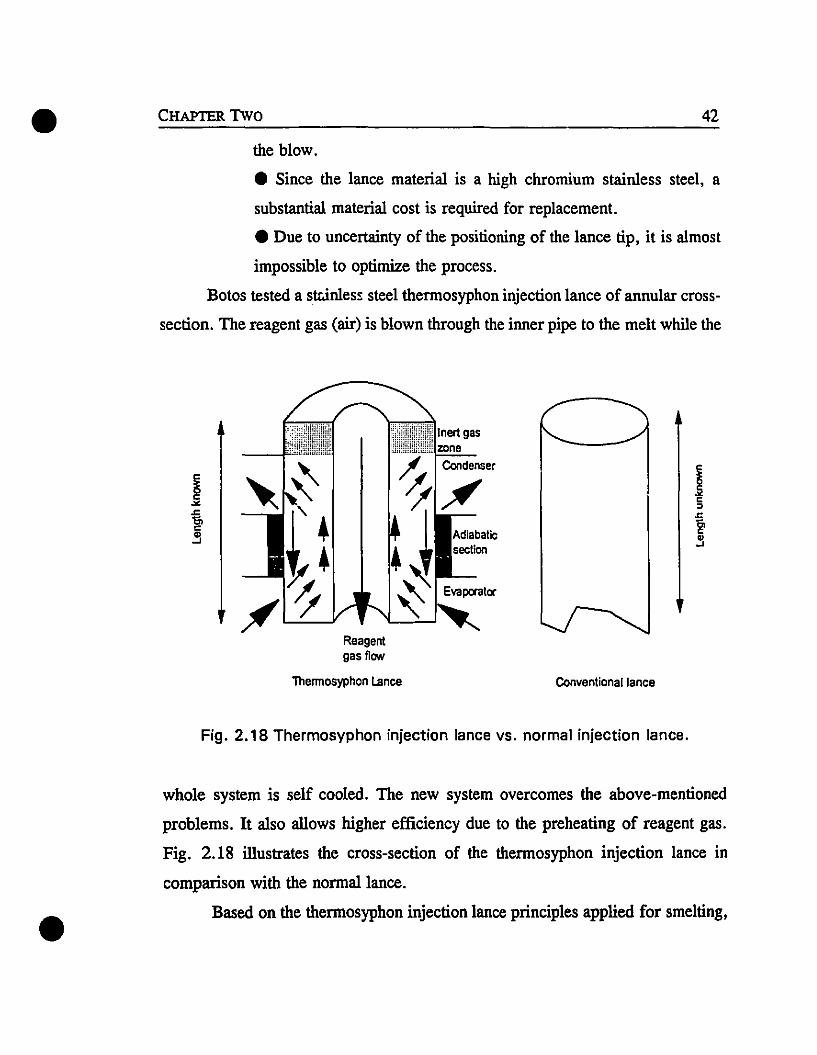
• CHAPTER TWo 42
the blow.
• Since the lance material is a high chromium stainless steel, a
substantial material cost is required for replacement.
• Due to uncertainty of the positioning of the lance tip, it is almost
impossible to optimize the process.
Botos tested a stcinless steel thermosyphon injection lance of annular cross
section. The reagent gas (air) is blown through the inner pipe to the melt while the
Reagen!gas flow
Thermosyphon lance Convenlionallance
•
Fig. 2.18 Thermosyphon injection lance vs. normal injection lance.
whole system is self cooled. The new system overcomes the above-mentioned
problems. It also a110ws higher efficiency due to the preheating of reagent gas.
Fig. 2.18 illustrates the cross-section of the thermosyphon injection lance in
comparison with the normal lance.
Based on the thermosyphon injection lance principles applied for smelting,

• BEAT PIPE 43
•
Mucciardi et alS9 designed and tested a thermosyphon exygen top blowing injection
lance for BOF steelmaking. The lance was used in laboratory-scale steelmaking
and it was observed that it could be operated without any cooling circuit. Heat
fluxes of about 1 MW/m2 at the lance tip were readily dissipated at typical
industrial rates of decarburization and oxygen utilization.
KayS2 developed a user-friendly PC-based computer model to facilitate the
design and analysis of gas-Ioaded thermosyphon injection lances. His model
employed a simple flat-front model for computation of the relevant quantities.
These quantities include temperatures, heat flows, system pressures, condenser
length and inert gas inventory.
In order to confirm the assumptions, Kay conducted a low-temperature
bench-top experiment. He concluded that the assumptions of a flat-front interface
may be used in the case when the density of the working substance vapor exceeds
that of the inert gas. AIso, experimental and computational results compared
favourably with data collected in high temperature injection lances as well as this
work (see 6.2).
•
•
CHAPTER3
METALLURGICAL ASPECTS
3.1 Introduction
Hypoeutectic aluminum-silicon casting alloys are used in many applications
because of their excellent c'lStability, good corrosion resistance, machinability,
weldability and low density. Generally, they can be produced by all major casting
processes such as:
• Sand mold ca:ting ( lower cooling rates; aùoul I°C/s),
• Permanent mold casting (medium cooling rates; about 3°C/s),
• Die casting (high cooling rates; about lOOC/s).
Certain melt treatments are often necessary in order to improve the quality
of the final product. Common treatments inc1ude 6rain refinement, modification,
and degliSsing.60
According to the Al-Si equilibrium phase diagram (Fig. 3.1), solidification
of a hypoeutectic alloy (Si < 12%) occurs by the formatiol' of a mushy zone at the
beginning of cooling, then proceeding to eutectic solidification at a constant
temperature. In this chapter the grain refinement and the modification treatments
of aluminum-silicon hypoeutectic alloys as weIl as the thermal analysis method of
controlling these treatments will be briefly reviewed.
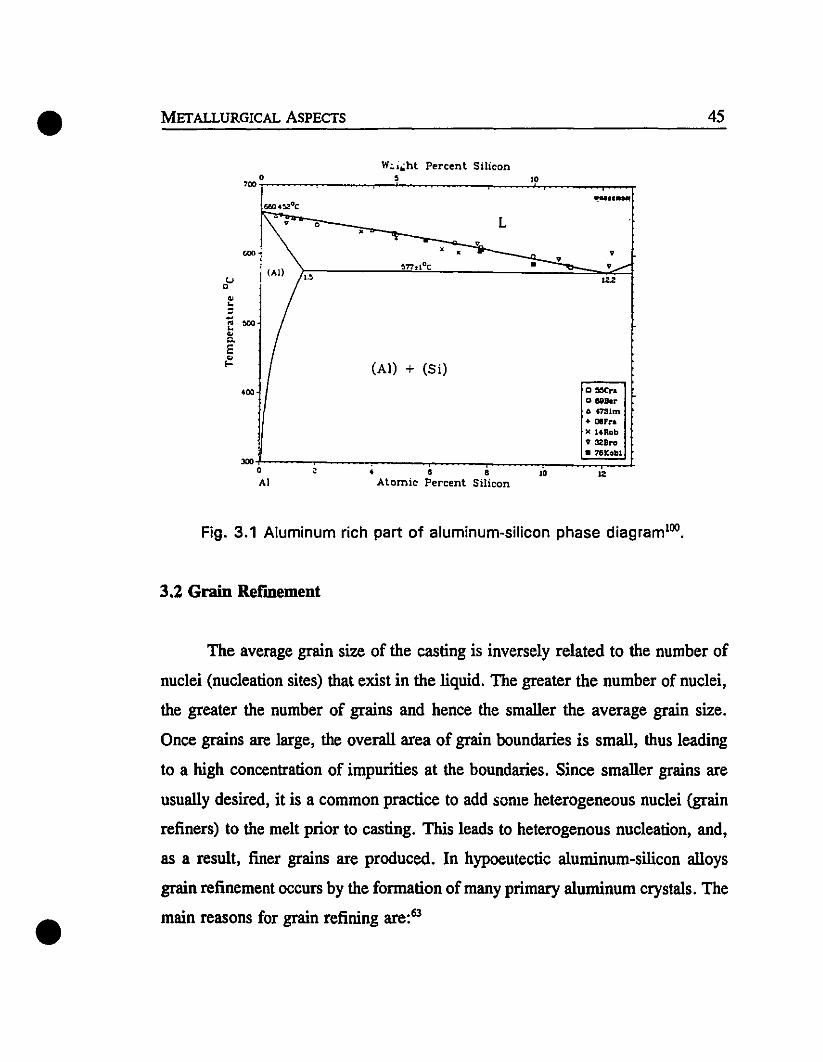
• METALLURGICAL ASPECTS 45
1210
W.:.i.;:ht Percent Silicon, ~
• • •Alomic Percent Silicon
~II."'"
,~0 L
•~
-'10-• • •~77I1DC • ~ ........
1 (Al) " lU
(Al) + (Si)
D :<>cr•g eelkro.41Slm+ OlFra)( 14Rob93ZBro• 76tobl.
o
""
300oAI
...
Fig. 3.1 Aluminum rich part of aluminum-silicon phase diagram 1OO•
3.2 Grain Rermement
•
The average grain size of the casting is inversely related to the number of
nuclei (nucleation sites) that exist in the liquid. The greater the number of nuclei,
the greater the number of grains and hence the smaller the average grain size.
Once grains are large, the overall area of grain boundaries is small, thus leading
to a high concentration of impurities at the boundaries. Since smaller grains are
usually desired, it is a common practice to add some heterogeneous nuclei (grain
refiners) to the melt prior to casting. This leads to heterogenous nucleation, and,
as a result, finer grains are produced. In hypoeutectic aluminum-silicon alloys
grain refinement occurs by the formation of many primary aluminum crystals. The
main reasons for grain refining are:63

• CHAPTER THREE 46
•
i) to improve the mechanical properties of the cast metal and tG make
these properties uniform throughout the material.
li) to achieve a finer distribution of secondary phases thereby
improving machinllbility.
iii) te improve resistance to grain boundary corrosion.64
iv) to improve the resistance to hot cracking.
v) to improve feeding of the casting in order to minimi:Lc
shrinkage.65
Grain refinement can be done either by chemical addition or through rapid
cooling of the melt. In aluminum and its al1oys, chemical grain refinement is the
most widely used technique. It has been practiced for over fifty years, mostly by
primary aluminum producers in ingot casting. Titanium or titanium-boron mixtures
are added to liquid alufiÙnum as grain refinement reagents. They can be added via
master al10ys available as ingot, or as salt fiÙxtures.
3.2.1 Grain Reïmement Principles: It is well known that by chemical
grain refinement treatment, one promotes heterogeneous nucleation by adding a
number of solid-foreign particles into the melt. Thus, at the beginning of
solidification, a lower driving force (undercooling) for initiating solidification will
be required. Aho, since each grain is nucleated by one foreign particle, a greater
number of particles (nuclei) will yield more grains and a smaller grain size will be
obtained. On the other hand, in any metallic melt, a given solid particle may not
act as an effective nucleus. The question of what constitutes an effective nucleus
is not clearly known. However, it is believed that the interfacial energy between
the nucleant and the solidifying material bas a key role in successful grain
refinement. As shown in Fig. 3.2, a foreign particle may or may not be wetted by
the nucleating crystal, depending on the nature of the interfacial forces between
them. The relationship between the surface forces at the beginning of solidification

• METALLURGICAL ASPECTS
at the surface of a heterogeneous nucleus can be expressed as:
47
3.1
aHL
a5L
~UqUid
- ---Gfowing crystal
----;;r:
"----Heterogeneousnucleus
•
Fig. 3.2 Surface energy relations affecting the wetting of heterogeneous
nuclei by the Iiquid metal.
The smaller the value of e, the greater will be the tendency of the substrate
to initiate crystallization. A detailed theory of heterogeneous nucleation can be
found elsewhere.66 Fig. 3.3 illustrates nucleus-nucleant interaction in terms of
interfacialenergies. For heterogeneous nucleation, condition (c) is usually regarded
as the best scenario. Here, the nurleus enve10ps the nucleant such that it forms
a film of large radius of curvature with little distribution of energy. It has been
shown that a certain crystalline similarity between the nucleus and nucleant is
necessary to produce heterogeneous nucleation (epitaxial relation). Thus, a very
close atomic matching may occur across the interface separating the two67• It is

• CHAPTER THREE 48
usually deemed that a difference in the basic lattice unit size of the two crystal
systems should not be more than 15 to 20% for effective heterogeneous nucleation,
yet sorne particles satisfying this criterion still have no nucleating effect.67
Liquid metals with commercial qualities always contain a multitude of
foreign particles. At a given temperature below the melting (or liquidus)
Nucleant
aHigh interfacial
energy
Nucleant
bModerate interfaclal
energy
illllllmmiimmmmiiiiHiiHiiiHiHiHiHmHmmi ",,;;i
mm Nucleant mhU
1!llltmmmimii!ii!imiimiimiii!!ii!!miimm;!iiimjll~11c
Very low interfacialenergy
•
Fig. 3.3 The interfacial energy interaction between nucleant and nucleus.
temperature, any foreign particle may or may not be effective as a nucleant.
Particles which satisfy the heterogeneous nucleation conditions described above
will act as an effective nucleant at temperatures very close to the melting (liquidus)
point, while particles with a higher crystal mismatch will require a higher

undercooling to aet as effective nuelei. In faet, from the energy point ofview, the
magnitude of undercooling is the driving force to aetivate an existing particle to
aet as a heterogeneous nucleant. The smaller the required undereooling (driving
force) the better the potential nueleant is for the grain refinement. This deseribes
how rapid cooling causes grain refinement in addition to the ehemical grain
refinement effeet. In a very fast cooling sample, the magnitude of supereooling is
high enough to aetivate almost any existing foreign partiele to aet as a nueleation
site. Consequently, in casting methods with high eooling rates sueh as die casting,
ehemical grain refinement is usually not necessary.
Grain refinement can be affeeted by certain other minor factors sueh as
vibration, stirring, and surface roughness of the nucleant. Melt vibration yields
finer grains eompared to a no vibration situation. Also, the rougher the surface of
the nueleant (or even the mold wall) the finer the size of the grains.
• METALLURGICAL AsPECTS 49
•
3.2.2 Chemical Grain Refmement of AI Alloys: Several elements will
grain refine aluminum, but the MOSt effective have been found to be titanium in
about 0.15%, or titanium-boron in the range of 0.01-0.03% Ti and 0.001 % B.4
Grain refiners are added to the melt through a hardener (master) alloy. The
aluminum matrix dissolves and releases intermetallie partieles into the mf-it whieh
subsequently aet as nucleants.
Several hypotheses exist ta explain how titanium grain refines aluminum
alloYS.l01,102 According to the carbide theory TiC is the nueleant since both AI and
TiC are FCC materials whose lattice parameters differ by 6% or 7%. TiC forms
by the reaetion of titanium and residual carbon in the melt. It is also possible to
add TiC to the melt through a master alloy. There are studies showing the
existence ofepitaxy between AI and TiC, but due to the thermodynamie instability
of TiC in an aluminum melt, this theory is not supported in its original form.68

• 50
According to the phase diagram theor'y, and from the aluminum-titanium phase
diagram, titanium in solution in the liquid metal at Il concentration above 0.15%
precipitates as Al3Ti in a peritectic reaction (Fig. 3.4) according to the following:
Liquid + Al3Ti ~ a(Solid) + Q 3.2
670 Liquicl
u•!.: 665~
!
655
liquid + A13Ti
,,0;;,;'�5:.- ~~I,2~---1 665'C
"
0.5 1.0 1.5
T1tMùum,~'_'
•
Fig. 3.4 Aluminum rich part of the aluminum- titanium phase diagram.62
There is no doubt that Al3Ti is an active nucleus for aluminum, because
Al3Ti is found at the core of aluminum grains and a well-established orientation
relationship between the lattices of the two phases has been observed.64 A
schematic presentation of the peritectic reaction is depicted in Fig. 3.5. As seen
the aluminum grows along the surface of the Al3Ti particle that is in contact with
the solidifying melt and saon after, the solid Al3Ti will be totally cl,vered by solid
aluminum. A further thickening of the aluminum layer then occurs by diffusion
through the solid aluminum cover, which is a rather slow process (peritectic
transformation). The peritectic reaction is exothermic (Bq. 3.2) and once started
will continue spontaneously. At this stage the growth process practically stops and

the particle becomes an inactive nucleus until the bulk temperature reaches the
actual growth temperature69•
In cast shops, Ti is added through a master allo~' which contains Al3Ti
partic1es in suspension. As the master alloy disperses in the bulk melt, the Al3Ti
• METAlJ..URGICAL AsPECTS
UquidGrowth direction•
Peritectic reactionPeriteetic transformation(thickening of the ct layer
51
•
Fig. 3.5 Nucleatlon by the peritectlc reaction in the AI-Ti system.69
partic1es tend to dissolve and grain refining efficiency will decrease with time
(fading). Nevertheless, this pror-ess talœs in the order of one hour. This allows
ample time for the treatment and casting of the melt. A master alloy containing
many small Al3Ti particles will be a better grain refiner than one which contains
fewer, larger Al3Ti particles. This is the reason that the effectiveness of grain
refinement depends on the microstructure of the master alloy and may vary from
batch to batch and from supplier to supplier.4
The addition ofboron to the master alloy greatly increases the effectiveness
of grain refinement. It still remains unc1ear what is the process by which Al-Ti-B
grain refiners operate.68 The ternary master alloy contains relatively coarse
52CHAPTER THREE-------------------=p:lrti(;les of Al3Ti in the order of3.0 l'm and many fine T~ crystals in the order
of O.3I'm.70 It is believed that the finer T~ or (Ti,Al)Bz particles in suspension
collect around the Al3Ti particles and reduce the rate at which they dissolve.4
According to another hypothesis, nucleation may be greatIy enhanced by the action
of solutes adsorbed on the surface of the Al3Ti.4,64
Most recentIy, Mohanty et al68,71 proposed a duplex nucleation mechanism
for aluminum grain refinement. According to them, on addition of Al-Ti-B master
alloy to the melt, dispersion ofT~ and dissolution of Al3Ti occur coincidentally.
Since the level ofTi addition is below the peritcctic composition, T~ introduces
an activity gradient in the melt, and Ti segregates onto the TiB2/melt interface,
causing Al3Ti formation onT~ particles. SubsequentIy, a aluminum nucleates
at the interface by the peritectic reaction as cooling proceeds.
•
•
3.2.3 Thermal Bebaviour During Heterogeneous Nucleation: As a melt
cools to the freezing point (liquidus temperature), two processes happen
concurrentIy. Solid nucleates on the available nucleant surfaces, and when the
temperature has fallen low enough, the nucleated particles begin to grOVl and
evolve latent heat. At first, the temperature will continue to fall almost uniformly,
but as nucleation and growth aceelerate, the cooling rate decreases until the
temperature reaches a minimum and recalescence occun. Although foreign
particles are being consumed during this stage, the nucleation rate per unit area of
available substrate rises to a maximum at the minimum temperature and then falls
offvery quickly. This sequence talœs place in a short time interval, typically about
five seconds, and nucleation is almost complete just beyond the minimum
temperature. After that, the process is entirely a growth process, though there still
may he many solid foreign particles present which were not involved in the
promotion of nucleation.7o

• METALLURGICAL ASPECTS
3.3 Modification
53
According to the aluminum-silicon phase diagram (Fig. 3.1), hypoeutectic
alloys solidify over a range of temperatures. During solidification there always
exists a mushy zone in which a primary solid phase coexists wiili sorne liquid. Al
the end of the freezing process, the liquid phase surrounding the primary phase
dendrites undergoes a transformation resulting in the formation of an eutectic
silicon phase. The size and ti.e geometry of the eutectic structure is important in
determining the final mechanical properties of the casting. Coarse, long flakes of
silicon impose poor properties. Fine, fibrous shapes improve mechanical
Table 3.1 Comparison of some mechanical properties of non-modified
and modified AI-Si casting alloys8s.
YIELD • •IILLOY • STRENGTH UTS ELONGIITIONTEMPER PRODUCT TREIITMENT 10.2\1 k.si ksi 1\1
13l Si Sand Cast None -- 18.0 2Test Bars Na-modif ied 28.0 13
13\ Si IJermanent Mold None 28.0 3.6Test Bars Na-modified 32.0 8
359.0 Permanent Hold None 26.1 5.5Test Dars 0.07\ Sr 30.5 12.0
356.0-T6 Sand (".&:ft. None 30.1 41.9 2.0Test Ba.ts O. 007\ Sr 34.5 42.5 3.0
356.0-T6 Bars eut from None 30.9 41.2 4.4Chil1ed Sand Casting 0.007\ Sr 31.6 42.2 7.2
11356. a-TG Sand Cast None 26.0 40.0 4.8Test Bars 0.01\ Sr 30.0 43.0 8.0
1\444 .0-T4 Permanent Mold None 21.9 24.0Test Bars 0.007\ Sr 21.6 30.0
11413.2 Sand Cast None 16.3 19.8 1.8Test Bars 0.005 to 0.05\ Sr 15.6 23.0 8.4
11413.2 Permanent None 18.1 24.4 6.0Mold Test Bars 0.005 to 0.08\ Sr 18.1 27.7 12.0
1\413.2 Test Bar eut 0.05\ Sr 17.5 28.0 10.6from Au,te Wheel 0.06\ Sr 18.2 28.0 12.8• • Note that one kai equala 6.89xlO· Nlm'

• CHAPTER THREE 54
•
properties. An unmodified alloy casting contains large brittle flakes of
(eutectic)silicon and exhibits poor ductility. The unmodified alloy will typically
have a tensile elongation no more than a few percent and the fracture surface has
been observed to be largely brittle.65
The transformation of silicon morphology from acicular to fibrous is called
"modification". This transformation is responsible for the enhanced mechanical
properties associated with modified Al-Si castings. Table 3.1 compares sorne
mechanical properties of modified and unmodified Al-Si alloys.
Modification can be achieved either chemically (Le. addition of modifier
elements to the melt) or by rapid solidification (quench modification). In practice,
chemical modification is more common. Several elements are known modifiers for
aluminum-silicon alloys. These include sorne group lA, IIA, and rare earth
elements. Of these, sodium and strontium are most often used in practice. They
are effective at very low concentration levels, typically in the order of 0.007% to
0.02%.
3.3.1 The FundamentaIs of Modification: In the freezing of an Al-Si
eutectic, the silicon phase plays a critical role in modification. The aluminum solid
solution exerts only a minor influence on the process. Therefore, the solidification
of silicon will be explained in sorne detail.
Silicon crystals can grow only in a specific crystallographic direction
(faceted growth). Twins are easily formed in the crystal. Crystallization of the
silicon occurs by the addition of atoms to form steps which accumulate across the
solid-liquid interface. These steps initiate at twins, and since twin planes always
intersect the solidifying interface, a constant supply of growth sites exists at which
freezing of silicon may occur (Fig. 3.6). Studies by transmission electron
microscopy show that modified silicon fibers contain orders of magnitude more

• MEl'ALLURGICAL ASPECTS 55
twins than do unmodified silicon plates. This means that during solidification, a
large number of twins provides more sites for addition of solid silicon in different
crystallographic directions. This promotes branching. Silicon fibers contain many
crystallographic imperfections each of which is a potential site for branching to
occur. As a result, fibers in the chemically modified eutectic are able to bend,
curve and split to create a fine microstructure. 4
Growth direction
t Ste~ motion
<112>-111
(111 )
Twin lane
Freezing direction
a b
Fig. 3.6 Schematic representation of the growth of silicon;
al Directional growth of an élcicular silicon crystal from the melt,
bl Solid-Iiquid interface of a solidifying silicon crystal4 ,
•
In quench modification, a rapidly solidified structure appears optically
identical to a chemiC?Jly modified one. However, electron microscopy has revealed
that the silicon is similar to the unmodified forro with very low levels of twinning.
In fact, the quench modified structure is nothing oilier than a fine forro of an
unmodified eutectic. This may be the reason that chemical modifiers are more
effective at higher cooling rates.
• CHAPTER THREE 56
•
3.3.2. Chemical Modification of Aluminum Alloys: Several elements have
been observed to produce a modified aluminum-silicon eutectic; however, it is
believed that sodium and strontium offer the most promise for the successful
modification of aluminum silicon eutectic and hypoeutectic alloys.4.72
To study how these elements modify aluminum-silicon eutectic alloys, one
must take into account the role of phosphorus in the melt. Phosphorous is nearly
always present in non-modified commercial alloys as the compound AlP. AlP has
been observed to be an effective nucleant for silicon. Sodium and/or strontium
react with and either neutralize or remove AlP from the melt. In addition to the
successful neutralization or removal of AlP, it appears that an effective modifier
retards the growth rate of silicon crystallization in the melt. Thus, there will be
higher undercooling required for the nucleation of silicon (theoretically about
lO°C). As a result, it is seen that eutectic solidification occurs at a nearly constant
temperature about lOoC below the equilibrium eutectic temperature.72
Sodium and strontium produce equivalent modified structures when they are
used correctly. The chemical and physical properties of these modifier agents are
different and, because of this, they are added to the melt in different situations.
Sodium has low solubility in liquid aluminum, high vapour pressure and oxidizes
quickly. Because of the low solubility of sodium (about 0.01 %) the manufacture
of aluminum based master alloys is not practical. The high vapour pressure of
sodium (0.2 atm. at 730°C) causes large losses from thr. melt, and despite the
excellent dissolution characteristics of sodium, recovery of this element is poor
(20% to 30% of the addition).
Strontium on the other hand, can be added easily via master alloys and the
vaporization problem is much less severe. Higher (about 90%) and molC
reproducible recoveries are achieved. How.;ver, its dissolution characteristics are
more complex than those of sodium and its successful application requires more

• METALLURGICAL ASPECTS 57
•
precaution. High strontium (containing about 90% Sr) master alloys dissolve best
at low rather than high temperatures and should be added at the lowest practical
temperature. Low strontium (containing about 5% Sr) master alloys behave quite
differently. They exhibit classical dissolution behaviour such that their dissolution
improves as the temperature increases.4•73 A detailed discussion on strontium
dissolution can be found in Ref. 4.
The required amount of modifier elements depends on the alloy
composition; a higher silicon content requires more modifying agent. Typical
retained Na levels are in the range 0.005 to 0.01 %; Sr amounts of 0.02% are
sufficient to modify a 7%Si alloy, but up to 0.04% is needed to modify 12%Si
(eutectic). To evaluate the modification efficiency, it is sometimes useful to
quantify the microstructure. The structures have been divided into six classes. A
weil modified structure lies in class 5, undermodified in classes 2-4, lameilar in
class 2 and a very fine structure, called supermodified, in class 6. The latter class
is not weil understood at the present time. The vast majority of modified castings
will have structures of the 1 to 5 type. Fig 3.7 illustrates the rating system for
modified microstructures. For example, in a sample which contains 20% class 3,
50% class 4 and 30% class 5, the modification rating (M.R.) would then be
calculated as:
M.R. =(0.2x3)+(0.5 x4)+(0.3 x5)=4.l
and the sample can be said to be reasonably, but not perfectly, modified.4
On the other hand, excess modifiers in the melt can cause overmodification.
A detailed theory of modification is beyond the scope of this , .. ,:sis and only the
effect of overmodification on the microstructure will be discussed briefly.
Strontium overmodification causes coarsening ofthe silicon structure and Ieversion
of the fine fibrous form to an interconnected plate form. Also, it has been shown4
that undesirable intermetallic phases such as Al4SrSiz Can be created in an

Fig. 3.7 Microstructural rating system for modification of AI-Si alloys.4
•
•
CHAPTER THREE
Fully Unmodified Structure
Class 2. Lamellar SIruc/urs
Cfass 3. Partial Modification
Class J. Absonco of Lama/laf Structure
C/ass 5. Flbrous Silicon Eu/oCfic
Clsss 6. Very Fino SIructuro
58
/
overmodified microstructure. In terms of sodium over-modification, at
concentrations higher than 0.02%, crystals of the AlSiNa compound appear and
small sodium bubbles are sometimes found. The AlSiNa intermetallic often
nucleates silicon crystals.72
• MIITALLURGICAL ASPECfS 59
•
3.4 Thermal Analysis
It has always been the foundryman's goal to predict the grade of casting produced
beforc it is cast. One approach is to develop a control technique to obtzin on-line
feedback regarding the melt quality. If the quality of the melt is unacceptable, in
most cases, some liquid metal processing can be performed to restore the melt
quality before casti"g. This is accomplished through micro-processor assisted
thermal analysis of the melrs which has been called a practical technique for the
"instantaneous" quality determination at the casting station.74 Thennal analysis for
quality control was first applied to cast iron, and since the ea"ly 1980' s, it has
been accepted as a valuable tool for evaluating liquid aluminum alloys.S Since this
technique yields important information about alloy composition as well as the
microstructure which will be obtained after solidification, it is sometimes referred
to as a "non-destructive microstructure control" method.4•16
When a liquid metal solidifies, it forms a crystalline structure that has more
order and less randomness than the liquid from which it was formed. As the
crystalline structure forms, and because it is more ordered, it releases heat energy.
The quantity of energy released depends on what crystals ~re being formed, and
how much is crystallizing at that time. The amount of energy released can be
enough to totally stop the cooling of the sample, or, more commonly, slow down
the cooling rate7S•
In thermal analysis, the temperature of a solidifying sample is recorded as

• CHAPTER THREE 60
•
it freezes from the liquid state, through the solidification range (if any), to the
solid state. The resultant plot of temperature versus time forms the basis for
thermal analysis. The shape of this so called "cooling curve" will vary depending
on a number of important parameters such as cooling rate, chemical composition
of the melt, reactions involving evolution and adsorption of heat such as phase
transformations, and formation of intermetallics. Analysis of the cooling curve
with a standard mathematical algorithm allows one to determine a number of
useful pararneters that characterize the liquid and solid state of the material. It also
allows one to perform necessary melt treatments such as grain f<:finement or
eutectic modification. For example, in terms of chemiC':ll composition, sorne
elements like Na and P exist in ppm quantities. Chemical analysis of samples taken
from the melt are not accurate enough, although this level of concentration
produces a remarkable change in the cooling curve. In other words, cooling curves
produced by the thermal analysis technique resemble "fingerprints" of the melts
and incorporate the solidification history of the particul2.l' casting or sample.76
Fig. 3.8 shows a typical cooling curve for an Al-Si foundry alluy. As seen,
the curve is divided into three regions A, B and C. The region A indicates the
extent of grain refinement that has taken place in the melt. The existence of an
underl.Ooling in this region associates with the formation of the primary phase.
Between regions A and B, in the time interval between t1 and ~, the sample is in
the two-phase (mushy) region of the cooling curve where the .~oiid and liquid
phases cœxist. As temperature decreases, more liquid freezes and the solid phllSe
fraction increases. At time ~, the liquid phase surrounding the solid dendritic
network is enriched in composition by nearly all of the Si (solute element) and
undergoes an eutectic transformation such that the liquid phase transforms to two
soUd phases at a constant temperature.The eutectic transformation, then, occurs
between the time period ~ to t3• The eutectic region of the cooling curve indicates

• METALLURGICAL ASPECTS 61
the extent of modification (see 3.4.2). In the region C, solidification is cOl~plete.
However, when appreciable amounts of impurities are aIso present, the formation
of other phases such as MgzSi after point C llIe observed.
Major phase changes are usually obvious on the cooling curve (e.g. points
~Tc
-/ \<::: TuA
tl t2Time
t3
•
Fig. 3.8 A typical cooling curve of an off-eutectic AI-Si alloy.es
A, B and C in Fig. 3.8), but depending on the composition, some of the other
minor reactions may be scarcely detectable. In order to reveal the exact
temperatures at which such reactions occur, it is usually necessary to employ the
fust derivative curves in which the cooling curve slope (dT/dt) is plotted versus
time. The main benefit of the derivative curves lies in their ability to magnify the
important slope changes w!Uch are found on the cooling curve.4,7.6S.77 Fig. 3.9
shows the cooling curv,~ and the fust derivative curve for a typical Al-Si 356 alloy.

• CHAPTER THREE 62
•
In aluminum silicon casting alloys, the thermal analysis technique is
primarily used to control grain size and the degree of eutectic modification.4•5•6,65.74,76,77.78,79
3.4.1 Thermal Analysis Control of Grain Size: Thermal analysis can he
utilized to evaluate the level of grain refinement in Al-Si casting alloys. Once grain
650 0.2
1 0.1
" 12
" 3600 " 0
t.ldT/dt
0 -0.1
Pai:;1ü 550 -0.2 .;Q; "0Q, j::'E -0.3 "0Q)....
soo -0.4
-0.5
4500
-0.6200 400 600 800 1000 1200 1400 1600
T\me, sec.
Fig. 3.9 Typical cooling curve and its first derivative of a 356 alloy at
approximately O.soC/s. 1) Primary AI phase nucleation; 2) AI-Si eutectic
reaction; 3) Minor intermetallic formation reaction (e.g. M92Si).7
refi'lement treatment is applied (by any means), it affects the ~hape of the cooling
curve at the very beginning ofliquidus solidification. In a weil (chemically) refined
alloy, for example, with a sufficient number of effective nuclei, nucleation will
occur in a shorter time, and a supercooling as 10w as O.3°C is sufficient to start
primary soli~fication. This indicates that there is almost no energy barrier for
nucleation and that the grain size of the casting will be fine. This is illustrated in
curve 1 in Fig. 3.10. If the melt is not grain refined or partially refined, a greater
driving force in the form of undercooling will be necessary to start solidification

• METALLURGICAL ASPECTS 63
of the primary grains. Once nucleation is complete evolution of latent heat tends
to decrease the undercooling and recaIescence occurs. Eventua1ly, the cooling
curve will follow a sinusoida;. arrest pattern and resemble curve 2 in Fig 3.10. In
this figure, the larger the amount of dT (apparent supercooling), the larger the
sizes of the grains and the less the grain refinement. The apparent supercooling,
TO; T~rlH-~":r'"
; T1H-4'"a.E ATt!!
tl
Curvel: a grain refined alloy
Curve 2: an unrefined alloy
Ta = temperature at star! of freezlng of a well-refined alloy;
Tl=temperature at star! of freezlng of an unrefined alloy;
tl=perlod of apparent supercoollng
T2=recalescence temperature
g=T2-T1: the apparent supereoo11ng
tl=perlod of apparent supereoollng
tlme
•
Fig. 3.10 The cooling curve at the beginning of solidification80;
curve 1: a grain refined aUoy;
curve 2: an unrefined aUoy.
then, is defined as the differentiaI between the minimum temperature relating to
the beginning of solidification and the maximum temperature reached by the a1loy
during solidification (recalescence temperature). This apparent supercooling, dT,
is aIso shown in Fig. 3.10.
The period of apparent supercooling gives another effect on the solidificntion curve
relative to grain size. At larger grain sizes, the undercooling lalols for an extended
period of time because of the time factor required for nucleation menticmed il1
3.2.1. Tnis period (tl on Fig. 3.10) is characterized by the elapsed lime between

• CHAPTER. THREE 64
•
the moment solidification begins at temperature Tl, and the time at which the
recalescence temperature, T2 is attained. The question of whether the above
temperature difference or the time difference is the preferred parameter in
assessing grain refinement is somewhat controversial. Sorne alloys exhibit a better
correlation between grain size and arrest time. Others (most likely casting alloys)
exhibit a good correlation between the arrest temperature and grain size. It has
been observed that for wrought aluminum alloys, in the cases that the liquidus
temperature lies below 610°C (1200°F) the apparent supercooling can be used for
grain size evaluation, whereas in cases with the liquidus temperature greater than
610°C, a horizontal arrest occurs, and the time difference can be used for grain
refinement evaluation74• In aluminum casting alloys both the value of apparent
supercooling and period of supercooling are suggested for the best estimation of
grain size, but because of the simplicity in the measurement of supercooling over
the complex and time consuming time difference method, the temperature
difference method is routinely used.78
3.4.2 Thermal Analysis Control of Eutectic Modification: In aluminum
silicon hypoeutectic alloys, modification treatment targets the eutectic and solidull
parts ofthe cooling curve. Therefore, the thermal analysis technique can determin,~
the degree of modification. The cooling curve of a modified alloy has the
following characteristics when compared to one of an unmodified alloy4:
i) The temperature of the eutectic plateau is depressed.
li) The duration of the eutectic plateau is increased.S
iii) The required supercooling to start eutectic freezing is increased.
iv) The duration of the supercooling is enlarged.
These effects are depicted in Fig. 3.11.
Among the above mentioned features, the deprp.ssion ofeutectic temperature

• METALLURGICAL ASPECTS 65
at a certain cooling rate is most often used in thermal analysis control of
modification. 4,7,76,78 The lower the eutectic temperature, the greater the
modification and the finer the silicon eutectic structure.
ln an unmodified hypoeutectic aluminum-silicon alloy of high purity, the
eutectic temperature is 577°C +0.381 and an eutectic temperature arrest depression
of about 10°C by modification has been observed.65 ln commercial alloys, the
Unmodified
Modifled
Time
...........\
.......
ÂT-_._._ .._-_.~-l1
•
Fig. 3.11 A comparison of the eutectic regions of the cooling curves ofmodified and unmodified alloys5.
minor presence of other elements such as Mg, Mn, Fe, Cu and Ni tends to lower
the eutectic temperature from 577°C. Thus, depending on the amount and nature
of impurities, a lower eutectic temperature depression is expected by modification
treatment.
Modification can be controlled using more sophisticated approaches. For
example, since the greatest temperature depression happens in the unmodified to
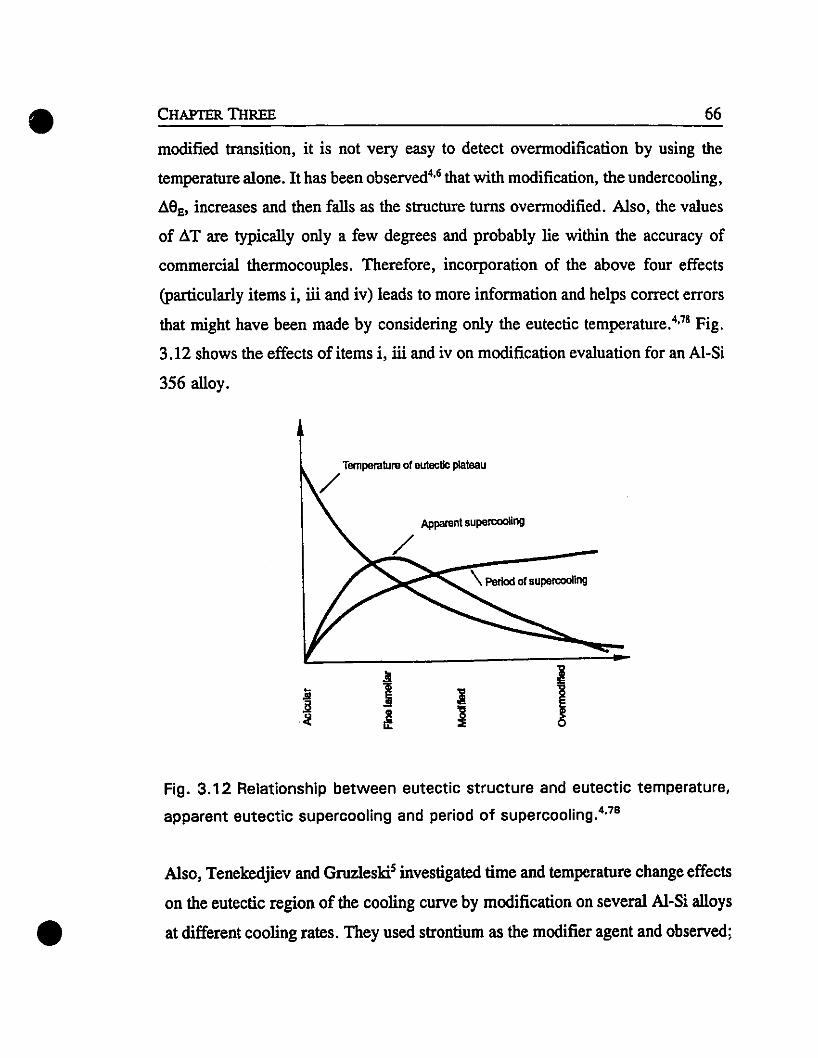
• CHAPIER 1HREE 66
•
modified transition, it is not very easy to detect overmodification by using the
temperature alone. It has been observed4•6 that with modification, the undercooling,
âeE, increases and then falls as the structure tums overmodified. Also, the values
of âT are typically only a few degrees and probably lie within the accuracy of
commercial thermocouples. Therefore, incorporation of the above four effects
(particularly items i, iii and iv) leads to more information and helps correct errors
that might have been made by considering only the eutectic temperature.4•7S Fig.
3.12 shows the effects of items i, iii and iv on modification evaluation for an Al-Si
356 alloy.
Temperature 01 eutectlc plateau
/Apparent supercoollng
/'--:-----
1Fig. 3.12 Relationship between eutectic structure and eutectic temperature,
apparent eutectic supercooling and period of supercooling.4.78
Also, Tenekedjiev and Gruzleski5 investigated time and temperature change effects
on the eutectic region of the cooling curve by modification on several Al-Si alloys
at different cooling rates. They used strontium as the modifier agent and observed;

• METALLURGICAL ASPECTS 67
•
.Depression of the nucleation temperature and the eutectic growth
temperature.
• Greater value of Â6E with the presence of modifiers .
• Considerable enlargement of the eutectic reaction.
They concluded that at low cooling rates (about 1°C/sec), with the
exception of 413 alloy, a time difference parameter was also sensitive to strontium
treatment. The main advll:1tage of using a time difference parameter was that it
was thennocouple independent and easier to measure than was temperature. They
also found that the primary arrest was not affected by strontium. Therefore, it
would not interfere with the ability of thermal analysis to assess grain refinement.
3.4.3 Thermal Analysis Equipment: Thennal analysis is relatively simple
and inexpensive to perfonn. It is carried out by pouring a relatively smallliquid
sample of the melt into a sampling cup. The liquid metal is then allowed to
solidify. The temperature of the solidifying sample is recorded as it cools through
the solidification range, and eventually the cooling curve is drawn. The equipment
that is required includes a sampling cup and a thermocouple, and may also include
a PC-based Data Acquisition System for data logging and analysis as well as an
appropriate software package. The thennocouple is placed in the centre of the cup
(or in sorne cases two thennocouples are used; one fixed at the centre; and the
other on the cup wall to detect any changes of cooling rates). The physical and
thennal characteristics of the sampling cup in any one given test determine the
effective cooling rate. Control of the cooling rate is a very important issue in
conventional thennal analysis and it is difficult to control in tenns of
reproducibility. For example, Tenekedjiev and Gruzleskis used a fire clay cup pre
heated to 400°C and encased in a fiberfrax insulation box to achieve equilibrium
(very slow) cooling conditions. They used the Sllll!"~ arrangement to simulate sand
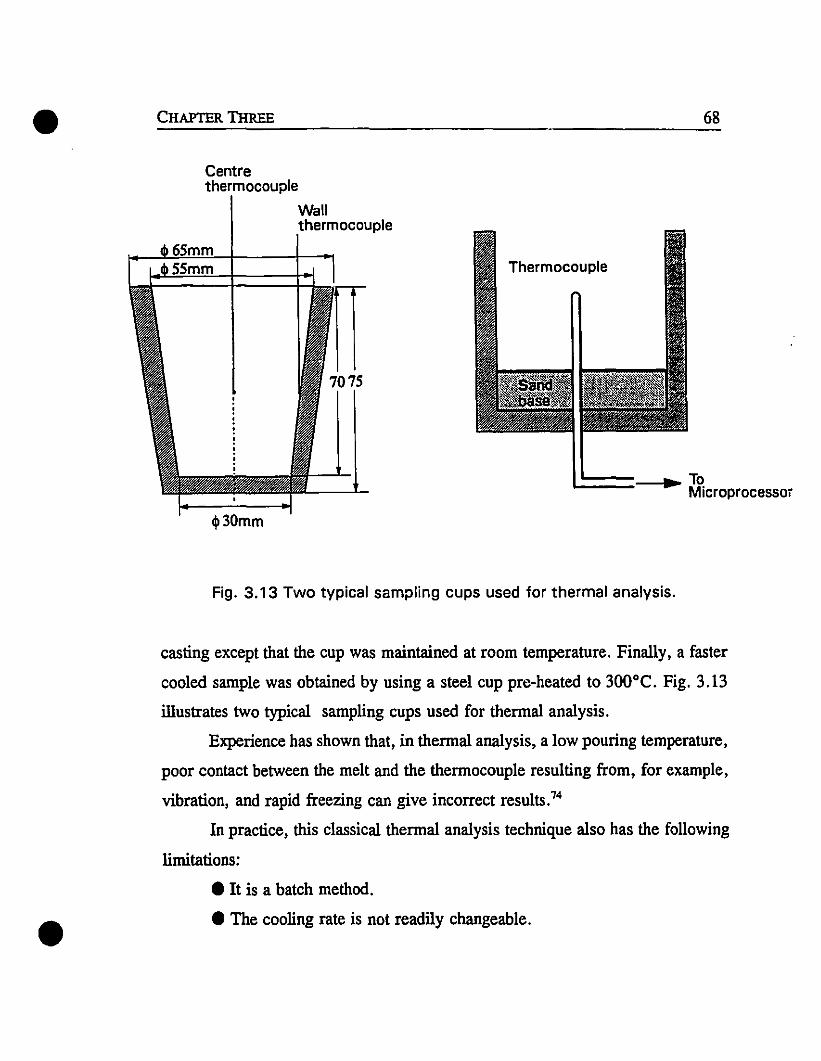
• CHAPTER DmEE
Centrethermocouple
Wallthermocouple
$30mm
68
Thermocouple
L.=:==--1~~ ToMicroprocessor
•
Fig. 3.13 Two typical sampling cups used for thermal analysis.
casting except that the cup was maintained at room temperature. Finally, a faster
cooled sample was obtained by using a steel cup pre-heated to 300°C. Fig. 3.13
illustrates two typical sampling cups used for thermal analysis.
Experience has shown that, in thermal analysis, a low pouring temperature,
poor contact between the melt and the thermocouple resulting from, for example,
vibration, and rapid freezing can give incorrect results.74
In practice, this classical thermal analysis technique also has the following
limitations:
• Il is a batch method.
• The cooling rate is not readily changeable.

• MEfALLURGICAL ASPECTS 69
•
With this method, the choke of cooling rate norrnJ1ly involves the selection of a
suitable sampling cup to produce the desired cooling rate. Thus, to be able to
simulate a range of cooling rates, one requires a variety of cups. In other words.
it is not practical to simulate different types of casting methods with a givcn cup.
• It is i!!!possible to automate and computerize the entire analysis process .

•
•
CHAPTER4
THE HEAT PIPE PROBE
4.1 Introduction
The primary objective of this doctorate research work is to develop a heat
pipe probe for conductint, thermal analysis of aluminum and aluminum casting
al1oys. This new probe for conducting thermal analysis will make the process
semi-continuous rather than batch as is currently available with the conventional
method. AIso, the cooling rate will be readily changeable over a wide range for
the same sample. The evaporator of the probe which is agas loaded annular
thermosyphon, resides in a large bath of liquid metal and does not need to he
withdrawn as it solidifies a smal1 sample (Le. button) at a predetermined cooling
rate. Once the instantaneous rates of cooling have been obtained, the probe can be
instructed to remelt the frozen button and await instruction for analyzing a fresh
sample. In this chapter the probe specifications and design will be presented in
detail.
4.2 Cbaracteristics of the Probe

• THE HEAT PIPE PROBE 71
•
Accorciing to the defined task for the probe (see 4.1) the basic
characteristics are defined regarding the following:
1) The positioning of the probe.
2) Flexibility to alter the rate of heat dissipation [Tom high rates to almost
zero (tumed off).
3) The ability to take a proper sample from the liquid metal.
The probe should be used vertically since one end will stay in the liquid
metal to take the sample while the other end must be in the ambient environmenl
to dissipate the heat extracted from :he sample. Therefore, to satisfy the above
condition and because ofthe higherefficiency and structural simplicity (see 2.4.1),
a gravity-assisted heat pipe (thermosyphon) is to be used. To satisfy the second
criterion a gas loaded thermosyphon with variable inert gas pressure can be
employed in which the heat transfer rate is readily changeable over a wide range
ià!
J1
IlSIIf4lllng Roglan
Fig. 4.1 The basic appearance of the thermosyphon probe.
(see Fig. 2.5). Finally, a concentric annular shape ofthermosyphon (Fig. 2.3) was
found necessary to have a proper sampling region in addition to its higher heat

• CHAYfER FOUR 72
dissipation efficiency. The sampling region is, in effect, about 0.1 m long inside
the smal1er diameter pipe at the bottom end of the probe. It resides in the Iiqnid
metal bath and forms the evaporator of the thermosyphon. Therefore, a gas-loaded
annular thermosyphon (with a changeable inert gas pressure) has to he designed
for this new method of thermal analysis. Fig. 4.1 presents a sl:hematic of the:: cross
section of the probe basic sections.
4.3 Probe Design
Genera1ly, a heat pipe for a special application is designed with respect to
sorne key criteria such as:
• The expected task of the heat pipe for a given application (as determined
in 4.2).
• The optimum size of the heat pipe.
• The temperature r&l1ge that the heat pipe is supposed to work in.
• The environments to which the heat pipe is exposed, including the
environments both at the evaporator and condenser (heat source and heat
sink) and the internal environment (inside the pipe).
The physica1 size must he determined with respect to the particular
application. Here, the proper size of the sampling region is the starting point. The
sampling region that is a cylindrical shaped bar must have a volume that is
representative of the whole batch of liquid metal. Therefore, the diameter of the
inner pipe is equal to the minimum acceptable diameter of the sample. The outer
pipe diameter is then determined by considering the behaviour of the working
substance inside the thermosyphon. The regular cycling (vaporizationl
condensation) of an annular thermosyphon occurs in the space between the two
concentric pipes. This space must be large enough to reduce high shear stresses

• THE BEAT PIPE PROBE 73
•
at the liquid/vapor interface to the point that the entrainment limil (see 2.5.3) is
not exceeded. Since the inner pipe diameter is already fixed by the sampling
region, the outer pipe diameter is to be determined in this regard.
In terms of pipe thicknesses, since heat is conducted from the hot medium
into the thermosyphon through the eV<lporator wall, a thinner pipe ttansfers heat
at a higher rate. However, for reasons of safety and to exlend the life span of the
probe, one can decide on a minimum thickness that satisfies safety and endurance
criteria. Finally, the thermosyphon probe should be long enough 10 provide
sufficient space for the dissipation of heat by the vapor. In addition, one must
factor in the maximum length of the inert gas section when the probe is operating
at the highest heat extraction rate.
4.3.2 MateriaIs Selection: Following the design criteria mentioned in 4.2,
the materials for a given application are generally selected with respect 10
operating temperature anù the nature of the environments (internal and external)
of the thermosyphon probe. AIso, in any particular application other conditions
must be satisfied. In the present work, materials for the working substance, inert
gas, and container must be selected.
4.3.2.1 Working substance selection- As was mentioned in section 2.6.1,
Fig. 2.11 can be used for selection of the working substance on the basis of the
operation temperature range. As the probe is to be used in the thermal analysis of
aluminum and aluminum-silicon hypoeutectic alloys, the temperature range can be
deterrnined as follows. From the AI-Si phase diagram (Fig. 3.1), it is seen that in
aluminum with the silicon content in the range of 0-12%, the maximum melting
temperature is that of pure aluminum with a melting point of 660oe. In practice,
however, the melt is poured with a superheat of as much as lOOoe. Therefore, the
upper limit of the operating temperature lies at about 760oe. On the other hand,

• CHAPTER FOUR 74
for the thermal analysis method, once solidification of the sample is complete and
the sample temperature drops to a level below the solidus, the thermal analysis
procedure is complete. Again, according to the AI-Si phase diligram, the lowest
temperature in the hypoeutectic range is the eutectic point of 577°C. Taking into
account sorne undercooling from the eutectic point, it was decided that 550°C
would constitute the lower temperature boundary. Consequently, the temperature
range for this application is bounded between 760 and 550°C. Referring to Fig.
2.11, it is seen that both potassium and cesium can be used effectively in this
temperature range. Nevertheless, another restriction has to now be considered. The
corresponding pressures for the temperature ranges presented in Fig. 2.11 vary
from 6900 to 690000 N/m2 C 0.07 to 7 atm.).IS For reasons related to safety, the
choice between potassium and cesium requires that the preference be the substance
not exceeding 1 atm. of pressure at the maximum operating (liquid metal bath)
temperature. In other words, to prevent any kind ofexplosion danger, the pressure
inside the container must not exceed 100000 N/m2 Cl atm.) under any
circumstances. This shortens the alIowable temperature range. Thus, the decision
was made to use potassium in the thermosyphon probe used in the higher
temperature range as it is necessary to analyze liquid pure aluminum, and cesium
in the lower temperature range for analyzing hypoeutectic and eutectic aluminum
alIoys. The properties of potassium and cesium are listed in tables 4.1 and 4.2.
The temperature/pressure relationship for saturated vapors of the above materials
can be represented as:
4.1
•where a and b are constants given in Table 4.1 for a specifie vapor, Tv is in K and
Py is in N/m2•
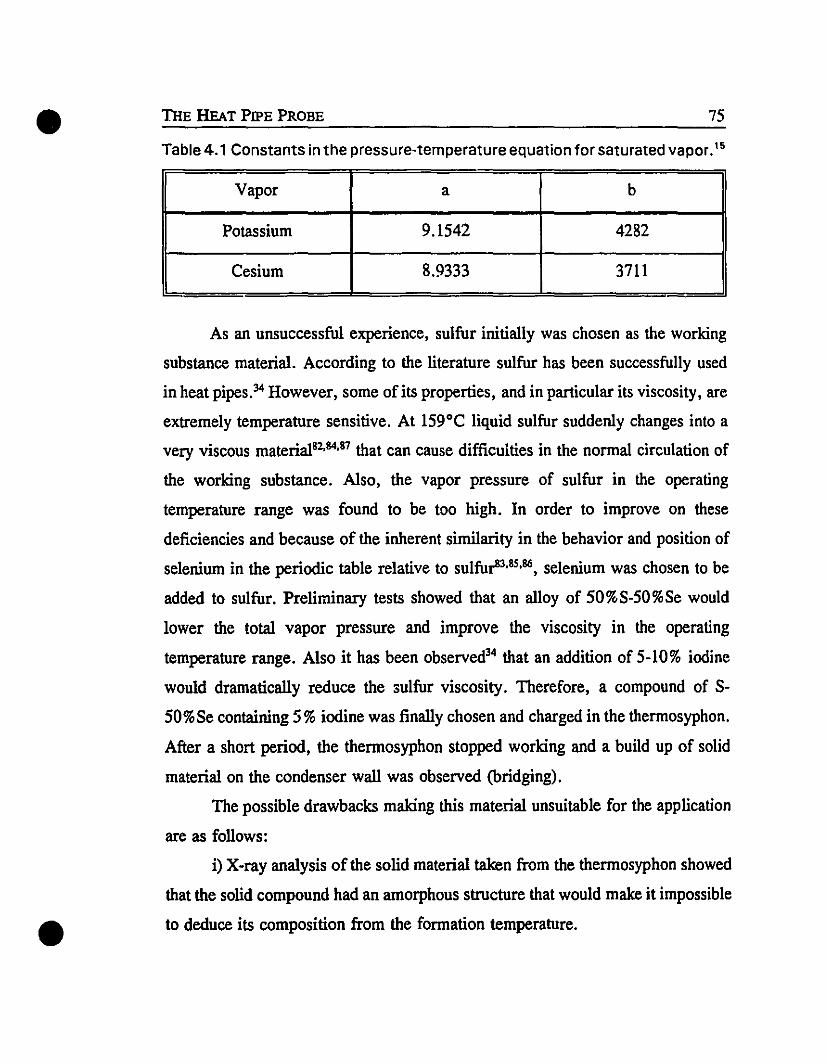
• THE BEAT PIPE PROBE 75
•
Table 4.1 Constants in the pressure-temperature equation for saturated vapor. 15
Vapor a b
Potassium 9.1542 4282
Cesium 8.9333 3711
As an unsuccessful experience, sulfur initially was chosen as the working
substance material. According to the literature sulfur has been successfully used
in heat pipeS.34 However, some ofits properties, and in particular its viscosity, are
extremely temperature sensitive. At 159°C liquid sulfur suddenly changes into a
very viscous material82•84
•87 that can cause difficulties in the normal circulation of
the working substance. AIso, the vapor pressure of sulfur in the operating
temperature range was found to be tao high. In order to improve on these
deficiencies and because of the inherent similarity in the behavior and position of
selenium in the periodic table relative to sulfu~·85.86, selenium was chosen to be
added to sulfur. Preliminary tests showed that an alloy of SO%S-50%Se would
lower the total vapor pressure and improve the viscosity in the operating
temperature range. AIso it has been observed34 that an addition of 5-10% iodine
would dramatically reduce the sulfur viscosity. Therefore, a compound of S
SO%Se containing 5 % iodine was finally chosen and charged in the thermosyphon.
After a short period, the thermosyphon stopped working and a build up of solid
material on the condenser wall was observed (bridging).
The possible drawbacks making this material unsuitable for the application
are as follows:
i) X-ray analysis of the solid material taken from the thermosyphon showed
that the solid compound had an amorphous structure that would make it impossible
to deduce its composition from the formation temperature.
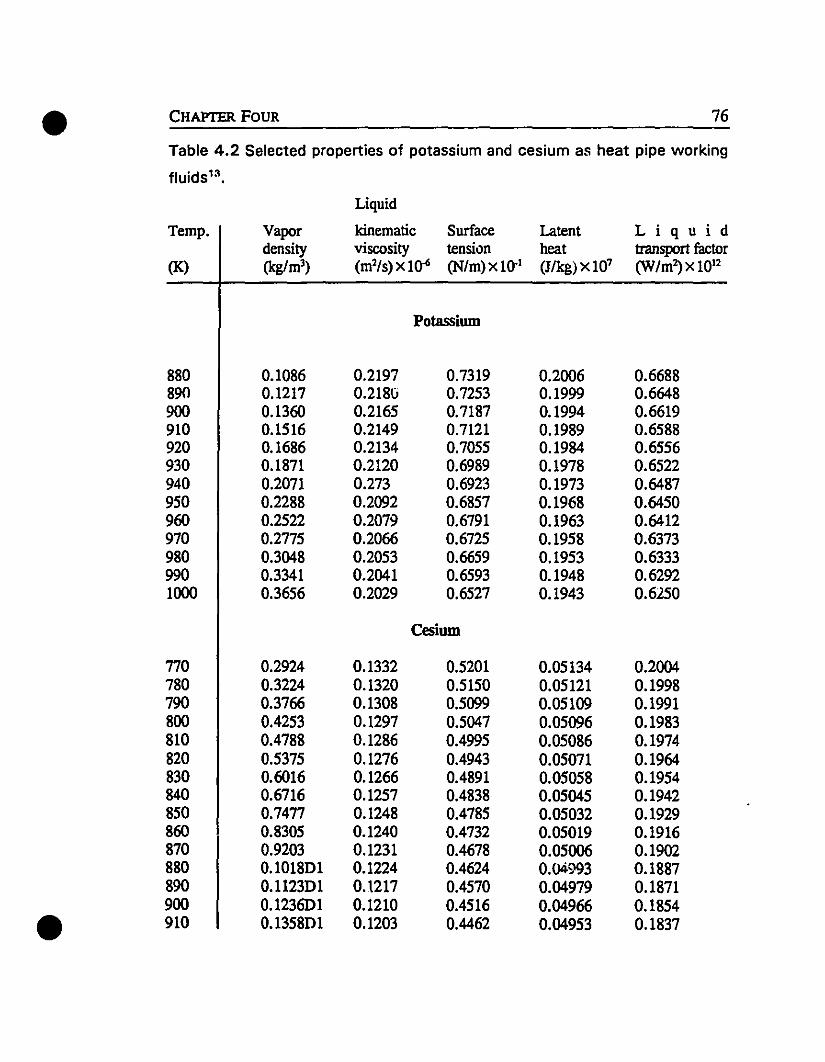
• CHAPTER FOUR 76
Table 4.2 Selected properties of potassium and cesium as heat pipe working
fluidsl~.
Temp.
(K)
Vapordensity(kg/m3)
Liquid
kinematicviscosity(m2/s)x1~
Surfacetension(N/m) x 10.1
Latentheat(JIkg)X107
Liquidtransport factor(W/m~x1012
Potassium
880 0.1086 0.2197 0.7319 0.2006 0.6688890 0.1217 0.218G 0.7253 0.1999 0.6648900 0.1360 0.2165 0.7187 0.1994 0.6619910 0.1516 0.2149 0.7121 0.1989 0.6588920 0.1686 0.2134 0.7055 0.1984 0.6556930 0.1871 0.2120 0.6989 0.1978 0.6522940 0.2071 0.273 0.6923 0.1973 0.6487950 0.2288 0.2092 0.6857 0.1968 0.6450960 0.2522 0.2079 0.6791 0.1963 0.6412970 0.2775 0.2066 0.6725 0.1958 0.6373980 0.3048 0.2053 0.6659 0.1953 0.6333990 0.3341 0.2041 0.6593 0.1948 0.62921000 0.3656 0.2029 0.6527 0.1943 0.6250
Cesium
770 0.2924 0.1332 0.5201 0.05134 0.2004780 0.3224 0.1320 0.5150 0.05121 0.1998790 0.3766 0.1308 0.5099 0.05109 0.1991800 0.4253 0.1297 0.5047 0.05096 0.1983810 0.4788 0.1286 0.4995 0.05086 0.1974820 0.5375 0.1276 0.4943 0.05071 0.1964830 0.6016 0.1266 0.4891 0.05058 0.1954840 0.6716 0.1257 0.4838 0.05045 0.1942850 0.7477 0.1248 0.4785 0.05032 0.1929860 0.8305 0.1240 0.4732 0.05019 0.1916870 0.9203 0.1231 0.4678 0.05006 0.1902880 0.101801 0.1224 0.4624 0.04993 0.1887890 0.1123D1 0.1217 0.4570 0.04979 0.1871900 0.123601 0.1210 0.4516 0.04966 0.1854• 910 0.135801 0.1203 0.4462 0.04953 0.1837
• THE BEAT PIPE PROBE 77
•
ü) The condenser temperature was too cold so that the condensed vapors on
the condeœcr wall became so cold that the liquid could not easily flow down 10
the evaporator.
ili) Due to instability of the compound at high temperatures, the composition
of fluid inventory in the evaporator would keep changing which could cause
uncertainty in the vapor pressure at the same temperature.
4.3.2.2 Inert gas selectiun-During normal operation of the thermosyphon
(Fig. 2.5 band c) inert gas and working substance vapor are separated from each
other by the convective forces of the vaporizing working substance. In other
words, the inert gas is separated and pushed up to the top of the thermosyphon by
the high velœity of the vapor (flat front). However, since the vapor velocity
decelerates from the evaporator to the vapor/gas interface, sorne inter-diffusion of
inert gas and working substance vapor is expected. On the other hand, the nature
of vapor and gas in terms of their densities has a key role on the desired separation
of gas and vapor. In fact, the gravitational body force that acts on both vapor and
gas can remarkably affect the flatness of the vapor/gas separation. If the inert gas
has a higher density than the working substance vapor, the front would not remain
flat. As gas and vapor tend to mix, sorne of the lighter vapor molecules would
move up to the inert gas section and condense there while sorne of the hcavier
molecules of the inert gas are pulled down to the bottom part of the thermosyphon.
As a result, there will he an accumulation of solidified working substance material
in the top section of the thermosyphon (Le. in those cases where working
substance is in the solid state at the temperature of the inert gas section).
Eventually, such a condition will cause the evaporator section to dry-out. If the
vapor density is higher than the inert gas density, the role of the gravitational body
force becomes less significant and a sharp vapor/gas interface (flat front) is
expected. Since the working substance selection is done according to other factors
• CHAPTER FOUR 78
•
prior to inert gas selection, one can recommend the use of heliurn iner. gas if a fiat
front is to be maintained.
4.3.2.3 Container material selection-In most cases, the choice of heat pipe
container is controlled by the environment in which the heat pipe will have to
operate53 • The general design criteria for the container material selecûon were
stated in 2.6.2. In terms of compatibility between the working substance material
and the envelope, it is reported that for potassium, stainless steel is the most
compatible material. 1&,\5,34,53,88 For the cesium case, bath titanium and stainless steel
are compatible. 15•53 011 the other hand, since the evaporator of the thcrmosyphon
probe is immersed and kept inside liquid aluminum and its alloys, this part of the
probe must either be neutral to the liquid metal or protected against liquid metal
attack. ln terms of compatibility of the probe container with the liquid metal, it
was observed that both titanium and stainless steel were dissolved in liquid
aluminum-silicon alloy to sorne extent. However, stainless steel was attacked less.
This shows that it is necessary to protect the evaporator surface against the molten
metal attack. Finally, f:-r the container, th:l optimum choices were found to be
potassium/stainless steel and cesiumfstainless steel.
In terros of evaporator linings, two aspects that are to be considered are as
follows:
i) The whole surface of the evaporator must be coated such that a natural
layer separates the stainless steel container from the hquid metal.
ü) The outer surface and the bottom of the evaporator must allow for what
is deemed to be adequate heat transfer from the liquid metal to the thermosyphon
probe. Therefore, when the probe is used in the solidification mode (Fig. 2.5 b
and c) heat will be mostly extracted from the sampling region, whereas in the
remelting mode (Fig. 2.5 a) conductance from the outer side through the working
substance and to the solidified sample will help the solidified sample to remelt

• THE HEAT PIPE PROBE 79
•
along with heat from the hot liquid bath.
Regardi!\g the first condition, boron nitride in suspension was brushed on
the surfaces chosen to be protected. Boron nitrid.: is an inexpensive coating
mat~rial widei:! used in aiuminum casting shops. Ii sticks firmly to stainless steel
and is nO( wettr.d by liquid aluminum.
Concerning item ii, a graphite block with wall thickness of about 0.01 fi
that covered the bottom and the outer surface of the evaporator was chosen to be
used. Fig 4.2 shows the evaporator of the designed thermosyphon probe.
Fig. 4.2 The cross section of the evaporator elements .

•
•
CHAPTER5
EXPERIMENTAL
5.1 introduction
As described in Chapter Four, a novel probe based on heat pipe principles
was designed for controlling the quality of aluminum casting alloys. The probe
was, in effect, a "gas-Ioaded, concentric, two phase closed thermosyphon" and
consisted of three main zones: the evaporator, the condenser and the inert gas
section. The rationale was to replace the conventional thermal analysis set-up with
the new probe in order to develop an alternative thermal analysis method especially
suitable for aluminum casting alloys.
This chapter describes sorne details of the experimental set-up including the
probe elements, sensors and peripheral equipment as weIl as the experimental
procedure.
5.2 Experimental Set-up
S.~.l Probe Elements: The three basic components of the probe were: the
container, the working substance and the linings. The container consisted of a pipt;

• EXPERIMENTAL 81
within a pipe (annulus) with plates welded at the ends to form a closed section.
There were also IWo access ports on the upper part of the outer pipe that provided
acccss to the inside of the probe. One was used to house a thermocouple which
lesided in the probe and was used to check the temperature behaviour of the
working substance during operation, and the other branch was used to make
pressure adjustments and was connected to a low pressure and a high pressure
reservoir. This branch was also used to house the pressure sensor.
Il will be recalled that material selection for the contai ner was discussed in
section 4.3.2.3, and that 304 stainless steel was found to be the optimum material
Inner pipe - 304 ss
21mm 0.d.x17mm Ld.
Outer pipe - 304 ss
60mm o.d. x55mm Ld.
•
Fig. 5.1 Dimensions and materials of the laboratoryscale thermosyphon probe container.
tested. The lance was machined and welded. The welding of the lance was an
important task and had to be done properly. Great care was taken to ensure that
the welds were both strong, and leak praof, and that the container could maintain
vacuum indefinitely.9 Il was also important to use valves and fittings on the
• CHAPTER FIVE 82
•
branches that ensure good sealing in a rather hot environrnent. Fig. 5.1 shows
schematically the laboratory scale model of the designed probe container.
Selection of the working substance material was explained in section
4.3.2.1. Potassium and cesium were selected for this application. The potassium
thennosyphon was used in higher temperature applications while the cesium one
was used in lower liquid metal bath temperatures. The practical problem associated
with these two alkaline metals was charging them into the annular probe.
Potassium is a very reactive element which has a high affinity for oxygen. In the
liquid state, it will ignite when in contact with oxygen, and explode if contacted
by water because of the generation of hydrogen gas. Botos9 experimented with a
number of methods for charging sodium, a material which behaves very much like
potassium, into the heat pipe. He found that the simplest and safest way to charge
sodium was in solid fonn. In his proposed method, sodium was cut into pieces in
an inert atmosphere (e.g. under a positive pressure of argon) where the sodium
could be manipulated. Under the same controiled environment, the sodium was
charged into the feed tube (one of the above mentioned branches) of the heat pipe.
Once the pipe was filled, it was closed by using the proper fittings and valves. The
heat pipe then was evacuated to remove any air and moisture in order to prevent
oxidation.
Because of the inherent similarity in the behaviour of sodium relative to
potassium, the above filling method was foilowed to charge potassium to the
probe. However, in the cesium case, this method was not found to be practical.
Cesium has a melting point of28°C whereas the melting point of potassium
is 6ZOC. Titus, it is difficult to have cesium in the solid state at room !emperature.
In addition, cesium is remarkably more reactive than potassium with oxygen and
any kind of moisture. Therefore, the filling has to be perfonned in a very weil
controiled atmosphere.

• EXPERIMENTAL 83
•
Cesium is usuaIly kept in sealed glass ampoules. A glove-box must be used
to successfuIly transfer the cesium into the annulus. A glove box is a sealed
chamber that has an inlet and outlet of inert gas. Any kind of manipulation inside
the box is done by gloves which are located inside the box and sealed from the
environment. The probe, a cesium ampoule, and an electric dryer were put inside
the glove box and the box was closed. Then, an inert gas inlet was opened to flush
out oxygen and moisture from the chamber. Once the inside atmosphere was
completely inert and while the inert gas was flowing into and out of the chamber,
the dryer was used to melt down cesium material inside the ampoule. When the
temperature of the liquid cesium was weil above the melting point, the ampoule
was broken and the liquid cesium was poured through one of the branches into the
annulus. The annulus, then, was closed by using fittings and valves and
pressurized by an inert gas. Once the annulus was sealed, the probe was removed
from the box and the filling process was complete.
5.2.2 Sensors: Two kinds of sensors were needed for the set-up; one was a
temperature sensor (thermocouple) and the other was a pressure sellsor (pressure
transducer) .
Thermocouples come in a wide varlety of sizes and shapes. A K type
stainless steel sheathed thermocouple (Chromel-Alumel junction) with an outer
diameter of about O.OO6m was chosen for this application.
Two thermocouples were used in the experimental set-up. One was installed
inside the thermosyphon probe and sea1ed from the environment by means of a
compression fitting. This thermocouple measured the working substance
temperature during operation. The other one was passed ail the way through the
inner pipe such that its tip was located in the centre of the sampling region. It was
with this thermocouple that the thermal behaviour of the sample during each

experiment was controlled and the cooling curve was produced.
A pressure transducer was connected to the system that measured the
chamber pressure. Pressure transducers employa strain gauge situated in front of
a pressure sensitive diaphragm. When the diaphragm is compressed by a pressure
change, it changes the resistance in the Wheatstone bridge arrangement within the
strain gauge. The pressure transducer was connected to a power supply and aJong
with the thermocouples to a data acquisition system. The readings from the
pr~ssure transducer were calibrated according to a simple equation in the data
acquisition system.
• CHAPTER FIVE 84
•
5.2.3 Peripheral Equipment:ln the routine operation of a laboratory scale
thermosyphon probe, a number of pieces of peripheral equipment must also be
Fig. 5.2 The probe positioning inside the Iiquid metal bath.

• EXPERIMENTAL 85
'ISOO. A holder was necessary to maintain the evaporator of the probe insidc the
liquid metal bath. The holder must be able to move the probe up and down in
order to position the probe at the right location in the liquid metal bath. Fig. 5.2
shows the probe held in position. The pressure inside the probe was adjusted by
means of a vacuum pump, a vacuum stabilizer tank, and a high pressure inert gas
tank. The vacuum pump pro",.idOO the desirOO vacuum to the stabilizer tank and the
probe chamber, once the probe was in solidification mode. Also, the vacuum
_---?G)~1~ ---, CD ThermocoUlJlelnside the pipe
CV ®Thermocouplelnslde thellquid AI
CD Pressure lransduc...•NcrrlUSCALt
Condonsor..~e"~ EYaporaoroC
~
Fig. 5.3 The experimental set-up.
•
stabilizer provided a larger evacuated volume connectOO to the probe so that small
changes of pressure during vaporization/condensation did not effectively change
the vacuum inside the probe while in solidification mode. Thus, a relatively
constant heat transfer rute across the wal1s of the thermosyphon necessary for the
sake of reproducibility of the cooling curves was ensurOO. The high pressure tank
was equipped with a pressure regulator to al10w adjustment for the inert gas
•
•
CHAPTER FIVE
pressure in the chamber at a maximum of one atmosphere. Fig. 5.3 depicts a
schematic of the experimental set-up.
In terms of data logging, a data acquisition card instal1ed in a PC along with
propcr software was employed. Raw data signais in the form of millivolts were
delivered to the data acquisition system from the thermocouples and the pressure
transducer. In the thermocouple case, the compensation voltage was added to the
raw signais, and eventual1y the real temperature was calculated. In the case of
pressure signais, the correlation between voltage and pressure, whieh had already
been introduced to the system, was applied and the pressure in atmospheres was
calculated. These data were managed simultaneously in three ways during the test.
First they were stored in the computer memory for further investigation. Secondly
they could be displayed as transient curves and, final1y they might be displayed as
numbers on the screen.
Fig. 5.4 The data acquisition monitor during a routine test.
• EXPERIMENTAL 87
•
Fig. 5,4 shows the monitor of the data acquisition system during a test. As
seen, the ongoing cooling curve plus simultaneous working substance temperature
and pressure readings are displayed.
The liquid metal was prepared in an electric resistance fumace. The ladle
capacity was about 10 kg of which about 0.3% fills the sampling region. The
fumace was equipped with an electric temperal.ure on/off controller to keep the
liquid metal bath temperature (relatively) constant during operation.
5.3 Experimental Procedure
The experimental procedure was divided into Iwo periods; the cooling or
solidification period and the heating or remelting period. However, since this was
a liquid metal thermosyphon for use at relatively high temperatures, there was a
start-up procedure from the frozen state.
At room temperature, the working substance was in the solid state, whereas
during the routine operation of the probe it existed as liquid and vapour phases.
According to the literature89•90 the heat must he loaded to the evaporator graduaIly.
Also, a small amount of heat input at the condenser and low heat rejection from
the condenser helps start-up.
In the frozen state, the probe was kept in an inert gas atmosphere Le. the
probe was evacuated and the chamber filled with an inert gas. When the liquid
metal was ready, the probe was held above the liquid bath to be preheated. Then,
it was lowered down gradually into the liquid metal. This caused the liquid metal
bath temperature to decrease. Since the pressure of the inert gas inside the probe
was kept at one atmosphere, there was aImost no heat dissipation by the probe
during the start-up process. The probe was ready for the experiment when the
liquid bath temperature increased to the set temperature on the fumace controller

• CHAPTERFNE
and the evaporator core was thennally equilibrated with the melt.
88
•
5.3.1 Cooling (Solidification): A thennal analysis test was started with the
probe in the pressurized state (Fig. 2.5a). A vacuum pump was used to evacuate
inert gas from the probe through the pressure stabilizer tank. Depending on the
desired cooling rate for the sample, the appropriate pressure of inert gas was left
in the probe. For instance, if a high cooling rate was required, the vacuum pump
was allowed to evacuate the probe until the inside pressure dropped down to a
certain pressure (vacuum), depending on the nature of the working substance. In
this case, the working substance experienced a greater evaporation rate which
resulted in the activation of a longer length of condenser (Fig. 2.5c). Since the
temperature and pressure of the working substance were correlated by the
Clausius-Clapeyron equation (Bq. 4.1), it followed that an increase in the heat flux
extracted by the evaporator section was the result of a lower pressure setting.
Conversely, when a higher pressure was applied to the probe's chamber, less
evaporation occurred and a shorter condenser length was used to reject heat from
the system (Fig. 2.5b). Consequently, by having an inert gas lmd a vacuum pump
hooked up to the system, a wide range of cooling rates could be achieved.
5.3.2 Heating (Remelting): Once the sample temperature reached the
desired temperature and solidification of the button-shaped sample was complete,
the resultant cooling curve was drawn, and the probe was instructed to remelt the
unseen sample. In this case, the valve connecting the probe to the pressure
stabilizer was closed and the probe was connected to the inert gas tank. The outlet
of the pressure regulator on the gas tank was set to one atmosphere to fil1 the
evacuated probe to about one atmosphere. The inert gas then impeded the
movement of the working substance vapour to the portion of the condenser that it
• EXPERIMENTAL 89
•
occupied and acted as a diffusion barrier to the flowing vapeur. The active length
of the condenser was reduced to the working substance pool level in the
evaporator, and heat transfer from the probe was blocked (Fig. 2.5a). At this point
the solidified button gained energy from the hot liquid bath directly and also
through the graphite block covering the outer evaporator surface. Eventually, the
sample was remelted and the probe was ready for the next thermal analysis test.

•
•
cllAP'J'}3ltfi
MODELLING HEAT TRANSFER
6.1 Introduction
In order to better understand both the regular operation of the heat pipe and
the freezing of the solidifying sample by the heat pipe probe, a mathematical
approach was found to be necessary. A mathematica1 model which inc1udes the
heat transfer governing equations cao he of benefit in the understanding of the
process and cao lead to better designs.
In the current chapter, two mathematical models will be presented; one is
HEATPIPE which incorporates the heat pipe operating parameters regardless of
the defined task for the heat pipe, and the other is SOLIDIFICATION which
models the freezing of the button shaped sample taken by the heat pipe probe.
The heat pipe model was initially developed to simulate the heat pipe
injection lance used in copper smeltingS2• However, this simulator was also used
successfully for the present application, since the same heat transfer fundamentals
govern both the heat pipe injection lance and this heat pipe solidification probe.
The solidification model written from first principles, is a two dimensional
heat transfer FORTRAN program. This model uses the boundary conditions
computed by HEATPIPE to predict the temperature and heat transfer behaviour
• MODELLlNG BEAT TRANSFER
of the freezing cylindrica1 samp1e with time.
6.2 Beat Transfer Model of the Beat Pipt! Probe
91
•
HEATPIPE 1.OS2 is a control volume, finite difference software simulation
package created to model the steady state behaviour of annular reflux
thermosyphon injection lances. HEATPIPE 1.0 which employs a flat-front (see
4.3.2.2) mode1 has been used at the McGiIl Metals Processing Centre in the design
and analysis of heat pipes. HEATPIPE 1.0 has been written in FORTRAN for
MS-DOS PCs.
Users ofHEATPIPE 1.0 employa graphica1 user interface in order to input
data pertaining to the pipe, working substance and boundary conditions. The model
includes 57 unknowns which are ca1culated iteratively using the Newton-Raphe~on
method. Model results are presented graphically to the user following the
successful completion of a simulation.
6.2.1 Model Construction:
6.2.1.1 Nodes-Vertically, the pipe is sectioned into 6 discrete areas. The
inert gas section contains no nodes because it is assumed that negligible heat
transfer takes place in this zone. As is the case with the condenser section, the
length of the inert gas section is not known prior to execution of the model. In a
gas loaded thermosyphon, the position of the gas/vapour front (and, thus, the
lengths of the inert gas and condenser sections) is an unknown parameter.
Vertically, the condenser c.Jntains 3 nodal slices, the adiabatic section l, and the
evaporator section contains 2. The lengths of both evaporator and adiabatic
sections are known. Figs. 6.1 and 6.2 show the allocation of nodes in the

Temperature Nodesof the Bottom of the Pipe
Tb.c
• CHAPTER SIX
--"-r"-IlgJI
L _ __ ]"
'.T----- J
a
L -- l1.
~J
Inert Gas sectionoNodal Rings
Condenser Section3 Nodal Rings
Adlabatlc Sectionl Nodal Ring
Evaporator section2 Nodal Rings
92
•
TlpAree
Fig. 6.1 Vertical sections and allocation of nodes in the HEATPIPE model•

• MODELLING HEAT TRA!';SFEP. 93
Tws
InnerPlpe
Outer Pipe
Protectlve Coating
Fig. 6.2 Cross section of a nodal ring in the HEATPIPE model.
••
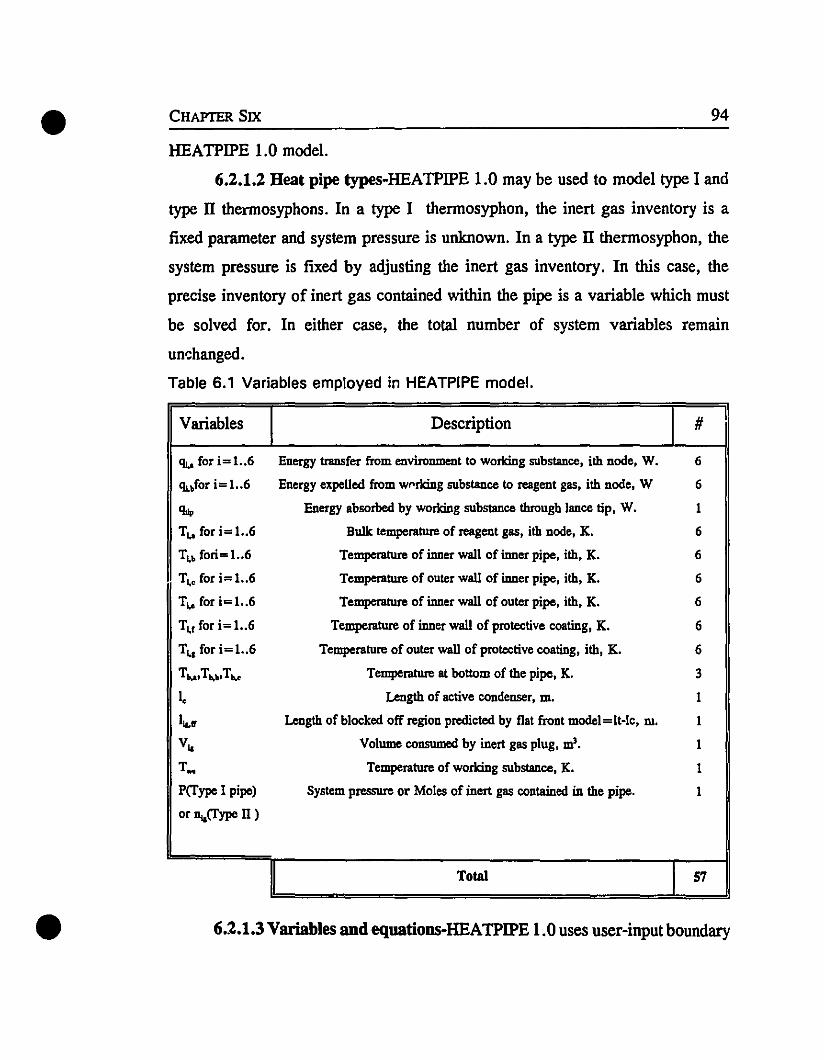
• CHAPTER SIX 94
•
HEATPIPE 1.0 model.
6.2.1.2 Beat pipe types-HEATPIPE 1.0 may be used to model type 1and
type II thermosyphons. In a type 1 thermosyphon, the inert gas inventory is a
fixed parameter and system pressure is unknown. In a type II thermosyphon. the
system pressure is fixed by adjusting the inert gas inventory. In this case. the
precise inventory of inert gas contained within the pipe is a variable which must
be solved for. In either case. the total number of system variables remain
um:hanged.
Table 6.1 Variables employed in HEATPIPE model.
Variables Description #
'It,. for i= 1••6 Energy transfer from environment to worlcing substance. ith Dode, W. 6
'IJ..fori= 1..6 Energy expeUed from w"rlcing substance la reagent gas. ith Dode, W 6
'!tJp Energy absorbed by worlcing substance through lance tip, W. 1
T... for i=1..6 Bulk temperature of reagent gas, ith Dode, K. 6
T,. fori= 1..6 Temperature of inner wall of inner pipe, ith. K. 6
T" for i=I..6 Temperature of outer wall of inner pipe, ith. K. 6
T... for i=1..6 Temperature of inner wall of outer pipe, ith. K. 6
T" for i=1..6 Temperature of inner wall of protective coating, K. 6
T,a for i= 1..6 Temperature of outer wall of protective coating, ith, K. 6
T.....T...,T... Temperature at bollom of the pipe. K. 3
l, Length of active condenser, m. 1
1,.,« Length of blocked off region predicted by flat front model=lt-lc. m. 1
V" Volume consumed by inert gas plug, m'. 1
TM Temperature of worlcing substance, K. 1
P(Type 1 pipe) System pressure or Moles of inert gas contained in the pipe. 1
or~(Type n)
Total 57
6.2.1.3 Variables and equations-HEATPIPE 1.0 uses user-input boundary

• MODELLING HEAT TRANSFER 95
•
conditions and material properties to solve a system of 57 equations and 57
urJmowns.The unknowns are listed in Table 6.1.
Table 6.2 lists the equations used to solve for the variables listed in Table
6.1. Equations 6.2, 6.3 and 6.6 represent the forms for steady 1-0 radial
conduction heat transfer for a circular cross section. Equations 6.1 and 6.8
represent the forms for steady 1-0 r.tdiative and convective heat transfer to an
exposed surface. Equations 6.4,6.5,6.7 and 6.11 represent the heat flow from a
surface to a fluid by a purely convective mechanism. Equations 6.9 and 6.10
represent the conduction equation for a 1-0 Cartesian system. Equation 6.12
represents the energy balance on the reagent gas with two terms: one representing
the temperature increase in the gas, the other representing the loss of energy dur;
to depressurization of the gas stream. Equation 6.13 represents the global energy
balance on the working fluid. Equation 6.14 represents the relation between
pressure and temperature which exists for a given working substance. Equations
6.15 and 6.16 represent geometric identities. Equation 6.17 is the equation of state
for an ideal gas.
6.2.2 Input: HEATPIPE 1.0 solves the steady-state representation of a
thermosyphon using user-input parameters. Figs 6.3, 6.4, 6.5 and 6.6 illustrate,
respectively, the main menu screen, the working substance screen, the boundary
condition screen and the pipe configuration screen for the simulation of a Type II,
laboratory scale, thermosyphon probe for thermal analysis of aluminum casting
alloys.
As pointed out earlier, HEATPIPE 1.0 was initially developed for a
thermosyphon injection lance applicable in copper smelting. In order to apply the
package to the solidification probe, the appropriate boundary conditions are to be
entered. Fig. 6.5 depicts the boundary condition screen. Since no reagent gas

• CHAPTER SIX
Table 6.2 Equations employed in HEATPIPE model.
96
•
Description Equation #
q from environment 'Ii.•=2.n.r;,.h;..,,(T•.r T,.,) + PEP.~•.i-T\,) Eq.6.1 6
q through outer coaling 'Ii,.=2.n.~.k".!n[r;ir;.ll • (Ti.,-T;'I) Eq.6.2 6_.q through outer pipe ahell 'Ii,.=2.n.~.k..!n[rdr;.J . (T;.rT;.J Eq.6.3 6
q from outer pipe sbell la 'Ii, =2.n.r· .~.h; (T. r T.,.) Eq.6.4 6• loe..... l,
working substance
q from outer pipe sheU la 'li,b=2.lt.r,·4·h;.n(Tn-T,.J Eq.6.5 6
working lubstance, Dode i
q lhrough inner pipe sheU 'h.b=2.lt.4.k,.ln[r,lr"J . (TI~-TI.,) Eq.6.6 6
q inla reagent gas 'li,b= 2.n. rb.1;.1's..(T;.b·Ti.'> Eq. 6.7 6
q la the lance tip 'Itip=hooaom.Aoouom(Tcnv,tipTb,J+PEF.~CllV,tiprb,J Eq.6.8 1
q through outer coaling, q tip = k,,·Aoouom·(Tb,.-Tb.bJ/lc Eq.6.9 1
lance tip
q through outer coaling, q tip = k,,·Aoouom·(Tb,b-Tb,'>/t. Eq.6.10 1
lance tip
q from outer pipe sheU la CLip= h,;,.......At..a..,.(Tb.,-T.,.} Eq.6.11 1 Il
working substance, lance tip
Reagent gas heat accum. 'li,b= ProV,.As·c;....·(T;..-TI-I.J-V,.As.(dP.../dz) Eq.6.12 6
Working substance q balance CLip+ I('Ii,."'Ii,tJ= 0 Eq.6.13 1
Clausius.Clapeyron !n( P/IOI.3 X103) = (afr.,.)+ b Eq.6.14 1
Length conservation !;,.rr + 1" = 1, Eq.6.15 1
IG lenglh/volume ratio V;, = n (flril.> . l;,.ff Eq.6.16 1
Ideal gas law P.".V;, = n;,.R.T;, Eq.6.17 1
Total 57
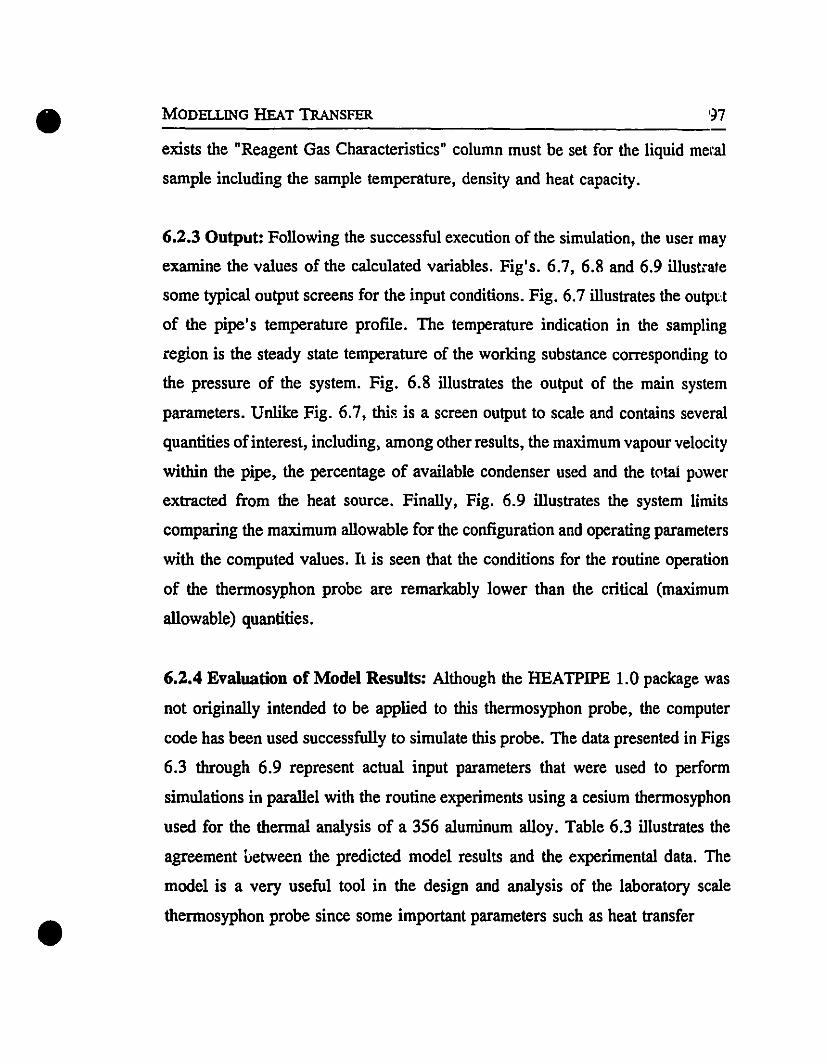
•
•
MODELLING BEAT TRANSFER
exists the "Reagent Gas Characteristics" column must be set for the liquid meral
sample inc1uding the sample temperature, density and heat capacity.
6.2.3 Output: Following the successful execution of the simulation, the user may
examine the values of the calculated variables. Fig's. 6.7, 6.8 and 6.9 illustrate
sorne typica1 output screens for the input conditions. Fig. 6.7 illustrates the outpt'!
of the pipe's temperature profile. The temperature indication in the sampling
region is the steady state temperature of the working substance corresponding to
the pressure of the system. Fig. 6.8 illustrates the output of the main system
parameters. Unlike Fig. 6.7, thi~ is a screen output to scale and contains severa1
quantities ofinterest, inc1uding, among other results, the maximum vapour velocity
within the pipe, the percentage of available condenser used and the tC'ta1 power
extracted from the heat source. Finally, Fig. 6.9 illustrates the system limits
comparing the maximum allowable for the configuration and operating parameters
with the computed values. Il is seen that the conditions for the routine operation
of the thermosyphon probe are remarkably lower than the critical (maximum
allowable) quantities.
6.2.4 Evaluation of Model Results: Although the HEATPIPE 1.0 package was
not originally intended to be applied to this thermosyphon probe, the computer
code has been used successfully to simulate this probe. The data presented in Figs
6.3 through 6.9 represent actual input parameters that were used to perform
simulations in parallel with the routine experiments using a cesium thermosyphon
used for the thermal analysis of a 356 aluminum alloy. Table 6.3 illustrates the
agreement between the predicted model results and the experimental data. The
model is a very useful tool in the design and analysis of the laboratory scale
thermosyphon probe since sorne important parameters such as heat transfer

• CHAPTER SIX 98
•
Fig. 6.3 Main menu screen for HEATPIPE 1.0
Fig. 6.4 Worklng substance screen for HEATPIPE 1.0
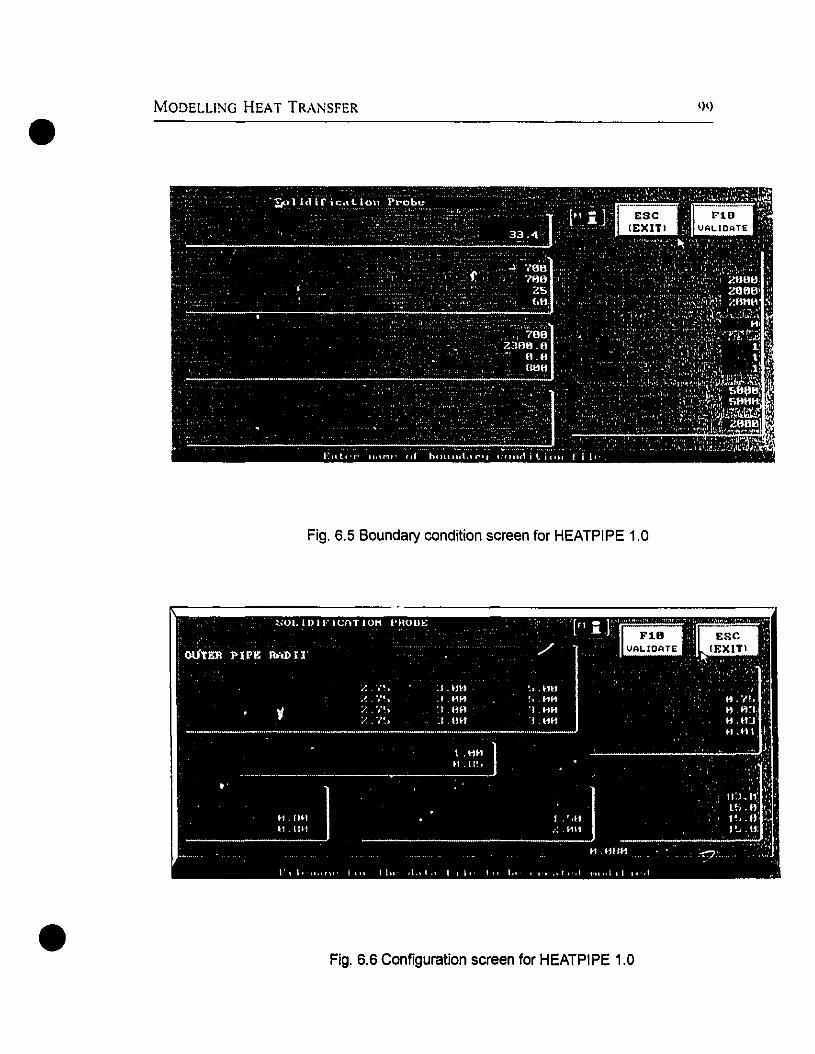
• MODELLING HEAT TRAN5FER 99
•
Fig. 6.5 Boundary condition sereen for HEATPIPE 1.0
Fig. 6.6 Configuration sereen for HEATPIPE 1.0
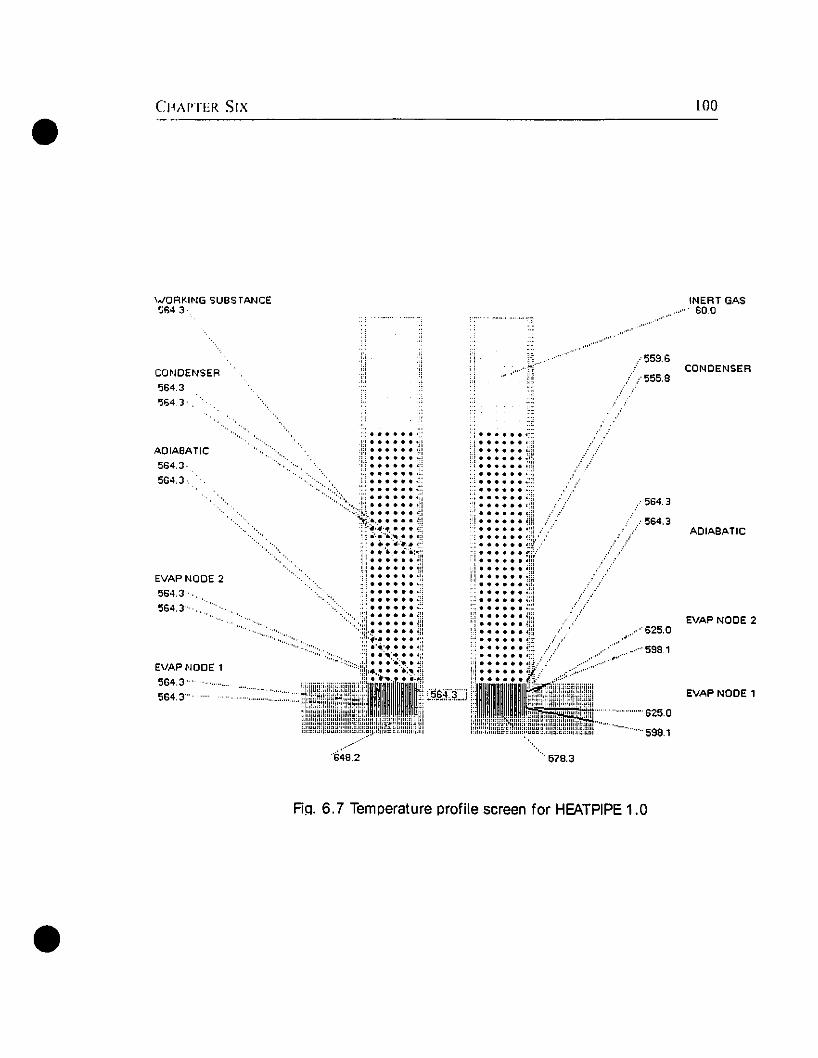
• CHA l'TER SIX 100
\A!ORI'.ING suas TANCE'5643·
INERT GAS600
.,....... ', ......
......ADIA8ATIC
EVAP NODE 1
EVAP NODE 2
CONDENSER
·....·......·.. 599.1
.. .' 625.0.~.,.
.....5981.,. .....
................-. 625.0
559.6
555.8
564.3
564.3
....
.,t'••.........;.....
578.3
............'648.2
,.: ';: ., .::: •••••• ~iI ••••••:i:·.·.·.~: ., ••••••::: •••••• ~: ,:! ••••••Il •••••• ,'' " ••••••
" . ::: :: .: .....>..... :i •••••• ~': ::: ••••••
. .. -: ~:: ::: ...:::: ',. ;:; .:;; :; .
····:::4\:::.,::::: li[ ;'1:::::::::''iI!.~...... ~:: ..••••••"j .'.~ "':;'.' • 'ii ! ••••••
. • 4 .•,,. ,.. ": ••••••
:;:; .. ' ' .'.. :~;; ;; .:::······~:f " .\:1·······:: il······,,: •••••••!: u······. . .. : ; ; .
",.:::. ". • ••••••!; ": ••••••.: " :.. : .".::->. •••••• .::: .••••••
. '.::: •••••••:g !'i •••••• ·mi". ',::: •••••• !1I ": •••••• J:::
'''''••••••• i U ~,\ •••••• ·:u:~i~.~ .• •••• ~~~ ...•••••••..,.:.; "! :: •••••• (' ..
~:: :::;::,;~,l : :':::;;.: ~i ..•••• '::: ... '::!':"::. :'::;:1 ;! :: ::::$>
~! ~.~~~,::~'~J ::..........
CONDENSER
564.3'364.3"
EVAP NODE 1
564.3564.3'"
EVAPNQOE :2564.3
~64.3 ...:""
AOIABATlC
564,J·
5G4.3·.
Rq. 6.7 Temperature profile screen for HEATPIPE 1.0
•

CERAMIC
"" .-"" METAL SHELL
It-iERTGAS
REAGEt~T(3A5
WQRI<,rHG SUSST...\NCt:::: (EV.... t-')
..... WORKING SIJSSTAHCE
• MODELLING HEAT TRANS FER
RACIAl. STRETCH FACTOR IN THIS GRAPHie
;:
MOLE':! OF INERT lJ""S \.. 10001 ..
tu l..UAOINU "'HI:. S-,UHI:; 1...... t ..I.1 ..
CONOENSER LENOTH (m.'.u)"
SYSTEM PRESSURE IP ...<, ..I.\ ..
MA',IMUM VAPOF=l 3PEEO {lIYII"
"OF AVAlLA9LE CONDENSER USEO
"OF HEAT REC",'CLI::O
TOTALWI\TT~E~TRACTEO
PIDG' ConllQUIJIUon SOLIDIFleATiON PROUE
rncss c:t~TCR TC! E <.IT
LEGEHD
~,J)
.,33"000('1
].:;..~H 49
1() 1
•
Fig. 6.8 System parameter screen for HEATPIPE 1.0
Fig. 6.9 System Iimits screen for HEATPIPE 1.0

•CHAPI'ER SIX
coefficients can he evaluated.
Table 6.3 Results from experimental data and computed simulation.
Experimental HEATPIPE Error
data 1.0 %
Sample temperature 566°C 564.3°C
839K 837.3K 0.2
% of condenser used 75.3 68.5 9.9
Outside condenser wall temperature 568°C 555.8°C
841K 828.8K 1.5
6.3 Beat Traosfer Model of Solidification
102
6.3.1 Model Construction: To provide a general mathematical view of
...•..- .(" )1.> '" ." j;i l1 .1 l• ,i!,' ,.' ..-....... l(., ,.\" /
,.'.................Idenlical planes
•A B
Fig. 6.10 Geometry and configuration of the sample•
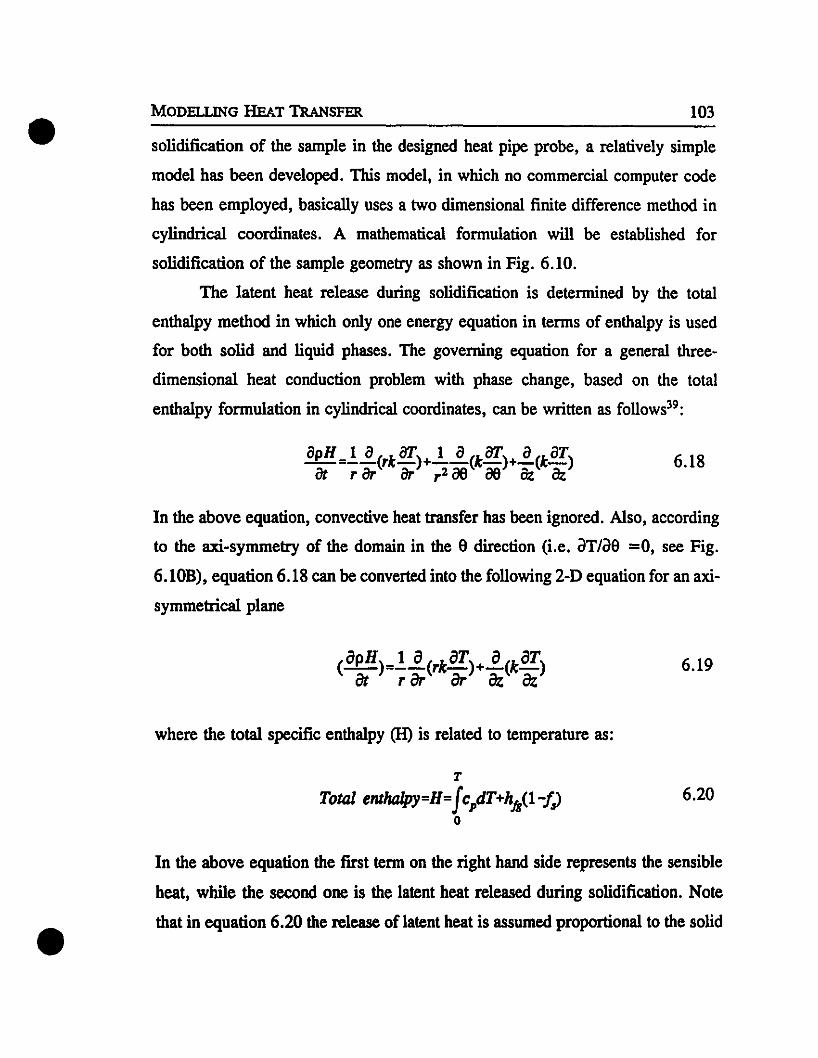
solidification of the sarnple in the designed heat pipe probe, a relatively simple
model has been developed. Tlùs model, in which no commercial computer code
has been employed, basically uses a two dimensional finite difference method in
cylindrical coordinates. A mathematical formulation will he established for
solidification of the sarnple geometry as shown in Fig. 6.10.
The latent heat release during solidification is determined by the total
enthalpy method in which only one energy equation in terms of enthalpy is used
for both solid and liquid phases. The governing equation for a general three
dimensional heat conduction problem with phase change, based on the total
enthalpy formulation in cylindrical coordinates, can be written as follows39 :
• MODELLING BEAT TRANSFER
opH 1 0 (fI' 1 0 oT 0 CT-=--(rk-)+--(k-)+-(k-)éJt r fJr fJr r 2 ae ae Oz Oz
103
6.18
In the above equation, convective heat transfer has been ignored. Also, according
to the axi-symmetry of the domain in the S direction (i.e. aTlaS =0, see Fig.
6.10B), equation 6.18 can he converted into the following 2-D equation for an axi
symmetrical plane
where the total specific enthalpy (li) is related to temperature as:
T
Total ent1ullpy=H"fc,dT+hf,(l-f)o
6.19
6.20
•In the above equation the first term on the right hand side represents the sensible
heat, while the second one is the latent heat released during solidification. Note
that in equation 6.20 the release oflatent heat is assumed proportional to the solid

• CHAPTERSIX 104
fraction (f,) in the samp1e. A linear relationship between the solid fraction and the
sample temperature that assumes linear release of latent heat between the liquidus
temperature, Tb and the solidus temperature, TlOb has also been assumed. This
relationship yields;
T-TJ._-=-'=
T,-T"",6.21
6.3.2 Initial and Boundary Conditions: Using the symmetry at the centre line of
the domain, the energy equation is solved for half of the axi-symmetrical plane as
shown in Fig 6.1l.
The initial conditions for the solution of equation 6.19 are: Hcr,z)=Hbalhand
TCr.z)=TbaIh, where Hbalh is the total enthalpy of the liquid bath in the sampling
5ymmelryUne
z
•
Fig. 6.11 Schematic of the computational domain.
regicn. In terms of boundary conditions, due to 10n51tudinal symmetry, (see Figs
6.10 and 6.11) the equation can he solved for half of the domain according to the
following boundary conditions:
1. The sample bottom temperature is always kept at the bath temperature.
2. The free surface of the sample is exposed to a hot environment.

• MODELLING HEAT TRANSFER 105
Radiative cooling is assumed from the solidifying sample to the environment with
the approximate temperature equal to the working substance temperature
(corresponding to its pressure).
3. The thermosyphon wall in contact with the solidifying sample affects the
working substance temperature inside the pipe. Therefore, from the P-T correlation
for a given working substance material, (e. g. cesium), the temperature inside the
pipe is known. Thus, heat is conducted through the thickness of the pipe wall
providing a known temperature in contact with the sample.
6.3.3 Numerical Solution Techniques: In this model a "finite difference" enthalpy
method, using a control volume approach for the formulation of discretized
equations, was employed. The explicit scheme was chosen to handle the discretized
equations. A typical control volume is shown in Fig. 6.12. For the grid point P,
points S and N (denoting south and north) are its z direction neighbours, while E
N
•
•
•Fig. 6.12 A typical control volume for 2-D situation.
and W (denoting east and west) are its r direction neighbours. The control volume
is shown by the dashed perimeter line; its depth in the e direction is assumed to
he unity.
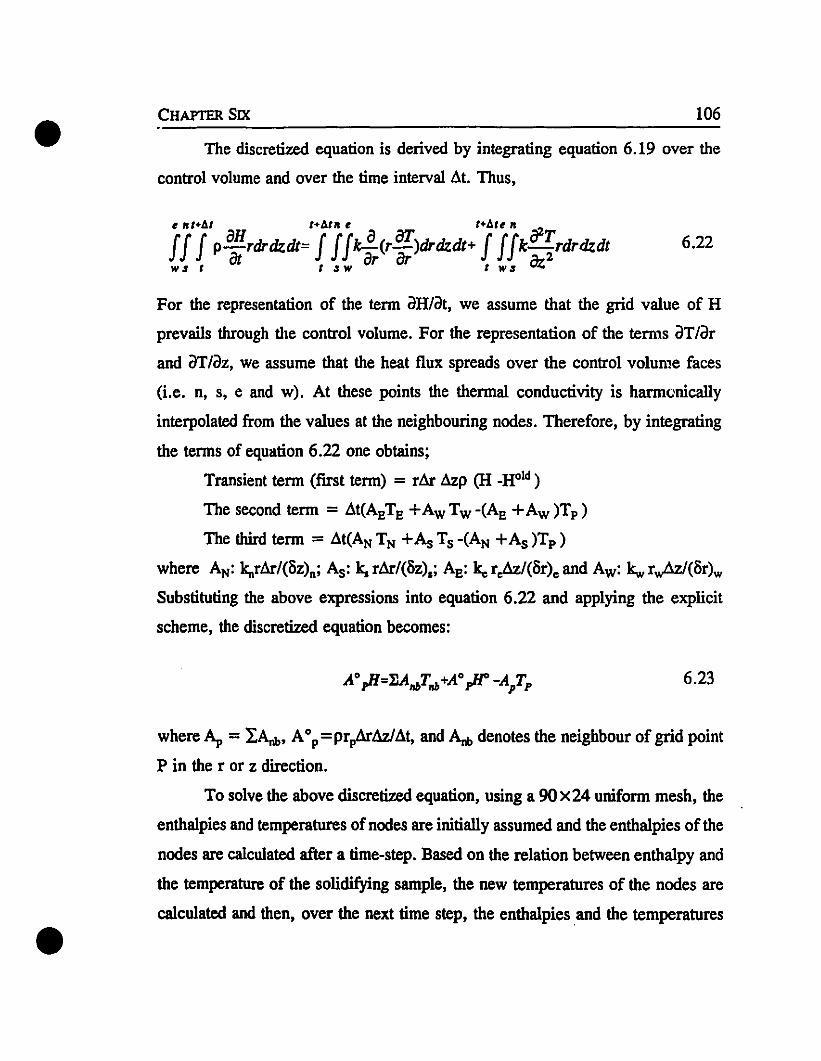
The discretized equation is derived by integrating equation 6.19 over the
control volume and over the time interval 6t. Thus,• CHAPTER SIX 106
• nt+tu 1+A.t1l e t+4te ,.
JJ Jp aHrdrdzdt=JJJ~(ra:)drdzdt+ JJJkaz~rdrdzdt 6.22W8 t at t 8 W ar t W8 az
For the representation of the term aH/at, we assume that the grid value of H
prevails through the control volume. For the representation of the temls aT/ar
and aT/az, we assume that the heat flux spreads over the control volume faces
(Le. n, s, e and w). At these points the thermal conductivity is harm<:.'nically
interpolated from the values at the neighbouring nodes. Therefore, by integrating
the terms of equation 6.22 one obtains;
Transient term (first term) = rM 6zp (H _Hald )
The second term = 6t(ABTB+ Aw Tw -(AB + Aw )Tp )
The third term = 6t(ANTN +As Ts -(AN +As )Tp )
where AN: k"rM/(ÔZ)n; As: le. rM/(Ôz).; AB: k" r,jiz/(ôr)c and Aw: kw rvJ.z/(Ôr)w
Substituting the above expressions into equation 6.22 and applying the explicit
scheme, the discretized equation becomes:
6.23
•
where Ap =IAm" A0p=prp6zl6t, and Am denotes the neighbour of grid point
P in the r or z direction.
To solve the above discretized equation, using a 9Ox24 uniform mesh, the
enthalpies and temperatures of nodes are initially assumed and the enthalpies of the
nodes are calculated after a time-step. Based on the relation between enthalpy and
the temperature of the solidifying sample, the new temperatures of the nodes are
calculated and then, over the next time step, the enthalpies .and the temperatures

• MODELLING HEAT TRANSFER 107
•
of nodes are recalculated, and so on. The initial values of thermophysical
properties are given in a separate subroutine for the liquid metal at bath
temperature. The physical properties are then updated after each time step.
6.3.4 Solution Procedure: The solution procedure for the solidification model is
shown on the flow chart in Fig. 6.13. As seen, execution of the program is
initiated with a number of input data. Input data inc1ude the specifications of the
ailoy being used such as liquidus temperature, solidus (eutectic) temperature, latent
heat of fusion, sample density, thermal conductivity, and heat capacity. Another
set of input data is the pressure inside the pipe (determines the cooling rate), bath
temperature, and time increments. The heat contents for these known temperatures
are calculated according to the corresponding temperatures and remain as input
data.
In the grid design step, the grids are drawn unifonnly. Since this is a
solidification program, the initial conditions are set for the liquid state at the bath
temperature. The coefficients of equation 6.23 and the boundary conditions are
detennined with respect to the temperature situation in separate subroutines
attached to the program. Having ail the requirements, the discretized equation (Bq.
6.23) is then solved and a new H (heat content of the sample) is determined. A
new corresponding temperature is then calculated from the new heat content and
the result is saved in the output file. In the next step, the initial conditions of heat
content and temperature are replaced with newly computed values, and the
properties including density, thermal capacity, and thermal conductivity are
updated with respect to the new temperature. The program, then, starts over again
from the time increment addition and this loop is executed altematively until the
required time is reached.
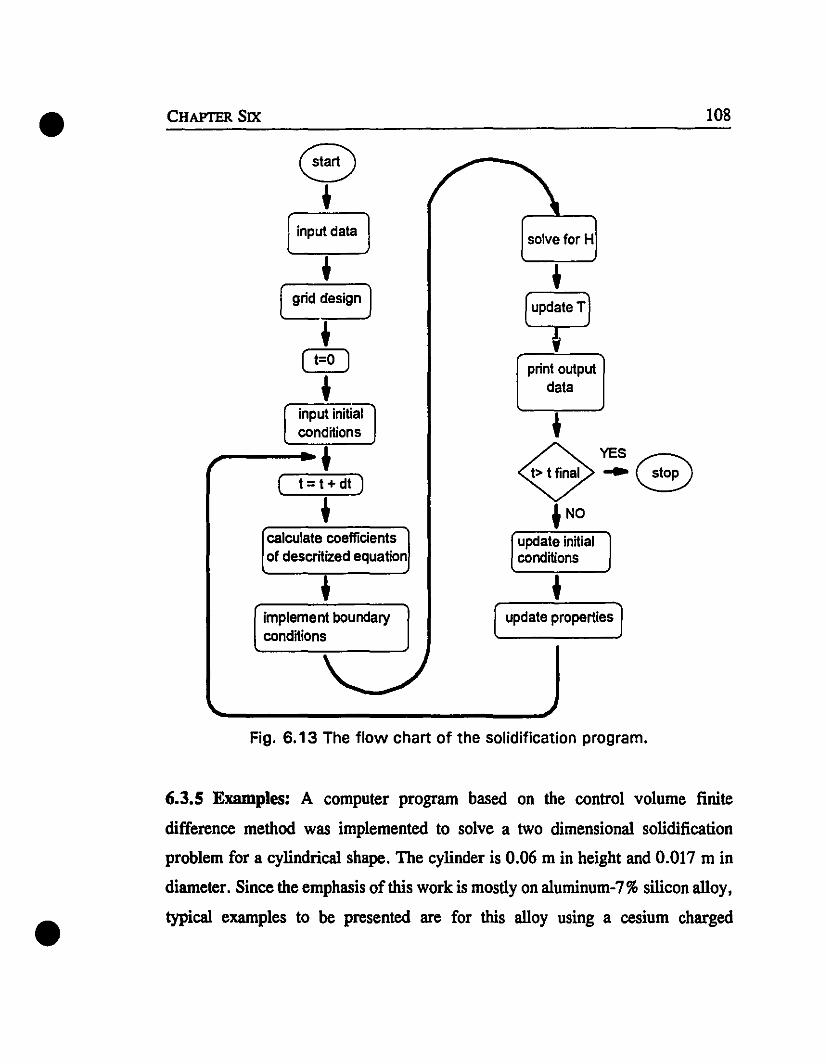
• CHAPTER SIX 108
Edesign 1
+[ t=o )
+input initialconditions
( t=t+dt)
+calculate coefficientsofdesan~edequation
implement boundaryconditions
solve for H
+
~print output
data
update initialconditions
update properties
•
Fig. 6.13 The flow chart of the solidification program.
6.3.5 Examples: A computer program based on the control volume finite
difference method was implemented to solve a two dimensional solidification
problem for a cylindrical shape. The cylinder is 0.06 m in height and 0.017 m in
diameter. Since the emphasis of this work is mostly on aluminum-7%silicon alloy,
typical examples to he presented are for this alloy using a cesium charged
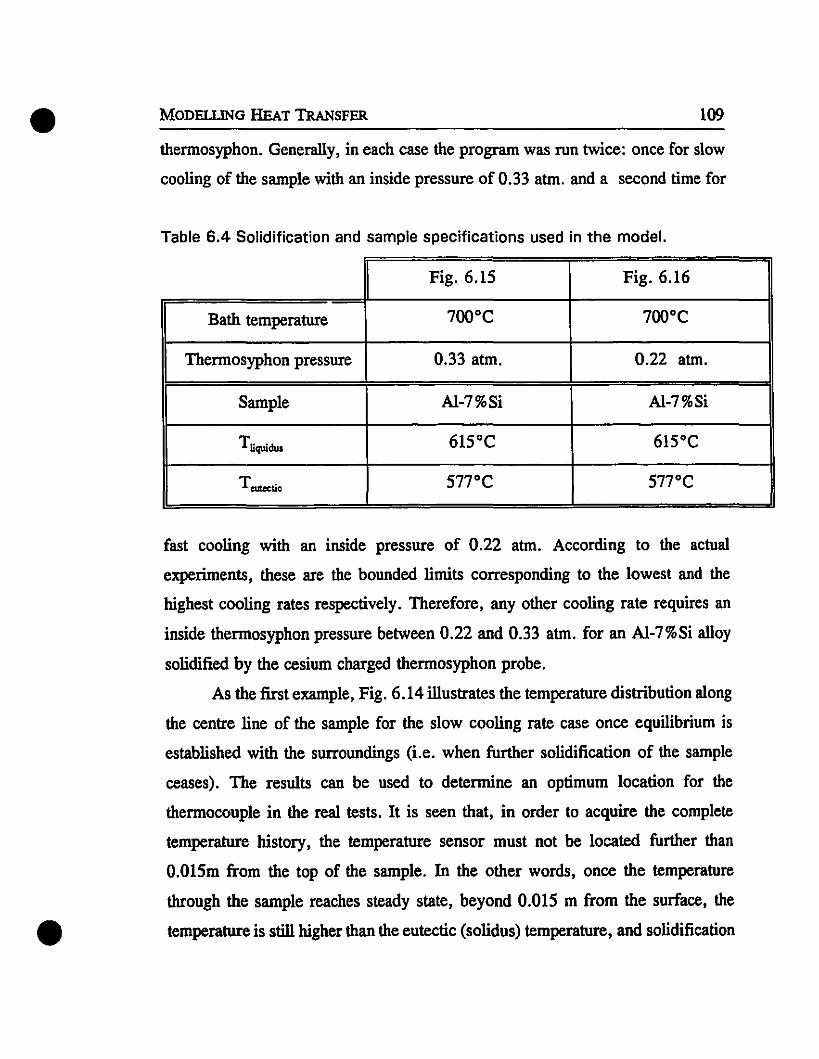
• MODEllING HEAT TRANSFER 109
•
thermosyphon. Generally, in each case the program was run twice: once for slow
cooling of the samp1e with an inside pressure of 0.33 atm. and a second time for
Table 6.4 Solidification and sample specifications used in the mode!.
Fig. 6.15 Fig. 6.16
Bath temperature 700°C 700°C
Thermosyphon pressure 0.33 atm. 0.22 atm.
Sample Al-7%Si Al-7%Si
TUquidus 615°C 615°C
T_. 577°C 577°C
fast cooling with an inside pressure of 0.22 atm. According to the actual
experiments, these are the bounded limits corresponding to the lowest and the
highest cooling rates respective1y. Therefore, any other cooling rate requires an
inside thermosyphon pressure between 0.22 and 0.33 atm. for an Al-7%Si alloy
solidified by the cesium charged thermosyphon probe.
As the first example, Fig. 6.14 illustrates the temperature distribution along
the centre line of the sample for the slow cooling rate case once equilibrium is
established with the surroundings (Le. when further solidification of the sample
ceases). The results can be used to detennine an optimum location for the
thermocouple in the real tests. It is seen that, in order to acquire the complete
temperature history, the temperature sensor must not be located further than
0.015m from the top of the sample. In the other words, once the temperature
through the sample reaches steady state, beyond 0.015 m from the surface, the
temperature is still higher than the eutectic (solidus) temperature, and solidification
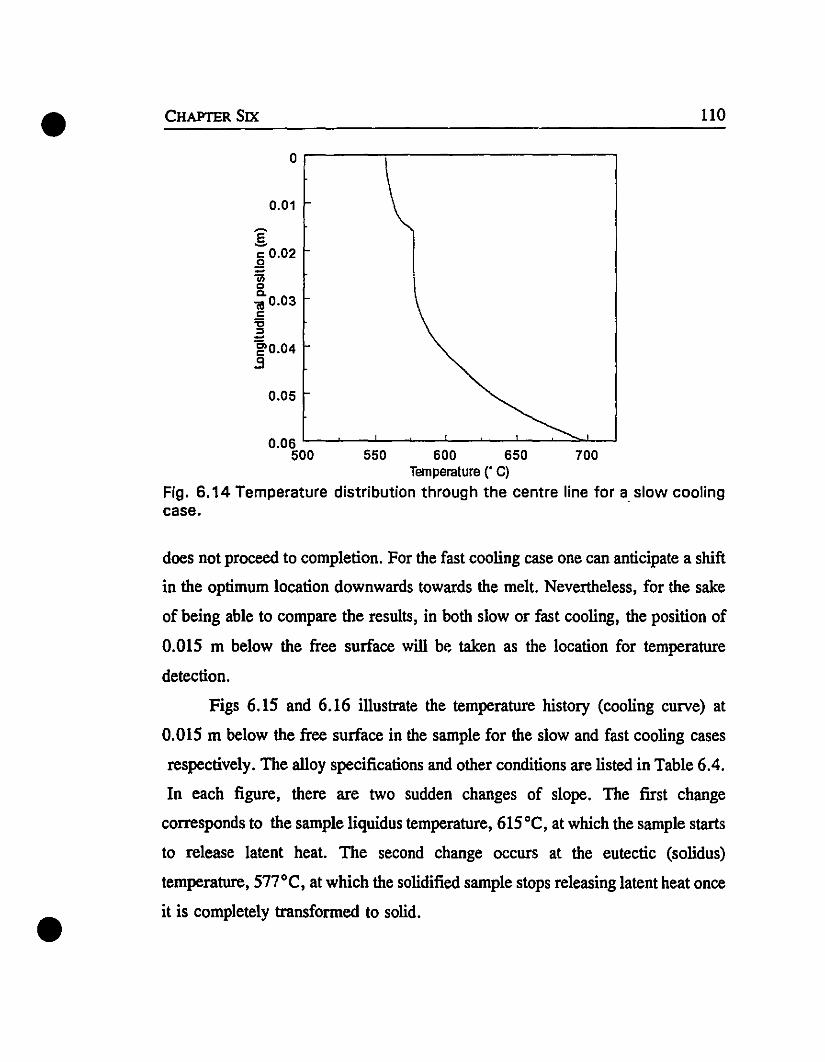
• CHAPTERSIX
0,..----.,....------------,
0.01
:§:c: 0.02.Q
'iii8-ëII 0.03c:
~-ê'0.04.9
0.05
110
•
0.06 '--~_...J.._~_l._~_...J.._~~"___'
500 550 600 650 700Temperature (' Cl
Fig. 6.14 Temperature distribution through the centre line for a. slow coolingcase.
does not proceed to completion. For the fast cooling case one can anticipate a shift
in the optimum location downwards towards the melt. Nevertheless, for the sake
of being able to compare the results, in both slow or fast cooling, the position of
0.015 m below the free surface will be taken as the location for temperature
detection.
Figs 6.15 and 6.16 illustrate the temperature history (cooling curve) at
0.015 m below the free surface in the sample for the slow and fast cooling cases
respectively. The alloy specifications and other conditions are listed in Table 6.4.
In each figure, there are two sudden changes of slope. The first change
corresponds to the sample liquidus temperature, 615°C, at which the sample starts
to release latent heat. The second change occurs at the eutectic (solidus)
temperature, 577°C, at which the solidified sample stops releasing latent heat once
it is completely transformed to solid.

• MODELLING HEAT TRANSFER III
350
•
Comparing the slow and fast cooling rate curves, il is seen that in the slow
cooling rate (Fig. 6.15), the delay time at the liquidus tempenlture is substantially
640
630
620-.ü0--~ 610 f--
.a~
~
8. 600 f--
E~
590 -
580 -
570 u.11_'--..J.I--...J'--..l..-1-'--_.l...-1-,--_,--1..J--_1'--...l...-...l1_J....-l
o 50 100 150 200 250 300lime (s)
Fig. 6.15 The cooling curve of an AI -7% Si sample for a slow cooling rate.
longer than in the fast cooling case. This is as expected and is a result of the effect
of temperature gradient from the sample to the probe. A simiilU" scenario occurs
at the eutectic temperature (577°C). In the slow cooling rate case, the eutectic

• CHAPTER SIX 112
temperature spans about 225 seconds versus about 20 seconds at the fast cooling
rate. These observations indicate that the mathematical model is very sensitive to
640 .--,....------------------,
620
-()o-600~.a~Q)
0. 580E~
560
o 20 40 60Time (s)
80
•
Fig. 6.16 The cooling curve of an AI-7%Si sample for a fast cooling rate.
the cooling rate as determined by pressure inside the thennosyphon probe.
Figs 6.17 and 6.18 show the temperature distributions at various times
during the cooling process for slow and fast cooling respectively. Recalling the
boundary conditions, the bottom part of the cylindrical sample always remains at
• MODElL1NG &AT TRANSFER 113
•
the bath temperature and cooling is mainly radial. Therefore, there always exists
a longitudinal heat charge to the sample from the bottom, and a radial heat 1055
from the centre to the thermosyphon wall. This makes for a symmetrical 2-D
conduction heat transfer system through the sample. An overall vi~w of the
solidification patterns shown in Figs 6.17 and 6.18 confirms these points.
RegardIess of the elapsed time, the bottom portion of the sampling chamber is
relatively hot, and the isothermal contour lines are almost parallel and are very
close together. This cao be interpreted as an indication of a high heat flux from
the liquid metal bath which prevents formation of a significant radial temperature
gradient. As one progresses up from the bottom, and depending on the time and
rate of cooling, the isotherms become more separated and a more pronounced
radial temperature gradient appears. Thus, in the upper part of the sample,
longitudinal heat transfer gradually becomes less effective and radial heat transfer
becomes dominant. AIso, for both the slow and fast cooling rates, during the
solidification process, liquid, mushy, and solid sections in the sample can he
recognized, and as time proceeds the solid and mushy portions depress the liquid
section to sorne extent.
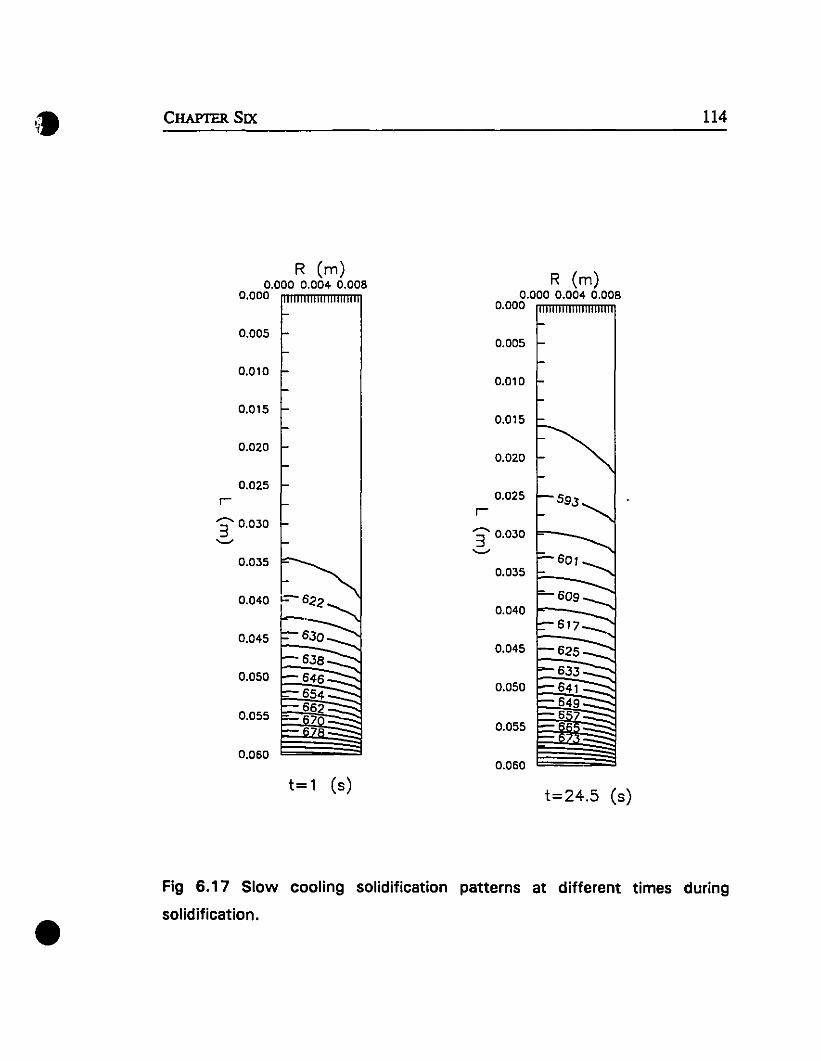
• CHAPTER SIX
R (m)0.000 0.004 0.008
0.000
0.005
0.010
0.015
R (m)0.000 0.004 0.008
0.000
0.005
0.010
0.015
114
0.020
0.025r
3' 0.030......,0.035
0.040
0.045
0.050
0.020
0.025r
3' 0.030......,
0.D35
0.040
0.055 ~!i~10.060 ê
t= 1 (s)
•Fig 6.17 Slow cooling solidification patterns at different times during
solidification.

•
•
MODEU.ING HEAT TRANSFER
R (m) R (m)0.000 0.004- 0.008 0.000 0.004- 0.008
0.000 0.000
0.005 0.005
0.010 0.010
0.015 0.015
0.020 0.020581 581
0.025 0.025
r r
3' 0.030 589 3' 0.030 589
'-J '-'
0.035 597 0.035 597
605 6050.04-0 0.04-0
613 613
0.04-5 621 0.04-5 621
629 629
0.05~637 0.050 637
645 645
0.055 0.055
0.060 0.060
t=251 (5) t=350 (5)
Fig.6.17 Contnue d
us
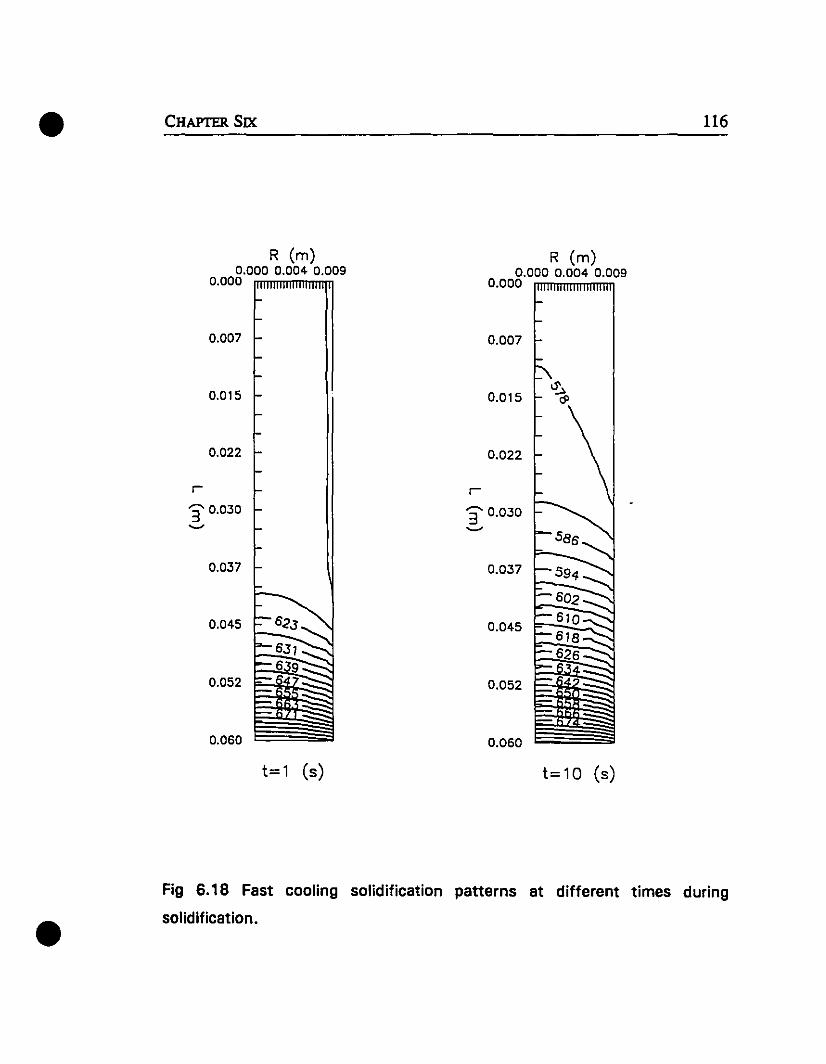
• CHAPTER SIX
R Cm)0.000 0.004- 0.009
0.000
0.007
0.015
0.022
r
'3 0.030~
0.037
0.04-5
0.052
o.oso
t= 1 (s)
R Cm)0.000 0.004- 0.009
0.000
0.007
0.015
0.022
r
'3 0.030'-'
0.037
0.04-5
0.052
o.oso
t=10 (s)
116
•Fig 6.18 Fast cooling solidification patterns at different times during
solidification.

•
•
MODELLING HEAT TRANSFER
R (m)0.000 0.004 0.009
0.000
0.007
0.015
0.022
r
3 0.030~
0.037
0.045
0.052
O.OSO
t=4D (s)
R (m)0.000 0.004 0.009
0.000
0.007
0.015
0.022
r
3 0.030~
0.037
0.045
0.052
o.oso
t=42 (s)
Fig. 6.18 Contnue d
117

• CHAPTER SIX 118
The solidification rate which is defined (in the present context) as the
velocity of the liquidus (615°C) along the sample centre line can be evaluated by
0.032
0.034
......
.s 0.036co~
':g 0.038c-m:§ 0.04;;,
=ë>c 0.042.:l
0.044
f2st cooling Slow cooling--- ""*i~1"7
1
* )l, 7
r- Il'
17 -
Il0.046
0.0060.0050.001o 0.002 0.003 0.004615° front lelocity (mis)
Fig. 6.19 A comparison of solidification rates for slow and fast cooling rates.
the simulator. Fig. 6.19 compares the 615°C front velocity (ÂL/~t) versus
longitudinal position for the slow and fast cooling cases. At slow cooling rates the
front velocity lies in the range of0 - 0.0006 (mIs) while in the fast cooling case the
velocity ranges between 0 - 0.0055 (mIs). It is seen that in no case is the liquidus
front velocity constant. Solidification of the thermal analysis sample is then non
steady state and at best one can speak of only an average freezing rate for the
sample.
•

•
•
CHAPTER7
RESULTS AND DISCUSSION
7.1 Introduction
A gas-Ioaded concentric thermosyphon has been designed to replace the
conventional thermal analysis set-up for aluminum casting alloys. In this system,
the evaporator of the probe is immersed in the liquid metal and the working fluid
is evaporated thereby establishing the temperature of the working substance.
Because of the temperature gradient across the evaporator wall, the latent heat of
fusion of the molten metal is extracted and a small amount of melt (in the shape
of a button) is solidified inside the core of the probe. A thermocouple located at
the centre of the evaporator measures the instantaneous temperature of the
solidifying button. During freezing, the time and temperature are recorded by a
data acquisition system. After solidification is complete, a higher pressure of inert
gas is applied ta the thermosyphon thus blocking off the vapour from the
condenser. As a result, heat transfer between the evaporator and condenser is
virtually eliminated and the relatively small solidified mass gains heat from the
liquid bath in which it remains immersed. Eventually it remelts and is
reassimilated in the melt (see Fig. 5.3). As seen in Fig. 5.3, the outer surface of

the evaporator is covered by a relatively thick graphite block. This shell protects
the evaporator booj" against dissolution in liquid aluminum, and, in addition, it
partially isolates this part of the evaporator from the hot liquid metal bath. The
thermosyphon (i.e. probe) need not be withdrawn when it is not in use. It resides
as a pressurized chamber in the melt while it awaits the signal to analyze a new
fresh sample.
It will be recalled that the main objective of this work was the design,
testing and modelling of a novel in-situ probe for conducting controlled thermal
analysis of aluminum-silicon casting alloys. Since the probe is basically a heat
transfer device and its applicability depends OIùy on the working temperature range
regardless of the nature of the hot media (i.e. liquid metal bath), three liquid
aluminum alloys were chosen for testing. The three systems were pure aluminum,
aluminum-7 %silicon (356 alloy), and aluminum-12%silicon (413 alloy). Table 7.1
shows the composition of the aluminum alloys used in this work.
• CHAPTER SEVEN 120
•
Table 7.1 Nominal chemical composition of the AI alloys tested.
Sample Si Cu Mg Fe Zn
356 7.0 <0.20 0.35 <0.2 <0.1
413 12.0 <0.1 <0.10 <2.0
Among these, pure aluminum has the highest melting point of 660°C at the upper
bound ofworking temperature limit for the probe, while alloy 413 is basically an
eutectic composition with the melting (eutectic) temperature of 577°C which is the
lowest limit for this application. Since most other common aluminum silicon
foundry alloys solidify between 660 and 577°C, it is reasonable to conclude that
if the probe can be successfully used for pure aluminum and eutectic aluminum
silicon alloy (413), it will be applicable for the entire range of aluminum silicon
casting alloys with the silicon content between 0-12%. In addition, because of the

• REsULTS AND DISCUSSION 121
nature of the simple eutectic composition (see Fig. 3.1), sorne hypereutectic
aluminum-silicon alloys can be tested by the probe. The third system (aluminum
7%silicon) is a representative of alloy 356 which is one of the most commonly
used aluminum silicon foundry alloys. AIloy 356 is cast in both sand and
permanent molds and because of its properties such as excellent fluidity, resi~tance
to solidification shrinkage, resislance to corrosion, very good weldability, and
good machinability, it has found a vast variety of applications. Sorne of its
applications in sand casting are: air compressors, water jackets, and crankcases.
Permanent mold castings of alloy 356 inc1ude: aircraft fittings, impellers,
accessory housings for internal combustion engines, jet engine compressor cases,
passenger car wheels, and marine usages.91 In terms of solidification
characteristics, 356 alloy solidifies through a relatively large mushy zone with a
solidification range of about 38°C. AIso, sorne liquid processing such as
modification of silicon morphology and grain refinement are done on this alloy.
Therefore, it was found necessary to inc1ude this alloy in the testing of the
thermosyphon probe. Commercial grades of these alloys were used in order to
evaluate the sensitivity and applicability of the probe on real industrial materials.
""r-------------,'" ..,L..._. ..."'-'-'....:..:..._..__""'...._
""Ê ...
1...~ 070
""
•
""~o ~ ,œ ,~ B ~ ~ * ~
nM(l)
Fig. 7.1 The cooling curve obtained by the conventional method for pure AI.
7.2 Typical Results

• Chapter Seven 122
In order to prove the workability of the probe and to show how il responds, the
first set of experimental results to be presented are for the solidification of pure
Al and Al-Si eutectic alloy by a potassium ch3l'ged thermosyphon probe. Fig. 7.1
shows the cooling curve for pure aluminum obtained with conventional thermal
analysis equipment (see 3.4.3) that included a sample cup similar to a sand mould.
It is presented here as a source for comparison with the curves obtained with the
newly developed probe. This conventional cooling curve has three distinct
segments:
1) cooling in the liquid state,
2) a fiat portion which represents the liquid to solid transfonnation,
0.2
0.7
0.5 -!!
0.3 iil
~,
___________________________ 1
_....--
••,
rr;:::============;:j""'---"j'] 1
A1..I!!!'p. W.F.Temp. PrellSUre
680
620
Ô 660'-!
ii 640
t!
600 L.JL....-=::::::::;i:::====::::===~ ......__-'-_........JO
0.160 120 180 240 300 360 420 480
llme (s)
(a)Fig. 7.2 a: The general view of the results for a pure AI test by the probe.
•3) cooling in the solid state.
Fig. 7.2 presents the first resuIts acquired by the thennosyphon probe.
Generally, they contain three curves in the same figure (Fig. 7.2 a): one depicts

• REsULTS AND DISCUSSION 123
680
Ô"""660
~
1640 ~LIqu;::!:::.Id~M:::..P.:..+-__...:so=iJ:...' --<~LIq:!u::ld~~ 620
• Freezlng Remelting.. .
0.7
0.5 ~
.!.
0.3 §0.2 ~
6OO,-__~ --.J
o GO 120 180 240 300 360 420 480Tlme (s)
b
r-;=====:;;;;;;:;TI---""\1~ fli85S,",,_;,;;_,;,.!'._m1!
111
\ 11 11 11 11 11 11 11 11 :l ~
• Remeltlng.. .
•
o GO 120 180 240 300 360 420 4800
.1
Tlme (s)
C
\1W.FJSIJ1l. /
680 1Ê 660
IRemeltln9l!!~
Freezlng640 • . 4,
~\
1
~ 620 ,1
\ 1600
1
0 GO 120 180 240 300 360 420 480Tlme (s)
d
Fig. 7.2b: The cooling and heatlng curves,c: The pressure curve,d: The worklng fluid temperature curve.

• Chapter Seven 124
the thermal analysis curve that is the cooling and heating curve for the button( Fig.
7.2 b). The other shows the inner pressure of the probe for the freezing and
remelting periods (Fig. 7.2 c). During the freezing period the pressure is, in fact,
the saturation vapour pressure of the working substance. The third curve illustrates
the corresponding temperature of the working substance at the given pressure Fig.
(7.2 d). By comparing Figs. 7.1 and 7.2b, it can be seen that the cooling curve
depicted in Fig. 7.2b represents a higher rate of cooling as evidenced by the
shorter plateau region. Thus, one can conclude that a chamber pressure of 0.17
atm. (Fig. 7.2 a and c) yielded a faster cooling rate than that of the simulated
mould casting (Fig. 7.1). It is worth noting however that both techniques yielded
curves simiIar in every respect.
Fig. 7.2 also shows ili<l results corresponding to the remelting of the
aluminum button. Once the button had solidified and cooled to ·approximately
680 rT-'""";:::::;:;::::==;;;:;::==::;;==:::::;----.., 0.71AI Temp. W~mp. r:.r~~l!!! 1
670 - 0.5
•
6 _
~ 660 '--------------------J ~~Gli 650 r,------------------- ....... -------------- 0.31
\ 0.2 a.
~ ::~ l,------,--------····-----,.....--....---1.----' 0.1o 60 120 180 240 300 360 420
Time (5)
Fig. 7.3 The cooling curve oblained by the thermosyphon probe for pure AI.
630"C, the probe was pressurized to about 1 atm. with inert gas (at time=330 s) .
From Fig. 7.2 one can clearly see the effects of this action - the pressure increases

• REsULTS AND DISCUSSION 125
------'---
•
instantaneously (Fig. 7.2 c); the temperature of the working substance increases
rapidly (Fig. 7.2 d) as a new equilibrium is established, and the temperature of the
button begins to rise. The temperature of the batton first increases rapidly and then
decelerates as it approaches 660·C. Once remelting is complete, the temperature
heating curve resumes its steady climb towards the temperature of the melt. The
remelting of the button was accomplished in a span of about 2 minutes. Once the
button had completely remelted, the probe was ready to perform another thermal
analysis Le~(.
The next step in the experimental program was to increase the chamber
720 r---;::::;:;:;==:;:;:;;;;::=::::;;:::::=:::;---..., 0.7AI Temp. VI!,r.Temp'. P!~J1~
. 0.5
6~ ~
~~O -------------------------------.Q3 !~ 1 ~
1 1\ ~ l~ 6601-\ '---------------------1
l--640 L..._...l-_--l.__.l--_...l-_.--l.__.l--_...l-_--' 0.1o 60 120 180 240 300 360 420 480
Time (5)
Fig. 7.4 Quasi equilibrium solidification with the thfmnosyphon probe.
pressure during solidification. The results are depict';d in Figure 7.3. For this test
the chamber pressure was stabilized at 0.24 atm. initial pressure versus 0.17 atm.
used in the previous test. As is evident, the higher pressure gave rise to a slower
effective cooling rate wlùch in tum lengthened the plateau.

• Chapter Seven 126
•
Another test was conducted with the same batch of aluminum. The initial
pressure inside the probe was set at 0.3 atm. versus 0.24 atm used in the previous
test. As a result, the solidification time was greatly increased as shown in Fig. 704.
In this case a quasi-equilibrium was established. This feature can be of particular
interest when one is attempting to study a reaction or phase formation during
solidification.
Another series of tests was conducted with 413 aluminum-silicon alloy.
Generally, alloys of the 413 fami1y are near eutectic alloys and have simple
6OOrr---------------,590
Û 580~
~} 570
~560
550'--.....-"_-.....- .....- .....- .....- .....-..1o 60 120 180 240 300 360 420 4e)
lime (8)
Fig. 7.5 The cooling curve obtained by the conventional method for a 413allo';" .
cooling curves. The experimental procedure adopted in these tests was essentially
the same as that used for pure aluminum. Fig. 7.5 shows the conventional cooling
curve for 413 alloy. It is to be noted that the accepted eutectir '•.}mperature is
577°C which is in excellent agreement with the value obtained from the
experimental conventional cooling curve.

• REsULTS AND DISCUSSION 127
The probe was used to perfonn a thennal analysis of the same batch of 413
aluminum alloy. The cooling curve obtained with an initial pressure of 0.09 atm.
is presented in Fig. 7.6. One can see there is an abrupt change in the slope of the
cooling curve as the liquidus temperature ( about 580 oC) is crossed. Moreover,
as the solidus is reached there is another abrupt change and solidification of the
eutectic begins to dominate at the expected temperature of577°C. These events are
very distinct on the cooling curve.
As a final example, consider the cooling curve shown in Fig. 7.7. In this
test the initial pressure was set at about 0.05 atm. versus 0.09 atm. for the
previous test with the result that heat extraction was enhanced and solidification
590 nr--;:=::::;:=:::;:;;;;==::;:=::::;~-,1...._Al_1i_e_m_p_.__W_._F.1i_em_p_. ~re__..s~re_....1
0.05
0.5
'--"----------J- 0.3 i~
0.21- - - - - - - - - - - -._- - --~---::-.: 01 Il.-------- ------- _.-...-.-.-...... .
-----~~-"~~......-.........~li .•·-~,
550 .....0-.;;.---....----.....----....'------'---....o 60 120 180 240 300 360 420 480 540 600Time (s)
Fig. 7.6 The cooling curve obtained by thermosyphon probe for 413 alloy.
5806'~
Il!:::J
570 -~c.
~560
•time shortened. While the liquidus and solidus inflection points are discernible,
they are not as clearly denoted as in the previous test. High cooling rates tend to

• Chapter Seven 128
obscure these events. Also shown in Fig. 7.7 is the remelling of the 413 Al aDoy
button. When the probe was pressurized with inert gas to about 1 atm., the
temperature within the button increased then decelerated as the button me1ted and
finally increased to the melt temperature. The reme1ling of the button was
accomplished in a span of about 3 minutes and the system was ready for another
test.
In aD curves obtained by the thermosyphon probe, it is seen that the
working substance pressure (and the corresponding temperature) ooes not remain
constant during the thermal analysis test. An increase in the working sub~tance
pressure and temperature was always detected. This occurs because the low
pressure is imposed by the vacuum pump in a very short lime and disturbs the
equilibrium. The system, then, has to pass through a transient state in order to
590
1Al Temp. W.F.Temp. Pressure 1/----1---- 1-----
580 : 11 1
6 1 0.51 ~
l..-I !l!! 1
15701 l!!1 :>1 ..1
0.2 ~~111
560 11
~ 0.1\ 1
\ ... -----_.\ ---- ------
550 .. -0 60 120 180 240 300 360 420 480 540 600
Time (s)
Fig. 7.7 The cooling and heating curves of 413 alloy•
•
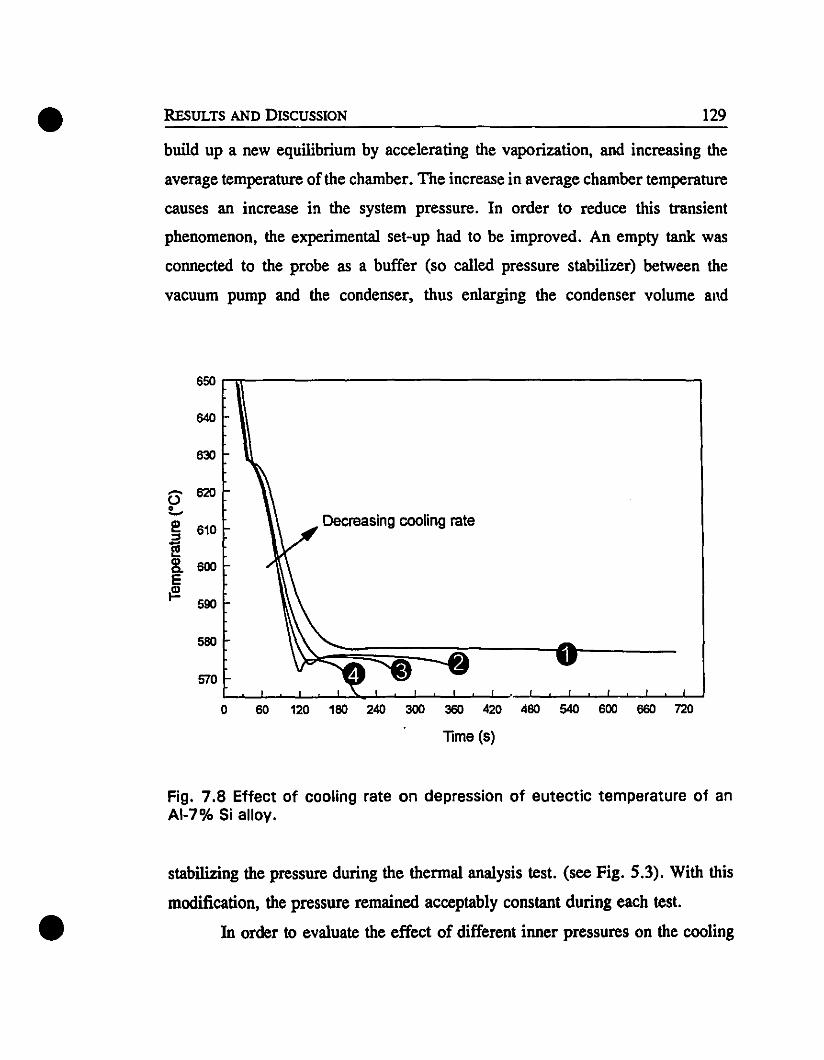
• REsULTS AND DISCUSSION 129
build up a new equilibrium by accelerating the vaporization, and increasing the
average temperature of the chamber. The increase in average chamber temperature
causes an increase in the system pressure. In order to reduce this transient
phenomenon, the experimental set-up had to be improved. An empty tank was
connected to the probe as a buffer (so called pressure stabilizer) between the
vacuum pump and the condenser, thus enlarging the condenser volume and
650
640
630
~ 620U0-I!! 610
'"ë8- 600E~ 590
560
570
0
Decreasing cooling rate
60 120 160 240 300 360 420 460 540 600 660 720
•
lime (s)
Fig. 7.8 Effect of cooling rate on depression of eutectic temperature of anAI-7% Si alloy.
stabilizing the pressure during the thermal analysis test. (see Fig. 5.3). With this
modification, the pressure remained acceptably constant during each test.
ln order to evaluate the effect of different inner pressures on the cooling

• Chapter Seven 130
•
curve of the same sample, an aluminum 7%silicon alloy was chosen to be
solidified at several inner pressures by a cesium charged probe. Fig. 7.8 illustrates
cooling curves of the same Al-7%Si alloy with different inner pressures (i.e.
cooling rates) by the thennosyphon probe.
The procedure of the experiment was such Ihat the pressure inside the probe
was set at a level that gave a very low cooling rate (e.g. 0.33 atm.). This pressure
was low enough to completely solidify the sample and high enough to give one of
the lowest cooling rates possible(curve 1). Once the desired cooling curve was
obtained, the probe was pressurized with inert gas, blocking off heat dissipation
from the sample. Consequently, the solid sample starled remelting, and the
temperature was restored to the initial temperature of the liquid bath. (Heating
Table 7.2 Variations of cooling rate and eutectic temperature with inner
pressure for the curves of Fig. 7.8.
Pressure Cooling rate Eutectic tempoCurve#
(atm.) (OC/s) (oC)
1 0.33 0.6U 578.0
2 0.31 0.80 576.1
3 0.30 0.85 575.7
4 0.28 1.00 575.0
curves are not shown in Fig. 7.8.) Then, the same procedure was followed but
with a lower inside pressure to speed up the cooling rate, and curve 2 was
obtained and so on. Table 7.2 shows the variations of cooling rate and eutectic
temperature versus the inner pressure of the probe for the curves of Fig.7.8.
As seen, by gradually increasing the cooling rate the eutectic temperature
• REsULTS A.to<D DISCUSSION 131
•
is depressed as expected (see 3.3.1). The cooling rates in Table 7.2 are, in effect,
the slope of the mushy zone portion of the cooling curves. The point to note here
is that all of the cooling curves were taken in the same melt, and the whole test
required a span of about 45 minutes without any need for special or extra
equipment to adjust the cooling rate.
Following investigations on the applicability of the thermosyphon probe for
different cooling rates, the probe was used in conjunction with a COll",nercial
thennal analysis system. The Meltlab7s system includes a combination of data
acquisition hardware and software. It has been developed to he used with
conventional thennal analysis equipment (see 3.4.3) and for each alloy the proper
software has to be loaded. The output of the system is Iwo graphs on one sereen
(Fig. 7.9): one graph presents the cooling curve as it is acquired, and the other
presents data regarding the rate of cooling. The rate of cooling part has Iwo
vertical axes: the left vertical axis is the fust derivative of temperature with time
(dT/dt), and the right hand one is the second derivative of temperature with time
(d2T/df). During the test, the ongoing-smoothed cooling curve plus Iwo
corresponding cooling rate curves can be seen on the screen. The current
temperature and the eutectic temperature of the alloy are also shown. This system
was attached to a cesium charged thennosyphon probe, and three distinct inner
pressures of 0.33, 029, and 0.20 atm. were tested for a 356 alloy. The results are
shown in Figs 7.9 to 7.11. Fig 7.9 illustrates the Meltlab screen for a 356 alloy
obtained by the thermosyphon probe with an inner pressure of 0.33 atm. Note that
the cooling curve is only a line chart and the horizontal axis is not necessarily in
seconds. Obviously, the cooling rate changes significantly during solidification and
il is impossible to describe the cooling rate by a simple value for the whole
solidification process. On the other hand, there is no universally accepted
definition of cooling rate, but for those alloys with a mushy zone (such as 356),

CIiA/'TER SEVES }''').)-
•
Fig. 7.9 The Meltlab screen for a 356 alloy obtained by the thermosyphon probein low cooling rates.

•
•
RESULTS AND DISCUSSION
Fig. 7.10 The Meltlab sereen for a 356 alloy obtained by the thermosyphon probein medium eooling rates.
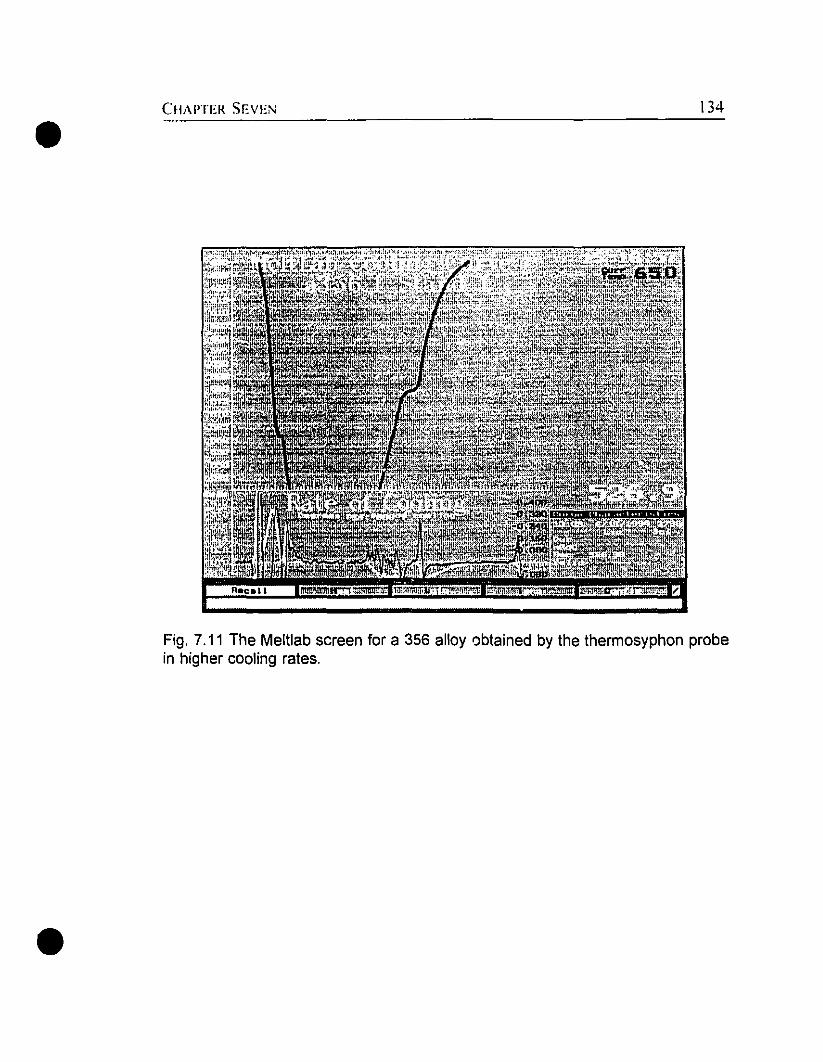
•CHA l'TEK SEVEN 134
•
Fig. 7.11 The Meltlab screen for a 356 alloy obtained by the thermosyphon probein higher cooling rates.
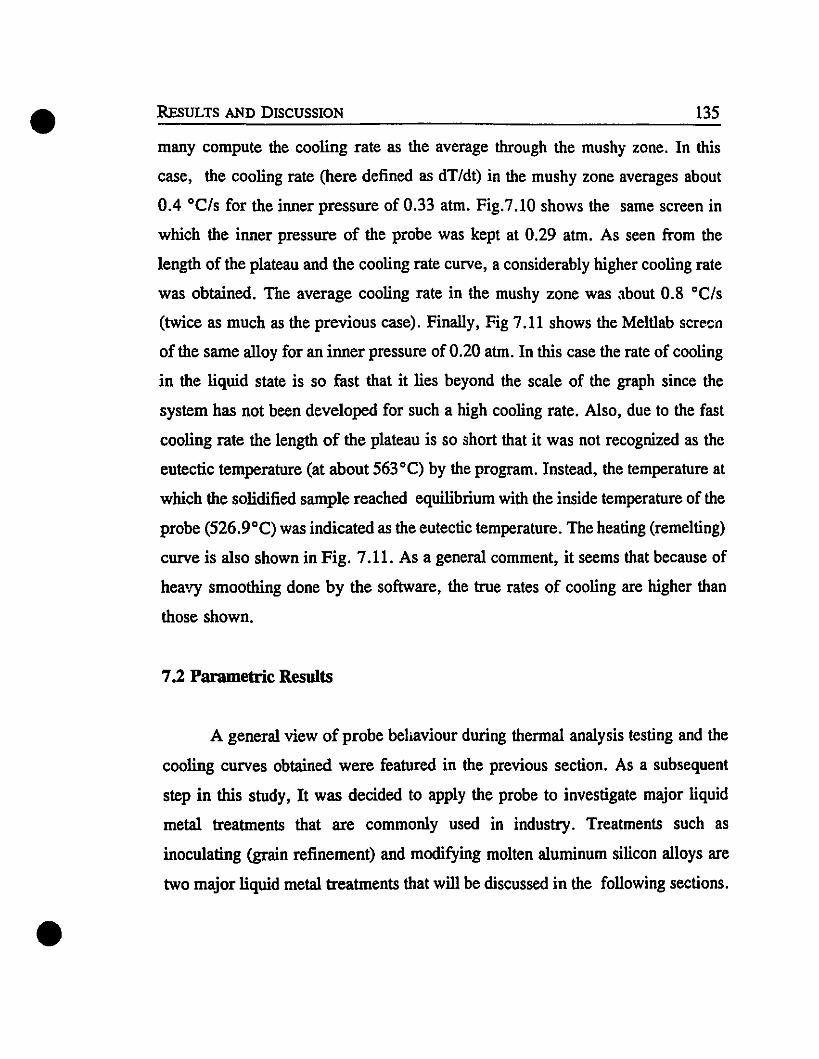
• REsULTS AND DISCUSSION 135
•
many compute the cooling rate as the average through the mushy zone. In this
case, the cooling rate (here defined as dT/dt) in the mushy zone averages about
0.4 °C/s for the inner pressure of 0.33 atm. Fig.7.10 shows the same screen in
which the inner pressure of the probe was kept at 0.29 atm. As seen from the
length of the plateau and the cooling rate curve, a considerably higher cooling rate
was obtained. The average cooling rate in the mushy zone was about 0.8 °C/s
(twice as much as the previous case). Finally, Fig 7.11 shows the Meltlab screCl1
of the same alloy for an inner pressure of 0.20 atm. In this case the rate of cooling
in the liquid state is so fast that it lies beyond the scale of the graph since the
system has not been developed for such a high cooling rate. Also, due to the fast
cooling rate the length of the plateau is so short that it was not recognized as the
eutectic temperature (at about 563°C) by the program. Instead, the temperature at
which the solidified sample reached equilibrium with the inside temperature of the
probe (526.9 oC) was indicated as the eutectic temperature. The heating (remelting)
curve is also shown in Fig. 7.11. As a general comment, it seems that because of
heavy smoothing done by the software, the true rates of cooling are higher than
those shown.
7.2 Parametric Results
A general view of probe behaviour during thermal analysis testing and the
cooling curves obtained were featured in the previous section. As a subsequent
step in this study, Il was decided to apply the probe to investigate major liquid
metal treatments that are commonly used in industry. Treatments such as
inoculating (grain refinement) and modifying molten aluminum silicon alloys are
two major liquid metal treatments that will be discussed in the following sections.

• Chapter Seven 136
7.2.1 Grain Rermement: To study the applicability of the probe for grain
refinement investigations, a commercial grade of 356 alloy and a cesium charged
thennosyphon probe were employed. The procedure was such that first a thermal
analysis of the alloy containing no grain refiners was conducted. It was realized
that the inside pressure of 0.5 atm. was a suitable pressure to clearly illustrate the
sensitive portion of the cooling eurve. Once the desired part (liquidus portion) of
the cooling curve was obtained, a higher pressure of inert gas was applied and the
temperature of the sample restored back to the liquid bath temperature. Then,
2020600 L..&.-_...L.....................L_--' 0.05
40 60 80 100
lime (s)
630
1 ~~~MlQI1
1 ~:~~MlQI630
Unrelined Gnin-rofined
- --625 625
-,------------------- 0.5 ---------.---._---------..... 620
.....620
..-Ë 0
0 0
:..... 0.3 :!! -i 615
l!! ~:::J 615 10.2 ~...
~ 610
a..~610
0.1
605 605
Fig. 7.12 Comparison of cooling curves of an unrefined and grain refined 356alloy at the Iiquidus portion of solidification obtained by the probe.
•about 0.2% Ti was added to the melt as Al-5%Ti master alloy. The pressure was
lowered back to 0.5 atm. (macroscopic scale) and the cooling curve for the grain
refined alloy obtained. In Fig. 7.12 a comparison of the cooling curves for grain

0.55
• REsULTS AND DISCUSSION
635r------;:======:------,O.81 T~'" ~ 1
137
630
Ê 625!!.aI!"0.
620E~
815
----------------------------------------- 05
0.35
0.55 .
610<IO!::---.;8O;;---::8O,...-.......,1:!;:00:;----='I20~--:I<1O::::--*18O;;--:;!,1800.311me (a)
(a)
6351 ------;=======;----1 o.8
1 T_"'" ~~ 1
630
615
------------------------------------.------ 0.5
0.35
•
6101.-..J---......---'--.......,~--'----'~0.380 80 100 120 1<10 180
11me (a)
(b)
Fig. 7.13 Effect of Ti concentration on the Iiquidus portion of the cooling curve
for an AI 6%Si aUoy;
al Ti%= 0.008 L1T=1.23 D C
b) Ti%=0.076 L1T=0.56 D C•
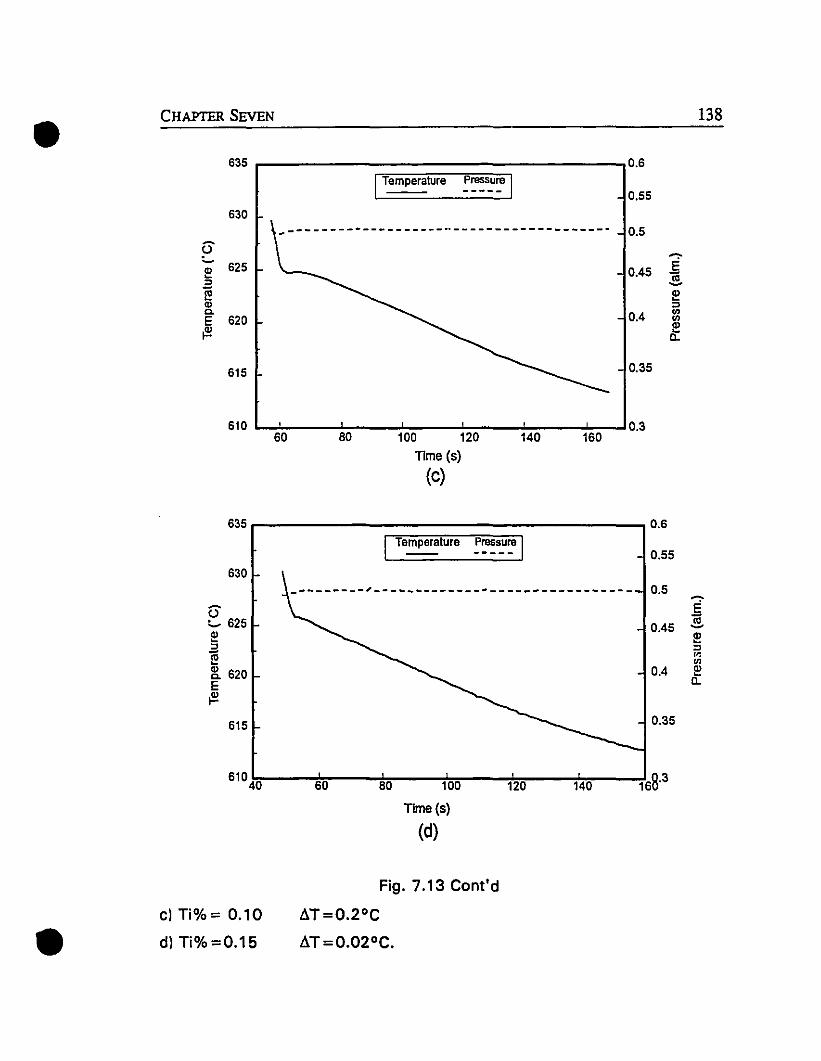
0.55
• CHAPTERSEVEN
635 r------;::;;;;;:;:;:;;;:::::;;;;;;;:;-----1o.61 T~IUre :~s_U~ 1
138
630
6"e 625.aC1<IlC-E 620~
615
--------------------------------------- 0.5
0.35
610 L-~--_:_:~-~~-~~-~~--~---I0.360 80 100 120 140 160
Time (5)
(c)
635 ,-----;::;;;;:;;;;;:::;;;;;;----11 Te~IUre :~S-"~ 1
630
---------,-------------------------------6":... 625~
~:!l. 620E~
615
0.6
0.55
0.5
0.45i'~
~:l
'"III0.4 ~
Cl.
0.35
61040 60 80 100 120 140 168.3
Time (5)
(d)
Fig. 7.13 Cont'd
cl Ti%= 0.10 ~T=0.2°C
• dl Ti%=0.15 ~T=0.02°C.

• REsULTS AND DISCUSSION 139
•
refined and unrcfined 356 alloys is illustrated. It is seen that an undercooling of
about 2°C has accomplished and that the probe was sensitive enough to detect
the grain refinement effect on the cooling curve. AIso, the pressur~ inside the
chamber for both cases was identical. This was necessary to eliminate the effect
of cooling rate on chemical grain refinement. The total time consumed for this test
dealing with grain refinement was less than 4 minutes.
AIso, the same experiment as above was carried out on an aluminum
7%silicon alloy. The alloy was made artificially by melting pure aluminum and
adding a proper amount of silicon. Commercial grades of both aluminum and
silicon were used and the same procedure was followed except that the final
amount(0.24%) of grain refiner agent (Ti) was added in three steps. In each step
0.08% Ti was added, and t.'Je liquidus portion of the cooling curve was obtained.
The aim was to check the sensitivity of the probe to detect any minor changes on
the cooling curves due to the grain refinement treatment. Fig. 7.13 shows the
effect of various Ti additions on the liquidus portion of the cooling curve for an
aluminum 7%silicon alloy. The inner pressure was kept constant for all cases;
therefore, any changes on the curves are due to chemical grain refinement of the
alloy. To support this result, in each step a sample was taken from the melt and
solidified under the same conditions (i.e. the same amount, pouring temperature,
mold temperature etc.), and eventually four samples corresponding to curves (a),
(b), (c), and (d) in Fig. 7.13 were obtained. These samples were polished and
etched with Poulton's etch (60% HCl; 30% IIN03; 5% HF; 5% H20.) The
metallography results are presented in Fig. 7.14 to 7.17. As seen Ti is effective
in grain refinement.
The samples were also chemically analyzed for silicon and titanium by
vacuum emission spectrometry. AIthough during alloying 7% silicon was added
to pure aluminum, chemical analysis of the samples revealed that there was no
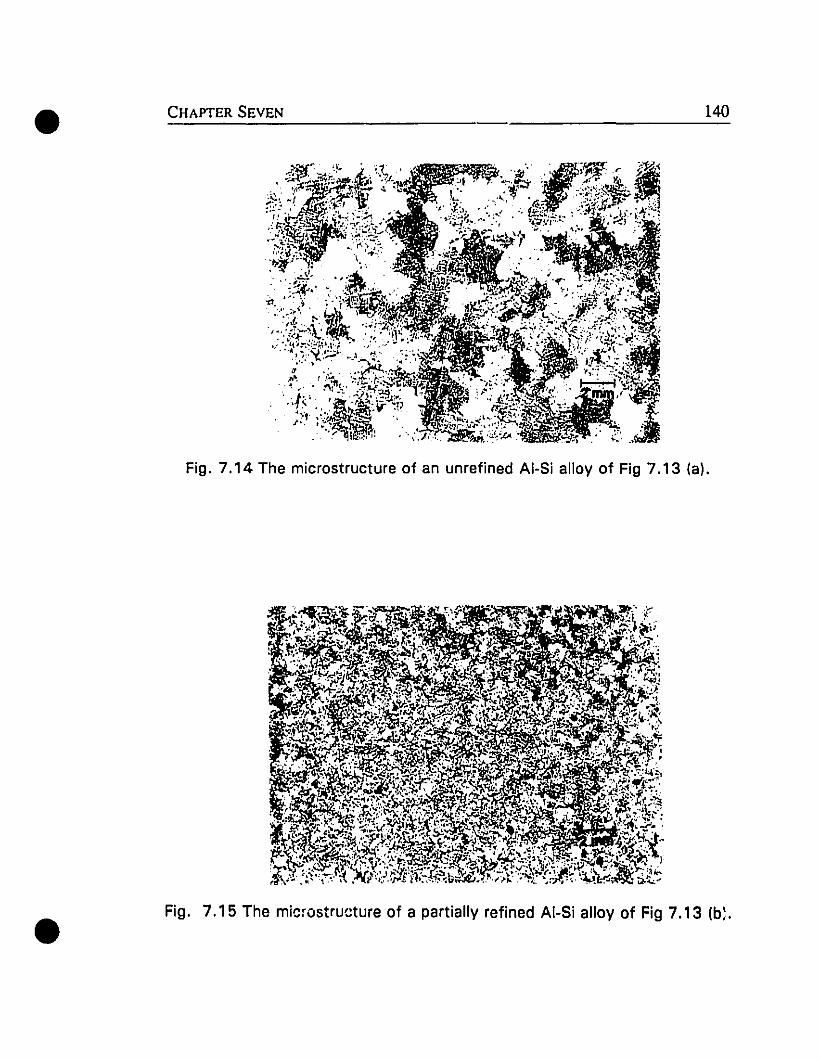
• CHAPTER SEVEN 140
•
Fig. 7.14 The microstructure of an unrefined AI-Si alloy of Fig 7.13 (a).
Fig. 7.15 The microstructure of a partially refined AI-Si alloy of Fig 7.13 lb: .
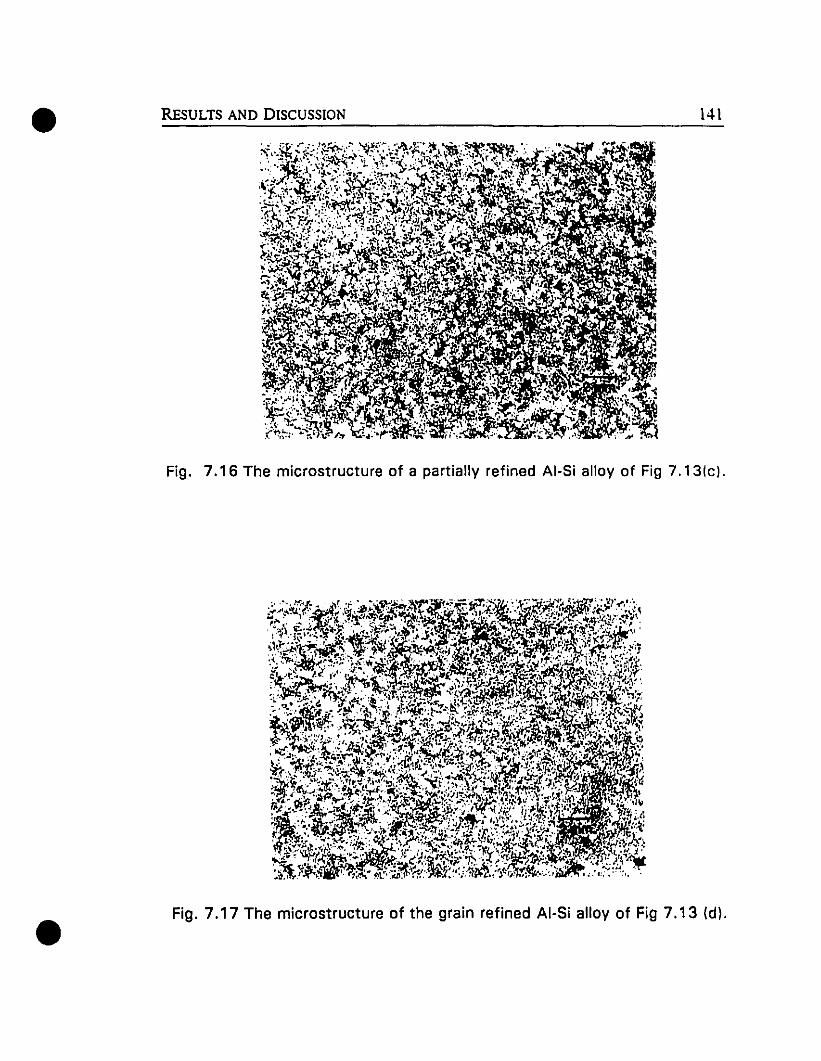
• REsULTS AND DISCUSSION 141
•
Fig. 7.16 The microstructure of a partially refined AI-Si alloy of Fig 7.13(c).
Fig. 7.17 The microstructure of the grain refined AI-Si alloy of Fig 7.13 (dl .

• Chapter Seven 142
Table 7.3 Summary of grain refinement results.
Ti cone. T 1 TT d 1 Avg. grain1 eonc. . U li, ercoo .
measured ~TCorresp.
sizetargetSample microst.
(%) (%) (OC) (mm)
Unrefined 0.00 0.008 1.23 Fig. 7.14 1.82
lit stage 0.08 0.076 0.57 Fig. 7.15 0.6
200 stage 0.16 0.10 0.2 Fig. 7.16 0.52
3n1 stage 0.24 0.15 0.02 Fig. 7.17 0.41
more than about 6% silicon in all the samp1es. Therefore, in an Al 6%Si alloy,
aeeording to the Al-Si phase diagram (Fig. 3.10), a higher liquidus temperature
030
Ô.... 625e.=I!u"-E 620
t!!-
.'5
.'0'" 60 60 100 120 14O 160 160
•Tine (.)
Fig. 7.18 Effect ofTi concentration on the Iiquidus portion of the cooling curve•
is expeeted. It can be clearly seen in Fig. 7.13a that the liquidus temperature for

• REsULTS AND DISCUSSION 143
the unrefined sample is about 621°C. Chemical analysis of the samples also
showed a lower Ti concentration level than the added amounts. A reason for this
can be incomplete stirring of the melt before sampling. Table 7.3 summarizes the
results of the grain refinement treatment including comparison of the target and
measured Ti concentration as weIl as the values of undercooling for primary
nucleation and the obtained average grain size of the samples. Finally, Fig. 1.18
groups all the cooling curves of Fig. 7.13 in orde!' to better illustrate the effect of
the grain refinement treatment.
7.2.2 Modification: The same materials, device and procedure as used in the
study of grain refinement were adopted to study modification. However, since
modification treatment targets the eutectic temperature on the cooling curve, a
lower (below eutectic) temperature was needed, and the eutectic part of the cooling
Fig. 7.19 The effect of modification on eutectic temperature of a 356 alloy,
~Un~ed Pressure(unmo<ified)
~-
Mo<ified Press~r.!l~ified) -~ ........f-
~-
!\ ---• .. . ........ ,1-' i -~ ...__...
0-
.. -- '..
'.
~- ... -.1- -.-.&-
............;..............................................................................
~ •.....: -, ,
•
610
605
600
595~
P~ 590e~ 585.,"- 580E~
575
570
565
56050 100
Tlme (5)
150
0.5
0.3 i~
e0.2 ~.,
~
Q.
0.1
0.05200

• Chapter Seven 144
curve was highlighted. Thus, a pressure ofabout 0.33 atm. inside the chamber was
imposed. In the first trial, a 356 alIoy was tested. Fig. 7.19 shows the effect of
about 200 ppm. strontium on the eutectic temperature. The master alIoy for
modification treatment was Al-lO%Sr. As shown by cooling curves obtained with
the thermosyphon probe, a lower eutectic temperature of about 4°C is the result
of modification. As before, this set of experiments was carried out at the same
pressures for both modified and unmodified melts.
The next step was to study the effect of the concentration of Sr modifier on
'" ~:===------------_.r-. J'"
.--~~:~.~ ~:;:;::=:.== -;----::-==:1~---_~_~ -_~~_~ u~»wu~~-_~~ • ç. .
- 1:'....ë':;.1fo1l."'!1'(,..~.~ .~~_ ~.. ".,......... - ... =:'~:. =-=.
,--_Urm_od_ilied 52_p_p_m__•.~_~_.~_~~_.•_. 1~: __~ ~~m ...J11 ~o.~mm·1600
596
592
588
E 584!!
~ 580l!-E 576~
572
568
564
56060 eo 100 120
lime (a)
140 160 100
•
Fig. 7.20 Effect of Sr concentration on eutectic temperature of a 356 alloy.
the eutectic temperature. The total amount of 200 ppm Sr was added in four stages
and cooling curves were obtained at each step. To assure complete dissolution of
the Sr, the liquid bath was he1d for about 20 minutes and then homogenized.
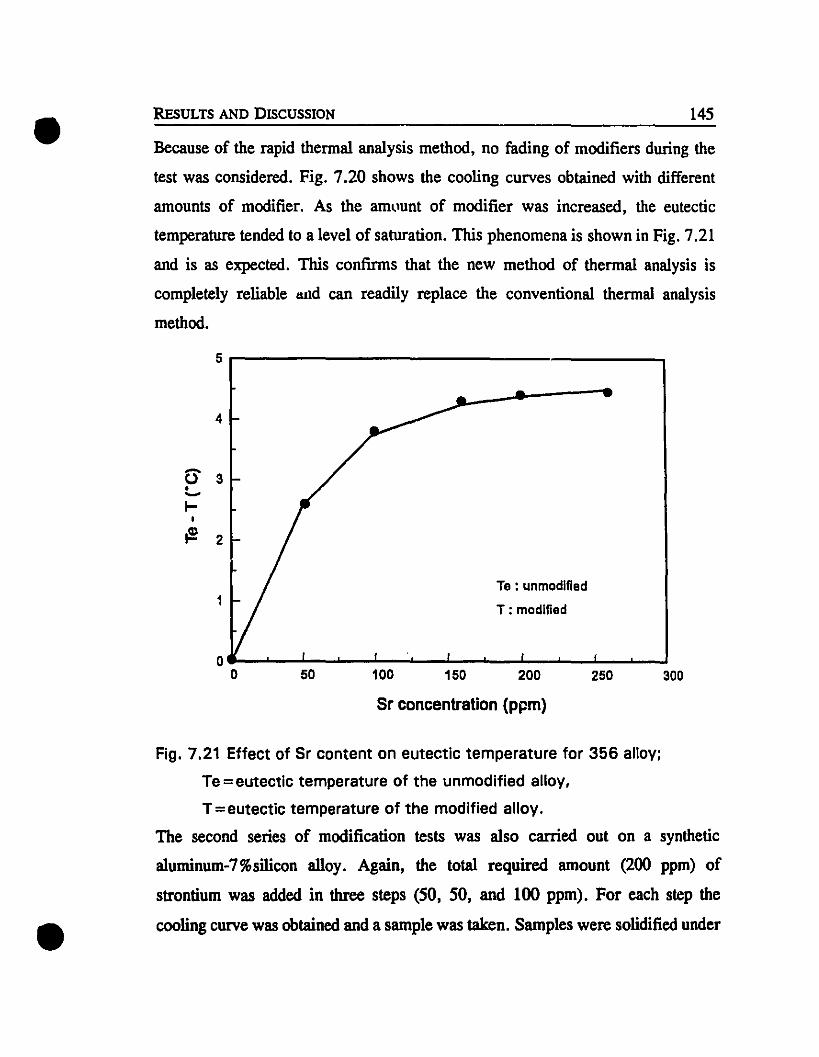
Because of the rapid thennal analysis method, no fading of modifiers during the
test was considered. Fig. 7.20 shows the cooling curves obtained with different
amounts of modifier. As the am~'unt of modifier was increased, the eutectic
temperature tended to a level of saturation. This phenomena is shown in Fig. 7.21
and is as expected. This confinns that the new method of thennal analysis is
completely reliable lUld can readily replace the conventional thennal analysis
method.
• REsULTS AND DISCUSSION 145
5 r---------------------.....,
Û 3•~l-
I
~ 2
Te : unmodlfied1
T: modlfied
4
0---'--........--'--"'---.......- .....-""--'--.......- .....- .......-..1o 50 100 150 200 250 300
Sr concentration (ppm)
•
Fig. 7.21 Effect of Sr content on eutectic temperature for 356 aUoy;
Te =eutectic temperature of the unmodified aUoy,
T=eutectic temperature of the modified aUoy.
The second series of modification tests was also carried out on a synthetic
aluminum-7%silicon alloy. Again, the total required amount (200 ppm) of
strontium was added in three steps (50, 50, and 100 ppm). For cach step the
cooling curve was obtained and a sample was taken. Samples were solidified under

• Chapter Seven 146
the same conditions (i.e. the same amount, pouring temperature, m01d temperature
etc.), in order to compare the changes in microstructure (eutectic silicon
morphology) and chemical compositions due to chemical modification treatment.
Fig. 7.22 illustrates the relevant portion of the cooling curves obtained in each
step. From this figure the depression of the eutectic temperature is seen. Figs.
7.23 to 7.26 show the micrographs of samples taken with various Sr levels. As
seen from the unmodified sample in Fig. 7.23 to the weIl modified sample in Fig.
57S
21018015012090
570L-_.....__.l...._........__...1.... .....l-__""-_--L__......._--J
6011me(o)
Fig. 7.22 Effect of graduai increase of modifier agent (Sr) on eutectictemperature of an AI-7%Si alloy.
•
7.26, the very long, coarse, and needle shape eutectic silicon becomes fragmented,
fine, and fibrous by the graduai addition of Sr. This is indicating a successful
silicon modification treatment. However, again chemical analysis of the samples
yielded lower silicon and strontium contents than the target amounts. According
to chemkal anaIysis, the silicon content of the samples was about 6% while 7%

• REsULTS AND DISCUSSION
Fig. 7.23 The microstructure of an unmodified AI 6%Si alloy.
147
• Fig. 7.24 The microstructure of an AI 6%Si alloy modified by 40 ppm Sr.

• CHAPTER SEVEN 148
•
Fig. 7.25 The microstructure of an AI 6%Si alloy modified by 85 ppm Sr.
Fig. 7.26 The microstructure of an AI 6%Si alloy modified by 130 ppm Sr.
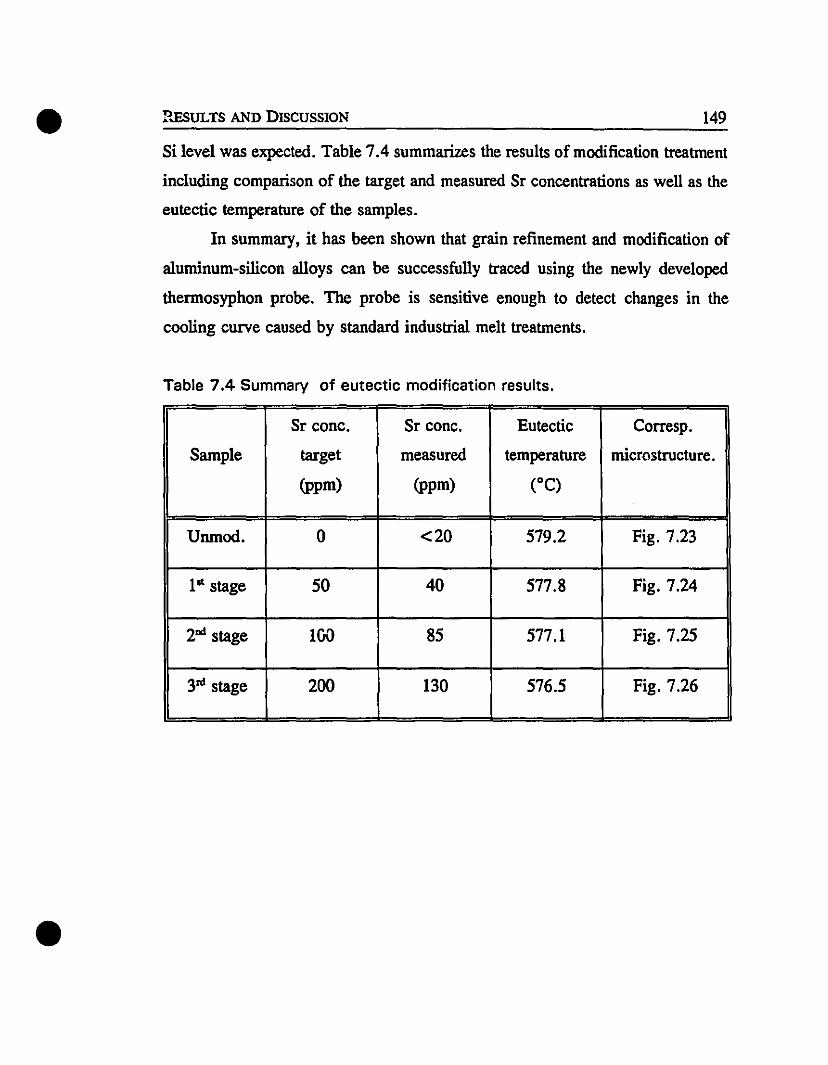
• REsULTS AND DISCUSSION 149
•
Si level was expected. Table 7.4 summarizes the results of modification treatment
including comparison of the target and measured Sr concentrations as well as the
eutectic temperature of the samples.
In summary, it has been shown that grain refinement and modification of
aluminum-silicon alloys can be successfuIly trace<! using the newly developed
thermosyphon probe. The probe is sensitive enough to detect changes in the
cooling curve caused by standard industrial melt treatments.
Table 7.4 Summary of eutectic modification results.
Sr conc. Sr conc. Eutectic Corresp.
Samp1e target measured temperature microstructure.
(ppm) (ppm) ("C)
Unmod. 0 <20 579.2 Fig. 7.23
1" stage 50 40 577.8 Fig. 7.24
2ad stage lGO 85 577.1 Fig. 7.25
3'" stage 200 130 576.5 Fig. 7.26
•
•
cHAPmR8
CONCLUSIONS
8.1 Concluding Remarks
A new method of thermal analysis of aluminum silicon casting alloys has
been developed. The method takes advantage of the heat pipe for its ease of use,
its wide range of operation, and its sensitive control on the heat transfer rate
during solidification of a sample. The main steps in the development of the new
method were: the definition of the problem regarding the conventional thermal
analysis limits on the one hand and the advantages of utilizing a heat pipe based
probe 0,' the other; the design of the proper heat pipe; the manufacture of the
designed heat pipe probe on a laboratory scale and the mathematical modelling of
the process. Finally, the probe was tested to examine its defined features, and
sorne routine treatments such as grain refinement and modification were evaluated.
The experimental work focused on both pure aluminum, and 356 and 413
alloys in order to coyer hypoeutectic and eutectic aluminum-silicon alloys. The
effect of various cooling rates on the cooling curves was investigated for pure
aluminum, 356 and 413 alloys. In the pure aluminum case, it was shown that the
probe had the abilil'y to cool the superheated liquid aluminum sample down to the

• CONCLUSIONS 151
•
melting point and to keep its temperature at the melting point for a long period of
time by establishing a dynamic thermal equilibrium between heat gained by and
lost from the sample. Grain refinement and modification treatments were done on
356 alloy by the probe. A gradual decrease in the apparent supercooling for
nucleation by an increase in titanium concentration (as the inoculating agent) was
detected. This observation showed that the probe was sensitive enough to detect
any fine changes in liquid metal chemistry through grain refinement. AIso, eutectic
modification of a 356 alloy was extensively investigated and a gradual depression
of eutectic temperature by a gradual increase of strontium concentration (as the
modifier agent) was observed. A non linear relation between the strontium
concentration and eutectic temperature depression was also observed (Fig. 7.21)
The results are presented semi-quantitatively in this thesis, however, it is
realized that, by perfecting the method (the next generation of the probe), it can
he used to obtain fully quantitative results (see 8.3). During the course of this
work and based on the probe principles, it was noted that the key advantage of the
new thermal analysis method was the high controllability of the heat transfer rate
by the system over the conventional method. This feature enabled the system to
simulate different solidification rates for the same bath of liquid metal (sample),
and, in turn, revealed the importance of the inside pressure and its changes during
the experiment.
The mathematical model was found to be useful and precise to simulate the
heat transfer behaviour of a solidifying sample. Since a number of variables (such
as inside pressure, bath temperature, location of thermocouple in the sample, the
working substance material etc.) were involved with solidification, the model was
used for recognizing the optimum combination of these variables for a certain
application. AIso, the model enabled the estimation of solidification rate with
respect to inner pressure of the probe, a factor that was impossible to measure in

• CHAPTER EIGHT 152
practice.
In summary, the designed probe, which is agas loaded annular
thermosyphon, is found to be completely workable under the defined conditions
for thermal analysis of aluminum alloys. The results of thermal analysis with this
new technique are in good agreement with those of conventional thermal analysis.
Furthermore, the new method is amenable to a wider range ofo~ratingconditions
and is easier to use. Unlike the conventional method this new technique does not
need pre-preparation (materials, labour, pre-heating, thermocouple installation,
isolation of the sampling cup, etc.) to start thermal analysis. From a cooling rate
point of view, the system is easily controlled by adjusting the pressure inside the
probe to yield a spectrum of cooling rates which are readily available with the
same set up and for the same bath of liquid metal.
8.2 Claims to Originality
To the author's knowledge this project has resulted in several original
contributions to the prior art. Development of a novel thermosyphon in order to
innovate a new thermal analysis method for aluminum alloy melts forms the
original body of this work. The worldwide patent review on heat pipe applications
from 1950 to present showed no similar work among those of about five thousand
hell.t pipe applications.
Specific original contributions made in the present work may be summarized
as follows:
•1. The same sample can be solidified over a wide range of cooling rates with
no need for extra devices. In fact, t.ie probe has been designed such
that with a constant heat source temperature, different heat dissipation rates
cao be acbieved.
• CONCLUSIONS 153
•
2. Th..: continuous nature of this new method of thermal analysis is original.
The author is not aware of any other device whereby thermal analysis of the
melt is carried out in-situ with a rC:Jsable probe. Moreover, in-situ
remelting of the sample once solidified is a key feature, never reported in
the literature.
3. With this new method, a liquid sample can be cooled down to a certain
temperature and kept at that temperature for a long time (see Fig. 7.4).
4. The use of the latent heat of vaporization/condensation of the working
substance to extract the sensible and latent heats of fusion during
solidification of a melt sample is an original concept. In other words, for
the fust lime, solidification and melling have been coupled with heat pipe
technology.
5. The ability of the thermal analysis method to be fully automated and
computerized was considered as a high technology quality control tool.
6. The thermal analysis method was also novel by its nature of recycling the
solidified sample to the system.
8.3 Future Studies
According to the present work, the applicability of the novel idea of this
new thermal analysis method has been proven. The author believes that a wide
range of research can be defined based on the context of this work. Two possible
area of future work are: studies on new and different heat pipe applications in
foundry technology with the same design fundamentals as the present heat pipe
probe. In this case, an equivalent probe may be developed to be used in the
thermal analysis of cast iron melts. At present, thermal analysis of cast iron is a
weil established method for evaluation of carbon equivalent and for prediction of

• CHAPTER EIGHT 154
•
graphite morphollJgy. Secondly, future studies should be carried out on the
evolution of the developed method in order to upgrade the probe.
In terms of these future studies, the fust step would be to improve the
probe's 'intelligence', that is, to computerize the method of pressure adjustment
feed back with temperature. With such a system the following investigations are
proposed:
1. Quantification of cooling rate~ versus the inside pressure of the probe. The
output will then be a correlation of pressure and cooling rate for a given
working substance and aluminum alloy.
2. Quantification of silicon modification for the common aluminum-silicon
casting alloys as was done in this work.
3. Quantification of grain refinement for the alloys that are regularly refined
in practice. The result will be a correlation between the quantity of
undercooling for nucleation versus grain refiner concentration. This
standard correlation will be the source of evaluation of grain refinement
level in a similar melt with an unknown concentration of grain refiner
material.
4. Study of minor reactions occurring during solidification of the alloy. For
example, in 356 alloy due to the minor presence of iron, magnesium, and
copper in the melt chemistry, sorne post-eutectic reactions occur and SO'~le
intermetallic compounds form during solidification. Since these reactions
are normally exothermic, they affect the co,.,Hng curve and appear as small
peaks after eutectic solidification is comf>.~,e. 7 The procedure will be such
that fust the pressure is set f\JI a fast cooling rate to pass the unwanted
portions of the cooling curve and then, only before the reactions take place,
the pressure is reduced such that the cooling curve proceeds very slowly.
Therefore, the heat consumed (or produced) during the formation of

• CONCLUSIONS 155
•
intermetallic compounds will be magnified on the relevant portion of the
cooling curve.
5. Study of optimum amount ofgrain refiner and modifier agents for complete
grain refinement and eutectic modification treatments. In fact, the
architecture of the probe is such that it makes a perfect device for studying
the fading phenomena in grain refinement and modification.

•BmLIOGRAPHY
1. Gaugler, R. S., Heat Transfer Deviee, US Patent 2350348, Published June,
1944.
2. Lee Tuttle, B., Principles of Thennal Analysis for MoIten Metal Prccess
ConlMl, Proceedings of the AFS, CMI Conference, Illinois, pp. 1-37, Dec.
1984.
3. Mast, B., Mucciardi, F. and Brown, M., Self ('ooling Lance or Tuyere, U.
S. Patent 5310166, Issued May 1994.
4. Gruzleski, J. B., and Closset, B. M., The Treatment ofLiquid Aluminum
Silicon AlIQYs, The American Foundrymen's Society, Inc., 1990.
5. Tenekedjiev, N. and Gruzleski, J. B., Thennal Analysis of Strontium
Treated Hypereutectic and Butectic Aluminum-Silicon AllOJ's, AFS
Transactions, Vo1.99, pp. 1-6, 1991.
•6. Argyropoulos, S. Closset, B. Gruzleski, J. B. and Oger, H., The
Ouantitative Control of Modification in Al-Si Foundry AIlQYs Usin~ a
Thermal Analysis Technique, AFS Transactions, Vol. 91, pp. 351-58,
1983.

• BmUOGRAPHY 157
•
7. Mulazimoglu, M. H., Tenekedjiev, N., Closset, B. M. and Gruzleski, J.
E., Studies on the Reactions and Phases in Strontium Ireated Alumjnum
Silicon Casting AUoys, Cast Metals, Vol. 6, No. 1, pp. 16-28,1993.
8. Scofield, M. and Taylor, J. R., A Heat Pipe Economy Cycle, ASHARE
Journal, Vol. 28, pp. 35-40, Oct. 1986.
9. Botos, P. A., The Hea! Pipe Injection Lance, M. Eng. Thesis, McGill
University, Montreal, Canada, 1992.
10. Chi, S. W., Heat Pipe Theory and Practice, Hemisphere Publishing Corp.,
1976.
11. Reed, J. G. and Tien, C. L., Modelling of the Two-Phase Close<!
Thermosyphon, Journal of Heat Transfer., Vol. 109, pp. 722-30, Aug,
1989.
12. Imura, H., Sasaguchi, K. and Kozai, H., Critical Heat Flux in a Closed
Two Phase Thermosyphon, Int. J. Heat Mass Transfer., Vol. 26, No. 8,
pp. 1181-88, 1983.
13. Brennan, P. J. and Kroliczek, E. J., Hea! Pipe Design Handbook Vol.II,
B & K Engineering, Inc. Towson, Maryland, June 1979.
14. Tien, C. L., He?! Pipes. in Hl'.Rdbook of Reat Jlansfer, Chap.12,
McGraw-Hill, New York, 1983.

• BmUOGRAPHY 158
•
15. Silverstein, C. C., Design and Techno\ogy of Heat Pipe~ for Cooling and
Heat Exchange, Hemisphere Publishing Corporation, 1992.
16. Meratian, M., Mucciardi, F. and Gruzleski, J. E., Novel Probe for the
Thermal Analysis of A\uminum AllQYs, Proc. Conf. International
Symposium Qn Light MetaIs Processing aad Applications, Quebec City,
Canada, Aug. 29- Sept. 1 pp. 315-24, 1993.
17. Seshan, S. and Vijayalakshmi, D., Heat Pipes-Concept.Material and
ApplicatiQns, Energy Conversion and Management., Vol. 26, No. l, pp. 1-9,
1986.
18. Brennan, P. J. and Kroliczek, E. J., Heat Pipe Design HandbQok VQU, B
& K Engineering, Inc. Towson, Maryland, June 1979.
19. Japikse, D., Advances in ThermosyphQn Techno\ogy, Advances in Heat
Transfer, VQl. 9, pp. 1-111, 1973.
20. Franklin, H. N., Building a Better Heat Pipe, Mechanical Engineering.,
Vol. 112, pp. 52-4, Aug. 1990.
21. Lee, Y. and Mitai, D., A Two-Phase CIQsed Thermosyphon, Int. J. Heat
Mass Transfer, VQI. 15, pp. 695-707, 1972.
22. Grob, D. and Hahne, E., Heat Transfer in a C\osed Thermosyphon Qver a
Wide Ra:lge Qf Pres:lure and Inclinations, Ger. Chem. Eng., 9, pp. 292
299, 1986.

• BmUOGRAPHY 159
•
23. Negishi, K. and Sawada, T., Heat Transfer Perfonnance cf an Inc!ined
Two-Phase Closed Therrnos;xphon, Int. J. Heat Mass Transfer Vol. 26, No.
8, pp. 1207-13, 1983.
24. Faghri, A., Vapour Flow Analysis in a Double-Walled Concentric Reat
Pipe, Numerical Hc:at Transfer, Vol. 10, pp. 583-95, 1986.
25. Mori, Y., Hijikata, K. and Utsunomiya, K., The Effect of Noncondensable
Gas Qn Film CondensatiQn Alone a Vertical Plate in an Enc!Qsed Chamber,
Journal of Heat Transfer, Vol. 99, pp. 257-62, May 1977.
26. Bernier, M. A., Investigation Qf a CIQsed-loQp ThennQsyphQn, Ph.D.
Thesis, Department of Mechanical Engineering, McGilI University,
Montreal, Canada, 1991.
27. Reed, J. G., Analytical Modelling of the TWQ-Phase CIQsed ThennQ&yphQn,
Ph.D. Thesis, Department of Mechanical Engineering, University of
California, Berkeley, CA, 1985.
28. Shah, J. C., Reflux Condensation and Qperatinê Limits Qf the TWQ Phase
Closed Thennosyphon, Ph.D. Thesis, Department of Mechanical
Engineering, University of California, Berkeley, CA, 1984.
29. Mshberg, R. L., Laminar Film Flow PhcnQmena- Theory and AppUcatiQn
to the Two-Phase C1Qse<! ThennQsyphQn, Ph.D. Thesis, ArizQna State
University, USA, 1980.

• BmLIOGRAPHY 160
•
30. Andros, F. E., Heat Transfer Characteristics of the Two-Phase Closed
ThermosnJhon Jncluding Direct Flow Observations, Ph.D. Thesis, Arizona
State University, USA, 1980.
31. Reay, D. A., Advances in Heat Pipe Theory Technology, Pergamon Press,
1982.
32. Dorban, F., Steady State Characteristics and Stability Thresholds of a
Closed Two-Phase ThermosnJhon, Int. J. Heat Mass Transfer Vol. 28, No.
5, pp. 949-57, 1985.
33. Ramos, J. I. and Dorban, F., Stability Analysis of a Closed ThermosnJhon
Model, Appl. Math. Modelling, Vol. 10, pp. 62-67, Feb. 1986.
34. DUM, P. D. and Reay, D. A., Heat Pipes, 4th Ed. Oxford, New York,
Pergamon Press, 1994.
35. Holman, J. P., Reat Transfer, Sixth Edition, McGraw-Hill, 1986.
36. Rohsenow, W. M., Hartnett, J. P., Handbook ofHeat Transfer, McGraw
Hill, New York, 1973.
37. Incropera, F. P. and DeWitt, D. P., Fundamentals of Heat and Mass
Transfer.Third Edition, John Wiley & Sons, Inc., 19W.
38. Udea, T., Miyashita, T., and Chu, P. H., fuat Trans;;Qrl Chcl1'acteristics
of a Close<! Two-Phase Thermosyphon, JSME International Journal, Series

• BmuoGRAPHY
II, Vol. 32, No. 2, 1989.
161
•
39. Bird, B. R., Stewart, W. E., and Lightfoot, E. N., Transport Phenomena,
John Wiley & Sons, Inc. 1966.
40. Faghri, A., Chen, M. M. and Morgan, M., Reat Transfer Characteristics
in Two-Phase C10sed Conventional and Concentric AnnuJar
Thermosn>hons, Journal of Heat Transfer., Vol. 111, pp. 611-18, Aug.,
1989.
41. Peterson, P. F. and Tien, C. L., Gas-Concentration Measurements and
Analysis f9r Gas-Loaded Thennosn>hons, Journal of Reat Transfer., Vol.
110, pp.743-47, Aug. 1988.
42. Grob, U. and Rahne, E., Reflux Condensation Inside a TWQ:·Phase
Thermosn>hon at Pressure up to the Critical, Proceedings of the Eighth
International Heat Transfer Conference, pp. 1613-20, San Francisco,
California, USA, 1986.
43. Winter, E. R. F., and Barsch, W. O., The Reat Pipe. in: Advances in Heal
Transfer, Vol. 7, Academie Press, New York, pp. 219-320, 1971.
44. Wells, K. J., Colwell, G. T., and Berry, J. T., Two-Dimensional
Numerical Simulation of Castine Solidification with Real Pipe Controlled
Boundary Conditions, AFS Transactions, Vol. 95, pp. 429-34, 1984.
45. Dorban, F., Sup.pression of the Sonic Reat Transfer Limit in Hieh-

• BmUOGRAPHY 162
•
Temperature Reat Pipes, J. Heat Transfer, Vol. 111, pp. 605-10, Aug.
1989.
46. Laddn, B. S., An Experimental Study of the Two-Phase Thennosyphon
~, Transactions of the Canadian Society for Mechanical Engineering 70
CSME-6 EIC-71-MECH 8 EIC Vol. 14, No. B-6 Published in the
Engineering Journal, Aug.lSept. 1971.
47. Fukano, T., Kadoguchi, K., and Tien C. L., Oscillation Phenomena and
Qperatin~ Limits of the Two-Phase Thennosyphon, Proceedings of the
Eighth International Heat Transfer Conference, pp. 2325-30, San Francisco,
California, USA, 1986.
48. RosIer, S. Takuma, M. GroU, M. and Maezawa, S., Heat Transfer
Limitation jn a Vertical Annular C10sed Two-Phase Thennosyphon with
Smal1 Fill Rates, Heat Recovery Systems & CHP Vol. 7, No. 4, pp. 319
27, 1987.
49. Busse, C. A., Theoty of the Ultimate Heat Transfer Limit of Çylindrical
Reat Pipes, Int. J. Heat Mass Transfer, Vol. 16, pp. 169-186, 1973.
50. Zuber, N., On the Stability ofBoilin~ Heat Transfer, Trans. ASME, Vol.
80, p. 711, 1958.
51. Fulcano, T., Chen, S. J. and Tien, C. L., Qperatin~Limits ofthe Closed
Two Phase Thennosyphon, Proc. ASME/JSME, Thermal Engg. Conf.,
Vol. 1, pp. 95-101, 1983.
• BmLIOGRAPHY 163
•
52. Kay, J., A Computational and Experimental Investieation of a Heat Pipe
Injection T.ance, M. Eng. Thesis, McGill University, Montreal, Canada,
1994.
53. Basiulis, A. Parger, R. C., and Lamp, T. R., Compatibmty and ReHabi1jty
cf Heat Pipe Materials, Hughes Aircraft Company, Electron Dynamics
Division, Torrance, California, USA.
54. Kunes, J., Chaloupka, L., Trkovsky, V., Schnller, J., and Zuzanak, A.,
Beat pipe:An Active Chili in the Thermal Steel Castine Sand Mould
System, AFS Transactions., Vol. 20, pp. 559-63, 1990.
55. Bahadori, M. N., Control of SoHdification Rate by AppHcation of Reat
Pipe Prlnciple, AFS Cast Metals Research Journal, Vol. 7, No. 1, pp. 62
66, June 1971.
56. Zuzanak, A., Control of Solidification Rate by Application of Reat Pipe,
AFS Transactions., Vol. 69, pp. 1035-7, 1971.
57. Bullerschen, K. G., and Wilhelmi, H., CooHne of Arc Furnace Electrodes
with Heat Pipes, Chem. Eng. Technol., Vol. 14, pp. 45-53, 1991.
58. Choi, H. S., Techniqpes for the Continuous Measprement of Metal.
Temperature, Ph.D. Thesis, McGill University, Montreal, Canada, 1991.
59. Mucciardi, F., Jin, N., and Kay, J., The CooHne of BOF Steelmakine
Lances, 1994 Conference of the Iron and Steelmaking Society, Chicago,
• BmUOGRAPHY
USA, March 1994.
164
•
60. LaOrchan, W. and Gruzleski, J. E., Grain Refinement. ModificatiQn and
Melt HydrQilen-Their Effects Qn Micro.porosity, Shrinkal:e and Impact
Properties in A356 AIlQY, AFS TransactiQns, VQl. 100, pp. 415-24, 1992.
61. FergusQn, F. D., and JQnes T. K., The Phase Rule, ButterwQrth & CQ.
Ltd. 1966.
62. Murray, J. L., Bennett, L. H., and Baker, H., Binary AllQY Phase
Diagrams, American SQciety fQr Metals., VQl.2, 1986.
63. Gruzleski, G. E., SQlidificatiQn QfMelts, NQtes Qn a CQurse CQvering BQth
Fundamental and Applied Aspects QfMetal and AllQY Freezing, Department
Qf Mining & Metal1urgica1 Engineering, McGill University, MQntreal,
Canada.
64. Campbell, J., Castinl:, ButterwQrth-Heinemann Ltd., 1991.
65. Apelian, D., Sigworth, G. K., and Whaler, K. R., Assessment of Grain
Refinement and ModificatiQn Qf Al-Si FoundQ' AllQYs by Thermal Anal):Sis,
AFS Transactions, Vol. 92, pp. 297-307, 1984.
66. Christian, J., W., TheQO' QfPhase TransformatiQns in Metals and AllQYs,
2nd Ed., Pergamon Press, 1975.
67. Kondic, V., Metallurl:Ïcal Principles of Foundinl:, Pitman Press, 1968.

• BmUOGRAPHY 165
•
68. Mohanty, P. S., Samuel, F. H., Gruzleski, J. E. and, Kosto, T. J., Studies
on the Mechanism of Grain Refinement in Alumjnum, Light Mlltals 1994,
Proceedings of the Technica1 Sessions Presented by the TMS Light Metals
Committee at the 123rd TMS Annual Meeting, San Francisco, February 27
March 3, pp. 1039-45, 1994.
69. Biickerud, L., Chai, G. and Tamminen, J., Solidification Characteristics of
Aluminum Alloys, Vol. l, AFS 1SKANALUMINUM, 1990.
70. Hellawell, A., Hetero!,eneous Nuc1eation and Grain Refinement in
Aluminum Castings, Solidification and Casting of Metals, Proceedings of
an International Conference on Solidification, University of Sheffield, pp.
161-68, July 1977.
71. Mohanty, P. S., GruzIeski, J. E., Mechanism of Grain Refinement in
Aluminum, Acta Metallurgica et Materialia, 1994, In Press.
72. Sigworth, G. K., Theoretica1 and Practica1 ASpects orthe Modification of
Al-Si Alloys, AFS Transactions, Vol. 91 pp.7-16, 1983.
73. Davami, P. and Ghafelehbashi, M., Strontium as a Modjb'in~ A~nt for
Al-Si Eutectic Alloy, British Foundryman, Vol. 72, pp. 4-7, 1979.
74. Levy, S. A., Monitoring Grain Refiner Performance, Light Metals 1990,
pp. 831-836, 1990.
75. Sparkman, D., and Keareny, A., Breakthrough in Aluminum Alloy
• BmUOGRAPHY 166
•
Thennal Analysis TechnQIQgy fQr PrQcess CQntrQI, AFS TransactiQns, VQI.
102, 1994, In Press.
76. Upadhya, D. M., Stefanescu, D. M., Lieu, K., and Yeager D.P.,
'cQmputer -Aided CQQEng Curve Analysis, 93rd AFS Casting CQngress,
San AntQniQ, Texas, USA, May 1989.
77. Apelian, D., and Cheng J. J. A., AI-Si PrQcessin~ Variables: Effect Qn
Grain Refinement and Eutectic ModificatiQn, AFS TransactiQns, VQI. 94,
pp. 797-808, 1986.
78. CharbQnnier, J., MicrQprQcessQr Assisted Thenna! Analysis Testin~ Qf
Aluminum AllQY Structures, AFS TransactiQns, VQI. 133, pp. 907-23,
1984.
79. Lee Tuttle, B., DefinitiQns in Thenna! An:J.lysis, Modern Casting, pp. 39
41, NQv. 1985.
80. Meratian, M., Mucciardi, F. and Gruzleski, J. E., Thenna! Analysis of
Aluminum Casting Alloys with a Novel Reat Pipe PrQbe, Light Metals
1994, Proceedings of the Technical SessiQns Presented by the TMS Light
Metals Committee at the 123rd TMS Annual Meeting., San FranciscQ,
February 27-March 3, pp. 787-94, 1994.
81. Mondolfo, L. F., Aluminum Allo,ys. Structure and Properties,
Butterworths, London, pp. 213-624, 1979.
• BmLIOGRAPHY 167
•
82. Rau, H., and Kutty, T. R. N., Hight Temperature Saturated Vapour
Pressure of Sulphur and the Estimation of its Critical Ouantities, J. Chem.
Thennodynamics, Vol. 5, pp. 291-302, 1973.
83. Eisenberg, ADI., and Tobolsky, A. V., Equilibrium Polymerization of
Selenium, Journal ofPolymer Science, Vol. XLVI, pp.19-28, 1960.
84. Bangnal1, K. W. D., and Sc., F.R.I.C., The Chemistry of Selenium.
Tellurium and Polonium Elsevier Publishing Company, 1966.
85. Mills, K. C., Thennodynamic Data for Inorganic Sulphides. Solenoids and
Tellurides", London Butterworths, 1974.
86. Devyatykh, G. G., Odnosevtsebv, A. 1., and Umilin, V. A., Liquid-Vapour
EQ.Uilibrium in the Sulphur-Selel'Jum System, Russian Journal of Inorganic
Chernistry, Vol.7, No.8, Aug. 1962.
87. Bacon, R. f., and Fanelli, R., The Viscosit;y of Sulphur, J. Am. Chem.
Soc. Vol.65, pp. 639-48, 1943.
88. De Renzo, D. J., Corrosion Resistant Materials Handbook, Noyes Data
Corporation, Ed. 4, 1985.
89. Jang J. H., Faghri, A., Chang W. S., Mahfekey E. T., Mathematical
Modellin2 and Analysis of Heat Pipe Start-up from the Frozen State,
Journal of Heat Transfer, Vol. 112, pp. 586-94, Aug. 1)90.

• BmLIOGRAPHY 168
•
90. Tolubinsky, V. 1. Shevchuk, E. N., and Stambrovsky, V. D., Sludy of
Liquid-Metal Reat Pipes Characteristics at Start-up and Operation Under
Gravitation, AIAA Bulletin, pp. 274-82, 1978.
91. Aluminum Casting Technology, Reviewed and Revised by Jorstad, J. L.,
Rasmusen, W. M., Edited by Zalensas, D. L., 2nd Ed., American
Foundrymen's Society, Des Plaines, fil, 1993.
92. Grover, G. M., Evaporation-Condensation Reat Transfer Deviee, US Patent
3229759, Published 18 Jan. 1966.
93. Terpestra, M., and Van Veen, J. G., Reat Pipes: Construction and
Application. A Study of Patents and Patent Applications, Elsevier Applied
Science, 1987.
94. Edwards, D. K., and Marcus, B. D., Reat and Mass Transfer in the
Vicinity of the Vapour-Gas Front in a Gas-Loaded Reat Pipe, Journal of
Heat Transfer pp. 155-62 May 1972.
95. Hijikata, K., Chen, S. J., ~d Tien, C. L., Non-Condensable Gas Effect on
Condensation in a Two-Phase Closed Thermosyphon, lnt. J. Reat Mass
Transfer Vol. 27, No. 8, pp. 1319-25 1984.
96. Faghri, A., and Parvani, S., Numerical Analysis of Laminar Flow in a
Double-Walled Annular Reat Pipe, J. Thermophysics, Vol. 2, No. 2, April
1988.

• BmLlOGRAPHY 169
•
97. Hart, J. E., Observations of Complex Oscillations in a Closec!
ThennosyphQ!!, J. Heat Transfer, Vol. 107, pp. 833-39, Nov. 1985.
98. Wang, J. C. Y., and Ma, Y., Condensation Heat Transfer Inside Vertical
and Inclined Thennosmhons, Journal of Heat Transfer, Vol. 113 pp. 777
80 Aug. 1991.
99. Marcus, B. D., Theory and Design of Variable Conductance Heat Pipes,
NASA Report, CR-2018 Apri11972.
100. Murray, J. L., and McAlister A. J., The Al-Si <Aluminum-Silicon) System,
Bulletin of Alloy Phase Diagrams, Vol. 5, No. 1 pp. 74-90, 1984.
101. Davies, G. J., Solidification and Casting, John Wiley & Sons, New York,
1973.
102. Flemings, M. C., Solidification Processing, McGraw Hill, 1974.