γ-al o nanofibers - shodhganga : a reservoir of indian theses...
TRANSCRIPT

124
Chapter 5
Adsorption of dyes from aqueous solution on
γ-Al2O3 nanofibers
Alumina is made from bauxite, a naturally occurring ore containing variable amounts of
hydrous aluminum oxides. Free Al2O3 occurs in nature as the mineral corundum and its
gemstone forms, sapphire and ruby. Some alumina is still produced by melting bauxite in
an electric furnace, but most of the alumina is extracted from bauxite by Bayers method.
This method results in the production of several grades of granular or powdery alumina,
including activated alumina, smelter-grade alumina and calcined alumina [1]. Alumina
has many appealing properties which makes the material interesting for applications in
many different areas. Activated alumina is a porous, granular substance that is used as a
substrate for catalysts and as an adsorbent for removing water from gases and liquids [2].
Smelter-grade alumina accounts for 90% of all alumina produced and it is electrolyzed to
produce aluminum metal. Calcined alumina is made into a variety of ceramic products,
including spark-plug insulators, integrated circuit packages, bone and dental implants,
laboratory ware, sandpaper grits, grinding wheels and refractory linings for industrial
furnaces. These products exhibit the properties for which alumina is well known,
including low electrical conductivity, resistance to chemical attack, high strength,
extreme hardness and high melting point.
Alumina exists in a number of crystalline phases (polymorphs), three of the most
important being γ, θ, and α. The α structure is thermodynamically stable at all
temperatures up to its melting point, but the metastable phases (γ and θ) still appear

Chapter – 5 Adsorption of dyes on γ-Al2O3 nanofibers
125
frequently in alumina growth studies. The common alumina polymorphs can all be
formed within typical synthesis temperatures, i.e., from room temperature to about
1000 °C [2].
Metal oxide nanoparticles, including nanosized ferric oxides, zinc oxides,
aluminum oxides, titanium oxides, magnesium oxides and cerium oxides [3] have drawn
great interest in recent years due to their increasing and diversified applications [4].
Because of their large specific surface area and high potential adsorptive capacity are
classified as promising adsorbents for both organic [5, 6] and inorganic pollutants
[3, 7-9].
Alumina (Al2O3) nanoparticles are widely used as coatings and abrasives due to
their excellent dielectric and abrasive properties [10, 11]. The γ-Al2O3 has been widely
used as a catalyst and catalyst support and it also has extensive applications in structural
composites and ceramic industry. Recently, nanostructured γ-Al2O3 has been prepared for
its application in the biochemical engineering. Moreover, γ-Al2O3 is commercially used
as a component in cosmetics, pharmacy and pigment, after its biocompatibility been
improved [12].
In the present method γ-Al2O3 nanofibers were synthesized according to the
mercury-mediated method reported by Q. Yang et al. [13]. The synthesized material was
characterized by XRD, FESEM, N2 adsorption studies and FTIR analysis. The adsorption
behavior of γ-Al2O3 nanofibers has been tested towards the removal of three dyes (IB,
LFR and AR 112) from aqueous solution. Batch adsorption experiments were carried out
in an incubator shaker at constant temperature. The effect of various parameters such as

Chapter – 5 Adsorption of dyes on γ-Al2O3 nanofibers
126
contact time, temperature and pH were studied and optimized. The kinetics and
thermodynamics of adsorption has been also studied.
5.1 Synthesis and characterization of γ-Al2O3 nanofibers
Figure-5.1: Images showing the various stages of γ-Al2O3 formation on aluminium plate.
In the present study, facile mercury mediated synthetic pathway was adopted for
the bulk synthesis of alumina nanofibers in the absence of surfactants. From the images
(Figure 5.1) it can be seen that the growth of white alumina fibres starts as soon as the
(a) (b)
(c)
(d)

Chapter – 5 Adsorption of dyes on γ-Al2O3 nanofibers
127
aluminium plate is removed from HgCl2 solution and exposed to the air. The grown
alumina fibres are clearly observed along the plate edges (Figure 5.1d) which ultimately
fall down after reaching a short length.
According to Q. Yang et al., the growth mechanism of alumina nanofibers is
similar to voluminous oxidation of aluminium by continuous dissolution in a wetting
mercury film [14]. The reactions involved are as shown below:
32 2332 AlHgHgAl (5.1)
HOHAlOHAl 3)(3 32
3 (5.2)
HgOnHOAlOnHOAlHg 4.23)(4 23222 (5.3)
Although the natural alumina film offers some protection for bulk aluminium, it
contains surface defects [15]. Therefore, HgCl2 solution can penetrate, react with the bulk
aluminium, and mercury will form by metathesis reaction. Because protective alumina
film is removed, aluminium atoms continuously dissolve into mercury and form
amalgam. After aluminium strip is moved from HgCl2 solution and exposed in air,
aluminium atoms diffuse from the amalgamated layer near bulk aluminium to the
amalgam/air interface and react with oxygen and water in air to form alumina according
to equation 5.3. Alumina particles assemble by preferred orientation to form nanofibers
[16]. As the Al atoms are depleted, more bulk aluminium dissolves into the mercury and
the process continues until mercury volatilize completely.

Chapter – 5 Adsorption of dyes on γ-Al2O3 nanofibers
128
5.1.1 X-ray diffraction studies
The powder X-ray diffraction patterns of the synthesized product and the product
calcined at 850 °C for 2h are shown in Figure 5.2. The XRD pattern of the as-grown
product indicated that the product consists of amorphous alumina (Figure 5.2a). After
calcined at 850 °C for 2 h, the amorphous alumina transferred into γ-Al2O3 (Figure 5.2b).
All the diffraction peaks matched well with those of γ-Al2O3 according to JCPDS card
No. 10-0425. The major peaks at 2θ values of 37.4º, 39.4º, 45.8º, 60.8º and 67.0º can be
indexed to the lattice planes of (311), (222), (400), (551) and (440), respectively.
Furthermore, no characteristic peaks from other impurities were detected by XRD
suggesting that the product was of pure alumina.
Figure-5.2: The XRD patterns of (a) as-grown product and (b) product calcined at 850 °C
for 2h.

Chapter – 5 Adsorption of dyes on γ-Al2O3 nanofibers
129
5.1.2 FESEM and surface area analysis
The surface and textural morphology of the product was studied using FESEM analysis.
The as-grown sample was collected and subjected to FESEM analysis. From Figure 5.3a
it can be observed that the sample consists of clusters of alumina nanofibers. They appear
to be fused all along their length resulting in a porous structure. The low density sample
showed peaks for aluminium and oxygen in the EDS spectrum and further no other
elements were found in EDS which evidenced that the product was of pure Al2O3.
Figure-5.3: (a) The FESEM micrographs and (b) EDS spectrum of γ-Al2O3 nanofibers.
(b)
(a)
Chapter – 5 Adsorption of dyes on γ-Al2O3 nanofibers
130
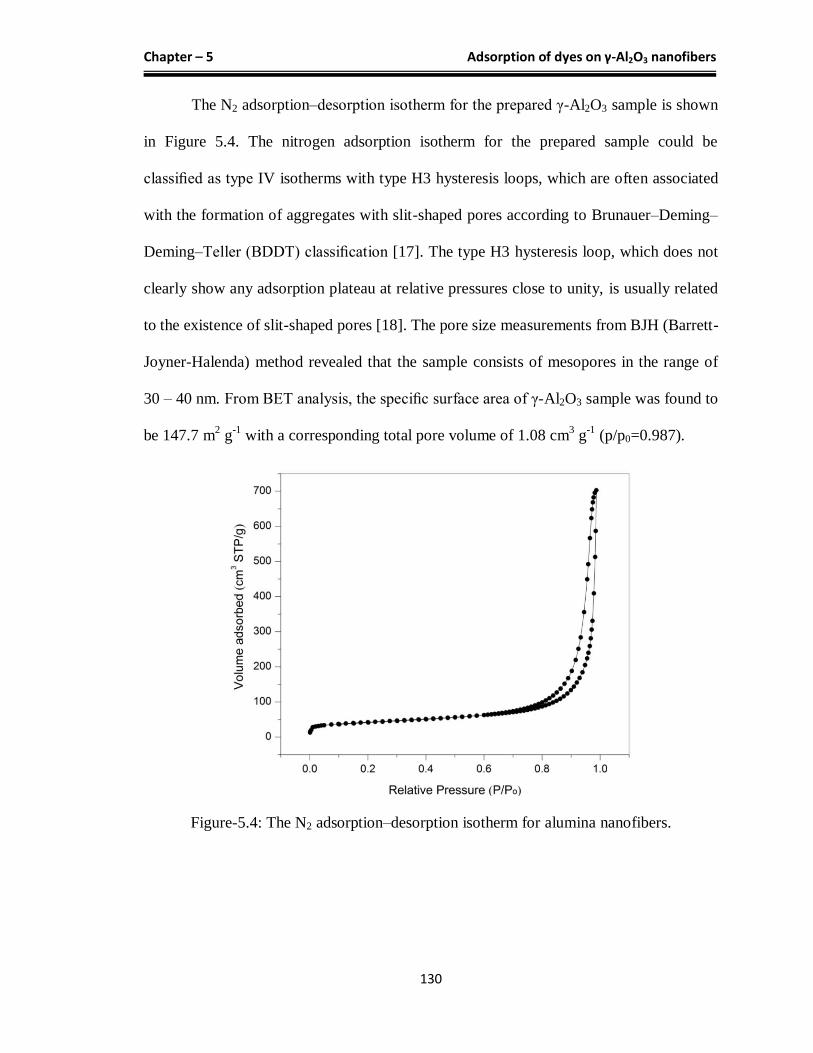
The N2 adsorption–desorption isotherm for the prepared γ-Al2O3 sample is shown
in Figure 5.4. The nitrogen adsorption isotherm for the prepared sample could be
classified as type IV isotherms with type H3 hysteresis loops, which are often associated
with the formation of aggregates with slit-shaped pores according to Brunauer–Deming–
Deming–Teller (BDDT) classification [17]. The type H3 hysteresis loop, which does not
clearly show any adsorption plateau at relative pressures close to unity, is usually related
to the existence of slit-shaped pores [18]. The pore size measurements from BJH (Barrett-
Joyner-Halenda) method revealed that the sample consists of mesopores in the range of
30 – 40 nm. From BET analysis, the specific surface area of γ-Al2O3 sample was found to
be 147.7 m2 g
-1 with a corresponding total pore volume of 1.08 cm
3 g
-1 (p/p0=0.987).
Figure-5.4: The N2 adsorption–desorption isotherm for alumina nanofibers.

Chapter – 5 Adsorption of dyes on γ-Al2O3 nanofibers
131
5.1.3 Fourier transform infrared spectroscopy (FTIR)
The FTIR spectrum of γ-Al2O3 was recorded by making pellet with KBr. The stronger
broad band at 3451 cm–1
may be attributed to the AlO-H stretching vibration of surface
adsorbed water molecules in the product [19]. The band near 1643 cm-1
may be attributed
to H-O-H bending vibrations of adsorbed water molecules. The stronger broadening
band in the range of 1000 – 400 cm–1
corresponds to Al-O vibrations [20, 21].
Figure-5.5: The FTIR spectrum of γ-Al2O3 nanofibers.
5.2 Adsorption studies
The synthesized nano aluminium oxide was employed for the adsorption of three textile
dyes namely, Levafix fast red (LFR), Indanthren blue BC (IB) and Acid red 112 (AR
112). Batch experiments were carried out for the adsorption of these dyes from their
aqueous solutions. The effect of adsorption parameters such as contact time and initial
solution pH were studied and optimized. The adsorption kinetics and thermodynamics

Chapter – 5 Adsorption of dyes on γ-Al2O3 nanofibers
132
have been also studied and the calculated kinetic and thermodynamic parameters have
been presented.
5.2.1 Effect of contact time
Figure-5.6: Effect of contact time on the adsorption capacity of nano Al2O3 towards (a)
LFR (b) IB and (c) AR 112.
The variation of adsorption capacity of nano alumina towards textile dyes with
time is depicted in Figure 5.15. It is evident from all the three figures that the adsorption
was rapid initially and the dye removal percentage improved slowly with time and finally
reached almost a constant value at equilibrium. The initial rapid adsorption rate is due to
the presence of large number of active sites on the surface of alumina and the high
(a) (b)
(c)

Chapter – 5 Adsorption of dyes on γ-Al2O3 nanofibers
133
concentration gradient. Adsorption equilibrium was attained within 120 min of contact
time for LFR, 90 min for IB and 60 min for AR 112. The presence of plateau after the
equilibrium might be attributed to the saturation of adsorption sites on alumina
nanofibers.
5.2.2 Effect of pH
Figure-5.7: Influence of pH on the adsorption capacity of nano Al2O3 towards the dyes
studied.
It is well established that, pH is an important parameter which affects the
adsorption performance of oxide materials in aqueous medium. In order to study the
effect of pH, adsorption equilibrium studies were carried out at 25 °C and at varying pH
(2.0-11.0) for a series of dye solutions (100 ppm) containing a fixed amount of alumina
nanofibers. The variation of equilibrium adsorption capacity (qe) of γ-Al2O3 towards the
three dyes (LFR, IB and AR 112) is shown in Figure 5.7. From the Figure it can be seen
that the values of qe decrease with increase in the pH for LFR and AR 112. However, the

Chapter – 5 Adsorption of dyes on γ-Al2O3 nanofibers
134
variation of solution pH did not influence the adsorption of IB and hence the qe values
were found to be almost constant in the entire pH range.
The adsorption performance of nano alumina towards the chosen dyes may be
understood by considering the surface charge of γ-Al2O3 under different pH conditions.
From literature, it is well known that the point of zero charge (pHZPC) for γ-Al2O3 is 7.9
[22]. Thus the surface of γ-Al2O3 is positively charged in acidic, neutral and slightly basic
environments (below pH 8.0). However, the surface is negatively charged under basic
conditions (above pH 8.0). The higher qe values observed for LFR and AR 112 at acidic
pH conditions may be explained by considering the surface charge on γ-Al2O3 and dye
molecules. The charge of the AR 112 molecules is highly negative due to the presence of
four SO3-
groups on each molecule. Similarly, the reactive dye LFR is also negatively
charged due to the presence of negatively charged reactive groups. Since γ-Al2O3 is
positively charged below pH 8.0, the negatively charged dye molecules are strongly
attracted towards the adsorbent surface. Thus, electrostatic force of attraction between the
positively charged γ-Al2O3 and negatively charged dye molecules is responsible for the
high adsorption capacity which was observed upto pH 8.0. However, a drastic decrease in
the dye removal efficiency was observed for both LFR and AR 112 after pH 8.0. This is
because the surface of γ-Al2O3 acquires positive charge which causes repulsion with the
dye molecules [22].
From Figure 5.7, it can also be observed that there was no appreciable change in
the adsorption capacity for IB in the entire pH range studied. Indanthren Blue BC (IB) is
insoluble but highly dispersible in water and thus it remains non-ionic in aqueous
solution. Although solution pH influences the surface charge of adsorbent, the surface
Chapter – 5 Adsorption of dyes on γ-Al2O3 nanofibers
135
properties of IB remain unchanged. Thus the change in solution pH did not influence the
adsorption of IB.
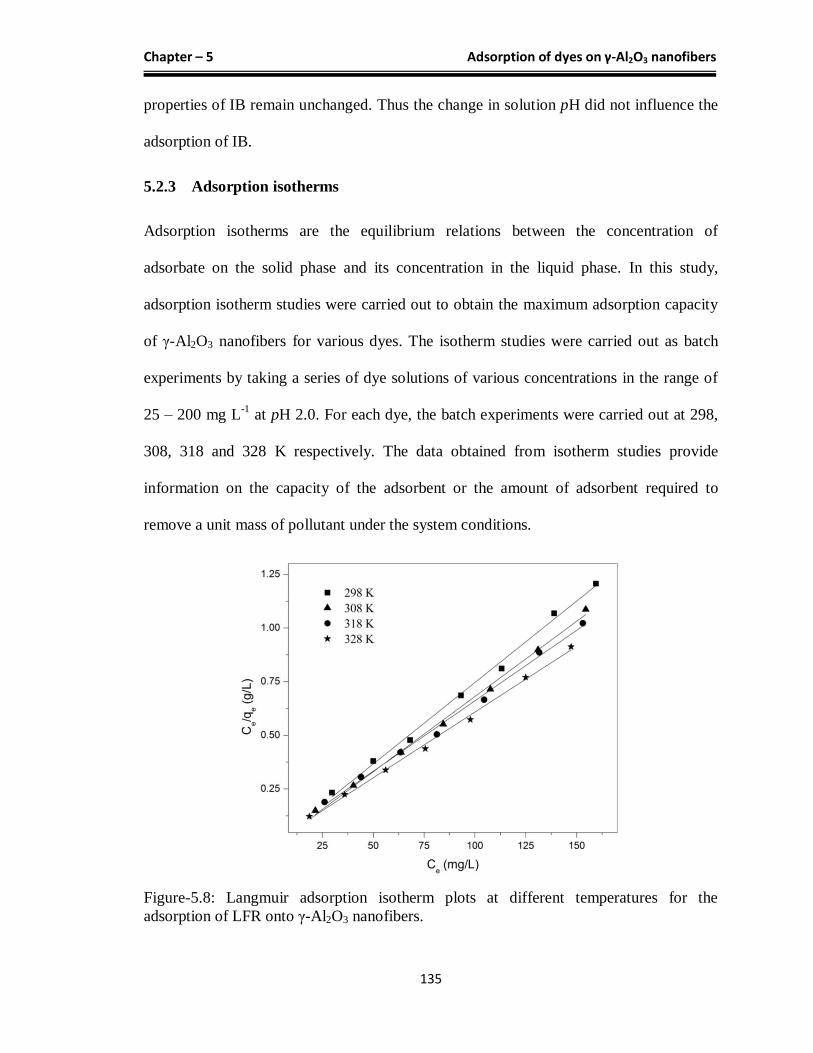
5.2.3 Adsorption isotherms
Adsorption isotherms are the equilibrium relations between the concentration of
adsorbate on the solid phase and its concentration in the liquid phase. In this study,
adsorption isotherm studies were carried out to obtain the maximum adsorption capacity
of γ-Al2O3 nanofibers for various dyes. The isotherm studies were carried out as batch
experiments by taking a series of dye solutions of various concentrations in the range of
25 – 200 mg L-1
at pH 2.0. For each dye, the batch experiments were carried out at 298,
308, 318 and 328 K respectively. The data obtained from isotherm studies provide
information on the capacity of the adsorbent or the amount of adsorbent required to
remove a unit mass of pollutant under the system conditions.
Figure-5.8: Langmuir adsorption isotherm plots at different temperatures for the
adsorption of LFR onto γ-Al2O3 nanofibers.

Chapter – 5 Adsorption of dyes on γ-Al2O3 nanofibers
136
Table-5.1: The parameters of Langmuir model for the adsorption of LFR onto γ-Al2O3
nanofibers at different temperatures.
Figure-5.9: Langmuir adsorption isotherm plots at different temperatures for the
adsorption of AR 112 onto γ-Al2O3 nanofibers.
T (ºC) qmax (mg g-1
) KL (L mg-1
) R2 RL
25 131.75 0.582 0.995 0.007-0.035
35 142.65 0.347 0.997 0.012-0.057
45 152.21 1.626 0.994 0.003-0.013
55 163.13 1.416 0.996 0.003-0.007

Chapter – 5 Adsorption of dyes on γ-Al2O3 nanofibers
137
Table-5.2: The parameters of Langmuir model for the adsorption of AR 112 onto γ-Al2O3
nanofibers at different temperatures.
T (ºC) qmax (mg g-1
) KL (L mg-1
) R2 RL
25 139.47 0.899 0.985 0.012-0.037
35 207.04 5.367 0.997 0.002-0.006
45 260.42 1.280 0.994 0.008-0.015
55 304.88 2.827 0.995 0.004-0.007
Figure-5.10: Langmuir adsorption isotherm plots at different temperatures for the
adsorption of IB onto γ-Al2O3 nanofibers.

Chapter – 5 Adsorption of dyes on γ-Al2O3 nanofibers
138
Table-5.3: The parameters of Langmuir model for the adsorption of IB onto γ-Al2O3
nanofibers at different temperatures.
T (ºC) qmax (mg g-1
) KL (L mg-1
) R2 RL
25 88.97 0.270 0.997 0.018-0.129
35 106.9 0.196 0.995 0.025-0.169
45 125.5 0.283 0.995 0.017-0.124
55 143.7 0.155 0.988 0.031-0.205
In this study, equilibrium data were analyzed using the Langmuir and Freundlich
adsorption isotherm models. The plots of Langmuir isotherm model obtained for the
adsorption of LFR, AR 112 and IB at different temperatures are shown in Figures 5.8, 5.9
and 5.10 respectively. The calculated Langmuir model parameters for the three dyes are
summarized in Tables 5.1, 5.2 and 5.3. From the tables it can be seen that high
correlation coefficient (R2) values were obtained for all the three dyes at all the
temperatures studied, indicating a good agreement of the data. However, very poor data
fit with low correlation coefficient (R2) values were observed for the Freundlich model.
Thus it may be concluded that Langmuir model is a suitable isotherm model to describe
the adsorption of all the three dyes onto γ-Al2O3 nanofibers. The agreement of data with
Langmuir model for all the three dyes emphasizes the formation of monolayer coverage
of the dye molecules on the surface of adsorbent. At 298 K, the maximum adsorption
capacities (qmax) of γ-Al2O3 were found to be 131.75, 139.47 and 88.97 mg g-1
for LFR,
AR 112 and IB respectively. Comparatively low qmax values obtained for IB may be
attributed to its insolubility and non-ionic nature in aqueous medium, while the high qmax
values observed for LFR and AR 112 may be due to the strong electrostatic attractive

Chapter – 5 Adsorption of dyes on γ-Al2O3 nanofibers
139
forces between the negatively charged dye molecules and positive surface of γ-Al2O3.
From tables 4.3 and 4.8 (shown in the previous chapter), it is clear that the adsorption
capacity of γ-Al2O3 nanofibers is relatively high than the other adsorbents reported
earlier. The high adsorption capacity of γ-Al2O3 nanofibers towards the dyes is due to the
high specific surface area coupled with electrostatic forces of attraction involved during
adsorption.
The RL vaues within the range 0 < RL < 1 indicate a favorable adsorption. In the
present study, RL values obtained were in the range of 0.003 – 0.057, 0.004 – 0.037 and
0.017 – 0.205 for LFR, AR 112 and IB respectively. This clearly indicated favorable
adsorption of all the three dyes on γ-Al2O3 nanofibers.
5.2.4 Adsorption thermodynamics
The effect of temperature on the adsorption capacity of γ-Al2O3 nanofibers towards the
chosen dyes was studied by performing the adsorption experiments at four different
temperatures (298, 308, 318 and 328 K). Batch experiments were performed separately
for LFR, IB and AR 112 at pH 2.0.
The plots showing the variation of adsorption capacity of γ-Al2O3 nanofibers for
the three dyes at different temperatures are given in Figures 5.11a, 5.12a and 5.13a. The
results revealed that the adsorption capacity increased with increase in temperature from
298 to 328 K for all the three dyes. This indicated that the adsorption of all the three dyes
is endothermic. This supports chemisorption of dyes where there is an increase in the
number of dye molecules acquiring sufficient energy to undergo chemical reaction with
the adsorbent at higher temperatures [23].

Chapter – 5 Adsorption of dyes on γ-Al2O3 nanofibers
140
Figure-5.11: (a) Effect of temperature on the adsorption capacity and (b) van’t Hoff’s plot
for the adsorption of LFR onto γ-Al2O3 nanofibers.
Figure-5.12: (a) Effect of temperature on the adsorption capacity and (b) van’t Hoff’s plot
for the adsorption of IB onto γ-Al2O3 nanofibers.
(a) (b)
(a) (b)

Chapter – 5 Adsorption of dyes on γ-Al2O3 nanofibers
141
Figure-5.13: (a) Effect of temperature on the adsorption capacity and (b) van’t Hoff’s plot
for the adsorption of AR 112 onto γ-Al2O3 nanofibers.
Figure-5.14: Plots of ln(1-θ) versus 1/T for (a) LFR (b) IB and (c) AR 112.
(a) (b)
(a) (b)
(c)

Chapter – 5 Adsorption of dyes on γ-Al2O3 nanofibers
142
Table-5.4: Thermodynamic parameters for the adsorption of LFR, IB and AR 112 on
alumina nanofibers at pH 2.0.
Dye T
(°C)
ΔG°
(kJ mol−1
)
ΔS°
(J K−1
mol−1
)
ΔH°
(kJ mol−1
)
Kc Ea
(kJ mol−1
)
S*
LFR 25 0.669 25.01 8.123 0.767 3.83 0.121
35 0.419 0.858
45 0.169 0.914
55 -0.081 1.046
IB 25 1.129 111.2 34.27 0.652 18.68 3.3×10⁻⁴
35 0.0174 0.963
45 -1.0946 1.556
55 -2.2066 2.224
AR
112
25 -1.903 369.8 108.3 2.310 99.0 1.5×10⁻¹⁸
35 -5.601 9.468
45 -9.299 28.98
55 -12.99 129.5
The van’t Hoff’s plots for the adsorption of LFR, IB and AR 112 onto γ-Al2O3
nanofibers are shown in the Figures 5.11b, 5.12b and 5.13b respectively. The
corresponding values of thermodynamic parameters obtained from these plots are given
in Table 5.4. The values of ΔH° were found to be positive for all the three dyes which

Chapter – 5 Adsorption of dyes on γ-Al2O3 nanofibers
143
indicated that the adsorption process is endothermic. Also, the positive values of ΔS°
revealed that adsorption of dyes on nano alumina leads to the increase in randomness of
the system [24]. Among the three chosen dyes, the values of ΔH° and ΔS° were found to
be maximum for AR 112. In case of LFR, the values of free energy (ΔG°) were slightly
positive at lower temperatures and became negative at higher temperatures. However, the
ΔG° values were found to be negative at all the temperatures for the other two dyes (IB
and AR 112). The negative values of ΔG° indicated that the process of adsorption is
spontaneous. Further, the values of ΔG° became more negative with increase in
temperature for all the three dyes, suggesting that the adsorption of dye molecules
became more favourable at higher temperatures.
Energy of activation
The values of activation energy (Ea) and sticking probability (S*) were calculated using
modified Arrhenius equation. The values of Ea were calculated from the slope of the plot
of ln(1−θ) versus 1/T (Figure 5.14). In the present case, the values of Ea were found to be
3.83, 18.68 and 99 kJ mol-1
for LFR, IB and AR 112 respectively. Higher values of Ea
indicated more favourable adsorption of dyes and it also suggested the involvement of
chemisorption on γ-Al2O3 nanofibers.
5.2.5 Adsorption kinetics
The kinetics of adsorption was studied by employing pseudo-first-order and pseudo-
second-order models. The pseudo-first-order and pseudo-second-order plots for the
adsorption of LFR, IB and AR 112 on γ-Al2O3 nanofibers are shown in Figures 5.15, 5.16
and 5.17 respectively.

Chapter – 5 Adsorption of dyes on γ-Al2O3 nanofibers
144
Figure-5.15: (a) Pseudo-first-order and (b) pseudo-second-order plots for the adsorption
of LFR onto γ-Al2O3 nanofibers.
Figure-5.16: (a) Pseudo-first-order and (b) pseudo-second-order plots for the adsorption
of IB onto γ-Al2O3 nanofibers.
Figure-5.17: (a) Pseudo-first-order and (b) pseudo-second-order plots for the adsorption
of AR 112 onto γ-Al2O3 nanofibers.
(a) (b)
(a) (b)
(a) (b)
Chapter – 5 Adsorption of dyes on γ-Al2O3 nanofibers
145
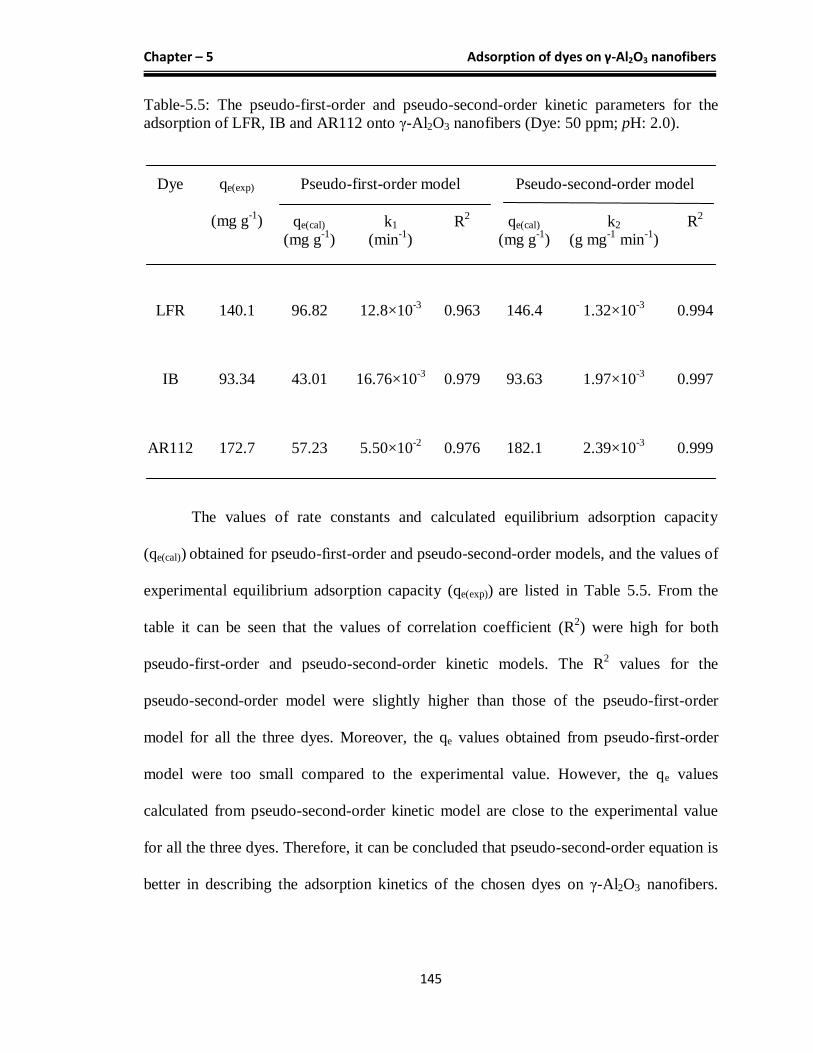
Table-5.5: The pseudo-first-order and pseudo-second-order kinetic parameters for the
adsorption of LFR, IB and AR112 onto γ-Al2O3 nanofibers (Dye: 50 ppm; pH: 2.0).
The values of rate constants and calculated equilibrium adsorption capacity
(qe(cal)) obtained for pseudo-first-order and pseudo-second-order models, and the values of
experimental equilibrium adsorption capacity (qe(exp)) are listed in Table 5.5. From the
table it can be seen that the values of correlation coefficient (R2) were high for both
pseudo-first-order and pseudo-second-order kinetic models. The R2 values for the
pseudo-second-order model were slightly higher than those of the pseudo-first-order
model for all the three dyes. Moreover, the qe values obtained from pseudo-first-order
model were too small compared to the experimental value. However, the qe values
calculated from pseudo-second-order kinetic model are close to the experimental value
for all the three dyes. Therefore, it can be concluded that pseudo-second-order equation is
better in describing the adsorption kinetics of the chosen dyes on γ-Al2O3 nanofibers.
Dye
qe(exp)
(mg g-1
)
Pseudo-first-order model Pseudo-second-order model
qe(cal)
(mg g-1
)
k1
(min-1
)
R2 qe(cal)
(mg g-1
)
k2
(g mg-1
min-1
)
R2
LFR 140.1 96.82 12.8×10⁻³
0.963 146.4 1.32×10⁻³
0.994
IB 93.34 43.01 16.76×10⁻³
0.979 93.63 1.97×10⁻³
0.997
AR112 172.7 57.23 5.50×10⁻²
0.976 182.1 2.39×10⁻³
0.999

Chapter – 5 Adsorption of dyes on γ-Al2O3 nanofibers
146
According to pseudo-second-order model the adsorption depends on the adsorbate as well
as the adsorbent, and it involves chemisorption.
Figure-5.18: Intra-particle diffusion model for the adsorption of (a) LFR (b) IB and (c)
AR 112 onto γ-Al2O3 nanofibers.
Table-5.6: The Intraparticle diffusion model parameters for the adsorption of LFR, IB
and AR 112 onto γ-Al2O3 nanofibers (Dye: 50 ppm; pH: 2.0).
Dye kid (mg g-1
min-0.5
) C (mg g-1
) R2
LFR 8.952 70.17 0.970
IB 5.199 45.73 0.980
AR 112 9.541 116.4 0.953
(c)
(a) (b)

Chapter – 5 Adsorption of dyes on γ-Al2O3 nanofibers
147
In order to further analyze the kinetic results, the intra-particle diffusion model
proposed by Weber and Morries was employed. The plots of qt versus t0.5
for LFR, IB
and AR 112 are shown in Figure 5.18. The values of kid and C were calculated from the
slope and intercept of plots of qt versus t0.5
and are summarized in Table 5.6. All the three
plots were found to be linear with high correlation coefficient values, however they do
not pass through the origin. Therefore it may be concluded that the boundary layer (film)
diffusion is the rate controlling step in the process of dye adsorption by γ-Al2O3
nanofibers.
5.2.6 Recyclability of adsorbent
Regeneration of adsorbent is one of the important factors in order to reduce the cost
incurred during pollutant adsorption. The nano alumina adsorbent could be recovered by
combustion at 800 °C and reused. Thus regenerated alumina could remove similar
amounts of dyes even after the second and third regenerations.
5.3 Conclusions
The γ-Al2O3 nanofibers were synthesized by mercury mediated method. The low density
nano alumina was found to posses high adsorption capacity for textile dyes. The
adsorption was found to be maximum at pH 2.0 for LFR and AR 112, which is due to
strong electrostatic forces of attraction between γ-Al2O3 and dye molecules. However, the
solution pH did not influence the adsorption of IB. Langmuir isotherm was found to be
suitable to describe the adsorption mechanism, suggesting monolayer coverage of dye
molecules on γ-Al2O3 nanofibers. Chemisorption was found to be the operating
mechanism and qmax values for LFR, AR 112 and IB were found to be 131.75, 139.47 and
88.97 mg g-1
respectively. Thermodynamic studies revealed that the adsorption of all the

Chapter – 5 Adsorption of dyes on γ-Al2O3 nanofibers
148
dyes was endothermic and spontaneous. Further, the adsorption of dyes followed pseudo-
second-order kinetics. The high adsorption capacity of γ-Al2O3 nanofibers towards
different classes of textile dyes suggests that it can act as a potential adsorbent for the
removal of dyes from textile wastewater.

Chapter – 5 Adsorption of dyes on γ-Al2O3 nanofibers
149
REFERENCES
[1] http://www.britannica.com/EBchecked/topic/17897/alumina.
[2] Jon Martin Andersson, Controlling the Formation and Stability of Alumina Phases,
Dissertation No. 987, Linköping University, 2005.
[3] M. Hua, S.J. Zhang, B.C. Pan, et al., J. Hazard. Mater. 211–212 (2012) 317–331.
[4] G. Oskam, Sol–Gel Sci. Technol. 37 (2006) 161–164.
[5] X.L. Wang, J.L. Lu, M.G. Xu, et al., Environ. Sci. Technol. 42 (2008) 7267–7272.
[6] A. Saxena, H. Mangal, P.K. Rai, et al., J. Hazard. Mater. 180 (2010) 566–576.
[7] A.S. Madden, M.F. Hochella, T.P. Luxton, Geochim. Cosmochim. Acta 70 (2006)
4095–4104.
[8] D.E. Giammar, C.J. Maus, L.Y. Xie, Environ. Eng. Sci. 24 (2007) 85–95.
[9] Y.M. Zheng, L. Yu, D. Wu, et al., Chem. Eng. J. 188 (2012) 15–22.
[10] Jiang, W., Mashayekhi, H., Xing, B., Environmental Pollution 157 (2009), 1619-
1625.
[11] Pakrashi, S., Dalai, S., Sabat, D., Singh, S., Chandrasekaran, N., Mukherjee, A.,
Chemical Research in Toxicology 24 (2011), 1899-1904.
[12] S. Chibowski,M. Paszkiewicz,M. Krupa, Powder Technol. 107 (2000) 251.
[13] Qi Yang, Yida Deng, Wenbin Hu, Ceramics International 35 (2009) 531–535.
[14] M.R. Pinnel, J.E. Bennet, J. Mater. Sci. 7 (1972) 1016–1026.
[15] J.B. Bessone, Corrosion Sci. 48 (2006) 4243–4256.
[16] M. Khoudiakova, A.B. Ellisa, K.D. Keplerb, J. Alloys Compd. 338 (2002) 32–35.
[17] K.S.W. Sing, D.H. Everett, R.A.W. Haul, L. Moscou, R.A. Pierotti, J. Rouquerol, T.
Siemieniewska, Commission on colloid and surface chemistry including catalysis,
Pure Appl. Chem. 57 (1985) 603–619.
[18] Zhenxuan Zhao, Hongxing Dai, Yucheng Du, Jiguang Deng, Lei Zhang, Fengjuan
Shi, Mater. Chem. Phys. 128 (2011) 348-356.

Chapter – 5 Adsorption of dyes on γ-Al2O3 nanofibers
150
[19] David N. Goldstein, Jarod A. McCormick, Steven M. George, J. Phys. Chem. C, 112
(2008) 19530–19539.
[20] Seyed Ali Hosseini, Aligholi Niaei, Dariush Salari, Open J. Phys. Chem., 1 (2011)
23-27.
[21] Zivar Ghezelbash, Davoud Ashouri, Saman Mousavian, Amir Hossein Ghandi,
Yaghoub Rahnama, Bull. Mater. Sci., 35, (2012) 925–931.
[22] Wei Jiang, Saikat Ghosh, Lei Song, Richard W. Vachet, Baoshan Xing, Colloids and
Surfaces B: Biointerfaces 102 (2013) 292– 299.
[23] Mehrorang Ghaedi, Spectrochim. Acta A 94 (2012) 346-351.
[24] I.M. Ahmed, M.S. Gasser, Appl. Surf. Sci. 259 (2012) 650-656.