© ams 1 chapter 9 atmosphere’s planetary circulation ams weather studies introduction to...
TRANSCRIPT

© AMS© AMS 11
Chapter 9Chapter 9
Atmosphere’s Planetary Atmosphere’s Planetary CirculationCirculation
AMS Weather StudiesAMS Weather Studies Introduction to Atmospheric Science, 4Introduction to Atmospheric Science, 4 thth Edition Edition

© AMS© AMS 22
Case-in-PointCase-in-Point In the winter of 1997-98, the San Francisco Bay area
experienced considerable flooding due to an unusually high sea level and wind-driven waves
On one of the worst days of flooding, 3 February 1998, waters from the Bay inundated U.S. Highway 101 to a depth of up to 1.2 m (4 ft) north of the Golden Gate Bridge
Several factors control sea level in San Francisco Bay– The most important are the regular astronomical tides
Two high tides and two low tides per day
– Second factor is the slow long-term trend of rising sea level due to global warming
Causes expansion of sea water and melting of land-based glaciers
– El Niño is also a major factor The 1997-98 El Niño, one of the most intense of the 20th century,
winter winds blew strongly from the south along the California coast, driving surface water toward the shore and raising sea level

© AMS© AMS 33
Driving QuestionDriving Question
What are the principal features of the What are the principal features of the planetary-scale atmospheric circulation, and planetary-scale atmospheric circulation, and how does the circulation affect weather and how does the circulation affect weather and climate?climate?
This chapter describes planetary-scale:This chapter describes planetary-scale:– Pressure systemsPressure systems– Wind beltsWind belts– Circulation patterns of middle latitude westerliesCirculation patterns of middle latitude westerlies– Anomalous variations in the circulation regime Anomalous variations in the circulation regime
that result in El Nithat result in El Niño and La Niñaño and La Niña

© AMS© AMS 44
Idealized Circulation PatternIdealized Circulation Pattern To start with, assume a To start with, assume a
non-rotating Earthnon-rotating Earth Also assume a uniform Also assume a uniform
solid surfacesolid surface Sun heats the equatorial Sun heats the equatorial
regions more intensely regions more intensely than the poles; a than the poles; a temperature gradient temperature gradient developsdevelops
Convection cell forms Convection cell forms when cold, dense air sinks when cold, dense air sinks at the poles and flows at at the poles and flows at the surface toward the the surface toward the equator, where it forces equator, where it forces warm, less dense air to warm, less dense air to rise. Aloft, equatorial air rise. Aloft, equatorial air flows toward the poles.flows toward the poles.
© AMS© AMS 55
Idealized Circulation PatternIdealized Circulation Pattern
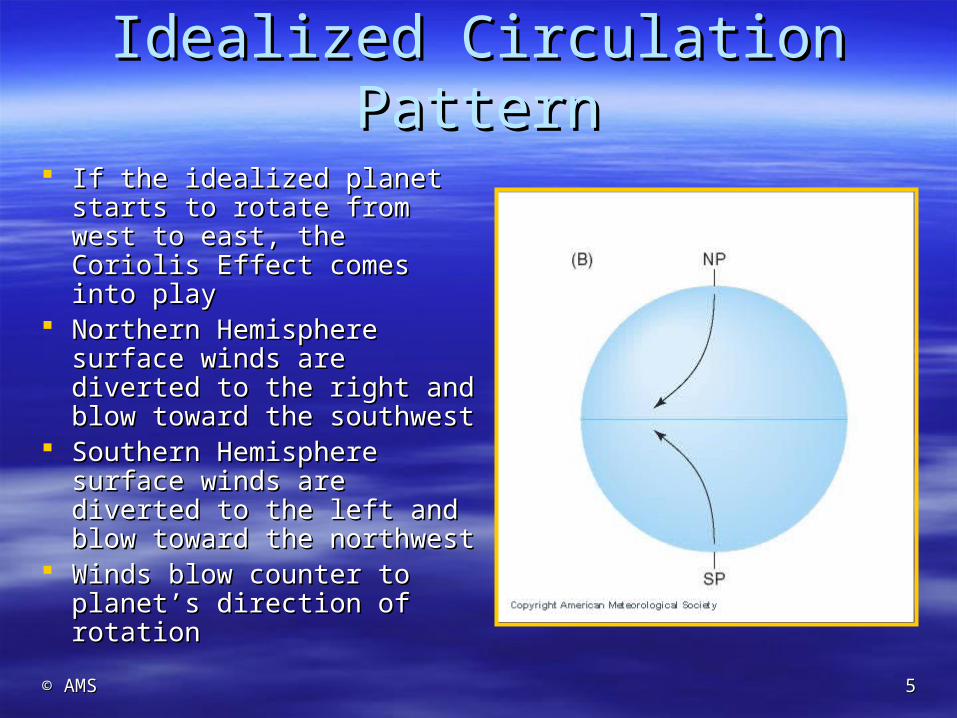
If the idealized planet starts If the idealized planet starts to rotate from west to east, to rotate from west to east, the Coriolis Effect comes the Coriolis Effect comes into playinto play
Northern Hemisphere Northern Hemisphere surface winds are diverted surface winds are diverted to the right and blow toward to the right and blow toward the southwestthe southwest
Southern Hemisphere Southern Hemisphere surface winds are diverted surface winds are diverted to the left and blow toward to the left and blow toward the northwestthe northwest
Winds blow counter to Winds blow counter to planet’s direction of rotationplanet’s direction of rotation

© AMS© AMS 66
Idealized Circulation PatternIdealized Circulation Pattern
Circulation is maintained in Circulation is maintained in the atmosphere of our the atmosphere of our idealized Earth because idealized Earth because the planetary-scale winds the planetary-scale winds split into 3 belts in each split into 3 belts in each hemispherehemisphere
3 belts are:3 belts are:– 00°° to 30 to 30°°
– 3030°° to 60 to 60°°
– 6060°° to 90 to 90°°
Now some winds blow with Now some winds blow with and some blow against the and some blow against the planet’s rotationplanet’s rotation

© AMS© AMS 77
Idealized Circulation PatternIdealized Circulation Pattern Surface winds converge along Surface winds converge along
the equator and along 60the equator and along 60° ° latitude circleslatitude circles– Convergence leads to rising Convergence leads to rising
air, expansional cooling, cloud air, expansional cooling, cloud development and precipitationdevelopment and precipitation
– Convergence zones are belts Convergence zones are belts of relatively low surface air of relatively low surface air pressurepressure
Surface winds diverge at the Surface winds diverge at the poles and along the 30poles and along the 30° latitude ° latitude circlescircles– Air descends, is compressed Air descends, is compressed
and warms, and weather is and warms, and weather is generally fairgenerally fair
– Divergence zones are belts of Divergence zones are belts of relatively high surface air relatively high surface air pressurepressure

© AMS© AMS 88
Adding continents and Adding continents and ocean basins ocean basins complicates the complicates the picturepicture
Some pressure belts Some pressure belts break into separate break into separate cellscells
Important pressure Important pressure contrasts develop contrasts develop over land versus seaover land versus sea
Maps show mean Maps show mean sea-level air pressure sea-level air pressure during January (top) during January (top) and July (bottom); and July (bottom); these are semi-these are semi-permanent featurespermanent features
Features of the Planetary-Scale CirculationFeatures of the Planetary-Scale Circulation

© AMS© AMS 99
Features of the Planetary-Scale CirculationFeatures of the Planetary-Scale Circulation
Schematic representation of the planetary-scale Schematic representation of the planetary-scale surface circulation of the atmospheresurface circulation of the atmosphere

© AMS© AMS 1010
Features of the Planetary-Scale CirculationFeatures of the Planetary-Scale Circulation
Pressure Systems and Wind BeltsPressure Systems and Wind Belts– Subtropical anticyclonesSubtropical anticyclones
Form near 30Form near 30°° N and S latitude over oceans N and S latitude over oceans Extend from the ocean surface to the tropopause and Extend from the ocean surface to the tropopause and
exert a major influence on weather and climate over exert a major influence on weather and climate over vast areas of the ocean and continentsvast areas of the ocean and continents
Subsiding air extends outward from the eastern sidesSubsiding air extends outward from the eastern sides– Compressional warming, low relative humidity, and fair Compressional warming, low relative humidity, and fair
skies are commonskies are common
– Major deserts are located on eastern flanksMajor deserts are located on eastern flanks The far western portions are characterized by less The far western portions are characterized by less
subsidence, less stable air, and frequent episodes of subsidence, less stable air, and frequent episodes of cloudy, stormy weathercloudy, stormy weather

© AMS© AMS 1111
Features of the Planetary-Scale CirculationFeatures of the Planetary-Scale Circulation
Pressure Systems and Wind Belts, cont.Pressure Systems and Wind Belts, cont.– Subtropical anticyclonesSubtropical anticyclones
Common is a weak horizontal pressure gradient over a large areaCommon is a weak horizontal pressure gradient over a large area– Winds are weak and Winds are weak and
– Horse latitudes (30 to 35 degrees N and S) resultHorse latitudes (30 to 35 degrees N and S) result
Surface winds poleward of the horse latitudes are the midlatitude Surface winds poleward of the horse latitudes are the midlatitude westerlieswesterlies
Winds blowing out of the high pressure cells toward the equatorial Winds blowing out of the high pressure cells toward the equatorial lows are called the trade windslows are called the trade winds
Trade winds from the two hemispheres converge into a broad east-Trade winds from the two hemispheres converge into a broad east-west equatorial belt of light and variable winds called the doldrums. west equatorial belt of light and variable winds called the doldrums. In that belt, ascending air induces cloudiness and rainfall and the In that belt, ascending air induces cloudiness and rainfall and the most active weather develops along the intertropical convergence most active weather develops along the intertropical convergence zone (ITCZ).zone (ITCZ).

© AMS© AMS 1212
Features of the Planetary-Scale CirculationFeatures of the Planetary-Scale Circulation
Pressure Systems and Wind Belts, cont.Pressure Systems and Wind Belts, cont.– Poleward of subtropical anticyclones:Poleward of subtropical anticyclones:
Surface westerlies flow into regions of low pressureSurface westerlies flow into regions of low pressure These are the Aleutian low and the Icelandic low in These are the Aleutian low and the Icelandic low in
the Northern Hemispherethe Northern Hemisphere In the Southern Hemisphere, this is a nearly In the Southern Hemisphere, this is a nearly
continuous belt of low pressure surrounding continuous belt of low pressure surrounding AntarcticaAntarctica
Surface westerlies meet and override the polar Surface westerlies meet and override the polar easterlies along the polar fronteasterlies along the polar front
– In places where the polar front is well-defined, it is a In places where the polar front is well-defined, it is a potential site for development of extra-tropical cyclonespotential site for development of extra-tropical cyclones
– Polar highs are shallow, cold anticyclones that Polar highs are shallow, cold anticyclones that develop at high latitudesdevelop at high latitudes

© AMS© AMS 1313
Features of the Planetary-Scale CirculationFeatures of the Planetary-Scale Circulation
Winds AloftWinds Aloft– Aloft, winds in the middle and upper troposphere blow Aloft, winds in the middle and upper troposphere blow
away from the ITCZaway from the ITCZ– These feed into the subtropical highsThese feed into the subtropical highs– Resulting convection cells are called Hadley cellsResulting convection cells are called Hadley cells

© AMS© AMS 1414
Winds Aloft, continuedWinds Aloft, continued– Aloft in middle latitudes, winds blow from west to east in a wavelike Aloft in middle latitudes, winds blow from west to east in a wavelike
pattern of ridges and troughspattern of ridges and troughs– These winds are responsible for the movement of the synoptic-These winds are responsible for the movement of the synoptic-
scale weather systemsscale weather systems– Their north/south components contribute to poleward heat transportTheir north/south components contribute to poleward heat transport
Features of the Planetary-Scale CirculationFeatures of the Planetary-Scale Circulation

© AMS© AMS 1515
Vertical Cross Section of Prevailing Vertical Cross Section of Prevailing Winds in the TroposphereWinds in the Troposphere
The altitude of the tropopause is directly related to the mean air temperature of the The altitude of the tropopause is directly related to the mean air temperature of the troposphere. The tropopause is found in three segments, occurring at highest altitudes troposphere. The tropopause is found in three segments, occurring at highest altitudes in the tropics and lowest altitudes in the polar regions.in the tropics and lowest altitudes in the polar regions.

© AMS© AMS 1616
Features of the Planetary-Scale CirculationFeatures of the Planetary-Scale Circulation Trade Wind InversionTrade Wind Inversion
– A persistent and climatically significant feature of the planetary-scale A persistent and climatically significant feature of the planetary-scale circulation over the eastern portions of tropical ocean basinscirculation over the eastern portions of tropical ocean basins
– Key to formation is the descending branch of the Hadley cellKey to formation is the descending branch of the Hadley cell– Descending air is warmed by compression and its relative humidity Descending air is warmed by compression and its relative humidity
decreasesdecreases– This air encounters the marine air layer overlying the ocean surfaceThis air encounters the marine air layer overlying the ocean surface
Where SST are low, layer is cool, humid, and stableWhere SST are low, layer is cool, humid, and stable Where SST are high, layer is warm, more humid, less stable, and well Where SST are high, layer is warm, more humid, less stable, and well
mixed by convectionmixed by convection
– The trade wind inversion is formed at the altitude where air subsiding The trade wind inversion is formed at the altitude where air subsiding from above meets the top of the marine layer, trapping the cool marine from above meets the top of the marine layer, trapping the cool marine layer near the surfacelayer near the surface Develops to the east and southeast of the center of a subtropical highDevelops to the east and southeast of the center of a subtropical high Acts as a cap on the vertical development of clouds and rainActs as a cap on the vertical development of clouds and rain
© AMS© AMS 1717
Features of the Planetary-Scale CirculationFeatures of the Planetary-Scale Circulation Seasonal ShiftsSeasonal Shifts
– Pressure systems, the polar front, the planetary wind belts, and Pressure systems, the polar front, the planetary wind belts, and the ITCZ follow the sun, shifting toward the poles in spring and the ITCZ follow the sun, shifting toward the poles in spring and toward the equator in autumntoward the equator in autumn
– Planetary-scale systems in both hemispheres move north and Planetary-scale systems in both hemispheres move north and south in tandemsouth in tandem
– Subtropical anticyclones exert higher surface pressure in Subtropical anticyclones exert higher surface pressure in summersummer
– Icelandic low deepens in winter and weakens in summerIcelandic low deepens in winter and weakens in summer– The Aleutian low disappears in summerThe Aleutian low disappears in summer– Seasonal reversals of pressure occur over the continents due to Seasonal reversals of pressure occur over the continents due to
the contrast in solar heating of sea versus landthe contrast in solar heating of sea versus land Continents at middle and high latitudes are dominated by relatively Continents at middle and high latitudes are dominated by relatively
high pressure in winter and low pressure in summerhigh pressure in winter and low pressure in summer– Northward migration of the ITCZ triggers summer monsoon Northward migration of the ITCZ triggers summer monsoon
rains in Central America, North Africa, India, and Southeast rains in Central America, North Africa, India, and Southeast AsiaAsia

© AMS© AMS 1818
Features of the Planetary-Scale CirculationFeatures of the Planetary-Scale Circulation
ITCZ follows the sunITCZ follows the sun– It reaches farthest north in JulyIt reaches farthest north in July– It retreats to its most southerly latitudes in JanuaryIt retreats to its most southerly latitudes in January

© AMS© AMS 1919
Features of the Planetary-Scale CirculationFeatures of the Planetary-Scale Circulation
Same latitude, different Same latitude, different climatesclimates– In summer, San Diego In summer, San Diego
is under the eastern is under the eastern edge of the Hawaiian edge of the Hawaiian subtropical high and subtropical high and has a distinct dry has a distinct dry seasonseason
– In summer, Charleston In summer, Charleston is on the humid, is on the humid, unstable side of the unstable side of the Bermuda highBermuda high

© AMS© AMS 2020
Features of the Planetary-Scale Features of the Planetary-Scale CirculationCirculation
Ocean Surface CurrentsOcean Surface Currents– Surface ocean currents are wind-driven
Horizontal movement of ocean surface waters to a large extent mirrors the long-term average planetary scale atmospheric circulation
– Gyres, large-scale circulation regimes, appear in each of the major ocean basins and are associated with the prevailing winds that help set up the currents Trades winds and the westerlies associated with the semi-
permanent subtropical highs drive the subtropical gyres The counterclockwise surface winds in the Aleutian and
Icelandic sub-polar low pressure systems drive the sub-polar gyres

© AMS© AMS 2121
Features of the Planetary-Scale CirculationFeatures of the Planetary-Scale Circulation
Long-term average pattern of wind-driven ocean-surface currents. Gyres in the Long-term average pattern of wind-driven ocean-surface currents. Gyres in the ocean basin are driven by the planetary-scale atmospheric circulation.ocean basin are driven by the planetary-scale atmospheric circulation.
© AMS© AMS 2222
Monsoon CirculationMonsoon Circulation
Seasonal reversal of prevailing windsSeasonal reversal of prevailing winds– Results in wet summers and relatively dry wintersResults in wet summers and relatively dry winters– Vigorous monsoon over portions of Africa and Asia, Vigorous monsoon over portions of Africa and Asia,
where rains are essential for drinking water and where rains are essential for drinking water and agricultureagriculture
– Over much of India, monsoon rains account for over Over much of India, monsoon rains account for over 80% of the annual precipitation80% of the annual precipitation
– Depends on seasonal shifting of global circulation Depends on seasonal shifting of global circulation patternspatterns
– Also depend on seasonal contrasts in heating and Also depend on seasonal contrasts in heating and cooling of water and landcooling of water and land Ocean has greater thermal inertia than the landOcean has greater thermal inertia than the land

© AMS© AMS 2323
Surface wind Surface wind patterns over Asia patterns over Asia during during
A.A.Wet (summer) Wet (summer) monsoonmonsoon
B.B.Dry (winter) Dry (winter) monsonmonson

© AMS© AMS 2424
Monsoon CirculationMonsoon Circulation
In spring, there is relatively cool air over the ocean In spring, there is relatively cool air over the ocean and relatively warm air over landand relatively warm air over land– Horizontal pressure gradient is directed from sea to landHorizontal pressure gradient is directed from sea to land– Produces an onshore flow of humid airProduces an onshore flow of humid air– Over land, intense solar heating generates convectionOver land, intense solar heating generates convection– Expansional cooling causes condensation, clouds, and Expansional cooling causes condensation, clouds, and
rainrain Release of latent heat increases buoyancy and contributes to Release of latent heat increases buoyancy and contributes to
uplift and instability, triggering even more cloud development uplift and instability, triggering even more cloud development and rainfalland rainfall
– Aloft, the air spreads seaward and subsides over the Aloft, the air spreads seaward and subsides over the relatively cool ocean surfacerelatively cool ocean surface

© AMS© AMS 2525
Monsoon CirculationMonsoon Circulation In Autumn, radiational In Autumn, radiational
cooling chills the land cooling chills the land more than the adjacent more than the adjacent ocean surfaceocean surface– Horizontal pressure gradient Horizontal pressure gradient
is directed from land to seais directed from land to sea– Produces an offshore flow of Produces an offshore flow of
airair– Over land, air subsides, and Over land, air subsides, and
dry surface winds sweep dry surface winds sweep seawardseaward
– Air rises over the relatively Air rises over the relatively warm ocean surface, warm ocean surface, completing the monsoon completing the monsoon circulationcirculation

© AMS© AMS 2626
Monsoon CirculationMonsoon Circulation Topography complicates the monsoon Topography complicates the monsoon
circulation and the geographical circulation and the geographical distribution of rainfalldistribution of rainfall
Monsoon rainfall is neither Monsoon rainfall is neither uniform nor continualuniform nor continual– Rainy season consists of active and Rainy season consists of active and
dormant phasesdormant phases The planetary circulation (e.g., ITCZ The planetary circulation (e.g., ITCZ
shifts) and the strength and shifts) and the strength and distribution of convective activity vary distribution of convective activity vary from one year to the nextfrom one year to the next– Variation affects the intensity and Variation affects the intensity and
duration of monsoon rainsduration of monsoon rains The southwest monsoon affects the The southwest monsoon affects the
American Southwest and brings a American Southwest and brings a dramatic increase in rainfall during dramatic increase in rainfall during July and AugustJuly and August

© AMS© AMS 2727
Waves in the WesterliesWaves in the Westerlies Between 2 and 5 waves generally encircle the Between 2 and 5 waves generally encircle the
hemisphere at any one timehemisphere at any one time– These long waves are called Rossby waves, and These long waves are called Rossby waves, and
characterize the westerlies above the 500-mb levelcharacterize the westerlies above the 500-mb level– They are measured by:They are measured by:
WavelengthWavelength– Distance between successive troughs or ridgesDistance between successive troughs or ridges
AmplitudeAmplitude– North-south extentNorth-south extent
Number of wavesNumber of waves– In winter, waves strengthenIn winter, waves strengthen
Fewer wavesFewer waves Longer wavelengthLonger wavelength Greater amplitudeGreater amplitude
– Seasonal changes stem from variations in the north-Seasonal changes stem from variations in the north-south air pressure gradient, which is steeper in winter south air pressure gradient, which is steeper in winter because of the greater temperature gradientbecause of the greater temperature gradient

© AMS© AMS 2828
Waves in the WesterliesWaves in the Westerlies Zonal and Meridional Flow PatternsZonal and Meridional Flow Patterns
– Westerlies have 2 components:Westerlies have 2 components: North-south airflow is the meridional componentNorth-south airflow is the meridional component West-to-east airflow is the zonal componentWest-to-east airflow is the zonal component
– If north-south component is weak, the result is a zonal If north-south component is weak, the result is a zonal flow patternflow pattern North-south exchange of air masses is minimalNorth-south exchange of air masses is minimal
– If flow is in a pattern of deep troughs and sharp ridges, If flow is in a pattern of deep troughs and sharp ridges, the result is a meridional flow patternthe result is a meridional flow pattern Greater temperature contrasts develop across the U.S. and Greater temperature contrasts develop across the U.S. and
southern Canadasouthern Canada Stage is set for development of extra-tropical cyclonesStage is set for development of extra-tropical cyclones
– If northern westerlies have a wave configuration If northern westerlies have a wave configuration differing from the southern westerlies, a complicated differing from the southern westerlies, a complicated split flow pattern may exist split flow pattern may exist

© AMS© AMS 2929
Zonal and Meridional FlowZonal and Meridional Flow– These two images illustrate These two images illustrate
extremes of zonal and extremes of zonal and meridional flowmeridional flow
– Westerlies generally shift Westerlies generally shift back and forth between back and forth between zonal and meridional flowzonal and meridional flow
– There is no regularity to this There is no regularity to this shiftshift
– The affects long-range The affects long-range weather forecasting weather forecasting accuracyaccuracy
Waves in the WesterliesWaves in the Westerlies
© AMS© AMS 3030
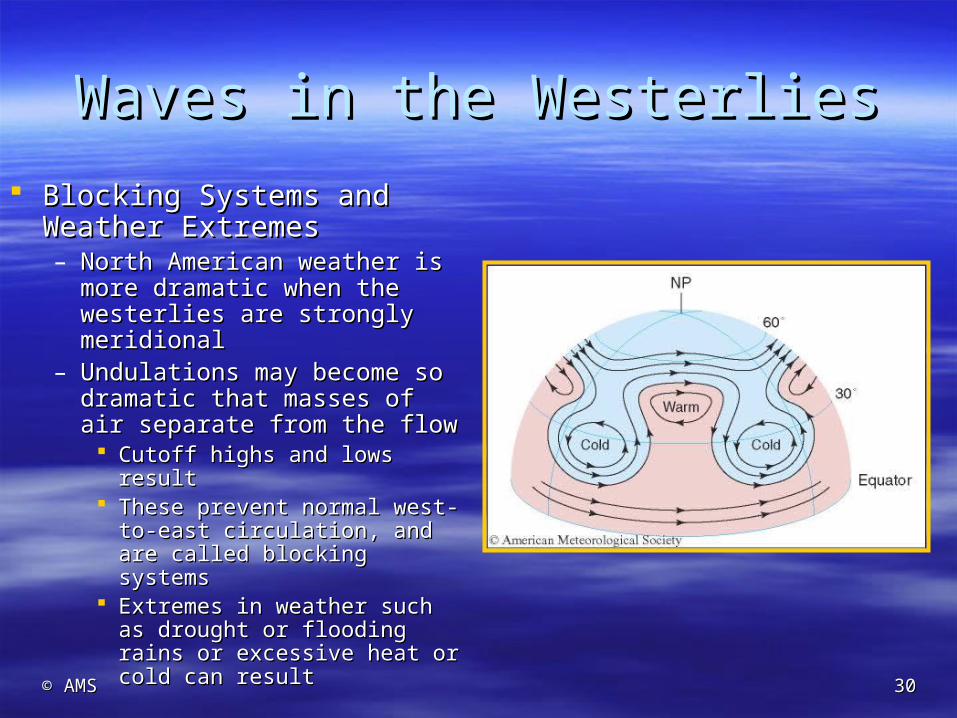
Blocking Systems and Blocking Systems and Weather ExtremesWeather Extremes– North American weather is North American weather is
more dramatic when the more dramatic when the westerlies are strongly westerlies are strongly meridionalmeridional
– Undulations may become so Undulations may become so dramatic that masses of air dramatic that masses of air separate from the flowseparate from the flow Cutoff highs and lows resultCutoff highs and lows result These prevent normal west-to-These prevent normal west-to-
east circulation, and are called east circulation, and are called blocking systemsblocking systems
Extremes in weather such as Extremes in weather such as drought or flooding rains or drought or flooding rains or excessive heat or cold can excessive heat or cold can resultresult
Waves in the WesterliesWaves in the Westerlies

© AMS© AMS 3131
Waves in the WesterliesWaves in the Westerlies Blocking Systems and Blocking Systems and
Weather Extremes, cont.Weather Extremes, cont.– (A) Prevailing circulation (A) Prevailing circulation
pattern in the mid to upper pattern in the mid to upper troposphere during the troposphere during the summer of 1988. The summer of 1988. The blocking warm anticyclone blocking warm anticyclone over the central U.S. over the central U.S. contributed to severe contributed to severe droughtdrought
– (B) The long-term average (B) The long-term average circulation patterncirculation pattern

© AMS© AMS 3232
Waves in the WesterliesWaves in the Westerlies
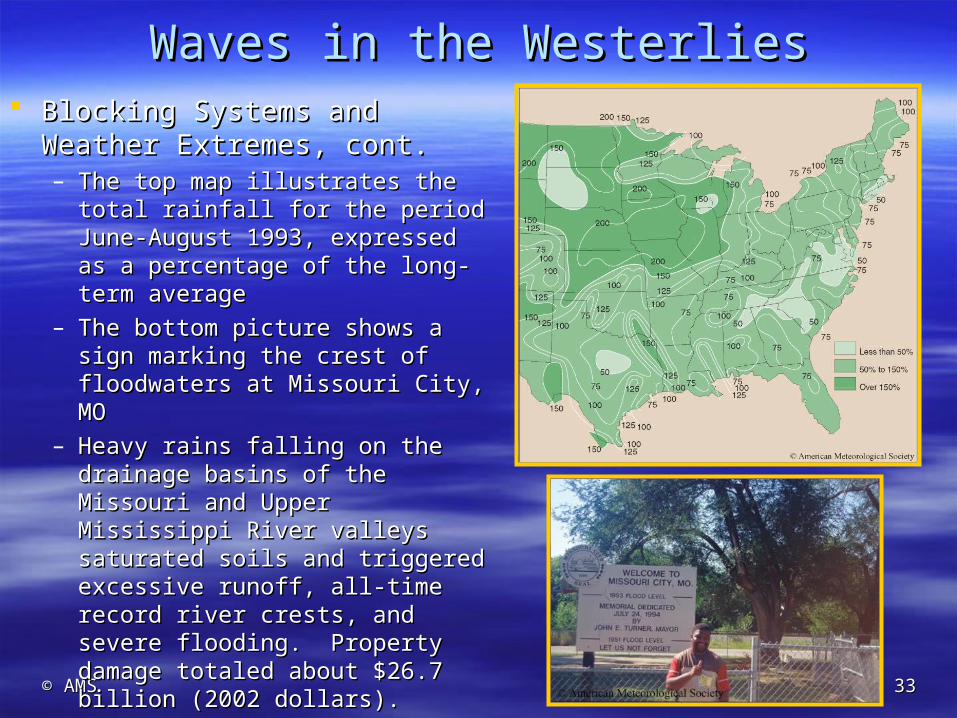
Blocking Systems and Blocking Systems and Weather Extremes, cont.Weather Extremes, cont.– The map illustrates The map illustrates
principal features of the principal features of the prevailing atmospheric prevailing atmospheric circulation pattern during circulation pattern during the summer of 1993the summer of 1993
– A blocking circulation A blocking circulation pattern was responsible pattern was responsible for record flooding in the for record flooding in the Midwest and drought over Midwest and drought over the Southeastthe Southeast
© AMS© AMS 3333
Waves in the WesterliesWaves in the Westerlies Blocking Systems and Weather Blocking Systems and Weather
Extremes, cont.Extremes, cont.– The top map illustrates the total The top map illustrates the total
rainfall for the period June-August rainfall for the period June-August 1993, expressed as a percentage 1993, expressed as a percentage of the long-term averageof the long-term average
– The bottom picture shows a sign The bottom picture shows a sign marking the crest of floodwaters marking the crest of floodwaters at Missouri City, MOat Missouri City, MO
– Heavy rains falling on the Heavy rains falling on the drainage basins of the Missouri drainage basins of the Missouri and Upper Mississippi River and Upper Mississippi River valleys saturated soils and valleys saturated soils and triggered excessive runoff, all-triggered excessive runoff, all-time record river crests, and time record river crests, and severe flooding. Property severe flooding. Property damage totaled about $26.7 damage totaled about $26.7 billion (2002 dollars).billion (2002 dollars).

© AMS© AMS 3434
Waves in the WesterliesWaves in the Westerlies
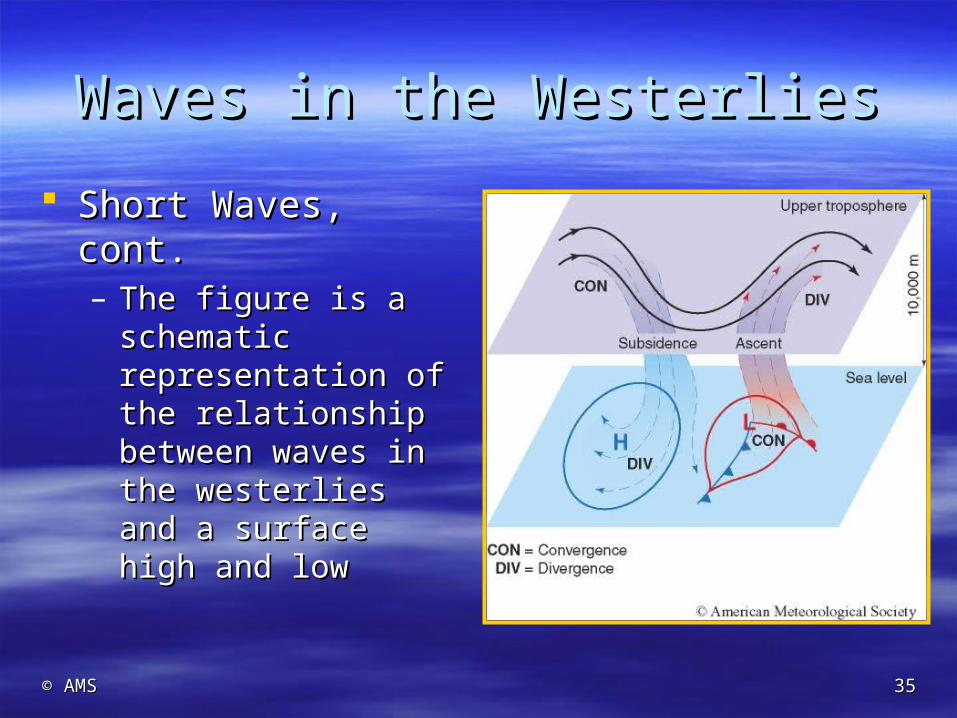
Short WavesShort Waves– Ripples superimposed on Rossby long wavesRipples superimposed on Rossby long waves– Propogate rapidly through the Rossby wavesPropogate rapidly through the Rossby waves– 12 or more waves are generally found in a hemisphere at any one time12 or more waves are generally found in a hemisphere at any one time– Westerlies accelerate in ridges and slow in troughs, inducing horizontal Westerlies accelerate in ridges and slow in troughs, inducing horizontal
speed convergence aloft ahead of ridges and horizontal speed speed convergence aloft ahead of ridges and horizontal speed divergence aloft ahead of troughsdivergence aloft ahead of troughs
© AMS© AMS 3535
Waves in the WesterliesWaves in the Westerlies
Short Waves, cont.Short Waves, cont.– The figure is a The figure is a
schematic schematic representation of the representation of the relationship between relationship between waves in the westerlies waves in the westerlies and a surface high and and a surface high and lowlow

© AMS© AMS 3636
Jet StreamsJet Streams Narrow corridors of very strong windNarrow corridors of very strong wind In middle latitudes, the most prominent jet In middle latitudes, the most prominent jet
stream (polar front jet stream) is located stream (polar front jet stream) is located above the polar front in the upper above the polar front in the upper troposphere between the midlatitude troposphere between the midlatitude tropopause and the polar tropopausetropopause and the polar tropopause– Follows the path of the planetary westerly Follows the path of the planetary westerly
waveswaves– Winds may top 160 km per hr (100 mph)Winds may top 160 km per hr (100 mph)– Eastbound aircraft seek it as a tail windEastbound aircraft seek it as a tail wind

© AMS© AMS 3737
Jet StreamsJet Streams
The polar front is a narrow The polar front is a narrow transition zone between transition zone between relatively cold and warm air relatively cold and warm air massesmasses– Cold air is denser than warm air, Cold air is denser than warm air,
so pressure drops more rapidly so pressure drops more rapidly in a column of cold air than in a column of cold air than warm airwarm air
– Even if air pressure is the same Even if air pressure is the same at the surface, there is a at the surface, there is a horizontal pressure gradient aloft horizontal pressure gradient aloft (directed from warm to cold air) (directed from warm to cold air) that increases with increasing that increases with increasing altitudealtitude

© AMS© AMS 3838
Jet StreamsJet Streams Coriolis Effect balances the horizontal pressure Coriolis Effect balances the horizontal pressure
gradient forcegradient force– Winds blow parallel to the polar front with cold air to the Winds blow parallel to the polar front with cold air to the
left of the direction of motion in the Northern left of the direction of motion in the Northern HemisphereHemisphere
– Due to a strengthening horizontal pressure gradient with Due to a strengthening horizontal pressure gradient with increasing altitude, wind speed increases with altitude in increasing altitude, wind speed increases with altitude in the troposphere and is highest near the tropopausethe troposphere and is highest near the tropopause
Where the polar front is well defined, jet stream Where the polar front is well defined, jet stream winds are stronger and jet streaks may developwinds are stronger and jet streaks may develop– Strongest jet streaks develop in winter along the east Strongest jet streaks develop in winter along the east
coasts of North America and Asiacoasts of North America and Asia Great temperature contrast between snow-covered land and Great temperature contrast between snow-covered land and
ice-free sea surfaceice-free sea surface– Jet streaks may have wind speeds as high as 350 km Jet streaks may have wind speeds as high as 350 km
per hr (217 mph)per hr (217 mph)

© AMS© AMS 3939
Jet StreamsJet Streams
The figure below is a map view of a jet streak with The figure below is a map view of a jet streak with associated regions of horizontal divergence and associated regions of horizontal divergence and convergence aloft. The contour lines are isotachs, lines of convergence aloft. The contour lines are isotachs, lines of equal wind speed (in km per hr). In a straight jet streak, the equal wind speed (in km per hr). In a straight jet streak, the strongest horizontal divergence is in the left-front quadrant, strongest horizontal divergence is in the left-front quadrant, supplying upper-air support for extra-tropical cyclone supplying upper-air support for extra-tropical cyclone development.development.

© AMS© AMS 4040
Jet StreamsJet Streams
Undergoes important Undergoes important seasonal shiftsseasonal shifts
Strengthens in winter and Strengthens in winter and weakens in summerweakens in summer
Map shows long-term Map shows long-term average seasonal average seasonal locationslocations
When polar front jet When polar front jet stream is south of your stream is south of your location, weather is location, weather is relatively cold. When it is relatively cold. When it is north, the weather is north, the weather is relatively warmrelatively warm

© AMS© AMS 4141
Jet StreamsJet Streams Subtropical Jet streamSubtropical Jet stream
– Found on the poleward side of Hadley cells near the Found on the poleward side of Hadley cells near the break in the tropopause between tropical and middle break in the tropopause between tropical and middle latitudeslatitudes
– Strongest in winterStrongest in winter– Less variable with latitude than the polar front jet streamLess variable with latitude than the polar front jet stream
Other jet streamsOther jet streams– Tropical easterly jetTropical easterly jet
Feature of the summer circulation at about 15 degrees N over Feature of the summer circulation at about 15 degrees N over North Africa and south of India and Southeast AsiaNorth Africa and south of India and Southeast Asia
– Low-level jet streamLow-level jet stream Several hundred meters above Earth’s surfaceSeveral hundred meters above Earth’s surface Surges up Mississippi River valleySurges up Mississippi River valley Contributes to the development of nocturnal thunderstormsContributes to the development of nocturnal thunderstorms

© AMS© AMS 4242
El NiñoEl Niño, La Niña, and the Southern , La Niña, and the Southern OscillationOscillation
In El Niño, In El Niño, – Trade winds weakenTrade winds weaken– SST rise well above long-term averages over the central and SST rise well above long-term averages over the central and
eastern tropical Pacificeastern tropical Pacific– Areas of heavy rainfall shift from the western into the central Areas of heavy rainfall shift from the western into the central
tropical Pacifictropical Pacific La Niña is a period of exceptionally strong trade winds La Niña is a period of exceptionally strong trade winds
across the tropical Pacific with lower than usual SST in the across the tropical Pacific with lower than usual SST in the central and eastern tropical Pacificcentral and eastern tropical Pacific
El Niño is the warm phase and La Niña is the cold phase of El Niño is the warm phase and La Niña is the cold phase of the tropical atmosphere/ocean interactionthe tropical atmosphere/ocean interaction
El Niño and La Niña influence the prevailing circulation of El Niño and La Niña influence the prevailing circulation of the atmosphere in middle latitudes, especially in winterthe atmosphere in middle latitudes, especially in winter– Weather extremes that may accompany El Niño are opposite those Weather extremes that may accompany El Niño are opposite those
associated with La Niñaassociated with La Niña
© AMS© AMS 4343
El NiñoEl Niño, La Niña, and the Southern , La Niña, and the Southern OscillationOscillation
Historical PerspectiveHistorical Perspective– Originally was the name given by fisherman to the Originally was the name given by fisherman to the
seasonal occurrence of an unusually warm southward seasonal occurrence of an unusually warm southward flowing ocean current and poor fishing off the coast of flowing ocean current and poor fishing off the coast of Peru and Ecuador during the Christmas seasonPeru and Ecuador during the Christmas season Warm weather episodes are relatively brief (1-2 months) and Warm weather episodes are relatively brief (1-2 months) and
then SST and fisheries return to normal levelsthen SST and fisheries return to normal levels
– Now, scientists reserve the term El Niño for long-lasting Now, scientists reserve the term El Niño for long-lasting atmosphere/ocean anomaliesatmosphere/ocean anomalies Occurs every 3-7 yearsOccurs every 3-7 years Persists for 12-18 months or longerPersists for 12-18 months or longer Accompanied by significant Pacific SST changes, major Accompanied by significant Pacific SST changes, major
changes in atmosphere and ocean circulation patterns, and changes in atmosphere and ocean circulation patterns, and collapse of important South American fisheriescollapse of important South American fisheries

© AMS© AMS 4444
El NiñoEl Niño, La Niña, and the Southern , La Niña, and the Southern OscillationOscillation
Historical PerspectiveHistorical Perspective– An important step in understanding El Niño was the An important step in understanding El Niño was the
discovery of the southern oscillation in 1924 by Sir discovery of the southern oscillation in 1924 by Sir Gilbert WalkerGilbert Walker Seesaw variation in air pressure across the tropical Indian and Seesaw variation in air pressure across the tropical Indian and
Pacific OceansPacific Oceans– Influences monsoon rains in IndiaInfluences monsoon rains in India
– In 1966, Jacob Bjerknes demonstrated a relationship In 1966, Jacob Bjerknes demonstrated a relationship between El Nibetween El Niñño and the southern oscillation (ENSO)o and the southern oscillation (ENSO) An El Niño episode begins when the air pressure gradient An El Niño episode begins when the air pressure gradient
across the tropical Pacific begins to weaken, heralding the across the tropical Pacific begins to weaken, heralding the slackening of the trade windsslackening of the trade winds
– Intense Intense El NiñoEl Niño of 1982-83 brought attention to weather of 1982-83 brought attention to weather impacts worldwideimpacts worldwide

© AMS© AMS 4545
El NiñoEl Niño, La Niña, and the Southern , La Niña, and the Southern OscillationOscillation
Historical PerspectiveHistorical Perspective– Today, the southern Today, the southern
oscillation index is oscillation index is computed by subtracting computed by subtracting the Darwin pressure the Darwin pressure from the Tahiti pressure from the Tahiti pressure divided by the standard divided by the standard deviation of that quantitydeviation of that quantity Strong positive values Strong positive values
indicate La Niña conditionsindicate La Niña conditions Strong negative values Strong negative values
indicate El Niño conditionsindicate El Niño conditions

© AMS© AMS 4646
El NiñoEl Niño, La Niña, and the Southern , La Niña, and the Southern OscillationOscillation
Neutral Conditions in the Tropical PacificNeutral Conditions in the Tropical Pacific– If Earth did not rotate, frictional coupling between the wind and the If Earth did not rotate, frictional coupling between the wind and the
ocean surface would push a thin layer of water in the same ocean surface would push a thin layer of water in the same direction of the wind, and the surface layer would drag the layer direction of the wind, and the surface layer would drag the layer beneath itbeneath it
– Because Earth rotates, the shallow layer of surface water set in Because Earth rotates, the shallow layer of surface water set in motion by the wind is deflected to the right of the wind direction in motion by the wind is deflected to the right of the wind direction in the Northern Hemisphere and to the left in the Southern the Northern Hemisphere and to the left in the Southern HemisphereHemisphere
– Except at the equator, each layer of water put into motion by the Except at the equator, each layer of water put into motion by the layer above shifts direction because of the Coriolis Effectlayer above shifts direction because of the Coriolis Effect
– The model to plot the direction and speed of water layers is known The model to plot the direction and speed of water layers is known as the Ekman spiralas the Ekman spiral
– The net water movement of 90° to the wind direction due to the The net water movement of 90° to the wind direction due to the coupling between wind and surface water is known as Ekman coupling between wind and surface water is known as Ekman transporttransport

© AMS© AMS 4747
Ekman Spiral and Ekman TransportEkman Spiral and Ekman Transport
In the Northern Hemisphere, the surface layer of water moves at 45 degrees to In the Northern Hemisphere, the surface layer of water moves at 45 degrees to the right of the wind direction. The net transport of water through the wind the right of the wind direction. The net transport of water through the wind driven column is 90 degrees to the right of the wind.driven column is 90 degrees to the right of the wind.

© AMS© AMS 4848
El NiñoEl Niño, La Niña, and the Southern , La Niña, and the Southern OscillationOscillation
Typically, southerly or southwesterly Typically, southerly or southwesterly winds blowing along the west coast of winds blowing along the west coast of South America drive warm surface South America drive warm surface waters to the left (westward) via Ekman waters to the left (westward) via Ekman transport, away from the coasttransport, away from the coast– In the process known as upwelling, cold-In the process known as upwelling, cold-
nutrient-rich waters move upward from nutrient-rich waters move upward from depths of 200 to 1000 m (650 to 3300 ft)depths of 200 to 1000 m (650 to 3300 ft)
– Abundance of nutrients brought to sunlit Abundance of nutrients brought to sunlit surface waters spurs an explosive surface waters spurs an explosive growth of phytoplankton, which supports growth of phytoplankton, which supports a highly productive fisherya highly productive fishery

© AMS© AMS 4949
Average rainfall per day across the tropical Pacific from 1998-2007

© AMS© AMS 5050
El NiñoEl Niño and La Niña and La Niña
Neutral Conditions in the Tropical Pacific, cont.Neutral Conditions in the Tropical Pacific, cont.– Walker Circulation (large convective-type circulation)Walker Circulation (large convective-type circulation)
High SST in the western tropical Pacific lowers surface air High SST in the western tropical Pacific lowers surface air pressure and low SST in the eastern tropical Pacific raises air pressure and low SST in the eastern tropical Pacific raises air pressurepressure
During neutral conditions, the east-west SST gradient reinforces During neutral conditions, the east-west SST gradient reinforces the trade winds by strengthening the east-west pressure the trade winds by strengthening the east-west pressure gradientgradient
Trades become warmer and more humid as they flow over the Trades become warmer and more humid as they flow over the ocean surfaceocean surface
In the western tropical Pacific warm humid air rises, expands, In the western tropical Pacific warm humid air rises, expands, and cools, leading to thunderstorm formationand cools, leading to thunderstorm formation
Aloft, air flows eastward and sinks over the cooler water of the Aloft, air flows eastward and sinks over the cooler water of the eastern tropical Pacificeastern tropical Pacific

© AMS© AMS 5151
El NiñoEl Niño, La Niña, and the Southern , La Niña, and the Southern OscillationOscillation

© AMS© AMS 5252
El NiñoEl Niño and La Niña and La Niña The Warm Phase – El NiñoThe Warm Phase – El Niño
– Air pressure falls over the eastern tropical Pacific and Air pressure falls over the eastern tropical Pacific and rises over the western Pacificrises over the western Pacific Pressure gradient weakens; winds slacken and may reverse Pressure gradient weakens; winds slacken and may reverse
direction west of 180° longitudedirection west of 180° longitude– A thick layer of warm surface water drifts slowly A thick layer of warm surface water drifts slowly
eastward over the tropical Pacificeastward over the tropical Pacific In the western tropical Pacific, SST drops, sea-level falls, In the western tropical Pacific, SST drops, sea-level falls,
thermocline risesthermocline rises In the eastern Pacific, SST rises, sea-level rises, thermocline In the eastern Pacific, SST rises, sea-level rises, thermocline
deepens, upwelling is blocked, fish harvest plummets, coral deepens, upwelling is blocked, fish harvest plummets, coral bleeching occursbleeching occurs
– El NiEl Niñño has a ripple effect on the weather and climate o has a ripple effect on the weather and climate throughout the world. A linkage between atmospheric throughout the world. A linkage between atmospheric circulation changes in widely separated regions of the circulation changes in widely separated regions of the globe is known as a teleconnection.globe is known as a teleconnection.
– The 1997-98 El NiThe 1997-98 El Niñño rivaled its 1982-83 predecessor as o rivaled its 1982-83 predecessor as the most intense of the 20the most intense of the 20thth century century

© AMS© AMS 5353
El NiñoEl Niño, La Niña, and the Southern , La Niña, and the Southern OscillationOscillation

© AMS© AMS 5555
El NiñoEl Niño and La Niña and La Niña
The Cold Phase - The Cold Phase - La NiñaLa Niña– A period of unusually strong trade winds and A period of unusually strong trade winds and
exceptionally vigorous upwelling in the eastern exceptionally vigorous upwelling in the eastern tropical Pacifictropical Pacific
– SST anomalies opposite those of El SST anomalies opposite those of El Niño, Niño, although the magnitude of anomalies are not as although the magnitude of anomalies are not as great (typically 2 to 3 Celsius degrees below the great (typically 2 to 3 Celsius degrees below the long-term average)long-term average)
– Brings opposite weather extremes than Brings opposite weather extremes than El NiñoEl Niño

© AMS© AMS 5656
El NiñoEl Niño, La Niña, and the Southern , La Niña, and the Southern OscillationOscillation

© AMS© AMS 5757
El NiñoEl Niño and La Niña and La Niña Frequency of El NiñoFrequency of El Niño and La Niña and La Niña
– NOAA’s Climate Prediction Center launched its new ENSO Alert System in February 2009
El Niño or La Niña watch: issued when conditions in the equatorial Pacific are favorable for the development of El Niño or La Niña conditions within the next three months
El Niño or La Niña advisory: issued when El Niño or La Niña conditions have developed and are expected to continue

© AMS© AMS 5858
El NiñoEl Niño, La Niña, and the Southern , La Niña, and the Southern OscillationOscillation

© AMS© AMS 5959
El NiñoEl Niño, La Niña, and the Southern , La Niña, and the Southern OscillationOscillation
Historical EpisodesHistorical Episodes– In 1982-83, the weather seemed to go wild in
many parts of the world as a result of the newly discovered phenomenon El Niñoño Spurred further research on atmosphere-ocean
circulation changes
– The 1997-98 El Niño rivaled the 1982-83 El Niño as the most intense of the 20th century

© AMS© AMS 6060Evolution of the 1997-98 El NiñoEvolution of the 1997-98 El Niño

© AMS© AMS 6161
El NiñoEl Niño, La Niña, and the Southern , La Niña, and the Southern OscillationOscillation
Prediction and MonitoringPrediction and Monitoring– Some empirical and dynamical numerical models have Some empirical and dynamical numerical models have
been developedbeen developed Overall results have been mixedOverall results have been mixed Dynamical models performed well in detecting the onset of the Dynamical models performed well in detecting the onset of the
1997-98 El Niño due to the increasing amount of 1997-98 El Niño due to the increasing amount of ocean/atmosphere observational data from the tropical Pacificocean/atmosphere observational data from the tropical Pacific
– ENSO Observing SystemENSO Observing System Consists of an array of moored and drifting buoys, island and Consists of an array of moored and drifting buoys, island and
coastal tide gauges, ship-based measurements, and satellitescoastal tide gauges, ship-based measurements, and satellites One component is the TAO/TRITON instrument array consisting One component is the TAO/TRITON instrument array consisting
of 70 deep-sea mooringsof 70 deep-sea moorings TOPEX/Poseiden and TRMM satellites also essential to TOPEX/Poseiden and TRMM satellites also essential to
monitoring conditionsmonitoring conditions

© AMS© AMS 6262

© AMS© AMS 6363
El NiñoEl Niño, La Niña, and the Southern , La Niña, and the Southern OscillationOscillation
Sea level record at a location along the equator in the eastern
tropical Pacific derived from measurements made by the TOPEX/
Poseidon satelliteTAO buoy