an atomic emission method routine detection of metal salts, principally na, k, li, ca, and ba flame...
TRANSCRIPT

an an atomic emission method atomic emission method routine detection of metal salts, principally routine detection of metal salts, principally
Na, K, Li, Ca, and BaNa, K, Li, Ca, and Ba
Flame PhotometryFlame PhotometryFFlame atomic emission spectrometrylame atomic emission spectrometry

Flame PhotometryFlame PhotometryFFlame atomic emission spectrometrylame atomic emission spectrometry
Emission is the process by which a higher energy quantum mechanical state of a particle becomes converted to a lower one through a photon resulting in the production of light.
The frequency of light emitted is a function of the energy of the transition. Since energy must be conserved, the energy difference between the two states equals the energy carried off by the photon.
By heating the sample to a high temperature, the excitations are produced by collisions between the sample atoms. This method is used in flame emission spectroscopy
Each element's emission spectrum is unique.

Flame PhotometryFlame PhotometryFFlame atomic emission spectrometrylame atomic emission spectrometry
How can we distinguish absorption spectrum from emission spectrum?
An absroption spectrum has dark lines where the energy is absorbed and the emmision spectrum has bright lines where the emission energy is.
Why is the emission spectrum of an element a line spectrum and not a continuous spectrum?
It's a line spectrum because of the quantization of energy- meaning you only see energy with levels n=1,2,3.... One would never see the energy level n=2.8 for instance- that would be the case if it were continuous rather than a line spectrum.

Flame PhotometryFlame Photometry

Solutions are Solutions are aspiratedaspirated into the flame into the flame The hot flame The hot flame evaporatesevaporates the solvent the solvent,,
atomizesatomizes the metal the metal,, excitesexcites a a valence electronvalence electron to to an upper state. an upper state.
Light is emitted at characteristic wavelengths for Light is emitted at characteristic wavelengths for each metal as the electron returns to the ground each metal as the electron returns to the ground statestate
Optical filters are used to select the emission Optical filters are used to select the emission wavelength monitored for the analyte species wavelength monitored for the analyte species
Flame PhotometryFlame Photometry

The energy that is needed for the excitation is provided The energy that is needed for the excitation is provided by theby the temperature of the flame (2000-3000 ºC), temperature of the flame (2000-3000 ºC), produced by the burning of acetyleneproduced by the burning of acetylene or natural gas (or or natural gas (or propane-butane gas) in the presence of air or oxygenpropane-butane gas) in the presence of air or oxygen..
By the heat of the flame and the effect of the reducing By the heat of the flame and the effect of the reducing
gas (fuel), molecules and ions of the sample species are gas (fuel), molecules and ions of the sample species are decomposed and reduced to give atoms, e.g.: Nadecomposed and reduced to give atoms, e.g.: Na++ + e + e-- Na. Na.
Atoms in the vapour state give line spectra. Atoms in the vapour state give line spectra. (there are no covalent bonds (there are no covalent bonds there are not any there are not any vibrational sub-levels to cause broadening)vibrational sub-levels to cause broadening)
Flame PhotometryFlame Photometry

Many different experimental variables affect the Many different experimental variables affect the intensityintensity of light emitted from the flame.of light emitted from the flame. Fuel and oxidant flow rates and purityFuel and oxidant flow rates and purity aspiration ratesaspiration rates solution viscositysolution viscosity concomitants in the samples, etc.concomitants in the samples, etc.
CCareful and frequent calibration is necessary for areful and frequent calibration is necessary for good resultsgood results
Flame PhotometryFlame Photometry

Flame PhotometryFlame Photometry

The bright doublet known as the Sodium Dlines at 588.9950 and 589.5924 nm.
These lines are emitted in a transition from the 3p to the 3s levels.
Flame PhotometryFlame Photometry

Flame PhotometryFlame Photometry
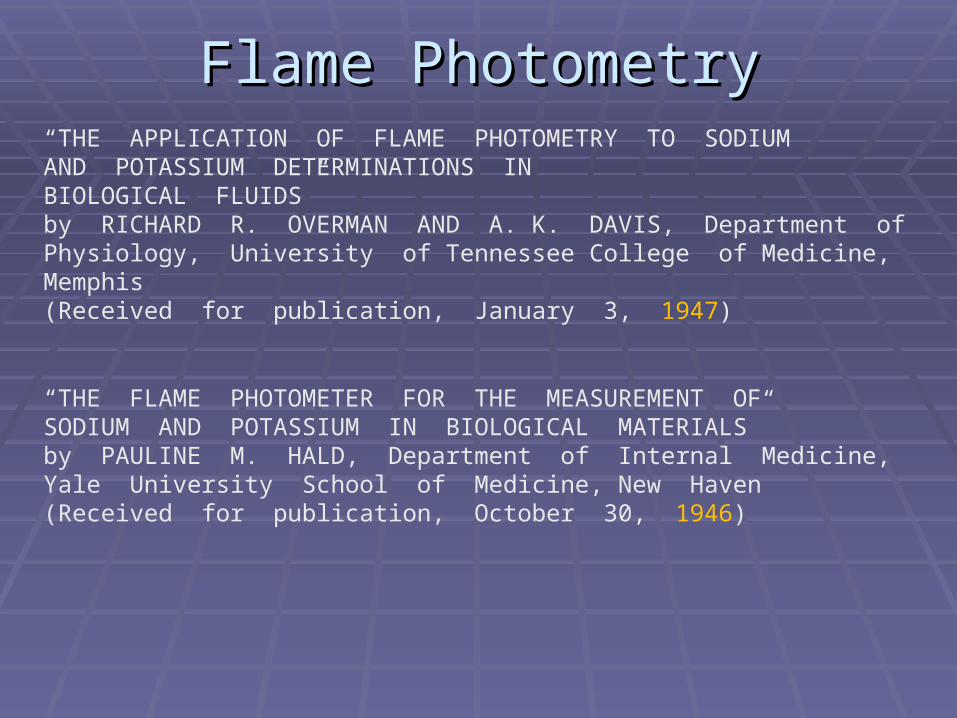
Flame PhotometryFlame Photometry“THE APPLICATION OF FLAME PHOTOMETRY TO SODIUM AND POTASSIUM DETERMINATIONS IN BIOLOGICAL FLUIDS”by RICHARD R. OVERMAN AND A. K. DAVIS, Department of Physiology, University of Tennessee College of Medicine, Memphis(Received for publication, January 3, 1947)
“THE FLAME PHOTOMETER FOR THE MEASUREMENT OF SODIUM AND POTASSIUM IN BIOLOGICAL MATERIALS” by PAULINE M. HALD, Department of Internal Medicine, Yale University School of Medicine, New Haven(Received for publication, October 30, 1946)

Flame PhotometryFlame Photometry
The Determination of Sodium and Potassium in Biological FluidProtocol: P05-031AIntroduction The simple measurement of sodium and potassium in various biological fluids using a flame photometer is described, including dilution ratios, interferences and calibration curves.
Materials Required • Equipment JENWAY Flame Photometer PFP7 Volumetric Glassware Pipettes • Reagents Sodium Standard Solution – 1000mg/l (1000ppm) (Jenway Part Number 025 021) Potassium Standard Solution – 1000mg/l (1000ppm) (Jenway Part Number 025 023) Deionised Water

Flame PhotometryFlame PhotometryMethods
Calibration using a standard curve 1. Set up the instrument as described in the instruction manual. 2. Prepare the following standard solutions: 0.2, 0.4, 0.6, 0.8 and 1.0mg Na/100ml, from the 1000mg/l sodium standard solution, using deionised water as the diluent. 3. Select the sodium filter and aspirate the 1.0mg Na/100ml standard and adjust sensitivity control to obtain a reading of 100. 4. Aspirate deionised water and adjust the zero control to obtain zero reading. 5. Aspirate 1.0mg Na/100ml standard again, re-adjust to 100. 6. Aspirate deionised water again and re-adjust if necessary to zero. 7. Repeat steps 5 and 6 if necessary to obtain 100 on the standard and zero on deionised water. 8. Aspirate the other standard solutions, note the readings and plot a calibration curve. 9. Repeat the above calibration procedure with potassium filter, using standard solutions of the following concentrations: 0.2, 0.4, 0.6, 0.8 and 1.0mg K/100ml, prepared from the 1000mg/l potassium standard solution using deionised water as the diluent.

Flame PhotometryFlame PhotometrySERUM POTASSIUM
Sample preparation Prepare a 1:50 dilution of haemolysis-free serum in deionised water. Note: The sodium present in the sample will not affect the potassium determination and no allowance need be made for sodium when preparing the standards.
Reagents 1.0mg K/100ml standard Blank Deionised water Procedure 1. Set up the instrument with the K filter and adjust the flame as described in the instruction manual. 2. Adjust the instrument to obtain 100 on the 1.0mg/100ml standard and zero reading on the blank as described above in the calibration section. 3. Aspirate sample and note the reading. 4. From the calibration curve previously prepared for potassium, read off the concentration equivalent to this reading. 5. To obtain mg K/100ml of serum, multiply this concentration by the dilution factor. 6. Aspirate deionised water to remove all traces of the sample, which might otherwise block the nebuliser.

Flame PhotometryFlame PhotometryPLASMA SODIUM Sample preparation Prepare a 1:500 dilution of the plasma sample in deionised water. Note: It is not necessary to remove proteins, also potassium and calcium do not interfere in the quantities present in plasma. Reagents 1.0mg Na/100ml standard Blank Deionised water Procedure 1. Set up the instrument with Na filter and adjust the flame as described in instruction manual. 2. Adjust the instrument to obtain 100 on the 1.0mg/100ml standard and zero reading on the blank as described above in the calibration section. 3. Aspirate sample and note the reading. 4. From the calibration curve previously prepared for sodium, read off the concentration equivalent to this reading. 5. To obtain mg Na/100ml of plasma, multiply this concentration by the dilution factor. 6. Aspirate deionised water to remove all traces of sample, which might otherwise block the nebuliser.
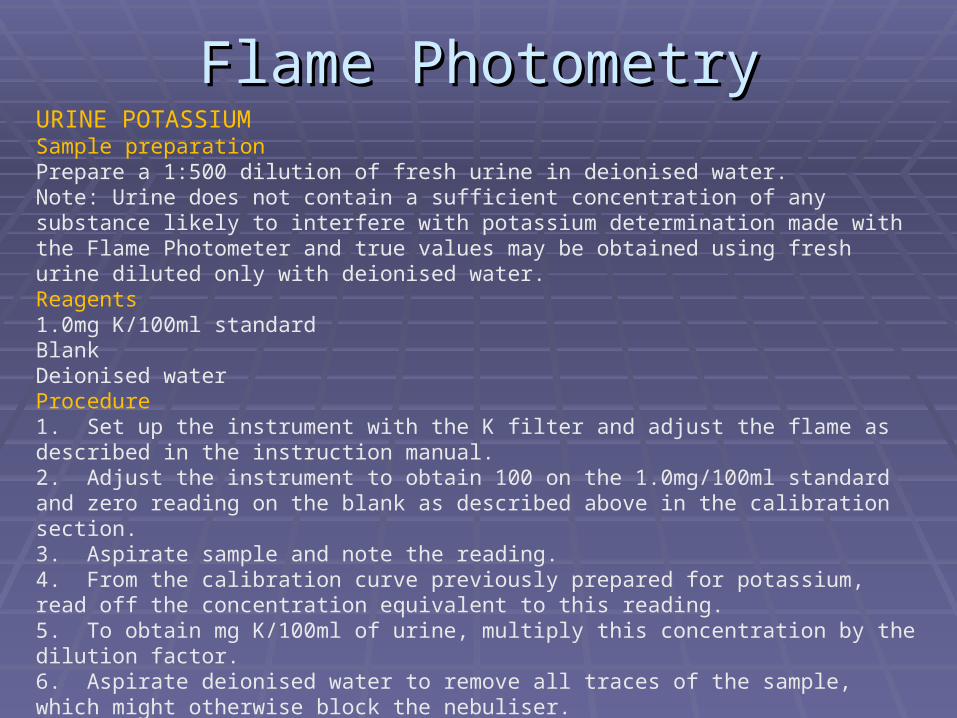
Flame PhotometryFlame PhotometryURINE POTASSIUM Sample preparation Prepare a 1:500 dilution of fresh urine in deionised water. Note: Urine does not contain a sufficient concentration of any substance likely to interfere with potassium determination made with the Flame Photometer and true values may be obtained using fresh urine diluted only with deionised water. Reagents 1.0mg K/100ml standard Blank Deionised water Procedure 1. Set up the instrument with the K filter and adjust the flame as described in the instruction manual. 2. Adjust the instrument to obtain 100 on the 1.0mg/100ml standard and zero reading on the blank as described above in the calibration section. 3. Aspirate sample and note the reading. 4. From the calibration curve previously prepared for potassium, read off the concentration equivalent to this reading. 5. To obtain mg K/100ml of urine, multiply this concentration by the dilution factor. 6. Aspirate deionised water to remove all traces of the sample, which might otherwise block the nebuliser.

Flame PhotometryFlame PhotometryURINE SODIUM Sample preparation Prepare a 1:1000 dilution of fresh urine in deionised water. Reagents 1.0mg K/100ml standard Blank Deionised water Procedure 1. Set up the instrument with Na filter and adjust the flame as described in instruction manual. 2. Adjust the instrument to obtain 100 on the 1.0mg/100ml standard and zero reading on the blank as described above in the calibration section. 3. Aspirate sample and note the reading. 4. From the calibration curve previously prepared for sodium, read off the concentration equivalent to this reading. 5. To obtain mg Na/100ml of urine, multiply this concentration by the dilution factor. 6. Aspirate deionised water to remove all traces of sample, which might otherwise block the nebuliser