* assistant professor of marketing, insead, boulevard...
TRANSCRIPT

"SPECIFYING COMPETITIVE EFFECTS INDIFFUSION MODELS: AN EMPIRICAL ANALYSIS"
by
Philip PARKER*and
Hubert GATIGNON**
N° 911621MKT
* Assistant Professor of Marketing, INSEAD, Boulevard de Constance,Fontainebleau 77305 Cedex, France.** Associate Professor of Marketing, The Wharton School, Universityof Pennsylvania, U.S.A.
Printed at INSEAD,Fontainebleau, France

SPECIFYING COMPETITIVE EFFECTS IN DIFFUSION MODELS:AN EMPIRICAL ANALYSIS
Philip Parker
and
Hubert Gatignon*
November, 1991
* Philip M. Parker is Assistant Professor of Marketing, INSEAD,Fontainebleau, France and Hubert Gatignon is Associate Professor ofMarketing, The Wharton School, University of Pennsylvania. Thanks areextended to Information Resources Inc., Broadcast Advertising Reports andLeading National Advertisers for making the data available and to LeonardLodish, Katrina Maxwell, David Reibstein, Howard Kunreuther and F. GerardAdams for their comments on this research. Part of this research wasconducted while Hubert Gatignon was a visiting Professor at the EuropeanInstitute for Advanced Studies in Management, Brussels (Belgium) and at theFacultes Universitaires Catholiques de Mons (Belgium).

SPECIFYING COMPETITIVE EFFECTS IN DIFFUSION MODELS:AN EMPIRICAL ANALYSIS
ABSTRACT
The objectives of this research are to provide a systematic analysis ofalternative specifications of brand—level first purchase diffusion models, andto empirically assess within a product category the relative success of thesemodels to explain trial dynamics. In particular, this analysis addresses thefollowing issues for a new and growing category: (1) the role of brand—specific versus category—level (competitive) effects across brands, (2) therole of both price and advertising on brand—level trial dynamics, (3) theexistence of static versus dynamic price and advertising elasticities, (4) theresponse of brand trials to absolute versus relative measures of marketing mixactivity, (5) the relative ability of various functional forms (e.g. separableversus nonseparable) in explaining brand—level trial dynamics in a newcategory, and (6) whether a common functional form, or hypothesized diffusionprocess can be imposed on all new brands entering into a new category. Whilesuch issues have received substantial attention in the literature for existingor newly launched brands in mature categories (e.g., in the area of marketshare models), these areas are relatively under—researched for new products innew categories which are undergoing a diffusion process.

SPECIFYING COMPETITIVE EFFECTS IN DIFFUSION MODELS:AN EMPIRICAL ANALYSIS
New product diffusion models have been developed to help marketing
managers (1) forecast market potentials and sales growth patterns, (2) test
hypotheses concerning the nature of the underlying diffusion process, and (3)
derive normative rules for optimal marketing mix allocation over the product
life cycle (Mahajan, Muller and Bass 1990).
Since the 1960s, models have increased in complexity from growth curves
such as the modified exponential curve (Fourt and Woodlock 1960), the Gompertz
curve (Chow 1967), the logistic function (Mansfield 1961) and the mixed
influence diffusion model of Bass (1969) to diffusion models with varying
potentials due to exogenous factors (Mahajan and Peterson 1978, Mahajan,
Peterson, Jain and Malhotra 1979) and to models incorporating marketing mix
variables. 1 Models with marketing mix variables have typically incorporated
one marketing mix variable at a time such as price (Robinson and Lakhani 1975,
Dolan and Jeuland 1981, Bass 1980, Kalish 1983), advertising (Horsky and Simon
1983, Simon and Sebastian 1987, Dockner and Jorgensen 1988, Ozga 1960), sales
force (Lilien, Rao and Kalish 1981) and distribution (Jones and Ritz 1991).
Noteworthy exceptions regarding monopolistic models are Jeuland (1981), who
incorporates information propagation due to communication programs and price,
and Kalish (1985) who models advertising and price effects on the diffusion
process.
Recently, brand-level diffusion models have become of greater interest
because the normative recommendations derived from monopolistic markets are
feared to be unapplicable to marketing situations when multiple brands enter
into a new category (see, for example, Eliashberg and Jeuland 1986). While
-1-

progress has been made from a normative perspective, empirical models of
brand—level diffusion have been under—represented in the literature. In fact,
model structures often assumed in normative research have yet to be
empirically validated at the brand level. Normative models have used a
variety of theoretically plausible specifications to capture marketing mix
effects at the brand level (see Mahajan, Muller and Bass 1990, and Hanssens,
Parsons and Schultz, Chapter 8, 1990 for reviews of normative diffusion
models). For example, Dockner and Jorgensen (1988) develop special cases
represented by a number of competitive model specifications, while Eliashberg
and Jeuland (1986) assume a unique model and elasticity structure across
competitors. Normative analyses also differ in their use of absolute versus
relative measures of marketing mix activities. This lack of empirical
research noted by Gatignon and Robertson (1985) is not specific to marketing,
as Rogers (1983) reports a similar lack of work on decentralized, or
competitive processes, partially due to difficulties in observing individual
behavior at the brand or firm (change agent) level. In doing so, one must
necessarily consider brand—level activities, including, for example, pricing
and advertising.
In this paper we propose to study brand—level diffusion models by focusing
on four objectives: (1) to formally test various specifications diffusion
models of competition, (2) to test relevant theories with respect to the
impact of marketing mix activities on the diffusion process for brands in
competition, (3) to develop an efficient methodology to empirically compare
various nested and non—nested models of the diffusion process, (4) to
demonstrate the use of diffusion models to explain the trial diffusion of
frequently purchased products. The issues raised in this paper have received
—2—

substantial attention in the literature for existing or newly launched brands
in mature categories (e.g. in the area of market share models). However,
these areas are relatively under-researched for new products in new categories
undergoing a diffusion process. While diffusion models in marketing have
developed considerably (Mahajan, Muller and Bass 1990), empirical evidence has
been confined mostly to product category diffusion processes. Instead, we
investigate the diffusion at the brand level, i.e., in the context of products
or firms which compete in a new market.
Our research approach is similar in spirit to the work of Simon and
Sebastian (1987) whose objectives were to assess the influence of advertising
on diffusion in monopolistic markets. Here, alternative brand-level diffusion
processes are modeled so as to capture the dynamics of competition via brand-
specific interpersonal influences, price elasticity dynamics and advertising
elasticity dynamics.
We propose a methodology that expands on the work of Jain and Rao (1990)
who compare three models using three time series, and Kamakura and
Balasubramanian (1988) who compare twelve models using six time series.
Rather than using only nested tests of alternative specifications, we consider
both nested and nonnested tests of twenty models across five brands in
competition. In doing so, we address the following issues for a new and
growing category: (1) the role of brand-specific versus category-level effects
across brands, (2) the role of both price and advertising on brand-level
adoptions (trials), (3) the existence of static versus dynamic marketing mix
elasticities, (4) the response of brand adoptions (trials) to absolute versus
relative measures of marketing mix activity, (5) the relative ability of
various functional forms (e.g. separable versus nonseparable) in explaining
-3-

brand-level diffusion, and (6) whether a common functional form, or
hypothesized diffusion process can be imposed on all new competitors entering
into a new category, as certain normative analyses assume.
To estimate the alternative model specifications, a broad search across
durable and non-durable categories revealed that one category was suitable for
analysis—"hair styling mousses"-- which was a completely new category with
multiple entrants. The use of this category provides an opportunity to
examine the use of diffusion models on the trial process of frequently
packaged goods. Though our investigation is limited to a single product
category, clarification of the issues summarized above stand to improve the
applicability of normative prescriptions and provide a basis upon which to
capture brand-level processes.
In the first section, the question of how brand-level effects can be
specified in diffusion models, and the "behavioral" meaning of the various
alternatives are discussed. In the second section, an empirical analysis of
brand-level first purchases (trials), including time series of multiple brands
which entered the market sequentially is presented.
MODELING BRAND-LEVEL DIFFUSION
The diffusion literature recognizes that all categories evolve from a
centralized diffusion process, initially dominated by a monopolist, into a
decentralized process having many competitors (Rogers 1983). When the first
brand of a new product category (innovation) is launched, the firm acts as a
monopolist (Eliashberg and Jeuland 1986). Potential and actual first adopters
of the new product communicate with their peers and receive information from
the firm, via marketing activities. These two forces influence the brand-
-4-

level diffusion process for decentralized competitive markets. Cross-brand or
competitive interpersonal influence was first suggested in the marketing
literature by Peterson and Mahajan (1978) and the negative impact of new
entrants on the potential market of a single brand (or entrant) is recognized
in Horsky and Mate (1988), Erickson (1985), Thompson and Teng (1984), Norton
and Bass (1986), and Eliashberg and Jeuland (1986). Marketing mix variables,
either measured at the category or brand level, have been an integral part of
most models of brand-level or competitive market behavior, including price
(Rao and Bass 1985, Dockner and Jorgensen 1988), advertising (Mate 1982, Teng
and Thompson 1983, Horsky and Mate 1988), and both price and advertising
(Thompson and Teng 1984).
In this section, models that have been used in the literature are
considered by presenting a general framework that leads to a systematic
analysis of alternative expanded models. We use the general formulation of
Dockner and Jorgensen (1988) which we modify to incorporate multiple marketing
mix variables. Then, we will discuss in turn the role of interpersonal
communications and the influence of marketing mix decisions of brands
competing in the market.
The first purchase diffusion process can be generally expressed by the
differential equation (1):
s i - A i - fi (x1 , . . . xN ; P 1 , . . . , PN ; Al , . . . AN ) (1)
where
s - instantaneous number of adopters (new buyers),x - cumulative number of adopters,i firm/product/brand index,P - price,A - advertising expenses,N - number of firms competing in market.
-5-

Research investigating optimal advertising and price behavior over time
in the most general form has been undertaken while assuming the multiplicative
separable form for mathematical tractability (Kalish 1983, Dockner and
Jorgensen 1988):
s i*i - di (xl , . . . xN ) r i (P i , . . . PN ; Al , . . . AN ) (2)
where
d i (•) - diffusion process equation,
r i ( . ) - response function to marketing mix variables.
We will first discuss the two components of equation (2), i.e., the diffusion
process per se (d i (•)) and the marketing mix effects (r i (•)). Then, we will
consider non-separable effects. A significant issue addressed in this
research is the functional form since, at least for the non-separable case,
the optimal pricing and advertising policies over time can only be derived
after first selecting a specific functional form.
Interpersonal Influences and Brand-Level Competition
A brand in competition with other substitutes can diffuse according to a
number of different processes, as shown in Figure 1. Figure 1 illustrates the
interpersonal influences affecting a given brand in a new category. Adopters
of a brand, i, can be influenced by previous adoptions of that brand only
(X i ), or all previous brand-level adoptions combined (X), or of competitive
brand adoptions only (Xi ). In the case of frequently purchased products, the
first adoptions (trials) of a brand can come from households who have adopted
(tried) other brands -- implying multiple brand adoptions. While multiple-
brand adopters may exert a particular interpersonal influence, influences from
these adopters are captured by total category adoptions, and by competitive
-6-

adoptions. We will now consider diffusion processes based on the three
influences shown in Figure 1.
First, diffusion can be specific to each product/brand; the diffusion
process is not influenced by the diffusion of competitive product offerings.
This process (for now excluding marketing mix effects) can be represented as
in equation (3)2:
d i (•) — ai + b i (x,/M,) (Mi — x i ) (3)
where
a i — external influence coefficient of brand i,b, — internal influence coefficient of brand i,M i — potential number of adoptions of brand i.
In this case, some individuals decide to purchase or try the brand
independently of others, i.e., as they are informed from sdurces external to
the social system (Gatignon and Robertson 1985). Other individuals use
information from previous adopters; this information is obtained from
interpersonal communication, from visual inspection of adcpters, or simply
because of the information conveyed by having a sizeable number of adopters.
This is the case when the products are substantially differentiated and the
information provided by adopters is specific to each product/brand. Equation
(3) represents the monopolistic case as each firm is sufficiently
differentiated so as to appear as a monopolist of an innovation. Equation 3,
therefore, corresponds to the Bass model applied at the brand level. The
substitute diffusion models of Peterson and Mahajan (1978) without competitive
word—of—mouth reduce to this specification.
In the second process, the diffusion is not specific to the
product/brand, but is general to each brand in the product category. This is
the case when adopters give general information about the nature of the
—7—

product and when the product offerings are undifferentiated. Then, each
product's first purchases may follow a product category diffusion process
i.e.,di (•) - ai + b i (x/M) ] (M - x) (4)
where
a- - external influence coefficient of brand i,b f - internal influence coefficient of category trials on brand
M potential number of adoptions (trials) in the category,x total category adoptions (trials).
In this case, the market potential is not specific to the brand, but is
the total market potential from which each brand will draw its share of first
purchases. The market potential is depleted whenever any brand is bought for
the first time. Horsky and Mate (1988), Eliashberg and Jeuland (1986) and
Dockner and Jorgensen (1988), among others, use a similar specification
without interpersonal influence diffusion. In the case of frequently
purchased products, M should reflect the fact that consumers can adopt (try)
multiple brands within the same category; the number of multiple adoptions
(trials) per household will generally be limited to some level less than the
total number of competing brands (i.e. consumers are not likely to try all
competing brands). If an individual tries multiple brands, this should be
reflected in this market potential estimate.
Finally, we consider influences from particular brands. Communication
between adopters at the brand level typically reflects two types of
interpersonal influence: (1) brand-specific influence, and (2) competitive
influence (Peterson and Mahajan 1978). Past adopters bought a specific brand.
Consequently, they can provide information about that brand. In general,
-8-

given that they have tried a brand, one may expect that they are satisfied
with their choice, because of confirmation of expectations or through the
process of cognitive dissonance reduction. In general, they may be,
therefore, likely to provide positive information about that brand. There
are, however, cases of dissatisfaction which create the diffusion of negative
information (Richins 1983). For frequently purchased products, negative trial
experience from one brand can lead to trials of another brand by the same
individual. The net impact of negative and positive information depends on
the degree of persuasion of these sources. Negative information can attenuate
positive information, in some cases, to such an extent that it may dominate.
This is quite plausible because negative information tends to be more
influential than positive information (Leonard-Barton 1985). In most cases,
however, the diffusion process that results from the information provided by
previous triers of a brand should be positive. The same is not true of the
information provided by triers of a competitive brand. Indeed, the evaluation
provided by the adopter of brand i about brand j is more likely to be
negative. For high involvement decision processes, individuals who have made
a first purchase have deliberated and evaluated a number of alternatives;
given that they did not choose brand j, they must have found brand j inferior
(assuming that both are on the market). Consequently, the fact of having
chosen brand i corresponds to a negative evaluation of brand j in relation to
brand i. The larger the group of adopters of brand i, the more positive the
information about brand i relative to brand j. Therefore, the larger the
group of adopters of brand i, the slower the diffusion of brand j. This
suggests the following model:
d i (•) [ai + b i (x;/M;) + c i (x - x i )/(M - x i ) ] (M i - x i ) (5)
-9-

where
c i — competitive internal influence coefficient of brand i.3
This specification corresponds to the substitute model of Peterson and
Mahajan (1978). Note that a fourth case is possible, when the diffusion
process is as discussed above but when the market potential for a brand is
general to all the brands, which leads to equation (6):
d i (•) — [a i + b i (x;/M;) + c i (x — x i )/(M — x i ) (M — x) (6)
In summary, interpersonal influence which characterizes diffusion processes
are represented by parameters b i and c i . The brand specific interpersonal
effect b, is expected to be positive, while the influence from the adopters of
competitive products (c 1 ) is expected to be negative.
The Marketing Mix
In addition to the dynamic effects of interpersonal influence on the
diffusion of new products, external influences can affect a brand's first
purchase diffusion or trial rate. In a decentralized/competitive diffusion
process, the suppliers of the innovation use marketing mix activities to speed
up the diffusion of their product/brand.
Price. The effect of pricing on the diffusion process can be
represented in the response function by the price elasticity of demand over
the product life cycle. Mickwitz (1959) was the first to consider the
possibility of dynamic price elasticities over the product life cycle. Based
on theoretical considerations, Mickwitz contended that price elasticities rise
in the first three stages of the life cycle, and fall during the decline, or
final stage. The same belief is held by Kotler (1966) and Lambin (1970).
Diffusion theory, as expanded into the marketing field by Robertson (1971),
—10—

suggests that innovators or early adopters of new products have relatively
high incomes and are therefore less sensitive to price changes than later
adopters. Economic theory similarly argues that elasticities are directly
related to the number of alternatives available to the consumers. The greater
the number of alternatives or close substitutes, the more brand—specific price
sensitivity increases.
An early empirical study by General Motors found results supporting this
contention (Dean 1950). Liu and Hanssens (1981), investigating inexpensive
gift items, and Tellis (1988), based on a meta analysis of branded products,
find that elasticities increase over the product life cycle. Simon (1979)
empirically examines the dynamics of price elasticities on 43 brands of
frequently purchased products (pharmaceutical, detergents, and household
cleansers), and finds that the price elasticity of growth brands decreases
over time and the price elasticity of decline brands increases over time.
Lilien and Yoon (1988) find that elasticities are stable in introduction and
decline stages and decrease during the growth—to—maturity stage of the life
cycle when examining the sales of thirty—five industrial chemicals. One
possible explanation for the lack of consistency across studies might be due
to differences in the level of analysis, some using aggregate industry sales
and others performing the analysis at the brand level. More importantly,
however, is the question of the theoretical rationale which might explain why
these parameters vary over time. Parsons (1975) and Tellis (1988) consider
changes in the competitive structure of the market. This is consistent with
the traditional approach to modeling competition in econometrics using
relative prices as explanatory variables (P,). Even though the relative price
sensitivity (the response function coefficient) may not change over time, the
—11—

change in sales due to a constant change in price depends on the changes in
competitors' prices. In particular, when a new competitor enters the market
with a lower price than the existing competitors (Eliashberg and Jeuland 1986)
the incumbent's price appears higher and sales fall; therefore, one approach
to modeling brand—level activities is to specify the response function r(•) as
a function of relative price, similarly to the price specification in market
share models (Brodie and de Kluyer 1984, Lambin 1976). An alternative is to
specify the price elasticity to vary explicitly as a function of the number of
competitors. In the first case, the impact of competition follows directly
from the relative price variable definition. With the prices of the
competitors entering in the denominator of the predictor variable, the
competitive effects are inversely related to the dependent variable. For
example, a new entry with the price lower than the current average, everything
else being held constant, makes the relative price of the analyzed brand
higher and, therefore, the current (for the introduction period) numbers of
first purchases will decrease (assuming a negative significant impact of
relative price on purchases). In the second case, it would be hypothesized,
according to the literature discussed above, that a brand's price sensitivity
to adoption (first purchase) increases as the number of entrants (close
substitutes) in the product category increases.
Advertising. The effects of marketing mix (advertising) activities have
recently been studied in diffusion theory research. Kotler (1971) reports
that advertising elasticities decline over time for packaged goods. The same
result is found by Parsons (1975) when examining the advertising elasticity
over the life cycle of a household cleanser. Arora (1979) expands this effort
by looking at the dynamic elasticities of journal advertising for new
—12—

pharmaceuticals. As found by Parsons, advertising elasticities approach zero
over time. However, there are two different sources of variation of
advertising elasticities of a product category. Brands have specific
characteristics and, therefore, the changing nature of the market offerings
over the product life cycle can alter the product class elasticities. In this
paper, we are not concerned with explaining brand differences which are stable
over time. Instead, we are interested in explanations due to the changing
nature of competitiveness in the market over time, which results in a dollar
spent in advertising a brand at a given point in time not generating the same
level of response in purchases than another dollar when facing a different
competitive environment.
Two factors can explain why the advertising effectiveness of a brand can
be expected to decrease over its life. The first explanation comes from the
fact that as more competitors enter the market, more competitive advertising
reaches consumers and escalation in expenditures are necessary to preserve a
constant effect. In addition, as more products enter the market, product
redundancies will occur ("me too" products). These explanations for
decreasing brand advertising effectiveness can be modeled with two
complementary specifications.4
If an advertising share predictor is specified to represent competitive
effects, the impact of competition follows directly from the share
specification (A 1 ), i.e., as the marketing actions of competitors enter into
the denominator of the predictor variable, the competitive effects are
inversely related to the dependent variable. Therefore, in this case, a new
entrant which advertises, everything else being held constant, would reduce
the share of advertising of the analyzed brand and, therefore, the current
—13—

(for the introduction period) numbers of purchases would decrease (assuming a
positive significant impact of advertising on purchases).
In addition, to represent the greater task difficulty as more brands
enter the market, the brand advertising sensitivity can be represented as a
function of the number of competitors. It is expected that the larger the
number of competitors, the smaller the advertising elasticity coefficient.
Both aspects discussed above correspond to the hypothesis that the impact of
advertising decreases as competition increases, in addition to effects due to
market saturation.
Therefore, the marketing mix variables can be modeled according to
either of the two equations (7) and (8)5:
fo + N(t) goi + N(t)ri(*) [Pi(t)) [Ai(t)] (7)
f - + f li N(t) go; + N(t)ri( . ) [Pi(t)] °' [Ai(t)] (8)
Where
P i (t) – price of brand i at time tA i (t) – advertising expenditure for brand i at time t
foi – intercept of price elasticity for brand i– coefficient of price elasticity dynamics for brand i
N(t) = number of brands in the product category at time t
goi – intercept of the elasticity of advertising for brand i– coefficient of advertising elasticity dynamics for brand i
1 N(t)P i (t) Pi(t)/.EN(t) j-1
P(t)
N(t)Ai(t)/Z
–1 Ai(t)
Equations (7) and (8) express the impact of marketing–mix variables on the
diffusion process. When appled to equation (2), the marketing mix effects and
the diffusion process have a separable form. In fact, as discussed earlier,
equation (1) might not be separable.
–14–

Non Separable Diffusion Functions
The separability question concerns whether price and advertising levels
affect one's decision making in interaction with cumulative sales experience
or not. It seems plausible that if a product is priced low, for example, then
people are more likely to talk about it as being a "great deal". In other
words, pricing or advertising can stimulate the communication processes
between adopters and non—adopters. Theoretically, advertising can give
credibility to interpersonal information or induce an "imitator" to seek
information from previous adopters (Simon and Sebastian 1987).
Rogers (1983) suggests that mass media communication is more important
during the early stages of an innovation's growth than for later sales. This
would imply that short—term communication elasticities decline over time. The
separable marketing mix response function allows for this phenomenon
implicitly because of the saturation effects of the market and explicitly with
equations (7) and (8). However, the same dynamics as specified by these
equations apply to both the external influence process and to interpersonal
communication. In fact, according to the argument discussed above, the
external influence coefficient is given greater importance in the beginning of
the life cycle while the internal influence coefficient dominates later.
To represent this phenomenon, both the external and internal influence
coefficients can be expressed as functions of advertising (Horsky and Simon
1983, Simon and Sebastian 1987, Teng and Thompson, 1983). 6 In theory, one
could develop individual response functions associated with each coefficient.
The latter approach is difficult due to estimation problems of
multicollinearity (Simon and Sebastian 1987). It is nevertheless instructive
to test alternative non—separable formulations which correspond to
—15—

specifications previously analyzed in the literature. A non separable
specification is proposed by Simon and Sebastian (1987) 7 where the response
function is multiplied by the coefficient of brand-spe ific internal
influence, b1:
s i[ai + bi (x;/M;) r i ( . )] (Mi - x i ) (9)
This specification does not increase the number of parameters but does
allow one to evaluate how sensitive the parameters are to alternative
formulations. In equation (9), advertising and price are viewed as marketing
tools which stimulate positive word of mouth.
The second alternative formulation multiplies the response function to
the coefficient of innovation and not to the other diffusion parameters,
similar to the model estimated by Horsky and Simon (1983):
s i- [ai r i (•) + (x;/M;)] (M i - x i ) (10)
In this case, advertising and price directly affect the likelihood of a
potential adopter to purchase at that period without being influenced by an
early adopter's information. Although the role of marketing is substantially
different depending on these specifications, the hypotheses concerning the
moderating role of competition remain unchanged.
In equations (9) and (10), the diffusion process is brand specific
whereas the corresponding alternatives with a product class process are
represented by equations (11) and (12):
s i[ai + bi (x/M) r i (•)] (M - x) (11)
s 1 fai r i (•) + b 1 (x/M)] (M - x) (12)
-16-

EMPIRICAL ANALYSIS OF COMPETITIVE MODELS
pata
In order to compare the alternative specifications, the data set must
have a reasonably large number of entrants (in order to assess competitive
effects) and include (from the first day of the category's existence) the
trials (first purchases), price, and advertising expenditures of all existing
brands. The product category defined as "hair styling mousses" was the only
category which met these criteria (with no seasonality) among hundreds of
categories screened (consumer electronics and frequently purchased products).
This category began with the first entrant in February 1984. By March 1985
there were 9 different (yet similar) brands offered on the market. The date
of entry of the brands are as follows:
Brand (order of entry) Date
1 02/19/842 03/11/843 05/06/844 05/06/845 07/01/846 08/12/847 10/28/848 11/18/849 02/10/85
The brands studied include the pioneer brand, L'Oreal, and eight other
"me too" products whose only differentiation consisted of their individual
umbrella brand names. All entrants studied are national brands and were
launched nationally; only trials in mass channels are considered (supermarkets
and drug stores). After the first nine brands (or two and a half years),
category segmentation led to an additional forty brand entrants by 1988; these
later brands differentiated themselves on various attributes, including
-17-

fragrances, flavors (e.g. lemon, cherry), colors (e.g. blue, purple),
metallic/glitter content, alcohol content, and hair treatment abilities (e.g.
strong hold, weak hold). Across the nine brands considered, Brand 6 (Suave)
is known as a follower or an umbrella "me too" brand for other hair care
products. Data sources relied on include (1) Information Resources, Inc. (IRI)
for first purchase/trial and price data, (2) Broadcast Advertising Report
(BAR) for broadcast advertising, and (3) Leading National Advertisers (LNA)
for print media advertising.
Trial and Price Data
In 1984/1985 (the period of the product category introduction), IRI
collected purchasing data from over 20,000 households across eight markets.
Only first purchases of a given brand of the product class were used from a
static sample of approximately 6,000 households who continually participated
during the diffusion of the hair mousse products. IRI data are aggregated to
cover periods of four weeks each (i.e., months). A maximum of 26 data points
could be retrieved for each brand, so that the data cover at most 26 months
for each of the brands studied. Average prices are given for those first
purchases (trials) recorded over each observation period. 8 Figures 2 and 3
provide graphic illustrations of the number of trials, and prices for,each of
the brands in the product category over the periods following their market
introduction. The last two brands that entered the market as well as brand 5
were excluded from the analysis due to lack of observations. Neither of these
brands achieved any significant penetration in the market, as shown in Figure
2. Brand 7 was also excluded because of its lack of diffusion process.
-18-

Trials of Brand 7 follow a purely random process which could not be fit by any
model of diffusion.
advertising Data.
Broadcast Advertising Reports (BAR) collects monthly advertising data
covering a number of broadcast media: local spot television, national network
television, cable television, and radio. For each of these media, BAR
calculates estimates of brand specific expenditures based on the time of day
an advertisement is aired, its duration (in seconds), audience covered (e.g.,
local versus national), and the broadcast station (e.g., NBC, CBS, etc.).
These estimates are aggregated on a monthly basis for each brand advertised.
Similar to BAR, Leading National Advertisers (LNA) collects brand-
specific monthly advertising data covering print media, including magazines,
newspapers and newspaper inserts. All major and most minor magazines and
newspapers are scanned for advertisements. Based on advertising rate cards
supplied by the publishers, the size of the advertisement (e.g., full-page,
half-page, etc.) and the format (black-and-white, or color), monthly
expenditures are estimated for each brand.
In order to derive total advertising expenditures, the broadcast and
print media expenditures (from BAR and LNA sources) are aggregated into total
advertising expenditures by brand (in thousands of dollars). 9 Figure 4 shows
the advertising expenditures for the nine brands introduced to the market
during the period of investigation following the entry.
Estimation
In order to test the existence of the competitive effects discussed
above and compare the performance of the various model specifications,
econometric models are specified and estimated at the brand-level. The
-19-

alternatives tested correspond to various combinations of the four diffusion
equations (equations (3), (4), (5), (6)) with the two alternative
specifications of the marketing response functions (equations (7) and (8)).
In addition, the non separable models represented by equations (9), (10), (11)
and (12) are also estimated, leading to 16 models to be evaluated. These
models are reported in Table 1 (where the time index t has been deleted for
greater clarity).
When the marketing mix variables have no effect, these models reduce to
simpler models which are also estimated. Models 1, 2, 9, 10, 11 or 12 reduce
to model 17, models 3, 4, 13, 14, 15 and 16 reduce to model 18, model 5 and 6
reduce to model 19 and models 7 and 8 reduce to model 20 as specified in Table
1. It should also be noted that with the restriction that c i - 0 models 19
and 20 reduce to model 17.
The market potentials (M O ) were first estimated by applying the original
Bass model individually to each brand. 1° The aggregate market potential (M)
was then estimated to be the sum of the individual brands' potential as the
competitors entered the market; the aggregate potential reflects, therefore,
multiple adoptions (trials) across brands. 11 Then, the diffusion parameters
were estimated using the estimated market potential specific to each model
specification as an externally evaluated parameter as in Gatignon, Eliashberg
and Robertson (1989).
Comparison of Models
Instead of reporting all of the parameter estimates for each model,
tests were performed to compare each specification and only the retained
models for each brand are presented and discussed.
-20-

When models are nested, such as model 17 which is a restricted version
of model 1, a likelihood ratio test can be performed. The restricted model is
defined as the null hypothesis and the alternative hypothesis represents the
unrestricted model specification. Therefore, it is possible to select the
best model specification within nested specifications. However, tests of non—
nested, non—linear models are not commonly performed in the marketing
literature. In our case, these tests are critical. Multiple tests exist for
non—nested models. However, different criteria can be used. Because we are
testing a theory in this study (the existence of certain types of effects)
rather than building models purely for predictive and/or for decision making
purposes, parsimony should not be a factor in the selection of the test to
apply (Rust and Schmittlein 1985). Therefore, there is no need to use
criteria that correct for the number of parameters. Such a test is proposed
by Cox (1961, 1962) and modified by Pesaran and Deaton (1978). The test used
is described in the Appendix. Due to the inherent nonlinearity of the
proposed models, the diffusion parameters are estimated using the Marquardt
nonlinear estimation technique. These estimates approach the Gauss maximum
likelihood estimates.
For each brand, tests for nested models are first performed and the Cox
test is applied to select the best of the non—nested models among the retained
nested models. The fit statistics of each model are provided in Table 2 and
the model test results are presented in Tables 3 and 4. Because of
collinearity, models 5, 6, 7, and 8, which involve competitive effects of
diffusion through the parameter c i and competitive marketing mix effects could
not be estimated. Consequently, the only models with competitive inter-
personal diffusion are models 19 and 20. Table 2 reports for each brand and
—21—

each model the residual sum of squares as well as the correlation between the
predicted and actual monthly trials. This correlation is a typical measure of
fit for non—linear models (Judge et al. 1985). A static version of the
marketing mix coefficients is also estimated for each brand. Because these
static models are restricted (fl ; — 0) versions of the models presented
in Table 1, nested model tests apply. These chi—square tests are reported in
Table 3. The model number corresponds to the numbers shown in Table 1 to
which the letter S is assigned to indicate the static (restricted) version of
each model. The statistically "best" nested models are then compared using
the Cox test for non—nested models (Table 4). As can be seen in Table 4, the
asymmetry of the Cox test does not define a single best alternative. Cox
tests are performed separately for models where the diffusion is brand
specific (models 1, 2, 9, 10, 11, 12) and for models where the diffusion is
product class—wide (models 3, 4, 12, 14, 15, 16). When the Cox test is
inconclusive, the more parsimonious model is retained. For each brand, the
final model reported in Table 5 is the "best" according to the Cox test
performed among the best brand specific versus product class diffusion models;
if two models are statistically equivallent, both are reported.
The tests of nested models are shown in Table 3 for each brand, where
the product class diffusion models (using M as the market potential of all
brands) are shown separately from the brand specific diffusion models (which
use a brand specific market potential MO. The most complete (dynamic
marketing mix effects) specification of each model form is first tested
against its least restricted version, which is the static marketing mix effect
model. For example, for brand 1, the static restricted version is not
statistically different from the dynamic specification of model 1. For model
—22—

2, however, the more complete dynamic specification has statistically a better
fit. The retained model is then tested against the next restriction, i.e., a
model with no marketing mix variables. The models with no marketing variables
are the basic Bass models specified either with a brand specific diffusion
(model 17) or with a product class diffusion (model 18). If one of the non—
basic models is retained, the corresponding basic model is rejected. These
nested tests lead to the selection of a subset of the original conceptually
feasible models. However, since the models retained so far are non—nested,
the Cox test must be used to select final models.
Table 4 presents these results in the form of matrices of scores for
each brand. Cox tests are performed among the retained brand specific
diffusion models and among the retained product class diffusion models
resulting in two matrices depending on the diffusion level specification. The
rows correspond to the test when the model on the row is the null hypothesis
and the model in the column is the alternative hypothesis. For example, for
brand 1, among the retained brand specific diffusion models, the static
version of model 11 is retained and among the product class diffusion models,
the static version of model 15 is selected.
A third matrix for each brand is necessary to select between the best of
the brand specific diffusion models and the best of the product class
diffusion models. Again using brand 1 as an example, model 15S is rejected
when the null is model 11S while we fail to reject model 11S when 15S is the
null hypothesis. We therefore select model 11S to represent the diffusion of
brand 1. In a few instances, such as for brands 3 and 4, selection could not
be made due to inconclusive Cox tests and the same number of parameters
prevented us from using the primary criterion. This primary criterion is
—23—

used, for example, for brand 5 to decide between models 2 and 12S in favor of
model 12S. These options were then retained for the final Cox tests. In the
case of brand 4, for example, models 1 and 9 are clearly rejected in favor of
model 13, leading to an unambiguous conclusion. However, two models are
reported for brand 3 as the criteria could not distinguish between models 10
and 4. The estimated models are shown in Table 5 with a summary of the
characteristics of the retained models across the brands. This fit is
graphically compared to the actual data and to the basic Bass model in Figure
2. This figure shows clearly that the lack of smoothness in the data is
explained well by the retained models.
The correlation between the predicted trials and the actual data are
shown for each brand in Table 5. The range from 0.71 to 0.91 indicates a good
fit of the retained models. The final models retained can be classified by
the type of diffusion process (brand specific versus product class), by the
marketing mix effects being dynamic or static, by whether marketing effects
are competitive due to a relative or not relative specification (static), and
by whether the marketing variable affects the coefficient of external
influence, the coefficient of internal influence or both.
Analysis of Retained Models
Based on the tests described above, this analysis addresses the
following issues:
(1) the role of brand-specific versus category level diffusion acrosscompetitive entrants,
(2) the role of marketing mix elements on brand-level diffusionprocesses,
(3) the existence of static versus dynamic elastic responses over thebrand life cycle,
(4) the response of brand trials to absolute versus relative measuresof marketing mix activity, and
(5) the appropriate use of separable versus non-separable functionalforms incorporating brand-level marketing mix elements.
-24-

More generally, this research empirically tests whether a common
functional form, or hypothesized diffusion process can be imposed on or
characterizes all new brands entering into a new category, as certain
normative analyses assume. The answer to this general question is "no". Each
brand diffusion's is best represented by a different model specification.
This is particularly critical because it creates asymmetries across brand
trials which imply different recommendations for optimal marketing activities
of each brand, rather than the same strategy for all brands.
Concerning the first issue of whether diffusion is brand or product
class specific, the first brand to enter the market is characterized by its
own brand-specific diffusion, which could correspond to the fact that, for the
period during which the brand is in a monopoly situation, the product class is
made up of that single brand. The finding that brand specific diffusion
represents best the diffusion of the first brand suggests a strong brand
identification, which insulates that brand from competitors. This finding is
particularly significant given that, in the product class studied, the second
brand entered the market only three weeks after the first entrant. This is
reinforced by the fact that absolute marketing activities (as opposed to
relative with respect to competitors) impact its diffusion and that
sensitivity to marketing mix is not affected by the number of competitors.
Therefore, the first brand seems to diffuse in the market independently of
competitive developments. This quasi-monopolistic behavior might be seen as a
pioneer's advantage.
Except for the sixth brand, the first generic-type brand which also
develops according to its own diffusion, the early followers are characterized
by a product class-wide diffusion. Therefore, the followers do not seem to be
-25-

able to develop their own market niche. This could be the reason for the
difficulty of late entrants, such as brands 7, 8, and 9, and possibly brand 5,
to be successful in this market. The sixth brand, Suave, achieves a brand
specific diffusion, possibly benefiting from an established brand name since
this brand is marketed under an umbrella brand strategy. Although the brand
was undifferentiated apart from its name, it was introduced following a
corporate policy of very low prices with no advertising (which is not needed
because the brand relies on the overall umbrella brand awareness). In fact,
as can be seen from Figure 3 (and which was confirmed in a conversation with
the brand manager), brand 6 was originally priced too low for generating
satisfactory profits and the price was subsequently raised progressively.
This explains the positive price sensitivity parameter of that brand.
With respect to the second and third issue, for all of the brands
investigated, the diffusion process is not independent of marketing activities
which clearly play a significant role. Sensitivity to marketing mix variables
is dynamic, i.e., varying when new competitors enter the market, except for
brands 1 and 6. Regarding price, however, the only brand sensitive to that
factor is the second entrant. This brand's trials become more sensitive to
price as more brands entered into competition. Apart from brand 2, price
coefficients are static as the parameters for the impact of the number of
competitors are not significant. With respect to price, therefore, our
analysis supports the findings of Tellis (1988), and Nagel (1987), among
others, that if price sensitivities are dynamic, they would tend to increase
over the product life cycle as brand competition increases.
The dynamic nature of the marketing effects come mostly, however, from
advertising. Advertising sensitivities can decline, increase, or be
—26—

insignificant, depending on the brand, and, in particular, the number of
competitors. The pioneer's advertising response parameters are not
statistically different from zero, while the second and third entrant's
sensitivities to advertising increased as the category matured. This
increasing sensitivity may reflect the fact that brand—level advertising is
only effective after a category's general awareness is high (created by the
pioneer, L'Oreal). This free—rider benefit may be short—lived, however, as
the next entrants eventually have declining elasticities as the number of
competitors increase. The dynamics found for these entrants may explain why
later entrants chose not to advertise. This finding, therefore, generally
does not support the idea that advertising elasticities decline over the
product life cycle, or are constant across competitive entries into a new
category. Clearly the optimal timing (pioneer versus follower) and the level
of marketing activity will be affected by such dynamics if they are considered
prior to launch.
Regarding the fourth issue of whether marketing variables are specific
(absolute) or relative to competitors's actions (relative price and share of
voice), the results indicate that this depends on the brand. Likewise,
regarding the fifth issue, this analysis provides little support (only
possibly for brand 3) of the separable form. A number of brands' external
influence coefficient is affected by marketing variables, although the
analysis suggests that in some instances, marketing variables affect the
coefficient of internal influence (brands 3 and 4). As Simon and Sebastian
(1987) indicate, these differences across brands may be due to the different
nature of the content of advertising for each brand. This is a product
category where it is very feasible to emphasize the social benefits of using
—27—

the product. This could have an influence on the impact of consumer response
to marketing activities and/or interpersonal communications (either in its
visual or verbal form). The lack of clear support for the separable
functional form is consistent with empirical studies of consumer durables at
the category level (Kamakura and Balasubramanian 1988, Jain and Rao 1989).
SUMMARY
In this study, we empirically estimated and compared a number of brand-
level model specifications typically found in the marketing literature which
derives optimal marketing mix strategies over the brand's life cycle. This
empirical investigation is limited to a single product category, which
prevents general substantive inferences about the diffusion of innovations
facing competition in general. The product category analyzed is a frequently
purchased item. Consequently, the trial dynamics, in particular in terms of
word-of-mouth, may be different for durable goods. For example, it is
possible that the degree of dissatisfaction and consequently switching to a
different brand leads to a stronger interpersonal influence than for durable
goods.
The results of this study nevertheless point out a number of conclusions
critical for modeling the diffusion of competing brands and with important
managerial implications. First, the results indicate that each brand can
follow a brand specific or a product class diffusion process and that
marketing's impact varies for each brand's trials: sometimes it is a dynamic
competitive force or, in other cases, the brand is strong enough to stand on
its own as a quasi-monopoly.
Marketing mix variables are also shown to be critical in the diffusion
of brands, and their impact is not identical across brands. The sensitivity
-28-

of trials to price increases over the product life cycle or is constant, while
advertising sensitivity appears to be insignificant, increase or decrease over
the product life cycle, depending on the order of entry.
Similar to findings for consumer durables, the separable functional form
does not seem to be supported, and, even though more tractable mathematically
for optimization purposes, would not be relevant for the brands analyzed in
this paper. This is particularly critical because a functional form must be
adopted for the optimization of the non—separable forms; only one separable
functional form fits the data in this study well.
Generally, this study illustrates that asymmetries in the diffusion
process exists across brands. This implies that optimal marketing mix
strategies should recognize the various cases which derive from the various
brand diffusion models. For example, while the first brand has a brand
specific diffusion, the second entrant could follow a product class diffusion.
These asymmetries should lead to different optimal strategies over time for
each brand.
—29—

FOOTNOTES
1. A number of non-symmetric growth curves have also been proposed and fitted,e.g., Sharif and Kabir (1976), Jeuland (1981), Easingwood, Mahajan and Muller(1983), or Von Bertalanffy (1957). For a complete review, see Mahajan, Mullerand Bass (1990).
2. The external influence model of Fourt and Woodlock (1960) and the internalinfluence model of Mansfield (1961) are not discussed further as conceptuallythey correspond to special cases of the mixed influence model of Bass (1969).Asymmetric growth curves in which the parameters' "behavioral" interpretationhas not been assessed are not discussed in this paper.
3. Although in theory each brand could have a different impact on thediffusion of their competitors, for practical purposes due to estimation whichwould become unfeasible, all competitors can be assumed to have an homogeneousimpact on the diffusion of brand i.
4. It should be noted that a third explanation comes from the saturation levelbeing achieved in the market which reduces indirectly the impact thatadvertising can possibly have. This phenomenon is implicitly represented bythe saturation of the market in the diffusion model specification.
5. Though similar in spirit to the response function above, market share modelspecifications such as the multiplicative competitive interaction model(Cooper and Nakanishi 1988) are not considered here due to the categorydynamics studied (i.e., new entrants' trials in a new category).
6. The separable marketing mix response function can be inter'reted in thismanner, with the restriction of equal effects of marketing variables on boththe diffusion model's external and internal influence coefficients.
7. Although Simon and Sebastian (1987) consider the monopolistic case for theanalysis of competitive brands, we consider a similar model where thepotential market is either brand specific or general to the category.
8. When there is no trial recorded during a period, price for the period isset equal to the average price for the prior period when purchases occurred.
9. Advertising data was (collected on a calendar basis) disaggregated to adaily basis assuming a uniform daily distribution and re-aggregated tocorrespond to the IRI four-week periods. A value of one was used for periodswithout advertising.
10. Because this analysis investigates an inexpensive frequently purchasedproduct, it does not seem necessary to formulate M i as a function of price, asin Kalish (1983); furthermore, Kamakura and Blasubramanian (1988) and Jainand Rao (1989) find that price affects the coefficients of internal andexternal influence, rather than the market potential for high and low pricedconsumer durables.
-30-

11. Although alternatives such as estimating the Bass model at the categorylevel are feasible, our approach recognizes that the product categorypotential changes when new brands are introduced. This is especially relevantin the case of first purchases of frequently purchased items when anindividual who is in the potential market of one brand may also be in thepotential market for a competitive brand.
—31--
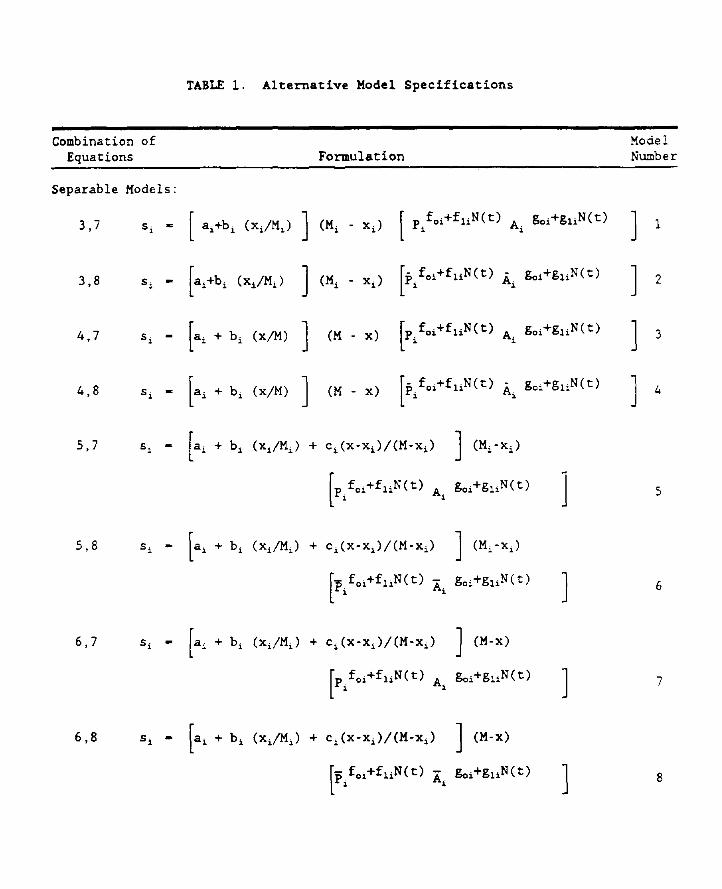
TABLE 1. Alternative Model Specifications
Combination of
ModelEquations Formulation
Number
Separable Models:
si I ai+b i (xi/M3 (Mi - x i ) [
si [ai+bi (xi/Mi )
+ bi (x/M)
(Mi -
(M
xi )
- x)
[15ifoi+fliN(t) Al goi+gliN(t)
.f °I+f 11N(t) goi+gliN(t)
si ai + (x/M) (M - x)[i, i foi+f, iN(t) go,g„N(t)
5,7 [ai + bi (xi /M;) + c i (x-xi )/(M-xi ) ] (M;-x;)
pi fei+fliN(t) Ai goi+gliN(t)
[
5,8 (xi/M,.) + c i (x-xi )/(M-x i ) (Mi-x)
[
pi foi+f1111(t) gei+gig(t)
6,7 [ai + (xi/140 + cl(x-x,)/(M-xi) (M-x)
[p,foi+fliN(t) A, g014-gliN(t) I
6,8 si [ai + b i (xjMi ) + c i (x-xi )/(M-x1 ) (M-x)
{f foi+fliN(t) 71 goi+gaiN(t)1
3,7
3,8
4,7
4,8
1
2
3
4
5
6
7
8
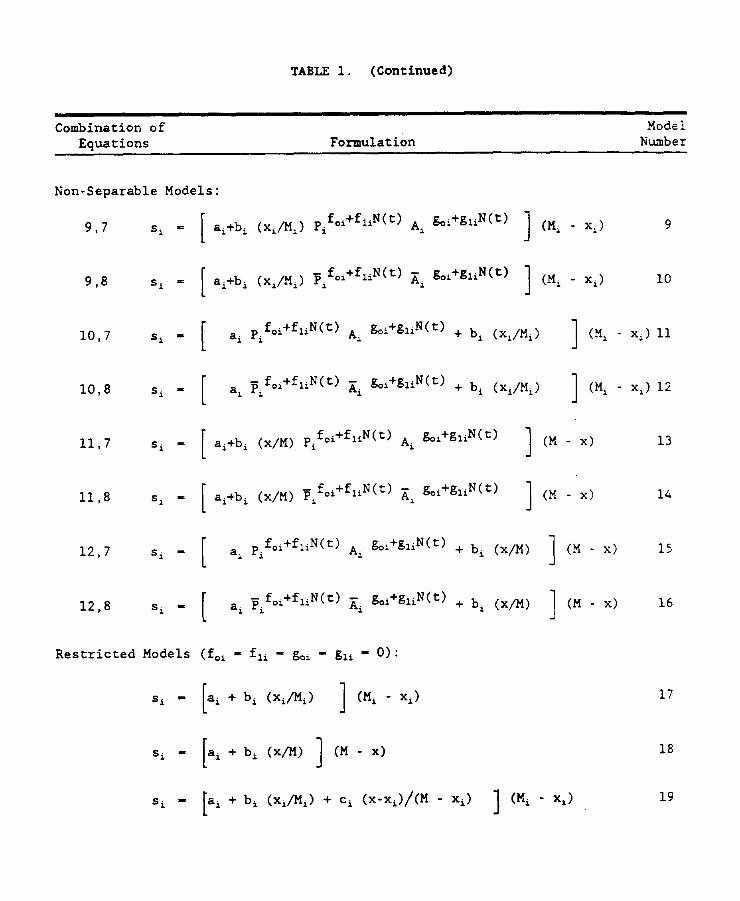
TABLE 1. (Continued)
Combination ofEquations Formulation
ModelNumber
Non-Separable Models:
9,7 si ai+bi(xi /Mi ) Pif0ffflill(t) Ai g° i+glill(t) ] (Mi- xi ) 9
9,8 si a +bi (xi/Mi ) f,foi+fliN(t) lc goi+gliN(t) ] (Mi - x i ) 10
10,7 si – foi+f liN(t) iti, goi+gliN(t) + s,] (Mi -
ai ri+ o (xi/Mi ) xi) 11
10,8 si fi f.i+f/iN(t) -2,1, goi+gliN(t) + biai(xi/Mi)
1 (Mi -xi) 12
11,7 si pifeffflili ( t ) Ai Boi-i-glili(t)]
ai+bi (x/M) j (M - x) 13
11,8 si y,fei+fliN(t) 7i-, gei+gliN(t) 1ai+b i (x/M) j (M - x) 14
12,7 si a, pi foi+fiiii(t) goi+glill(t) + b1(x/1.1.Ai) ] (M - x) 15
12,8 sossi – +fiiN(t) – goffgliN(t) + b i (xai Pi f° i Ai (x/M) I (M - x) 16
Restricted Models ( foi — fli = goi = gli - 0):
s i[ai + bi(xi/Mi ) I (Mi- xi) 17
s i [ai + bi (x/M) (M - x) 18
s i[ai + bi (xi/Mi ) + ci (x-x i )/(M - xi)3
(Mi - xi ) 19

TABLE 1. (Continued)
Combination of ModelEquations Formulation Number
Restricted Models (continued):
[a i + b i (x i/M,) + c i (x-xi )/(M - xi ) (M - x)
20
Where
s, – first purchases of brand i at time t,
a, external influence coefficient of brand i,
b i – internal influence coefficient of brand i,
c, – competitive internal influence coefficient of brand i,
M, potential number of adopters of brand i,
P i – price of brand i at time t,
13 , price of brand i relative to the average price of
competition at time t,
A, – advertising expenditure for brand i at time t,
Ai - advertising share of brand i relative to thecompetition at time t,
fol intercept of price elasticity of demand for brand i,
f11 – coefficient of price elasticity dynamics for brand i,
N(t) – number of products in the product category at time t,
gol – intercept of the elasticity of advertising for brand i
gil – coefficient of advertising elasticity dynamics for
brand i.

TABLE 2. Fit Statistics of Estimated Models
Brand1 2 3 4 6
Model RSS r RSS r RSS r RSS r RSS r
1 1524.95 .69 97.48 .89 135.66 .71 148.53 .82 2427.00 .69
1S 1714.18 .65 127.93 .85 161.63 .63 219.31 .71 2431.35 .69
2 1929.69 .57 149.02 .82 113.76 .77 219.94 .71 1112.13 .88
2S 1960.75 .57 153.47 .81 150.57 .71 237.31 .68 1922.69 .76
3 2221.02 .64 112.16 .88 130.00 .73 134.00 .83 2282.66 .71
3S 2248.85 .63 161.03 .83 156.69 .64 208.64 .73 2404.18 .69
4 2566.21 .56 185.88 .79 106.67 .79 193.56 .75 1395.18 .83
4S 2643.05 .55 186.53 .78 151.42 .65 232.24 .69 2070.92 .74
9 1642.68 .66 106.42 .87 117.34 .74 143.54 .82 1328.75 .88
9S 1941.58 .32 134.07 .84 215.43 .43 253.25 .65 2052.67 .74
10 1891.61 .58 153.57 .81 95.37 .80 214.39 .72 2155.86 .78
10S 1977.31 .57 159.20 .80 235.12 .33 232.61 .69 2426.46 .69
11 1208.90 .76 88.70 .90 142.83 .68 163.46 .80 2415.51 .70
11S 1430.86 .71 159.62 .64 180.77 .56 178.39 .77 2510.92 .67
12 1952.85 .57 162.34 .80 124.75 .75 181.80 .77 1159.31 .87
12S 2248.97 .47 200.76 .74 162.89 .62 217.23 .72 1301.42 .85
13 2215.63 .65 110.02 .87 130.01 .73 120.40 .85 2301.30 .71
13S 2581.03 .54 174.46 .82 167.73 .60 164.10 .79 2317.43 .71
14 2643.31 .55 158.46 .80 90.62 .82 147.31 .81 2417.34 .69
14S 2792.41 .54 171.11 .79 112.04 .76 153.89 .81 2440.74 .69
15 1869.48 .69 78.80 .91 145.92 .67 172.01 .78 2374.07 .70
15S 2199.71 .64 173.24 .81 157.06 .63 208.18 .73 2374.34 .70
16 2567.44 .55 190.95 .78 115.61 .78 222.44 .70 2114.53 .74
16S 2655.11 .55 198.48 .76 151.07 .66 228.24 .69 2243.87 .72
17 2249.62 .46 283.20 .60 240.50 .30 334.42 .49 2515.35 .67
18 3153.12 .44 308.51 .60 201.82 .48 328.63 .54 2440.82 .69
19 2229.96 .48 279.28 .61 218.93 .41 298.76 .59 2387.06 .71
20 2647.04 .48 259.98 .64 200.94 .48 319.91 .63 2390.32 .70
N 26 24 26 26 19

TABLE 3. Tests of Nested Models°
Dynamic vs. Static vs. No Marketing Mix
BRAND 1:
Brand Specific Diffusion
( 1 vs. 1S * 1S ( 3.04)) vs. 17 * 1S ( 7.07)**( 2 vs. 2S -. 2S ( 0.42)) vs. 17 • 17 ( 3.57)( 9 vs. 9S * 9S ( 4.35)) vs. 17 * 17 ( 3.83)(10 vs. 10S -. 10S ( 1.15)) vs. 17 - 17 ( 3.35)(11 vs. 11S * 11S ( 4.38)) vs. 17 * 11S (11.76)**(12 vs. 12S - 12S ( 3.67)) vs. 17 - 17 ( 0.01)
- Retained non-nested models: 1S, 11S
Product Class Diffusion:
( 3 vs. 3S * 3S ( 0.32)) vs. 18 * 3S ( 8.79)**( 4 vs. 4S - 4S ( 0.77)) vs. 18 * 18 ( 4.59)(13 vs. 13S * 13S ( 3.97)) vs. 18 * 18 ( 5.21)(14 vs. 14S - 14S ( 1.43)) vs. 18 - 18 ( 3.16)(15 vs. 15S * 15S ( 4.23)) vs. 18 •. 15S ( 9.36)*(16 vs. 16S * 16S ( 0.87)) vs. 18 * 18 ( 4.47)
* Retained non-nested models: 3S, 15S
BRAND 2:
Brand Specific Diffusion
( 1 vs. 1S * 1 ( 6.52)**) vs. 17 * 1 (25.60)*( 2 vs. 2S * 2S ( 0.71)) vs. 17 * 2S (14.70)*( 9 vs. 9S -. 9S ( 5.54)) vs. 17 * 9S (17.95)*(10 vs. 10S * 10S ( 0.86)) vs. 17 - 10S (13.82)*(11 vs. 11S -. 11 (14.10)*) vs. 17 * 11 (27.86)*(12 vs. 12S - 12S ( 5.10)) vs. 17 - 12S ( 8.26)**
-. Retained non-nested models: 1, 2S, 9S, 10S, 11, 12S
Product Class Diffusion:
( 3 vs. 3S - 3 ( 8.68)**) vs. 18 * 3 (24.28)*( 4 vs. 4S * 4S ( 0.08)) vs. 18 * 4S (12.08)*(13 vs. 13S * 13 (11.06)*) vs. 18 * 13 (24.75)*(14 vs. 14S -. 14S ( 1.84)) vs. 18 -. 14S (14.15)*(15 vs. 15S - 15 (18.91)**) vs. 18 * 15 (32.76)*(16 vs. 16S - 16S ( 0.93)) vs. 18 -. 16S (10.59)*
- Retained non-nested models: 3, 4S, 13, 14S, 15, 16S
Chi squared statistics are in parentheses* Significant at .01 level** Significant at .05 level

TABLE 3. Tests of Nested Models* (Continued)
Dynamic vs. Static vs. No Marketing Mix
BRAND 3:
Brand Specific Diffusion
( 1 vs. 1S * 1S ( 4.55)) vs. 17 * 1S (10.33)*( 2 vs. 2S - 2 ( 7.29)**} vs. 17 * 2 (19.46)*( 9 vs. 9S * 9 (15.80)*) vs. 17 * 9 (18.66)*(10 vs. 10S - 10 (23.46)*) vs. 17 - 10 (24.05)*(11 vs. 11S * 11 ( 6.12)**) vs. 17 • 11 (13.55)*(12 vs. 12S -. 12 ( 6.94)**) vs. 17 * 12 (17.07)*
-. Retained non-nested models: 1S, 2, 9, 10, 11, 12
Product Class Diffusion:
( 3 vs. 3S * 3S ( 4.86)) vs. 18 * 3S ( 6.58)**( 4 vs. 4S • 4 ( 9.11)**) vs. 18 - 4 (16.58)*(13 vs. 13S * 13 ( 6.62)** vs. 18 - 13 (11.43)**(14 vs. 14S -. 14S ( 5.52)) vs. 18 * 14S (15.30)*(15 vs. 15S * 15S ( 1.91)) vs. 18 * 15S ( 6.52)**(16 vs. 16S * 16 ( 6.96)) vs. 18 * 16 (14.49)*
-. Retained non-nested models: 3S, 4, 13, 14S, 15S, 16
BRAND 4:
Brand Specific Diffusion
( 1 vs. 1S • 1 (10.13)*) vs. 17 - 1 (21.10)*( 2 vs. 2S • 2S ( 1.98)) vs. 17 * 2S ( 8.92)**( 9 vs. 9S * 9 (14.76)*) vs. 17 * 9 (21.99)*(10 vs. 10S • 10S ( 2.12)) vs. 17 -. 10S ( 9.44)*(11 vs. 11S * 11S ( 2.27)) vs. 17 * lls (16.34)*(12 vs. 12S * 12S ( 4.63)) vs. 17 * 12S (11.22)*
* Retained non-nested models: 1, 2S, 9, 10S, 11S, 12S
Product Class Diffusion:
( 3 vs. 3S • 3 (11.51)*) vs. 18 * 3 (23.32)*( 4 vs. 4S - 4S ( 4.74)) vs. 18 * 4S ( 9.03)**(13 vs. 13S - 13 ( 8.05)**) vs. 18 -. 13 (26.11)*(14 vs. 14S - 14S ( 1.14)) vs. 18 -. 14S (19.73)*(15 vs. 15S * 15S ( 4.96)) vs. 18 - 15S (11.87)*(16 vs. 16S - 16S ( 0.67)) vs. 18 - 16S ( 9.48)*
* Retained non-nested models: 3, 4S, 13, 14S, 15S, 16S

TABLE 3. Tests of Nested Models' (Continued)
Dynamic vs. Static vs. No Marketing Mix
BRAND 6:
Brand Specific Diffusion
( 1 vs. 1S * 1S ( 0.03)) vs.( 2 vs. 2S * 2 (10.40)*) vs.( 9 vs. 9S * 9 ( 8.26)*) vs.(10 vs. 10S * 10S ( 2.25)) vs.(11 vs. 11S * 11S ( 0.74)) vs.(12 vs. 12S * 12S ( 2.20)) vs.
* Retained non-nested models:
Product Class Diffusion:
( 3 vs. 3S * 3S ( 0.99)) vs.( 4 vs. 4S -0 4 ( 7.50)*) vs.(13 vs. 13S -0 13S ( 0.13)) vs.(14 vs. 14S * 14S ( 0.18)) vs.(15 vs. 15S * 15S ( 0.01)) vs.(16 vs. 16S * 16S ( 1.13)) vs.
• Retained non-nested models:
1717171717172,
1818181818184
9,
* 17* 2-0 9-. 17* 17-0 12S12S
-. 18* 4* 18* 18-0 18* 18
( 0.65)(15.51)*(12.13)*( 0.68)( 0.03)(12.52)*
( 0.29)(10.63)*( 0.99)( 0.01)( 0.52)( 1.60)

TABLE 4: Tests of Non-Nested Models
BRAND 1:
Brand-Specific Diffusion Product-Class Differentiation
Models: Alt. l s 11S Models: Alt.
3S 15SNul
Nul
1S -- -4.72 3S -9.02
11S 1.65 -- 15S
3.45
-. 11S vs. 15S
Alt.11S 15S
Nul
11S -0.03
15S -2.14 -
Retained model: 11S
BRAND 2:
Brand-Specific Diffusion Product-Class Differentiation
Models:
Nu]Alt.
1 2S 9S 10S 11 12SModels: Alt
Nul 3 45 13S 14S 15 16S
1 - -2.83 - 0.82 -1.96 -1.66 -3.44 3 - -1.46 -1.38 -1.90 -6354.1 -2.40
2S - 4.20 - - 3.07 -0.49 -4.90 033 4S -4.75 - -6.45 -1.98 - 6.54 0.93
9S -12.58 -1.93 - -1.23 -5.03 -3.30 13S -338 -3.09 - -2.14 - 2.88 -3.15
10S - 330 -0.99 - 2.74 - -4.77 -1.07 14S -4.47 -1.90 -3A4 - -10.97 -1.58
11 0.82 -1.83 1.12 -0.74 - -333 15 3.34 -3.37 -038 -1.44 - -4.43
I2S -11.77 -3.86 -18.89 -5.42 -8.23 - I6S -5.63 -2.66 -8.90 -2.47 -6.84
-• 11 vs. 15
Models:Alt.
Nul11 15
11 -5.06
15 -0.72 -
-4 Retained model: 15
Models:
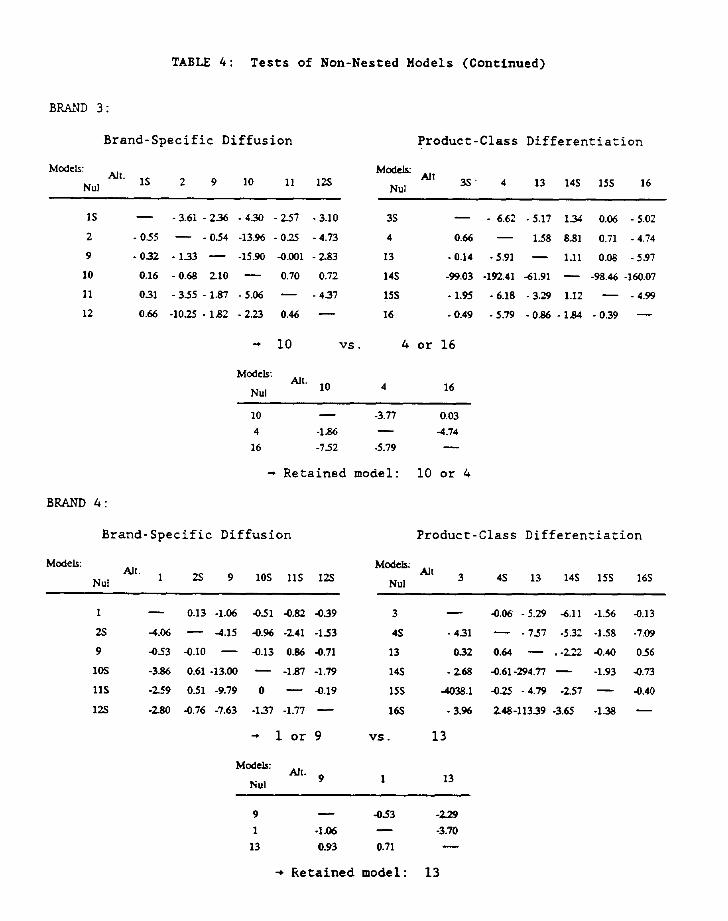
TABLE 4: Tests of Non-Nested Models (Continued)
BRAND 3:
Brand-Specific Diffusion Product-Class Differentiation
Models:IS 2 9 10 11 12SNul
Models:Alt
Nul3S 4 13 14S 15S 16
IS - - 3.61 - 2.36 -430 - 237 - 3.10 3S - - 6.62 - 5.17 1.34 0.06 - 5.02
2 - 035 - - 034 -13.96 - 0.25 - 4.73 4 0.66 - 138 8.81 0.71 - 4.74
9 - 0.32 - 133 - -15.90 -0.001 - 2.83 13 - 0.14 - 5.91 - 1.11 0.08 - 5.97
10 0.16 - 0.68 2.10 - 0.70 0.72 14S -99.03 -192.41 -61.91 - -98.46 -160.07
11 0.31 - 335 - 1.87 - 5.06 - - 437 15S - 1.95 - 6.18 - 3.29 1.12 - - 4.99
12 0.66 -10.25 - 1.82 - 2.23 0.46 - 16 - 0.49 - 5.79 - 0.86 - 1.84 - 0.39 -
• 10 vs. 4 or 16
Models:Alt. 10 4 16Nul
10 - -3.77 0.034 -1.86 - -4.74
16 -752 .5a9 -
* Retained model: 10 or 4
BRAND 4:
Brand-Specific Diffusion Product-Class Differentiation
Models:Alt.
1 2S 9 10S 11S 12SNul
Models:AU
Nul3 4S 13 14S 15S 16S
1 - 0.13 -1.06 .0.51 -0.82 -0.39 3 - -0.06 - 5.29 -6.11 -136 -0.13
2S -4.06 - -4.15 -0.96 -2.41 -1.53 4S - 4.31 - - 7.57 -532 -1.58 27.09
9 -033 -0.10 - -0.13 0.86 -0.71 13 032 0.64 - . -2.22 -0.40 0.56
IOS -3.86 0.61 -13.00 - -1.87 -1.79 14S - 2.68 -0.61-294.77 - -1.93 -0.73
11S -2.59 0.51 -9.79 0 - -0.19 15S -4038.1 -0.25 - 4.79 -2.57 - -0.40
12S -2.80 -0.76 -7.63 -137 -1.77 - 16S - 3.96 2.48-11339 -3.65 -1.38 -
* 1 or 9 vs. 13
Models:Alt.
Nul9 1 13
9 -- -033 -2.29
1 -1.06 - -3.70
13 0.93 0.71 -
-. Retained model: 13

TABLE 4: Tests of Non-Nested Models (Continued)
BRAND 6:
Brand-Specific Diffusion Product-Class Differentiation
Models:Alt.
Nul2 9 12S
2 -- - 0.79 -2.27 Model 4
9 -3.17 -- -5.11
12S -1.93 -12.98 --
-. 12S
Models:Alt.
Nul
vs. 4
12S 4
12S -- -0.62
4 -2.60 __
-. Retained model: 12S

BRAND 1:
TABLE 5. Estimated Parameters for Retained Xodels*
S i = 0.8424Pi Ai • 0.0993[
-4.36: 0.0346 x,--( ] (M - x,). r :.71
(0.254)(0.0269) (0.5632) (0.0001)
BRAND 2:
Si = 0.018Pi Ai - 0.0132 I[-0.4776 -0.0622N(t) -0.071 + 0.0104N(t)
MI (M-X) r = 0.91
(0.0813)(0.3162) (0.075) (0.234) (0.0008) (0.0099)
BRAND 3:
X - 4.08 + 0.0735N(t) - 0.0:35 4. 0.0094N(t)S i = [ 0.0017 • 0.0605 [ - 1 f X (M-X) r = C.79
M
(0.5204) (0.1382) (0.0526) (0.6476) (0.8219) (0.023)
S. = 0.0169 • 0.0822[
..I. 11 -12.84 • 0.3789N(t) - 0.4157 • 0.0295N(t)
A ] (m,-xi) r = 0.80 i)1 i
(0.0014) (0.6972) (0.2326) (0.5771) (0.335) (0.1742)
Brand 4:
X -6.205 4. 0.0868N(t) 0.3973 - 0.0:76N(t)S. 0.0019 • 0.3375• P. Ai
1 (M-X) r = 0.85M
(0.0513) (0.5045) (0.02) (0.278) (0.0287) (0.0196)
Brand 6:
8.3E5 xS. 0.4723 P . C.1597 (M - x) r = 0.85
(C.0305) (0.0019) (0.0001)
SMEMAFY OF ESTImA7E11 MODE:. SPESIFICA71•!:
Brand Mode:
Brand (B)vs.
Product (P)Diffusion
Static (S)vs.
Dynamic (D)MarketingEffects
Absolute (A)vs.
Relative (R)MarketingImpacts
External (E)vs.
Internal (I)vs.
Both (E)ConfluenceCoe"•-'ent
:15 E S A E
2 15 P D A E
4/10 P/B D R B/I
4 13 P 0 A I
6 12S B S P E
•Numbers in parenthesis indicate the significance level

(mu liple)Adopt Brand i Adopt Brand j
(X)
Non-Adopters(X) (Xi)
Figure 1. Brand-Level Adoption Influences(2 Brand Case)
Note: X. signifies influence associated with adopters of brand i.
signifies influence associated with adopters of brand j.X1X signifies influence associated with adoptions of all brands.
Multiple signifies the adoption of more than one brand within the category for
for a given household; otherwise, influences are based on single brand adoptions
20
10
0
Brand 2
10
15
Month
Brand 6706050403020100
Month
0 Month
Brand 3
Month
Brand 4
20
15
10 Month
5 Brand 981
0 MonthBrand 55
4
3
2Month
1
Figure 2. Trial Curves by Brand (Number of FirstPurchases on Vertical Axes Per Month)*
Month
*The first observation corresponds to the brand introduction monthFitted Data According to Bass Model
— Actual Data- Fitted Data According to Retained Model
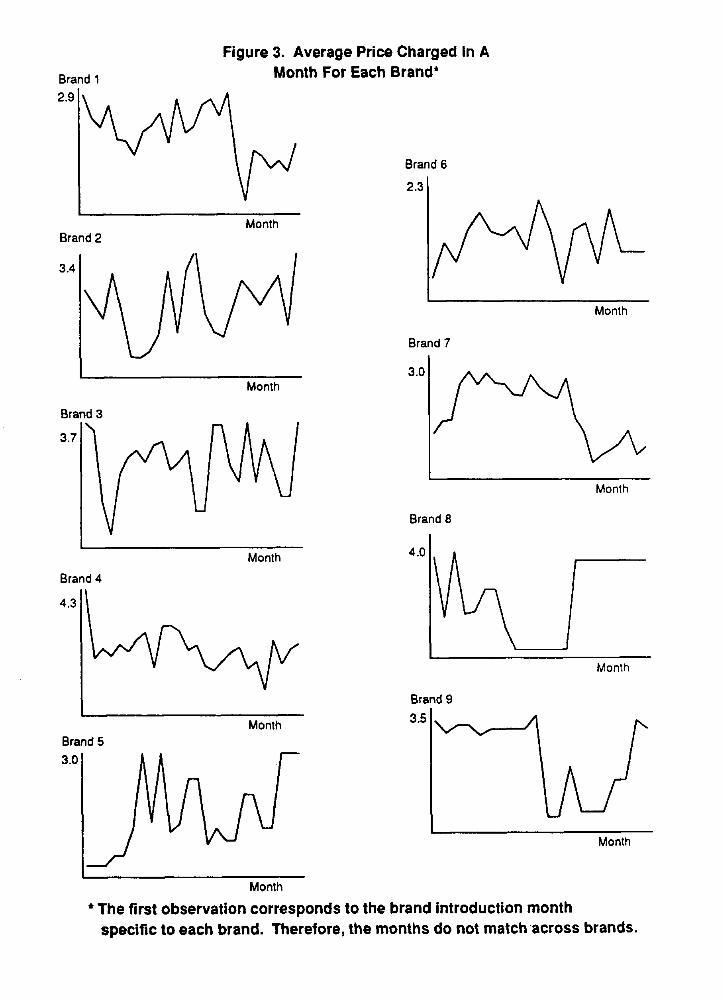
Figure 3. Average Price Charged In AMonth For Each Brand*
3.0
MonthBrand 2
Month
Brand 3
Month
Brand 4
Month
3.4
3.7
4.3
Month
Brand 7
Month
Brand 8
Month
Month
4.0
Month
*The first observation corresponds to the brand introduction monthspecific to each brand. Therefore, the months do not match across brands.

MonthBrand 3
1725
Brand 1
Figure 4. Advertising Expenditure CurvesBy Months For Each Brand*
3750
MonthBrand 2
320 1
..„
MonthBrand 4
250 I
MonthBrand 5
A
Month
Brand 912
Month
110
Month• The first observation corresponds to the brand introduction monthspecific to each brand. Therefore, the months do not match across brands.Advertising Expenditures are in thousand dollars. Brands 6 and 8 didnot advertise.

REFERENCES
Arora, Rahindas (1979), "How Promotion Elasticities Change," Journal ofAdvertising Research, 19 (June), 57-62.
Bass, Frank M. (1969), "A New Product Growth Model for Consumer Durables,"Management Science, 15, 5, 215-227.
(1980), "The Relationship Between Diffusion Rates, Experience Curves,and Demand Elasticities for Consumer Durable Technological Innovations,"Journal of Business, 53, 3 (July), Part 2, 51-67.
Bettman, James R. (1970), An Information Processing Theory of Consumer Choice,Reading, MA: Addison—Wesley.
Brodie, Roderick and Cornelis A. de Kluyver (1984), "A Comparison of MarketModels and Estimation Procedures, "Journal of Marketing Research, 21, 2,194-201.
Chow, G. (1967), "Technological Change and the Demand for Computers," 57:1117-3.
Cooper, Lee G. and Masao Nakanishi (1988), Market Share Anal ysis: EvaluatingCompetitive Marketing Effectiveness, Boston, MA: Kluwer AcademicPublishers.
Cox, D. R. (1961), "Test of Separate Families of Hypothesis, "Proceedings ofthe fourth Berkeley Sym posium on Mathematical Statistics andProbability, Vol. 1, Berkeley, CA: University of California Press.
(1962), "Further Results on Tests of Separate Families of Hypothesis,"Journal of the Royal Statistical Society, Series B, 24, 406-424.
Dean, Joel (1950), "Pricing Policies for New Products," 26,45-53.
Dockner, Engelbert and Steffen Jorgensen (1988), "Optimal Pricing Strategiesfor New Products in Dynamic Oligopolies," Marketing Science, 7 (Fall),315-334.
Dolan, Robert J. and Abel P. Jeuland (1981), "Experience Curves and DynamicDemand Models: Implications for Optimal Pricing Strategies," Journal ofMarketing, 45, 1 (Winter), 52-62.
Easingwood, Christopher, Vijay Mahajan and Eitan Muller (1983), "A Non—UniformInfluence Innovation Diffusion Model of New Product Acceptance,"Marketing Science, 2 (Summer), 273-296.
Eliashberg, Jehoshua and Abel P. Jeuland (1986), "The Impact of CompetitiveEntry in a Developing Market Upon Dynamic Pricing Strategies," MarketingScience, 5, 20-36.
Erickson, Gary M. (1985), "A Model of Advertising Competition," Journal ofMarketing Research, 22 (August), 297-304.
Fourt, Louis A. and Joseph W. Woodlock (1960), "Early Prediction of MarketSuccess for New Grocery Products," journal of Marketing, 25 (October),31-38.
Gatignon, Hubert and Thomas S. Robertson (1985), "A Propositional Inventoryfor New Diffusion Research," Journal of Consumer Research, 11 (March),849-867.
, Jehoshua Eliashberg and Thomas S. Robertson (1989), "ModelingMultinational Diffusion Patterns: An Efficient Methodology," MarketingScience, 8, 3, 231-247.
and Thomas S. Robertson (1986), "An Exchange Theory Model ofInterpersonal Communications," in Richard J. Lutz, ed., Advances inConsumer Research, 13, 629-632.
, Barton A. Weitz and Pradeep Bansal (1990), "Brand IntroductionStrategies and Competitive Environments," Journal of Marketing Research,forthcoming.
Horsky, Dan and Karl Mate (1988), "Dynamic Advertising Strategies of CompetingDurable Good Producers," Marketing Science, 7, 4 (Fall), 356-367.
and Leonard S. Simon (1983), "Advertising and the Diffusion of NewProducts," Marketing Science, 2, (Winter), 1-17.
Jain, Dipak C. and Ram C. Rao (1989), "Effect of Price on the Demand forDurables: Modeling, Estimation and Findings," Journal of Business andEconomic Statistics.
Jeuland, Abel P. (1981), "Parsimonious Models of Diffusion of Innovations,Part B: Incorporating the Variable of Price," Working Paper, Universityof Chicago, July.
Jones, J. Morgan and Christopher J. Ritz (1991), "Incorporating DistributionInto New Product Diffusion Models," International Journal of Research inMarketing, 8, 2, 91-112.
Judge, George G., W. E. Griffiths, R. Carter Hill, Helmet Lutkepohl andTsoung-Chao Lee (1985), The Theor y and Practice of Econometrics, NewYork, NY: John Wiley and Sons.
Kalish, Shlomo (1983), "Monopolist Pricing with Dynamic Demand and ProductionCost," Marketing Science, 2, (Spring), 135-159.
(1985), "A New Product Adoption Model with Price, Advertising andUncertainty," Management Science, 31, 12 (December), 1569-1585.
Kamakura, Wagner A. and Siva K. Balasubramanian (1988), "Long-term View of theDiffusion of Durables," International Journal of Research in Marketing,5, 1-13.

Kotler, Philip (1965), "Competitive Strategies for New Product Marketing Overthe Life Cycle," Management Science . , 12, B 104-B 119.
Lambin, Jean-Jacques (1970), "Advertising and Competitive Behavior: A CaseStudy," Applied Economics, 2, 231-251.
, (1976), Advertising. Competition and Market Conduct in Oligopoly Overtime, Amsterdam: Holland Publishing Company.
Lilien, Gary L., Ambar G. Rao and Shlomo Kalish (1981), "Bayesian Estimationand Control of Detailing Effort in a Repeat Purchase DiffusionEnvironment," 1anagement Science, 27 (May), 493-506.
and Eunsang Yoon, "An Exploratory Analysis of the Dynamic Behavior ofPrice Elasticity over the Product Life Cycle: An Empirical Analysis ofIndustrial Chemical Products," in Issues in Pricing, Timothy M. Devinneyed., Lexington Books, Lexington 1988, 261-287.
Liu, L., and Dominique Hanssens (1981), "A Bayesian Approach to Time-VaryingCross-Sectional Regression Models," Journal of Econometrics, 15, 341-56.
Leonard-Barton, Dorothy (1985), "Expert as Negative Opinion Leaders in theDiffusion of a Technological Innovation," Journal of Consumer Research,11, 4 914-926.
Mahajan, Vijay, Eitan Muller and Frank M. Bass (1990), "New Product DiffusionModels in Marketing: A Review and Directions for Research," Journal ofMarketing, 54, 1, 1-26.
and Robert A. Peterson (1978), "Innovation Diffusion in a DynamicPotential Adopter Population," Mana gement Science, 24 (15), 1569-1597.
, Robert A. Peterson, Arun K. Jain and Naresh Malhotra (1979), "A NewProduct Growth Model with a Dynamic Market Potential," Long RangePlanning, 12 (4), 62-69.
Mansfield, Edwin (1961), "Technological Change and the Rate of Imitation,"Econometrica, 29, 741-766.
Mickwitz, Costa (1959), Marketing and Competition, Helsingfors: CentralTrykerict.
Nagel, Thomas T. (1987), "The Strategy and Tactics of Pricing," EnglewoodCliffs, NJ: Prentice Hall.
Norton, John A. and Frank M. Bass (1987), "A Diffusion Theory Model ofAdoption and Substitution for Successive Generations of High TechnologyProducts," Management Science, 3 (September) 1063-1086.
Ozga, S. (1960), "Imperfect Markets Through Lack of Knowledge," Quarterlyjournal of Economics,

Parsons, Leonard J. (1975), "The Product Life Cycle and Time VaryingAdvertising Elasticities," Journal of Marketing Research 12, 3(November), 476-480.
Pesaran, M. H., and A. S. Deaton (1978), "Testing Nonrested NonlinearRegression Models," Econometrica, 46, 677-694.
Peterson, Robert A. and Vijay Mahajan (1978), "Multi-Product Growth Models,"in Jagdish Sheth, ed., Research in Marketing Vol. 1, Greenwich, CT: JAIPress, 201-231.
Rao, Ram C. and Frank M. Bass (1985), "Competition, Strategy, and PriceDynamics: A Theoretical and Empirical Investigation " Journal ofMarketing Research, 22 (August), 283-296.
Richins, Marsha L. (1983), "Negative Word-of-Mouth by Dissatisfied Consumers:A Pilot Study," Journal of Marketing, 47 (Winter) 68-78.
Robertson, Thomas S. (1971), Innovation Behavior and Communication New York:Holt, Rinehart and Winston.
, and Hubert Gatignon (1986), "Competitive Effects on TechnologyDiffusion," Journal of Marketing, 50, 3, 1-12.
Robinson, Bruce and Chet Lakhani (1975), "Dynamic Price Models for New-ProductPlaning," Management Science, 21, 10 (June), 1113-1122.
Rogers, Everett M. (1983), Diffusion of Innovations New York, NY: The FreePress.
Rust, Roland T. and David C. Schmittlein (1985), "A Bayesian Cross-ValidatedLikelihood Method for Comparing Alternative Specifications ofQuantitative Models," Marketing Science, 4, 1, 20-40.
Sharif, M. Nawaz and C. Kabir (1976), "A Generalized Model for ForecastingTechnological Substitution," Technological Forecasting and SocialChange, 8, 353-364.
Simon, Hermann (1979), "Dynamics of Price Elasticity and Brand Life Cycles: AnEmpirical Study," Journal of Marketing Research, 16 4 (November), 439-452.
and Karl-Heinz Sebastian (1987), "Diffusion and Advertising: TheGerman Telephone Campaign," Management Science, 33, 4 (April), 451-466.
Tellis, Gerard J. (1988), "The Price Elasticity of Selective Demand: A Meta-Analysis of Econometric Models of Sales," Journal of Marketing Research,25 (November), 331-41.
Teng, Jinn-Tsair and Gerald L. Thompson (1983), "Oligopoly Models for OptimalAdvertising When Production Costs Obey A Learning Curve," ManagementScience 29 9, 1067-1101.

Thompson, Gerald L. and Jinn—Tsair Teng (1984), "Optimal Pricing andAdvertising Policies for New Product Oligopoly Models," ManagementScience, 3, 2 (Spring), 148-168.
Tigert, Douglas and Behrooz Farivar (1981), "The Bass New Product GrowthModel: A Sensitivity Analysis for a High Technology Product," Journal ofMarketing, 45 (Fall), 61-90.
Von Bertalanffy, L. (1957), "Quantitative Laws in Metabolism and Growth,"Quarterly Review of Biology, 32, 217-231.

APPENDIXDescription of Tests for Comparing Non-Nested Models
Assume two non–linear models (Pesaran and Deaton 1978),
Model 1: y f (X,#) + e e N (0, (72I)
Model 2: y – g (W,w) + u u N (0, p2I)
In model 1, y is predicted by X and in model 2, y is predicted by W. The
number of parameters (or elements) of fi and w can be different. Let set first
model 1 as the null hypothesis (H0 ) and model 2 as the alternate hypothesisA
(H1 ). The maximum likelihood estimators of /9 and 02 are fi and (72 . Similarly,A A
the maximum likelihood estimators of w and p2 are w and p2 . The Cox test is
based on the test statistic C 1 – (Ln p2 – Ln p*2 ), where T is the number
of observations and p *2 is obtained as follows:
(1) Predict y using the maximum likelihood estimator of fi under
model 1, i.e., p:
y if (X,fi)A
(2) Regress y 1 on the W's
yi – g (W, w) + u1.
Minimizing the sum of squared residuals (least squares), this
leads to an estimate of (..),(..) 1 and mean squared residuals
1 fA0E11'
(3) Compute p*2 using
p*2 a2 (u 1 u1)
A
(4) Compute C 1 using
C I -I- (Ln p2 – Ln p*2)
2Compute the variance of C 1 using
V(C 1 ) (7 2/p*4 ) [14 01 ul]where
A A A
01 ` IT — Z ($) [Z(fi)' Z (fl)r 1 Z (P).
Z (fi) is the matrix of first order derivatives of model 1 evaluated atA
the maximum likelihood fi for each observation. C 1 is normally distributed
(5)

with variance V(C 1). If C 1 is significantly different from zero, model 1
(Ho) is rejected. If not, we fail to reject model 1.
Because this is not a symmetric test, we need to perform the parallel
test where model 2 becomes Ho and model 1 become H 1 . The computations are
similar except for switching the models:
Ho : (Model 2) y g (W, + u u - N(o,p2I)
H1 : (Model 1) y – f (X, fl) + e e - N(o,(72I)
The maximum likelihood estimates of w and As2 are w and /12
as before and similarly for Model 1 19 and 02 are maximum likelihood estimators
of # and a. The test now is based on the test statistic
C2 ■ 4 (Ln 02 Ln o'2)
The computation of C2 is analogous to the computation of C1.
Combining the two tests, the four cases shown in Figure A can occur. If
the test based on C 1 (where model 1 is the null hypothesis) fails to reject
model 1, and model 2 is rejected based on C 2 (where model 2 is the null
hypothesis), model 1 is selected. Similarly, model 2 is retained if model 1
is rejected when it is set as the null hypothesis and model 2 cannot be
rejected when it corresponds to the null hypothesis. For the other two
combinations, the test is inconclusive. In such cases, where no conclusion
can be reached, model selection must be based on other criteria. Parsimony
and/or plausibility of parameter estimates might be appropriate criteria in
such cases.
In summary, for a pair of models, four estimations are needed
1. Maximum likelihood estimators of model 1 parameters
2. Maximum likelihood estimators of model 2 parameters
3. Estimates of model 2 parameters predicting y1's
4. Estimates of model 1 parameters predicting y2's

Model 1Rejected
Test 1(based on C1)
Model 1Not Rejected
Test 2(based on C2)
Model 2
Model 2Rejected
Not Rejected
Inconclusive Retain Model 2
Retain Model 1 Inconclusive
FIGURE A. Possible Outcomes of Cox Test

88/12 Spyros MAKRIDAKIS "Business firms and managers in the 21st
century", February 1988
88/13 Manfred KETS DE VRIES "Alezithyrnia in organizational life: the
organization man revisited", February 1988.
88/14 Alain NOEL "The interpretation of strategies: a study of
the impact of CEOs on the
corporation", March 1988.
88/15 Anil DEOLALIKAR and "The production of and returns from
Lars-Hendrik ROLLER industrial innovation: an econometric
analysis for a developing country". December
1987.
88/16 Gabriel HAWAWINI "Market efficiency and equity pricing:
international evidence and implications for
global investing", March 1988.
88/17 Michael BURDA "Monopolistic competition, costs of
adjustment and the behavior of European
employment", September 1987.
88/18 Michael BURDA "Reflections on "Wait Unemployment"
Europe", November 1987, revised February
1988.
88/19 M.J. LAWRENCE and "Individual bias in judgements of
Spyros MAKRIDAKIS confidence", March 1988.
88/20 Jean DERMINE,
Damien NEVEN and
"Portfolio selection by mutual funds, an
equilibrium model", March 1988.
J.F. THISSE
88/21 James TEBOUL "De-industrialize service for quality", March
1988 (88/03 Revised).
88/22 Lars-Hendrik ROLLER "Proper Quadratic Functions with an
Application to AT&T", May 1987 (Revised
March 1988).
INSEAD WORKING PAPERS SERIES
1988
/01
Michael LAWRENCE and
"Factors affecting judgemental forecasts and
Spyros MAKRIDAKIS
confidence intervals", January 1988.
88/02
Spyros MAKRIDAKIS
"Predicting recessions and other turning
points", January 1988.
88/03
James TEBOUL
"De-industrialize service for quality", January
1988.
88/04
Susan SCHNEIDER
"National vs. corporate culture: implications
for human resource management", January
1988.
88/05
Charles WYPLOSZ
"The swinging dollar: is Europe out of
step?", January 1988.
88/06
Reinhard ANGELMAR
"Les conflits dans les cattails de
distribution", January 1988.
88/07
Ingemar DIERICKX
"Competitive advantage: a resource based
and Karel COOL perspective", January 1988.
88/08
Reinhard ANGELMAR
"Issues in the study of organizational
and Susan SCHNEIDER
cognition", February 1988.
88/09
Bernard SINCLAIR- "Price formation and product design through
DESGAGNE
bidding", February 1988.
88/10
Bernard SINCLAIR- "The robustness of some standard auction
DESGAGNE
game forms", February 1988.
88/11
Bernard SINCLAIR- "When stationary strategies are equilibrium
DESGAGNE
bidding strategy: The single-crossing
property", February 1988.

88/24
B. Espen ECKBO and "Information disclosure, means of payment,Herwig LANGOHR and takeover premia. Public and Private
tender offers in France", July 1985, Sixthrevision, April 1988.
88/25
Everette S. GARDNER
"The future of forecasting", April 1988.and Spyros MAKRIDAKIS
88/26
Sjur Didrik FLAM
"Semi-competitive Cournot equilibrium inand Georges ZACCOUR multistage oligopolies", April 1988.
88/27
Murugappa KRISHNAN
"Entry game with resalable capacity",Lars-Hendrik ROLLER April 1988.
Sumantra GHOSHAL andC. A. BARTLETT
Naresh K. MALHOTRA,Christian PINSON andArun K. JAIN
"The multinational corporation as a network:perspectives from interorganizationaltheory", May 1988.
"Consumer cognitive complexity and thedimensionality of multidimensional scalingconfigurations", May 1988.
88/28
88/29
88/30
Catherine C. ECKEL
"The financial fallout from Chernobyl: riskand Theo VERMAELEN perceptions and regulatory response", May
1988.
88/31
Sumantra GHOSHAL and
"Creation, adoption, and diffusion ofChristopher BARTLETT
innovations by subsidiaries of multinationalcorporations", June 1988.
88/32
Kura FERDOWS and
"International manufacturing: positioningDavid SACKRIDER plants for success", June 1988.
88/33
Mihkel M. TOMBAK
"The importance of flexibility inmanufacturing", June 1988.
88/34 Mihkel M. TOMBAK "Flexibility: an important dimension inmanufacturing", June 1988.
88/35 Mihkel M. TOMBAK "A strategic analysis of investment in flexiblemanufacturing systems", July 1988.
88/36 Vikas TIBREWALA and "A Predictive Test of the NBD Model thatBruce BUCHANAN Controls for Non-stationarity", June 1988.
88/37 Murugappa KRISHNAN "Regulating Price-Liability Competition ToLars-Hendrik ROLLER Improve Welfare", July 1988.
88/38 Manfred KETS DE VRIES "The Motivating Role of Envy : A ForgottenFactor in Management", April 88.
88/39 Manfred KETS DE VRIES "The Leader as Mirror : ClinicalReflections", July 1988.
88/40 Josef LAKONISHOK and "Anomalous price behavior aroundTheo VERMAELEN repurchase tender offers", August 1988.
88/41 Charles WYPLOSZ "Assymetry in the EMS: intentional orsystemic?", August 1988.
88/42 Paul EVANS "Organizational development in thetransnational enterprise", June 1988.
43 B. SINCLA1R-DESGAGNE "Group decision support systems implementBayesian rationality", September 1988.
88/44 Essam MAHMOUD and "The state of the art and future directionsSpyros MAKRIDAKIS in combining forecasts", September 1988.
88/45 Robert KORAJCZYK "An empirical investigation of internationaland Claude VIALLET asset pricing", November 1986, revised
August 1988.
88/46 Yves DOZ and "From intent to outcome: a processAmy SHUEN framework for partnerships", August 1988.
88/47 Alain BULTEZ,Els GUSBRECHTS,
"Asymmetric cannibalism between substituteitems listed by retailers", September 1988.
88/23 Sjur Didrik FLAM
"Equilibres de Nash-Cournot dans le marcheand Georges ZACCOUR europ6en du gaz: un cas ou les solutions en
boucle ouverte et en feedback coincident",Mars 1988.

"Reflections on 'Wait unemployment' inEurope, II", April 1988 revised September1988.
"Information asymmetry and equity issues",September 1988.
"Managing expert systems: from inceptionthrough updating", October 1987.
"Technology, work, and the organization:the impact of expert systems", July 1988.
"Cognition and organizational analysis:who's minding the store?", September 1988.
"Whatever happened to the philosopher-king: the leader's addiction to power,September 1988.
"Strategic choice of flexible productiontechnologies and welfare implications",October 1988
"Method of moments tests of contingentclaims asset pricing models", October 1988.
"Size-sorted portfolios and the violation ofthe random walk hypothesis: Additionalempirical evidence and implication for testsof asset pricing models", June 1988
"Data transferability: estimating the responseeffect of future events based on historicalanalogy", October 1988.
88/59 Martin KILDUFF
88/60 Michael BURDA
88/61 Lars-Hendrik ROLLER
88/62 Cynthia VAN HULLE,Theo VERMAELEN andPaul DE WOUTERS
88/63 Fernando NASCIMENTOand Wilfried R.VANHONACKER
88/64 Kasra FERDOWS
88/65 Arnoud DE MEYERand Kasra FERDOWS
88/66 Nathalie DIERKENS
88/67
Paul S. ADLER andKasra FERDOWS
1989
89/01 Joyce K. BYRER andTawfik JELASSI
"The interpersonal structure of decisionmaking: a social comparison approach toorganizational choice", November 1988.
"Is mismatch really the problem? Someestimates of the Chelwood Gate II modelwith US data", September 1988.
"Modelling cost structure: the Bell Systemrevisited", November 1988.
"Regulation, taxes and the market forcorporate control in Belgium", September1988.
"Strategic pricing of differentiated consumerdurables ht a dynamic duopoly: a numericalanalysis", October 1988.
"Charting strategic roles for internationalfactories", December 1988.
"Quality up, technology down", October 1988
"A discussion of exact measures ofinformation assymetry: the example of Myersand Mejluf model or the importance of theasset structure of the firm", December 1988.
"The chief technology officer", December1988.
"The impact of language theories on DSSdialog", January 1989.
Philippe NAERT andPiet VANDEN ABEELE
88/48
Michael BURDA
88/49
Nathalie DIERKENS
88/50
Rob WEITZ andArnoud DE MEYER
51 Rob WEITZ
88/52
Susan SCHNEIDER andReinhard ANGELMAR
88/53
Manfred KETS DE VRIES
88/54
Lars-Hendrik ROLLERand Mihkel M. TOMBAK
88/55
Peter BOSSAERTSand Pierre HILLION
88/56
Pierre HILLION
88/57 Wilfried VANHONACKERand Lydia PRICE
88/58 B. SINCLAIR-DESGAGNE
"Assessing economic inequality", November 89/02 Louis A. LE BLANC
"DSS software selection: a multiple criteriaand Mihkel M. TOMBAK 1988. and Tawfik JELASSI
decision methodology", January 1989.

89/03 Beth H. JONES andTawfik JELASSI
89/04
Kura FERDOWS andArnoud DE MEYER
89/05 Martin KILDUFF andReinhard ANGELMAR
89/06
Mihkel M. TOMBAIC andB. SINCLAIR-DESGAGNE
89/07
Damien J. NEVEN
89/08
Arnoud DE MEYER andHel!mut SCHOTTE
89/09
Damien NEVENCarmen MATUTES andMarcel CORSTJENS
89/10 Nathalie DIERKENS,Bruno GERARD andPierre HILLION
89/11
Manfred KETS DE VRIESand Main NOEL
89/12
Wilfried VANHONACKER
"Negotiation support: the effects of computerintervention and conflict level on bargainingoutcome", January 1989.
"Lasting improvement in manufacturingperformance: In search of a new theory",January 1989.
"Shared history or shared culture? Theeffects of time, culture, and performance oninstitutionalization in simulatedorganizations", January 1989.
"Coordinating manufacturing and businessstrategies: I", February 1989.
"Structural adjustment in European retailbanking. Some view from industrialorganisation", January 1989.
"Trends in the development of technologyand their effects on the production structurein the European Community", January 1989.
"Brand proliferation and entry deterrence",February 1989.
"A market based approach to the valuationof the assets in place and the growthopportunities of the firm", December 1988.
"Understanding the leader-strategy interface:application of the strategic relationshipinterview method", February 1989.
"Estimating dynamic response models whamthe data are subject to different temporalaggregation", January 1989.
89/13 Manfred KETS DE VRIES
89/14
Reinhard ANGELMAR
89/15
Reinhard ANGELMAR
89/16
Wilfried VANHONACKER,Donald LEHMANN andFareena SULTAN
89/17
Gilles AMADO,Claude FAUCHEUX andAndre LAURENT
89/18
Srinivasan BALAK-RISHNAN andMitchell KOZA
89/19
Wilfried VANHONACKER,Donald LEHMANN andFareena SULTAN
89/20
Wilfried VANHONACKERand Russell WINER
89/21
Arnoud de MEYER andKura FERDOWS
89/22
Manfred KETS DE VRIESand Sydney PERZOW
89/23
Robert KORAJCZYK andClaude VIALLET
89/24
Martin KILDUFF andMitchel ABOLAFIA
"The impostor syndrome: a disquietingphenomenon in organizational life", February1989.
"Product innovation: a tool for competitiveadvantage", March 1989.
"Evaluating a firm's product innovationperformance", March 1989.
"Combining related and sparse data in linearregression models", February 1989.
"Changement organisationnel et realitesculturelles: contrastes franco-americains",March 1989.
"Information asymmetry, market failure andjoint-ventures: theory and evidence",March 1989.
"Combining related and sparse data in linearregression models", Revised March 1989.
"A rational random behavior model ofchoice", Revised March 1989.
"Influence of manufacturing improvementprogrammes on performance", April 1989.
"What is the role of character inpsychoanalysis?" April 1989.
"Equity risk premia and the pricing offoreign exchange risk" April 1989.
"The social destruction of reality:Organisational conflict as social drama"zApril 1989.

89/25 Roger BETANCOURT and
David GAUTSCHI
89/26
Charles BEAN,
Edmond MALINVAUD,
Peter BERNHOLZ,
Francesco GIAVAllI
and Charles WYPLOSZ
89/27
David KRACKHARDT and
Martin KILDUFF
89/28
Martin KILDUFF
89/29 Robert GOGEL and
Jean-Claude LARRECHE
89/30 Lars-Hendrik ROLLER
and Mihkel M. TOMBAK
89/31 Michael C. BURDA and
Stefan GERLACH
89/32 Peter HAUG and
Tawfik JELASSI
89/33 Bernard SINCLAIR-
DESGAGNE
89/34
Sumantra GHOSHAL and
Nittin NOHRIA
89/35
Jean DERMINE and
Pierre BILLION
"Two essential characteristics of retail
markets and their economic consequences"
March 1989.
"Macroeconomic policies for 1992: the
transition and after", April 1989.
"Friendship patterns and cultural
attributions: the control of organizational
diversity", April 1989.
"The interpersonal structure of decision
making: a social comparison approach to
organizational choice", Revised April 1989.
"The battlefield for 1992: product strength
and geographic coverage", May 1989.
"Competition and Investment in Flexible
Technologies", May 1989.
"Intertemporal prices and the US trade
balance in durable goods", July 1989.
"Application and evaluation of a multi-
criteria decision support system for the
dynamic selection of U.S. manufacturing
locations", May 1989.
"Design flexibility in monopsonistic
industries", May 1989.
"Requisite variety versus shared values:
managing corporate-division relationships in
the M-Form organisation", May 1989.
"Deposit rate ceilings and the market value
of banks: The case of France 1971-1981",
May 1989.
89/36
Martin KILDUFF
89/37
Manfred KETS DE VRIES
89/38
Manfred KETS DE VRIES
89/39
Robert KORAJCZYK and
Claude VIALLET
89/40
Balaji CHAKRAVARTHY
89/41 B. SINCLAIR-DESGAGNE
and Nathalie DIERKENS
89/42
Robert ANSON and
Tawfik JELASSI
89/43
Michael BURDA
89/44
Balaji CHAKRAVARTHY
and Peter LORANGE
89/45
Rob WEITZ and
Arnoud DE MEYER
89/46
Marcel CORSTJENS,
Carmen MATUTES and
Damien NEVEN
89/47
Manfred KETS DE VRIES
and Christine MEAD
89/48
Damien NEVEN and
Lars-Hendrik ROLLER
"A dispositional approach to social networks:
the case of organizational choice", May 1989.
"The organisational fool: balancing a
leader's hubris", May 1989.
"The CEO blues", June 1989.
"An empirical investigation of international
asset pricing", (Revised June 1989),
"Management systems for innovation and
productivity", June 1989.
"The strategic supply of precisions", June
1989.
"A development framework for computer-
supported conflict resolution", July 1989.
"A note on firing costs and severance benefits
in equilibrium unemployment", June 1989.
"Strategic adaptation in multi-business
firms", June 1989.
"Managing expert systems: a framework and
case study", June 1989.
"Entry Encouragement", July 1989.
"The global dimension in leadership and
organization: issues and controversies", April
1989.
"European integration and trade flows",
August 1989.

"Home country control and mutualrecognition", July 1989.
"The specialization of financial institutions,the EEC model", August 1989.
"Sliding simulation: a new approach to timeseries forecasting", July 1989.
"Shortening development cycle times: amanufacturer's perspective", August 1989.
"Why combining works?", July 1989.
"Organisation costs and a theory of jointventures", September 1989.
"Euro-Japanese cooperation in informationtechnology", September 1989.
89/62 Amoud DE MEYER(TM)
89/63
Enver YUCESAN and(TM)
Lee SCHRUBEN
89/64
Enver YUCESAN and(TM)
Lee SCHRUBEN
89/65 Soumitra DU1TA and(TM, Piero BONISSONEAC, FIN)
89/66 B. SINCLAIR-DESGAGNE(TM,EP)
89/67
Peter BOSSAERTS and(FIN)
Pierre HILLION
"Technology strategy and international R&Doperations", October 1989.
"Equivalence of simulations: A graphapproach", November 1989.
"Complexity of simulation models: A graphtheoretic approach", November 1989.
"MARS: A mergers and acquisitionsreasoning system", November 1989.
"On the regulation of procurement bids",November 1989.
"Market microstructure effects ofgovernment intervention in the foreignexchange market", December 1989.
89/49 Jean DERMINE
89/50 Jean DERMINE
89/51 Spyros MAKRIDAKIS
89/52 Amoud DE MEYER
89/53 Spyros MAKRIDAKIS
89/54 S. BALAKRISHNANand Mitchell KOZA
89/55
H. SCHUTIM
89/56
Wilfried VANHONACKER
"On the practical usefulness of meta-analysisand Lydia PRICE results", September 1989.
199089/57
Taekwon KIM, "Market growth and the diffusion ofLars-Hendrik ROLLER multiproduct technologies", September 1989. 90/01 B. SINCLAIR-DESGAGNE
"Unavoidable Mechanisms", January 1990.
and Mihkel TOMBAK
TM/EP/AC
89/58 Lars-Hendrik ROLLER(EP,TM) and Mihkel TOMBAK
89/59
Manfred KETS DE VRIES,(011)
Daphne ZEVADI,Alain NOEL andMihkel TOMBAK
89/60
Enver YUCESAN and(114)
Lee SCHRUBEN
89/61
Susan SCHNEIDER and(All)
Amoud DE MEYER
"Strategic aspects of flexible productiontechnologies", October 1989.
"Locus of control and entrepreneurship: athree-country comparative study", October1989.
"Simulation graphs for design and analysis ofdiscrete event simulation models", October1989.
"Interpreting and responding to strategicissues: The impact of national culture",October 1989.
90/02
Michael BURDAEP
90/03
Amoud DE MEYERTM
90/04
Gabriel HAWAWINI andFIN/EP
Eric RAJENDRA
90/05 Gabriel HAWAWINI andFIN/EP Bertrand JACQUILLAT
"Monopolistic Competition, Costs ofAdjustment, and the Behaviour of EuropeanManufacturing Employment", January 1990.
"Management of Communication inInternational Research and Development",January 1990.
"The Transformation of the EuropeanFinancial Services Industry: FromFragmentation to Integration", January 1990.
"European Equity Markets: Toward 1992and Beyond", January 1990.

90/06 Gabriel HAWAWINI and "Integration of European Equity Markets:FIN/EP Eric RAJENDRA Implications of Structural Change for Key
Market Participants to and Beyond 1992",January 1990.
90/17FIN
Nathalie DIERKENS "Information Asymmetry and Equity Issues",
Revised January 1990.
90/18 Wilfried VANHONACKER "Managerial Decision Rules and the90/07 Gabriel HAWAWINI "Stock Market Anomalies and the Pricing of MKT Estimation of Dynamic Sales ResponseFIN/EP Equity on the Tokyo Stock Exchange",
January 1990.Models", Revised January 1990.
90/19 Beth JONES and "The Effect of Computer Intervention and90/08
TM/EP
Tawfik JELASSI and
B. SINCLAIR-DESGAGNE
"Modelling with MCDSS: What aboutEthics?", January 1990.
TM Tawfik JELASSI Task Structure on Bargaining Outcome",February 1990.
90/09 Alberto GIOVANNINI "Capital Controls and Internatiomd Trade 90/20 Tawfik JELASSI, "An Introduction to Group Decision and
EP/F1N and Jae WON PARK Fmance", January 1990. TM Gregory KERSTEN and Negotiation Support", February 1990.Stanley ZIONTS
90/10 Joyce BRYER and "The Impact of Language Theories on DSSTM Tawfik JELASSI Dialog", January 1990. 90/21 Roy SMITH and "Reconfiguration of the Global Securities
FIN Ingo WALTER Industry in the 1990's", February 1990.90/11 Enver YUCESAN "An Overview of Frequency DomainTM Methodology for Simulation Sensitivity 90/22 Ingo WALTER "European Financial Integration and Its
Analysis", January 1990. FIN Implications for the United States", February
1990.
90/12 Michael BURDA "Structural Change, Unemployment BenefitsEP and Iligh Unemployment: A U.S.-European 90/23 Damien NEVEN "EEC Integration towards 1992: Some
Comparison", January 1990. EP/SM Distributional Aspects", Revised December
198990/13 Soumitra DUTTA and "Approximate Reasoning about TemporalTM Shashi SHEKHAR Constraints in Real Time Planning and 90/24 Lars Tyge NIELSEN "Positive Prices in CAPM", January 1990.
Search", January 1990. FIN/EP
90/14
TM
Albert ANGEHRN and
Hans-Jakob LUTHI
"Visual Interactive Modelling and IntelligentDSS: Putting Theory Into Practice", January
90/25
FIN/EP
Lars Tyge NIELSEN "Existence of Equilibrium in CAPM",January 1990.
1990.
90/26 Charles KADUSHIN and "Why networking Fails: Double Binds and
90/15
TM
Arnoud DE MEYER,
Dirk DESCHOOLMEESTER,
Rudy MOENAERT and
"The Internal Technological Renewal of aBusiness Unit with a Mature Technology",January 1990.
OB/BP Michael BRIMM the Limitations of Shadow Networks",
February 1990.
Jan BARBE 90/27 Abbas FOROUGHI and "NSS Solutions to Major NegotiationTM Tawfik JELASSI Stumbling Blocks", February 1990.
90/16 Richard LEVICH and "Tax-Driven Regulatory Drag: EuropeanFIN Ingo WALTER Financial Centers in the 1990's", January 90/28 Amoud DE MEYER "The Manufacturing Contribution to
1990. TM Innovation", February 1990,

90/40 Manfred KETS DE VRIES "Leaders on the Couch: The case of Roberto90/29 Nathalie DIERKENS "A Discussion of Correct Measures of OB Calvi", April 1990.FIN/AC Information Asymmetry", January 1990.
90/30 Lars Tyge NIELSEN "The Expected Utility of Portfolios of90/41
FIN/EPGabriel HAWAWINI,
Itzhak SWARY and"Capital Market Reaction to the
Announcement of Interstate BankingFIN/EP Assets", March 1990. lk HWAN JANG Legislation", March 1990.
90/31 David GAUTSCHI and "What Determines U.S. Retail Margins?", 90/42 Joel STECKEL and "Cross-Validating Regression Models inMKT/EP Roger BETANCOURT February 1990. MKT Wilfried VANHONACKER Marketing Research", (Revised April 1990).
90/32 Srinivasan BALAK- "Information Asymmetry, Adverse Selection 90/43 Robert KORAJCZYK and "Equity Risk Premia and the Pricing ofSM RISHNAN and
Mitchell KOZAand Joint-Ventures: Theory and Evidence",
Revised, January 1990.
FIN Claude VIALLET Foreign Exchange Risk", May 1990.
90/33 Caren SIEHL, "The Role of Rites of Integration in Service 90/44 Gilles AMADO, "Organisational Change and CulturalOB David BOWEN and Delivery", March 1990. 011 Claude FAUCHEUX and Realities: Franco-American Contrasts", April
Christine PEARSON Andre LAURENT 1990.
90/45 Soumitra DUTTA and "Integrating Case Based and Rule Based90/34
FIN/EPJean DERMINE "The Gains from European Banking
Integration, a Call for a Pro-ActiveTM Piero BONISSONE Reasoning: The Possibilistic Connection",
May 1990.Competition Policy", April 1990.
90/46 Spyros MAKRIDAKIS "Exponential Smoothing: The Effect of90/35 Jae Won PARK "Changing Uncertainty and the Time- TM and MichNe HIBON Initial Values and Loss Functions on Post-EP Varying Risk Premia in the Term Structure
of Nominal Interest Rates", December 1988,Revised March 1990. 90/47 Lydia PRICE and
Sample Forecasting Accuracy".
"Improper Sampling in NaturalMKT Wilfried VANHONACKER Experiments: Limitations on the Use of
90/36 Arnoud DE MEYER "An Empirical Investigation of Meta-Analysis Results in BayesianTM Manufacturing Strategies in European Updating", Revised May 1990.
Industry", April 1990.
90/48 Jae WON PARK "The Information in the Term Stricture of90/37
TM/OB/SM
William CATS-BARIL "Executive Information Systems: Developing
an Approach to Open the Possibles", AprilEP Interest Rates: Out-of-Sample Forecasting
Performance", June 1990.1990.
90/49 Soumitra DUTTA "Approximate Reasoning by Analogy to90/38 Wilfried VANHONACKER "Managerial Decision Behaviour and the TM Answer Null Queries", June 1990.MKT Estimation of Dynamic Sales Response
Models", (Revised February 1990). 90/50
EPDaniel COHEN and
Charles WYPLOSZ"Price and Trade Effects of Exchange Rates
fluctuations and the Design of Policy90/39TM
Louis LE BLANC and
Tawfik JELASSI"An Evaluation and Selection Methodology
for Expert System Shells", May 1990.Coordination", April 1990.

90/51 Michael BURDA and "Gross Labour Market Flows in Europe: 90/63 Sumantra GHOSHAL and "Organising Competitor Analysis Systems",EP Charles WYPLOSZ Some Stylized Facts", June 1990. SM Eleanor WESTNEY August 1990
90/52 Lars Tyge NIELSEN "The Utility of Infinite Menus", June 1990. 90/64 Sumantra GHOSHAL "Internal Differentiation and CorporateFIN SM Performance: Case of the Multinational
Corporation", August 199090/53 Michael Burda "The Consequences of German EconomicEP and Monetary Union", June 1990. 90/65 Charles WYPLOSZ "A Note on the Real Exchange Rate Effect of
EP German Unification", August 199090/54 Damien NEVEN and "European Financial Regulation: AEP Colin MEYER Framework for Policy Analysis", (Revised 90/66 Soumitra DUTTA and "Computer Support for Strategic and Tactical
May 1990). TM/SE/FIN Piero BONISSONE Planning in Mergers and Acquisitions",
September 199090/55 Michael BURDA and "Intertemporal Prices and the US TradeEP
90/56
Stefan GERLACH
Damien NEVEN and
Balance", (Revised July 1990).
"The Structure and Determinants of East-West
90/67
7'M/SE/F1N
Soumitra DUTTA and
Piero BONISSONE
"Integrating Prior Cases and Expert Knowledge In
a Mergers and Acquisitions Reasoning System",
September 1990EP Lars-Hendrik ROLLER Trade: A Preliminary Analysis of the
Manufacturing Sector", July 1990 90/68 Soumitra DUTTA "A Framework and Methodology for Enhancing theTM/SE Business Impact of Artificial Intelligence
90/57 Lam Tyge NIELSEN Common Knowledge of a Multivariate Aggregate Applications", September 1990FIN/EP/ Statistic", July 1990TM 90/69 Soumitra DUTTA "A Model for Temporal Reasoning in Medical
TM Expert Systems", September 199090/58 Lars Tyge NIELSEN "Common Knowledge of Price and Expected CostFIN/EP/TM in an Oligopolistic Market", August 1990 90/70
TM
Albert ANGEHRN "'Triple C': A Visual Interactive MCDSS",September 1990
90/59 Jean DERMINE and "Economies of Scale andFIN Lars-Hendrik ROLLER Scope in the French Mutual Funds (SICAV) 90/71 Philip PARKER and "Competitive Effects in Diffusion Models: An
Industry", August 1990 MKT Hubert GATIGNON Empirical Analysis", September 1990
90/60 Peri IZ and "An Interactive Group Decision Aid for 90/72 Enver YCJCESAN "Analysis of Markov Chains Using SimulationTM Tawfik JELASSI Multiobjective Problems: An Empirical TM Graph Models", October 1990
Assessment", September 1990
90/61 Pankaj CHANDRA and "Models for the Evlauation of Manufacturing90/73
TM
Arnoud DE MEYER and
Kasra FERDOWS
"Removing the Barriers in Manufacturing",
October 1990TM Mihkel TOMBAK Flexibility", August 1990
90/62 Damien NEVEN and "Public Policy Towards TV Broadcasting in the 90/74 Sumantra GHOSHAL and "Requisite Complexity: Organising Headquarters-EP Menno VAN DUK Netherlands", August 1990 SM Nitin NOHRIA Subsidiary Relations ins MNCs", October 1990

90/75MKT
Roger BETANCOURT andDavid GAUTSCHI
"The Outputs of Retail Activities: Concepts,Measnresseut and Evidence, October 1990
90/87FIN/EP
Lars Tyge NIELSEN *Existroce of Equilibrium in CAPM: FurtherResults", December 1990
90/76 Wilfried VANHONACKER "Managerial Decision Behaviour and the Estimation 90/88 Susan C. SCHNEIDER and •Cogaitio. in Orgnaisatiomd Analysis: Who'sMKT of Dynamic Saks Response Models',
Revised October 1990011/MKT Reinhard ANGELMAR Minding the Rorer Revised, December 1990
90/89 Manfred F.R. KETS DE VRIES "The CEO Who Couldn't Talk Straight and Other90/77 Wilfried VANHONACKER "Teaks the Koyck Scheme of Saks Response to OD Tales from the Beard Room; December 1990MKT Advertising: A• Aggregation-Independeol
Awlecornlotioa Test', October 1990 90/90 Philip PARKER 'Price Elasticity Dynamics over the AdoptionMKT Likeyele: As Empirical Study,' December 1990
90/78 Michael BURDA end "Exchange Rate Dyamoics nod CurrencyEP Stefan GERLACH Unification: The Ostmark - DM Rate,
October 1990
90/79 Anil GABA •Infereoces with as lUaknown Noise Level is aTM Bernoulli Process•, October 1990
90/80 Anil GABA and •Using Survey Data is Inferences about PurchaseTM Robert WINKLER Behaviour'. October 1990 1991
90/81 Tewfik IELASSI 'Du Prdsan au Euler: War et Orientations desTM Syntheses loteractifs d'Aide h la Decisioa,"
October 199091/01TM/OM
Luk VAN WASSENHOVE,Leonard FORTUIN and
"Operatiosal Research Cam Do More for ManagersThaw They Thalia;
Paul VAN BEEK January 199190/82EP
Chicks WYPLOSZ "Monetary Union and Fiscal Policy Discipline,November 1990 91/02
TM/SMLuk VAN WASSENHOVE,Leonard FORTUIN end
"Operatiomil Research mid Envirooment,'January 1991
90/83 Nathalie DIERKENS end "Isionnotime Asymmetry and Corporate Paul VAN BEEKPIN/TM Bernard SINCLAIR-DESGAGNE Coommuication: Results of • Pilot Study',
November 1990 91/03 Pukka HIETALA and 'As Implicit Dividend Increase in Rights Issues:FIN Timo Theory and Evidence; January 1991
90/84 Philip M. PARKER "The Effect of Advertising on Price and Quality:MKT The Optometric ladustry Revisited,' 91/04 Lars Tyge NIELSEN •Two-EMsd Separation, Factor Structure and
December 1990 Fl N Robustoess," January 1991
90/113 Avijit GHOSH end "Optimal Timing and Location is Competitive 91/05 Susan SCHNEIDER "Managism Booaderies is Ongaokations,"MKT Vikas TIBREWALA Markets,• November 1990 OB January 1991
90/86 Olivier CADOT and °Prudeoce sad Success is Politics,' November 1990 91/06 Manfred KETS DE VRIES, °Ustderstaadise the Leader-Strategy Interface:EP/TM Bernard SINCLAIR-DESGAGNE OB Danny MILLER and Application of the Strategic Relationship Interview
Alain NOEL Method,' January 1990 (89/11, revised April 1990)

91/07 Olivier CADOT "Lending to Insolvent Countries: A ParadoxicalEP Story," January 1991 91/19
MKTVikas TIBREWALA andBruce BUCHANAN
"An Aggregate Test of Purchase Regularity",March 1991
91/08 Charles WYPLOSZ "Post-Reform East and West: CapitalEP Accumulation and the Labour Mobility 91/20 Darius SABAVALA and "Monitoring Short-Run Changes in Purchasing
Constraint," January 1991 MKT Vikas TIBREWALA Behaviour", March 1991
91/09TM
Spyros MAKRIDAKIS "What can we Learn from Failure?", February 1991 91/21SM
Sumantra GHOSHAL,Harry KORINE and
•Interunit Communication within MNCs: TheInfluence of Formal Structure Versus Integrative
Gabriel SZULANSKI Processes", April 1991
91/10 Luc Van WASSENHOVE and "Integrating Scheduling with Hatching andTM C. N. POTTS Lot-Sizing: A Review of Algorithms and
Complexity", February 199191/22EP
David GOOD,Lars-Hendrik ROLLER and
"EC Integration and the Structure of the Franco-American Airline Industries: Implications for
Robin SICKLES Efficiency and Welfare", April 1991
91/11 Luc VAN WASSENHOVE et al. "Multi-Item Lotsizing in Capacitated Multi-StageTM Serial Systems", February 1991 91/23 Spyros MAKRIDAKIS and "Exponential Smoothing: The Effect of Initial
TM Michele HIBON Values and Loss Functions on Post-Sample
91/12TM
Albert ANGEHRN "Interpretative Computer Intelligence: A Linkbetween Users, Models and Methods in DSS",February 1991
Forecasting Accuracy", April 1991 (Revision of90/46)
91/24 Louis LE BLANC and "An Empirical Assessment of Choice Models for
91/13EP
Michael BURDA "Labor and Product Markets in Czechoslovakia and
the Ex-GDR: A Twin Study", February 1991TM T.wtik JELASSI Software Evaluation and Selection*, May 1991
91/25 Luk N. VAN WASSENHOVE and "Trade-Offal What Trade-Offs?" April 1991
91/14 Roger BETANCOURT and 'The Output of Retail Activities: French SM/TM Charles J. CORBETTMKT David GAUTSCHI Evidence", February 1991
91/26 Luk N. VAN WASSENHOVE and "Single Machine Scheduling to Minimize Total Late
91/15OB
Manfred F.R. KETS DE VRIES "Exploding the Myth about Rational Organisationsand Executives", March 1991
TM C.N. POTTS Work', April 1991
91/27 Nathalie DIERKENS "A Discussion of Correct Measures of Information
91/16 Arnoud DE MEYER and "Factories of the Future: Executive Summary of FIN Asymmetry: The Example of Myers and Majluf's
TM Kasra FERDOWS et.al. the 1990 International Manufacturing FuturesSurvey", March 1991
Model or the Importance of the Asset Structure ofthe Firm", May 1991
91/17TM
Dirk CATTRYSSE,Roelof KUIK,Marc SALOMON and
"Heuristics for the Discrete Lotsizing andScheduling Problem with Setup Times", March 1991
91/28MKT
Philip M. PARKER "A Note on: 'Advertising and the Price and Qualityof Optometric Services'. June 1991
Luk VAN WASSENHOVE 91/29 Tawfik JELASSI and "An Empirical Study of an Interactive, Session-
TM Abbas FOROUGHI Oriented Computerised Negotiation Support System91/18 C.N. POTTS and `Approximation Algorithms for Scheduling a Single (NSS)", June 1991TM Luk VAN WASSENHOVE Machine to Minimize Total Late Work",
March 1991

91/30 Wilfried R. VANHONACKER and "Using Meta-Analysis Results in Bayesian Updating:MKT Lydia 1. PRICE The Empty Cell Problem", June 1991 91/43 Sumantra GHOSHAL and "Building Tninsnational Capabilities: The
SM Christopher BARTLETT Management Challenge", September 199191/31 Rezaul KABIR and "Insider Trading Restrictions and the StockFIN Theo VERMAELEN Market", June 1991 91/44 Sumantra GHOSHAL and "Distributed Innovation in the 'Differentiated
SM Nitin NOHRIA Network' Multinational", September 199191/32 Susan C. SCHNEIDER "Organisational Sensemaking: 1992", June 1991OB 91/45 Philip M. PARKER "The Effect of Advertising on Price and Quality:
MKT An Empirical Study of Eye Examinations, Sweet91/33 Michael C. BURDA and "German Trade Unions after Unification - Third Lemons and Self-Deceivers", September 1991EP Michael FUNKE Degree Wage Discriminating Monopolists?",
June 1991 91/46 Philip M. PARKER "Pricing Strategies in Markets with DynamicMKT Elasticities", October 1991
91/34 Jean DERMINE "The BIS Proposal for the Measurement of InterestFIN Rate Risk, Some Pitfalls", June 1991 91/47 Philip M. PARKER "A Study of Price Elasticity Dynamics Using
MKT Parsimonious Replacement/Multiple Purchase91/35FIN
Jean DERMINE "The Regulation of Financial Services in the EC,Centralization or National Autonomy?" June 1991
Diffusion Models", October 1991
91/48 H. Landis GABEL and "Managerial Incentives mid Environmental91/36 Albert ANGEHRN "Supporting Multicriteria Decision Malting: New EP/TM Bernard SINCLAIR-DESGAGNE Compliance", October 1991TM Perspectives and New Systems", August 1991
91/49 Bernard SINCLAIR-DESGAGNE "The First-Order Approach to Multi-Task91/37 Ingo WALTER and "The Introduction of Universal Banking in Canada: TM Principal-Agent Problem", October 1991EP Hugh THOMAS An Event Study", August 1991
91/50 Luk VAN WASSENHOVE and "How Gram is Your Manufacturing Strategy?"91/38 Ingo WALTER and "National and Global Competitiveness of New York SM/TM Charles CORBETT October 1991EP Anthony SAUNDERS City m a Financial Center", August 1991
91/51 Philip M. PARKER "Choosing Among Diffusion Models: Some91/39EP
Ingo WALTER andAnthony SAUNDERS
"Reconfiguration of Ranking and Capital Marketsin Eastern Europe", August 1991
MKT Empirical Gaidefines", October 1991
91/52 Michael BURDA and "Human Capital, Investment and Migration in an91/40TM
Luk VAN WASSENHOVE,Dirk CATTRYSSE and
"A Set Partitioning Heuristic for the GeneralizedAssignment Problem", August 1991
EP Charles WYPLOSZ Integrated Europe", October 1991
Marc SALOMON 91/53 Michael BURDA and "Labour Mobility and German Integration: SomeEP Charles WYPLOSZ Vignettes", October 1991
91/41TM
Luk VAN WASSENHOVE,M.Y. KOVALYOU and
"A Fully Polynomial Approximation Scheme forScheduling a Single Machine to Minimize Total 91/54 Albert ANGEHRN "Stimulus Agents: An Alternative Framework for
C.N. POTTS Weighted Late Work", August 1991 TM Computer-Aided Decision Making", October 1991
91/42 Rob R. WEffZ and "Solving A Multi-Criteria Allocation Problem:TM Tawfik JELASSI A Decision Support System Approach",
August 1991

91/55 Robin HOGARTH,
EP/SM Claude MICHAUD,
Yves DOZ and
Ludo VAN DER HEYDEN
"Longevity of Business Finns: A Four-Stage
Framework for Analysis", November 1991
91/56 Bernard SINCLAIR-DESGAGNE "Aspirations and Economic Development".
TM/EP November 1991
91/57 Lydia 1. PRICE "The Indirect Effects of Negative Information on
MKT Attitude Change", November 1991
91/58 Manfred F. R. ICETS DE VRIES "Leaders Who Go Crazy", November 1991
OB
91/59 Paul A. L. EVANS
OB
91/60 Xavier DE GROOTE
TM
91/61 Arnoud DE MEYER
TM
"Management Development as Glue Technology",
November 1991
"Flexibility and Marketing/Manufacturing
Coordination", November 1991 (revised)
"Product Development in the Textile Machinery
Industry", November 1991