يوـــــــنــــــــــــــــسلا ... · bahrain water bottling &...
TRANSCRIPT
201
8ي
ـوــــ
نــــــ
ــــــــ
ــــس
الر
ــــري
ــــــــ
ــــــــ
ــــقـ
تـالـ
AN
NU
AL
R
EP
OR
T
20
18
A N N U A L R E P O R T 2018
Overcoming challenges with perfect balanceالـتـغـلـب عـلـى الـتـحـديـات بـالـتـوازن الـمـثـالـي
2018 الــتـــقــــــريـــــرالــــســـــنـــوي

ص.ب 20202، الــمـنـامــة، مـمـلـكـة البحــريـن www.trafco.com ،17 727380 :7 17، فاكس 2 9 0 0 0 هاتف:
P O Box 20202, Manama, Kingdom of Bahrain Telephone: 17 729000, Fax: 17 727380, www.trafco.com
Redefining growth with a commitment to quality.
إعادةتعريف
النمو بالتزام الجودة.

His Royal Highness Prince Salman Bin Hamad
Al KhalifaThe Crown Prince,
Deputy Supreme Commander and First Deputy Prime
Minister
His MajestyKing Hamad Bin Isa
Al KhalifaThe King of the
Kingdom of Bahrain
His Royal HighnessPrince Khalifa Bin Salman
Al KhalifaThe Prime Minister

ANNUAL REPORT 20182 ANNUAL REPORT 20182
Company Profile4 decades of exceptional service
Trafco Group B.S.C (TRAFCO) was incorporated in the year 1977 as a public joint stock company as part of an initiative to revolutionize and rejuvenate the food industry of the Kingdom of Bahrain. The Company was successfully turned into Public Share Holding Company with initial public offering in 1980 and was later listed in Bahrain Bourse. In the last 4 decades the Company en route to success has achieved several milestones and has earned itself the reputation of being one among the major Fast Moving Consumer Goods (FMCG) industries in the Kingdom of Bahrain. Born out of a vision to be at the forefront of the food industry, TRAFCO is today a household name synonymous with some of the finest food products locally produced or imported from worldwide. Moreover, being one of the oldest food companies in Bahrain, it has gained trust and admiration for its commitment to quality, value and service excellence.
Serving Bahrain with the best from across the globe
The core business of the group is import & distribution of food & non-food products, manufacturing, logistics & related activities and with group annual sales turnover of over US$ 100 million. TRAFCO is one of the largest & biggest FMCG conglomerates in Bahrain with an extensive range of products comprising of canned, frozen & dry food and nonfood products, general commodities, fresh fruits and vegetables as well as chilled & frozen meat imported from countries such as Australia, Brazil, Europe, the Far East, India, UK, USA, Pakistan, besides Arab and the Middle East countries. With stringent and reliable quality control systems in place, TRAFCO continues to introduce many world-renowned brands with the assurance of excellent quality and exceptional service.
Success through synergy
As part of its vision to become a dominant player in food industry, TRAFCO is propelling its expansion through organic and inorganic growth. TRAFCO has invested in developing the food industry of Bahrain by acquiring BWBB, BFFC, Metro Markets, Trafco Logistics Co. (TLC) and by owning majority stake in Awal Dairy Company W.L.L., BANZ Group and Bahrain Livestock Company. To serve Bahrain’s objective of economic integration among GCC countries, Kuwait Bahrain Dairy Company was established in 1992 in Kuwait as a wholly owned subsidiary of Awal Dairy. Awal Dairy exports its products to Kuwait, Saudi Arabia, UAE, Jordan, Iraq, Yemen, North & West Africa and Latin America. Recently Awal Dairy expanded its operations in Kingdom of Saudi Arabia with a new branch.
BWBB: Bahrain Water Bottling & Beverages, 100% subsidiary of TRAFCO has received HACCP certificate & ISO 22000:2005 from SGF Gulf UAE for the quality of water it produces, awarded by institutions specializing in water analysis supported by Saudi and the Gulf standards. BWBB is one among very few companies in Bahrain that are into manufacturing and bottling of mineral water with strict adherence to quality control. BWBB is the market leader in water bottling industry and TYLOS is the brand leader in the segment in addition to other brands like Selsabil and the latest brand MARWA. Apart from the private labeling business, the company is also manufacturing ‘metro’ brand in its production line which is marketed by Trafco. The Company started trading juice products and potato chips during the year which are well accepted in the market.
BFFC: Bahrain Fresh Fruits Company, a pioneer in food industry was acquired in the year 2009 and is 100% subsidiary of TRAFCO. The Company was incorporated in the year 1998 and with its state-of-the-art infrastructure along with a dedicated & committed workforce has become
a dominant player in FMCG sector. BFFC is very active in two core food businesses – one being import and distribution of fresh fruits & vegetables and the other, import and distribution of frozen, chilled & dry food and non-food products. Our fruits & vegetables division is one of the biggest in Bahrain with largest banana ripening chambers. Few of the brands to reckon with in FMCG division are Bridel from Lactalies Europe, and Chiquita & Fruits brand bananas from Ecuador, Tyson Chicken from Brazil and Unilever products from India.
Metro: Metro Markets Co. is 100% owned and is the retail arm of TRAFCO. Spanning across various parts of Bahrain, Metro is undoubtedly one of the rapidly expanding supermarket chains in the Kingdom. Metro is known for their strict adherence to quality control and standards, have been over the years, patronized by discerning customers who value its superior products and services. The Company is currently refurbishing East Riffa branch which is expected to reopen in May 2019.
Trafco Logistics: Trafco Logistics Co. which commenced its operation from May 2010 is conveniently located in Galali. The US$ 14 million logistics complex is a wholly owned subsidiary of TRAFCO which is focusing on 3PL. This state of the-art logistic facility with sophisticated technology and exceeding 20,000 cubic meter space with Frozen, Chilled and Dry facilities located in close proximity to the airport and the new seaport of Khalifa Bin Salman port in Muharraq has propelled TRAFCO into the elite group of logistic solution providers in Bahrain. The Company is also looking for new avenues for expansion of the storage space since its customer base is increasing including contracts with the government agencies.
Awal Dairy: The first dairy company in Bahrain to be incorporated in the year 1963, TRAFCO holds 51% shareholding in Awal Dairy. The Company is ISO 22000:2005 certified and adheres to international food and safety standards. Latest technology, innovative & excellent products, proficient manpower, sophisticated logistics and outstanding customer care have made Awal Dairy the market leader in Bahrain. Awal Dairy offers novel range of fruit juices and drinks, fresh milk under brand name “Noor”, UHT milk under brand name “Awal” and “Fabion” ice creams in addition to other value added products. The Company with a workforce of around 300 people and with combined production capacity over 100,000 metric tons is one among the major dairies in the GCC region. The Company increased its export market share covering 18 countries including North & West Africa, Yemen and Latin America in addition to its export to GCC countries, Jordan and Iraq.
BLSC: This Company that is partially owned by TRAFCO was established in 2000 to own and operate the central slaughter house of Bahrain and be the major importer of livestock mainly from Australia. Later it expanded its activities to importing and distributing chilled & frozen meat. Red meat was heavily subsidized by Govt. of Bahrain for many years, but this policy was discontinued since October 2015. The Company, thus had to revise its activities based on the market change and concentrate now mainly on frozen & chilled meat and is expanding to value added activities in the meat sector.
Glimpse of the future
Success, as we all know, is not the destination but an ongoing process. We, at TRAFCO, strongly believe in this philosophy. Reason why, the Company is all set to expand further in the future, thus, underscoring the management’s objectives to serve not only the local market but also across the GCC region.

ANNUAL REPORT 2018 33ANNUAL REPORT 2018
Exploring opportunities for a promising future.
Key Business Plan
• Diversifying into sectors of private labelling
• Accelerate new product launches, brands,
agencies, distributions
• Expand management team in sales/marketing
• Strengthen human resources functions
• Seek new market segments in food category
• Locate new corporate premises
• Participating in trade shows and fairs
• Develop overseas market entry plans
• Expansion in the export market
T eamwork R el iabi l i ty A ccountabi l i ty F airness C ommitment O pt imum Value
VisionTRAFCO to be recognized as a household name synonymous with finest food products in the GCC.
MissionTo ensure customer satisfaction by delivering superior quality products, the highest level of service and diverse range of world-leading brands at the most competitive prices.
SWOT AnalysisStrength• 4 decades of presence with infrastructure facilities
including logistics services.• Key Customer BaseWeakness• Dependability on few major brands
Strategic Goals
Backed by strong financial stability, support of
the stakeholders, team of professionals HR, IT,
Finance, Storage and efficient fleet management
system, TRAFCO group strives to enhance their
business by diversifying into various segments in
food category.
ValuesThe company is guided by the following core values in its endeavour to realize its corporate vision:
Opportunities• Access to all sources of vendors, manufacturers and growers all over the world. • Scope to diversify into related market segments• Distribution channels seeking new productsThreats• Growing competition by small and medium players in the same sector.• Price sensitive market

ANNUAL REPORT 20184
Performance realised by global standards.
Authorised Capital BD 10,000,000
Issued and Paid Up Capital BD 8,067,505
Board of Directors
1) Ebrahim Mohamed Ali Zainal Chairman
2) Yusuf Saleh Abdulla Alsaleh Vice Chairman
3) Khalid A.Rahman Khalil Almoayed Director
4) Dr. Esam Abdulla Yousif Fakhro Director
5) Ebrahim Salahuddin Ahmed Ebrahim Director
6) Sami Mohammed Yusuf Jalal Director
7) Jehad Yusuf Abdulla Amin Director
8) A. Redha Mohamed Redha Aldailami Director
9) Ali Yusuf A.Rahman A.Rahim Director
10) Fuad Ebrahim Khalil Kanoo Director
Executive Management
S. Sridhar - Group CEO 17 725897 [email protected]
Sameer A. Alkhan - Assistant Group CEO 17 723343 [email protected]
Azzam Moutragi - Sales Manager 17 723524 [email protected]
P. Palanisamy - Finance Manager 17 827059 [email protected]
Francisco J. Sequeira - Maintenance Manager 17 729000 [email protected]
Layla Darwish - Human Resources Manager 17 825314 [email protected]
Wael Ahmed - Acting Stores Manager 17 729000 [email protected]
Group Companies Abdul Azeez Karinkalimmal - Operations Manager Bahrain Fresh Fruits Co. S.P.C. 17 470935 [email protected]
Raju Joseph - Operations Manager, Trafco Logistics Co. S.P.C. 17 810450 [email protected]
B.T. Mohan - Operations Manager, Bahrain Water Bottling & Beverage Co. S.P.C. 17 336700 [email protected]
Ahmed Ghaleb - Asst. Retail Operations Manager, Metro Markets Co. S.P.C. 17 729000 [email protected]

ANNUAL REPORT 2018 5
Other Departments
Sales Department 17 727208
Accounts Department - Head Office 17 827059
Fresh Fruits & Vegetables Division - Central Market 17 276603
Accounts Department - Central Market 17 276603
Banks
1) National Bank of Bahrain B.S.C.
2) Ahli United Bank Bahrain B.S.C.
3) Mashreq Bank
4) Arab Bank
5) Habib Bank Ltd.
6) Bank of Bahrain and Kuwait B.S.C
7) National Bank of Kuwait
8) Bahrain Islamic Bank
Subsidiary Companies Place of Effective Ownership Incorporation Interest
1) Bahrain Water Bottling & Beverage Co. S.P.C. Bahrain 100%
2) Bahrain Fresh Fruits Co. S.P.C. Bahrain 100%
3) Metro Markets Co. S.P.C. Bahrain 100%
4) Trafco Logistics Co. S.P.C. Bahrain 100%
5) Awal Dairy Co. W.L.L. Bahrain 51%
6) Kuwait Bahrain Dairy Co. W.L.L. Kuwait
(98% Owned By Awal Dairy Co. W.L.L.)
Associate Companies Place of Effective Ownership Incorporation Interest 1) Bahrain Livestock Company B.S.C. (C) Bahrain 36.26%
2) Qatari Bahraini Food Trading Co. L.L.C. Qatar 50% (under Liquidation)
ANNUAL REPORT 20186
Board of Directors
1 34
5
67
8
910 2

ANNUAL REPORT 2018 7
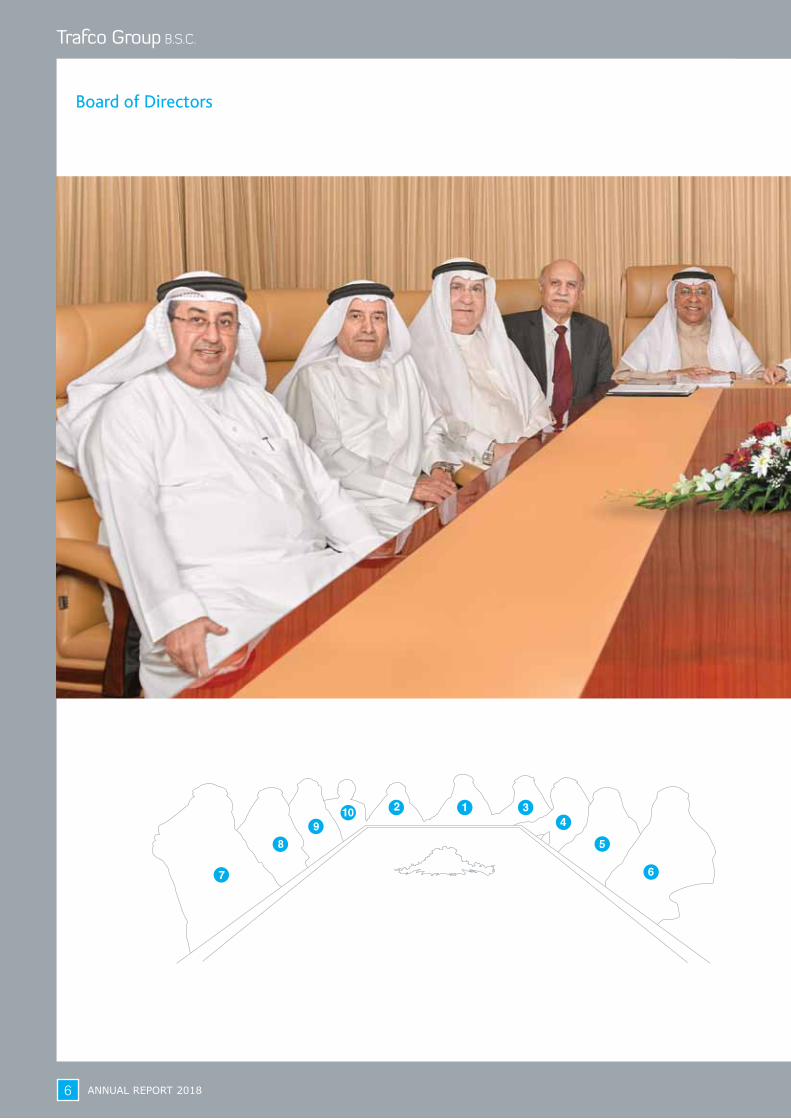
1. Ebrahim Mohamed Ali Zainal Chairman
2. Yusuf Saleh Abdulla Alsaleh Vice Chairman
3. Khalid A.Rahman Khalil Almoayed Director & Executive Committee Member
4. Dr. Esam Abdulla Yousif Fakhro Director & Executive Committee Member
5. Ebrahim Salahuddin Ahmed Ebrahim Director
6. Sami Mohammed Yusuf Jalal Director
7. Jehad Yusuf Abdulla Amin Director
8. Ali Yusuf A.Rahman A.Rahim Director
9. Fuad Ebrahim Khalil Kanoo Director
10. A. Redha Mohamed Redha Aldailami Director

ANNUAL REPORT 20188
Trafco Executive Management
Sitting
S. Sridhar (Left) Group CEO
Sameer A. Alkhan (Right)Assistant Group CEO
Standing from Left to Right
Francisco J. SequeiraMaintenance Manager
Azzam MoutragiSales Manager
Wael AhmedActing Stores Manager
P. PalanisamyFinance Manager
Layla DarwishHuman Resources Manager

ANNUAL REPORT 2018 9
Group Companies Management
Sitting
S. Sridhar (Right)Group CEO
Sameer A. Alkhan (Left)Assistant Group CEO
Standing from Left to Right
B.T. Mohan Operations Manager,Bahrain Water Bottling & Beverage Co. S.P.C.
Abdul Azeez Karinkalimmal Operations Manager,Bahrain Fresh Fruits Co. S.P.C.
Ahmed Ghaleb (from February 2019)Assistant Retail Operations Manager,Metro Markets Co. S.P.C.
Raju JosephOperations ManagerTrafco Logistics Co. S.P.C.
ANNUAL REPORT 201810
Report of The Board of Directors
Awal Dairy Company W.L.L.
The Group’s subsidiary Awal Dairy Company’s total sales amounted to BD 14.7 million for the current fiscal year, while net profit for the year increased from BD 1.42 million to BD 1.56 million due to improved performance of its subsidiary in Kuwait, increased export sales and reduced cost of raw materials and packaging materials and the co-packaging of some of its products under the brands of several Gulf and international companies for distribution in the GCC, Middle East and North Africa. Awal Dairy’s management decided at its last Board of Directors meeting to inject new investments up to BD 400k to increase production and marketing activities in Bahrain and Kuwait. As for Awal Dairy’s branch in the Kingdom of Saudi Arabia, all formal procedures have been completed including warehouse, office and lease of distribution vehicles are approved by the local food authorities regulations. It is hoped that the sales and distribution operations in the eastern province would commence during February 2019.
Bahrain Water Bottling & Beverages Company S.P.C.
Bahrain Water Bottling & Beverages Company continued to achieve positive results for the third year in a row. With the total sales reaching BD 1.69 million compared to BD 1.63 million in the previous year, the net profit improved by 13% from BD 179k to BD 203k. BWBB, having successfully marketed water under its brand Marwa, has expanded the brand for another product in the field of food, the potato chips manufactured under agreement with a local factory in the Kingdom of Bahrain. This product has been well accepted by consumers.
Bahrain Fresh Fruits Company S.P.C.
The overall profitability of Bahrain Fresh Fruits Company improved with the total sales amounting to BD 2.3 million compared to BD 3.36 million last year with the net profit
achieved of BD 42k against the loss of BD 136k last year. Change in the management had a positive impact on BFFC operations and the company focusses more on the goods and products that are largely consumed and we hope that there will be further improvement over the next year.
Metro Markets Company S.P.C.
This subsidiary is still waiting to reopen its refurbished shop at East Riffa during the first quarter of 2019 and is looking for the improved profitability and performance of its multiple branches. During the fiscal year, Um Al-Hassam Branch was sold due to lack of parking space for customers. The Salmabad branch did not achieve good sales due to the presence of temporary shops and supermarkets in the same area especially during the weekends which may need relocation. Metro Market’s total sales amounted to BD 2.47 million compared to BD 2.79 million in the previous year with a limited profitability of BD 20k compared to BD 39k in the preceding year.
Trafco Logistics Company S.P.C.
This subsidiary continued to achieve good results in third party logistics and storage services. TLC achieved revenue of about BD 845k this year compared to BD 802k in the previous year with a net profit of BD 186k as against BD 201k last year. The management is considering the expansion of storage especially for frozen goods, despite the increase in competition and the decline in prices and storage charges.
Bahrain Livestock Company B.S.C (c)
This sister company continued to record losses for the third year in a row. Despite the restructuring of the company, the volume of meat sales in the Bahrain market declined significantly with fierce competition during the fiscal year. BLSC in cooperation with the government authorities felt the need to reopen the main slaughterhouse of the
The food commodities market in 2018 witnessed a general decline in prices, especially in basic commodities such as sugar, rice, vegetable oil and frozen chicken as a direct result of the abundance of the products available in world markets and the decline in the prices of oil and energy derivatives. The intense competition between shopping malls and the discounted offers resulted in decline in consumer prices. Despite the negative impact on the total sales, the Group was able to maintain its share in the market. The Group’s total sales amounted to BD 39.5 million this year, a decrease of 1% compared to BD 40 million in the previous year. The Group’s net profit attributable to shareholder of Trafco for the year was BD 1.84 million, an increase of 10% over BD 1.67 million last year. It is worth mentioning that during this year the trading profit of the core business improved plus the profits achieved from subsidiaries, associates and investment portfolio.
In the name of Allah, Most Gracious, Most Merciful

ANNUAL REPORT 2018 11
Report of The Board of Directors
company and hence carried out the necessary refurbishing of the slaughter house. It was reopened in the pre-Eid al-Adha period to provide slaughtering and packing services to others. BLSC also imported meat of Somali, Sudanese and Arab sheep. The slaughterhouse is still open to the company’s business and others but unfortunately the demand is very limited and declining for locally slaughtered sheep since the market is largely dependent on chilled and frozen meat, which the company still deals with on a daily basis. During the last quarter of the fiscal year, the company’s management decided to establish a division to deal with various foodstuffs in general and to focus on providing services to hotels, restaurants and catering segment with the appointment of manager in this field. It is hoped that this division will achieve desired results and success during the new fiscal year.
New storage for the group
As previously communicated, the Group acquired total of 8 plots of land with a total area of 97,000 sq ft in Investment Gateway of Bahrain in Galali/East Hidd, a special area for warehouses, workshops and commercial offices. During the fiscal year, the Board of Directors floated tender for the construction of the first stage of the warehousing on 2 plots with a total area of 23,000 sq ft and the work was allocated to one of the local construction companies at a cost of BD 886k to build the dry warehouse. The construction started in September 2018 and is expected to be completed by the end of this year. Storage space will be used for Group’s inventory and for third party storage.
Issues Related to Corporate Governance Process
The Group complies with all Corporate Governance Code requirements and the related Committees and Executive Management follow these matters. The annual report
clearly indicates all information with regard to the directors and their participation in different committees. The Board of Directors would like to inform the shareholders that some of the Board members may have personal interest or stakeholders in other companies that operate for many years in similar activities of the company. All transactions with related parties including Board members or companies that they may have interest in are being disclosed in full transparency and on normal commercial basis.
Net profit and recommendation on how to distribute it:
The audited net profit for the financial year ended 31 December 2018 amounted to BD 1,838,292 and with the addition of retained earnings carried from the previous year BD 2,184,791 adding the IFRS impact adjustments & other restatements BD 559,525 and after deducting our share of statutory reserve of a subsidiary BD 80,525 the total net profit distributable will be BD 4,502,083. The Board of Directors recommends the distribution of these profits as follows subject to AGM approval:
• Statutory reserve BD 185,480
• General reserve BD 50,000
• Cash dividend to shareholders at 18% BD 1,384,829
Retained earnings carried to 2019 BD 2,881,774
• Allocation to donations and charity BD 50,000
• Directors’ remuneration BD 123,000
Total provision BD 173,000
Towards a brighter future through innovative thinking.

ANNUAL REPORT 201812
Acknowledgements
On behalf of all shareholders, the Board of Directors are grateful to His Royal Majesty King Hamad Bin Isa Al Khalifa, King of the Kingdom of Bahrain, His Royal Highness Prince Khalifa Bin Salman Al Khalifa, the Prime Minister, and His Royal Highness Prince Salman Bin Hamad Al Khalifa, Crown Prince and Deputy Supreme Commander and First Deputy Prime Minister. We would also like to thank all the ministers and officials from the ministries and institutions of the Kingdom of Bahrain for their cooperation and the continued support and assistance to Trafco and its subsidiaries and associates.
We would also like to show our gratitude towards the administration and employees of the group for their untiring efforts and dedication to work without whom the Group could not have achieved this growth and good results.
We also like to sincerely thank our valued customers and our clients for their support who had a positive role in selling our products which resulted in gaining the customers’ confidence and trust in our products.
105: And say (O Muhammad saw) “Do Deeds, Allah Will See Your Deeds And (so will) His Messenger And The Believers”: Al Tawba, The Holy Qur’an.
Ebrahim Mohamed Ali ZainalChairmanBahrain, 27 February 2019

ANNUAL REPORT 2018 13
Key audit matter
The Group holds unquoted equity investments of BD 3,886,101 as at 31 December 2018, which accounts for 10% of the Group’s total assets. These investments are measured at fair values determined based on unobservable inputs using market multiples or other appropriate valuation methodologies.
Due to the illiquid nature of these investments, the determination of fair value is subjective and involves estimates and judgements. The exit value of unquoted equity investments will be determined by the market at the time of realisation and therefore despite the valuation policy and judgments applied by management, the final exit value may materially differ from the fair value determined at the reporting date.
Given the inherent subjectivity surrounding the valuation of unquoted equity investments, we determined this to be a key audit matter for our audit.
How our audit addressed the key audit matter
Our audit procedures in this area included, among others: (i) Assessing the appropriateness of the valuation
methodologies used by management;
(ii) Corroborating the key inputs used in the valuation with independently available information;
(iii) Reviewing the appropriateness of illiquidity and other discounts applied on the valuation;
(iv) Checking the arithmetical accuracy of the calcuation used in the valuation; and
(v) Evaluating the adequacy of disclosures in the consolidated financial statements.
Auditor’s Report
Report on the Audit of the Consolidated Financial Statements
OpinionWe have audited the accompanying consolidated financial statements of Trafco Group B.S.C. (“the Company”) and its subsidiaries (together “the Group”), which comprise the consolidated statement of financial position as at 31 December 2018, and the consolidated statements of income, other comprehensive income, cash flows and changes in equity for the year then ended, and notes to the consolidated financial statements, including a summary of significant accounting policies. In our opinion, the accompanying consolidated financial statements present fairly, in all material respects, the consolidated financial position of the Group as at 31 December 2018, its consolidated financial performance and its consolidated cash flows for the year then ended in accordance with International Financial Reporting Standards (IFRSs). Basis for opinion We conducted our audit in accordance with International Standards on Auditing (ISAs). Our responsibilities under those standards are further described in the Auditor’s responsibilities for the audit of the consolidated financial statements section of our report. We are independent of the Group in accordance with the International Ethics Standards Board for Accountants’ Code of Ethics for Professional Accountants (IESBA Code), and we have fulfilled our other ethical responsibilities in accordance with the IESBA Code. We believe that the audit evidence we have obtained is sufficient and appropriate to provide a basis for our opinion. Key audit matters Key audit matters are those matters that, in our professional judgement, were of most significance in our audit of the consolidated financial statements for the year ended 31 December 2018. These matters were addressed in the context of our audit of the consolidated financial statements as a whole, and in forming our opinion thereon, and we do not provide a separate opinion on these matters. For each matter below, our description of how our audit addressed the matter is provided in that context. We have fulfilled the responsibilities described in the Auditor’s responsibilities for the audit of the consolidated financial statements section of our report, including in relation to these matters. Accordingly, our audit included the performance of procedures designed to respond to our assessment of the risks of material misstatement of the consolidated financial statements. The results of our audit procedures, including the procedures performed to address the matters below, provide the basis for our audit opinion on the accompanying consolidated financial statements.
1. VALUATION OF UNQUOTED EQUITY INVESTMENTS
Refer to notes 3 and 11 to the consolidated financial statements.
Independent Auditor’s Report To The Shareholders Of Trafco Group B.S.C.
ANNUAL REPORT 201814
2. ALLOWANCE FOR EXPECTED CREDIT LOSSES FOR TRADE RECEIVABLES
Refer to notes 3 and 13 to the consolidated financial statements.
Auditor’s Report
Other information included in the Group’s 2018 annual report Other information consists of the information included in the Group’s 2018 Annual Report, other than the consolidated financial statements and our auditor’s report thereon. The Board of Directors is responsible for the other information. Prior to the date of this auditors’ report, we obtained the report of the Board of Directors and the Report on Corporate Governance Code which form part of the annual report, and the remaining sections of the annual report are expected to be made available to us after that date. Our opinion on the consolidated financial statements does not cover the other information and we do not express any form of assurance conclusion thereon. In connection with our audit of the consolidated financial statements, our responsibility is to read the other information identified above when it becomes available and, in doing so, consider whether the other information is materially inconsistent with the consolidated financial statements or our knowledge obtained in the audit, or otherwise appears to be materially misstated. If, based on the work we have performed on the other information obtained prior to the date of the auditor’s report, we conclude that there is a material misstatement of this other information, we are required to report that fact. We have nothing to report in this regard. Responsibilities of the Board of Directors for the consolidated financial statements The Board of Directors is responsible for the preparation and fair presentation of the consolidated financial statements in accordance with IFRSs and for such internal control as the Board of Directors determines is necessary to enable the preparation of consolidated financial statements that are free from material misstatement, whether due to fraud or error. In preparing the consolidated financial statements, the Board of Directors is responsible for assessing the Group’s ability to continue as a going concern, disclosing, as applicable, matters related to going concern and using the going concern basis of accounting unless the Board of Directors either intends to liquidate the Group or to cease operations, or has no realistic alternative but to do so. Auditor’s responsibilities for the audit of the consolidated financial statements Our objectives are to obtain reasonable assurance about whether the consolidated financial statements as a whole are free from material misstatement, whether due to fraud or error, and to issue an auditor’s report that includes our opinion. Reasonable assurance is a high level of assurance, but is not a guarantee that an audit conducted in accordance with ISAs will always detect a material misstatement when it exists. Misstatements can arise from fraud or error and are considered material if, individually or in the aggregate, they could reasonably be expected to influence the economic decisions of users taken on the basis of these consolidated financial statements.
Key audit matter
The Group has gross trade receivables of BD 8,409,365, which accounts for 21% of the Group’s total assets. The allowance for expected credit losses as of 31 December 2018 is BD 665,592.
As of 1 January 2018, the Group adopted International Financial Reporting Standard (IFRS) 9: Financial instruments for the first time. The Group applied the simplified approach to measuring Expected Credit Losses (ECL) on trade receivables as allowed by IFRS 9. The determination of the ECL allowance for trade receivables involves estimates and assumptions in relation to loss rates based on past history of defaults, existing market conditions, segmentation of customers based on credit characteristics as well as forward looking estimates.
Due to the significance of trade receivables and subjectivity involved in the determination of ECL, this is considered as a key audit matter.
How our audit addressed the key audit matter
Our audit procedures included, among others:
(i) testing accuracy of ageing of trade receivables;
(ii) assessing the appropriateness of segmentation of customers based on credit characteristics;
(iii) assessing the Group’s ECL allowance policies including reasonableness of the inputs used; and
(iv) assessing the adequacy of the disclosures in relation to trade receivables and allowance for ECL.
Independent Auditor’s Report To The Shareholders Of Trafco Group B.S.C. (continued)
Report on the Audit of the Consolidated Financial Statements (continued)Key audit matters (continued)
ANNUAL REPORT 2018 15
As part of an audit in accordance with ISAs, we exercise professional judgement and maintain professional skepticism throughout the audit. We also: - Identify and assess the risks of material misstatement of the consolidated financial statements, whether due to fraud
or error, design and perform audit procedures responsive to those risks, and obtain audit evidence that is sufficient and appropriate to provide a basis for our opinion. The risk of not detecting a material misstatement resulting from fraud is higher than for one resulting from error, as fraud may involve collusion, forgery, intentional omissions, misrepresentations, or the override of internal control.
- Obtain an understanding of internal control relevant to the audit in order to design audit procedures that are appropriate in the circumstances, but not for the purpose of expressing an opinion on the effectiveness of the Group’s internal control.
- Evaluate the appropriateness of accounting policies used and the reasonableness of accounting estimates and related disclosures made by the Board of Directors.
- Conclude on the appropriateness of the Board of Directors’ use of the going concern basis of accounting and, based on the
audit evidence obtained, whether a material uncertainty exists related to events or conditions that may cast significant doubt on the Group’s ability to continue as a going concern. If we conclude that a material uncertainty exists, we are required to draw attention in our auditor’s report to the related disclosures in the consolidated financial statements or, if such disclosures are inadequate, to modify our opinion. Our conclusions are based on the audit evidence obtained up to the date of our auditor’s report. However, future events or conditions may cause the Group to cease to continue as a going concern.
- Evaluate the overall presentation, structure and content of the consolidated financial statements, including the disclosures,
and whether the consolidated financial statements represent the underlying transactions and events in a manner that achieves fair presentation.
- Obtain sufficient appropriate audit evidence regarding the financial information of the entities or business activities within
the Group to express an opinion on the consolidated financial statements. We are responsible for the direction, supervision and performance of the Group audit. We remain solely responsible for our audit opinion.
We communicate with the Board of Directors regarding, among other matters, the planned scope and timing of the audit and significant audit findings, including any significant deficiencies in internal control that we identify during our audit. We also provide the Board of Directors with a statement that we have complied with relevant ethical requirements regarding independence, and to communicate with them all relationships and other matters that may reasonably be thought to bear on our independence, and where applicable, related safeguards. From the matters communicated with the Board of Directors, we determine those matters that were of most significance in the audit of the consolidated financial statements of the current period and are therefore the key audit matters. We describe these matters in our auditor’s report unless law or regulation precludes public disclosure about the matter or when, in extremely rare circumstances, we determine that a matter should not be communicated in our report because the adverse consequences of doing so would reasonably be expected to outweigh the public interest benefits of such communication. Report on Other Legal and Regulatory Requirements We report that: a) as required by the Bahrain Commercial Companies Law: i) the Company has maintained proper accounting records and the consolidated financial statements are in agreement
therewith; ii) the financial information contained in the Report of the Board of Directors is consistent with the consolidated financial
statements; and iii) satisfactory explanations and information have been provided to us by management in response to all our requests; and
b) we are not aware of any violations of the Bahrain Commercial Companies Law, the Central Bank of Bahrain (CBB) Rule Book
(applicable provisions of Volume 6) and CBB directives, regulations and associated resolutions, rules and procedures of the Bahrain Bourse or the terms of the Company’s memorandum and articles of association during the year ended 31 December 2018 that might have had a material adverse effect on the business of the Group or on its consolidated financial position.
The Partner in charge of the audit resulting in this independent auditor’s report is Prasanth Govindapuram. Auditor’s Registration No. 212 27 February 2019Manama, Kingdom of Bahrain
Independent Auditor’s Report To The Shareholders Of Trafco Group B.S.C. (continued)
Report on the Audit of the Consolidated Financial Statements (continued)Auditor’s responsibilities for the audit of the consolidated financial statements (continued)
Auditor’s Report

ANNUAL REPORT 201816
Consolidated Statement of Income
The attached notes 1 to 34 form part of these consolidated financial statements.
2018 2017Note BD BD
(Restated)
Revenue from contracts with customers 5 39,521,811 39,866,114 Costs of revenue (31,159,974) (31,827,945)
GROSS PROFIT 8,361,837 8,038,169
Other operating income 201,291 132,917 Personnel costs 6 (3,639,893) (3,622,530)General and administrative expenses (1,328,614) (1,255,571)Selling and distribution expenses (829,344) (899,879)Depreciation 9 (399,547) (411,875)
PROFIT FROM OPERATIONS 2,365,730 1,981,231
Net investment income 7 575,214 879,227 Finance costs 6 (178,160) (206,028)Share of results of an associate 10 (174,044) (168,315)Foreign exchange gains - net 14,082 23,144 Impairment of non-trading investments 11 - (140,582)
PROFIT OF THE GROUP FOR THE YEAR 6 2,602,822 2,368,677 of which profit attributable to non-controlling interests (764,530) (694,206)
PROFIT FOR THE YEAR ATTRIBUTABLE TO THESHAREHOLDERS OF TRAFCO 1,838,292 1,674,471
BASIC AND DILUTED EARNINGS PER SHARE (FILS) 8 24 22
For the year ended 31 December 2018
Ebrahim Mohamed Ali Zainal Yusuf Saleh Abdulla Alsaleh Seethapathy SridharChairman Vice Chairman Group Chief Executive Officer

ANNUAL REPORT 2018 17
Consolidated Statement of Other Comprehensive Income
The attached explanatory notes 1 to 34 form part of these consolidated financial statements.
For the year ended 31 December 2018
Ebrahim Mohamed Ali Zainal Yusuf Saleh Abdulla Alsaleh Seethapathy SridharChairman Vice Chairman Group Chief Executive Officer
2018 2017Note BD BD
(Restated)
PROFIT OF THE GROUP FOR THE YEAR 2,602,822 2,368,677
Other comprehensive (loss) incomeOther comprehensive (loss) income to be reclassified to the
consolidated statement of income in subsequent years:
- Transfer of gain on disposals of non-trading investments to the consolidated statement of income - (347,684)
- Foreign exchange differences on translation of foreign operations (15,868) 25,811
Net other comprehensive loss to be reclassified to the consolidated statement of income in subsequent years (15,868) (321,873)
Other comprehensive income (loss) not to be reclassified to the consolidated statement of income in subsequent years:
- Net changes in fair value of non-trading investments classified as fair value through other comprehensive income 11 224,065 1,096,749 Net changes in fair value of associate's non-trading investments 10 6,655 (9,920)
Net other comprehensive income not to be reclassified to the consolidated statement of income in subsequent years 230,720 1,086,829
Other comprehensive income for the year 214,852 764,956
TOTAL COMPREHENSIVE INCOME OF THE GROUP FOR THE YEAR 2,817,674 3,133,633
of which total comprehensive income attributable to non-controlling interests (758,182) (706,498)
TOTAL COMPREHENSIVE INCOME FOR THE YEAR ATTRIBUTABLE TO THE SHAREHOLDERS OF TRAFCO 2,059,492 2,427,135

ANNUAL REPORT 201818
Consolidated Statement of Financial PositionAt 31 December 2018
The attached explanatory notes 1 to 34 form part of these consolidated financial statements.
2018 2017Note BD BD
ASSETS (Restated)
Non-current assetsProperty, plant and equipment 9 9,025,225 8,896,251 Investment in an associate 10 1,635,236 1,802,625 Non-trading investments 11 10,960,631 9,852,400
21,621,092 20,551,276 Current assetsInventories 13 7,729,203 8,160,086 Right of return assets 40,170 32,976 Trade and other receivables 14 8,377,042 8,298,885 Bank balances and cash 15 1,987,607 2,779,561
18,134,022 19,271,508 TOTAL ASSETS 39,755,114 39,822,784
EQUITY AND LIABILITIES
EquityShare capital 16 8,067,505 8,067,505 Treasury shares 17 (866,096) (834,008)Share premium 18 3,386,502 3,386,502 Statutory reserve 19 3,786,542 3,601,062 General reserve 20 1,365,000 1,315,000 Fair value reserve 21 5,232,400 5,740,819 Retained earnings - distributable 2,881,774 2,070,628 Retained earnings - non-distributable 22 353,474 272,949 Proposed appropriations 1,434,829 1,282,559
Equity attributable to the shareholders of Trafco 25,641,930 24,903,016 Non-controlling interests 29 3,106,227 2,705,208
Total equity 28,748,157 27,608,224
Non-current liabilitiesEmployees’ end of service benefits 24 1,332,663 1,303,829 Term loans 26 392,361 437,512 Retentions payable 9,005 - Loans from non-controlling interests 25 - 497,000
1,734,029 2,238,341 Current liabilitiesTrade and other payables 27 6,538,671 6,039,609 Import loans 28 2,299,147 2,946,277 Bank overdrafts 15 186,498 364,869 Contract and refund liabilities 166,052 167,135 Term loans 26 82,560 458,329
9,272,928 9,976,219
Total liabilities 11,006,957 12,214,560
TOTAL EQUITY AND LIABILITIES 39,755,114 39,822,784
Ebrahim Mohamed Ali Zainal Yusuf Saleh Abdulla Alsaleh Seethapathy SridharChairman Vice Chairman Group Chief Executive Officer

ANNUAL REPORT 2018 19
Consolidated Statement of Cash Flows
The attached explanatory notes 1 to 34 form part of these consolidated financial statements.
For the year ended 31 December 2018
2018 2017Note BD BD
(Restated)OPERATING ACTIVITIESProfit of the Group for the year 2,602,822 2,368,677 Adjustments for:
Finance costs 6 178,160 206,028 Gain on disposals of property, plant and equipment 6 (31,570) (2,833)Net investment income 7 (575,214) (879,227)Depreciation 9 967,528 1,041,489 Share of results of an associate 10 174,044 168,315 Impairment of non-trading investments 11 - 140,582 Provision for slow moving and obsolete of inventories 13 62,970 71,312 Allowance for expected credit losses 14 78,506 85,512 Provision for employees’ end of service benefits 24 177,117 192,735
Operating profit before changes in working capital 3,634,363 3,392,590 Working capital changes:
Inventories 367,913 617,414 Right of return assets (7,194) 3,297 Trade and other receivables (223,941) 203,536 Trade and other payables 546,982 208,217 Contract and refund liabilities (1,083) 20,309
Cash generated from operations 4,317,040 4,445,363 Directors' remuneration paid (107,625) (112,750)Employees’ end of service benefits paid 24 (148,283) (105,271)
Net cash flows from operating activities 4,061,132 4,227,342
INVESTING ACTIVITIESAdditions to property, plant and equipment (1,038,607) (1,454,222)Proceeds from disposals of property, plant and equipment 36,980 5,399 Purchase of non-trading investments 11 (884,166) (193,677)Proceeds from disposals of non-trading investments - 757,998 Return of capital on non-trading investments 11,365 15,000 Dividends received 575,195 540,688
Net cash flows used in investing activities (1,299,233) (328,814)
FINANCING ACTIVITIESDividends paid 32 (1,227,494) (1,305,337)Term loans availed 32 500,000 750,000 Repayment of term loans 32 (920,920) (470,611)Import loans availed 32 10,612,868 12,371,364 Repayment of import loans 32 (11,259,998) (12,494,931)Repayment of loans from non-controlling interests 32 (497,000) - Dividend paid to non-controlling interests (357,162) - Finance costs paid (177,820) (205,788)Purchase of treasury shares (32,088) -
Net cash flows used in financing activities (3,359,614) (1,355,303)
NET (DECREASE) INCREASE IN CASH AND CASH EQUIVALENTS (597,715) 2,543,225 Net foreign exchange translation differences (15,868) 25,811 Cash and cash equivalents at 1 January 2,414,692 (154,344)
CASH AND CASH EQUIVALENTS AT 31 DECEMBER 15 1,801,109 2,414,692
Non-cash transactions- Unclaimed dividends pertaining to prior years amounting to BD 5,065 (2017: BD 4,257) have been excluded from the
movement of trade and other payables above. - Additions to property, plant and equipment and movements of trade and other payables and retentions payable
exclude amount payable to a contractor of BD 63,305 (2017: nil).

ANNUAL REPORT 201820 ANNUAL REPORT 201820
For the year ended 31 December 2018
The attached explanatory notes 1 to 34 form part of these consolidated financial statements.
Consolidated Statement of Changes in Equity
Attributable to the shareholders of Trafco Attributable to the shareholders of Trafco
Reserves Reserves
Retained Retained Non-Share Treasury Share Statutory General Fair value earnings - earnings-non Proposed Total Shareholders' controlling Total capital shares premium reserve reserve reserve distributable distributable appropriations reserves equity interests equity
Note BD BD BD BD BD BD BD BD BD BD BD BD BD
Balance at 1 January 2018 (as previously reported)
8,067,505 (834,008) 3,386,502 3,601,062 1,315,000 5,740,819 2,184,791 272,949 1,282,559 14,397,180 25,017,179 2,708,756 27,725,935
Impact of adoption IFRS 9 and IFRS 15
2 - - - - - (729,619) 655,785 - - (73,834) (73,834) (3,549) (77,383)
Other restatements 30 - - - - - - (107,625) - - (107,625) (107,625) - (107,625)
Balance at 1 January 2018 (restated) 8,067,505 (834,008) 3,386,502 3,601,062 1,315,000 5,011,200 2,732,951 272,949 1,282,559 14,215,721 24,835,720 2,705,207 27,540,927
Profit for the year - 2018 - - - - - - 1,838,292 - - 1,838,292 1,838,292 764,530 2,602,822
Other comprehensive income (loss) - - - - - 221,200 - - - 221,200 221,200 (6,348) 214,852
Total comprehensive income for the year
- - - - - 221,200 1,838,292 - - 2,059,492 2,059,492 758,182 2,817,674
Dividend to non-controlling interests 29 - - - - - - - - - - - (357,162) (357,162)
Recovery of impairment of an equity investment
- - - - - - 11,365 - - 11,365 11,365 - 11,365
Purchase of treasury shares - (32,088) - - - - - - - - (32,088) - (32,088)2017 Appropriations:
- General reserve - 2017 20 - - - - 50,000 - - - (50,000) - - - - - Dividends paid - 2017 23 - - - - - - - - (1,232,559) (1,232,559) (1,232,559) - (1,232,559)
2018 - Proposed appropriations:- General reserve - 2018 20 - - - - - - (50,000) - 50,000 - - - - - Proposed dividend - 2018 23 - - - - - - (1,384,829) - 1,384,829 - - - -
Transfer to statutory reserve 19 - - - 185,480 - - (185,480) - - - - - -
Transfer by a subsidiary 22 - - - - - - (80,525) 80,525 - - - - -
Balance at 31 December 2018 8,067,505 (866,096) 3,386,502 3,786,542 1,365,000 5,232,400 2,881,774 353,474 1,434,829 15,054,019 25,641,930 3,106,227 28,748,157

ANNUAL REPORT 2018 21ANNUAL REPORT 2018 21
For the year ended 31 December 2018
The attached explanatory notes 1 to 34 form part of these consolidated financial statements.
Consolidated Statement of Changes in Equity
Attributable to the shareholders of Trafco Attributable to the shareholders of Trafco
Reserves Reserves
Retained Retained Non-Share Treasury Share Statutory General Fair value earnings - earnings-non Proposed Total Shareholders' controlling Total capital shares premium reserve reserve reserve distributable distributable appropriations reserves equity interests equity
Note BD BD BD BD BD BD BD BD BD BD BD BD BD
Balance at 1 January 2018 (as previously reported)
8,067,505 (834,008) 3,386,502 3,601,062 1,315,000 5,740,819 2,184,791 272,949 1,282,559 14,397,180 25,017,179 2,708,756 27,725,935
Impact of adoption IFRS 9 and IFRS 15
2 - - - - - (729,619) 655,785 - - (73,834) (73,834) (3,549) (77,383)
Other restatements 30 - - - - - - (107,625) - - (107,625) (107,625) - (107,625)
Balance at 1 January 2018 (restated) 8,067,505 (834,008) 3,386,502 3,601,062 1,315,000 5,011,200 2,732,951 272,949 1,282,559 14,215,721 24,835,720 2,705,207 27,540,927
Profit for the year - 2018 - - - - - - 1,838,292 - - 1,838,292 1,838,292 764,530 2,602,822
Other comprehensive income (loss) - - - - - 221,200 - - - 221,200 221,200 (6,348) 214,852
Total comprehensive income for the year
- - - - - 221,200 1,838,292 - - 2,059,492 2,059,492 758,182 2,817,674
Dividend to non-controlling interests 29 - - - - - - - - - - - (357,162) (357,162)
Recovery of impairment of an equity investment
- - - - - - 11,365 - - 11,365 11,365 - 11,365
Purchase of treasury shares - (32,088) - - - - - - - - (32,088) - (32,088)2017 Appropriations:
- General reserve - 2017 20 - - - - 50,000 - - - (50,000) - - - - - Dividends paid - 2017 23 - - - - - - - - (1,232,559) (1,232,559) (1,232,559) - (1,232,559)
2018 - Proposed appropriations:- General reserve - 2018 20 - - - - - - (50,000) - 50,000 - - - - - Proposed dividend - 2018 23 - - - - - - (1,384,829) - 1,384,829 - - - -
Transfer to statutory reserve 19 - - - 185,480 - - (185,480) - - - - - -
Transfer by a subsidiary 22 - - - - - - (80,525) 80,525 - - - - -
Balance at 31 December 2018 8,067,505 (866,096) 3,386,502 3,786,542 1,365,000 5,232,400 2,881,774 353,474 1,434,829 15,054,019 25,641,930 3,106,227 28,748,157

ANNUAL REPORT 201822 ANNUAL REPORT 201822
For the year ended 31 December 2018
Consolidated Statement of Changes in Equity
Attributable to the shareholders of Trafco Attributable to the shareholders of Trafco
Reserves Reserves
Retained Retained Non-Share Treasury Share Statutory General Fair value earnings - earnings-non Proposed Total Shareholders' controlling Total capital shares premium reserve reserve reserve distributable distributable appropriations reserves equity interests equity
Note BD BD BD BD BD BD BD BD BD BD BD BD BD
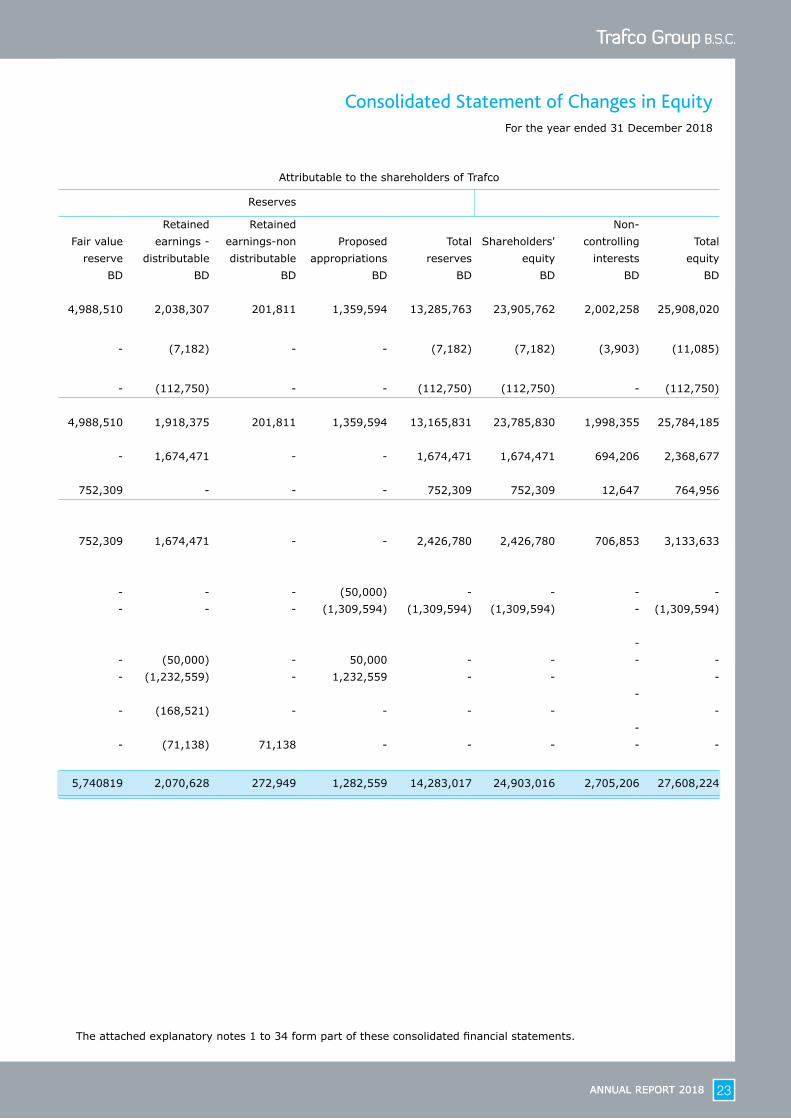
Balance at 1 January 2017 8,067,505 (834,008) 3,386,502 3,432,541 1,265,000 4,988,510 2,038,307 201,811 1,359,594 13,285,763 23,905,762 2,002,258 25,908,020
Impact of adoption of IFRS 15 2 - - - - - - (7,182) - - (7,182) (7,182) (3,903) (11,085)
Other restatements 30 - - - - - - (112,750) - - (112,750) (112,750) - (112,750)
Balance at 1 January 2017 (restated) 8,067,505 (834,008) 3,386,502 3,432,541 1,265,000 4,988,510 1,918,375 201,811 1,359,594 13,165,831 23,785,830 1,998,355 25,784,185
Profit for the year - 2017 (restated) - - - - - - 1,674,471 - - 1,674,471 1,674,471 694,206 2,368,677
Other comprehensive income - - - - - 752,309 - - - 752,309 752,309 12,647 764,956
Total comprehensiveincome for the year (restated) - - - - - 752,309 1,674,471 - - 2,426,780 2,426,780 706,853 3,133,633
2016 Appropriations:- General reserve - 2016 20 - - - - 50,000 - - - (50,000) - - - - - Dividends paid - 2016 23 - - - - - - - - (1,309,594) (1,309,594) (1,309,594) - (1,309,594)
2017 - Proposed appropriations: - - General reserve -2017 20 - - - - - - (50,000) - 50,000 - - - - - Dividends - 2017 23 - - - - - - (1,232,559) - 1,232,559 - - -
- Transfer to statutory reserve 19 - - - 168,521 - - (168,521) - - - - -
- Transfer by a subsidiary 22 - - - - - - (71,138) 71,138 - - - - -
Balance at 31 December 2017 (restated) 8,067,505 (834,008) 3,386,502 3,601,062 1,315,000 5,740819 2,070,628 272,949 1,282,559 14,283,017 24,903,016 2,705,206 27,608,224
The attached explanatory notes 1 to 34 form part of these consolidated financial statements.
ANNUAL REPORT 2018 23ANNUAL REPORT 2018 23
For the year ended 31 December 2018
Consolidated Statement of Changes in Equity
Attributable to the shareholders of Trafco Attributable to the shareholders of Trafco
Reserves Reserves
Retained Retained Non-Share Treasury Share Statutory General Fair value earnings - earnings-non Proposed Total Shareholders' controlling Total capital shares premium reserve reserve reserve distributable distributable appropriations reserves equity interests equity
Note BD BD BD BD BD BD BD BD BD BD BD BD BD
Balance at 1 January 2017 8,067,505 (834,008) 3,386,502 3,432,541 1,265,000 4,988,510 2,038,307 201,811 1,359,594 13,285,763 23,905,762 2,002,258 25,908,020
Impact of adoption of IFRS 15 2 - - - - - - (7,182) - - (7,182) (7,182) (3,903) (11,085)
Other restatements 30 - - - - - - (112,750) - - (112,750) (112,750) - (112,750)
Balance at 1 January 2017 (restated) 8,067,505 (834,008) 3,386,502 3,432,541 1,265,000 4,988,510 1,918,375 201,811 1,359,594 13,165,831 23,785,830 1,998,355 25,784,185
Profit for the year - 2017 (restated) - - - - - - 1,674,471 - - 1,674,471 1,674,471 694,206 2,368,677
Other comprehensive income - - - - - 752,309 - - - 752,309 752,309 12,647 764,956
Total comprehensiveincome for the year (restated) - - - - - 752,309 1,674,471 - - 2,426,780 2,426,780 706,853 3,133,633
2016 Appropriations:- General reserve - 2016 20 - - - - 50,000 - - - (50,000) - - - - - Dividends paid - 2016 23 - - - - - - - - (1,309,594) (1,309,594) (1,309,594) - (1,309,594)
2017 - Proposed appropriations: - - General reserve -2017 20 - - - - - - (50,000) - 50,000 - - - - - Dividends - 2017 23 - - - - - - (1,232,559) - 1,232,559 - - -
- Transfer to statutory reserve 19 - - - 168,521 - - (168,521) - - - - -
- Transfer by a subsidiary 22 - - - - - - (71,138) 71,138 - - - - -
Balance at 31 December 2017 (restated) 8,067,505 (834,008) 3,386,502 3,601,062 1,315,000 5,740819 2,070,628 272,949 1,282,559 14,283,017 24,903,016 2,705,206 27,608,224
The attached explanatory notes 1 to 34 form part of these consolidated financial statements.
ANNUAL REPORT 201824
1 CORPORATE INFORMATION Trafco Group B.S.C. (‘the Company’ or ‘Trafco’ or ‘the parent company’) is a public joint stock company, the shares of which are listed and publicly traded on Bahrain Bourse. The Company was incorporated in the Kingdom of Bahrain by Amiri Decree No. 10 of November 1977. The Company operates in accordance with the provisions of the Bahrain Commercial Companies Law under commercial registration (CR) number 8500 issued by the Ministry of Industry, Commerce and Tourism. The postal address of the Company’s registered office is PO Box 20202, Manama, Kingdom of Bahrain. The Company’s principal activity is trading in food products.
The consolidated financial statements were authorised for issue in accordance with a resolution of the Board of Directors on 27 February 2019. The Group comprises of the Company and its following subsidiaries and associates:
* Effective ownership. Owned by Awal Dairy Company W.L.L. Except for Awal Dairy Company W.L.L. and its subsidiary Kuwait Bahrain Dairy Company W.L.L. which have 30 September financial year-ends, the financial year-end of all the remaining subsidiaries and associates is 31 December. The Group operates in the Kingdom of Bahrain and in the State of Kuwait through its subsidiary.
2 SIGNIFICANT ACCOUNTING POLICIES Basis of preparation The consolidated financial statements are prepared under the historical cost convention, except for non-trading investments that have been measured at fair value. The consolidated financial statements have been presented in Bahraini Dinars (BD) which is the functional currency of the Company and the presentation currency of the Group.
Country ofincorporation
Ownership interest
Relationship / name 2018 2017 Principal activities
Subsidiaries
Bahrain Water Bottling & Beverages Company S.P.C.
Kingdom of Bahrain 100% 100% Producing, bottling and marketing of sweet drinking water and beverages.
Bahrain Fresh Fruits Com-pany S.P.C.
Kingdom of Bahrain 100% 100% Trading in fresh fruits, vegetables and other food products.
Metro Markets Company S.P.C.
Kingdom of Bahrain 100% 100% Trading in food items and beverages.
Trafco Logistics Company S.P.C.
Kingdom of Bahrain 100% 100% Providing storage and logistics services.
Awal Dairy Company W.L.L. Kingdom of Bahrain 51% 51% Production and supply of milk, juices, ice cream and tomato paste.
Kuwait Bahrain Dairy Com-pany W.L.L.
State of Kuwait 50%* 50%* Marketing and supply of milk, juices and associated products.
Associates
Bahrain Livestock Company B.S.C. (c)
Kingdom of Bahrain 36.26% 36.26% Import of both livestock and chilled meat.
Qatari Bahraini Food Trading Co. L.L.C.
State of Qatar 50% 50% Under liquidation.
At 31 December 2018
Notes to the Consolidated Financial Statements

ANNUAL REPORT 2018 25
2 SIGNIFICANT ACCOUNTING POLICIES (continued) Statement of compliance The consolidated financial statements of the Group have been prepared in accordance with International Financial Reporting Standards (IFRS), as issued by the International Accounting Standards Board (IASB), and in conformity with the Bahrain Commercial Companies Law, the Central Bank of Bahrain (CBB) Rule Book (applicable provisions of Volume 6) and CBB directives, regulations and associated resolutions, rules and procedures of the Bahrain Bourse. Basis of consolidation The consolidated financial statements comprise the financial statements of the Company and its subsidiaries as at 31 December 2018. Control is achieved when the Group is exposed, or has rights, to variable returns from its involvement with the investee and has the ability to affect those returns through its power over the investee. Specifically, the Group controls an investee if and only if the Group has:
- power over the investee (i.e. existing rights that give it the current ability to direct the relevant activities of the investee);
- exposure, or rights, to variable returns from its involvement with the investee; and - the ability to use its power over the investee to affect its returns.
Generally, there is a presumption that a majority of voting rights results in control. To support this presumption and when the Group has less than a majority of the voting or similar rights of an investee, the Group considers all relevant facts and circumstances in assessing whether it has power over an investee, including:
- the contractual arrangement with the other vote holders of the investee; - rights arising from other contractual arrangements; and - the Group’s voting rights and potential voting rights.
The Group re-assesses whether or not it controls an investee if facts and circumstances indicate that there are changes to one or more of the three elements of control. Consolidation of a subsidiary begins when the Group obtains control over the subsidiary and ceases when the Group loses control of the subsidiary. Assets, liabilities, income and expenses of a subsidiary acquired or disposed of during the year are included in the consolidated financial statements from the date the Group obtains control until the date the Group ceases to control the subsidiary. Profit or loss and each component of other comprehensive income are attributed to the shareholders of the parent of the Group and to the non-controlling interests, even if this results in the non-controlling interests having a deficit balance. When necessary, adjustments are made to the financial statements of subsidiaries to bring their accounting policies into line with the Group’s accounting policies. All intra-group assets and liabilities, equity, income, expenses, cash flows and unrealised gains or losses relating to transactions between members of the Group are eliminated in full on consolidation. A change in the ownership interest of a subsidiary, without a loss of control, is accounted for as an equity transaction. If the Group losses control over a subsidiary, it derecognises the related assets (including goodwill), liabilities, non-controlling interest and other components of equity while any resultant gain or loss is recognised in the consolidated statement of income. Any investment retained is recognised at fair value. New and amended standards and interpretations effective as of 1 January 2018 The accounting and reporting policies adopted in the preparation of these consolidated financial statements are consistent with those used in the previous year, except for certain new standards and interpretations and amendments to standards and interpretations adopted by the Group as of 1 January 2018. The Group has not early adopted any other standard, interpretation or amendment that has been issued but is not yet effective. The nature and the impact of each new standard or amendment which management concluded has an impact for the Group is described below:
At 31 December 2018
Notes to the Consolidated Financial Statements

ANNUAL REPORT 201826
2 SIGNIFICANT ACCOUNTING POLICIES (continued)
New and amended standards and interpretations effective as of 1 January 2018 (continued)
The Group applied, for the first time, IFRS 9 Financial Instruments and IFRS 15 Revenue from Contracts with Customers. The nature and effect of the changes as a results of adoption of new standards are disclosed below.
IFRS 9 Financial Instruments IFRS 9 Financial Instruments replaces IAS 39 Financial Instruments: Recognition and Measurement for annual periods beginning on or after 1 January 2018, bringing together all three aspects of the accounting for financial instruments: classification and measurement, impairment and hedge accounting. For the Group, classification and measurement and impairment aspects of IFRS 9 had an impact. Since the Group does not enter into derivative contracts, hedge accounting aspect had no impact. The Group has applied IFRS 9 prospectively at the initial application date of 1 January 2018, without restating comparatives which continues to be presented under IAS 39. The adoption of IFRS 9 impacted the reclassification of the Group’s investments in equity instruments from ‘available-for-sale’ to ‘fair value through other comprehensive income’ (FVOCI). Classification and measurement of financial instruments IFRS 9 requires all financial assets to be classified and subsequently measured at either amortised cost or fair value on the basis of the entity’s business model for managing the assets and whether the instruments’ contractual cash flows represent ‘solely payments of principal and interest’ on the principal amount outstanding (the ‘SPPI criterion’). Financial assets at fair value through other comprehensive income (FVOCI) (i) Equity instruments On initial recognition, the Group made an irrevocable election (on an instrument-by-instrument basis) to designate investments in equity instruments as FVOCI if the equity investment is not held for trading. A financial asset or financial liability is held for trading if: (a) it is acquired or incurred principally for the purpose of selling or repurchasing it in the near term;
(b) on initial recognition it is part of a portfolio of identified financial instruments that are managed together and for
which there is evidence of a recent actual pattern of short-term profit taking; or
(c) it is a derivative (except for derivative that is a financial guarantee contract or a designated and effective hedging instrument).
The Board of Directors believes that designating the non-trading investments as FVOCI provides a more meaningful presentation for medium or long-term strategic investments, than reflecting changes in fair value in the consolidated statement of income. Investment in equity instruments at FVOCI are initially measured at fair value plus transaction costs. Subsequently, these are measured at fair value with gains and losses arising from changes in fair value recognised in other comprehensive income and “Fair value reserve” within the consolidated statement of changes in equity. The cumulative gains or losses are never recycled to the consolidated statement of income on disposal of equity investments. Dividends on FVOCI investments in equity instruments continue to be recognised in the consolidated statement of income when the Group’s right to receive the dividends is established, unless the dividends clearly recover part of the cost of the investment in equity instruments. (ii) Debt instruments The Group measures debt instruments at FVOCI if both of the following conditions are met:
- the financial asset is held within a business model with the objective of both holding to collect contractual cash flows and selling; and
At 31 December 2018
Notes to the Consolidated Financial Statements
ANNUAL REPORT 2018 27
2 SIGNIFICANT ACCOUNTING POLICIES (continued)
New and amended standards and interpretations effective as of 1 January 2018 (continued)
IFRS 9 Financial Instruments (continued) Classification and measurement of financial instruments (continued) Financial assets at fair value through other comprehensive income (FVOCI) (continued)
- the contractual terms of the financial asset give rise on specified dates to cash flows that are solely payments of principal and interest on the principal amount outstanding.
For debt instruments at FVOCI, interest income, foreign exchange revaluation and impairment losses or reversals of impairment losses are recognised in the consolidated statement of income and computed in the same manner as for financial assets measured at amortised cost. The remaining fair value changes are recognised in the consolidated statement of comprehensive income. Upon derecognition, the cumulative fair value change recognised in the consolidated statement of comprehensive income is recycled to the consolidated statement of income. Financial assets measured at amortised cost All other financial assets including trade receivables are initially recognised in accordance with the requirements of IFRS and are subsequently measured at amortised cost, depending on the classification of the financial assets as described below: A financial asset is classified as ‘amortised cost’ only if both of the following criteria are met: - the asset is held within a business model whose objective is to hold financial assets in order to collect contractual
cash flows; and
- the contractual terms of the instrument give rise on specified dates to cash flows that are solely payments of principal and interest on the principal amount outstanding.
Financial assets meeting these criteria are measured initially at fair value plus transaction costs that are directly attributable to the acquisition of the financial assets. These are subsequently measured at amortised cost using the effective interest method (EIR) less any impairment. Gains and losses on disposal or impairment are recognised in the consolidated statement of income. Impairment of financial assets The adoption of IFRS 9 has changed the Group’s accounting for impairment losses for financial assets by replacing IAS 39’s ‘incurred loss’ approach with a ‘forward-looking expected credit loss’ (ECL) approach. IFRS 9 requires the Group to record an allowance for ECLs for all loans and other debt financial assets not held at fair value through profit or loss (FVTPL). ECLs are based on the difference between the contractual cash flows due in accordance with the contract and all the cash flows (including those arising from any credit enhancements that are part of the contract) that the Group expects to receive. The shortfall is then discounted at an approximation to the asset’s original effective interest rate. For ‘Trade and other receivables’, the Group has applied the Standard’s simplified approach and has calculated ECLs based on lifetime expected credit losses. The Group has established a provision matrix that is based on the Group’s historical credit loss experience, adjusted for forward-looking factors specific to the debtors and the economic environment. The Group considers a financial asset to be in default when internal or external information indicates that the Group is unlikely to receive the outstanding contractual amounts in full before taking into account any credit enhancements held by the Group.
At 31 December 2018
Notes to the Consolidated Financial Statements

ANNUAL REPORT 201828
2 SIGNIFICANT ACCOUNTING POLICIES (continued) New and amended standards and interpretations effective as of 1 January 2018 (continued) IFRS 9 Financial Instruments (continued) The impact of adoption of IFRS 9 on the Group’s consolidated financial statements is presented below: Transition Changes in accounting policies resulting from the adoption of IFRS 9 have been applied prospectively and the comparative information has not been restated. The difference in the carrying amounts of financial assets resulting from the adoption of IFRS 9 are recognised in ‘Retained earnings - distributable’ as at 1 January 2018. Accordingly, the financial information presented for 2017 does not reflect the requirements of IFRS 9 and therefore may not comparable to the financial information presented for 2018 under IFRS 9.
i) Reconciliation of carrying amounts of financial assets as at 31 December 2017 and 1 January 2018 The following table reconciles the carrying amounts of financial assets as of 31 December 2017 to the carrying amounts determined by applying IFRS 9 on 1 January 2018:
Carrying Re- Allowance Carryingvalue as at classification for expected value as at
31 December of financial credit losses 1 January2017 assets (ECL) 2018
BD BD BD BDFinancial assets
Available-for-sale investments 9,852,400 (9,852,400) - -
Non-trading investments at FVOCI - 9,852,400 - 9,852,400
Trade and other receivables 8,298,885 - (67,305) 8,231,580
Cash, bank balances and short-term deposits 2,779,561 - - 2,779,561
20,930,846 - (67,305) 20,863,541
ii) Impact on total reserves and non-controlling interests Non-
Total controlling
reserves interests
BD BD
14,397,180 2,708,756
Recognition of allowance for impairment under IFRS 9 (67,305) -
Net impact on adoption of IFRS 15 (6,529) (3,549)
(73,834) (3,549)
Restated opening balance as at 1 January 2018 14,323,346 2,705,207
iii) Reconciliation of allowance recorded as at 31 December 2017 and 1 January 2018 The following table reconciles the previously recorded allowance for impairment of trade receivables as at 31 December 2017 to the revised allowance for expected credit losses as of 1 January 2018 on transition to IFRS 9:
As at 31 December Transition As at 1 January
2017 adjustment 2018BD BD BD
Allowance / ECL relating to:
Trade and other receivables 589,431 67,305 656,736
At 31 December 2018
Notes to the Consolidated Financial Statements

ANNUAL REPORT 2018 29
2 SIGNIFICANT ACCOUNTING POLICIES (continued) New and amended standards and interpretations effective as of 1 January 2018 (continued)
IFRS 15 Revenue from Contracts with Customers IFRS 15 supersedes IAS 11 Construction Contracts, IAS 18 Revenue and related interpretations and it applies to all revenue arising from contracts with customers, unless those contracts are in the scope of other standards. The new standard establishes a five-step model to account for revenue arising from contracts with customers. Under IFRS 15, revenue is recognised at an amount that reflects the consideration to which an entity expects to be entitled in exchange for transferring goods or services to a customer. IFRS 15 requires entities to exercise judgement, taking into consideration all of the relevant facts and circumstances when applying each step of the model to contracts with their customers. The standard also specifies the accounting for the incremental costs of obtaining a contract and the costs directly related to fulfilling a contract. The Group adopted IFRS 15 using full retrospective method of adoption. The effect of transition on the current period has not been disclosed as the standard provides an optional practical expedient. The Group did not apply any of the other available optional practical expedients. The Group’s revenue from contracts with customers arises from sale of goods and rendering of services. The specific revenue recognition policies in respect of these contracts with customers are presented below: (i) Sale of goods The Group’s contracts with customers for the sale of goods generally include one performance obligation. The Group has concluded that revenue from sale of goods should be recognised at the point in time when control of the asset is transferred to the customer (generally on delivery of goods). Therefore, the adoption of IFRS 15 did not have an impact on the timing of revenue recognition. The transaction price of the goods sold is determined taking into account the effects of variable consideration (refer below). The Group has concluded that its contracts with customers do not involve significant financing components or non-cash considerations. Variable consideration Certain contracts for the sale of goods provide customers with right of return, volume rebates and display fees. Under IFRS 15, rights of return, volume rebates and display fees give rise to variable consideration. The variable consideration is estimated at contract inception and constrained until the associated uncertainty is subsequently resolved. The application of the constraint on variable consideration increases the amount of revenue that will be deferred. a) Rights of return When a contract provides a customer with a right to return the goods within a specified period, the Group estimates expected returns using a probability-weighted average. Prior to adoption of IFRS 15, the amount of revenue related to the expected returns was deferred and recognised in the statement of financial position within ‘Trade and other payables’ with a corresponding adjustment to ‘Cost of sales’. The initial carrying amount of goods expected to be returned was included within ‘Inventories’. Under IFRS 15, the consideration received from the customer is variable because the contract allows the customer to return the products. The Group uses the expected value method to estimate the goods that will be returned because this method best predicts the amount of variable consideration to which the Group will be entitled. The Group applies the requirements in IFRS 15 on constraining estimates of variable consideration to determine the amount of variable consideration that can be included in the transaction price. The Group presents a refund liability and an asset for the right to recover products from a customer separately in the consolidated statement of financial position. Upon adoption of IFRS 15, the Group reclassified ‘Trade and other payables’ to ‘Contract and refund liabilities’ and ‘Inventories’ to ‘Right of return assets’ as at 1 January 2017. In addition, the remeasurement resulted in additional ‘Contract and refund liabilities’ and ‘Right of return assets’ in the consolidated statement of financial position as at 1 January 2017. The Group determined the amounts of ‘Refund liabilities’ and ‘Right of return assets’ and the net effect was adjusted in ‘Retained earnings’ in the consolidated statement of changes in equity.
At 31 December 2018
Notes to the Consolidated Financial Statements

ANNUAL REPORT 201830
2 SIGNIFICANT ACCOUNTING POLICIES (continued) New and amended standards and interpretations effective as of 1 January 2018 (continued) IFRS 15 Revenue from Contracts with Customers (continued) (i) Sale of goods (continued) Variable consideration (continued) a) Rights of return (continued) The consolidated statement of financial position as at 31 December 2017 was restated resulting in recognition of ‘Right of return assets’ and ‘Contract and refund liabilities’ of BD 32,976 and BD 43,054 respectively and decreases in ‘Trade and other payables’, ‘Inventories’ and ‘Retained earnings - distributable’ of BD 43,054, BD 32,976 and BD 10,078 respectively. The consolidated statement of income for the year ended 31 December 2017 was also restated resulting in decreases in ‘Revenue from contracts with customers’ and ‘Costs of revenue’ of BD 43,054 and BD 32,976 respectively. b) Volume rebates The Group provides retrospective volume rebates to its customers on certain products purchased by the customer once the quantity of products purchased during the period exceeds a threshold specified in the contract. Rebates are offset against amounts payable by the customer. Under IFRS 15, retrospective volume rebates give rise to variable consideration. The Group estimates the variable consideration to which it will be entitled by applying the ‘most likely amount method’ for contracts with a single volume threshold and the ‘expected value method’ for contracts with more than one volume threshold. The selected method that best predicts the amount of variable consideration was primarily driven by the number of volume thresholds contained in the contract. The Group then applies the requirements on constraining estimates of variable consideration and recognises a refund liability for the expected future rebates. Upon adoption of IFRS 15, the Group recognised ‘Contract and refund liabilities’ for the expected future rebates, derecognised the provision for rebates previously recognised under ‘Trade and other payables’ and adjusted the ‘Retained earnings’ for the difference. The consolidated statement of financial position as at 31 December 2017 was restated resulting in recognition of ‘Contract and refund liabilities’ of BD 124,081 and decreases in ‘Trade and other payables’ of BD 124,081. The consolidated statement of income for the year ended 31 December 2017 was also restated resulting in a decrease in ‘Revenue from contracts with customers’ and ‘Selling and distribution expenses’ of BD 822,592. c) Display fees The Group pays display fees to its customers for renting of shelf for displaying its products. Display fees are offset against amounts payable by the customer. Under IFRS 15, display fees give rise to variable consideration which the Group applies by reducing the revenue. The consolidated statement of income for the year ended 31 December 2017 was restated in respect of display fees resulting in a decrease in ‘Revenue from contracts with customers’ and ‘Selling and distribution expenses’ of BD 282,962.
(ii) Rendering of services Revenue from rendering of services is recognised when the outcome of the transaction can be estimated reliably, by reference to the stage of completion of the transaction at the reporting date. Under IFRS 15, the Group concluded that revenue for rendering of services continue to be recognised over time using relevant input methods. The Group’s revenue from rendering of services mainly relates to storage income which was previously presented separately in the consolidated statement of income. Upon adoption of IFRS 15, storage income, which was separately disclosed in prior year, is presented under revenue from contracts with customers. IFRIC 22 Foreign Currency Transactions and Advance Consideration The Interpretation clarifies that, in determining the spot exchange rate to use on initial recognition of the related asset, expense or income (or part of it) on the derecognition of a non-monetary asset or non-monetary liability relating to
At 31 December 2018
Notes to the Consolidated Financial Statements
ANNUAL REPORT 2018 31
2 SIGNIFICANT ACCOUNTING POLICIES (continued) New and amended standards and interpretations effective as of 1 January 2018 (continued) IFRS 15 Revenue from Contracts with Customers (continued)
IFRIC 22 Foreign Currency Transactions and Advance Consideration (continued)
advance consideration, the date of the transaction is the date on which an entity initially recognises the non-monetary asset or non-monetary liability arising from the advance consideration. If there are multiple payments or receipts in advance, then the entity must determine the date of the transactions for each payment or receipt of advance consideration. This Interpretation does not have any impact on the Group’s consolidated financial statements. Several other new standards and interpretations and amendments to standards and interpretations applied for the first time in 2017. However, they did not impact the consolidated financial statements of the Group. Foreign currency transactions The Group’s consolidated financial statements are presented in Bahraini Dinars (BD) which is also the Company’s functional currency. For each entity, the Group determines the functional currency and items included in the financial statements of each entity are measured using that functional currency. The Group uses the direct method of consolidation and has elected to recycle to the consolidated statement of income the gain or loss that arises from using this method. Transactions and balances Transactions in foreign currencies are initially recorded at their respective functional currency spot rates at the date the transaction first qualifies for recognition. Monetary assets and liabilities denominated in foreign currencies are retranslated at the functional currency spot rate of exchange at the reporting date. All differences arising on settlement or translation of monetary items are taken to the consolidated statement of income. Non-monetary items that are measured in terms of historical cost in a foreign currency are translated using the exchange rates as at the dates of the initial transactions. Non-monetary items measured at fair value in a foreign currency are translated using the exchange rates at the date when the fair value is determined. The gain or loss arising on retranslation of non-monetary items is treated in line with the recognition of gain or loss on change in fair value of the item (i.e., translation differences on items whose fair value gain or loss is recognised in the consolidated statement of comprehensive income or the consolidated statement of income is also recognised in the consolidated statement of comprehensive income or the consolidated statement of income, respectively). Group companies On consolidation, the assets and liabilities of foreign operations are translated into BD at the rate of exchange prevailing at the reporting date and their statements of income are translated at the weighted average exchange rates for the year. The exchange differences arising on the translation for consolidation are recognised in the consolidated statement of comprehensive income. On disposal of a foreign operation, the component recognised in the consolidated statement of comprehensive income relating to that particular foreign operation is recognised in the consolidated statement of income. Revenue Revenue from contract with customers The Group is in the business of production, marketing and trading in food products and beverages and providing storage and logistics services. Revenue from contracts with customers is recognised when control of the goods or services are transferred to the customer at an amount that reflects the consideration to which the Group expects to be entitled in exchange for those goods or services. The Group has generally concluded that it is the principal in its revenue arrangements because it typically controls the goods or services before transferring them to the customer.
At 31 December 2018
Notes to the Consolidated Financial Statements

ANNUAL REPORT 201832
2 SIGNIFICANT ACCOUNTING POLICIES (continued) Revenue (continued) Revenue from contract with customers (continued) The disclosures of significant accounting judgements, estimates and assumptions relating to revenue from contracts with customers are provided in Note 3. The recognition criteria for various types of revenue are as follows: Sale of goods Revenue from sale of goods is recognised at the point in time when control is transferred to the customer, generally on delivery of the goods. The normal credit term is 60 to 90 days upon delivery. The Group considers whether there are other promises in the contract that are separate performance obligations to which a portion of the transaction price needs to be allocated. In determining the transaction price for the sale of goods, the Group considers the effects of variable consideration, the existence of significant financing components, non-cash consideration and consideration payable to the customer (if any). Presently only variable consideration has an effect on the Group’s revenue recognition. (i) Variable consideration If the consideration in a contract includes a variable amount, the Group estimates the amount of consideration to which it will be entitled in exchange for transferring the goods to the customer. The variable consideration is estimated at contract inception and constrained until it is highly probable that a significant revenue reversal in the amount of cumulative revenue recognised will not occur when the associated uncertainty with the variable consideration is subsequently resolved. Some contracts for the sale of goods provide customers with a right of return and volume rebates. The rights of return and volume rebates give rise to variable consideration. • Rights of return
Certain contracts provide a customer with a right to return the goods within a specified period. The Group uses the expected value method to estimate the goods that will not be returned because this method best predicts the amount of variable consideration to which the Group will be entitled. The requirements in IFRS 15 on constraining estimates of variable consideration are also applied in order to determine the amount of variable consideration that can be included in the transaction price. For goods that are expected to be returned, instead of revenue, the Group recognises a refund liability. A right of return asset (and corresponding adjustment to cost of sales) is also recognised for the right to recover products from a customer.
• Volume rebates The Group provides retrospective volume rebates to certain customers once the quantity of products purchased during the period exceeds a threshold specified in the contract. Rebates are offset against amounts payable by the customer. To estimate the variable consideration for the expected future rebates, the Group applies the most likely amount method for contracts with a single-volume threshold and the expected value method for contracts with more than one volume threshold. The selected method that best predicts the amount of variable consideration is primarily driven by the number of volume thresholds contained in the contract. The Group then applies the requirements on constraining estimates of variable consideration and recognises a refund liability for the expected future rebates.
Other revenue Interest income Interest income is recorded using the effective interest rate (EIR) method, which is the rate that exactly discounts the estimated future cash payments or receipts through the expected life of the financial instrument or a shorter period, where appropriate, to the net carrying amount of the financial asset or liability. Dividend income Revenue is recognised when the Group’s right to receive the payment is established, which is generally when shareholders of the investee approve the dividend.
At 31 December 2018
Notes to the Consolidated Financial Statements

ANNUAL REPORT 2018 33
2 SIGNIFICANT ACCOUNTING POLICIES (continued) Revenue (continued) Other revenue (continued) Other revenue Other revenue is recognised on an accrual basis when income is earned. (ii) Trade receivables A receivable represents the Group’s right to an amount of consideration that is unconditional (i.e., only the passage of time is required before payment of the consideration is due). Refer to accounting policies relating to financial assets for further details. (iii) Contract liabilities A contract liability is the obligation to transfer goods or services to a customer for which the Group has received consideration (or an amount of consideration is due) from the customer. If a customer pays consideration before the Group transfers goods or services to the customer, a contract liability is recognised when the payment is made or the payment is due (whichever is earlier). Contract liabilities are recognised as revenue when the Group performs under the contract. (iv) Right of return assets Right of return asset represents the Group’s right to recover the goods expected to be returned by customers. The asset is measured at the former carrying amount of the inventory, less any expected costs to recover the goods, including any potential decreases in the value of the returned goods. The Group updates the measurement of the asset recorded for any revisions to its expected level of returns, as well as any additional decreases in the value of the returned products.
(v) Refund liabilities A refund liability is the obligation to refund some or all of the consideration received (or receivable) from the customer and is measured at the amount the Group ultimately expects it will have to return to the customer. The Group updates its estimates of refund liabilities (and the corresponding change in the transaction price) at the end of each reporting period. Refer to above accounting policy on variable consideration. Property, plant and equipmentProperty, plant and equipment is stated at cost, net of accumulated depreciation and impairment in value, if any. Such cost includes the cost of replacing a part of the property, plant and equipment and borrowing costs for long-term construction projects if the recognition criteria are met. When significant parts of property, plant and equipment are required to be replaced at intervals, the Group recognises such parts as individual assets with specific useful lives and depreciates them accordingly. Likewise, when a major inspection is performed, its cost is recognised in the carrying amount of the property, plant and equipment as a replacement if the recognition criteria are satisfied. All other repair and maintenance costs are recognised in the consolidated statement of income when incurred. Depreciation is calculated on a straight-line basis over the estimated useful lives of the assets, except for freehold land and capital work-in-progress, as follows: - Buildings on leasehold land lesser of 10 to 30 years or lease term - Plant, machinery and cold store equipment over 2 to 10 years - Furniture, fixtures and office equipment over 2 to 5 years - Motor vehicles over 4 to 12 years The carrying values of property, plant and equipment are reviewed for impairment when events or changes in circumstances indicate the carrying value may not be recoverable. If any such indication exists and where the carrying values exceed the estimated recoverable amount, the assets are written down to their recoverable amount, being the higher of their fair value less costs to sell and their value in use. An item of property, plant and equipment is derecognised upon disposal or when no future economic benefits are expected from its use or disposal. Any gain or loss arising on derecognition of the asset (calculated as the difference between the net disposal proceeds and the carrying amount of the asset) is recognised in the consolidated statement of income in the year the asset is derecognised.
At 31 December 2018
Notes to the Consolidated Financial Statements
ANNUAL REPORT 201834
2 SIGNIFICANT ACCOUNTING POLICIES (continued) Property, plant and equipment (continued) The assets’ residual values, useful lives and methods of depreciation are reviewed at each financial year-end and adjusted prospectively if appropriate. Inventories Inventories are stated at the lower of cost and net realisable value after making due provision for any obsolete or slow moving items. Costs are those expenses incurred in bringing each product to its present location and condition, and are accounted for as follows: Raw materials, consumables, - landed costs on a weighted average basis. spare parts and other items
Finished goods - costs of direct materials and labour and proportion of manufacturing overheads based on normal operating capacity
Goods for sale - landed costs on a first-in, first-out basis. Net realisable value is based on estimated selling price in the ordinary course of business less estimated costs of completion and the estimated costs necessary to make the sale. Impairment of non-financial assets The Group assesses at each reporting date whether there is an indication that an asset may be impaired. If any indication exists, or when annual impairment testing for an asset is required, the Group estimates the asset’s recoverable amount. An asset’s recoverable amount is the higher of an asset’s or cash-generating unit’s (CGU) fair value less costs to sell and its value in use and is determined for an individual asset, unless the asset does not generate cash inflows that are largely independent of those from other assets or groups of assets. When the carrying amount of an asset or CGU exceeds its recoverable amount, the asset is considered impaired and is written down to its recoverable amount. In assessing value in use, the estimated future cash flows are discounted to their present value using a pre-tax discount rate that reflects current market assessments of the time value of money and the risks specific to the asset. In determining fair value less costs to sell, an appropriate valuation model is used. These calculations are corroborated by valuation multiples, quoted share prices or other available fair value indicators. The impairment calculation is based on detailed budgets and forecasts for a period of five years, which are prepared separately for each of the Group’s CGUs to which the individual assets are allocated. For longer periods, a long-term growth rate is calculated and applied to project future cash flows after the fifth year. An assessment is made at each reporting date whether there is any indication that previously recognised impairment losses may no longer exist or may have decreased. If such indication exists, the Group estimates the asset’s or CGU’s recoverable amount. A previously recognised impairment loss is reversed only if there has been a change in the assumptions used to determine the asset’s recoverable amount since the last impairment loss was recognised. The reversal is limited so that the carrying amount of the asset does not exceed its recoverable amount, nor exceed the carrying amount that would have been determined, net of depreciation, had no impairment loss been recognised for the asset in prior years. Such reversal is recognised in the consolidated statement of income. Investment in an associate An associate is an entity over which the Group has significant influence. Significant influence is the power to participate in the financial and operating policy decisions of the investee, but is not control or joint control over those policies. The considerations made in determining significant influence are similar to those necessary to determine control over subsidiaries. The Group’s investment in an associate is accounted for using the equity method. Under the equity method, the investment in an associate is initially recognised at cost. The carrying amount of the investment is adjusted to recognise changes in the Group’s share of net assets of the associate since the acquisition date. Goodwill relating to the associate is included in the carrying amount of the investment and is neither amortised nor individually tested for impairment.
At 31 December 2018
Notes to the Consolidated Financial Statements
ANNUAL REPORT 2018 35
2 SIGNIFICANT ACCOUNTING POLICIES (continued) Investment in an associate (continued) The consolidated statement of income reflects the Group’s share of the results of operations of the associate. Any change in other comprehensive income of the investee is presented as part of the consolidated statement of comprehensive income. In addition, when there has been a change recognised directly in the equity of the associate, the Group recognises its share of any changes, when applicable, in the consolidated statement of changes in equity. Unrealised gains and losses resulting from transactions between the Group and the associate are eliminated to the extent of the investment in the associate. The aggregate of the Group’s share of results of an associate is shown on the face of the consolidated statement of income outside operating profit and represents results after tax and non-controlling interests in the subsidiaries of the associate. The financial statements of the associate is prepared for the same reporting period as the Group. When necessary, adjustments are made to bring the accounting policies in line with those of the Group. After application of the equity method, the Group determines whether it is necessary to recognise an impairment loss on its investment in its associate. At each reporting date, the Group determines whether there is objective evidence that the investment in the associate is impaired. If there is such evidence, the Group calculates the amount of impairment as the difference between the recoverable amount of the associate and its carrying value, then recognises the loss as ‘Share of results of associate’ in the consolidated statement of income. Upon loss of significant influence over the associate, the Group measures and recognises any retained investment at its fair value. Any difference between the carrying amount of the associate upon loss of significant influence and the fair value of the retained investment and proceeds from disposal is recognised in the consolidated statement of income. Current versus non-current classification The Group presents assets and liabilities in the consolidated statement of financial position based on a current/non-current classification. An asset is current when it is:
- expected to be realised or intended to be sold or consumed in the normal operating cycle; - held primarily for the purpose of trading; - expected to be realised within twelve months after the reporting period; or - cash or cash equivalent unless restricted from being exchanged or used to settle a liability for at least twelve months after the reporting period. All other assets are classified as non-current. A liability is current when:
- it is expected to be settled in the normal operating cycle; - it is held primarily for the purpose of trading; - it is due to be settled within twelve months after the reporting period; or - there is no unconditional right to defer the settlement of the liability for at least twelve months after the reporting period. All other liabilities are classified as non-current. Financial instruments - initial recognition and subsequent measurement A financial instrument is any contract that gives rise to a financial asset of one entity and a financial liability or equity instrument of another entity.
At 31 December 2018
Notes to the Consolidated Financial Statements

ANNUAL REPORT 201836
2 SIGNIFICANT ACCOUNTING POLICIES (continued)
Financial instruments - initial recognition and subsequent measurement (continued) i) Financial assets (policy applicable from 1 January 2018) Initial recognition and measurement Financial assets are classified, at initial recognition, as subsequently measured at amortised cost, fair value through other comprehensive income (FVOCI) or fair value through profit or loss (FVTPL). The classification of financial assets at initial recognition depends on the financial asset’s contractual cash flow characteristics and the Group’s business model for managing them. With the exception of trade receivables that do not contain a significant financing component or for which the Group has applied the practical expedient, the Group initially measures a financial asset at its fair value plus, in the case of a financial asset not at fair value through profit or loss, transaction costs. Trade receivables that do not contain a significant financing component or for which the Group has applied the practical expedient are measured at the transaction price determined under IFRS 15. In order for a financial asset to be classified and measured at amortised cost or fair value through OCI, it needs to give rise to cash flows that are ‘solely payments of principal and interest (SPPI)’ on the principal amount outstanding. This assessment is referred to as the SPPI test and is performed at an instrument level. The Group’s business model for managing financial assets refers to how it manages its financial assets in order to generate cash flows. The business model determines whether cash flows will result from collecting contractual cash flows, selling the financial assets, or both. Purchases or sales of financial assets that require delivery of assets within a time frame established by regulation or convention in the market place (regular way trades) are recognised on the trade date, i.e., the date that the Group commits to purchase or sell the asset. Subsequent measurement For purposes of subsequent measurement, financial assets are classified in four categories: - Financial assets at amortised cost (debt instruments); - Financial assets at fair value through OCI with recycling of cumulative gains and losses (debt instruments); - Financial assets designated at fair value through OCI with no recycling of cumulative gains and losses upon derecognition (equity instruments); and - Financial assets at fair value through profit or loss. Financial assets at amortised cost This category is the most relevant to the Group. The Group measures financial assets at amortised cost if both of the following conditions are met: - The financial asset is held within a business model with the objective to hold financial assets in order to collect contractual cash flows; and - The contractual terms of the financial asset give rise on specified dates to cash flows that are solely payments of principal and interest on the principal amount outstanding. Financial assets at amortised cost are subsequently measured using the effective interest (EIR) method and are subject to impairment. Gains and losses are recognised in profit or loss when the asset is derecognised, modified or impaired. The Group’s financial assets at amortised cost includes a portion of trade and other receivables. Financial assets at fair value through OCI (i) Equity instruments The Group classifies equity instruments at FVOCI if the asset is not held for trading. A financial asset is held for trading if: (a) it is acquired or incurred principally for the purpose of selling or repurchasing it in the near term;
At 31 December 2018
Notes to the Consolidated Financial Statements

ANNUAL REPORT 2018 37
2 SIGNIFICANT ACCOUNTING POLICIES (continued)
Financial instruments - initial recognition and subsequent measurement (continued) i) Financial assets (policy applicable from 1 January 2018) (continued)
(i) Equity instruments (continued)
(b) on initial recognition it is part of a portfolio of identified financial instruments that are managed together and for which there is evidence of a recent actual pattern of short-term profit taking; or (c) it is a derivative (except for derivative that is a financial guarantee contract or a designated and effective hedging instrument). Financial assets classified at FVOCI are subsequently measured at fair value with changes in fair value recognised in the consolidated statement of comprehensive income. The cumulative gains or losses recognised in “Fair value reserve” within the consolidated statement of changes in equity are never reclassified to the consolidated statement of income on disposals. Dividends are recognised as investment income in the consolidated statement of income when the right of payment has been established, except when the Group benefits from such proceeds as a recovery of part of the cost of the financial asset, in which case, such gains are recorded in the consolidated statement of other comprehensive income. Equity instruments designated at FVOCI are not subject to impairment assessment. The Group’s equity instruments at fair value through other comprehensive income includes investments in equity instruments of quoted and unquoted companies and included in non-trading investments. (ii) Debt instruments The Group measures debt instruments at fair value through OCI if both of the following conditions are met: - The financial asset is held within a business model with the objective of both holding to collect contractual cash flows and selling; and - The contractual terms of the financial asset give rise on specified dates to cash flows that are solely payments of principal and interest on the principal amount outstanding. Investments in debt instruments classified at FVOCI are subsequently measured at fair value with changes in fair value are recognised in the consolidated statement of comprehensive income. The cumulative gains or losses recognised in ‘fair value reserve’ within consolidated statements of changes equity and are recognised in the consolidated statement of income on disposal. Interest income, foreign exchange revaluation and impairment losses or reversals are recognised in the statement of profit or loss and computed in the same manner as for financial assets measured at amortised cost. The Group’s debt instruments at fair value through OCI include investments in quoted debt instruments. Financial assets at fair value through profit or loss Financial assets at fair value through profit or loss include financial assets held for trading, financial assets designated upon initial recognition at fair value through profit or loss, or financial assets mandatorily required to be measured at fair value. Financial assets are classified as held for trading if they are acquired for the purpose of selling or repurchasing in the near term. Derivatives, including separated embedded derivatives, are also classified as held for trading unless they are designated as effective hedging instruments. Financial assets with cash flows that are not solely payments of principal and interest are classified and measured at fair value through profit or loss, irrespective of the business model. Notwithstanding the criteria for debt instruments to be classified at amortised cost or at fair value through OCI, as described above, debt instruments may be designated at fair value through profit or loss on initial recognition if doing so eliminates, or significantly reduces, an accounting mismatch.
At 31 December 2018
Notes to the Consolidated Financial Statements

ANNUAL REPORT 201838
2 SIGNIFICANT ACCOUNTING POLICIES (continued)
Financial instruments - initial recognition and subsequent measurement (continued) i) Financial assets (policy applicable from 1 January 2018) (continued)
Financial assets at fair value through profit or loss are carried in the statement of financial position at fair value with net changes in fair value recognised in the statement of profit or loss. This category includes derivative instruments and listed equity investments which the Group had not irrevocably elected to classify at fair value through OCI. Dividends on listed equity investments are also recognised as other income in the statement of profit or loss when the right of payment has been established. Cash and cash equivalents For the purpose of the consolidated statement of cash flows, cash and cash equivalents consist of cash on hand and bank balances, net of outstanding bank overdrafts. Derecognition of financial assetsA financial asset (or, where applicable a part of a financial asset or part of a group of similar financial assets) is derecognised when: - the rights to receive cash flows from the asset have expired; or - the Group has transferred its rights to receive cash flows from the asset or has assumed an obligation to pay the received cash flows in full without material delay to a third party under a ‘pass-through’ arrangement; and either (a) the Group has transferred substantially all the risks and rewards of the asset, or (b) the Group has neither transferred nor retained substantially all the risks and rewards of the asset, but has transferred control of the asset. When the Group has transferred its rights to receive cash flows from an asset or has entered into a pass-through arrangement, it evaluates if and to what extent it has retained the risks and rewards of ownership. When it has neither transferred nor retained substantially all of the risks and rewards of the asset, nor transferred control of the asset, the Group continues to recognise the transferred asset to the extent of the Group’s continuing involvement. In that case, the Group also recognises an associated liability. The transferred asset and the associated liability are measured on a basis that reflects the rights and obligations that the Group has retained. Continuing involvement that takes the form of a guarantee over the transferred asset is measured at the lower of the original carrying amount of the asset and the maximum amount of consideration that the Group could be required to repay. Impairment of financial assets The Group recognises an allowance for expected credit losses (ECLs) for all debt instruments. ECLs are based on the difference between the contractual cash flows due in accordance with the contract and all the cash flows that the Group expects to receive, discounted at an approximation of the original effective interest rate. The expected cash flows will include cash flows from the sale of collateral held or other credit enhancements that are integral to the contractual terms. ECLs are recognised in two stages. For credit exposures for which there has not been a significant increase in credit risk since initial recognition, ECLs are provided for credit losses that result from default events that are possible within the next 12-months (a 12-month ECL). For those credit exposures for which there has been a significant increase in credit risk since initial recognition, a loss allowance is required for credit losses expected over the remaining life of the exposure, irrespective of the timing of the default (a lifetime ECL). For trade receivables which is the only significant financial asset exposed to credit risk, the Group applies a simplified approach in calculating ECLs. Therefore, the Group does not track changes in credit risk, but instead recognises a loss allowance based on lifetime ECLs at each reporting date. The Group has established a provision matrix that is based on its historical credit loss experience, adjusted for any relevant forward-looking factors. The Group considers a financial asset in default when internal or external information indicates that the Group is unlikely to receive the outstanding contractual amounts in full before taking into account any credit enhancements held by the Group. A financial asset is written off when there is no reasonable expectation of recovering the contractual cash flows.
At 31 December 2018
Notes to the Consolidated Financial Statements

ANNUAL REPORT 2018 39
2 SIGNIFICANT ACCOUNTING POLICIES (continued)
Financial instruments - initial recognition and subsequent measurement (continued) ii) Financial assets (policy applicable prior to 1 January 2018) Initial recognition and measurement Financial assets are classified, at initial recognition, as financial assets at fair value through profit or loss, loans and receivables, held-to-maturity investments or available-for-sale financial assets as appropriate. The Group determines the classification of its financial assets at initial recognition. All financial assets are recognised initially at fair value plus, in the case of financial assets not recorded at fair value through profit or loss, transaction costs that are attributable to the acquisition of the financial asset. Purchases or sales of financial assets that require delivery of assets within a time frame established by regulation or convention in the market place (regular way trades) are recognised on the trade date, i.e. the date the Group commits to purchase or sell the asset. The Group’s financial assets include non-trading investments, a certain portion of trade and other receivables and bank balances and cash. Subsequent measurement The subsequent measurement of financial assets depends on their classification as described below: Available-for-sale investments Available-for-sale financial investments include non-trading investments in equity securities. Equity investments classified as available-for sale are those, which are neither classified as held-for-trading nor designated at fair value through profit or loss. After initial measurement, non-trading investments are subsequently measured at fair value with unrealised gains or losses recognised in the consolidated statement of comprehensive income and taken to ‘Fair value reserve’ within the consolidated statement of changes in equity until the investment is derecognised, at which time the cumulative gain or loss is recognised in the consolidated statement of income, or determined to be impaired, at which time the cumulative loss is reclassified to the consolidated statement of income and removed from ‘Fair value reserve’. Loans and receivables Loans and receivables are non-derivative financial assets with fixed or determinable payments that are not quoted in an active market. After initial measurement, such financial assets are subsequently measured at amortised cost using the EIR, less any impairment in value. A certain portion of trade and other receivables are classified as loans and receivables. Cash and cash equivalents For the purpose of the consolidated statement of cash flows, cash and cash equivalents consist of cash on hand and bank balances, net of outstanding bank overdrafts. Impairment of financial assets The Group assesses at each reporting date whether there is any objective evidence that a financial asset or a group of financial assets is impaired. A financial asset or a group of financial assets is deemed to be impaired if, and only if, there is objective evidence of impairment as a result of one or more events that has occurred after the initial recognition of the asset (an incurred ‘loss event’) and that loss event has an impact on the estimated future cash flows of the financial asset or the group of financial assets that can be reliably estimated. Evidence of impairment may include indications that the debtors or a group of debtors is experiencing significant financial difficulty, default or delinquency in interest or principal payments, the probability that they will enter bankruptcy or other financial reorganisation and where observable data indicate that there is a measurable decrease in the estimated future cash flows, such as changes in arrears or economic conditions that correlate with defaults. Available-for-sale investments For available-for-sale investments, the Group assesses at each reporting date whether there is objective evidence that an investment or a group of investments is impaired.
At 31 December 2018
Notes to the Consolidated Financial Statements

ANNUAL REPORT 201840
2 SIGNIFICANT ACCOUNTING POLICIES (continued) Financial instruments - initial recognition and subsequent measurement (continued) ii) Financial assets (policy applicable prior to 1 January 2018) (continued)
In case of equity instruments classified as available-for-sale, objective evidence would include a “significant” or “prolonged” decline in the fair value of the investment below its cost. ‘Significant’ is evaluated against the original cost of the investment and ‘prolonged’ against the period in which the fair value has been below its original cost. Where there is evidence of impairment, the cumulative loss - measured as the difference between the acquisition cost and the current fair value, less any impairment loss on that investment previously recognised in the consolidated statement of income is removed from the consolidated statement of comprehensive income and recognised in the consolidated statement of income. Financial assets carried at amortised cost The amount of the impairment loss is measured as the difference between the asset’s carrying amount and the present value of estimated future cash flows (excluding future expected credit losses that have not yet been incurred) and recognised in the consolidated statement of income. The present value of the estimated future cash flows is discounted at the financial asset’s original EIR. If an asset has a variable interest rate, the discount rate for measuring any impairment loss is the current EIR. iii) Financial liabilities (policy applicable prior to and after 1 January 2018) Initial recognition and measurement Financial liabilities are classified, at initial recognition, as loans and borrowings or financial liabilities at amortised cost as appropriate. All financial liabilities are recognised initially at fair value and, in the case of loans and borrowings and payables, net of directly attributable transaction costs. The Group’s financial liabilities include a portion of trade and other payables and loans and borrowings comprising loans from non-controlling interests, term loans, import loans and bank overdrafts. Subsequent measurement The measurement of financial liabilities depends on their classification, as described below: Loans and borrowings After initial recognition, interest-bearing loans and borrowings are subsequently measured at amortised cost using the EIR method. Gains and losses are recognised in profit or loss when the liabilities are derecognised as well as through the EIR amortisation process. Amortised cost is calculated by taking into account any discount or premium on acquisition and fees or costs that are an integral part of the EIR. The EIR amortisation is included as finance costs in the statement of profit or loss. This category generally applies to interest-bearing loans and borrowings. Trade and other payables Liabilities for trade and other payables are carried at cost, which is the fair value of the consideration to be paid in the future for goods and services received, whether or not billed to the Group. Derecognition of financial liabilities A financial liability is derecognised when the obligation under the liability is discharged or cancelled, or expires. When an existing financial liability is replaced by another from the same lender on substantially different terms, or the terms of an existing liability are substantially modified, such an exchange or modification is treated as the derecognition of the original liability and the recognition of a new liability. The difference in the respective carrying amounts is recognised in the consolidated statement of income. Offsetting of financial instruments Financial assets and financial liabilities are offset and the net amount reported in the consolidated statement of financial position if, and only if, there is a currently enforceable legal right to offset the recognised amounts and there is an intention to settle on a net basis, or to realise the assets and settle the liabilities simultaneously.
At 31 December 2018
Notes to the Consolidated Financial Statements

ANNUAL REPORT 2018 41
2 SIGNIFICANT ACCOUNTING POLICIES (continued) iii) Financial liabilities (policy applicable prior and after 1 January 2018) (continued) Fair value measurement Fair value is the price that would be received to sell an asset or paid to transfer a liability in an orderly transaction between market participants at the measurement date. The fair value measurement is based on the presumption that the transaction to sell the asset or transfer the liability takes place either: - in the principal market for the asset or liability, or - in the absence of a principal market, in the most advantageous market for the asset or liability. The principal or the most advantageous market must be accessible by the Group. The fair value of an asset or a liability is measured using the assumptions that market participants would use when pricing the asset or liability, assuming that market participants act in their economic best interest. A fair value measurement of a non-financial asset takes into account a market participant’s ability to generate economic benefits by using the asset in its highest and best use or by selling it to another market participant that would use the asset in its highest and best use. The Group uses valuation techniques that are appropriate in the circumstances and for which sufficient data are available to measure fair value, maximising the use of relevant observable inputs and minimising the use of unobservable inputs. All assets and liabilities for which fair value is measured or disclosed in the consolidated financial statements are categorised within the fair value hierarchy, described as follows, based on the lowest level input that is significant to the fair value measurement as a whole: - Level 1 — Quoted (unadjusted) market prices in active markets for identical assets or liabilities; - Level 2 — Valuation techniques for which the lowest level input that is significant to the fair value measurement is directly or indirectly observable; and - Level 3 — Valuation techniques for which the lowest level input that is significant to the fair value measurement is unobservable. For assets and liabilities that are recognised in the consolidated financial statements on a recurring basis, the Group determines whether transfers have occurred between Levels in the hierarchy by re-assessing categorisation (based on the lowest level input that is significant to the fair value measurement as a whole) at the end of each reporting period. Treasury shares Own equity instruments which are reacquired (treasury shares) are recognised at cost and deducted from equity. No gain or loss is recognised in the consolidated statement of income on the purchase, sale, issue or cancellation of own equity instruments. Voting rights related to treasury shares are nullified for the Company and no dividends are allocated to them. Provisions Provisions are recognised when the Group has a present obligation (legal or constructive) as a result of a past event, it is probable that an outflow of resources embodying economic benefits will be required to settle the obligation and a reliable estimate can be made of the amount of the obligation. Where the Group expects some or all of a provision to be reimbursed, for example under an insurance contract, the reimbursement is recognised as a separate asset but only when the reimbursement is virtually certain. The expense relating to any provision is presented in the consolidated statement of income, net of any reimbursement. Employees’ end of service benefits The Group makes contributions to the Social Insurance Organisation (SIO), Bahrain for its Bahraini employees and Public Authority for Social Security, Kuwait, for its Kuwaiti employees, calculated as a percentage of the employees’ salaries. The Group’s obligations are limited to these contributions, which are expensed when due.
At 31 December 2018
Notes to the Consolidated Financial Statements

ANNUAL REPORT 201842
2 SIGNIFICANT ACCOUNTING POLICIES (continued) iii) Financial liabilities (policy applicable prior and after 1 January 2018) (continued)
Employees’ end of service benefits (continued)
The Group also provides for end of service benefits for its expatriate employees. The entitlement to these benefits is based upon the employee’s final salary and length of service. The expected costs of these benefits are accrued over the period of employment. Operating leases Operating lease payments are recognised as an expense in the consolidated statement of income on a straight-line basis over the lease term. 3 SIGNIFICANT ACCOUNTING JUDGEMENTS, ESTIMATES AND ASSUMPTIONS The preparation of the Group’s consolidated financial statements requires the Board of Directors to make judgements, estimates and assumptions that affect the reported amounts of revenues, expenses, assets, liabilities and the disclosure of contingent liabilities, at the reporting date. However, uncertainty about these assumptions and estimates could result in outcomes that require a material adjustment to the carrying amount of the assets or liabilities affected in future periods. (i) Judgements In the process of applying the Group’s accounting policies, the Board of Directors has made the following judgements, which have the most significant effect on the amounts recognised in the consolidated financial statements: Going concern The Company’s Board of Directors has made an assessment of the Group’s ability to continue as a going concern and is satisfied that the Group has the resources to continue the business for the foreseeable future. Furthermore, the Board of Directors is not aware of any material uncertainties that may cast a significant doubt about the Group’s ability to continue as a going concern. Therefore, the consolidated financial statements continue to be prepared on a going concern basis. Classification of investments The Group’s management determines the classification of investments on initial recognition as “financial asset at fair value through profit or loss” or “financial asset at fair value through other comprehensive income”. The investments are classified as “financial asset at fair value through profit or loss” if they are acquired for the purpose of selling in the near term. All other investments are classified as “financial asset at fair value through other comprehensive income”. Leases The determination of whether an arrangement is, or contains a lease is based on the substance of the arrangement at inception date: whether fulfillment of the arrangement is dependent on the use of a specific asset or assets or the arrangement conveys a right to use the asset or assets and the arrangement conveys a right to use the asset or assets, even if that right is not explicitly specified in an arrangement. The Group has entered into commercial property leases for its office and warehouse buildings. The Group has determined, based on an evaluation of the terms and conditions of the arrangements that the lessor retains all the significant risks and rewards of ownership of the land and so accounts for the contracts as operating leases. (ii) Estimates and assumptions The key assumptions concerning the future and other key sources of estimation uncertainty at the reporting date, that have a significant risk of causing a material adjustment to the carrying amounts of assets and liabilities within the next financial year, are described below. The Group based its assumptions and estimates on parameters available when the consolidated financial statements were prepared. Existing circumstances and assumptions about future developments, however, may change due to market changes or circumstances arising beyond the control of the Group. Valuation of unquoted non-trading investments Management uses its best judgement in determining fair values of the unquoted private equity investments by reference to using fair value provided by the investment managers or other appropriate valuation techniques including fair values determined based on unobservable inputs using a market multiples or other appropriate valuation methodologies.
Notes to the Consolidated Financial StatementsAt 31 December 2018

ANNUAL REPORT 2018 43
3 SIGNIFICANT ACCOUNTING JUDGEMENTS, ESTIMATES AND ASSUMPTIONS (continued) (ii) Estimates and assumptions (continued)
Valuation of unquoted non-trading investments (continued) Management uses its best judgement, however, the actual amount realised in a future transaction may differ from the current estimate of fair value given the inherent uncertainty surrounding the valuation of unquoted equity investments. Provision for slow moving and obsolete inventories Inventories are held at the lower of cost and net realisable value. When inventories become old or obsolete, an estimate is made of their net realisable value. For individually significant amounts this estimation is performed on an individual basis. Amounts which are not individually significant, but which are old or obsolete, are assessed collectively and a provision applied according to the inventory type and the degree of ageing or obsolescence, based on historical selling prices and next year budget. At the reporting date, gross inventories amounted to BD 8,449,119 (2017: BD 8,817,032), with a provision for slow moving and obsolete inventories of BD 719,916 (2017: BD 656,946). Any difference between the amounts actually realised in future periods and the amounts expected will be recognised in the consolidated statement of income. Impairment of property, plant and equipment The Group assesses at each reporting date whether there is any indication that an asset may be impaired. If any such indication exists, or when annual impairment testing for an asset is required, the Group makes an estimate of the asset’s recoverable amount. An asset’s recoverable amount is higher of an asset’s or cash-generating unit’s (CGU) fair value less costs to sell and its value in use and is determined for an individual asset, unless the asset does not generate cash inflows that are largely independent of those from other assets or group of assets. Where the carrying amount of an asset exceeds its recoverable amount, the asset is considered impaired and is written down to its recoverable amount. In assessing value in use, the estimated future cash flows are discounted to their present value using a discount rate that reflects current market assessment of the time value of money and the risks specific to the assets. The Board of Directors does not believe that there is any impairment of property, plant and equipment as at 31 December 2018 and 31 December 2017. Useful lives of property, plant and equipment The Group’s management determines the estimated useful lives of its property, plant and equipment for calculating depreciation. This estimate is determined after considering the expected usage of the asset or physical wear and tear. Management reviews the residual values and useful lives annually and future depreciation charges would be adjusted where management believes the useful lives differ from previous estimates. Allowance for expected credit losses of trade receivables The determination of ‘allowance of expected credit losses’ as discussed in note 2 involves estimates and assumptions. Estimating variable consideration for returns and volume rebates The Group estimates variable considerations to be included in the transaction price for the sale of good with rights of return and volume rebates. The Group used the historical return data of each product to come up with expected return percentages. These percentages are applied to determine the expected value of the variable consideration. Any significant changes in experience as compared to historical return pattern will impact the expected return percentages estimated by the Group.
The Group’s expected volume rebates are analysed on a per customer basis for contracts that are subject to a single volume threshold. Determining whether a customer will be likely entitled to rebate will depend on the customer’s historical rebates entitlement and accumulated purchases to date. For volume rebates for contract with more than one volume threshold, the Group uses the historical purchasing patterns and rebates entitlement of customers to determine the expected rebate percentages and the expected value of the variable consideration. Any significant changes in experience as compared to historical purchasing patterns and rebate entitlements of customers will impact the expected rebate percentages estimated by the Group.
Notes to the Consolidated Financial StatementsAt 31 December 2018

ANNUAL REPORT 201844
3 SIGNIFICANT ACCOUNTING JUDGEMENTS, ESTIMATES AND ASSUMPTIONS (continued) (ii) Estimates and assumptions (continued) Estimating variable consideration for returns and volume rebates (continued) The Group updates its assessment of expected returns and volume rebates on a quarterly basis and the refund liabilities are adjusted accordingly. Estimates of expected returns and volume rebates are sensitive to changes in circumstances and the Group’s past experience regarding returns and rebate entitlements may not be representative of customers’ actual returns and rebate entitlements in the future. As at 31 December 2018, the amount recognised as refund liabilities for the expected returns and contract liability for volume rebates was BD 115,778 (2017: BD 124,081) and BD 50,274 (2017: BD 43,054) respectively. 4 STANDARDS AND INTERPRETATIONS ISSUED BUT NOT YET EFFECTIVE Standards issued but not yet effective up to the date of issuance of the consolidated financial statements are listed below. This listing is of standards and interpretations issued, which the Group reasonably expects to be applicable at a future date. The Group intends to adopt these standards when they become effective. IFRS 16 Leases IFRS 16 was issued in January 2016 and it replaces IAS 17 Leases, IFRIC 4 Determining whether an Arrangement contains a Lease, SIC-15 Operating Leases-Incentives and SIC-27 Evaluating the Substance of Transactions Involving the Legal Form of a Lease. IFRS 16 sets out the principles for the recognition, measurement, presentation and disclosure of leases and requires lessees to account for all leases under a single statement of financial position model similar to the accounting for finance leases under IAS 17. The standard includes two recognition exemptions for lessees – leases of ’low-value’ assets (e.g., personal computers) and short-term leases (i.e., leases with a lease term of 12 months or less). At the commencement date of a lease, a lessee will recognise a liability to make lease payments (i.e., the lease liability) and an asset representing the right to use the underlying asset during the lease term (i.e., the right-of-use asset). Lessees will be required to separately recognise the interest expense on the lease liability and the depreciation expense on the right-of-use asset. Lessees will be also required to remeasure the lease liability upon the occurrence of certain events (e.g., a change in the lease term, a change in future lease payments resulting from a change in an index or rate used to determine those payments). The lessee will generally recognise the amount of the remeasurement of the lease liability as an adjustment to the right-of-use asset. Lessor accounting under IFRS 16 is substantially unchanged from today’s accounting under IAS 17. Lessors will continue to classify all leases using the same classification principle as in IAS 17 and distinguish between two types of leases: operating and finance leases. IFRS 16 also requires lessees and lessors to make more extensive disclosures than under IAS 17. IFRS 16 is effective for annual periods beginning on or after 1 January 2019. Early application is permitted, but not before an entity applies IFRS 15. A lessee can choose to apply the standard using either a full retrospective or a modified retrospective approach. The Group is currently assessing the impact of IFRS 16 and plans to adopt the new standard on the required effective date. Based on the impact assessment and information currently available, the group is expected to recognise right to use assets and lease liabilities approximately of BD 2 million as at 1 January 2019. IAS 28 Investment in Associates and Joint Ventures (Amendments): Long-term interests in associates and joint ventures The amendments clarify that an entity applies IFRS 9 to long-term interests in an associate or joint venture to which the equity method is not applied but that, in substance, form part of the net investment in the associate or joint venture (long-term interests). This clarification is relevant because it implies that the expected credit loss model in IFRS 9 applies to such long-term interests.
Notes to the Consolidated Financial StatementsAt 31 December 2018

ANNUAL REPORT 2018 45
4 STANDARDS AND INTERPRETATIONS ISSUED BUT NOT YET EFFECTIVE (continued) IAS 28 Investment in Associates and Joint Ventures (Amendments): Long-term interests in associates and joint ventures (continued) The amendments also clarified that, in applying IFRS 9, an entity does not take account of any losses of the associate or joint venture, or any impairment losses on the net investment, recognised as adjustments to the net investment in the associate or joint venture that arise from applying IAS 28 Investments in Associates and Joint Ventures. The amendments should be applied retrospectively and are effective from 1 January 2019, with early application permitted. Since the Group does not have such long-term interests in its associate and joint venture, the amendments will not have an impact on its consolidated financial statements. IAS 23 Borrowing Costs - Borrowing costs eligible for capitalisation The amendments clarify that an entity treats as part of general borrowings any borrowing originally made to develop a qualifying asset when substantially all of the activities necessary to prepare that asset for its intended use or sale are complete. An entity applies those amendments to borrowing costs incurred on or after the beginning of the annual reporting period in which the entity first applies those amendments. An entity applies those amendments for annual reporting periods beginning on or after 1 January 2019, with early application permitted. Since the Group’s current practice is in line with these amendments, the Group does not expect any effect on its consolidated financial statements. Amendments to IFRS 9: Prepayment Features with Negative Compensation Under IFRS 9, a debt instrument can be measured at amortised cost or at fair value through other comprehensive income, provided that the contractual cash flows are ‘solely payments of principal and interest on the principal amount outstanding’ (the SPPI criterion) and the instrument is held within the appropriate business model for that classification. The amendments to IFRS 9 clarify that a financial asset passes the SPPI criterion regardless of the event or circumstance that causes the early termination of the contract and irrespective of which party pays or receives reasonable compensation for the early termination of the contract. The amendments should be applied retrospectively and are effective from 1 January 2019, with earlier application permitted. These amendments are not expected to have any impact on the consolidated financial statements of the Group. Amendments to IFRS 10 and IAS 28: Sale or Contribution of Assets between an Investor and its Associate or Joint Venture The amendments address the conflict between IFRS 10 and IAS 28 in dealing with the loss of control of a subsidiary that is sold or contributed to an associate or joint venture. The amendments clarify that the gain or loss resulting from the sale or contribution of assets that constitute a business, as defined in IFRS 3, between an investor and its associate or joint venture, is recognised in full. Any gain or loss resulting from the sale or contribution of assets that do not constitute a business, however, is recognised only to the extent of unrelated investors’ interests in the associate or joint venture. The IASB has deferred the effective date of these amendments indefinitely, but an entity that early adopts the amendments must apply them prospectively. The amendments are not expected to have any impact on the Group’s consolidated financial statements. Other amendments resulting from new standards and interpretations and amendments to standards and interpretations will not have any impact on the accounting policies, consolidated financial position or consolidated financial performance of the Group.
Notes to the Consolidated Financial StatementsAt 31 December 2018
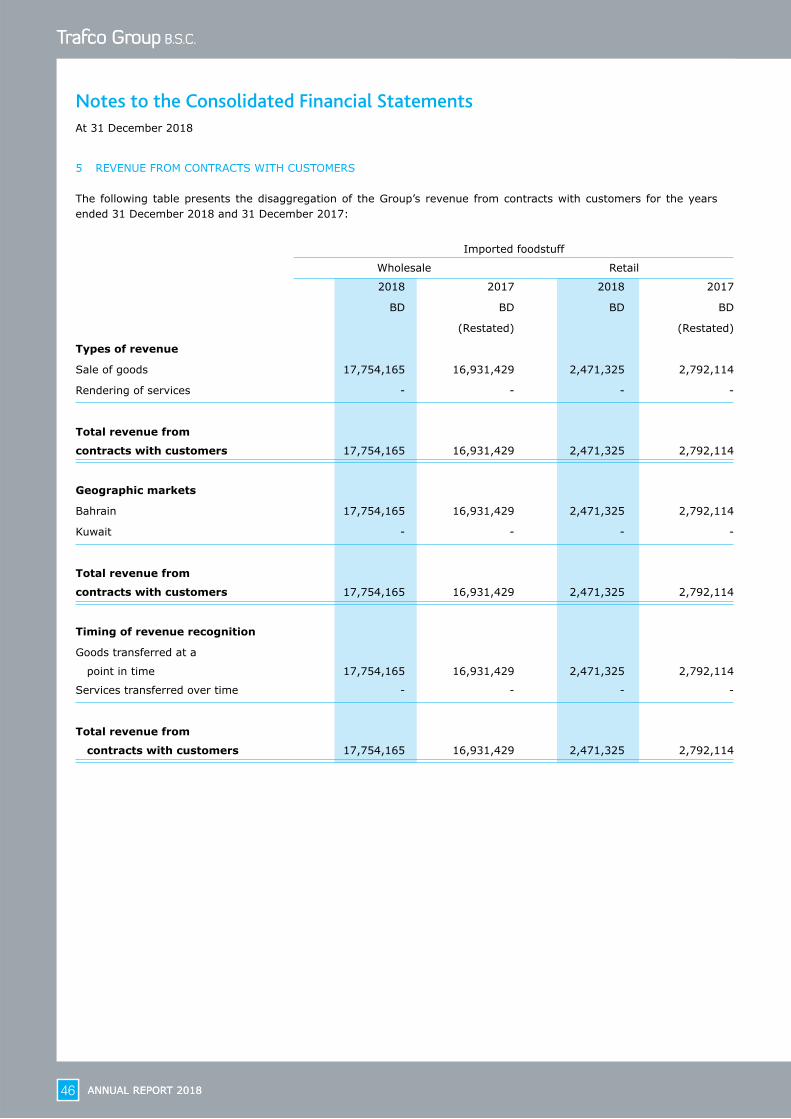
ANNUAL REPORT 201846 ANNUAL REPORT 201846
Notes to the Consolidated Financial Statements
Imported foodstuff Dairy products andbeverages
Fruits andvegetables
Storage andlogisticsWholesale Retail Total
2018 2017 2018 2017 2018 2017 2018 2017 2018 2017 2018 2017
BD BD BD BD BD BD BD BD BD BD BD BD
(Restated) (Restated) (Restated) (Restated) (Restated) (Restated)
Types of revenue
Sale of goods 17,754,165 16,931,429 2,471,325 2,792,114 16,339,288 16,388,978 2,238,747 3,174,988 - - 38,803,525 39,287,509
Rendering of services - - - - - - - - 718,286 578,605 718,286 578,605
Total revenue from
contracts with customers 17,754,165 16,931,429 2,471,325 2,792,114 16,339,288 16,388,978 2,238,747 3,174,988 718,286 578,605 39,521,811 39,866,114
Geographic markets
Bahrain 17,754,165 16,931,429 2,471,325 2,792,114 13,308,121 13,421,537 2,238,747 3,174,988 718,286 578,605 36,490,644 36,898,673
Kuwait - - - - 3,031,167 2,967,441 - - - - 3,031,167 2,967,441
Total revenue from
contracts with customers 17,754,165 16,931,429 2,471,325 2,792,114 16,339,288 16,388,978 2,238,747 3,174,988 718,286 578,605 39,521,811 39,866,114
Timing of revenue recognition
Goods transferred at a
point in time 17,754,165 16,931,429 2,471,325 2,792,114 16,339,288 16,388,978 2,238,747 3,174,988 - - 38,803,525 39,287,509
Services transferred over time - - - - - - - - 718,286 578,605 718,286 578,605
Total revenue from
contracts with customers 17,754,165 16,931,429 2,471,325 2,792,114 16,339,288 16,388,978 2,238,747 3,174,988 718,286 578,605 39,521,811 39,866,114
5 REVENUE FROM CONTRACTS WITH CUSTOMERS The following table presents the disaggregation of the Group’s revenue from contracts with customers for the years ended 31 December 2018 and 31 December 2017:
At 31 December 2018

ANNUAL REPORT 2018 47ANNUAL REPORT 2018 47
Notes to the Consolidated Financial Statements
Imported foodstuff Dairy products andbeverages
Fruits andvegetables
Storage andlogisticsWholesale Retail Total
2018 2017 2018 2017 2018 2017 2018 2017 2018 2017 2018 2017
BD BD BD BD BD BD BD BD BD BD BD BD
(Restated) (Restated) (Restated) (Restated) (Restated) (Restated)
Types of revenue
Sale of goods 17,754,165 16,931,429 2,471,325 2,792,114 16,339,288 16,388,978 2,238,747 3,174,988 - - 38,803,525 39,287,509
Rendering of services - - - - - - - - 718,286 578,605 718,286 578,605
Total revenue from
contracts with customers 17,754,165 16,931,429 2,471,325 2,792,114 16,339,288 16,388,978 2,238,747 3,174,988 718,286 578,605 39,521,811 39,866,114
Geographic markets
Bahrain 17,754,165 16,931,429 2,471,325 2,792,114 13,308,121 13,421,537 2,238,747 3,174,988 718,286 578,605 36,490,644 36,898,673
Kuwait - - - - 3,031,167 2,967,441 - - - - 3,031,167 2,967,441
Total revenue from
contracts with customers 17,754,165 16,931,429 2,471,325 2,792,114 16,339,288 16,388,978 2,238,747 3,174,988 718,286 578,605 39,521,811 39,866,114
Timing of revenue recognition
Goods transferred at a
point in time 17,754,165 16,931,429 2,471,325 2,792,114 16,339,288 16,388,978 2,238,747 3,174,988 - - 38,803,525 39,287,509
Services transferred over time - - - - - - - - 718,286 578,605 718,286 578,605
Total revenue from
contracts with customers 17,754,165 16,931,429 2,471,325 2,792,114 16,339,288 16,388,978 2,238,747 3,174,988 718,286 578,605 39,521,811 39,866,114
At 31 December 2018

ANNUAL REPORT 201848
Notes to the Consolidated Financial StatementsAt 31 December 2018
6 PROFIT OF THE GROUP FOR THE YEAR Profit of the Group for the year is stated after charging:
2018 2017BD BD
(Restated)
Inventories recognised as an expense on sale of finished goods 27,083,958 27,218,382
Provision for slow moving and obsolete inventories (note 13) 62,970 71,312
Allowance for expected credit losses on trade receivables (note 14) 78,506 85,512
Operating lease rentals included in general and administration expenses 283,630 281,262
Gain on disposals of property, plant and equipment 31,570 2,833
2018 2017BD BD
Finance costs
Interest on term loans, import loans and a loans from non-controlling interests 139,550 162,925
Interest on bank overdrafts 22,980 28,597
Bank charges 15,630 14,506
178,160 206,028
2018 2017BD BD
Personnel costs
Salaries and wages 3,691,509 3,668,979
Contributions to Social Insurance Organisation (SIO), Bahrain and
Public Authority for Social Security, Kuwait 260,893 219,261
Employees’ end of service benefits (note 24) 177,117 192,735
Other benefits 981,632 966,050
5,111,151 5,047,025
The personnel costs have been presented in the consolidated statement of income under the following:
2018 2017BD BD
Costs of revenue 1,471,258 1,424,495
Personnel costs 3,639,893 3,622,530
5,111,151 5,047,025
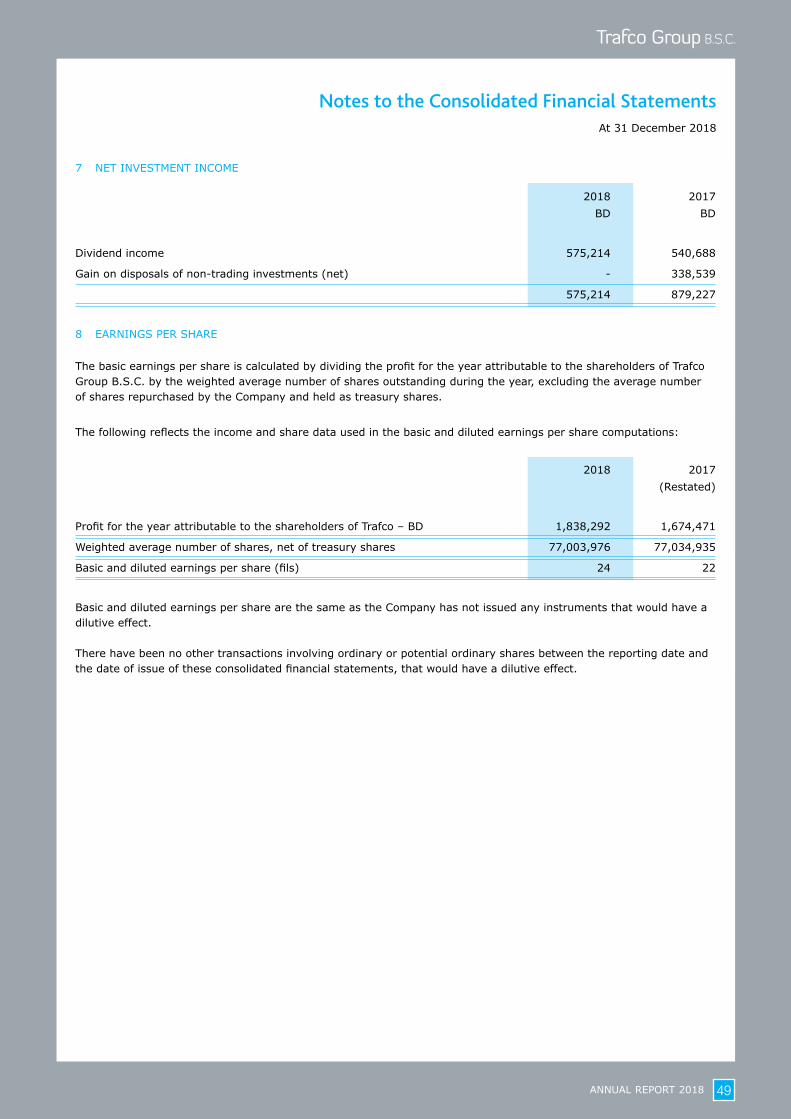
ANNUAL REPORT 2018 49
Notes to the Consolidated Financial Statements
2018 2017BD BD
Dividend income 575,214 540,688
Gain on disposals of non-trading investments (net) - 338,539
575,214 879,227
8 EARNINGS PER SHARE
The basic earnings per share is calculated by dividing the profit for the year attributable to the shareholders of Trafco Group B.S.C. by the weighted average number of shares outstanding during the year, excluding the average number of shares repurchased by the Company and held as treasury shares.
The following reflects the income and share data used in the basic and diluted earnings per share computations:
2018 2017(Restated)
Profit for the year attributable to the shareholders of Trafco – BD 1,838,292 1,674,471
Weighted average number of shares, net of treasury shares 77,003,976 77,034,935
Basic and diluted earnings per share (fils) 24 22
Basic and diluted earnings per share are the same as the Company has not issued any instruments that would have a dilutive effect. There have been no other transactions involving ordinary or potential ordinary shares between the reporting date and the date of issue of these consolidated financial statements, that would have a dilutive effect.
At 31 December 2018
7 NET INVESTMENT INCOME
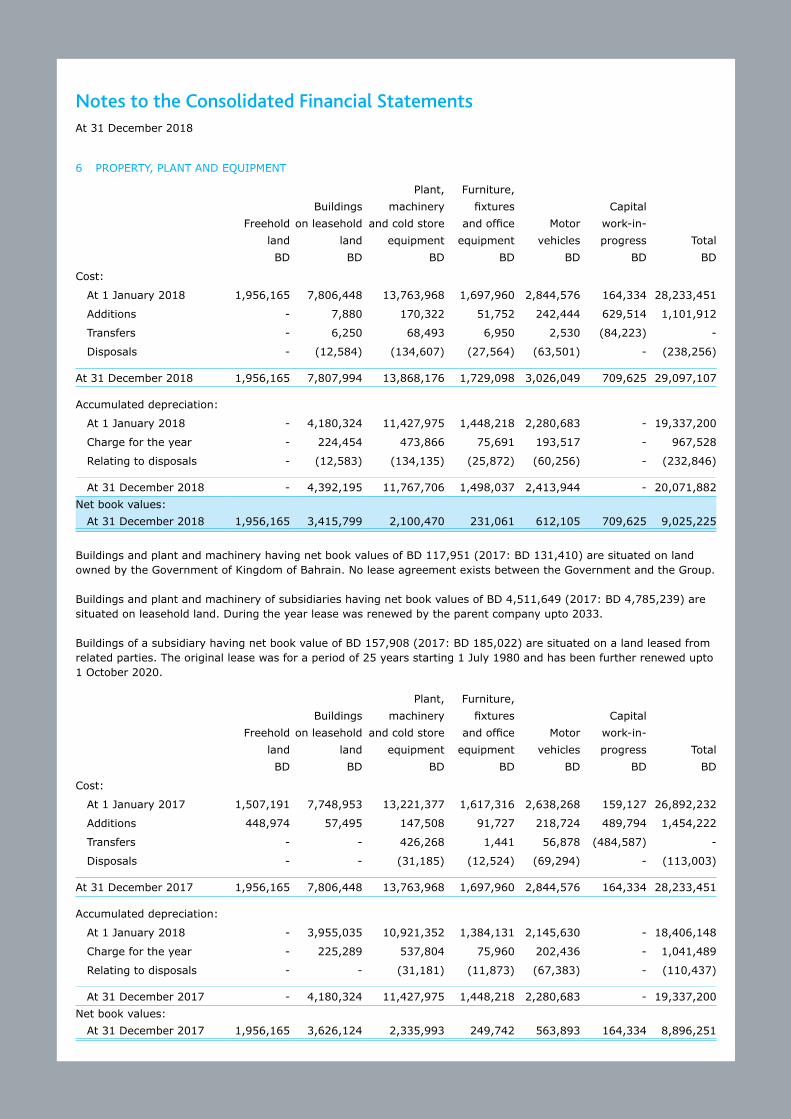
ANNUAL REPORT 201850
Notes to the Consolidated Financial StatementsAt 31 December 2018
Plant, Furniture,Buildings machinery fixtures Capital
Freehold on leasehold and cold store and office Motor work-in-land land equipment equipment vehicles progress TotalBD BD BD BD BD BD BD
Cost:
At 1 January 2018 1,956,165 7,806,448 13,763,968 1,697,960 2,844,576 164,334 28,233,451
Additions - 7,880 170,322 51,752 242,444 629,514 1,101,912
Transfers - 6,250 68,493 6,950 2,530 (84,223) -
Disposals - (12,584) (134,607) (27,564) (63,501) - (238,256)
At 31 December 2018 1,956,165 7,807,994 13,868,176 1,729,098 3,026,049 709,625 29,097,107
Accumulated depreciation:
At 1 January 2018 - 4,180,324 11,427,975 1,448,218 2,280,683 - 19,337,200
Charge for the year - 224,454 473,866 75,691 193,517 - 967,528
Relating to disposals - (12,583) (134,135) (25,872) (60,256) - (232,846)
At 31 December 2018 - 4,392,195 11,767,706 1,498,037 2,413,944 - 20,071,882 Net book values:
At 31 December 2018 1,956,165 3,415,799 2,100,470 231,061 612,105 709,625 9,025,225
Buildings and plant and machinery having net book values of BD 117,951 (2017: BD 131,410) are situated on land owned by the Government of Kingdom of Bahrain. No lease agreement exists between the Government and the Group. Buildings and plant and machinery of subsidiaries having net book values of BD 4,511,649 (2017: BD 4,785,239) are situated on leasehold land. During the year lease was renewed by the parent company upto 2033. Buildings of a subsidiary having net book value of BD 157,908 (2017: BD 185,022) are situated on a land leased from related parties. The original lease was for a period of 25 years starting 1 July 1980 and has been further renewed upto 1 October 2020.
Plant, Furniture,Buildings machinery fixtures Capital
Freehold on leasehold and cold store and office Motor work-in-land land equipment equipment vehicles progress TotalBD BD BD BD BD BD BD
Cost:
At 1 January 2017 1,507,191 7,748,953 13,221,377 1,617,316 2,638,268 159,127 26,892,232
Additions 448,974 57,495 147,508 91,727 218,724 489,794 1,454,222
Transfers - - 426,268 1,441 56,878 (484,587) -
Disposals - - (31,185) (12,524) (69,294) - (113,003)
At 31 December 2017 1,956,165 7,806,448 13,763,968 1,697,960 2,844,576 164,334 28,233,451
Accumulated depreciation:
At 1 January 2018 - 3,955,035 10,921,352 1,384,131 2,145,630 - 18,406,148
Charge for the year - 225,289 537,804 75,960 202,436 - 1,041,489
Relating to disposals - - (31,181) (11,873) (67,383) - (110,437)
At 31 December 2017 - 4,180,324 11,427,975 1,448,218 2,280,683 - 19,337,200 Net book values:
At 31 December 2017 1,956,165 3,626,124 2,335,993 249,742 563,893 164,334 8,896,251
6 PROPERTY, PLANT AND EQUIPMENT
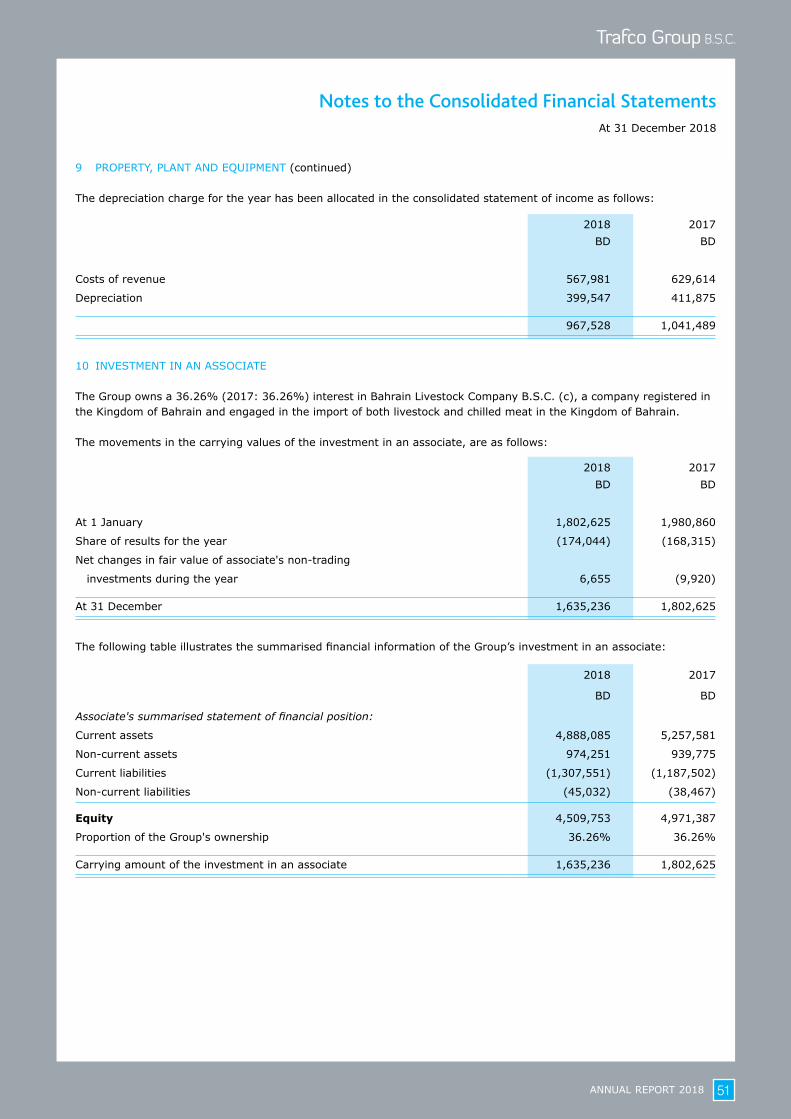
ANNUAL REPORT 2018 51
Notes to the Consolidated Financial StatementsAt 31 December 2018
2018 2017BD BD
Costs of revenue 567,981 629,614
Depreciation 399,547 411,875
967,528 1,041,489
10 INVESTMENT IN AN ASSOCIATE The Group owns a 36.26% (2017: 36.26%) interest in Bahrain Livestock Company B.S.C. (c), a company registered in the Kingdom of Bahrain and engaged in the import of both livestock and chilled meat in the Kingdom of Bahrain.
The movements in the carrying values of the investment in an associate, are as follows:
2018 2017BD BD
At 1 January 1,802,625 1,980,860
Share of results for the year (174,044) (168,315)
Net changes in fair value of associate's non-trading
investments during the year 6,655 (9,920)
At 31 December 1,635,236 1,802,625
The following table illustrates the summarised financial information of the Group’s investment in an associate:
2018 2017
BD BD
Associate's summarised statement of financial position:
Current assets 4,888,085 5,257,581
Non-current assets 974,251 939,775
Current liabilities (1,307,551) (1,187,502)
Non-current liabilities (45,032) (38,467)
Equity 4,509,753 4,971,387
Proportion of the Group's ownership 36.26% 36.26%
Carrying amount of the investment in an associate 1,635,236 1,802,625
9 PROPERTY, PLANT AND EQUIPMENT (continued) The depreciation charge for the year has been allocated in the consolidated statement of income as follows:

ANNUAL REPORT 201852
Notes to the Consolidated Financial StatementsAt 31 December 2018
10 INVESTMENT IN AN ASSOCIATE (continued)
2018 2017
BD BD
Associate's summarised statement of comprehensive income:
Revenue 5,680,567 7,711,744
Costs of revenue (5,298,160) (7,226,647)
General and administration expenses (556,204) (681,132)
Depreciation (130,804) (143,851)
Finance costs (175,389) (124,303)
Loss for the year (479,990) (464,189)
Proportion of the Group's ownership 36.26% 36.26%
Group's share of results for the year (174,044) (168,315)
The share of results of the associate is recognised based on the approved management accounts for the years ended 31 December 2018 and 31 December 2017.
The associate has no significant contingencies or capital commitments as at 31 December 2018 and 31 December 2017.
11 NON-TRADING INVESTMENTS
2018 2017BD BD
Quoted equity investments at FVOCI:
- in Bahrain 6,227,761 5,497,191
- other GCC countries 546,769 547,039
6,774,530 6,044,230
Unquoted equity investments at FVOCI:
- in Bahrain 3,750,897 3,602,368
- other GCC countries 135,204 205,802
3,886,101 3,808,170
Total equity investments at FVOCI 10,660,631 9,852,400
Quoted debt instruments at FVOCI:
- in Bahrain 300,000 -
10,960,631 9,852,400

ANNUAL REPORT 2018 53
Notes to the Consolidated Financial StatementsAt 31 December 2018
11 NON-TRADING INVESTMENTS (continued)
Movements in non-trading investments during the year were as follows:
2018 2017
BD BD
At 1 January 9,852,400 9,484,699
Purchase of investments 884,166 193,677
Net changes in fair values 224,065 1,096,749
Disposals of investments at book value - (767,143)
Return of capital - (15,000)
Impairment in value - (140,582)
At 31 December 10,960,631 9,852,400
Quoted equity investments
The fair values of the quoted equity investments are determined by reference to published price quotations in active markets.
Unquoted equity investments
The fair values of unquoted equity investments have been estimated using fair value provided by the investment managers or other appropriate valuation techniques including fair values determined based on unobservable inputs using market multiples or other appropriate valuation methodologies.
Quoted debt instruments
The fair values of the quoted debt instruments are determined by reference to published price quotations in an active market.
12 FAIR VALUE HIERARCHY
The following table provides the fair value measurement hierarchy of the Group’s assets and liabilities
Fair value measurement using
Quoted prices Significant Significant
in active observable unobservable
markets inputs inputs
Level 1 Level 2 Level 3 Total
31 December 2018 BD BD BD BD
Assets measured at fair value
Non-trading investments
Quoted equity (note 11) 6,774,530 - - 6,774,530
Unquoted equity (note 11) - - 3,886,101 3,886,101
Quoted debt (note 11) 300,000 - - 300,000
7,074,530 - 3,886,101 10,960,631

ANNUAL REPORT 201854
Notes to the Consolidated Financial StatementsAt 31 December 2018
12 FAIR VALUE HIERARCHY (continued)
Liabilities measured at fair value: There were no liabilities measured at fair value as of 31 December 2018 and 31 December 2017.
Fair value measurement using
Quoted prices Significant Significant
in active observable unobservable
markets inputs inputs
Level 1 Level 2 Level 3 Total31 December 2017 BD BD BD BD
Assets measured at fair value
Non-trading investments
Quoted equity (note 11) 6,044,230 - - 6,044,230
Unquoted debt (note 11) - - 3,808,170 3,808,170
6,044,230 - 3,808,170 9,852,400
During the years ended 31 December 2018 and 31 December 2017, there were no transfers between Level 1 and Level 2 fair value measurements, and no transfers into and out of Level 3 fair value measurements.
Level 3 equity securities have been estimated using fair value provided by the investment managers or other appropriate valuation techniques including fair values determined based on unobservable inputs using market multiples or other appropriate valuation methodologies.
Reconciliation of fair value measurements of level 3 financial instrumentsMovements in the fair values of financial assets classified as level 3 category were as follows:
2018 2017BD BD
At 1 January 3,808,170 2,513,433
Return of capital - (15,000)
Net changes in fair value 77,931 1,309,737
At 31 December 3,886,101 3,808,170
13 INVENTORIES
2018 2017BD BD
(Restated)
Goods for sale 3,080,121 3,590,732
Raw materials and consumables [net of provision for slow moving
and obsolete inventories of BD 247,686 (2017: BD 222,039)] 2,052,323 2,303,925
Goods-in-transit 1,655,268 1,230,508
Finished goods [net of provision for slow moving and obsolete
inventories of BD 15,712 (2017: BD 7,825)] 764,662 835,647
Spare parts and other items [net of allowance for slow moving and
obsolete inventories of BD 456,518 (2017: BD 427,082)] 176,829 199,274
7,729,203 8,160,086

ANNUAL REPORT 2018 55
Notes to the Consolidated Financial StatementsAt 31 December 2018
13 INVENTORIES (continued)
Movements in the provision for slow moving and obsolete inventories were as follows:
2018
Raw materials Spare parts
and Finished andconsumables goods other items Total
BD BD BD BD
At 1 January 2018 222,039 7,825 427,082 656,946
Net charge for the year 25,647 7,887 29,436 62,970
At 31 December 2018 247,686 15,712 456,518 719,916
2017
Raw materials Spare partsand Finished and
consumables goods other items TotalBD BD BD BD
At 1 January 2017 180,350 7,638 397,646 585,634 Net charge for the year 41,689 187 29,436 71,312
At 31 December 2017 222,039 7,825 427,082 656,946
14 TRADE AND OTHER RECEIVABLES
2018 2017BD BD
Trade receivables [net of allowance for expected credit loss
BD 665,592 (2017: BD 589,431)] 7,594,654 7,456,907
Trade receivables - related parties (note 30) 149,119 131,268
7,743,773 7,588,175
Other receivables 429,494 506,929
Prepayments 176,201 181,528
Deposits 27,574 19,627
Due from related parties (note 30) - 2,626
8,377,042 8,298,885
Terms and conditions of the above financial assets are as follows:
- Trade receivables are non-interest bearing and are normally settled on 60 to 90 day terms.- For terms and conditions of trade receivables - related parties and amounts due to related parties, refer to note 30.- Other receivables are non interest-bearing and have terms ranging between one and three months.
Trade receivables at a value of BD 665,592 (2017: BD 589,431) were impaired and provided for as at 31 December 2018. For disclosures of the Group’s credit risk management processes, refer to note 32.

ANNUAL REPORT 201856
Notes to the Consolidated Financial StatementsAt 31 December 2018
14 TRADE AND OTHER RECEIVABLES (continued)
Movements in the expected credit losses of trade receivables were as follows:
2018 2017
BD BD
At 1 January 589,431 562,811 IFRS 9 transition adjustment 67,305 - Charge for the year 78,506 85,512 Amounts written off (69,650) (58,892)
At 31 December 665,592 589,431
Neither past Past due but not impaired
due nor Less than 30 to 60 More thanTotal impaired 30 days days 60 days
BD BD BD BD BD
2018
Gross trade receivables 8,409,365 4,757,831 2,552,455 352,534 746,545 Expected credit loss (665,592) (11,087) (17,356) (2,865) (634,284)
At 31 December 7,743,773 4,746,744 2,535,099 349,669 112,261
2017 7,588,175 3,900,807 1,917,917 1,241,468 527,983
Unimpaired trade receivables are expected, on the basis of past experience, to be fully recoverable. It is not the practice of the Group to obtain collateral over trade receivables.
15 CASH AND CASH EQUIVALENTS
Cash and cash equivalents included in the consolidated statement of cash flows consist of the following amounts:
2018 2017BD BD
Bank balances and cash 1,987,607 2,779,561 Bank overdrafts (186,498) (364,869)
Cash and cash equivalents as at 31 December 1,801,109 2,414,692
Bank overdrafts are denominated mainly in Bahraini Dinars and the United States Dollars and carry interest at commercial rates.
The Group has BD 17,310,136 (2017: BD 15,593,807) of undrawn borrowing facilities as at 31 December 2018.
16 SHARE CAPITAL
2018 2017BD BD
Authorised:
100,000,000 (2017: 100,000,000) shares of BD 0.100 each 10,000,000 10,000,000
Issued, subscribed and fully paid-up:
80,675,052 (2017: 80,675,052) shares of BD 0.100 each 8,067,505 8,067,505
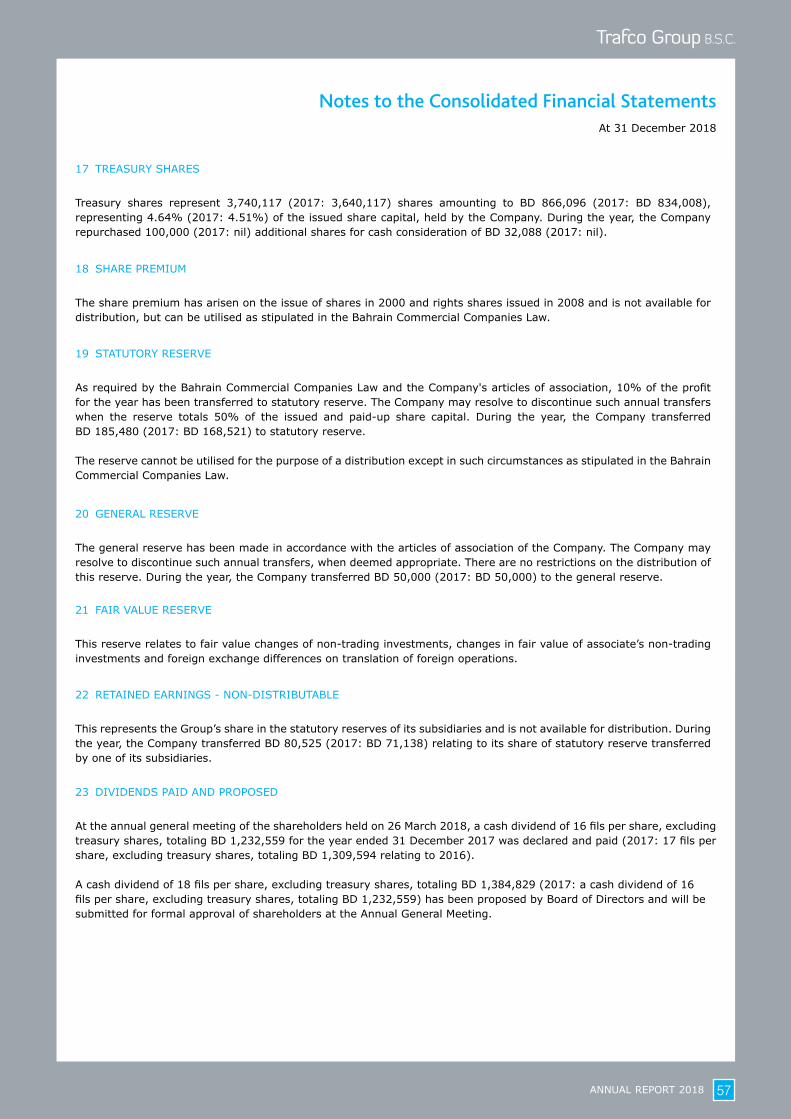
ANNUAL REPORT 2018 57
Notes to the Consolidated Financial StatementsAt 31 December 2018
17 TREASURY SHARES
Treasury shares represent 3,740,117 (2017: 3,640,117) shares amounting to BD 866,096 (2017: BD 834,008), representing 4.64% (2017: 4.51%) of the issued share capital, held by the Company. During the year, the Company repurchased 100,000 (2017: nil) additional shares for cash consideration of BD 32,088 (2017: nil).
18 SHARE PREMIUM
The share premium has arisen on the issue of shares in 2000 and rights shares issued in 2008 and is not available for distribution, but can be utilised as stipulated in the Bahrain Commercial Companies Law.
19 STATUTORY RESERVE
As required by the Bahrain Commercial Companies Law and the Company's articles of association, 10% of the profit for the year has been transferred to statutory reserve. The Company may resolve to discontinue such annual transfers when the reserve totals 50% of the issued and paid-up share capital. During the year, the Company transferred BD 185,480 (2017: BD 168,521) to statutory reserve.
The reserve cannot be utilised for the purpose of a distribution except in such circumstances as stipulated in the Bahrain Commercial Companies Law.
20 GENERAL RESERVE
The general reserve has been made in accordance with the articles of association of the Company. The Company may resolve to discontinue such annual transfers, when deemed appropriate. There are no restrictions on the distribution of this reserve. During the year, the Company transferred BD 50,000 (2017: BD 50,000) to the general reserve.
21 FAIR VALUE RESERVE
This reserve relates to fair value changes of non-trading investments, changes in fair value of associate’s non-trading investments and foreign exchange differences on translation of foreign operations.
22 RETAINED EARNINGS - NON-DISTRIBUTABLE
This represents the Group’s share in the statutory reserves of its subsidiaries and is not available for distribution. During the year, the Company transferred BD 80,525 (2017: BD 71,138) relating to its share of statutory reserve transferred by one of its subsidiaries.
23 DIVIDENDS PAID AND PROPOSED
At the annual general meeting of the shareholders held on 26 March 2018, a cash dividend of 16 fils per share, excluding treasury shares, totaling BD 1,232,559 for the year ended 31 December 2017 was declared and paid (2017: 17 fils per share, excluding treasury shares, totaling BD 1,309,594 relating to 2016).
A cash dividend of 18 fils per share, excluding treasury shares, totaling BD 1,384,829 (2017: a cash dividend of 16 fils per share, excluding treasury shares, totaling BD 1,232,559) has been proposed by Board of Directors and will be submitted for formal approval of shareholders at the Annual General Meeting.

ANNUAL REPORT 201858
Notes to the Consolidated Financial StatementsAt 31 December 2018
24 EMPLOYEES’ END OF SERVICE BENEFITS
Movements in the employees’ end of service benefits are as follows:
2018 2017
BD BD
At 1 January 1,303,829 1,216,365 Provided during the year (note 6) 177,117 192,735 Paid during the year (148,283) (105,271)
At 31 December 1,332,663 1,303,829
25 LOANS FROM NON-CONTROLLING INTERESTS
The loans were unsecured and had no fixed repayment terms. The loans carried an effective interest rate of 5% per annum and were fully repaid during the year.
26 TERM LOANS
2018 2017Interest rate Maturity BD BD
Loan from Bahrain Islamic Bank B.S.C. 6.25% p.a. March 2025 454,080 -
Loan from Ahli United Bank B.S.C. - 1 Three-month BIBOR plus
3% p.a.
March 2019 20,841 104,173
Loan from National Bank of Bahrain B.S.C. Three-month BIBOR plus 2.15% p.a.
December 2018
- 125,000
Loan from Ahli United Bank B.S.C. - 2 Three-month BIBOR plus 2.25% p.a.
May 2018 - 666,668
474,921 895,841
The term loans are presented in the consolidated statement of financial position as follows:
2018 2017BD BD
Non-current 392,361 437,512
Current 82,560 458,329
474,921 895,841

ANNUAL REPORT 2018 59
Notes to the Consolidated Financial StatementsAt 31 December 2018
26 TERM LOANS (continued)
Loan instalments payable within twelve months from the consolidated statement of financial position date are disclosed as current portion and remaining are disclosed as non-current. These loans are secured by promissory notes issued by the Group.
The terms of the loan agreements require compliance with certain covenants relating to financial ratios and the declaration of dividends to shareholders. As of 31 December 2018 the Group is in compliance with all applicable covenants.
27 TRADE AND OTHER PAYABLES
2018 2017BD BD
(Restated)
Trade payables 3,734,155 3,280,581
Accrued expenses 1,598,916 1,545,280
Unclaimed dividends payable 440,616 435,551
Other payables 483,189 354,794
Due to related parties (note 30) 281,795 423,403
6,538,671 6,039,609
Terms and conditions of the above financial liabilities: - Trade payables are non-interest bearing and are normally settled on 60 to 90 day terms. - For terms and conditions relating to amounts due to related parties, refer to note 30. - Other payables are non-interest bearing and have average terms ranging between one to six months.
28 IMPORT LOANS These represent loans obtained from commercial banks for the import of raw materials and finished goods with a weighted average effective interest rate of 5.04% (2017: 3.52%) per annum and secured by promissory notes issued by the Group. 29 MATERIAL PARTLY-OWNED SUBSIDIARY The Group holds 51% shareholding in Awal Dairy Company W.L.L., a subsidiary incorporated in the Kingdom of Bahrain and engaged in production and supply of milk, juices, ice cream and tomato paste.

ANNUAL REPORT 201860
Notes to the Consolidated Financial StatementsAt 31 December 2018
29 MATERIAL PARTLY-OWNED SUBSIDIARY (continued) The summarised financial information of the subsidiary as at 31 December 2018 and 31 December 2017 is provided below. This information is based on amounts before inter-company eliminations.
2018 2017Summarised statement of comprehensive income BD BD
(Restated)
Revenue 14,700,743 14,640,621
Other operating income 73,020 26,348
Costs of revenue (10,607,563) (10,704,504)
Selling and distribution expenses (645,017) (654,992)
Personnel costs (1,401,683) (1,366,815)
General and administration expenses (410,351) (345,675)
Finance costs (16,885) (56,115)
Depreciation (146,081) (145,266)
Exchange gains - net 14,082 23,144
Profit for the year 1,560,265 1,416,746
Total comprehensive income (15,868) 25,811
Total comprehensive income 1,544,397 1,442,557
Attributable to non-controlling interests 756,755 706,853
Dividends paid to non-controlling interest 357,162 -
2018 2017Summarised statement of financial position: BD BD
(Restated)
Inventories and cash and bank balances (current) 4,549,554 5,254,657
Property, plant and equipment and other (non-current) 1,596,604 1,359,518
Non-trading investments (non-current) 356,062 -
Trade and other receivables (current) 3,147,933 3,228,069
Trade and other payable (current) (2,697,578) (2,777,877)
Interest-bearing loans and borrowings (non-current) - (1,000,000)
Employees' end of service benefits (non-current) (613,336) (543,534)
Equity 6,339,239 5,520,833
Attributable to:
Equity holders of parent 3,233,012 2,815,625
Non-controlling interests 3,106,227 2,705,208
6,339,239 5,520,833

ANNUAL REPORT 2018 61
Notes to the Consolidated Financial StatementsAt 31 December 2018
29 MATERIAL PARTLY-OWNED SUBSIDIARY (continued)
2018 2017Summarised statement of cash flows information: BD BD
(Restated)
Net cash flows from operating activities 2,428,792 2,439,686
Net cash flows used in investing activities (946,544) (400,533)
Net cash flows used in financing activities (1,728,900) (33,098)
Foreign currency translation adjustments (15,868) 25,811
Net (decrease) increase in cash and cash equivalents (262,520) 2,031,866
30 RELATED PARTY TRANSACTIONS Related parties represent associated companies, major shareholders, directors, companies having common directors and key management personnel of the Group, and entities controlled, jointly controlled or significantly influenced by such parties. Pricing policies and terms of these transactions are approved by the Group’s management. Transactions and balances with related parties included in the consolidated statement of financial position and consolidated statement of income are as follows: Name Relationship Nature of transactions
Bahrain Livestock Company B.S.C. (c) Associated company Services rendered and dividend received.
Qatari Bahraini Food Trading Co. L.L.C. Associated company Company is under liquidation process.
Yousuf Abdul Rehman Engineer Holding W.L.L. Common director Services received.
Intershield W.L.L. Common director Insurance services.
United Paper Industries B.S.C. Common director Purchases of packaging materials.
Delmon Poultry Company B.S.C. Common director Purchases and dividend received.
Manama Travel Centre Common director Services received.
Mohammad Jalal Group Common director Purchases and sales of goods.
Saleh Al Saleh Company W.L.L. Common director Purchases and sales of goods.
Ebrahim K Kanoo B.S.C. (c) Common director Purchase of spare parts and services received.
Mohamed Ali Zainal Abdulla B.S.C. (c) Common director Purchases and sales of goods.
Fakhro Electronics W.L.L. Common director Sales.
National Transport Establishment Common director Services received.
Budget - Rent a car Common director Services received.
Bahrain Cinema Company B.S.C. Common director Sales.
Khalid Almoayed and Sons W.L.L. Common director Purchases.
BMMI B.S.C. Common director Purchases, sales of goods and dividend received.
The Food Supply Company W.L.L. Common director Sales of goods.
BANZ Group B.S.C. (c) Common director Sales and dividend received.
Abdulla Yousif Fakhro and Sons Common director Sales of goods and services received.

ANNUAL REPORT 201862
30 RELATED PARTY TRANSACTIONS (continued)
Revenue
Purchase ofgoods and
services
Otheroperating
incomeTrade
receivables
Due fromrelatedparties
Due torelatedparties
31 December 2018 BD BD BD BD BD BD
Associated companies 149 115,683 5,974 649 - 7,014
Entities with common directors 493,629 1,507,467 323,441 148,470 - 274,781
493,778 1,623,150 329,415 149,119 - 281,795
Revenue Purchase ofgoods and
services
Otheroperating
income
Tradereceivables
Due fromrelatedparties
Due torelatedparties
31 December 2017 BD BD BD BD BD BD
Associated companies - 190,940 55,667 - 2,626 44,604
Entities with common directors 453,954 1,084,142 300,706 131,268 - 378,799
453,954 1,275,082 356,373 131,268 2,626 423,403
Terms and conditions of transactions with related partiesPurchases from and sales to related parties are made at normal market prices. Outstanding balances at the year-end arise in the normal course of business, are unsecured, interest free and settlement occurs in cash except for loan from non-controlling interests (note 25). For the years ended 31 December 2018 and 31 December 2017, the Group has not recorded any impairment of amounts owed by related parties. Compensation of key management personnelThe remuneration of directors and other members of key management personnel during the year was as follows:
2018 2017
BD BD
(Restated)
Directors' remuneration 107,625 112,750
Directors' fees 54,150 53,550
161,775 166,300
Short-term benefits 245,515 257,729
Employees' end of service benefits 11,461 16,182
256,976 273,911
418,751 440,211
During the year, the Group accrued Directors’ remuneration which was previously recognised in the consolidated statement of income only upon payment. The retained earnings have been adjusted to reflect this change respectively.
Notes to the Consolidated Financial StatementsAt 31 December 2018
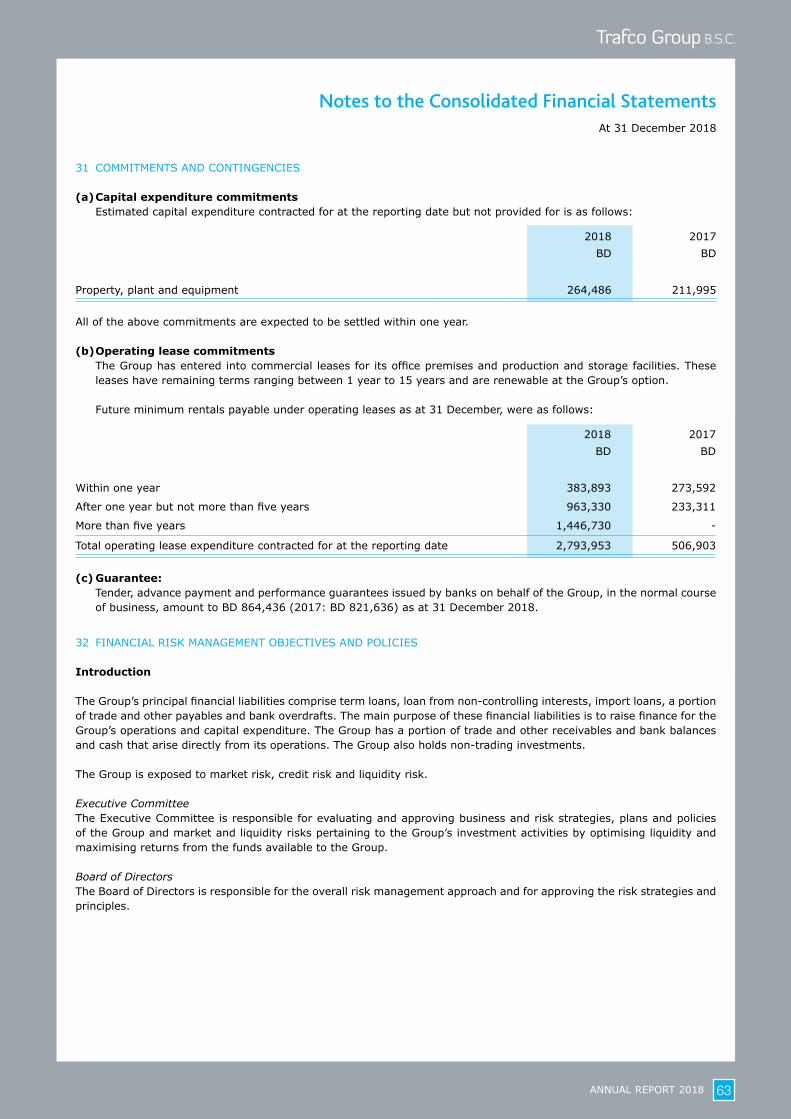
ANNUAL REPORT 2018 63
31 COMMITMENTS AND CONTINGENCIES
(a) Capital expenditure commitments Estimated capital expenditure contracted for at the reporting date but not provided for is as follows:
2018 2017BD BD
Property, plant and equipment 264,486 211,995
All of the above commitments are expected to be settled within one year.
(b) Operating lease commitments The Group has entered into commercial leases for its office premises and production and storage facilities. These leases have remaining terms ranging between 1 year to 15 years and are renewable at the Group’s option.
Future minimum rentals payable under operating leases as at 31 December, were as follows:
2018 2017BD BD
Within one year 383,893 273,592
After one year but not more than five years 963,330 233,311
More than five years 1,446,730 -
Total operating lease expenditure contracted for at the reporting date 2,793,953 506,903
(c) Guarantee: Tender, advance payment and performance guarantees issued by banks on behalf of the Group, in the normal course of business, amount to BD 864,436 (2017: BD 821,636) as at 31 December 2018.
32 FINANCIAL RISK MANAGEMENT OBJECTIVES AND POLICIES
Introduction The Group’s principal financial liabilities comprise term loans, loan from non-controlling interests, import loans, a portion of trade and other payables and bank overdrafts. The main purpose of these financial liabilities is to raise finance for the Group’s operations and capital expenditure. The Group has a portion of trade and other receivables and bank balances and cash that arise directly from its operations. The Group also holds non-trading investments. The Group is exposed to market risk, credit risk and liquidity risk. Executive Committee The Executive Committee is responsible for evaluating and approving business and risk strategies, plans and policies of the Group and market and liquidity risks pertaining to the Group’s investment activities by optimising liquidity and maximising returns from the funds available to the Group. Board of DirectorsThe Board of Directors is responsible for the overall risk management approach and for approving the risk strategies and principles.
Notes to the Consolidated Financial StatementsAt 31 December 2018

ANNUAL REPORT 201864
32 FINANCIAL RISK MANAGEMENT OBJECTIVES AND POLICIES (continued) Market risk Market risk is the risk that the fair value of future cash flows of a financial instrument will fluctuate because of changes in market prices. Market price risk comprises of interest rate risk, foreign currency risk and equity price risk. Financial instruments affected by market risk include non-trading investments, a portion of trade and other receivables, bank balances and cash, term loans, import loans, loans from non-controlling interest, a portion of trade and other payables and bank overdrafts. The sensitivity analysis have been prepared on the basis that the amount of net debt, the ratio of fixed to floating interest rates of the debt and the proportion of financial instruments in foreign currencies are all constant at 31 December 2018 and 31 December 2017. The following assumptions have been made in calculating the sensitivity analysis: a) The consolidated statement of financial position sensitivity relates to financial assets and financial liabilities as at 31 December 2018 and 31 December 2017; b) The sensitivity of the relevant consolidated statement of income item is the effect of the assumed changes in respective market risks. This is based on the financial assets and financial liabilities held at 31 December 2018 and 31 December 2017; and c) The sensitivity of equity is calculated by considering the effect of non-trading investments and translation of foreign operations at 31 December 2018 and 31 December 2017 for the effects of the assumed changes of the underlying risk. Interest rate risk Interest rate risk is the risk that the fair value or future cash flows of a financial instrument will fluctuate because of changes in interest rates. The Group is exposed to interest rate risk on its floating interest rate bearing liabilities (bank overdrafts and certain term loans). The following table demonstrates the sensitivity of the consolidated statement of income to reasonably possible changes in interest rates, with all other variables held constant. The Group’s profit for the year is affected through the impact on floating interest bearing bank overdrafts and certain term loans, as follows:
2018 2017
Increase (decrease) in basis points +50 -50 +50 -50
(Decrease) increase in profit [in BD] (1,037) 1,037 (5,679) 5,679
Foreign currency risk Foreign currency risk is the risk that the fair value or future cash flows of a financial instrument will fluctuate because of changes in foreign exchange rates. The Group’s exposure to the risk of changes in foreign exchange rates relates primarily to the Group’s operating activities (when revenue or expense is denominated in a different currency from the Group’s functional currency). The Group’s exposure to foreign currency risk primarily arising from trade payables denominated in Swiss Francs, Pound Sterling, Kuwaiti Dinars and Euros is not material.
Notes to the Consolidated Financial StatementsAt 31 December 2018

ANNUAL REPORT 2018 65
Notes to the Consolidated Financial StatementsAt 31 December 2018
32 FINANCIAL RISK MANAGEMENT OBJECTIVES AND POLICIES (continued)
Market risk (continued)
Foreign currency risk (continued)
The following table demonstrates the sensitivity to a reasonably possible change in the foreign currency exchange rate, with all other variables held constant, of the Group’s profit (due to changes in the fair value of monetary assets and liabilities) and the Group’s other comprehensive income (due to changes in the net investment in a foreign operations).
Change inexchange rate
Effect on theconsolidated statement of
income
Effect on theon consolidated statements of
comprehensive income2018 2017 2018 2017
BD BD BD BD
EURO +5% (1,264) (399) - - EURO -5% 1,264 399 - -
Other currencies +5% (2,852) (8,868) - - Other currencies -5% 2,852 8,868 - -
Kuwaiti Dinar +5% - - 41,615 43,604 Kuwaiti Dinar -5% - - (41,615) (43,604)
As the Bahraini Dinar is pegged to the United States (US) Dollar, balances in US Dollars and currencies pegged to the US Dollar are not considered to represent a significant foreign currency risk. Equity price riskEquity price risk is the risk that the value of a financial instrument will fluctuate as a result of changes in market prices, whether those changes are caused by factors specific to the individual investment or its issuer, or factors affecting all investments traded in the market. The Group manages equity price risk through diversification and placing limits on individual and total equity investments. Reports on the investment portfolio are submitted to the Executive Committee on a regular basis. The Executive Committee reviews and approves all investment decisions. The significant unobservable inputs used in the fair value measurement categorised within Level 3 of the fair value hierarchy together with a quantitative sensitivity analysis, with all other variables held constant, as at 31 December 2018 and 31 December 2017 are shown below: A 5% increase in the significant unobservable inputs used (illiquidity discount and minority discount) would result in a reduction in fair value of the non-trading investments ranging between BD 220,561 to BD 242,671 and vice versa. Credit riskCredit risk is the risk that a counterparty will not meet its obligations under a financial instrument or customer contract, leading to a financial loss. The Group is exposed to credit risk from its operating activities (primarily for trade receivables) and from its financing activities, including bank balances and other financial instruments. Trade and other receivablesCustomer credit risk is managed by each entity as per Group’s established policy, procedures and control relating to customer credit risk management. Outstanding customer receivables are regularly monitored. An impairment analysis is performed at each reporting date using a provision matrix to measure expected credit losses. The provision rates are based on days past due for groupings of various customer segments with similar loss patterns (i.e., by customer type). The calculation reflects the probability-weighted outcome, the time value of money and reasonable and supportable information that is available at the reporting date about past events, current conditions and forecasts of future economic conditions. Generally, trade receivables are written-off if past due for more than one year.
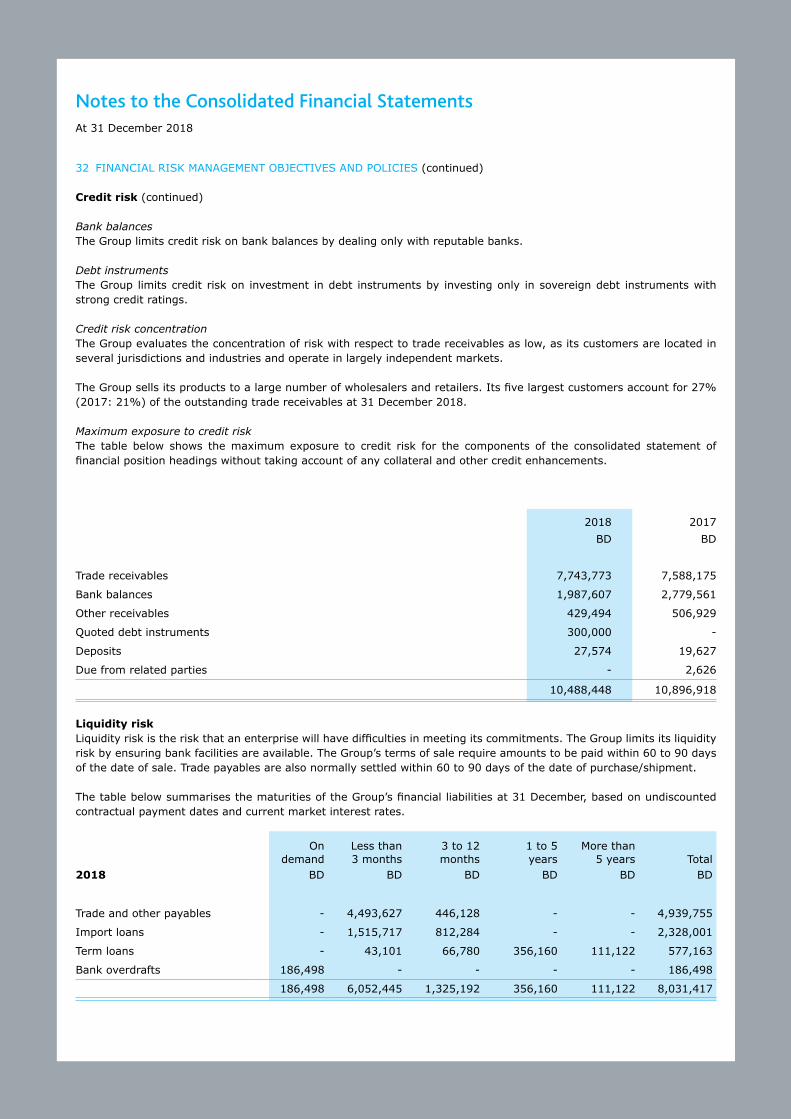
ANNUAL REPORT 201866
32 FINANCIAL RISK MANAGEMENT OBJECTIVES AND POLICIES (continued)
Credit risk (continued)
Bank balances The Group limits credit risk on bank balances by dealing only with reputable banks. Debt instrumentsThe Group limits credit risk on investment in debt instruments by investing only in sovereign debt instruments with strong credit ratings. Credit risk concentration The Group evaluates the concentration of risk with respect to trade receivables as low, as its customers are located in several jurisdictions and industries and operate in largely independent markets. The Group sells its products to a large number of wholesalers and retailers. Its five largest customers account for 27% (2017: 21%) of the outstanding trade receivables at 31 December 2018.
Maximum exposure to credit risk The table below shows the maximum exposure to credit risk for the components of the consolidated statement of financial position headings without taking account of any collateral and other credit enhancements.
2018 2017BD BD
Trade receivables 7,743,773 7,588,175
Bank balances 1,987,607 2,779,561
Other receivables 429,494 506,929
Quoted debt instruments 300,000 -
Deposits 27,574 19,627
Due from related parties - 2,626
10,488,448 10,896,918
Liquidity risk Liquidity risk is the risk that an enterprise will have difficulties in meeting its commitments. The Group limits its liquidity risk by ensuring bank facilities are available. The Group’s terms of sale require amounts to be paid within 60 to 90 days of the date of sale. Trade payables are also normally settled within 60 to 90 days of the date of purchase/shipment.
The table below summarises the maturities of the Group’s financial liabilities at 31 December, based on undiscounted contractual payment dates and current market interest rates.
Ondemand
Less than3 months
3 to 12months
1 to 5years
More than5 years Total
2018 BD BD BD BD BD BD
Trade and other payables - 4,493,627 446,128 - - 4,939,755
Import loans - 1,515,717 812,284 - - 2,328,001
Term loans - 43,101 66,780 356,160 111,122 577,163
Bank overdrafts 186,498 - - - - 186,498
186,498 6,052,445 1,325,192 356,160 111,122 8,031,417
Notes to the Consolidated Financial StatementsAt 31 December 2018

ANNUAL REPORT 2018 67
32 FINANCIAL RISK MANAGEMENT OBJECTIVES AND POLICIES (continued)
Ondemand
Less than3 months
3 to 12months
1 to 5years Total
BD BD BD BD BD
(Restated) (Restated) (Restated) (Restated) (Restated)
2017
Trade and other payables - 4,006,307 488,013 - 4,494,320
Import loans - 2,971,320 - - 2,971,320
Term loans - 214,707 268,746 503,743 987,196
Loan from non-controlling
interests - - - 621,250 621,250
Bank overdrafts 364,869 - - - 364,869
364,869 7,192,334 756,759 1,124,993 9,438,955
Changes in liabilities arising from financing activities of the consolidated statement of cash flows
As at1 January
2018
Cash flows Dividenddeclared
As at31 December
2018 Availed Payments
BD BD BD BD BD
Unclaimed dividend payable 435,551 - (1,227,494) 1,232,559 440,616
Term loans 895,841 500,000 (920,920) - 474,921
Import loans 2,946,277 10,612,868 (11,259,998) - 2,299,147
Loans from non-controlling
interests 497,000 - (497,000) - -
4,774,669 11,112,868 (13,905,412) 1,232,559 3,214,684
As at1 January
2017
Cash flows Dividenddeclared
As at31 December
2017 Availed Payments
BD BD BD BD BD
Unclaimed dividend payable 431,294 - (1,305,337) 1,309,594 435,551
Term loans 616,452 750,000 (470,611) - 895,841
Import loans 3,069,844 12,371,364 (12,494,931) - 2,946,277
Loans from non-controlling
interests 497,000 - - - 497,000
4,614,590 13,121,364 (14,270,879) 1,309,594 4,774,669 Capital management The primary objective of the Group’s capital management is to ensure that it maintains a healthy capital base in order to support its business and maximise shareholders’ value. The Group manages its capital structure and makes adjustments to it in light of changes in economic conditions. In order to maintain or adjust the capital structure, the Company may adjust the dividends paid to shareholders, repurchase of own shares, or issue new shares.
Notes to the Consolidated Financial StatementsAt 31 December 2018

ANNUAL REPORT 201868
32 FINANCIAL RISK MANAGEMENT OBJECTIVES AND POLICIES (continued)
Capital management (continued)
No changes were made in the objectives, policies or processes during the years ended 31 December 2018 and 31 December 2017.
The Group monitors capital on the basis of the debt-to-equity ratio. This ratio is calculated as net debt divided by equity. Net debt is calculated as total debt (i.e. term loans, loan from non-controlling interests, trade and other payables, import loans and net cash and cash equivalents). Equity comprises all components of equity (i.e. share capital, share premium, statutory reserve, general reserve, retained earnings-distributable, retained earnings-not distributable, fair value reserve and proposed appropriations).
2018 2017
BD BD
(Restated)
Term loans 474,921 895,841
Loan from non-controlling interests - 497,000
Trade and other payables 6,538,671 6,039,609
Import loans 2,299,147 2,946,277
Bank overdrafts 186,498 364,869
Contract and refund liabilities 166,052 167,135
Net debt 9,665,289 10,910,731
Total equity attributable to the shareholders of Trafco 25,641,930 24,903,016
Debt-to-equity ratio 38% 44%
32 FAIR VALUE MEASUREMENTS
Fair value is the price that would be received to sell an asset or paid to transfer a liability in an orderly transaction between market participants at the measurement date.
Fair value of financial instrumentsFair value of financial instruments is estimated based on the following methods and assumptions: a) Bank balances and cash, bank overdrafts, a portion of trade and other receivables and a portion of trade and other payables approximate their carrying amounts largely due to the short-term maturities of these instruments as at 31 December 2018 and 31 December 2017; b) Term loans, loans from non-controlling interests, import loans are evaluated by the Group based on parameters such as interest rates. The carrying amounts are not materially different from their fair values as at 31 December 2018 and 31 December 2017; and c) Fair value of quoted equity investments and quoted debt instruments is derived from quoted market prices in active markets or in the case of unquoted non-trading investments using market multiples or other appropriate valuation methodologies. Fair value of non-financial assets or liabilities The Group does not have any non-financial assets or liabilities which have been measured at fair value as at 31 December 2018 and 31 December 2017. Fair value hierarchyFor fair value hierarchy of the Group’s assets and liabilities refer to note 12.
Notes to the Consolidated Financial StatementsAt 31 December 2018

ANNUAL REPORT 2018 69
34 SEGMENT REPORTING For management purposes, the Group is organised into business units based on their products and services and has six reportable operating segments as follows: Imported foodstuff - Wholesale Import and distribution of foodstuff.
Imported foodstuff - Retail Import and distribution of foodstuff through supermarkets.
Investments Investment in quoted and unquoted securities (including investments in an associate).
Dairy products and beverages Production, processing and distribution of dairy products, juices, ice-cream, bottling of water and other items.
Fruits and vegetables Import and distribution of fruits, vegetables and other food items.
Storage and logistics Providing storage and logistics services. No operating segments have been aggregated to form the above reportable operating segments. Management monitors the operating results of its business units separately for the purpose of making decisions about resource allocation and performance assessment. Segment performance is evaluated based on operating profit or loss which in certain respects, as explained later in a table, is measured differently from operating profit or loss in the consolidated financial statements. Transfer prices between operating segments are on an arm’s length basis in a manner similar to transactions with third parties. The Group’s geographical segments are based on the location of the Group’s assets. Sales to external customers disclosed in geographical segments are based on the geographical location of its customers. Segment assets include all operating assets used by a segment and consist primarily of property, plant and equipment, inventories, trade and other receivables and bank balances and cash. Whilst the majority of the assets can be directly attributed to individual business segments, the carrying amounts of certain assets used jointly by two or more segments are allocated to the segments on a reasonable basis. Segment liabilities include all operating liabilities used by a segment and consist primarily of employees’ end of service benefits, loan from non-controlling interests, term loans, import loans, bank overdraft and trade and other payables. Whilst the majority of the liabilities can be directly attributed to individual business segments, the carrying amounts of certain liabilities used jointly by two or more segments are allocated to the segments on a reasonable basis. Revenue from operations for the year ended 31 December 2018 in the State of Kuwait amounted to BD 3,031,167 (2017: BD 2,967,441) and loss for the year ended 31 December 2018 amounted to BD 123,942 (2017: BD 194,536). All remaining revenue and profit for the year is generated from the primary geographical segment in the Kingdom of Bahrain. Total assets in the State of Kuwait amounted to BD 1,038,276 (2017: BD 1,128,610) and total liabilities amounted to BD 927,279 (2017: BD 1,045,468). All remaining assets and liabilities arise from the primary geographical segment in the Kingdom of Bahrain. Inter-segment revenues, transactions, assets and liabilities are eliminated upon consolidation and reflected in the “Adjustment and eliminations column.”
Notes to the Consolidated Financial StatementsAt 31 December 2018
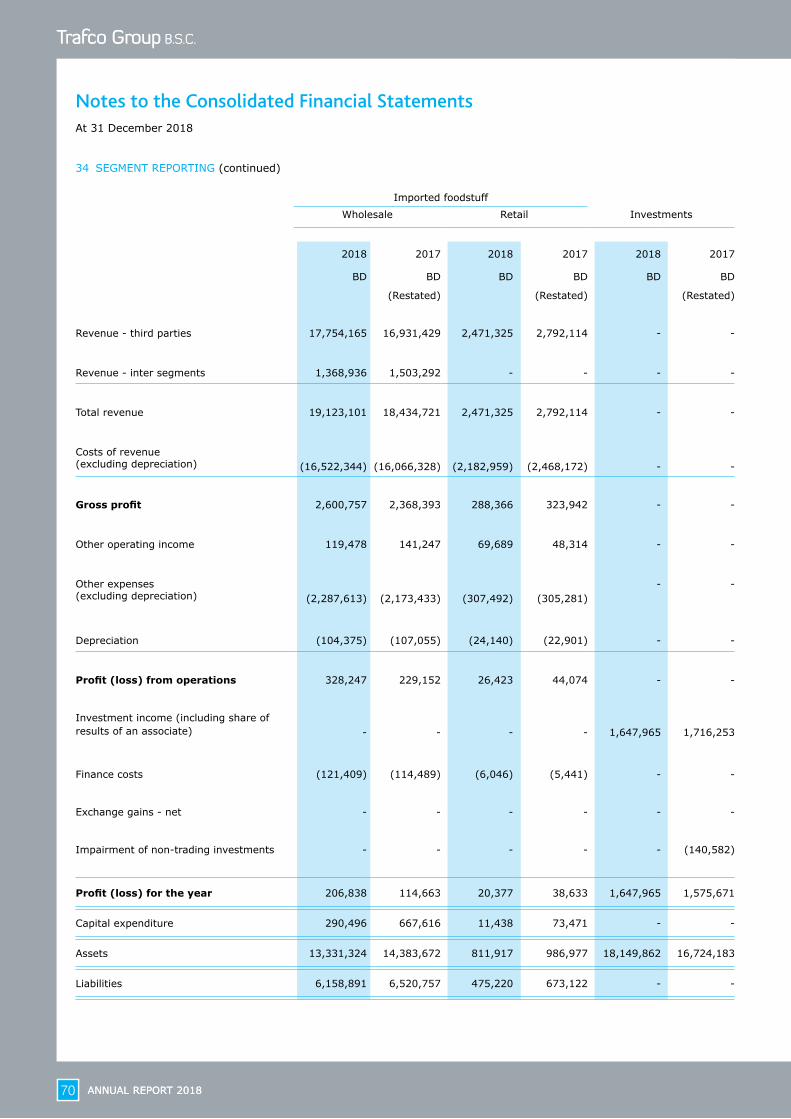
ANNUAL REPORT 201870 ANNUAL REPORT 201870
Imported foodstuff Dairy products andbeverages
Fruits andvegetables
Storage andlogistics
Adjustments andeliminations TotalWholesale Retail Investments
2018 2017 2018 2017 2018 2017 2018 2017 2018 2017 2018 2017 2018 2017 2018 2017
BD BD BD BD BD BD BD BD BD BD BD BD BD BD BD BD
(Restated) (Restated) (Restated) (Restated) (Restated) (Restated) (Restated) (Restated)
Revenue - third parties 17,754,165 16,931,429 2,471,325 2,792,114 - - 16,339,288 16,388,978 2,238,747 3,174,988 718,286 578,605 - - 39,521,811 39,866,114
Revenue - inter segments 1,368,936 1,503,292 - - - - 47,626 62,396 88,325 160,886 127,133 223,286 (1,632,020) (1,949,860) - -
Total revenue 19,123,101 18,434,721 2,471,325 2,792,114 - - 16,386,914 16,451,374 2,327,072 3,335,874 845,419 801,891 (1,632,020) (1,949,860) 39,521,811 39,866,114
Costs of revenue (excluding depreciation)
(16,522,344)
(16,066,328)
(2,182,959)
(2,468,172) - - (11,293,301)
(10,965,396) (1,883,905) (2,892,805) (221,353) (231,585)
1,504,887
1,425,955
(30,598,975)
(31,198,331)
Gross profit 2,600,757 2,368,393 288,366 323,942 - - 5,093,613 5,485,978 443,167 443,069 624,066 570,306 (127,133) (523,905) 8,922,836 8,667,783
Other operating income 119,478 141,247 69,689 48,314 - - 118,789 69,905 39,761 24,416 27,008 44,580 (173,434) (195,545) 201,291 132,917
Other expenses (excluding depreciation)
(2,287,613)
(2,173,433)
(307,492)
(305,281)
- - (2,936,004)
(2,992,511) (347,756) (488,826) (89,119) (84,206) 177,115 266,277
(5,790,869)
(5,777,980)
Depreciation (104,375) (107,055) (24,140) (22,901) - - (502,004) (559,885) (52,014) (61,833) (268,484) (273,304) (16,511) (16,511) (967,528) (1,041,489)
Profit (loss) from operations 328,247 229,152 26,423 44,074 - - 1,774,394 2,003,487 83,158 (83,174) 293,471 257,376 (139,963) (469,684) 2,365,730 1,981,231
Investment income (including share of results of an associate) - - - -
1,647,965 1,716,253 - - - - - -
(1,246,795)
(1,005,341) 401,170
710,912
Finance costs (121,409) (114,489) (6,046) (5,441) - - (25,085) (73,805) (48,518) (52,790) (107,536) (112,047) 130,434 152,544 (178,160) (206,028)
Exchange gains - net - - - - - - 14,082 23,144 - - - - - - 14,082 23,144
Impairment of non-trading investments - - - - - (140,582) - - - - - - - - - (140,582)
Profit (loss) for the year 206,838 114,663 20,377 38,633 1,647,965 1,575,671 1,763,391 1,952,826 34,640 (135,964) 185,935 145,329 (1,256,324) (1,322,481) 2,602,822 2,368,677
Capital expenditure 290,496 667,616 11,438 73,471 - - 642,983 602,746 36,450 19,380 120,545 91,009 - - 1,101,912 1,454,222
Assets 13,331,324 14,383,672 811,917 986,977 18,149,862 16,724,183 10,962,388 11,135,523 1,674,380 1,730,223 3,680,445 3,877,381 (8,855,202) (9,015,175) 39,755,114 39,822,784
Liabilities 6,158,891 6,520,757 475,220 673,122 - - 3,803,033 4,971,335 1,194,732 1,238,282 2,331,018 2,714,018 (2,955,937) (3,902,954) 11,006,957 12,214,560
34 SEGMENT REPORTING (continued)
Notes to the Consolidated Financial StatementsAt 31 December 2018

ANNUAL REPORT 2018 71ANNUAL REPORT 2018 71
Imported foodstuff Dairy products andbeverages
Fruits andvegetables
Storage andlogistics
Adjustments andeliminations TotalWholesale Retail Investments
2018 2017 2018 2017 2018 2017 2018 2017 2018 2017 2018 2017 2018 2017 2018 2017
BD BD BD BD BD BD BD BD BD BD BD BD BD BD BD BD
(Restated) (Restated) (Restated) (Restated) (Restated) (Restated) (Restated) (Restated)
Revenue - third parties 17,754,165 16,931,429 2,471,325 2,792,114 - - 16,339,288 16,388,978 2,238,747 3,174,988 718,286 578,605 - - 39,521,811 39,866,114
Revenue - inter segments 1,368,936 1,503,292 - - - - 47,626 62,396 88,325 160,886 127,133 223,286 (1,632,020) (1,949,860) - -
Total revenue 19,123,101 18,434,721 2,471,325 2,792,114 - - 16,386,914 16,451,374 2,327,072 3,335,874 845,419 801,891 (1,632,020) (1,949,860) 39,521,811 39,866,114
Costs of revenue (excluding depreciation)
(16,522,344)
(16,066,328)
(2,182,959)
(2,468,172) - - (11,293,301)
(10,965,396) (1,883,905) (2,892,805) (221,353) (231,585)
1,504,887
1,425,955
(30,598,975)
(31,198,331)
Gross profit 2,600,757 2,368,393 288,366 323,942 - - 5,093,613 5,485,978 443,167 443,069 624,066 570,306 (127,133) (523,905) 8,922,836 8,667,783
Other operating income 119,478 141,247 69,689 48,314 - - 118,789 69,905 39,761 24,416 27,008 44,580 (173,434) (195,545) 201,291 132,917
Other expenses (excluding depreciation)
(2,287,613)
(2,173,433)
(307,492)
(305,281)
- - (2,936,004)
(2,992,511) (347,756) (488,826) (89,119) (84,206) 177,115 266,277
(5,790,869)
(5,777,980)
Depreciation (104,375) (107,055) (24,140) (22,901) - - (502,004) (559,885) (52,014) (61,833) (268,484) (273,304) (16,511) (16,511) (967,528) (1,041,489)
Profit (loss) from operations 328,247 229,152 26,423 44,074 - - 1,774,394 2,003,487 83,158 (83,174) 293,471 257,376 (139,963) (469,684) 2,365,730 1,981,231
Investment income (including share of results of an associate) - - - -
1,647,965 1,716,253 - - - - - -
(1,246,795)
(1,005,341) 401,170
710,912
Finance costs (121,409) (114,489) (6,046) (5,441) - - (25,085) (73,805) (48,518) (52,790) (107,536) (112,047) 130,434 152,544 (178,160) (206,028)
Exchange gains - net - - - - - - 14,082 23,144 - - - - - - 14,082 23,144
Impairment of non-trading investments - - - - - (140,582) - - - - - - - - - (140,582)
Profit (loss) for the year 206,838 114,663 20,377 38,633 1,647,965 1,575,671 1,763,391 1,952,826 34,640 (135,964) 185,935 145,329 (1,256,324) (1,322,481) 2,602,822 2,368,677
Capital expenditure 290,496 667,616 11,438 73,471 - - 642,983 602,746 36,450 19,380 120,545 91,009 - - 1,101,912 1,454,222
Assets 13,331,324 14,383,672 811,917 986,977 18,149,862 16,724,183 10,962,388 11,135,523 1,674,380 1,730,223 3,680,445 3,877,381 (8,855,202) (9,015,175) 39,755,114 39,822,784
Liabilities 6,158,891 6,520,757 475,220 673,122 - - 3,803,033 4,971,335 1,194,732 1,238,282 2,331,018 2,714,018 (2,955,937) (3,902,954) 11,006,957 12,214,560
Notes to the Consolidated Financial StatementsAt 31 December 2018

ANNUAL REPORT 201872
Corporate Governance Disclosure
1 CORPORATE GOVERNANCE POLICY
Good Corporate Governance practices are significant in creating and sustaining shareholder value and ensuring appropriate disclosures and transparency. Trafco Group B.S.C.’s (‘the Company’) Corporate Governance Policy provides the framework for the principles of effective Corporate Governance standards across the Group. The Board of Directors (the Board) is committed to implementing robust Corporate Governance practices and continuous review and adherence to strong corporate governance practices help enhance compliance levels according to international standards and best practice.
Trafco Group B.S.C. shall continue its endeavor to enhance shareholders value, protect their interests and defend their rights by practicing the pursuit of excellence in corporate life. The Company shall continuously strive to best serve the interests of its stakeholders including shareholders, customers, employees and at public at large.
The management is committed to ensuring that procedures and processes are in place to reflect and support the Board approved Corporate Governance related policies to ensure the highest standards of Corporate Governance throughout the Group.
2 CORPORATE GOVERNANCE DEVELOPMENTS DURING THE YEAR
During the year, we have appointed Mr. Sameer A. Alkhan as Corporate Governance Officer as per the requirement of Corporate Governance Code 2018 issued by Ministry of Industry, Commerce & Tourism (MOICT). We engaged a consultant to review and make necessary change in the existing Corporate Governance code to comply with the new Corporate Governance Code of 2018 issued by MOICT.
3 SHAREHOLDER INFORMATION
The existing share structure of the Company consists of only ordinary shares and there are no different classes of ordinary shares. As on 31 December 2018, the Company had issued 80,675,052 ordinary shares, each with a nominal value of 100 fils per share. All the shares are fully paid.
Shareholders are invited by the Chairman to attend the AGM. The Chairman and other Directors attend the AGM and are available to answer any questions.
The Annual General Ordinary and Extraordinary Meetings were held on 26 March 2018.
Major shareholders of the Company (Name of the shareholder holding 5% or more) as of 31st December, 2018 is as follows:
Name of Shareholder Number of Shares % of Holdings Name of the natural person, the final beneficiary
Abdulhameed Zainal Mohamed Zainal
8,433,646 10.45% Abdulhameed Zainal Mohamed Zainal
Statement of shareholders’ equity as of 31 December 2018 (individuals, corporate, government or organizations) to be classified as follows:
S.No. Shareholder ClassificationShareholding %
Individuals Corporate Government or Organizations
Total
1 Local 57.46 35.52 4.95 97.93
2 Arab 1.87 - - 1.87
3 Foreign 0.17 0.03 - 0.20
4 Total 59.50 35.55 4.95 100.000

ANNUAL REPORT 2018 73
Corporate Governance Disclosure
3 SHAREHOLDER INFORMATION (continued)
Description of how shareholders are distributed according to their respective shareholding as at 31 December 2018 as follows:
S.No. Shareholding (share) Number of Shareholders Number of shares held Shareholding %
1 Less than 50,000 2796 10,782,055 13.37
2 50,000 to 500,000 178 24,423,919 30.27
3 500,000 to 5,000,000 25 37,035,432 45.91
4 More than 5,000,000 1 8,433,646 10.45
Description of the significant events that occurred during the year 2018 as follows:There are no significant events during the year 2018
4. COMPANY’S BOARD, DIRECTORS AND MANAGEMENT
4.1. Board ProcedureThe Board procedure is clearly defined by the Charter of the Board. The Company has the practice of circulation of agenda and other supporting documents well in advance to enable the directors to deliberate and decide on all matters listed in the agenda to constantly enhance the performance of the Group.
4.2. Board and Directors’ Responsibilities
The specific responsibilities of the Board include:
1. Monitoring the overall business performance;
2. Monitoring the performance of the executive management to ensure that the executives are compensated fairly;
3. Monitoring management performance and succession plan for Senior Management;
4. Accurate preparation of the quarterly and annual consolidated financial statements and ensure that financial statements are free from errors and frauds;
5. Monitoring conflicts of interest and preventing abusive related party transactions;
6. Convening and preparing for the shareholders meetings;
7. Recommending dividends to shareholders and ensure its execution;
8. Adapting, implementing and monitoring compliance with the Company’s Code of Business Conduct;
9. Disclosure of financial information to the Government Authorities and the public within the stipulated time;
10. Reviewing the Company’s objectives and policies relating to social responsibilities; and
11. Overseeing the direction and management of the company in accordance with Commercial Companies Law and other Rules and Regulations ordained by the Government of Bahrain.
4.3. Material Transactions that require the Board approval
The following material transactions require review of the Board of Directors, evaluation and approval:
1. The Company strategy;
2. The annual budget, capital expenditure budget, major contracts, diversification plans/divestment.;
3. The financial statements;
4. Major resource allocations and capital investments; and
5. Management responsibilities and training, development and succession plan for Senior Management.

ANNUAL REPORT 201874
4. COMPANY’S BOARD, DIRECTORS AND MANAGEMENT (continued)
4.4. Director’s profiles (Directorships of other Boards)The following members of the Board of Directors are also the member of the other listed companies in the Kingdom of Bahrain:
S.No. Name of Director Designation Directorships and positions in other companies
Positions in any other key regulatory, government or commercial entities.
1. Mr. Ebrahim Mohamed Ali Zainal Vice Chairman United Paper Industries B.S.C
None
2. Mr. Yusuf Saleh Abdulla Alsaleh Director Delmon Poultry Company B.S.C.
None
3. Dr. Esam Abdulla Yousif Fakhro Vice Chairman National Bank of Bahrain B.S.C.
NoneChairman Bahrain Cinema
Company (Cineco) B.S.C
Chairman Bahrain Islamic Bank B.S.C.
4. Mr. A. Redha Mohamed Redha Aldailami
Director Delmon Poultry Company B.S.C.
None
5. Mr. Sami Mohammed Jalal Director United Paper Industries B.S.C
None
6. Mr. Jehad Yusuf Abdulla Amin Director Bahrain Duty Free Complex B.S.C
None
Director Bahrain National Holdings B.S.C
Vice Chairman Banader Hotels Company B.S.C
Director BMMI B.S.C.
Director Bahrain Cinema Company B.S.C.
Corporate Governance Disclosure
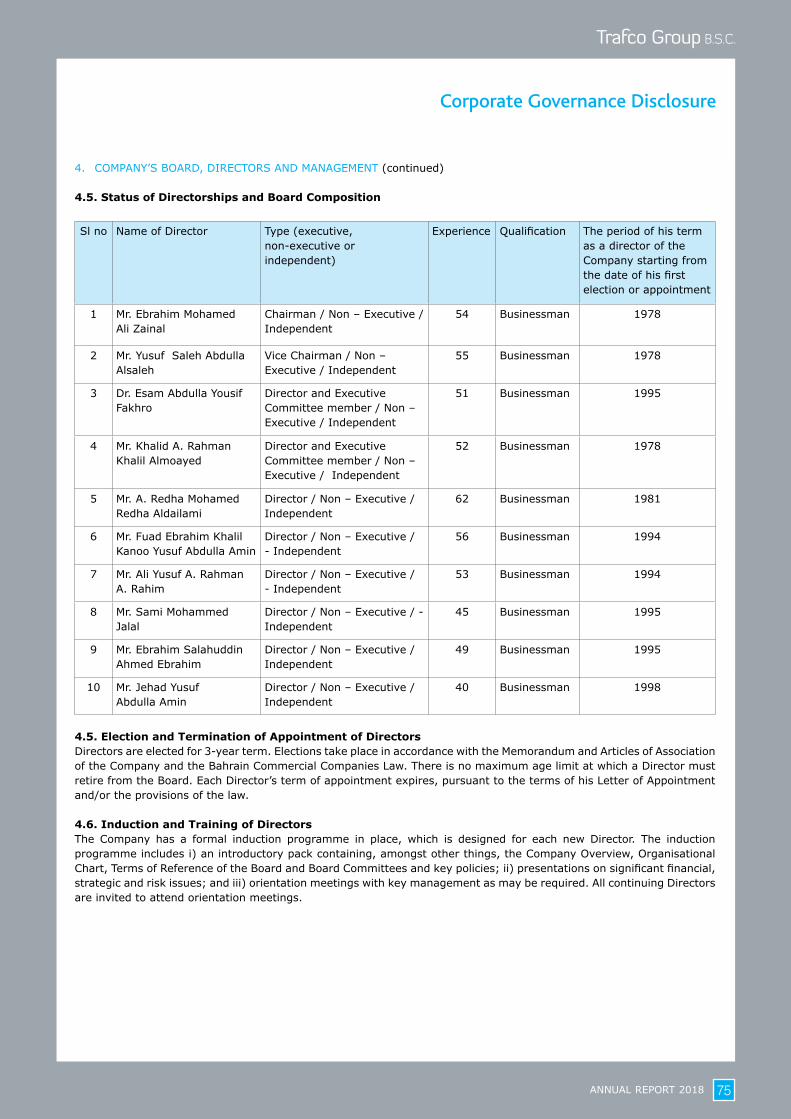
ANNUAL REPORT 2018 75
4. COMPANY’S BOARD, DIRECTORS AND MANAGEMENT (continued)
4.5. Status of Directorships and Board Composition
Sl no Name of Director Type (executive, non-executive or independent)
Experience Qualification The period of his term as a director of the Company starting from the date of his first election or appointment
1 Mr. Ebrahim Mohamed Ali Zainal
Chairman / Non – Executive / Independent
54 Businessman 1978
2 Mr. Yusuf Saleh Abdulla Alsaleh
Vice Chairman / Non – Executive / Independent
55 Businessman 1978
3 Dr. Esam Abdulla Yousif Fakhro
Director and Executive Committee member / Non – Executive / Independent
51 Businessman 1995
4 Mr. Khalid A. Rahman Khalil Almoayed
Director and Executive Committee member / Non – Executive / Independent
52 Businessman 1978
5 Mr. A. Redha Mohamed Redha Aldailami
Director / Non – Executive / Independent
62 Businessman 1981
6 Mr. Fuad Ebrahim Khalil Kanoo Yusuf Abdulla Amin
Director / Non – Executive / - Independent
56 Businessman 1994
7 Mr. Ali Yusuf A. Rahman A. Rahim
Director / Non – Executive / - Independent
53 Businessman 1994
8 Mr. Sami Mohammed Jalal
Director / Non – Executive / - Independent
45 Businessman 1995
9 Mr. Ebrahim Salahuddin Ahmed Ebrahim
Director / Non – Executive / Independent
49 Businessman 1995
10 Mr. Jehad Yusuf Abdulla Amin
Director / Non – Executive / Independent
40 Businessman 1998
4.5. Election and Termination of Appointment of DirectorsDirectors are elected for 3-year term. Elections take place in accordance with the Memorandum and Articles of Association of the Company and the Bahrain Commercial Companies Law. There is no maximum age limit at which a Director must retire from the Board. Each Director’s term of appointment expires, pursuant to the terms of his Letter of Appointment and/or the provisions of the law.
4.6. Induction and Training of DirectorsThe Company has a formal induction programme in place, which is designed for each new Director. The induction programme includes i) an introductory pack containing, amongst other things, the Company Overview, Organisational Chart, Terms of Reference of the Board and Board Committees and key policies; ii) presentations on significant financial, strategic and risk issues; and iii) orientation meetings with key management as may be required. All continuing Directors are invited to attend orientation meetings.
Corporate Governance Disclosure

ANNUAL REPORT 201876
4. COMPANY’S BOARD, DIRECTORS AND MANAGEMENT (continued)
4.7. Directors Ownership of Company’s shares
S.No. Name of Director Type of Shares Number of Shares Percentage %
1. Mr. Ebrahim Mohamed Ali Zainal Equity Shares 1,888,137 2.34%
2. Mr. Yusuf Saleh Abdulla Alsaleh Equity Shares 542,227 0.67%
3. Dr. Esam Abdulla Yousif Fakhro Equity Shares 1,583,161 1.96%
4. Mr. Khalid A. Rahman Khalil Almoayed Equity Shares 457,089 0.57%
5. Mr. A. Redha Mohamed Redha Aldailami Equity Shares 270,184 0.33%
6. Mr. Fuad Ebrahim Khalil Kanoo Equity Shares 174,757 0.22%
7. Mr. Ali Yusuf A. Rahman A. Rahim Equity Shares 149,660 0.19%
8. Mr. Sami Mohammed Jalal Equity Shares 203,901 0.25%
9. Mr. Ebrahim Salahuddin Ahmed Ebrahim Equity Shares 311,115 0.39%
10. Mr. Jehad Yusuf Abdulla Amin Equity Shares 910,000 1.13%
4.8. Director’s Trading of Shares during the yearDuring the year, the following Board Member disposed / purchased additional shares in the Company:
Name Position /Kinship
Number of shares held as at 31/12/2017
Number of shares disposed
Additional shares
purchased
Number of shares held as at 31/12/2018
Mr. Khalid A. Rahman Khalil Almoayed
Director 591,545 134,456 - 457,089
Mr. Jehad Yusuf Abdulla Amin Director 450,000 - 460,000 910,000
Board MeetingsThe Group should hold a minimum of four Board meetings during each year. The following table summarises the information about the members’ attendance in the Board of Directors meetings:
Meetings of Board of Directors held in 2018: Five
Name of Director Business Title 8 Jan 19 Feb 9 May 6 Aug 7 Nov % Attended
Mr Ebrahim Mohamed Ali Zainal Chairman 100%
Mr Yusuf Saleh Abdulla Alsaleh Vice Chairman 100%
Mr Khalid A.Rahman Khalil Almoayed
Director and Executive Committee Member
x x 60%
Dr Esam Abdulla Yousif Fakhro Director and Executive Committee Member
100%
Mr Ebrahim Salahuddin Ahmed Ebrahim
Director 100%
Mr Sami Mohamed Yosuf Jalal Director x 80%
Mr. Jehad Yusuf Abdulla Amin Director 100%
Mr. A. Redha Mohamed Redha Aldailami Amin
Director 100%
Mr. Ali Yusuf A. Rahman A. Rahim Director x 80%
Mr. Fuad Ebrahim Khalil Kanoo Director x 80%
Corporate Governance Disclosure

ANNUAL REPORT 2018 77
4. COMPANY’S BOARD, DIRECTORS AND MANAGEMENT (continued)
4.9. Remuneration Policy of Board of DirectorsArticle 188 of the Commercial Companies Law No.21 of 2001 explains the method of payment of remuneration to the directors. The remuneration policy is based on attendance fees and basic fees paid to the members of the Board of Directors.
Total remunerations paid to the directors for the year ended 31 December 2017 amounted to BD 107,625/- and directors sitting fees paid BD 38,250.
The proposed total remunerations to be paid to the directors for the year 2018, will be presented at the annual general meeting for approval.
Description of the sitting fees paid to the directors for attendance of the Board’s committees for the financial year 2018 is as follows:
S.No. NameSitting fees paid for attendance of the Board’s committees
Name of committee Sitting fees amount
Number of meetings
1. Mr Ebrahim Mohamed Ali Zainal Board meeting 2,250 5
Executive Committee 2,700 6
Nomination and Remuneration Committee
0 1
2. Mr Yusuf Saleh Abdulla Alsaleh Board meeting 2,250 5
Executive Committee 2,700 6
Nomination and Remuneration Committee
0 1
3. Mr Khalid A.Rahman Khalil Almoayed
Board meeting 1,350 3
Executive Committee 1,800 4
Nomination and Remuneration Committee
0 1
4. Dr Esam Abdulla Yousif Fakhro Board meeting 2,250 5
Executive Committee 2,700 6
Nomination and Remuneration Committee
0 1
5. Mr Ebrahim Salahuddin Ahmed Ebrahim
Board meeting 2,250 5
Audit Committee 1,800 4
Corporate Governance committee 450 1
6. Mr Sami Mohamed Yusuf Jalal Board meeting 1,800 4
7. Mr Jehad Yusuf Abdulla Amin Board meeting 2,250 5
Audit Committee 1,800 4
Corporate Governance committee 450 1
8. Mr A. Redha MohamedRedha Aldailami
Board meeting 2,250 5
Audit Committee 1,800 4
Corporate Governance committee 450 1
9. Mr. Ali Yusuf A. Rahman A. Rahim
Board meeting 1,800 4
Audit Committee 900 2
Corporate Governance committee 450 1
10. Mr Fuad Ebrahim Khalil Kanoo Board meeting 1,800 4
Corporate Governance Disclosure

ANNUAL REPORT 201878
4. COMPANY’S BOARD, DIRECTORS AND MANAGEMENT (continued)
ManagementThe following table summarises the information about the profession, designation/business title, experience in years and the qualifications of the Senior Management:
S.No. Name of members of senior management
Designation Experience in years
Qualification
1. Mr. S Sridhar Group Chief Executive Officer
33 Fellow Member – Institute of Chartered Accountants of India
2. Mr. Sameer Abdulla Alkhan
Assistant Group Chief Executive Officer
36 Diploma in Human Resources
3. Mr. P Palanisamy Finance Manager 14 Associate Member – Institute of Chartered Accountants of India
4. Mr. Azzam M A Moutragi Sales Manager 33 Master’s Degree in Business Administration
5. Mr. Sequeira Francisco Maintenance Manager 34 Diploma in Mechanical Engineering and Post Graduate Diploma in Production & Maintenance Management
6. Mrs. Layla Darwish Human Resource Manager
28 Education Diploma in Secretarial Studies
7. Mr. Wael Ahmed Acting Stores Manager 24 -
The remuneration paid to the Senior Management during the year was as follows:
Name of members of senior management Amount (BD)
Salaries 245,515
Employees’ end of service benefits 11,461
Total 256,976
4.10. Code of Conduct/ Code of EthicsThe Company has the Code of Conduct/Code of Ethics policy describing the standards expected from each and every employee of the Group.
• Each and every employee should protect the assets of the Group.
• Group has to act on the customers’ complaints promptly and courteously.
• No employee should take bribe from any outside person on behalf of the Group.
• The Group will not disclose the information about the customers/business associates to any other person/entities.
• The employees are not supposed to disclose the information about the Group either during or after the service to any outside person/entities
Corporate Governance Disclosure

ANNUAL REPORT 2018 79
Maintenance Manager
5. COMPANY ORGANIZATIONAL STRUCTURE
Board of Directors
Audit Committee
Executive Committee
Group CEO
Assistant Group CEO
Group Financial Controller
HRD Manager
Sales Manager
Catering Manager
Stores Manager
Finance Manager
Assistant Sales Manager
Field Sales Manager
Assistant Store
Manager
Assistant IT Manager
Assistant Marketing Manager
Retail Operations Manager - Metro
Markets SPC
Operations Manager - Trafco
Logistics SPC
Operations Manager -
Bahrain Fresh Fruits Co. SPC
Operations Manager - Bahrain Water Bottling &
Beverage Co. SPC
Corporate Governance Disclosure

ANNUAL REPORT 201880
6. COMMITTEES
The Committees are constituted by the Board for the good corporate governance. Scope of authority and responsibilities are clearly defined by the Charters of the respective Committee. Committees put forward suggestions and recommendation to the Board as and when deemed necessary. Minutes of the Committee meetings are distributed to the members of the Board periodically. The Board constantly evaluates the composition of the committees in the light of requirements of Law and for the successful functioning of the Company.
The following table summarises the information about the Board Committees, their members and objectives:
Board’s Committee Objective Members Independent/Non-independent
Audit Committee The Audit Committee is responsible for:1) Monitoring the integrity of the financial
reporting process, Trafco systems of Internal Control, review of the consolidated financial statements and reports, compliance of the board with legal and regulatory requirements and the performance of the Company’s Internal Audit function.
2) To recommend the appointment of external auditors, agreeing their compensation, overseeing their independence and preparing reports required to be prepared by the Committee pursuant to Central Bank of Bahrain, Bahrain Bourse, Bahrain Commercial Companies Law and other regulatory authorities in the Kingdom of Bahrain.
1. Mr Ebrahim Salahuddin Ahmed Ebrahim (Chairman)
2. Mr Jehad Yusuf Abdulla Amin
3. Mr A. Redha Mohamed Redha Aldailami
4. Mr Ali Yusuf A.Rahman A. Rahim
Non-executive / Independent
Non-executive / Independent
Non-executive / Independent
Non-executive / Independent
Executive (Investment & Finance) Committee
The executive committee is formed to discuss matters with the Company’s management regarding senior staffing, financial performance, strategies and all other issues as directed by the Board
1. Mr Ebrahim Mohamed Ali Zainal
2. Mr Yusuf Saleh Abdulla Alsaleh
3. Mr Khalid A.Rahman Khalil Almoayed
4. Dr Esam Abdulla Yousif Fakhro
Non – Executive / Independent
Non – Executive / Independent
Non – Executive / Independent
Non – Executive / Independent
Nomination and Remuneration Comittee
Review and advise the Board of Directors on the Board’s composition, new directors nominations in addition to Board and Senior Management remuneration.
1. Mr Ebrahim Mohamed Ali Zainal (Chairman)
2. Mr Yusuf Saleh Abdulla Alsaleh
3.Dr Esam Abdulla Yousif Fakhro
4. Mr Khalid A.Rahman Khalil Almoayed
Non-executive / Independent
Non-executive / Independent
Non-executive / Independent
Non-executive / Independent
Corporate Governance committee
To review and ensure compliance with Corporate Governance Code framework and guidelines.
1. Mr Ebrahim Salahuddin Ahmed Ebrahim (Chairman)
2. Mr Jehad Yusuf Abdulla Amin
3. Mr A. Redha Mohamed Redha Aldailami
4. Mr Ali Yusuf A.Rahman A.Rahim
Non-executive / Independent
Non-executive / Independent
Non-executive / Independent
Non-executive / Independent
Corporate Governance Disclosure

ANNUAL REPORT 2018 81
6. COMMITTEES (continued)
Audit Committee:Mr. Ebrahim Salahuddin Ahmed Ebrahim is the Chairman of the Audit Committee. The Audit Committee comprises of four directors. The Charter of the Audit Committee specifies the roles and responsibilities assigned to the Committee.
Competences of the Audit Committee Members:1- Review the Company’s accounting and financial practices.2- Review the credibility of the Company’s financial control, internal control and financial statements. 3- Review and approve the Company’s financial statements before presenting the same to the Board.4- Discuss the significant accounting and financial policies and reporting issues for the financial year.5- Review the Company’s compliance with legal requirements.6- Consider and recommend to the Board the appointment, resignation or dismissal of an external auditor, determine
the audit fees and compensations and oversee the auditor’s work.7- Discuss the significant observations of external and internal Auditors and the response from the management.8- Review the company’s risk management and internal audit functions.9- Ensure existence of appropriate policies, procedures, systems, internal controls and guidelines in the Company.10- Deal with any concerns arising from the ‘whistleblower’ program adopted by the Board to allow for concerns to be
raised confidentially.
The Company should hold a minimum of four Audit Committee meetings during each year. During the year, four meetings of the Audit Committee were held. The following table summarises the information about the members attendance in the Audit Committee meetings:
Members 14 Feb 24 Apr 26 July 30 Oct % Attended
Mr Ebrahim Salahuddin Ahmed Ebrahim 100%
Mr Jehad Yusuf Abdulla Amin 100%
Mr A. Redha Mohamed Redha Aldailami 100%
Mr Ali Yusuf A.Rahman A. Rahim x x 50%
During the year, total fees paid to the members of the Audit Committee was BD 6,300/-.
Executive Committee:Mr. Ebrahim Mohamed Ali Zainal is the Chairman of the Executive Committee. The Executive Committee comprises of four directors. The Charter of the Executive Committee specifies the roles and responsibilities assigned to the Committee.
Competences of the Executive Committee Members:1- Address specific matters delegated to it by the Board of Directors.2- Make recommendations thereon to the Board and make decisions based on authorities specifically delegated by
the Board. 3- Review and approve business and investment opportunities and proposals, credit, major procurement and outsourcing
matters, as may be delegated by the Board.
The Company should hold a minimum of four Executive Committee meetings during each year. During the year, Six meetings of the Executive Committee were held. The following table summarises the information about the members attendance in the Executive Committee meetings:
Members 15 Feb 3 May 19 Jul 14 Oct 4 Dec 30 Dec % Attended
Mr Ebrahim Mohamed Ali Zainal 100%
Mr Yusuf Saleh Abdulla Alsaleh 100%
Mr Khalid A.Rahman Khalil Almoayed x x 67%
Dr Esam Abdulla Yousif Fakhro 100%
During the year, total fees paid to the members of the Executive Committee was BD 9,900/-.
Corporate Governance Disclosure

ANNUAL REPORT 201882
6. COMMITTEES (continued)
Nomination and Remuneration Committee:Mr. Ebrahim Mohamed Ali Zainal is the Chairman of the Nomination and Remuneration Committee. The Nomination and Remuneration Committee comprises of four directors. The Charter of the Nomination and Remuneration Committee specifies the roles and responsibilities assigned to the Committee.
Competences of the Nomination and Remuneration Committee Members:1- Review the structure of the Board, periodically evaluate the directors’ performance and make recommendations to
the Board on the necessary changes that should be made to address weaknesses to achieve the company’s interests.2- Ensure that adequate policies and procedures are in place for the evaluation of the performance of executive
management.3- Review the remuneration & sitting fees of the directors and making recommendations to the Board about their
decision.4- Approve of succession plans of senior management before the plans is presented to the Board for approval.
The Company should hold a minimum of two Nomination and Remuneration was Committee meetings during each year. During the year, one meeting of the Nomination and Remuneration Committee was held. The following table summarises the information about the members attendance in the Nomination and Remuneration Committee meetings:
Members 30 Dec % Attended
Mr Ebrahim Mohamed Ali Zainal 100%
Mr Yusuf Saleh Abdulla Alsaleh 100%
Mr Khalid A.Rahman Khalil Almoayed 100%
Dr Esam Abdulla Yousif Fakhro 100%
During the year, no fees were paid to the members of the Nomination and Renumeration Committee.
Corporate Governance Committee:Mr Ebrahim Salahuddin Ahmed Ebrahim is the Chairman of the Corporate Governance Committee. Corporate Governance Committee comprises of four directors. The Charter of the Corporate Governance Committee specifies the roles and responsibilities assigned to the Committee.
Competences of the Corporate Governance Committee Members:1- Assist the board in developing Company’s Corporate Governance policy framework and recommending changes from
time to time to the framework developed.2- Ensure the Company’s practices conform to its corporate governance policy and is aligned to good governance
practices.
The Company meeting should hold a minimum of two Corporate Governance was Committee meetings during each year. During the year, one meeting of the Corporate Governance Committee was held. The following table summarises the information about the members attendance in the Corporate Governance Committee meetings:
Members 30 Oct % Attended
Mr Ebrahim Salahuddin Ahmed Ebrahim 100%
Mr Jehad Yusuf Abdulla Amin 100%
Mr A. Redha Mohamed Redha Aldailami 100%
Mr Ali Yusuf A.Rahman A. Rahim 100%
During the year, total fees paid to the members of the Corporate Governance Committee was BD 1,800.
Corporate Governance Disclosure

ANNUAL REPORT 2018 83
7. CORPORATE GOVERNANCE
Actions taken to complete the Corporate Governance CodeThe Board and the Company’s employees are expected to maintain the highest level of corporate ethics and personal behaviour. The Company has established the Code which provides an ethical and legal framework for all employees in the conduct of its business. The Code also defines how the Company relates to its employees, shareholders and the community in which the Company operates.
The Board of Directors has adopted the Code and a Whistleblower Policy to monitor compliance with the ethical requirements of the Code. The Code provides clear directions on conducting business internationally, interacting with the Government entities, communities, business partners and general workplace behaviour having regard to the best practice of corporate governance models and ethics. The Code also sets out a behavioural framework for all employees in the context of a wide range of ethical and legal issues.
Compliances with the corporate governance codeManagement and Board of Directors ensure compliance with corporate governance framework and guidelines to ensure compliance with the Corporate Governance Code and did not note any non-compliance during the years ended 2018.
8. CORPORATE GOVERNANCE OFFICER
S.No. Name Qualification Date of Appointment Contact Details
1 Mr. Sameer Abdulla Alkhan
Diploma in Human Resources
23/12/2018 Phone: +973-17723343e-mail: [email protected]
9. IRREGULARITIES COMMITTED DURING THE FINANCIAL YEAR
There are no irregularities committed during the year 2018.
10. EXTERNAL AUDITORS
Fees and charges for the audit services provided by the external auditor during the year 2018, in addition to a description of the auditor’s years of service as the Company’s external auditor is as follows:
Name of the audit firm Ernst & Young
Years of service as the Company’s external auditor 23 years
Name of the partner in charge of the Company’s audit Prasanth Govindapuram
The partner’s years of service as the partner in charge of the Company’s audit
First year
Total audit fees for the financial statements for the year 2018 (in BD)
Information about audit fees is available on request from Corporate Governance Officer.Other special fees and charges for non-audit services
other than auditing the financial statements for the year 2018 (in BD) if any. In the absence of such fees, this shall be expressly stated
11. CONFLICT OF INTEREST
No conflicts of interest arose during the years ended 2018. In the instance of a conflict of interest arising as a result of any business transaction or any type of resolution to be taken, the concerned Board member shall refrain from participating at the discussion of such transaction or resolution to be taken. Members of the Board of Directors or its Committees usually inform the Board of a potential conflict of interest prior to the discussion of any transaction or resolution and concerned member(s) refrain from voting on these transactions or resolution where a conflict of interest arise.
Corporate Governance Disclosure

ANNUAL REPORT 201884
12. RELATED PARTY TRANSACTIONS
All related party transactions are done on an arm’s length basis and approved by the management of the Company. No employee or director or member of executive management can trade the shares with the material information which is not made public.
Details of transactions with related parties (stakeholders), indicating the nature of relationship and type of transaction is detailed in point 17. All transaction listed in point 17 is with common directors except Bahrain Livestock Company B.S.C. (c) which is an Associate.
13. MEANS OF COMMUNICATION WITH SHAREHOLDERS AND INVESTORS
The Company is committed to providing relevant and timely information to its shareholders, investors and regulators in accordance with its continuous disclosure obligations defined in the Code. Information is communicated to shareholders and regulators through the distribution of the Company’s Annual Report and other information releases about the significant matters through the Company’s website in a timely manner. The Board Secretary is responsible for communications with the shareholders and regulators ensuring that the Company meets its continuous disclosures obligations as defined in the Code.
14. EVALUATION OF BOARD PERFORMANCE
The shareholders evaluate the performance of the Board of Directors and absolve them from liability in the Annual General Meeting. The Board of Directors evaluates the performance of the Chairman and Group CEO in the Board of Directors meeting.
During the year, 2018, evaluation was done in the following ways:
The Board has introduced annual performance evaluations of Board, Audit committee, individual directors and executive management in accordance with their respective terms of reference and appointment agreements with the aim of improving the effectiveness and contributions towards the Company.
The evaluation is designed to determine whether the Board, its committees, individual directors and executive management continues to be capable of providing the high level judgment required and are informed and up to date with the business and its goals and understand the context within which it operates.
15. CONTRIBUTIONS TOWARDS COMMUNITY DEVELOPMENT AND ENVIRONMENT PRESERVATION
Contribution to societies and others in cash BD 31,063Contribution in kind BD 7,037
Corporate Governance Disclosure

ANNUAL REPORT 2018 85
16. COMPLIANCE WITH THE PROVISIONS OF THE CORPORATE GOVERNANCE CODE
Principle Non-compliant
Partially Compliant
Fully Compliant
Explanation in case of non-compliance
Principle 1: The Company shall be headed by an effective, qualified and expert board.
Yes
Principle 2: The directors and executive management shall have full loyalty to the company.
Yes
Principle 3: The Board shall have rigorous controls for financial audit and reporting, internal control, and compliance with law.
Yes
Principle 4: The Company shall have effective procedures for appointment, training, and evaluation of the directors.
Yes
Principle 5: The Company shall remunerate directors and senior officers fairly and responsibly
Yes
Principle 6: The Board shall establish a clear and efficient management structure for the Company and define the job titles, authority, roles and responsibilities.
Yes
Principle 7: The Company shall communicate with shareholders, encourage their participation, and respect their rights.
Yes
Principle 8: The Company shall disclose its corporate governance.
Yes
Principle 9: The Board shall ensure the integrity of the financial statements submitted to shareholders through appointment of external auditors.
Yes
Principle 10: The Company shall seek through social responsibility to exercise its role as a good citizen.
Yes
17. ANNEXURE 1: RELATED PARTY TRANSACTIONS
Related party details for the year 2018
1. TRAFCO - Trafco Group B.S.C2. ADC - Awal Dairy Co. W.L.L.3. BWBC - Bahrain Water Bottling & Beverage Co. S.P.C4. BFFC - Bahrain Fresh Fruits Co. S.P.C5. METRO - Metro Markets Co. S.P.C6. TLC - Trafco Logistics Co. S.P.C
MAZA B.S.C (C ) TRAFCO ADC BWBC BFFC METRO TLC TOTAL
Sales 14,891 4,839 - - - - 19,730
Purchases - 406,898 - - 2,735 - 409,633
Other income - - - - - 778 778
Receivables 14,480 2,946 - - - - 17,426
Payables - 15,365 - - 202 - 15,567
Other expenses - - - - - - -
Corporate Governance Disclosure
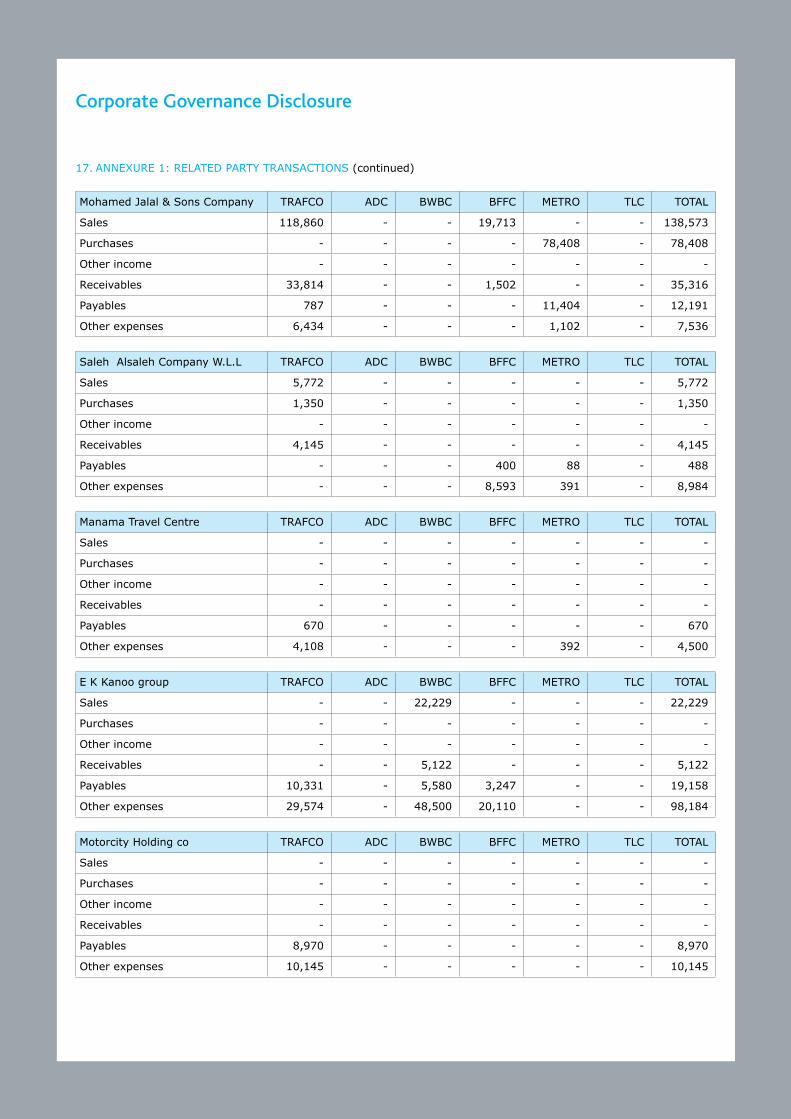
ANNUAL REPORT 201886
17. ANNEXURE 1: RELATED PARTY TRANSACTIONS (continued)
Mohamed Jalal & Sons Company TRAFCO ADC BWBC BFFC METRO TLC TOTAL
Sales 118,860 - - 19,713 - - 138,573
Purchases - - - - 78,408 - 78,408
Other income - - - - - - -
Receivables 33,814 - - 1,502 - - 35,316
Payables 787 - - - 11,404 - 12,191
Other expenses 6,434 - - - 1,102 - 7,536
Saleh Alsaleh Company W.L.L TRAFCO ADC BWBC BFFC METRO TLC TOTAL
Sales 5,772 - - - - - 5,772
Purchases 1,350 - - - - - 1,350
Other income - - - - - - -
Receivables 4,145 - - - - - 4,145
Payables - - - 400 88 - 488
Other expenses - - - 8,593 391 - 8,984
Manama Travel Centre TRAFCO ADC BWBC BFFC METRO TLC TOTAL
Sales - - - - - - -
Purchases - - - - - - -
Other income - - - - - - -
Receivables - - - - - - -
Payables 670 - - - - - 670
Other expenses 4,108 - - - 392 - 4,500
E K Kanoo group TRAFCO ADC BWBC BFFC METRO TLC TOTAL
Sales - - 22,229 - - - 22,229
Purchases - - - - - - -
Other income - - - - - - -
Receivables - - 5,122 - - - 5,122
Payables 10,331 - 5,580 3,247 - - 19,158
Other expenses 29,574 - 48,500 20,110 - - 98,184
Motorcity Holding co TRAFCO ADC BWBC BFFC METRO TLC TOTAL
Sales - - - - - - -
Purchases - - - - - - -
Other income - - - - - - -
Receivables - - - - - - -
Payables 8,970 - - - - - 8,970
Other expenses 10,145 - - - - - 10,145
Corporate Governance Disclosure

ANNUAL REPORT 2018 87
17. ANNEXURE 1: RELATED PARTY TRANSACTIONS (continued)
United Paper industries TRAFCO ADC BWBC BFFC METRO TLC TOTAL
Sales - - - - - - -
Purchases 4,749 282,581 93,834 - - - 381,164
Other income - - - - - - -
Receivables - - - - - - -
Payables 809 77,810 20,388 - - - 99,007
Other expenses - - - - - - -
Delmon Poultry TRAFCO ADC BWBC BFFC METRO TLC TOTAL
Sales - - - - - - -
Purchases - - - - - - -
Other income 15,797 - - - - - 15,797
Receivables - - - - - - -
Payables - - - - - - -
Other expenses - - - - - - -
Abdulla Yusif Fakhro TRAFCO ADC BWBC BFFC METRO TLC TOTAL
Sales - - 194 - - - 194
Purchases - - - - - - -
Other income - - - - - - -
Receivables - - 98 - - - 98
Payables 660 - - - - - 660
Other expenses 3,747 - 800 350 - - 4,897
Bahrain Cinema Company TRAFCO ADC BWBC BFFC METRO TLC TOTAL
Sales - - 994 - - - 994
Purchases - - - - - - -
Other income - - - - - - -
Receivables - - 294 - - - 294
Payables - - - - - - -
Other expenses - - - - - - -
Budget Rent A Car TRAFCO ADC BWBC BFFC METRO TLC TOTAL
Sales - - - - - - -
Purchases - - - - - - -
Other income - - - - - - -
Receivables - - - - - - -
Payables - - 560 - - - 560
Other expenses - - 1,680 - - - 1,680
Corporate Governance Disclosure

ANNUAL REPORT 201888
17. ANNEXURE 1: RELATED PARTY TRANSACTIONS (continued)
Intershield Insurance Company TRAFCO ADC BWBC BFFC METRO TLC TOTAL
Sales - - - - - - -
Purchases - - - - - - -
Other income - - - - - - -
Receivables - - - - - - -
Payables 13,879 - - 7,324 1,810 - 23,013
Other expenses 29,626 - 12,783 15,307 1,810 - 59,526
Khalid Almoayed TRAFCO ADC BWBC BFFC METRO TLC TOTAL
Sales 688 - - 688
Purchases - - - -
Other income - - - - - - -
Receivables 21 - - - - - 21
Payables - - - - - - -
Other expenses - - - - - - -
National Transport Company TRAFCO ADC BWBC BFFC METRO TLC TOTAL
Sales - - - - - - -
Purchases - - - - - - -
Other income - - - - - - -
Receivables - - - - - - -
Payables - 1,050 - - - - 1,050
Other expenses - 4,200 - - - - 4,200
Yousuf Abdul Rahman Engineer TRAFCO ADC BWBC BFFC METRO TLC TOTAL
Sales - - - - - - -
Purchases - 4,515 - - - - 4,515
Other income - - - - - - -
Receivables - - - - - - -
Payables - 37,996 - 37,996
Other expenses 784 151,152 - - - - 151,936
FOOSCO TRAFCO ADC BWBC BFFC METRO TLC TOTAL
Sales - 32,955 17,552 - - - 50,507
Purchases 71,389 - 23,088 - 1,545 96,022
Other income - - - - - - -
Receivables 23,072 15,898 6,827 - - - 45,797
Payables 9,758 - 8,406 - 60 - 18,224
Other expenses - - - - - - -
Corporate Governance Disclosure

ANNUAL REPORT 2018 89
17. ANNEXURE 1: RELATED PARTY TRANSACTIONS (continued)
Bahrain Livestock Company TRAFCO ADC BWBC BFFC METRO TLC TOTAL
Sales - - 149 - - - 149
Purchases 115,683 - - - - - 115,683
Other income 5,974 - - - - - 5,974
Receivables 639 - 10 - - - 649
Payables 7,014 - - - - - 7,014
Other expenses - - - - - - -
Fakhro Insurance Services Company TRAFCO ADC BWBC BFFC METRO TLC TOTAL
Sales - - - - - - -
Purchases - - - - - - -
Other income - - - - - - -
Receivables - - - - - - -
Payables 1,319 - 186 - - - 1,505
Other expenses 5,426 - 5,394 - - - 10,820
BMMI Group TRAFCO ADC BWBC BFFC METRO TLC TOTAL
Sales 226,519 25,769 252,288
Purchases - - - - 71,557 - 71,557
Other income 94,475 - - - - 2,226 96,701
Receivables 35,280 - - 1,604 - 2,226 39,110
Payables - - - - 22,453 22,453
Other expenses - - - - - - -
BANZ Group TRAFCO ADC BWBC BFFC METRO TLC TOTAL
Sales - - - - - - -
Purchases - - 1,410 - - - 1,410
Other income 210,165 - - - - - 210,165
Receivables - - 435 - - - 435
Payables - - 369 - - - 369
Other expenses - - - - - - -
National Media TRAFCO ADC BWBC BFFC METRO TLC TOTAL
Sales - - - - - - -
Purchases - - - - - - -
Other income - - - - - - -
Receivables - - - - - - -
Payables - - - - - - -
Other expenses - 1,500 - - - - 1,500
Corporate Governance Disclosure

ANNUAL REPORT 201890
17. ANNEXURE 1: RELATED PARTY TRANSACTIONS (continued)
Banader Hotels TRAFCO ADC BWBC BFFC METRO TLC TOTAL
Sales - - - - - - -
Purchases - - - - - - -
Other income - - - - - - -
Receivables - - - - - - -
Payables 200 - - - - - 200
Other expenses 1,000 - - - - - 1,000
Directors TRAFCO ADC BWBC BFFC METRO TLC TOTAL
Sales - - - - - - -
Purchases - - - - - - -
Other income - - - - - - -
Receivables - - - - - - -
Payables - 12,700 - - - - 12,700
Other expenses - - - - - - -
Purchase of
goods and
services
Other
income
Other
Expenses
Due from
related
parties
Due to
related
parties
DescriptionSales
BD BD BD BD BD BD
Associated companies 149 115,683 5,974 - 649 7,014
Directors & RP 493,629 1,144,059 323,441 363,408 148,470 274,781
493,778 1,259,742 329,415 363,408 149,119 281,795
Ebrahim Mohamed Ali ZainalChairman
27 February 2019
Corporate Governance Disclosure