- commonwealth department · literature, vol. 17 legal issues? of- ” 72 66 kozelka,f.l. and hine,...
TRANSCRIPT

c9 L
~
17
~
18
19
20
21
22
23
24
25
26
- 27
28
- 29
30
i
31
Un i vers i
BOULTON, the Governme -
t y of Melbourne, 1976.
J.B. The Effectiveness of Driver Training, Proceedinqs Of .ional Road Safety Symposium, 1972. Austral iz !nt - Publishinq Service, 1972. "
BOWMAN, R.S., STEIN, L.I. and NEWTON, J.R. Measurement and and Interpretation of Drinking Behaviour, Journai of Studies 0" Alcohol, 1973, 36, 1 1 54-1 172.
BRECHER, E.M. Llcit and illicit Drugs, Consumers' Union, Montana Little arown and Co.. 1972. BROWN, G. A Study of the Adjournment of Exceeding .058 Cases. Unpublished Report, Dept. of Criminology, University of Melbourne, 1974.
- -
BROWN, M.H. lnternattonal Survey Vol. 1 , Alcohol Taxation and Control Policies, Brewers Association of Canada, March, 1978.
BRUCE TART AND ASSOCIATES. Advertising Expendlture and Statistics, Melbourne, 1977.
CAMERON, M.H., STRANG, P.M. and VULCAN, A.P. Evaluation of Random Breath Testing in Victoria, Australia, Proceedings of the Eighth
Sweden, 15-19 June, 1980. In Ress. International on Alcohol, Drugs and Traffic Safety, Stockholm,
CARLSON, W.L. Alcohol Usage of the Nlght-Time Driver,JournaI of Safety Research, 1972, - 4, 12-25.
Age, Lxposure and Alcohol Involvement In Night Crashes. Journal of - Safety Research, 1973, - 5 (41, 247-259. CHEETHAM, J.S.. AUSBURN, L.J. and CALL, D. Educational Philosophy and Practice: Contributors to Aicohol Abuse and Drug Dependence in Australia, 1 9 t h Annual Conference, Austraiia Coiiege of Education, 1978.
COMMONWEALTH DEPARTMENT OF HEALTH Aicohol Australia: A Summary - of Related Statistics, Canberra, Department of Health, 1978:
COMMONWEALTH DEPARTMENT OF HEALTH Road Casualties- Australia - Report, CommonweaITh Department of Health, 1978. 1952 to 1977: A Reduced Alcohol-Related Problem. Unpubl i she3
COMMONWEALTH DEPARTMENT OF TRANSPORT. Submission to the House of Representatives Standing Committee on Road Safety, Officiai Hansard Report, pp. 367-396, 1976.
COPPIN, R.S., FERDUN, G.S. and PECK, R.C. The Teenaae W, Report No. 21 - California Department of btor Vehicles, February, 1965.
DEPARTMENT OF THE ATTORNEY GENERAL AND OF JUSTICE, N.S.W. Bureau of Crime Statistics and Research, Statistical Report No. 7, Series-2, Court Statistics 1975.
-
-

I 70
32 N.S.W. Bureau of Crlme Statistics and Research, Statistical Report No. 8, Series 2, - Court Statistics 1976.
34 OUNCAN. J.A. Drinkin&3rivlnq b~ Canberra Motorists, Canberra, Australian Government Publishing Services, 1976.
35 ENCEL, S.,KOTOWICZ, K. and RESTER, H. Drinking Patterns in Sydney, Australia, guarterly Journal Studies 01 Alcohol, Supplement, 1972, - 6, 1-27.
36 EVANS. R. I., ROZELLE, R.M., LASATER, T.M., DEMBROSKI, T.M. and ALLEN, B.P. Fear Arousal Persuasion and Actual Versus lmplled Behavioural Change: New Perspective Wilislng a Real-Life bntai Hygiene Programme. Journal & Personality= Soclai PsycholoW, 1970, - 16, 220-227.
37
30
39
40
41
42
43
44
45
46
47
48
FORENSIC SCIENCE LABORATORY internal fkcument, 1979.
GARRE’IT, G.R. and BAHR, H.M. Comparlson of SeIf-Rating and Quarterly Frequency Measures of Drinking, Quarterly Journal Studies - of Alcohol, 1974, 35, 1294-1306.
GAY, T.J., COATES, R.L., COGGINS, G.L., ALEXANDER, K.W. and NAYMAN, J. Blood Alcohol Concentrations Upon Admission to a Hospital Casualty Department, Medical Journal & Australia, 1970, 2, 770-701.
GEORGE, A. Survey of Drug Use in a Sydney Suburb, Medical JOUrnJl of - Australla, 1972. 2, 233-237. GIBSON, J., JOHANSEN, A., RAWSON, G. and WEBSTER, 1. Drinking Smoking and Drug-Taking Patterns in a Predominantly Lower Socio-econmic Status Sample: Comparison with Medlcheck sample, Medical Journal & Australia, 1977, 2. 459-461.
HANSARD Victorian Parliament 1909.
19631’64, 1499.
2nd Reading Speech, 1973.

49
50
51
52
53
54
55
56 -
57
58 i
59
60 .-
61
62 -
65
71
1972. Canberra, Australian Government Publishing Service, 1972.
The Younq Driver, Traffic Accident Research Unit, Department -or Transport, N.S.W., 1972. - Traffic Accidents and Social Deviance, In Edwards, A.E. and
WiIson, P.R. (Eds.), Social Deviance In Australia, Melbourne, Cheshire, 1975.
-~ HENDERSON, M. and FREEDMAN, K. Public Education as a Drink-Driving Countermeasure, Australian Journal of Alcohol and Drug Dependence, 1976, - 3, (41, 107-112. HENDERSON. M. FREEDMAN, K., and WOOD, R. Drinkinq and Drivinq in Sydney. A Community Survey of Behaviour and Attitudes. TraffE Accident Research Unit. Repzt 1/73. 1973.
HETZEL, B.S., RYAN, G.A.. McDERMOTT, F. and HUGHES, E.S.R. Compulsory Blood Alcohol Determinations in Road Crash Casualties: ExDeience followina Recent Australian Leaisiatio. In Israeistram, - - S. and Lambert, S. (Eds.) Proceedings of the 6th International Conference Alcohol, Drugs and Traffic Safety, Toronto. 1974. ‘Canada: Addlctlon Research Foundation of Ontario, 1975.
”
HOMEL, R. Penaltles and the Drink/DrIver, N.S.W. Bureau of Crime Statistics and Research, Sydney, 1980.
HOSSACK. D. and BROWN, G. The hard facts of the influence of Alcohol on Serious Road Accident Casualties, Medical Journal of Australia, 1974, - 2, 473-479. HOUSE OF REPRESENTATIVES STANDING COMMIlTEE ON ROAD SAFETY. Alcohol, Ikuqs and Road Safety. Canberra, Australian Government Publishing Service, 1980.
HURST, P.M. Epidemloiogical Aspects of Alcohol in Driver Crashes and Citations, Journal of Safety Research, 1973, - 5, 130-148.
JACKSON, J. and CALYSIN, R.J. Evaluation of a Self-Development Approach to Drug Education, Journal of Druq Educafion, 1974, - 7, 97. JAMi ESON. K.G.. DUGGAN. A. W.. TWEDDELL, . J., POPE, L. l . and ZVIRBULIS, V.E. Traffic Crashes in Brisbane, Australian Road Research Board, Special R e m . 271 971.
Australian Road Research Board, Internal Report, AIR 000-84. JARVIS, J.R. Accident Reporting and Analysis: Research Needs,
JOHNSTON, I.R. Alcohol and Road Accidents: A Review of the Problem, Australian Journal e Alcohol and Dependence, 1976, 3,14), 102-107.
- - JOSCELYN, K.B. and JONES, R.K. A Systems Approach to the Analysis
the Drinkinq Driver Controi m, Vols. I-IV, U.S. Dept of Transportation, Washington, D.C., May, 1971.
JOSCELYN, K.B., MAICKEL,R.P. and GOLDENBAUM, D.M. The Drinkin Driver: A Survey, Vol. I - Literature, Vol. 1 7 Legal Issues?
”
of-

72
66 KOZELKA,F.L. and HINE, C.H. Method for Determination of Ethyl Alcohol for Medlcolegal Purposes, Analvtical Chemistry, 1941, 13, 905-907.
67 KORNACZEWSKi, A., WILKINSON, P., RAYMOND, A., RANKIN, J.G. and SANTAMARIA, J.N. Drlvlng Convictions of a Random Sample of Victorlan Drivers, Australian - Road Research, 1972, - 4, 40-51.
68 KRUPINSKI. J. and STOLLER, A. (Eds.) The Health of a Metropolis, Sydney: Heinemann Education, 1971.
"
69 Special Publications No. 4, Mental Health Authority, Victoria, 1973.
70 KRUPINSKI, J., BAIKIE, A.G., STOLLER, A., GRAVES, J., OIDAY, D.M. and POLKE, P. A Community Health Survey of Heyfield, Vlctorla, Medical Journal of Australia, 1967, 1204-1211.
71 LAW DEPARTMENT COURT STATISTICS. Unpubllshed Document, Vlctorla, 1978.
72 LIQUOR INDUSTRY SOURCES, 1979.
73 McOERMOTT, F. and STRANG, P. Compulsory Blood Alcohol Testing of Road Crash Casualtles in Victoria: The First Three Years, Medlcal Journal of - Australia, 1978, 2, 612-615.
75 MACKAY, I.R., SINCLAIR. C., WILKINSON, P. and TRAVERS, D. (Eds.)
76 MEDIA COUNCIL OF AUSTRALIA Voluntary Codes of Advertisinq Practice Sydney, N.S.W.
77 MILNER, G. and HUDSON, R. The Characteristics of Several Thousand Dependent Persons presenting to the Alcoholics and Drug Dependent
the National Committee for the Prevention of Alcoholism Seminar, Persons Services, Health Department, Victoria, Paper presented at
Sydney, 1978.
78 MILNER, G. lnteractlon between barbiturates, alcohol and some psychotroplc drugs, Medlcal Journal of Australia, 1970, 1,

73
1204-1207.
79 MOTOR ACCIDENT BOARD. Third Annuai Report for the Year ended 30th June, 1976, Me i bourne, b v t .R i nter, 1978.
~ 90 Melbourne, Govt. Printer, !978.
Fourth Annuai Report for the Year ended 30th June, 1977,
91 Personal Communication, 1980.
82 MOTOR REGISTRATION BRANCH Communication to the Road Safety and Trafflc Authority, 17th May, 1978.
83 NATIONAL HEALTH AND MEDICAL RESEARCH COUNCIL. Report of the
.l 975. Standing Committee on the Health Problems of Alcohol, Canberra,
84 OTS, E.Y. Characteristics Orivers Convicted of Alcohol Related Offences with Particular Reference Problem Drinkina.
m e c r e t a r y ' s Dept., Victoria, 1971. -
a5 Drink Drivers: A follow-up Study
Victoria, 1973. Convicted of Drink-Driving Offences. Chief
86 PLUECKHAHN, V.D. The Significance of Blood Autopsy, Medical Journai - of Australia, 1967, - 2,
87 PETZ, D.C., McDOLE, T.L. and SCHWANN, S.H. Dr
-, 88
89
" 90
91
~
92
93
- 94
95
SZretaryls Dept., of 300 Drivers
Alcohol Levels at 118-124.
nking-Driving i I Behaviour of Young Men in Relation to Accidents, Quarterly Journal Studies of - Alcohol, 1975, - 36, (7). 956-972.
RANKIN J.G. Epidemiology of Alcohol Abuse, Medical Journal of Australia, 1970, l , 1218-1220.
- - -
RANKIN, J.G. and WILKINSON, P. Aicohol and Tobacco Consumption In Krupinski, J. and Stoller, A. (Eds.) The Hea!th of 5 MerropoIis, Sydney, Heinemann Education, 1971.
RAYMOND, A.E. Characteristics of Breathalysed Drivers, Proceedinas " of the National - Road Safety Symposium, Canberra. Australian Government Publishing Service, 1972.
-
A Comparison of Breathalyzed Drivers with the Gensral Driving Population, Australian Road Research, 1972, 4, 52-61.
A Review Alcohol in Relation to Road Safety. Canberra, AGstral ian Government Pub: is h i n g Service, 1973.
REYNOLDS, l., HARNAS, J. GALLAGHER, H. and BRYDEN, D. Drinking and Drug-Taking Patterns of 8516 Adults in Sydney, Medical Journal of Austral ia, 1976, 2, 782-785.
ROAD SAFETY AN0 TRAFFIC AUTHORITY Accident e, Meibourne, 1917.
- -
Drink Driving Behaviour, Knowledge and Attitudes in Victoria, December 1976 - January 1979. RoSTA, 1981.

74
96 Internal Report on l000 Randomly Selected Licence H0 I ders, 1978.
97 Internal Report, 1978.
98 ROBERTSON, J.S. Blood Alcohol Concentrations in Drivers Breathalvsed b y Police in Six Australlan States. Proceedinqs Of the
99 ROBINSON, C.D. The ODeration Drlver Llcence Disquailflcation - a Sanction. Dept. of Criminology, University of Melbourne, 1977. 100 ROSS, H.L. Law, Sclence and Accidents: The British Road Safety Act
of 1967, Journal of Leqal Studies, 1973 I I , (l).
101 RYAN, G.A. Submlssion to the House of Representatives Standing Committee on Road Safety, Official Hansard Report, 1978, 367-396.
102 Urban-Rural Differences in Biographical Characteristics and Blood Alcohol Concentrations of Car Crash Casualties, Victorla, 1978 Unpublished report, RoSTA 1980.
103 RYAN, G.A., CLARK, P.D. and LAZARUS, S.A. A Review of tnerqenc Medical Service In Relation to Road SaTet , Report b. NRl24: m a m a l % Government%bming + ervice. 1973.
104 RYAN, G.A., SALTER, W.E., COX, C.J. and McDERMOTT, F.T. Blood Alcohol and Road Trauma Survey, Medical Journal g Austrella, 1976, - 2, 129-131.
105 RYAN. G.A. and SALTER, W. Alcohol Levels and Drlnkinq Behaviour of Road Crash Vlctims, Monash University, 1977.
106 SCHMIDT, W. and POPHAM, R.E. Personal Communication, 1978.
107 SELZER, M.L. and VINOKUR, A. Life Events, Subjective Stress and Traffic Accidents, American Journal of Psychiatry. 1974, 131, 903-906.
- L
108 SELZER. M.L. and WEISS, S. Alcoholism and Trafflc Fatalities: A Study in Futility, American Journal of Psychiatry, 1966, 123, 762-767.
- 109 SENATE STANDING COMMITTEE ON SOCIAL WELFARE Druq Problems 1_?
Austraila - An Intoxicated Society?. Canberra, Australian Government Piibi ISFiing Service, 1977.
110 SHUEY, K.B. 1977. Motor Car (Breath Testing Stations) Act 1976,
of Breath Testing Stations, internal Police Document. No. 8865 - Evaluation of Effectiveness of Twelve Months Operations
1 1 1 SMART, R.G. Per Capita Alcohol Consumption, Liver Cirrhosis, Death Rates and Drinking and Driving, Journal of Safety Research 1976, S, 112-1 15.
112 STEWART, R.W. identifying the Drinking Driver, Unpublished Report, Dept. of Criminology, University of Melbourne. 1977.

75
1 i3 Some Findings of Random Breathanalysis Programmes. Proceedinqs of the Autumn School 02 Studies on Alcohol W. Melbourne, St. Vincent's Hospital, 1978.
-
I14 STONE, K.C. Alcohol-Work Performance and Safety. Unpublished paper, Victorian Trades Hall Council, Melbourne, 1978.
115 Alcoholism in Industry Programs - A Union Manaqement Responsibllity Melbourne, Victorian Trades Hail Council. 1978.
116 SWANSON, C. Booby Traps in Drug Education, Journal g Education, 1976, - 6, 297. -
117 TONGE, ,J.I., O'REILLY, M.J.J., OAVISON, A. and DERRICK, E.H. Fatal Traffic Accldents in Brisbane from 1935 to 1964, Medical Journal of 'Austral'la, 1964, 2, 811-820.
118 TONGE, J.I. Post Msrtem B i w d Alcohol Levels in Road Accident Victims. Roceedings of the National Road Safety Symposium, Canberra. Australian Government Publishing Service, 1972.
119 TDNGE, J.I.. O'REiLLY, M.J.J., DAVISDN, A. and JOHNSTON, N.G. Trafflc Crash Fatalities: Injury Patterns and Other Factors. Medical Journal of - Australia, 1972: - 2, 5-13.
~~ 120 TRANSPORT CANADA The Education Study on Traffic Safety, Ottawa, 1973. (Clted b v Smith G.A.. Wolvnetz. M.S. and Wiaains. T.R.I.
~ ~,~ Drinkinq Drivers-b Canada A National Gadside Survey of the Blood Alcohol Concentratlons in Niqhtime Canadian Drivers. Ottawa, Ontario Transport Canada, March 1976).
~~ " - -
121 TRAVERS, D. and HENDTLASS, J. Survey of Aicohollsm Treatment Services in Victoria, Roceedinqs of the Autumn School of Studies on Alcohol and Drugs, Melbourne, St. Vincent's Hospital, 1978.
l22 TRINCA, G.W. The Role of the Road Trauma Committee of the Royal Australasian College of Surgeons, Paper presented at a Queensland Road Safety Council Seminar, Brisbane, 1977.
,' 123 Australia, Paper presented at the 51st General Scientific Meeting,
Aicohol Involvement in Road Crash Casualties: Victoria,
Kuala Lumpur, May, 1978.
124 VICTORIA POLICE Alcotest District ibnthly Totals Sook, 1977, Internal Document, Breath Anaiysis Section, Victorian Police Department ..
125 Breath Test Book 1977, Internal Document, Breath Analysis Section, Victorian Police Department.
126 Fatal Accidents Diary, Traffic Department, Victoria Poi ice, 1977.
- 127 Refuse Breath Test b o k , 1977, Breath Analysis Section, Victorian Poiice Department e
128 Traffic Department, Victoria Police Annual Report, 1971.
I 76
129
130
131
1 32
133
1 34
135
1 36
137
138
139
140
141
VULCAN. A.P. To What Extent have Random Breath Tests Controlled Drlnk/Driving Deaths and Injuries? Roceedinqs Seminar Wmtroi of the Drlnkin Driver". Melbourne, Royal Australasian College of SSrgZEiis, -"d c o er ,1979.
A Revlew of Road Safety Inltiatives, Paper presented to Transportation Branch, institute of Engineers, Australia, Melbourne Dlvlsion, 23rd AprlI, 1980.
r
WAGNER, M.H., BIGELOW, J.H., COBB. J., GOLDSTEIN, L. KIRKPATRICK, R.E. Analysis of Risk Groups for Alcohol
and
Countermeasures, Technical Research Assoclates, Inc., Washington, March, 1975.
- WALLER, J.A. identlficatlon of Problem Drinking among Drunken Drlvers, Journal of the American MedIcaI Assoclation, 1967, 200 (2), 124-130.
WALLER, J.A. and TURKEL, H.W. Alcoholism and Trafflc Death, New England Journal g Medicine, 1966, 275, 532-536. WALLER, P.F., HOUSE, E.G. and STEWART, J.R. An Analysis g Accidents b~ h, Highway Safety Research Centre. Universlty of North Carollna, 1977.
WHITLOCK, F.A., ARMSTRONG, J.L., T0NGE.J.i.. O'REILLY, M.J.J.,
or the Driving Drinker? Alcohol, Alcoholism and other Factor,s in DAVISON, A., JOHNSTON,N.G. and BILTOFT, R.P. The Drinking Driver
Road Accidents, Medlcal Journal g Australla, 1971, - 2, 5-16. WILDE, G.T.S. Evaluatlon of Effectiveness of Public Education and information Proarammes Related to Alcohol, Drugs and Traffic Safety, - In Israeistam, S. and Lambert, S. (Eds.) &oceedings of the 6th International Conference Alcohol, Druqs and Traffic Safety, Toronto, 1974, Canada: Addiction Research Foundation of Ontario, 1975.
WILKINSON, P., KORNACZEWSKI, A., RANKIN, J.G. and SANTAMARIA, J.N. Physical Disease in Alcoholism. Medlcal Journal of Australia, 1971, 1, 1217-1223.
- - WILLIAMS, K. Youth Survey: Alcohol and Drug Use, Unpublished Report, Social Welfare Department, 1978.
WORKERS COMPENSATION ACT.
WORLD HEALTH ORGANIZATION Technical Report, Series No. 48, Geneva, 1952.
WRIGHT, B.M., JONES, T.P. and JONES, A.W. Breath Alcohol Analysis and the Blood-Breath Ratio, Medicine,Science and the Law,1975, E, 205-210.

APPENDIX A
DRIVER GROUP DATA BASES
-~ ~-
A.
B.
C.
D.
E.
F.
G.
78
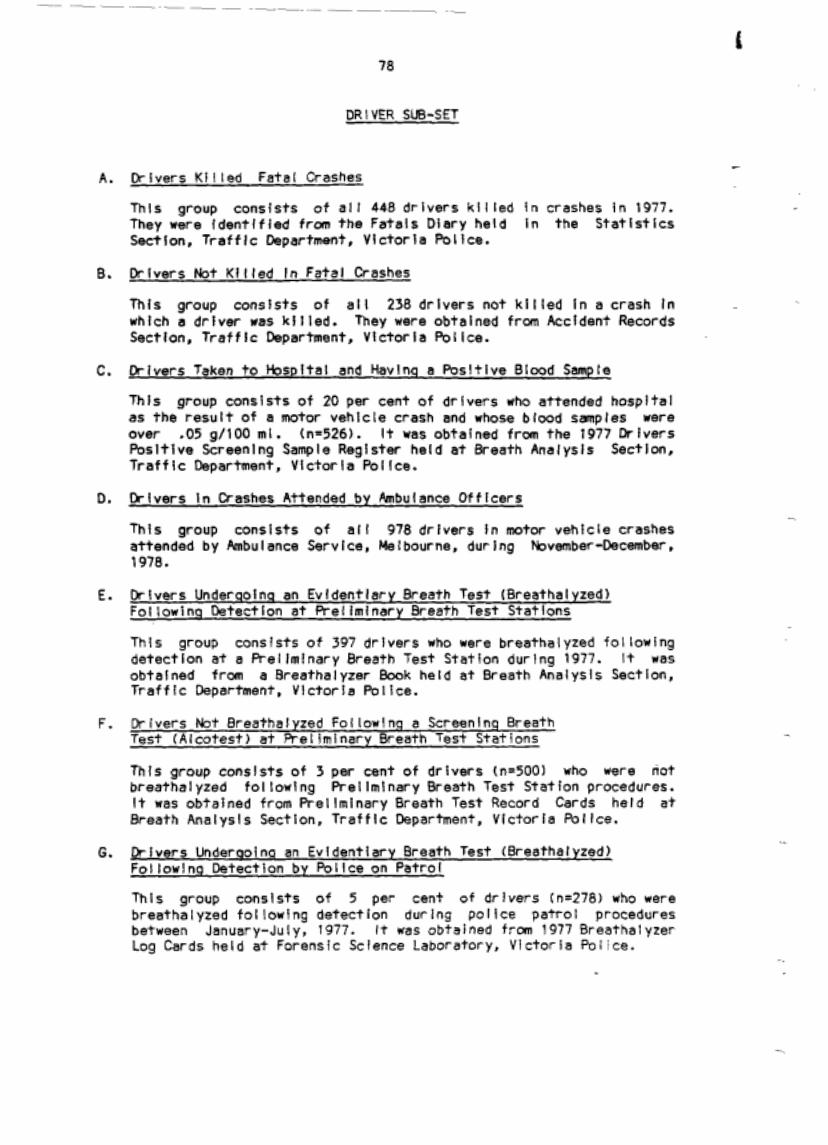
DRIVER SUB-SET
Drivers Ki I led Fatal Crashes
They were identlfied from the Fatals Diary held in the Statlstics Thls group consists of all 448 drivers killed in crashes in 1977.
Sectlon, Trafflc Department, Victoria Police.
Drlvers Not Kllled In Fatal Crashes
This group consists of all 238 drivers not kllied in a crash In which a driver was killed. They were obtained from Accident Records Section, Trafflc Department, Vlctoria Pollce.
Drivers Taken to Hospital and Havinq a PosItive Blood Sample
Thls group consists of 20 per cent of drivers who attended hospltai as the result of a motor vehicle crash and whose blood samples were over .05 g/100 ml. (n=526). It vas obtained f r m the 1977 Drivers Positive Screenlnq Sample Reglster held at Breath Analysis Section, Traffic Department. Victoria Pollce.
klvers In Crashes Attended by Ambulance Offlcers
This group conslsts of all 978 drivers In motor vehicle crashes attended by Ambulance Service, Melbourne. during November-December. 1978.
Drlvers Underqolnq an Evldentlary Breath Test (Breathalyzed) Foilowinq Detection at Rellmlnary Breath Test Statlons
This group conslsts of 397 drivers who were breathalyzed following
obtalned from a Breathalyzer Book held at Breath Analysis Sectlon. detectlon at a Preliminary Breath Test Station during 1977. it was
Traffic Department, Victoria Police.
Test (Alcotest) at Preliminary Breath Test Stations Drivers Not Breathalyzed Followinq a Screeninq Breath
Thls group conslsts of 3 per cent of drivers (n.5001 who were not breathalyzed following Preilmlnary Breath Test Station procedures.
Breath Analysls Section, Traffic Department, Victoria Pollce. It was obtalned from Preilminary Breath Test Record Cards held at
Drivers Underooinq an Evldentlary Breath Test (Breathalyzed) Followinq Detectlon by Pollce on Patrol
Thls group consists of 5 per cent of drlvers (n=278) who were breathalyzed following detectlon durlng police patrol procedures between January-July, 1977. It was obtained f r m 1977 Breathalyzer Log Cards held at forensic Sclence Laboratory, Victoria Police.

79
H. Drivers Ebt Breathalyzed Following a Screenlna Breath Test (Alcotest) by Police on Patrol
This group conslsts of 15 per cent of drivers (n=499) who were administered a Preliminary Breath Test by police on patrol but not subsequently breathalyzed. It was obtalned from Preiiminary Breath Test Record Cards held at Breath Analysis Section, Traffic Department, Vlctorla Police.
I. Ikivers Attendinq Rehabilitation Courses
I Thls group consists of all 678 drivers who attended Drink-Driving Rehabilltation Courses during 1977. It was obtained from records held at St. Vincents' Hospital, Pleasant View Centre and Geelong Centre .for Alcohol and b u g Dependence. These centres operate.ln Melbourne and Geelong.
J. Drivers Disqualified from Crivlnq as the Result of a Drink-Drlv Conviction
Thls group consists of 5 per cent of drivers (n=500) who were disquailfied from driving as the result of a drink-driving convlctlon during 1977. It was obtained from the Dlsquaiification Register held at the Brief Room, Traffic Department, Victoria P O ~ ice.
.-
K. Drivers Refusing a Breath Test
This group consists of all 248 drivers who refused an evldentlary breath test when detected by police patrol procedures. It was obtalned from 1977 breathalyrer log cards held at the Forensic Science Laboratory, Victoria P 0 1 ice.

I
APPENDIX B
81
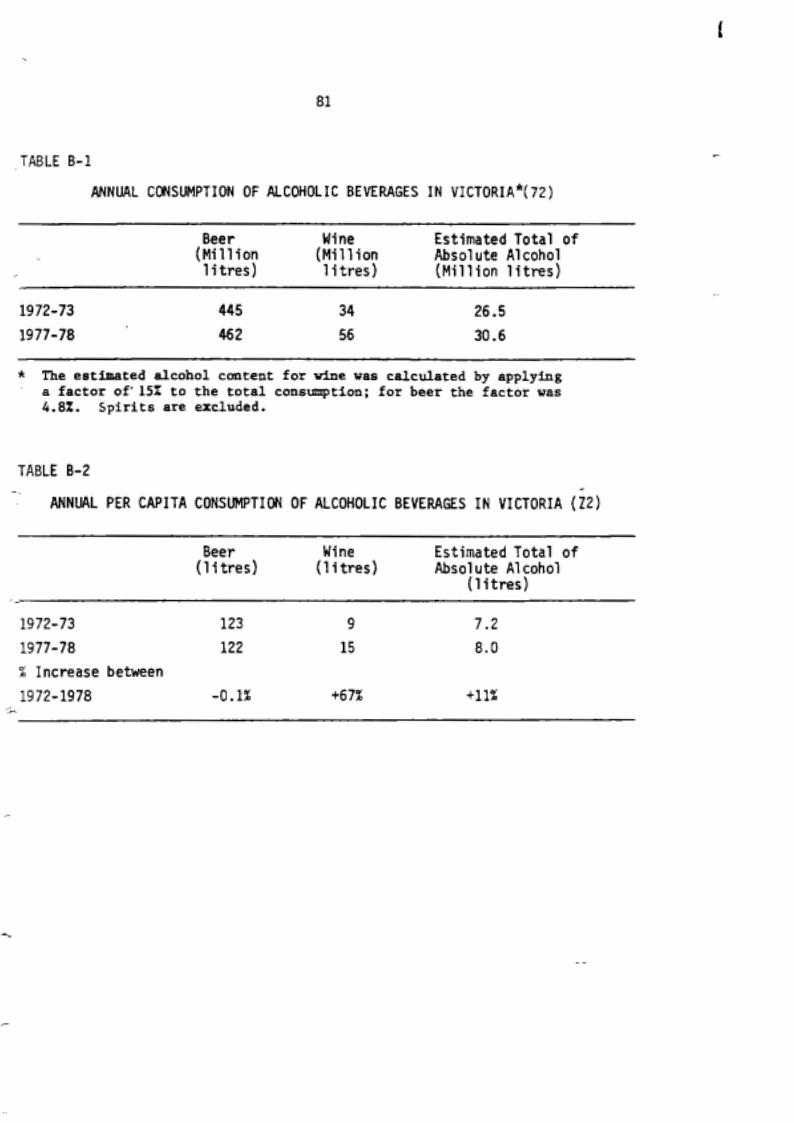
TABLE B-l
ANNUAL CONSUMPTION OF ALCOHOLIC BEVERAGES I N VICTORIA*(72)
Beer Wine Estimated Total of (Million (Million Absolute Alcohol 1 i tres) 1 i tres) (Million litres)
1972-73 445 34 26.5 1977-7a 462 56 30.6
* The estimated alcohol content for wine was calculated by applying a factor of155 to the total consumption; for beer the factor was 4.8%. Spirits are excluded.
TABLE B-2 - ~- ANNUAL PER CAPITA CONSUMPTION OF ALCOHOLIC BEVERAGES IN VICTORIA (22)
(litres) Beer
(litres) Wine Estimated Total of
Absolute A1 cohol (1 i tres)
1972-73 123 9 7.2 1977-78 122 15 8.0 X Increase between 1972-1978 -0.1% +67% +ll%

I \
TABLE B-3 CONCENTRATIONS OF ALCOHOL IN BEER FROM SELECTED COUNTRIES* .
Range of Beer*** , .. Range of Beer***
Supplied Locally Concentrations Supplied for Export
Country Concentrations
Austral i a Japan
3. 6 - 3.97** (72) 3.13 - 4.02 4.10 - 4.34
New Zeal and 3. 9 - 4. 9 3. 7 - 4. 2 Finland 2.25 - 4.50 3. 7 - 4. 5 Denmark Sweden
2. 1 - 6. 3 1. 8 - 3. 6 4. 5
Norway 1.78 - 5.30 3.53 Great Britain 1.77 - 2.49 Germany 1. 5 - 5.60 2.25 - 3.53
1. 5 - 5. 6 * Provided by selected manufacturers (1975) ** As in 1975. Up to date figures give the present range as
*** All concentrations are expressed as percent by weight. Percentage by volume can be calculated by dividing the figures given by .79.
2.1 - 4.25% (72)
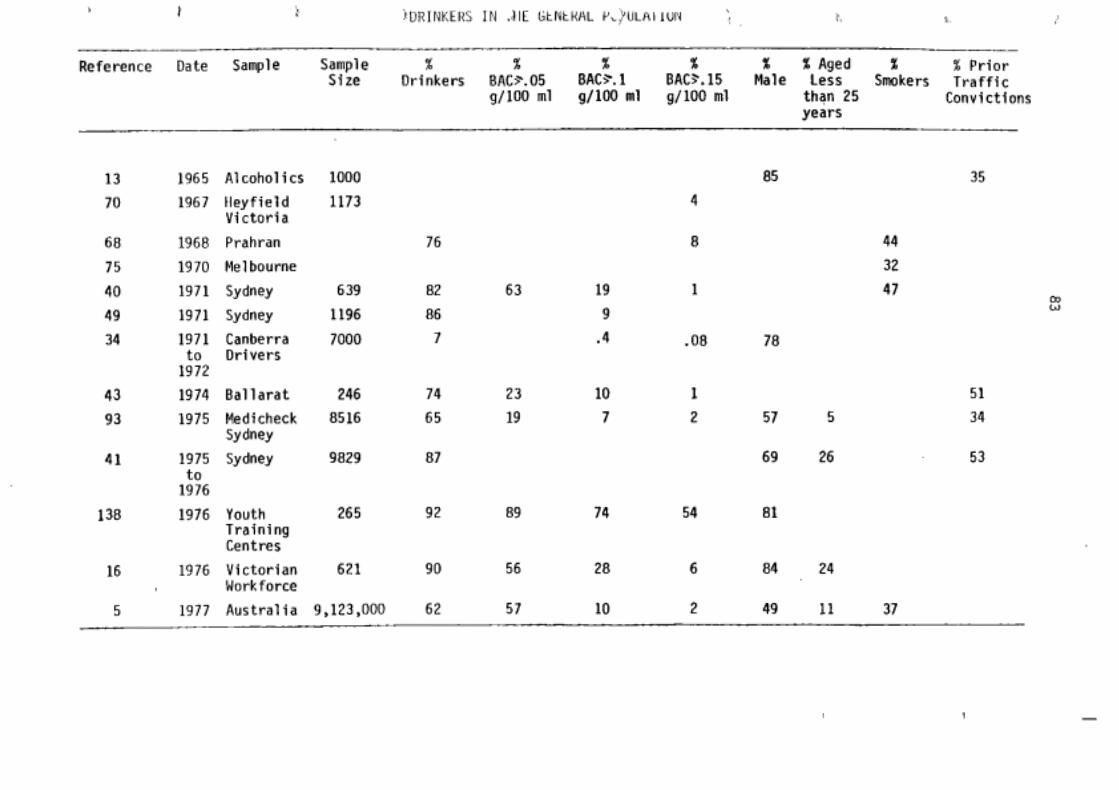
i 1 i i,DRINKEllS I N . d I E titNtKHL I',)ULHI lUlY ', P, P,, _'
Reference Date Sample Sample % % % % % % Aged % Size Drinkers BAC9.05 8AC9.1 8AC3.15 Male Less Smokers Traffic
% Prior
g/100 m1 g/100 m1 g/100 m1 than 25 Convictions years
13 70
68 75 40 49 34
43 93
41
138
16
5 -
1965 A1 cohol i cs 1967 tleyfield
Victoria 1968 Prahran 1970 Melbourne 1971 Sydney 1971 Sydney 1971 Canberra to Drivers 1972 1974 Ballarat 1975 Medicheck
Sydney 1975 Sydney
1976 to
1976 Youth Training Centres
1976 Victorian Workforce
1977 Australia
1000 1173
6 39 1196 7000
246 8516
9829
265
621
9,123,000
76
82 86 7
74 65
87
92
90
62
63 19 9 .4
23 10 19 7
89 74
56 28
57 10
4
8
1
.08
1 2
54
6
2
85
78
57
69
81
84
49
5
26
35
44 32 41 m
W
24
11 37
51 34
53

- . Sample X X X X X % %
Reference Date Sample Size Drinking Over Over Over Male Positive Prior
g/ 100 g/lOo g/100 .05 .l .l5 Under Traffic
m1 m1 m1 ol d 30 years Convi cti ons
112 1977 Charged, Victoria 250 96 1 34 98 50 112 1977 Not Charged, 250 81 54
55 30
Victoria
Breath Test 123 1977 Total Preliminary 635 2 89 38 31
34 1975 Canberra Roadside 7000 7 - .48 .08 78 Survey
* Percentages have been rounded to nearest whole number.
i
' l
.. ,

87
v, W I
LT W 5
LT M
n
m
.r c
Y
bec
0
L
-r
7
W aw
EN
m mm
7
W E m m

TABLE C-4 INJURED DRIVERS
Reference Date Sample Sample % % % % % % % Size Drinking Over Over Over Male Alcoholic Prior
.05 .l .l5 or Problem Criminal
59 . 6’1
104 103 122 122 122 104 73 122 123
g/lOO g/lOO g/lOO Drinkers m1 m1 m1
Convictions
1963 Brisbane 311 8 24 89 29 46 1974-75 Drivers, Sth. 21 20-30 16
Australia 1974 Victoria 117 29 1975 A1 fred Casualty 508 29 26 15 68 1977 Melbourne 271 28 18 13
1977 Victoria 34
1977 Victoria 20 1974 Alfred Hospital 142 28
1974-77 Victoria 35591 26 21 16 11 70 1974-75 Victoria 25 26 1977 Victoria 33
m m

TABLE C-5 DRIVERS BREATH TESTED BY PATROL PROCEDURES
Reference Date Sample % % % % % % X %
Sample Drinking Over Over Over Over Male Positive Prior Size .05 .l .l5 2 Under Traffic ggoo g q o o q o o d t o o 25 years Convictions -
67 91 91 90
20 122 123 48 98
1969 Victoria 1967 Melbourne 1967 Me1 bourne 1973 Metro.
1973 Victoria 1976 Victoria 1976 Victoria 1970 N.S.W. 1966-71 Australia
Me1 bourne
99 94 476
68,550 99 382
992 16,053
100 90 91
22,352 100 96
90 40 23 70 100 31 62
91 65 98 55 98 31 65
70 30 36 33
55 98 42 87 39 16 87 61 98 24
m W

90
APPENDIX E
TABLES RELATING TO DRINK-DRIVING EDUCATION AND PUBLICITY

TABLE D-l REFERENCE TO DRINK-DRIVING I N MELBOURNE METROPOLITAN
DAILY NEWSPAPERS, 1977 (2,223)
General Legislation/Penalties County/Supreme Courts Magistrate's Court Coroner's Court Hospi tals/Blood Tests Preliminary Breath Test Stations Police in General Drink/Driving Rehabilitation Overseas and Interstate Reports
16 3 5 10 9 15 30 6 4 2
Equivalent Total Expenditure*
100%
$16,000
36 2 8 17 4 6 24 3
4
100% -
$15,000
49 - 4 13 3 2 5 5 12 7
100%
$27,000
Estimated at $10 Cm/Colrrmn
TABLE D-2 DRINK-DRIVING AN0 LIQUOR INDUSTRY ADVERTISING ON
MELBOURNE METROPOLITAN TELEVISION, 1977
DRINK/DRIVING LIQUOR INDUSTRY Paid Unpaid*
($'OOO) (S'OOO)
Road Safety and
Channel 2 4.0 Channel 0 (now Channel 10) 4.5 Channel 7 64.0 Channel 9 N/A
Traffic Authority 35
TOTAL : ~~~ ~~~
107.5 1,958
* Estimated at $500 per minute Includes known Drink-Driving spots only (minimm figures)

92
TABLE D-3
,-
DRINK-DRIVING AND LIQUOR INDUSTRY ADVERTISING ON MELBOURNE METROPOLITAN RADIO, 1977
DRINK/DRIVING LIQUOR INDUSTRY Time (mi ns)
Expenditure Time Expenditure (S‘DOO) (mins) ($‘OOO)
,F Road Safety and
Traffic Authority 4 60* 24 Private Sponsors 43 2 3MP** 480 96
TOTAL : 9 83 122 12,500* 642
* Estimated at $52 per minute ** November 1977 - February 1978
,- TABLE D-4 OEFENSIVE AND SKILLED DRIVING COURSES
Number of Drink- Approx. Orink- Proportion
(1977) Content Allocation (hrs) Course Time Sponsor . participants Driving Driving of Total
Road Safety & Film & Traffic Authority 900 Discussion si 5% Royal Automobile Literature &
Goul burn Vall ey Film & Club of Victoria 40 Discussion r,
Driver Training 160 Discussion 1 7 7: Complex
5 0’ M
F-,
APPENDIX E
STATISTICAL COMPARISONS BETWEEN DIFFERENT DRIVER SUB-SETS

94
TABLE E-l
,... POLICE ACCIDENT REPORTS OF METROPOLITAN CRASHES
Drivers Transported drivers with Drivers with by Ambulance - No blood sample Pol ice blood sample taken taken bl ood sample
(n=57)1 W
(n=262)2 (n=500) analysed e % X (n=182)
.T 4,
Accident Report not available
Accident Report available4
47
53
36 33
64 67
1
99
NOTES : 1 From Driver Sub-set D - Drivers in collisions attended by Ambulance
officers, of which Non-Injury Accident Reports represent 5%
”- 2 From Driver Sub-set D - Drivers in collisions attended by Ambulance officers, of which Non-Injury Accident Reports represent 2%
3 From Driver Sub-set C - Drivers taken to hospital and having a positive blood sample. - 4 Non-Injury Accident Reports are included as Reported Accidents.

95
TABLE E-2 DRIVERS TAKEN TO HOSPITAL BY AMBULANCE OR BY OTHER
TRANSPORT'
N u l ance Other Transport Transport
% % ~~ ~~
Proportion of all drivers taken to hospital 62% 38% Sex (11.126) (n.77) - Male 65 68 - Female 35 32
Age - Less than 26 years - 26 to 40 years - Over 40 years
Occupation - White collar - Blue collar - Not Employed
Licence Status - Current Licence - Unlicensed
(n.125) (n.77) 45 40 30 27 25 32
(n.126) (n.77) 32 26 43 38 25 36
(n=117) (n=72) 97 99 3 1
Vehicle Type (11.116) (n.75) - Sedan or Station Wagon 72 71 - Motor Cycle 20 21 - Commeri cal a a
* Use of similar.symbols indicates a statistically significant difference. From Motor Accident Board Statistical File - metropolitan, 6 November exceed $100. to 4 December, 1978. Includes only drivers whose medical expenses

b.
96
TABLE E-3
GENERAL CHARACTERISTICS OF DRIVERS TESTE0 OR NOT TESTED ,.- FOR ALCOHOL AS THE RESULT OF A METROPOLITAN CASUALTY CRASH
.- . .
TAKEN TO NOT TAKEN HOSPITAL TO HOSPITAL
BLOOD NOT BLOOD BREATH2 NOT BREATH TESTED TESTED TESTED TESTED % % % %
Number in 1977 (N=27,436) (Total State)
Proportion of Drivers involved in Casualty Crashes3
Sex - Male - Female Age - Less than 26 years .- 26 to 40 years - Over 40 years Residential Address - Central Melbourne - Northern Suburbs - Eastern Suburbs
- - - South Eastern Suburbs - Western Suburbs - Rural Victoria - Interstate & Overseas
-_
-
~" Occupation - White Collar - Blue Collar - Other (including Housewife)
' - Pensioner Drinking - Yes
-.
- NO ,"
9,788 2,048
36% 7%
(n=272) (n-57) 7 1' 560 A 29 44
(n=273) (n=55) 46' 40 2 9' 40 25 20
(n=269) (n=51) 6 7
15 30 34O 14' 22 23 18 18 6 7 1 2
(n=149) (n=22) 36 41 38 16' 3 6'
g'oA
10' 14
(n=9Y)i' (n=16)4 40'* 50' 60 50
649
2%
(n=9D) 96"' 4
(n.90) 43 36 21
(n.90) 6 10 26 36 14 8 1
(n=11) 45 55' 0.O 0'
(n=89) 98 A
2
14,951
54%
(n=235) 81AA 19
(n.217) 3 1' 4 3' 26
(n=128) 4
21 27 21 19 6 2
(n=60) 33 53A 12 2
(r1.129)~ 16hA a5
97
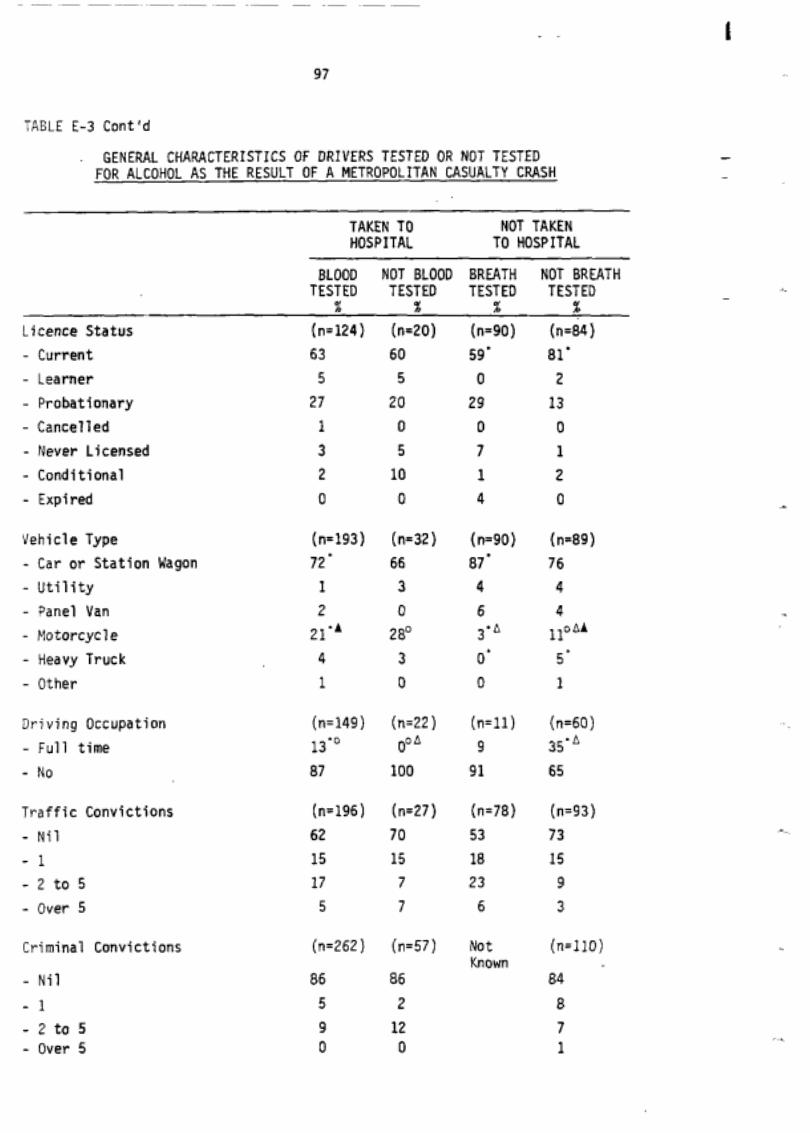
TABLE E-3 Cont 'd
FOR ALCOHOL AS THE RESULT OF A METROPOLITAN CASUALTY CRASH GENERAL CHARACTERISTICS OF DRIVERS TESTED OR NOT TESTED
TAKEN TO NOT TAKEN HOSPITAL TO HOSPITAL
BLOOD NOT BLOOD BREATH NOT BREATH TESTED TESTED TESTED TESTED
licence Status (n=124) ( ~ 2 0 ) (n=90) (n=B4) - Current 63 60 59' 81' - Learner 5 5 0 2 - Probationary 27 20 29 13 - Cancelled 1 0 0 0 - Never Licensed 3 5 7 1 - Conditional 2 10 1 2 - Expired 0 0 4 0
Vehicle Type (n=193) (n=32) (n=90) (n=89) - Car or Station Wagon 72. 66 87' 76 - Utility 1 3 4 4 - Panel Van 2 0 6 4 - Motorcycle 21.A 2 a0 3.A 11OAA - Heavy Truck 4 3 0' 5' - Other 1 0 0 1
OI k % % % -
Driving Occupation - Full time - NO Traffic Convictions - N i l - 1
- 2 t o 5 - Over 5 Criminal Convictions
- N i l - 1 - 2 t o 5 - Over 5
(n=149) (n.22) (n=ll) (n=60) 13" O0 * 9 35'A 87 100 91 65
(n=196) (n.27) (n=78) (n=93) 62 70 53 73 15 15 18 15 17 7 23 9 5 7 6 3
(n=262) (n=57) Not (n=110)
86 86 84 5 2 8 9 12 7 0 0 1
Known

90
TABLE E-3 Cont'd
GENERAL CHARACTERISTICS OF DRIVERS TESTED OR NOT TESTED FOR ALCOHOL AS THE RESULT OF A METROPOLITAN CASUALTY CRASH
TAKEN TO NOT TAKEN HOSPITAL TO HOSPITAL
,-
~~ ~ ~~~ ~ ~~~
BLOOD NOT BLOOD BREATH NOT BREATH TESTED TESTED TESTED TESTED % % % %
Drink-Driving Convictions (n=196) (11.28) (n.78) (n=94) - Nil 93 92 B7 9a - 1 6 4 12 2 - 2 o r 3 1 4 1 0
-_~ NOTES
The use of similar symbols indicates a statistically significant difference between the two groups (p < .001).
Calculated from entire state figures (73) and assuming that the country * distribution is the same as the city distribution.
Combined Driver Sub-sets D, G and H.
Calculated on the basis of proportions in metropolitan casualty crashes.
Taken from ambulance officers' assessment. -

99
TABLE E-4 GENERAL CHARACTERISTICS OF DRIVERS INVOLVED
IN CASUALTY CRASHES (METROPOLITAN ONLY)
Killed' Drivers Drivers Taken
to Hospital2 Taken to Hospital' Drivers Not
% % %
Number for 1977
State (N=28,384) Total
Propartion of drivers involved i n Casualty crashes Sex - Male - Female
Age - Less than 26 years - 26-40 years - Over 40 years Resi denti a1 Address - Central Melbourne - Northern Suburbs - Eastern Suburbs - South Eastern Suburbs - Western Suburbs - Rural Victoria
Interstate or Overseas Occupation - White Collar - Blue Collar - Other (including
housewife) - Pensioner Drinking - Yes - NO Licence Status - Current - Learner - Probationary
448 11,8363 16,100
2%
(n=142) 83' 17
(n=142) 44 27' 30
(n1142) 5 11 29 22 27 7 0
(n-85) 25 51
14
11' (n=113)"
46 54
(n=133) 5 7O 7 18
42%
(n=346) 69' ' 31
(n.331) 46' 31 24
(n=332) 6 18 30 22 17 6 l
(n=172) 36 35
19
11 (n=354)
31 69
(n=145) 62 * 5
26
56%
(11.239) 8Z0 18
(n=221) 31' 43' 26
(n.132) 4 21 27 21 19 6 2
(n=62 j 32 55
11
2 O -
19 O (n=148)
81 (n=88)
El0' 2 13
-.

. , 100
TABLE E-4 Cont'd GENERAL CHARACTERISTICS OF DRIVERS INVOLVED
IN CASUALTY CRASHES (METROPOLITAN ONLY) _-
Drivers Ki 1 led'
Drivers Taken Drivers Not to Hospitali Taken to Hospital2
X % 01 ,e
- Cancel 1 ed 2 1 0 - Never Licensed 10 3 2 - Conditional 6 3 2 Vehicle Type (n=141) (n=227) (11.196) - Car, Station Wagon 67 71 81 O - Utility 2 1 2 - Panel Van 4 2 2 - Motorcycle 25 * 22 O 3O' - Heavy Truck 3O 4 11 O - Other 0 1 2 Driving Occupation (n.87) (n=172) (1-1.62) - Full Time 17 11 O 34 O
.~ 1
-.
- NO 83 89 66
PRIOR CONVICTIONS OF DRIVERS INVOLVED IN CASUALTY CRASHES
Drivers Drivers Taken Drivers Not Kil l ed to Hospital Taken to Hospital
7; DI b
OI 13
Traffic Convictions - Nil - 1 - 2 t o 5 - Over 5 Criminal Convictions - N i l - 1 - 2 t o 5 - Over 5 Drink-Driving Convictions - Nil - 1 - 2 o r 3
~-
F.
I
(n=109) 56 28 16 O 0
(n=73)6 74 15 11 0
(n=224) 63 15 16 5 O
(n.321) 86 4 9 0
(n=225) 93 6 1
(n=97) 73 16 8 3
(n=113) a4 a 7 l

:;CITES
Use of similar symbols indicates a statistically significant difference between the two groups (p < .001)
l Information taken from Driver Sub-set A - drivers killed in metropolitan crashes in 1977
2 Information taken from Driver Sub-set D - drivers inv71ved in metropolitan crashes attended by Ambulance
3 Taken from McDermott and Strang (i3)
4 Based on blood alcohol readings
5 Estimated from blood alcohol readings of samples taken within
or if it was taken outside 2 hours 2 hours, and ambulance officers' opinions if the sample was not taken
6 Only available for July-December fatalities.
-.

102
TABLE E- 5 VEHICLES OF DRIVERS TESTED FOR ALCOHOL I N VICTORIA, 1977 -
Enforcement ' Victorian Vehicle (6) Sys tern Population (%) ( X )
r~ Vehicle Type - Car and Station - Utility - Panel Van - Motorcycle - Heavy Truck - Other
wagon (11-3.683)
86' 4' 5 O
3.2' 1' l
(n=1,799,400) 81' 6' 3O
2.9O 7' 0

TAELE E-6 SELECTION OF UNLICENSED OVER .05 g/100 m1 DRIVERS
Casualty No Crash, or Preliminary Crash Property Damage Breath Test
Only Crash Stations (Patrol 1
A l l Drivers Over
(N=13,920) .05 g/IDO m1
Sample % Unl icensed
Estimated No. of Unlicensed Over
(N=2,022) .05 g/100 m1
Estimated No. of Licensed Over .OS g/100 m1 (N=ll, 898)
~~ ~~
No. in Sample (n=328)*
2,993 10,662 265
12.3% 15.4% 4.76
368 1,642 12
2,625 9,020 253
70 246 12
* Based on a 15% sampling fraction. This sample size detects a difference
Licensed and Unlicensed groups of drivers. of 0.127 or greater between category proportions (around 0.5) in the
...
%.
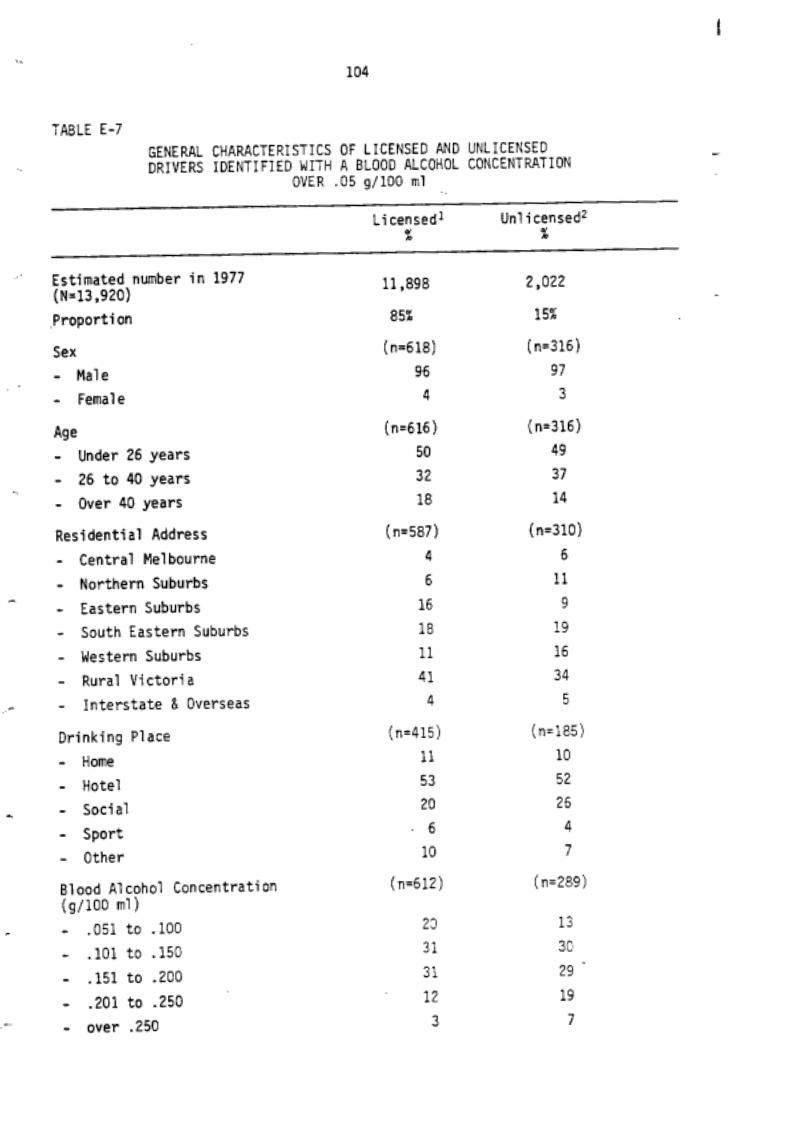
104
-.
Licensed' Unl i censed2 % %
~.' Estimated number in 1977 (N=13,920) ,~roporti on
Sex - Male - Female
Age - Under 26 years - 26 to 40 years - Over 40 years -.
Residential Address - Central Melbourne - Northern Suburbs - Eastern Suburbs - South Eastern Suburbs - Western Suburbs - Rural Victoria - ~nterstate & Overseas
Drinking Place - Home - Hotel - Social - Sport - Other
11.898
85%
(n=618) 96 4
2,022
15%
(n=316) 97 3
(n.616) (n=316) 50 49 32 37 18 14
(n=587) 4 6 16 18 11 41 4
(n=415) 11 53 20
- 6 10
(n=310) 6 11 9 19 16 34 5
(n.185) 10 52 26 4 7
.~
61 ood AI cohol Concentration (n=612) (q/loo m11 - .051 to .l00 - .l01 to .l50 - .l51 to .ZOO - .201 to .250 - over .250
(n=289)
23 13 r
31 30 31 29 12 19 3 7 -

105
'ABLE E-7 cont..
DRIVING CHARACTERISTICS OF LICENSED AND UNLICENSED DRIVERS IDENTIFIED WITH A BLOOD CONCENTRATION OVER .05 g/100 m1
Licensed o/
Unlicensed B %
.icence Status (n=618) (n=316)3
. Current 65 0
. Conditional 1 0 I Learner 2 0 - Probationary 32 0 - Cancelled/Disqualified D 23 - Unlicensed 0 76 - Expired 0 1
,iehicle Type (11.616) (n=316) - Car/Station Wagon 84 85 - Utility 5 7 - Panel Van 6 2 - Motorcycle 4 6 - Truck 1 0 - Other 0 0

106
TABLE E-7 cont..
PRIOR CONVICTIONS OF LICENSED AN0 UNLICENSED DRIVERS IClENTIFIED WITH A BLOOD ALCOHOL
CONCENTRATION OVER .05 9/100 m1
Licensed Unlicensed % ol
h
Traffic Convictions (n.568) - Nil - 1 - 2 t o 5 - Over 5
(n=311) 55O 36'. 18O 6'
5O 30' 23 28
Criminal convictions4 - Nil - 1 - 2 t o 5 - Over 5
(n.190) 78O
12O 3"
7
(n.69) 3 P 20 29' 2 oo
prink-Dri ving Convictions (n=566) - Nil
(n.310) 85' 570
2O zoo 0 1
- L 13 22 - - 2 t o 5 - Over 5
L

107
TABLE E-7 cont.. COilRT DETAILS OF LICENSED AN0 UNLICENSED DRIVERS IDENTIFIED WITH A BLOOD ALCOHOL
CONCENTRATION OVER .05 g/m! ~
Licensed Unl i chnsed % X
Drink-Driving Charge (n=614) (n-316) Exceeding .OS% 85 Driving Under the Influence 0 Drunk-in-Charge 0 Refuse Breath Test 00 Refuse Preliminary 0 Multiple Charges 6 Not Charged a
Other Traffic Charges5 - Speeding - Vehicle - OWD - Other
Presentment - Arrest - S u m n s
Representation - Ye5 - No
Plea - Guilty - Not Guilty - Did not appear
Result - Convict - Dismiss - Withdraw - Adjourn - Bond
Appeal - Yes - NO
(n=618) 16 6 O
O0 4 1
(n=592) 29O
71
(n=417) 45 55
(n.338) 60 29O
11
(n.438) 93 5
(n=616) 1
99
84 1 0 40 0 10 0
(n=316) 12 2 le 2 3O 90
(n=316) 80° 20
(11.278) 38 62
(n=245) 68 14' 18
(n=313) 95 1 2 0 2
(n=316) 1
99 -.

108
TABLE E-7 c@nt.' IDENTIFIED WITH A BLOOD ALCOHOL CONCENTRATION OVER COURT DETAILS OF LICENSED AND UNLICENSED DRIVERS
.05 gfml Licensed Unlicensed -
4 B
o_ n
~
Penalty: Loss of Licence (n=384) (n.292) - X who lost 1 i cence 62 92 - Average period of licence 10 18
- Range (months) 1-84 3-84 disqualification (months)
Penalty: Jail - Number who went to jail - % who went to jail
7 1% - Average sentence (weeks) 25 - Range (weeks) 2-104
Penalty: Fine - % who were fined - Average fine ($1 - Range
58 18% 4
1-36
(n=386) (n=239) 62 76 109 a9
620-$600 $30-$450
NOTES :
The use sf similar symbols indicates a statistically significant difference between the two groups (p < .001).
1. The proportion of the licensed driver group in various demographic ~ and biographic categories were calculated from the equation: . .
(Driver Sub-set C X .22) i (Driver Sub-set E X .02) + (Driver Sub-set G X .76).
2. The proportions of the unlicensed driver group in various demographic and biographic categories were calculated from the equation: (Driver Sub-set C X .l8) + (Driver Sub-set G X .82).
3. Of the Unlicensed drivers, 55 per cent had never been licensed before. 4. Figures refer only to drivers involved in a casualty crash; drivers
identified by patrol procedures are excluded.
5. These categories are not mutually exclusive and therefore do not add to 100 per cent.
*

109
TABLE E-E GENERAL CHARACTERISTICS OF UNLICENSED DRIVERS AND DRIVING
WHILE DISQUALIFIED DRIVERS (DWD) WITH A BLOOD ALCOHOL CONCENTRATION OVER .05 g/100 m1
Unl i censed DW D ($1 ( X )
Estimated Number in 1977 (N=2022) 1,557 465 Proportion 7% 2 3%
Sex - Male - Female
Age - Under 26 years - 26 to 40 years - Over 40 years
Residential Address - Central Melbourne - Northern Suburbs - Eastern Suburbs - South Eastern Suburbs - Western Suburbs - Rural Victoria
(n=242) (n=72) 9 5 O 100" 5 0
(n=242) (11.72) 53 38 33 50 14 12
(11.236) (n=72) 7 3 10 15 8 13 21 13 15 19 33 36
- Interstate & Overseas 6 1
Drinking Place - Home - Hotel - Social - Sport - Other
(n=141) (n.43) 11 9 55 44 24 33 4 5 6 9
Blood Alcohol Concentration (g/lOO mls) (11-226) (c.60) - .051 to .l00 13 13 - .l01 to .l50 32 22 - .l51 to .200 30 32 - .201 to .250 18 27
Over .250 7 6

l 110
TABLE E-8 cont.
WHILE DISQUALIFIED DRIVERS (DWD) WITH A BLOOD ALCOHOL CONCENTRATION GENERAL CHARACTERISTICS OF UNLICENSED DRIVERS AND DRIVING
OVER .@5 g/lOO m1
” Licence Status (11.232) (n.71) - Licensed before & Cancel led 330 00 - Licensed before & DWD OC 78@ - Licensed before & Expi red 1 0 - Never Licensed Before 66@ 2 2 O
Vehicle Type (n=242) (n.72) - Car/Station Wagon 84 aa - Utility 7 8 - Panel Van 2 1 - Motorcycle 7 3 - Truck 0 0 - Other 0 0 -

111
rABLE E-8 cont..
DISQUALIFIED DRIVERS (DWD) WITH A BLOOD ALCOHOL CONCENTRATION PRIGR CONVICTIONS OF UNLICENSED DRIVERS AND DRIVING WHILE
OVER .05 g/100 m1
Unlicensed (%l
DW D (%l
Traffic Convictions - N i l - 1 - 2 t o 5 - Over 5
Zriminal Convictions - N i l - 1 - 2 t o 5 - Over 5
Drink-Driving Convictions - N i l - 1 - 2 t o 5 - Over 5
(n.237) 4 8' 6
27 20'
(n=240) 33 16 27 24
(n=237) 70' 21 9 O
0
(n.71) 2' 4 33 61"
(11-72) 22 12 31 352
(n=71) 18' 21 5 8' 3

t I 112
Unlicensed DUD (4,) (%l I ~,
- Drink-Driving Charge (n=242) (n.72) - Exceeding .05% 86 79 - Driving Under the Influence 1 - Drunk-in-Charge n - Refuse Breath Test 2 - - Refuse Preliminary 0
- Multiple Charges 11
l
0 8 1 1D
Other Traffic Charges3 (n=242) - Speeding 11 - Vehicle-related
(n=72) 12
23 14 0 100 - DWD - Other 10Go 57O
Presentment - - Arrest
- surnons
Representation - Yes - NO
Plea - Guilty - Not Guilty - Did Not Appear
Result - Conri ct - Dismiss - Withdraw
.-
_I - Adjourn
- Bond
(n=242) 76' 24
(n=211) 32O
68
(n=188) 64 13 2 3'
(n.235) 96 1 1 0 1
(11.72) 93O 7
(n=65) 5 7O 43
(n=53) 79 17 40
(n=72) 90 1 3 0 6
Appeal - Yes 0 4 100 96
-. - NO -

NOTES
The use of shilar symbols indicates a statistically significant different berween the two groups (p < .001).
1. 42 per cent had 8 or more prior traffic convictions.
2. 31 per cent had 8 or more prior criminal convictions. 3. These categories arenot mutually exclusive and therefore do not
add to 100 per cent.

I , -. 114
TABLE E-9 GENERAL CHARACTERISTICS OF DRIVERS OVER .05 g/100 m1
PROSECUTED AND NOT PROSECUTED
Casualty Crzsh or Property No Crash Preliminary
Damage Only Greath Test
Crash Steticn
~ ~~ ~ ~~ ~~
Prose- Not Prose- Not Prose- Not cuted' Prose- cutedl Prose- cuted' Prose-
~~~
-, cufed2 _I cuted2 ", cuted2
Number in 1977
Proportion of Drivers 29% 7 1% (n=12,476) 455 1,093
Sex (n=138) - Male 9 6' - Female 4
Age (n=122) - Less than 26 years 50. - 26 to 40 years 34 - Over 40 years 16'
Residence (n=106) - Central Melbourne 7 - Northern Melbourne 7' - Eastern Suburbs - S/Eastern Suburbs - Western Suburbs - Rural Victoria - Interstate &
Overseas
Occupation
- White Collar - Blue Collar - Other (including Housewife) - Pensioner
Blood A1 cohol Concentration (g/100 ml) - .051 to -100 - .l01 to .l50 - .l51 to .ZOO - .ZOO to .250
(n.327) 85' 15
(11.270) 56 31 19
(n.198) 40 8
1 7 18 18 23 12 loll 37L 36'
2 2
(n=41) (n=69)
l00 25 66 55
12 12 12 8
(n=138)' (n=316l4 9ov 260'
590* 44AA 32 29'
0 0
10,513 99%
(n.204) 98 2
(n.204) 4 70 34 190
(n=204) 4 6" 130 18 1 IC 4?
5
Not Known
149 198 1% 74$
(n=3) (n=186) 97 3
(n=3) (11.186) 31O' 42 2 70A
(n=3) (n.186) 7
]8Dh
30. 16 190 go A
1
Not (n=184) Known
340 58
5 3
68 26 ?L
(n568) 97A 3
(n=68) 23 44 32 A
(n=66) 9" 23 18 18 24 8 b
2
(11.68)
38 59
3 -
(n=205) (n.3) (n.186) (n-68: 15. 36Avm 76 31 37A - 4 55' 19'0 101 0 8 3

115
TAB1.E E-9 Cont'd DRIVING CHARACTERISTICS OF DRIVERS OVER .05g/100 m1
PROSECUTED AND NOT PROSECUTED
Casualty Crash No Crash Preliminary or Property Damage Only
Breath Test Station
.~ Crash
Prose- Not Prose- Not cuted
Prose- Not Prose- cuted Prose-, cuted Prose- cuted
% X % % % % cuted cuted
Licence Status
- Current - Learner - Probationary - Cancelled - Never Licenced - Conditional - Expired
Vehicle Type
- Car/Station Wagon - Utility - Panel Van - Motorcycle - Heavy Truck - Other
Driving Occupation
- Full-time - N O
(n.121)
50 7' 27 4 8 4 0
(n=11g)
78 . OA
1P' 4
1 0
(n.41)
12 88
(n.241) (11.206)
52A 57' 6' 1 31' 2 5A 4O 2 5 11 3 1 0 4
(n.244) (n=206)
8 5' a5A 3 Ph
€? 20
3 6
1 1 0 0
(11.69) Not Known
7 93
(n=3) (n= 185)
850' A 0' 9 'A 0 5 0 1
(n=3) (n.186)
67 96 '' 1' 2 1' 1 0
Not (115183) Known
12 88
(n.68)
100 - 0
(n.68)
100 O -
(n=68)
13 87
. ..

116 .
TABLE E-9 cont.
PRIOR CONVICTIONS OF DRIVERS OVER .05 g/100 m1 PROSECUTED AND NOT PROSECUTED
Casualty Crash No Crash or Property Breath Test
Prelimicary
Damage Only Station Crash
~~ ~~ ~~~~ ~ ~ ~ ~~ ~~
Prose- Not Prose- Not cuted
Prose- Not Prose- cuted Prose- cuted Prose-
% cuted cuted % X % % %
cuted
- Traffic Convictims (n=117) (n.250) (n=161) (n.2) (n.184) (n.66)
- N i l 45' 57 5'! 60 58 - 1 21 15 17 17 21 - 2 t o 5 - Over 5
29 22 29O 22 21 4 6' 4 1 O 0
Criminal Convictions (n.128) (n=292) Not Not (n.186) (n=66!
- Nil 73" 73 4300 72 Known Known
- 1 6' 9' 38' 18- .~ - 2 t o 5 14 12 15 7
- Over 5 a 6 5 3
Drink-Driving
- N i l a4 a5 77 85 86 Convictions (n.116) ( ~ 2 5 0 ) (n=206) (n=2) (n=184) (n=66)
_. - 1 12 13 19 12 9 - 2 o r 3 4 2 4 3 5
117
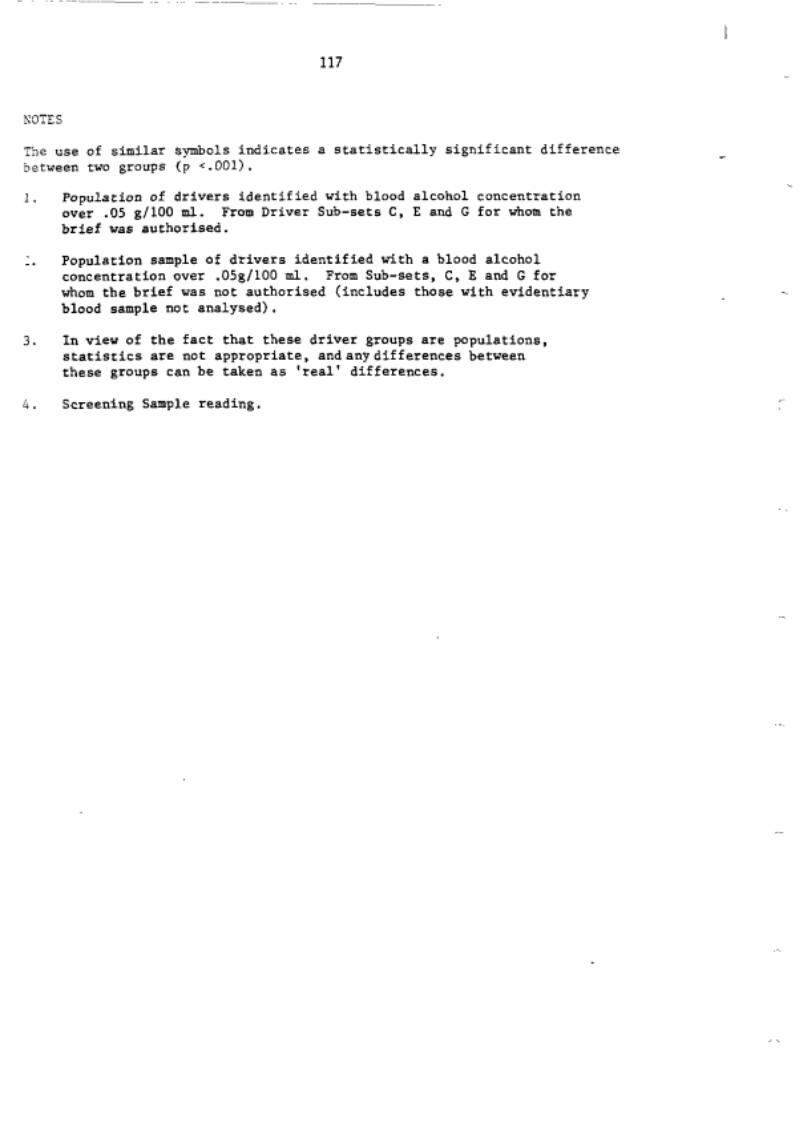
NOTES
The use of similar symbols indicates a statistically significant difference between two groups (p <.001).
1.
_.
3.
4.
Population of drivers identified with blood alcohol concentration
brief was authorised. over .05 g/100 d. From Driver Sub-sets C, E and G for whom the
Population sample of drivers identified with a blood alcohol concentration over .05g/100 ml. From Sub-sets, C, E and G for whom the brief was not authorised (includes those with evidentiary blood sample not analysed).
In view of the fact that these driver groups are populations, statistics are not appropriate, andanydifferences between these groups can be taken as 'real' differences.
Screening Sample reading.

I 118
TABLE E-l0
,~
Found Case
.a % Gui 1 tyl Dismissed2
01
.. Number of cases in 1977 (N =11,523)
in the Magistrate's Court proportion of cases heard
1977 Sex - Male - Female
Age
"
- Under 26 years - 26 to 40 years - Over 40 years
Resi denti a1 Address - Central Melbourne ~ - Northern Suburbs
- Eastern Suburbs - South Eastern Suburbs - Western Suburbs - Rural Victoria - Interstate & Overseas
Occupation - White Collar - Blue Collar - Other (including Housewives) - Pensioners
_ .
-
11,108
96%
(n.488) 98 2
(n5477) 4 7 35 18
(n=463) 4 6 13 18 11 49" O0
(n=202) 13 86 1" oo
415
4%
(n=207) 94
6
(n=206) 44 34 22
(n.206) 2 10 19 ?l l5 3 1' z0
(n= 120) 25 52 1 go 4"
Blood Alcohol Concentration (g/100ml) (n=479) ( ~ 2 0 7 ) - ,051 to .l00 - .l01 to .l50
l? 2 8' 30 32 52' 20 - .l51 to .ZOO
- .201 to .250 - Over .250 2" 14 " O 3 6"
119
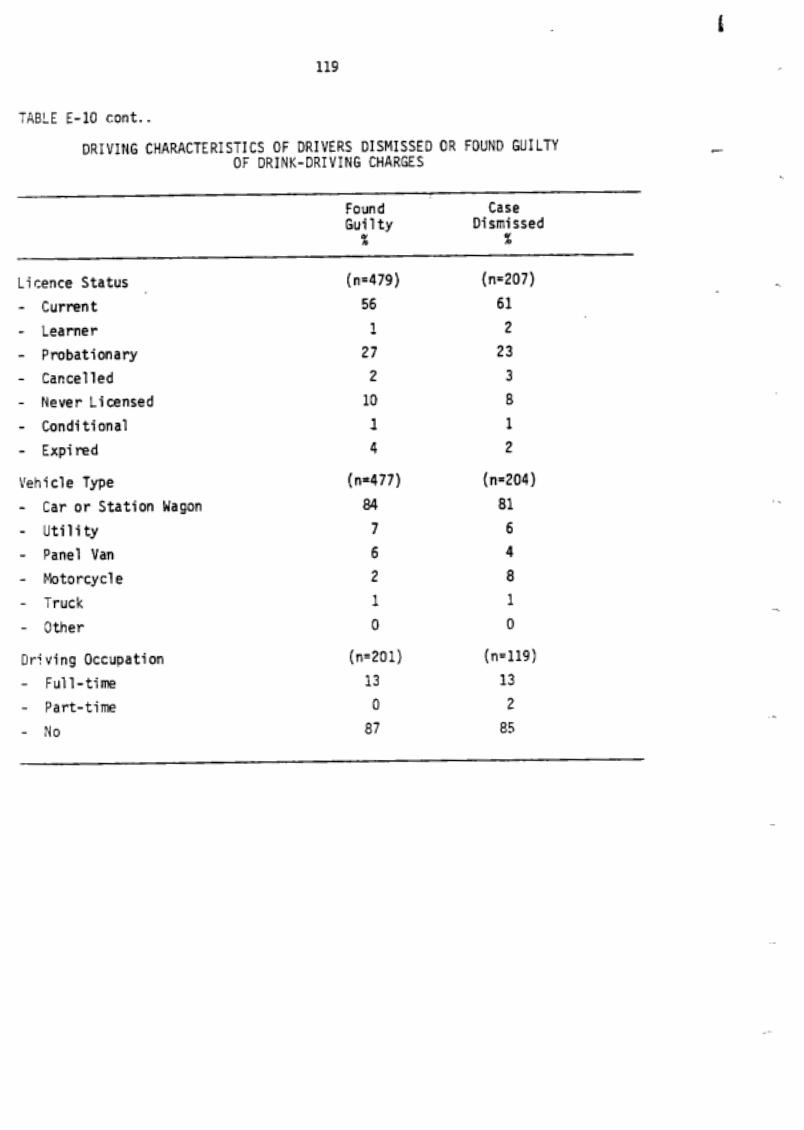
TABLE E-l0 cont..
Found Case Gui 1 ty Dismissed % % ._
Licence Status - Current - Learner - Probationary - Cancelled - Never Licensed 10 - Conditional 1 - Expired 4
Vehicle Type (n=477) - Car or Station Wagon - Utility - Panel Van - Motorcycle 2 - Truck - Other
Dr; ving OCCUpatiOn - Full-time - Part-time - No
(n.479) (n.207) 56 61 1 2 27 23 2 3
8 1 2
(n-204) 84 81 7 6 6 4
8 1 1 0 D
(n=201) (n=119) 13 13 0 2 87 B5
120
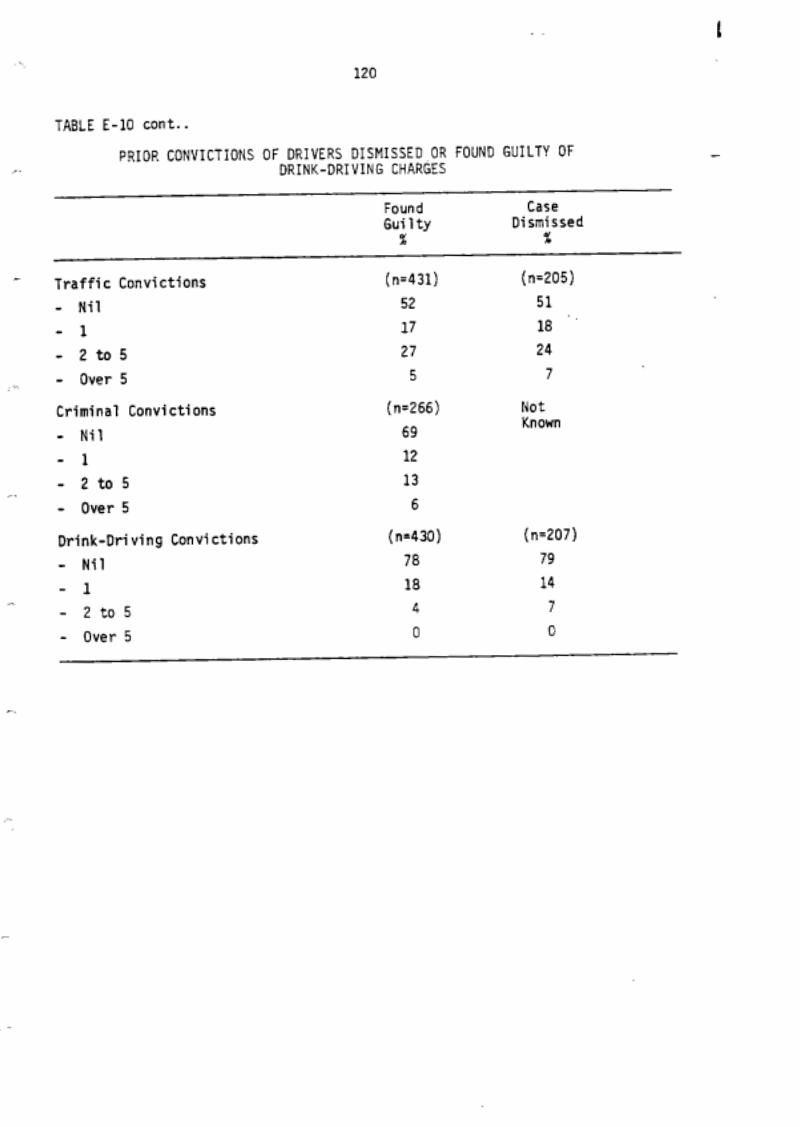
TABLE E-l0 cont..
~- Traffic Convictions (n.431) (n.205) 52 51 17 18
- Nil - 1 - 2 t o 5 - Over 5
Criminal Convictions (n.266) - N i l - 1 - 2 t o 5 - Over 5
Drink-Dri ving COnVi CtiOnS (n.430) - Nil - 1 - 2 t o 5 - Over 5
27 24 5 7
~1
Not Known 69
12 13 6
<.
(n=207) 7a 79 18 14 4 7 0 0
~

ABLE E-l0 cont..
COURT DETAILS OF DRIVERS DISMISSED OR FOUND GUILTY OF DRINK-DRIVING CHARGES
Found Gui 1 ty
v ' Case Dismissed
c, l2 X
rink-Driving Charges (n.484) (n.207) Exceeding .05% 92' a3O
Drunk in Charge 1 Driving Under the Influence 1
5 2
Mu1 tiple Charges 6 3 Refuse Breath Test D 3 Refuse Preliminary Breath Test O0 40
'01 ice Informant Metropolitan Traffic
Other Pol ice Operations Group
'resentment Arrest
. Summons
(n=217) (n=207)
14 13 a6 a7
(n=490) (n=206) 4i0 70 O 59 30
iepresentation (n=515) (n=195) - Yes 39O 91° - NO 6 1 9
VOTES
The use of similar symbols indicates a statistically significant difference Ietveen the two groups (p < .OOl). 1. The relative frequencies were calculated from the equation:
(Driver Sub-set G X 0.93) + (Driver Sub-set E X 0.02) + (Driver Sub-set C X 0.05).
2. The relative frequencies were calculated from the equation: (Driver Sub-set C X 0.49) + (Driver Sub-sets G and E X 0.51!.

I . 122
TABLE E-l1 GENERAL CHARACTERISTICS OF DRIVERS WHO ARE DISQUALIFIED OR NOT DISQUALIFIED FROM DRIVING AS THC RESULT OF A
DRINK-DRIVING CHARGE ,~
Not Oisqual i fi edl Disqualifiedi from DTi vi ng from Drivipg - C! -
Number in 1977 (N=11,192) 900 10,292 Proportion of Cases Heard3 8% 92"L "
Sex - Male - Female
Age - Less than 26 years - 26 to 40 years - Over 40 years
Residence Central Melbourne Northern Suburbs Eastern Suburbs South Eastern Suburbs Western Suburbs Rural Victoria Interstate & Overseas
(3.44) 100 0
(n=sO) 49 22 29
(n= 77) l0 10
11 29 11 39 9
Occupation (n=54) - White Collar 19 - Blue Collar 41" - Other (including Housewife) O 2 - Pensioner 40 O
Blood Alcohol Concentration (g/lnOml) (n=83) - .051 - ,100 30 - .l01 - .l50 39 - .l51 - .zoo 29 - .201 - .250 ZC
Identification Procedure (n=86) - Police on Patrol 1 2 O
- Preliminary Breath Test 40 - Casualty Crash 4 9 O
(n=500) 98 2
(n.500) 46 35 19
(n=500) 7O
loo 17 16 14 32 4
!n=270) 17 7,o I J
6' 4a
(n=500) 15 35 44 'i'
(n=jOD) 92' 29 63

123
Not Disqualified Disqualified Ly I0 %
.i cence Status - Current - Learner - Probationary 20 - Cancel l ed O0 - Never Licensed 10 - Conditional 0 - Expired O0
(n=79) (n.499) 69 54 O0 2O
26 3O
9 1 5 O
Veh i cl e Type - Car/Station Wagon - Utility - Panel Van - Motorcycle - Heavy Truck - Other
Driving OCCUp3t!On - Part-time - No
(n.73) 81 D 9 10 0 0
(n.45)" 16 84
(n=499) 94 D 2 2 1 0
(n.268) 16 a4

t 124
TABLE E-11 cont.
Not Disqualified Disqualified DI 0 %
-- Traffic Convictions (11.74) (n=490)
- Nil 19 51
49 27 - 1 17 17
- 2 t o 5 - Over 5 16 5
Criminal Convictions - Nil - 1 - 2 t o 5 - Over 5
Drink-Driving Convictions - Nil - 1 - 2 o r 3
-
-
(n=72) 60 17 12 11
(n.74) 58 16 16
Not Known
(n=490) 80 17 3

125
rfiBLE E-11 cont..
COURT CASE FOR DRIVERS WHO ARE DISQUALIFIED OR NOT
CHARGE DISQUALIFIED FROM DRIVING AS THE RESULT OF A DRINK.-DRIVING
Not Disqualified Di squal i fied % %
.-
'l ea (n.58) (n.332) . Guilty 65 76 - Not Guilty 35 24
?epresentation - Represented . Not Represented
'resentment - Arrest - S u m n s
(11-79) 61 39
(n=81) 47 54
li-ink-Driving Charges (n.81) - Ex .05 g/lOO m1 a1 . Driving Under the Influence 9 - Refuse Breath Test or Refuse
Preliminary Breath Test 00 - More than one drink-driving
Charge O0 - Failed to Comply 0 - Drunk-in-Charge 9
(n=430) 47 53
(11.500) 44 56
(11.500) a7 1
2O
9O
0 0
I 126
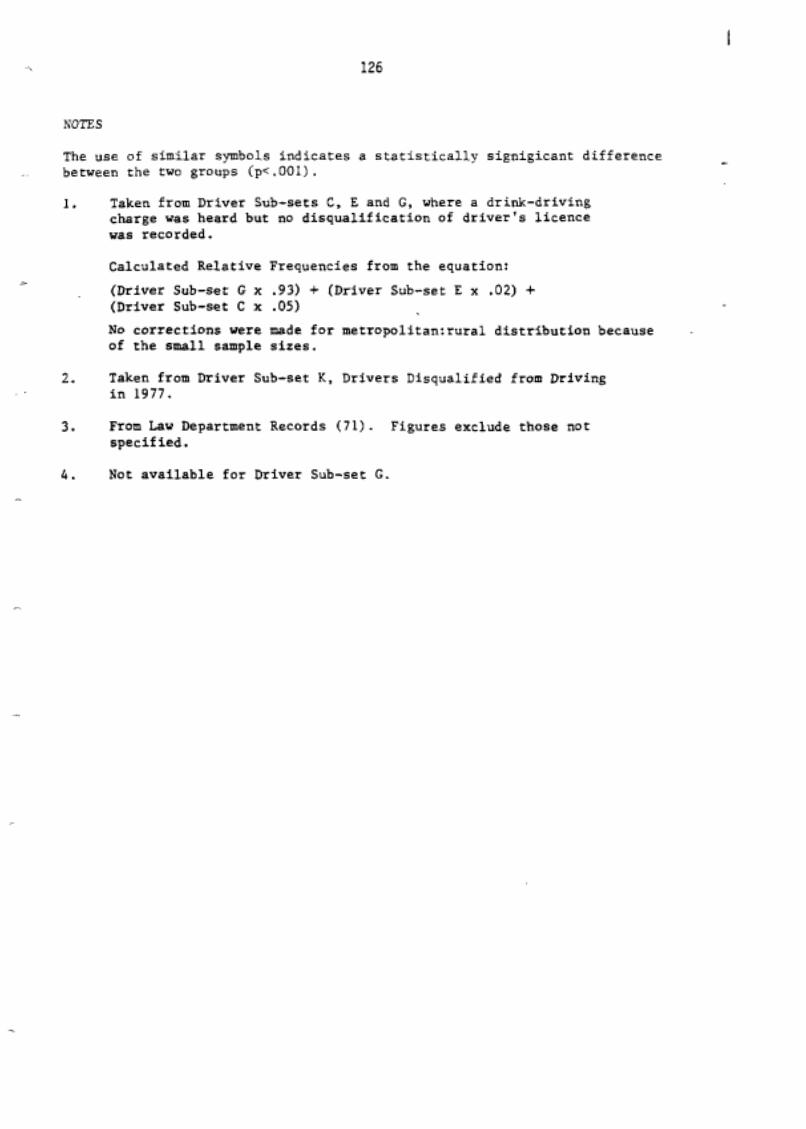
NOTES
between the two groups (p<.OOl). The use of similar symbols indicates a statistically signigicant difference -
"
1. Taken from Driver Sub-sets C, E and G, where a drink-driving charge was heard but no disqualification of driver's licence was recorded.
Calculated Relative Frequencies from the equation:
(Driver Sub-set G X .93) + (Driver Sub-set E X .02) + (Driver Sub-set C X .05) No corrections were made for metropo1itan:rural distribution because of the small sample sizes.
2. Taken from Driver Sub-set K, Drivers Disqualified from Driving in 1977.
3. From Law Department Records (71). Figures exclude those not specified.
4. Not available for Driver Sub-set G.

127
and Law DeDartment.
completes NOTICE of Disqualification Or Cancellation of Licence
(Form F4701
iecorded 1-n Court Xegister
I Zollated for
geturn Sheets
Form F430 I sent to
Police Station nearest Offenders Residence
attached)
I MOqOR l
l FCLICE FROSECUTOR completes Report of Conviction
' i -
INFOWiTiON
I Xecorded 1 %story Sheet
(no correspondin
Conviction Tie corded on Drivers Index Card)
Breath xnallysi s Section
l Eolice Stztion
1 nearest Offenders
"l Informants Police Station


129
10
2
3
12
20
29
41
72
4
2
3
3
11
11
14
a
3
2
l
3
1
2
3
3
1
3 2 l
3 2
1
1
1
l
1
2
1 1
2
1
1
1
4 1
1
1 l
n = 500

130
n

131
A3LE E-l6
DEFINITIONS USED FOR MELBOURNE SUBCRBAN AREAS AND OCCUPATIONAL STATUS -
iesidential address, collected as postcode numbers kere grouped according to :he geographic boundaries shown in the figure below.
iccupational categories were decided using the following system:
Jhi te Collar = Professional Managerial, Clerical and Salesworkers. These are Australian Bureau of Statistics categories: 01, 02, 03 and 04.
j1ue Collar = Farmers. miners, transport and communication workers, tradesmen and labourers and people from service and sporting occupations. These are Australian Bureau of Statistics categories: 05, 06, 07, 08 and 09.
Ither including
= Military servicemen, students, housewives and those coded 'Other'.
lousewi ves 'ensioners = Pensioners, retired people and the unemployed.

I 132
TABLE E-l6 cont.. 1 CRAIGIEBURN
DIGGERS REST 0
/ l NORTHERN \ F I "I I", .""C
LILYDALE
SUBURBS
A SOUTH-EASTERN SUBURBS
0 SYDENHAM a u m u n w
WESTERN SUBURBS
3R
ERRIBEE
'OUT' METROPOLITAN DIVISIONS \ Y CRANE( L FRANKSTON
! VICTORIA j I ",L.
STATE DIVISIONS

APPENDIX F
TABLES RELATING TO
LiCENCE RESTORATION
134 l
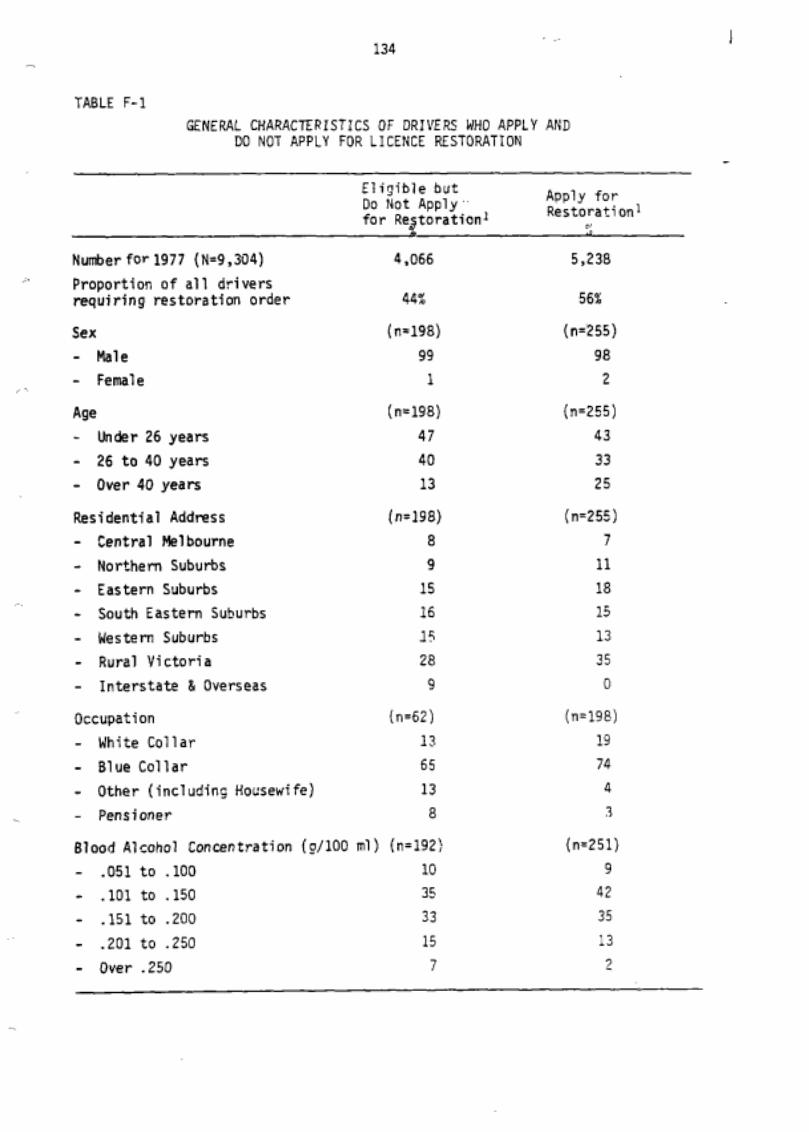
TABLE F-l GENERAL CHARACTERISTICS OF DRIVERS WHO APPLY AND
DO NOT APPLY FOR LICENCE RESTORATION
Eliyible but 00 Not Apply .. for Reporation’ Restoration’ c,
Apply for
Number for 1977 (N=9,304) Proportion of all drivers requiring restoration order
Sex - Male - Female
;i
, ,
Age - Under 26 years - 26 to 40 years - Over 40 years
Residential Address - Central Melbourne - Northern Suburbs - Eastern Suburbs - South Eastern Suburbs - Western Suburbs - Rural Victoria - Interstate €i Overseas
4,066
44%
(n=198) 99 1
(n=198) 47 40 13
(n.198) 8 9 15 16 If; 28 9
Occupation (n=62) - White Collar 13 - Blue Collar 65 - Other (including Housewife) 13 - Pensioner a
5,238
56%
(n=255) 98 2
(n=255) 43 33 25
(n=255) 7 11 18 15 13 35 D
(n=198) 19 74 4 3
Blood Alcohol Concentration (!/loo ml) (n=192) (n.251) - .051 to .l00 10 9 - .l01 to .l50 35 42 - .l51 to .ZOO 33 35
- .201 to .250 15 13 - Over .250 7 2

135 .-.
- Eligible but Do Not Apply for Restoration
Apply for Restoration
DI m %
.icence Status - Current - Learner - Probationary - Cancel led - Never Licensed - Conditional - Expired
Vehicle Status - car or Station Wagon - Utility - Panel Van - Motorcycle - Truck - Other
Driving OCCUpatiOn - Full Time - Part Time - N o
(n=198) 47O 3
19 6' 17' 1 9'
(n=198) 9s 0 3 1 2 0
(n=60) 5 10 85
(n=254) 64' 1 30 l0 2 O
2' 1
(n-254) 9 5 0 1 2 0 2
(n= 198) 8 8 85

136
TABLE F-l Cotit.
PRIOR CONVICTIONS OF DRIVERS WHO APPLY AND DO NOT APPLY FOR LICENCE RESTORATION
El i gi ble but Do Not Apply for Restoration
Apply for Restoration
X %
,. Traffic Convictions - Nil - 1 - 2 t o 5 - Over 5
Drink-Driving Convictions - Nil - 1
- - 2 o r 3
(q.190) 48 14 31 8
(n=l89) 78 l? 5
(n=253) 52 19 26 4
(n=254) 81 18 1
NOTES
The use of similar symbols indicates a statistically significant different between the tvo groups (p < .001) .
1. Taken from Driver Sub-set J.
137
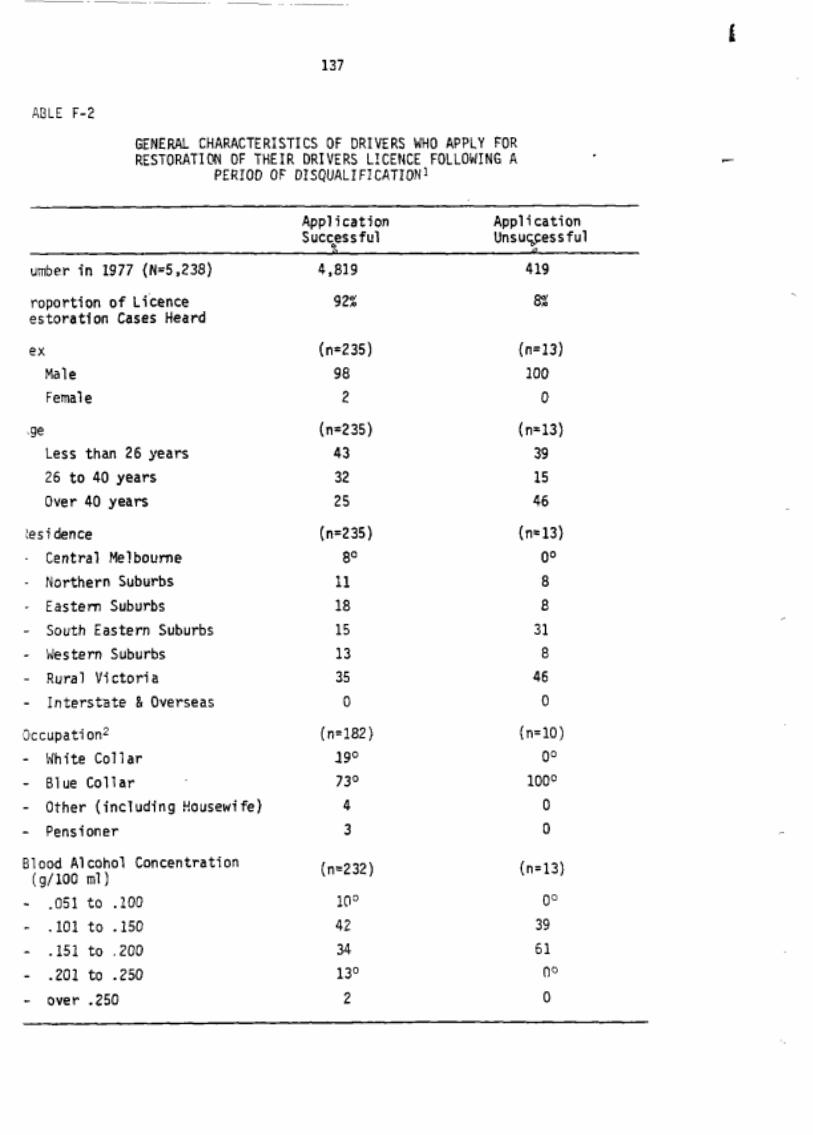
ABLE F-2
GENERAL CHARACTERISTICS OF DRIVERS WHO APPLY FOR RESTORATIN OF THEIR DRIVERS L!CENCE FOLLOWING A
PERIOD OF DISQUALIFICATION1
Application Appl i cation Succoessful Unsuyessful
umber in 1977 (N=5.238) 4,819 4 19
estoration Cases Heard roportion of Licence
ex Mal e Female
,ge Less than 26 years 26 to 40 years Over 40 years
:esi dence . Central Melbourne - Northern Suburbs - Eastern Suburbs - South Eastern Suburbs - Western Suburbs - Rural Victoria - Interstate & Overseas
92% 8%
(n=235) 98 2
(n=235) 4 3 32 25
(n=235) a0
18 11
15 13 35 0
Occupation’ (n.182) - White Collar 190 - Blue Collar 730 - Other (including Uousewi fe) 4 - Pensioner 3
Blood Alcohol Concentration (g/lOO m1 1 (n.232)
- .051 to .l00 100 - .l01 to .l50 42 - .l51 to .200 34 - .201 to .250 13O - over .250 2
(n=13) 100 0
(n=13) 39 15 46
( ~ 1 3 ) 00 a a 31 B
46 0
(n=10) 00
1000 0 0
(11.13)
00 39 61 no
0

138
TABLE F-2 cont.. DRIVING CHARACTERISTICS OF DRIVERS WHO APPLY
FOR RESTORATION OF THEIR DRIVERS LICEVCE FOLLOWING DISQUALIFICATION IN 1977
Application Application Successful Unsuccessful
% %
Licence Status2 (n=234) - Current 65 - Learner 0 - Probationary 30 - Cancelled 1 - Never Licensed 2 - Condftional 0 - Expired 1
Vehicle Type2 (n.234) - Car or Station Wagon 95 - Utility 0 - Pznel Van 1 - Motorcycle 3 - Heavy Truck 0 - Other
Driving Occupation2 (n-lez) - Full Time 16'
(n.13) 62 B
2 3 0 0 a 0
(11.13) 92 0 0 8 0
0 0
(n=lO) OC
a4 100 - NO

TADLE F-2 cont.. PRIOR CONVICTIONS FOR DRIVERS WHO APPLY FOR
RESTORATION OF THEIR DRIVERS LICENCE FOLLOWING DISQUALIFICATION I N 1977
Application Application Successful Unsuccessful
% %
Traffic Convictions2 - Nil - 1
(n=233) 53 18
(n=13) 39 31 - 2 t o 5 25 31
- Over 5 40 00
criminal Convictions3 (n=100) (n=4) - N i l 74 25 - 1 - 2 t 0 5
6 12
25 50
- Over 5 B 0
Drink-Driving Convictions2 - Nil - 1
(n=234) B2 16
(n=13) 69 31
- 2 o r 3 2 0

140
TARLE F-2 cont. I
OTHER INFORMATION ABOUT DRIVERS WHO APPLY FOR RESTORATION OF THEIR DRIVERS LICENCE
FOLLOWING DISQLJALIFICATION IN 1977
Appli catior! Application Successful Unsuccessful
?a %
Identification Procedure2 - Casualty Crash - Preliminary Breath Test St.ation - Patrol Procedures
Drink-Driving Charges - Exceed -05 g/lOO m1 - Driving Under the Inflwnce - Refuse Breath Test - Refuse Breath Test & DUI
Rehabilitation Centre - Nil - Drink-Driving Programme - A1 cohol ism Treatment - Other
(n=235) 7 O . l
92 O
(n.235) 92 1 0 7
(n=234) 87 9 1 3
(n=13) 00 0
100 O
(n=13) 85 0 0 15
(n.13) 77 16 8 0
N O m S
The use of similar symbols indicates a statistically significant difference between the two gro'lps (p < .001).
1. Information from Driver Sub-set J
2. Data relates to time of original identification as a drink-driver.
1. As at August 1979.

141
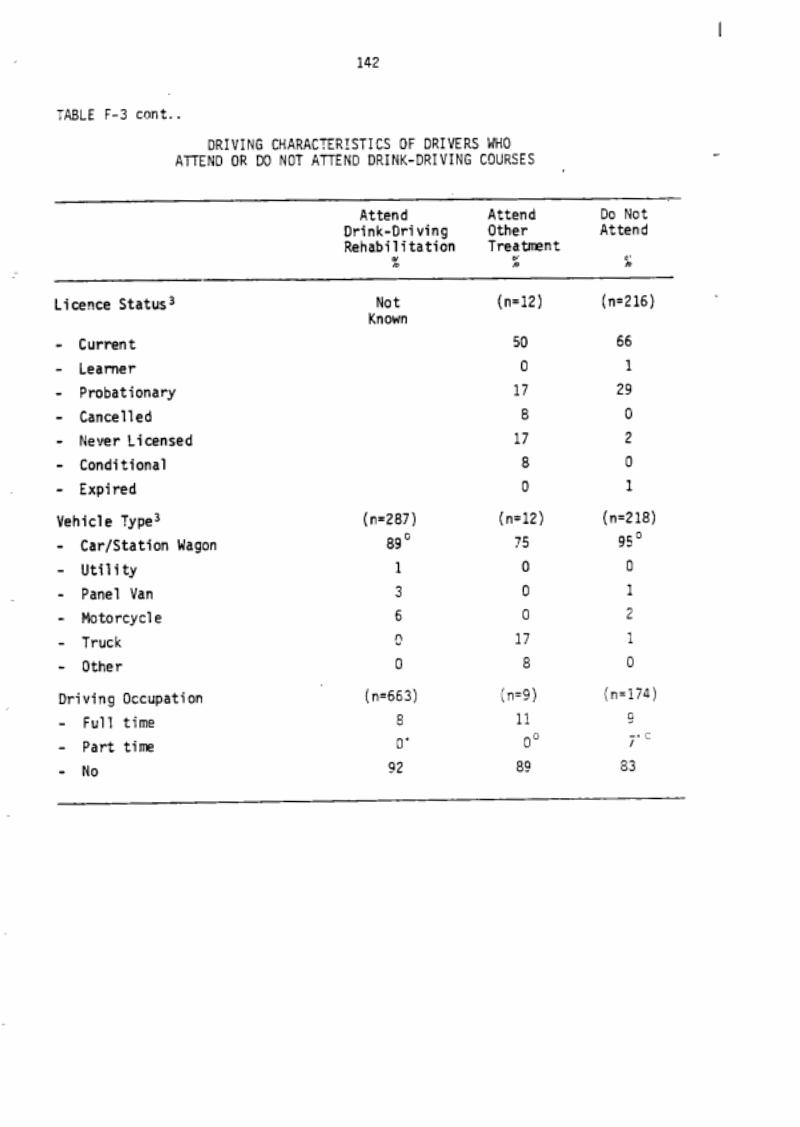
4BLE F-3 GENERAL CHARACTERISTICS OF DRIVERS WHO ATTEND OR
DO NOT ATTEND DRINK-DRIVJNG COURSES
Attend' Attend2 00 Not2 Orink-Driving Other Attend Rehabilitation ' Treatment
% % %
rlmber in 1977 (N=9,304) 678 387 a , m roportion of Drivers who Apply or Licence Restoration 7% 4% 89%
ex Male Femle
ge Under 26 years 26 to 40 years Over 40 years
(11.678) (n=12) (n.217) 99 100 98 1 0 2
(n=678) (n=12) (11.217) 53O 42 42' 30 42 32 16' 17 25'
!esidential Address ( ~ 6 6 2 ) (n= 12) (n=218) Central Melbourne Northern Suburbs Eastern Suburbs South Eastern Suburbs Western Suburbs Rural Victoria Interstate & Overseas
5 a 7 26' 8 9O
28' 42 16' 20 17 15 9 17 11 12' ao 40" 0 0 0
Iccupation (n=666) - White Collar 20 - Blue Collar 69 - Other (including Housewife) 3 - Pensioners a Blood Alcohol Concentration (g/100ml) (n=645) - .l00 to .l50 7 - .l51 to .200 43
- Over .250 O0 - .201 to .250 50'
( n=9 1 22 67 0 11
(n=l1) 9 27 45 18
(n=168) 17 76 4 3
(n=218) 8 44 34 * 13 O
142
TABLE F-3 cont.
A T E N D OR DO NOT ATTEND DRINK-DRIVING COURSES DRIVING CHARACTERISTICS OF DRIVERS WHO
Attend Attend Do Not Drink-Driving Other Attend Rehabilitation Treatment
% D. b %
Licence Status
- Current - Learner - Probationary - Cancelled - Never Licensed - Conditional - Expired
Vehicle Type3 - Car/Station Wagon - Utility - Panel Van - Motorcycle - Truck - Other
Driving OcCUpati On - Full time - Part t i m - NO
Not (n=12) (n.216) Known
50 66 0 1 17 29 a 0
a 0 17 2
(n=287) a9 G 1 3 6 9 0
(n.663) a 0'
S2
U
( ~ 1 2 ) 75 D 0 0 17 8
(n=9) 11 O0 a?
l
(n=218) 95 O 0 l
2 1 0
(n=174) 0 _. c I
83

143
TAaLE F-3 cont..
PRIOR CONVICTIONS OF DRIVERS WHO ATTEFD OR DO NOT ATTEND DRINK-DRIVING COURSES
Attend 8 'Attend Do Not Drink-Driving Other . Attend Rehabilitation Treatment
% X X ~ ~~ ~~
Traffic Convictions - Nil - 1
- 2 t o 5 - Over 5
Drink-Driving Convictions - N i l - 1 - 2 o r 3
(n=651) 37' 28' 30 5
( ~ 6 4 5 ) 65 28 * 7O
(n.12) 17' 25 50 8
(n=12) 33O
58' a
(n=216) .56' O 19O
23 4
(n=216) 85' 14' l0