computational genomics lecture #3a (revised 24/3/09) this class has been edited from nir...
Post on 21-Dec-2015
213 views
TRANSCRIPT

.
Computational GenomicsLecture #3a (revised 24/3/09)
This class has been edited from Nir Friedman’s lecture which is available at www.cs.huji.ac.il/~nir. Changes made by Dan Geiger, then Shlomo Moran, and finally Benny Chor.
Background Readings: Section 2.7, 2.8 in Biological Sequence Analysis, Durbin et al., 2001.Sections 15.7-15.11 in Algorithms on Strings, Trees, and Sequences, Gusfield, 1997.
1. Intro to ML and Scoring functions2. PAM and BLOSUM AA scoring matrices

2
Scoring Functions
So far, we discussed dynamic programming algorithms for global alignment local alignment other, related versions
All of these assumed a scoring function:
that determines the value of substitutions, insertions, and deletions.
}){(}){(:σ

3
Where does the scoring function come from ?
An additive scoring function is defined by specifying a function ( , ) such that (x,y) is the score of replacing x by y (including x=y) (x,-) is the score of deleting x (-,x) is the score of inserting x
But how do we come up with the “correct” score ?
Idea: By encoding experience of what are similar sequences for the task at hand. Similarity depends on time, evolution trends, and sequence types.

4
Why probability setting is appropriate to define and interpret a scoring function ?
• Similarity is probabilistic in nature because biological changes like mutation, recombination, and selection, are random events.
• We could answer questions such as:• How probable it is for two sequences to be similar?• Is the similarity found significant or spurious?• How to change a similarity score when, say, mutation rate of a specific area on the chromosome becomes known ?

5
A Probabilistic Model
For starters, will focus on alignment without indels
(implying aligned sequences are equal length). For now, we assume each position (nucleotide /amino-
acid) is independent of other positions.
This is not a very realistic assumption, BUT it makes
our life a lot easier, and is a good start. We consider two options:
M: the sequences are Matched (related)
R: the sequences are Random (unrelated)

6
Unrelated Sequences (R)
Our random model R of unrelated sequences is simple Each position is sampled independently from a
fixed distribution q() over the alphabet We assume there is a distribution q() that
describes the probability of single letters. Then:
i
R(s[1..n], t[1..n] | ) q q(s[i]) (P t[i])

7
Related Sequences (M)
We assume that each pair of aligned positions (s[i],t[i]) evolved from a common ancestor
Let p(a,b) be a distribution over pairs of letters. p(a,b) is the probability that some ancestral letter
evolved into this particular pair of letters.
i
i
P(s[1..n], t[1..n] | ) p(s[i], t[i])
(
M
Rs[1..n], t[1..n] | ) (s[i]) (t[iP )q ]q
Compare to:

8
Odd-Ratio Test for Alignment
i
ii
p(s[i], t[i])P(s, t | ) p(s[i], t[i])
QP(s, t | ) q(s[i])q(t[i]) q(s[i])q(t[R i])
M
If Q > 1, then the two strings s and t are more likely tobe related (M) than unrelated (R).
If Q < 1, then the two strings s and t are more likely tobe unrelated (R) than related (M).
9
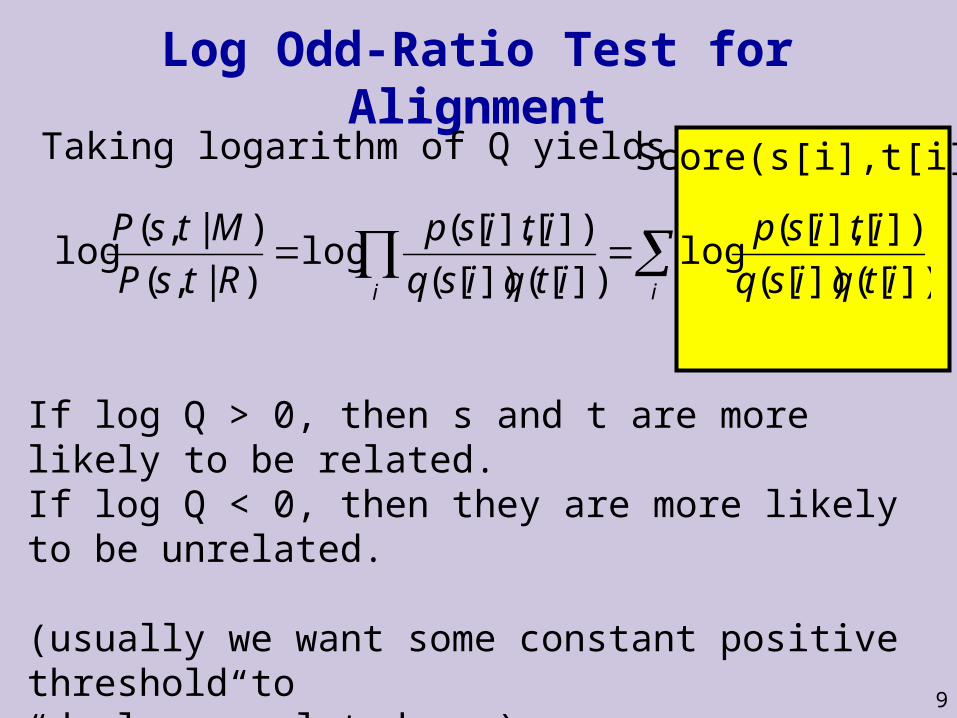
Score(s[i],t[i])
Log Odd-Ratio Test for AlignmentTaking logarithm of Q yields
])[(])[(
])[],[(log
])[(])[(
])[],[(log
)|,(
)|,(log
itqisq
itisp
itqisq
itisp
RtsP
MtsP
ii
If log Q > 0, then s and t are more likely to be related.If log Q < 0, then they are more likely to be unrelated.
(usually we want some constant positive threshold to “declare” relatedness).
How can we relate this quantity to a scoring function ?

10
Probabilistic Interpretation of Scores
We define the scoring function via
Then, the score of an alignment is the log-ratio between the two models:
Score > 0 Model is more likely
Score < 0 Random is more likely
)()(
),(log),(
bqaq
bapba

11
Probabilistic Interpretation of Scores We’ve defined the scoring function via
For example, suppose q(a)=0.1, q(b)=0.1, f(a,b)=0.001, f(a,a)=0.08, f(b,b)=0.07.
Then score (a,b)=log 0.1 < 0; score (a,a)=log 8 > 0; score (b,b)=log 7 > 0; Logarithms are convenient in order to have an additive scoring function under assumption of independence (log of product = sum of logs).
)()(
),(log),(
bqaq
bapbascore

12
Modeling Assumptions
It is important to note that this interpretation depends on our modeling assumption!!
For example, if we assume that the letter in each position depends on the letter in the preceding position, then the likelihood ratio will have a different form.
If we assume, for proteins, some joint distribution of letters that are nearby in 3D space after protein folding, then likelihood ratio will again be different.
13
Estimating Probabilities
Suppose we are given a long string s[1..n] of letters from
We want to estimate the single letters distribution, q(·), that best corresponds to the sequence
How should we go about this?
The theory of parameter estimation in statistics
Deals with this problem in detail.
But in our case, there is no need for heavy tools.

14
Estimating q()
Suppose we are given a long string s[1..n] of letters from
s is the concatenation of many sequences in our database
We want to estimate the distribution q()
That is, q is defined per single letters
a
nN
i 1 a
qL( | q) ( [is s ]) )q(a
Likelihood function:

15
Estimating q() (cont.)
How do we define q?
aq(a)N
n
a
nN
i 1 a
L(s | q) q(s[i]) q(a)
Likelihood function:
ML parameters(Maximum Likelihood)
Namely q(a) is simply the observed frequency of a in the sequence

16
Estimating p(·,·)
Intuition: Find pair of aligned sequences s[1..n], t[1..n], Estimate probability of pairs:
The sequences s and t are be the concatenation of many aligned pairs of sequences from the database
n
Nbap ba,),(
Number of times a is
aligned with b in (s,t)

17
Problems in Estimating p(·,·)
How do we find pairs of aligned sequences? How far is the ancestor of the aligned sequences?
earlier divergence low sequence similarity recent divergence high sequence similarity
Does one letter mutate to the other or are they both mutations of a common ancestor having yet another residue/nucleotide acid ?

18
Estimating p(·,·) for amino acids
Definition: An accepted point mutation is an observed substitution in a gapless alignment of closely related (homologous) protein sequences. For example, Hemoglobin alpha chain in humans and other mammalians.
Note that we cannot claim such mutation actually occurred (if we observe an A to B substitution, the “evolutionary truth” could be A to C to B (one substitution, two hidden mutations).

19
PAM-1 matrices (M. Dayhoff, 1970)
We take pairs of sequences that are no more than“1 unit of evolutionary distance apart”. This is interpreted as having substitutions in 1 percent (1/100) of the aligned sites (all other are matches, as we assumed no gaps).
In this ensemble of alignments, we count the frequencies of single letters, q() , and the frequencies of substitutions, p(·,·) .
The (a,b) entry in the PAM1 matrix is then
)()(
),(log),( PAM1
bqaq
bapba

20
PAM-1 matricesValues in matrix usually multiplied by 10 &
rounded.Example: A portion of PAM1 matrix1. A R N D C Q E 2. A 7 -15 -11 -11 -14 -12 -93. R -15 9 -14 -27 -16 -9 -26 4. N -11 -14 9 -5 -28 -11 -105. D -11 -27 -5 9 -32 -10 -46. C -14 -16 -28 -32 10 -31 -317. Q -12 -9 -11 -10 -31 9 -68. E -9 -26 -10 -4 -31 -6 9
Most off diagonal entries are negative, but not all.
For example score(B,N)=score(B,D)=7 (out of our
small portion).
21
PAM-n matrices
Generalize PAM1: Take pairs of sequences that are no more than “n unit of evolutionary distance apart”. Interpret this as having substitutions in n percent (n/100) of the aligned sites (all other are matches, as we assumed no gaps).
Nice idea, but does not quite work.Sequences with more than 3 or 4 percent substitutions cannot be aligned without gaps.
In addition, we may want evolutionary units that arelarger than 100 (e.g. PAM250 exists and useful).

22
PAM-n matrices
Let be the conditional probability that in 1 evolutionary time unit, an A mutates to a B.
In our terminology,
What is then the probability that in n evolutionary time units, an A mutates to a B ?
We should start with an A (an event whose probability is q(A) ),and then go through all possible paths that lead fromA to B in n steps.
)|Pr(),( M ABBA
)(/),()Pr(/)Pr(
)|Pr(),( M
ApBAqAAB
ABBA

23
PAM-n matrices
We should start with an A (an event whose probability is q(A) ),and then go through all possible paths that lead fromA to B in n steps. The probability of such processis given exactly by the A,B entry of the n-th powerof the matrix M.
Therefore, the probability of starting with A and
moving to B in n steps equals q(A) Mn(A,B).

24
PAM-n matrices
Therefore, the probability of starting with A and
moving to B in n steps equals q(A) Mn(A,B).
Recall the random (unrelated sequences) model, wherethe probability of having S[i]=A and T[i]=B equals q(A) q(B).
So PAMn (A,B), which is the log odds score, equals
log( q(A) Mn(A,B) / q(A)q(b) ) = log(Mn(A,B) / q(b) )
Notice that for n=1 this is the same as PAM1.

25
PAM-250 matricesValues in matrix usually multiplied by 10 &
rounded.Example: A portion of PAM250 matrix1. A R N D C Q E 2. A 2 -2 0 0 -2 0 03. R -2 6 0 -1 -4 1 -1 4. N 0 0 2 2 -4 1 15. D 0 -1 2 4 -5 2 36. C -2 -4 -4 -5 12 -5 -57. Q 0 1 1 2 -5 4 28. E 0 -1 1 3 -5 2 4
Many more off diagonal entries are positive(compare to PAM1).
26
The BLOSUM substitution matricesBLOSUM stands for BLOcks Substitution Matrices. The basic principles are similar to PAM,but the sequences used to compute substitutionfrequencies differ.
BLOSUM uses a database containing multiple sequence alignments from related (by function)but possibly remote (evolutionary) proteins. Conserved blocks (local alignments) are
detected, and substitution frequencies are computed
based on them.
BLOSUMn reflects more conserved sequencesfor higher values of n.

27
BLOSUM vs. PAM
BLOSUM 62 is the default matrix in BLAST 2.0.