© copyright 2015 sylvia m. lacourse
TRANSCRIPT

© Copyright 2015
Sylvia M. LaCourse

Tuberculosis case finding and performance of symptom screening and rapid
diagnostic tests in HIV-infected pregnant women in western Kenya
Sylvia M. LaCourse
A thesis
submitted in partial fulfillment of the
requirements for the degree of
Master in Public Health
University of Washington
2015
Reading Committee:
Grace John-Stewart, Chair
David Horne
Program Authorized to Offer Degree:
Epidemiology

University of Washington
Abstract
Tuberculosis case finding in HIV-infected pregnant women in Kenya reveals poor performance
of symptom screening and rapid diagnostic tests
Sylvia Marie LaCourse
Chair of the Supervisory Committee:
Grace John-Stewart, Professor
Departments of Global Health, Epidemiology, Medicine, and Pediatrics
University of Washington
Background: Tuberculosis (TB)/HIV during pregnancy is associated with poor maternal and
infant outcomes. There are limited data on TB prevalence, optimal TB screening, and
performance of rapid diagnostics in pregnant HIV-infected women.
Methods: We conducted a cross-sectional study of HIV-infected pregnant women in western
Kenya using a standardized questionnaire, and collected sputum for smear, mycobacterial liquid
culture, GeneXpert MTB/RIF, and urine for lipoarabinomannan. We determined prevalence and
correlates of culture-confirmed pulmonary TB, and compared diagnostic performance of World
Health Organization symptom screening and rapid diagnostic tests to sputum culture.
Results: Between July 2013 and July 2014, we enrolled 306 women. Among 288 women with a
valid sputum culture result, 54% were on antiretroviral treatment, and median CD4 cell count
was 437 cell/mm3 (IQR 342-565). Prevalence of culture-confirmed pulmonary TB was 2.4% (CI
1.0-4.9%). Cough >2 weeks (p=0.04) and positive TST (>5mm, p=0.03) were associated with
pulmonary TB. Women with TB were 23-fold (95% CI 4.4-116.6) more likely to report a
household member with TB symptoms (p=0.002). WHO symptom screen (43%), AFB smear
(0%), Xpert (43%) and LAM (0%) had low sensitivity but high specificity (81%, 99%, 99% and
95%, respectively) for pulmonary TB.
Conclusion: HIV-infected pregnant women had appreciable prevalence of pulmonary TB
despite modest immunosuppression. Current TB screening and diagnostic tools perform poorly
in pregnant HIV-infected women. Adapted TB screening tools including household member TB
symptoms may be useful in this population.

i
TABLE OF CONTENTS
List of Figures ................................................................................................................................ iii
List of Tables ................................................................................................................................. iv
1.0 Introduction ............................................................................................................................... 1
1.1 TB screening and diagnostic tests ................................................................................... 1
1.2 TB prevalence estimates in pregnancy ........................................................................... 2
2.0 Methods..................................................................................................................................... 2
2.1 Study Setting ................................................................................................................... 2
2.2 Participants ...................................................................................................................... 2
2.3 Procedures ....................................................................................................................... 3
2.3.1 Enrollment................................................................................................................... 3
2.3.2 TST testing .................................................................................................................. 3
2.3.3 Sputum Collection and TB Laboratory Testing .......................................................... 3
2.3.4 Kenyan National TB Guidelines ................................................................................. 4
2.4 Study Endpoints and Statistical Analysis ....................................................................... 4
2.5 Ethics Approval .............................................................................................................. 5
3.0. Results ...................................................................................................................................... 5
3.1 Baseline characteristics ................................................................................................... 6
3.2 TST and TB exposure ..................................................................................................... 6
3.3 Prevalence of culture-confirmed TB ............................................................................... 6
3.4 Performance of WHO symptom screen and rapid diagnostics ....................................... 7
3.4.1 WHO TB symptom screen .......................................................................................... 7
3.4.2 Xpert ........................................................................................................................... 7
3.4.3 Smear microscopy ....................................................................................................... 7
3.4.4 Urine LAM.................................................................................................................. 8

ii
3.4.5 Overlap of WHO TB symptoms screen, rapid diagnostics, and culture confirmed TB
cases ........................................................................................................................... 8
3.4.6 Overall performance of screening and diagnostic tools and combined screening
performance ............................................................................................................... 8
4.0. Discussion ................................................................................................................................ 9
4.1 High prevalence of culture-confirmed TB ...................................................................... 9
4.2 WHO TB symptom screening ......................................................................................... 9
4.3 Xpert ............................................................................................................................. 11
4.4 Urine TB-LAM ............................................................................................................. 11
4.5 Poor performance of WHO TB symptom screen and rapid diagnostic tests ................ 12
4.6 Promising future directions ........................................................................................... 12
4.7 Strengths and limitations............................................................................................... 13
4.8 Conclusions ................................................................................................................... 13
Bibliography ................................................................................................................................. 14
Appendix A: Tables and Figures .................................................................................................. 19
Figure 1 ..................................................................................................................................... 19
Figure 2 ..................................................................................................................................... 20
Figure 3 ..................................................................................................................................... 21
Table 1 ...................................................................................................................................... 22
Table 2 ...................................................................................................................................... 25
Figure 4 ..................................................................................................................................... 26
Table 3 ...................................................................................................................................... 27
Figure 5 ..................................................................................................................................... 28
Figure 6 ..................................................................................................................................... 29

iii
LIST OF FIGURES
Figure 1: Characteristics of TB screening and diagnostic tests.
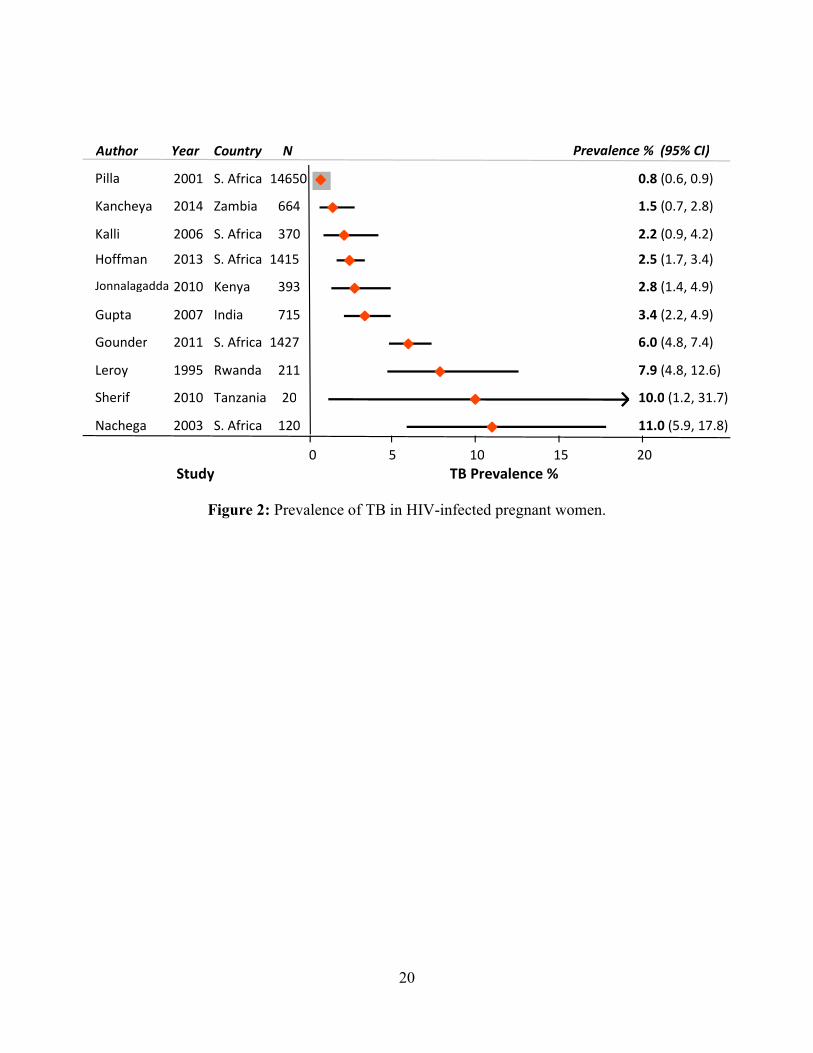
Figure 2: Prevalence of TB in HIV-infected pregnant women.
Figure 3: Study flow of HIV-infected pregnant women screened for pulmonary TB in western
Kenya.
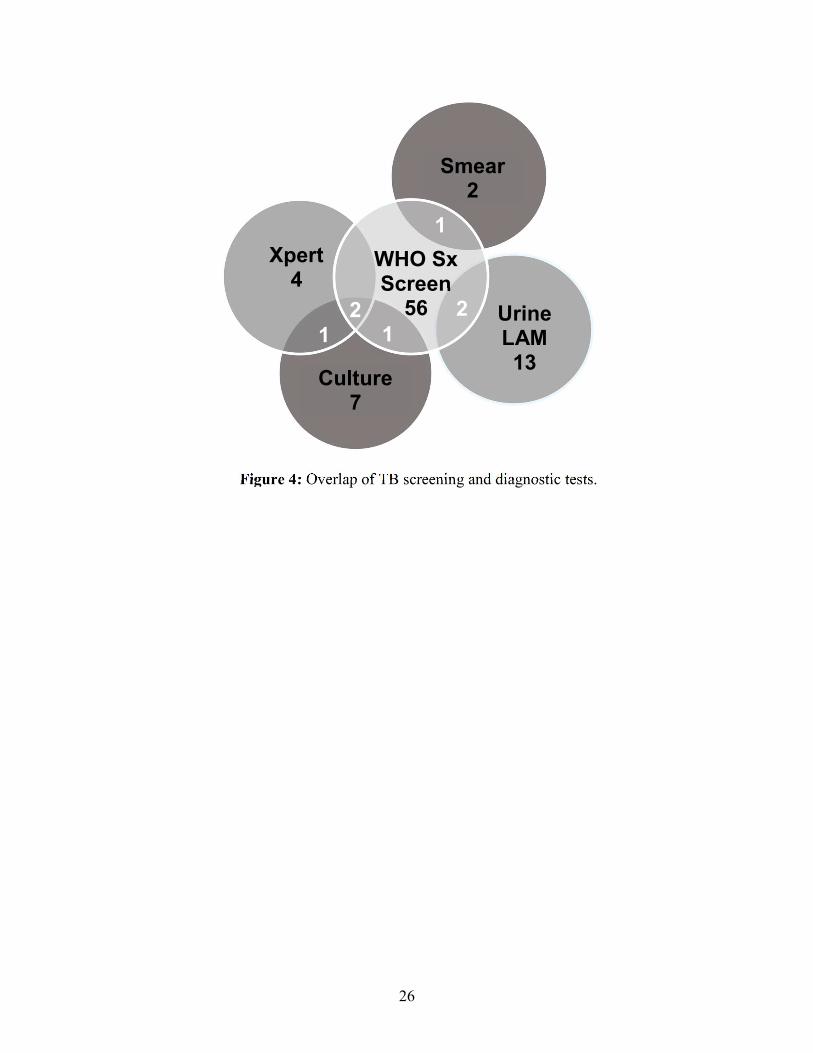
Figure 4: Overlap of TB screening and diagnostic tests.
Figure 5: Area under the curve of individual TB screening and diagnostic tests.
Figure 6: Area under the curve of combined TB screening and diagnostic tests.

iv
LIST OF TABLES
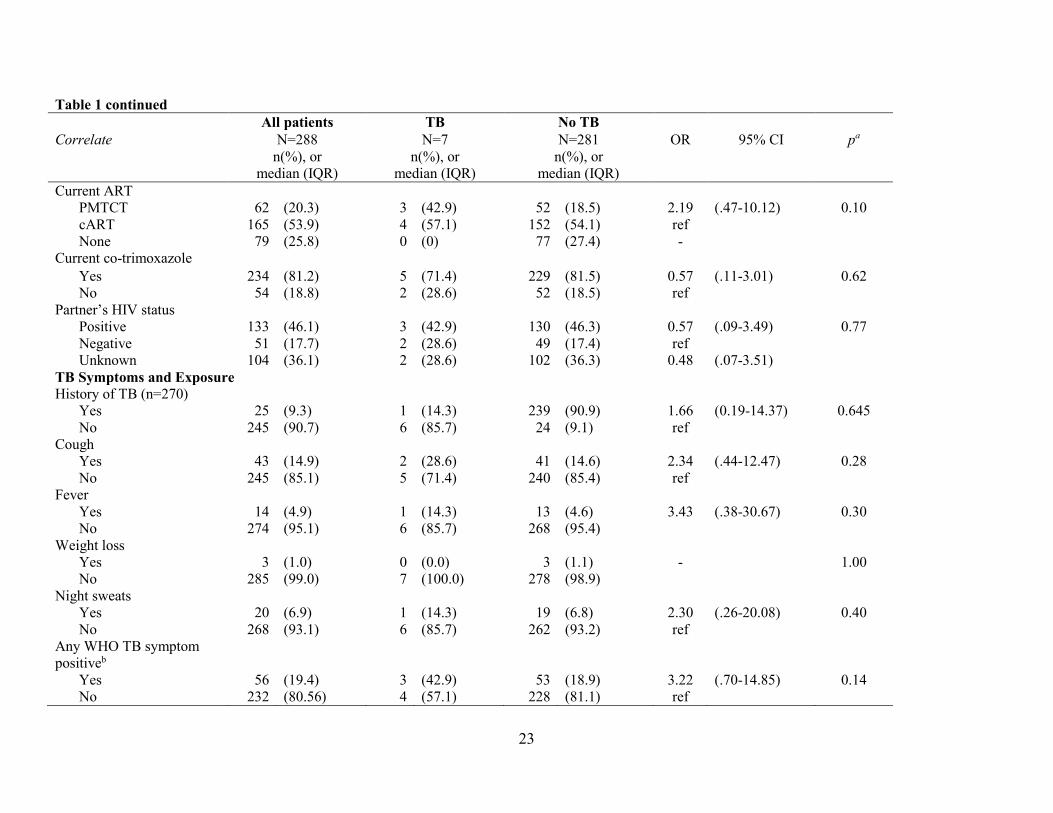
Table 1: Correlates of culture confirmed pulmonary TB among HIV-infected pregnant women.
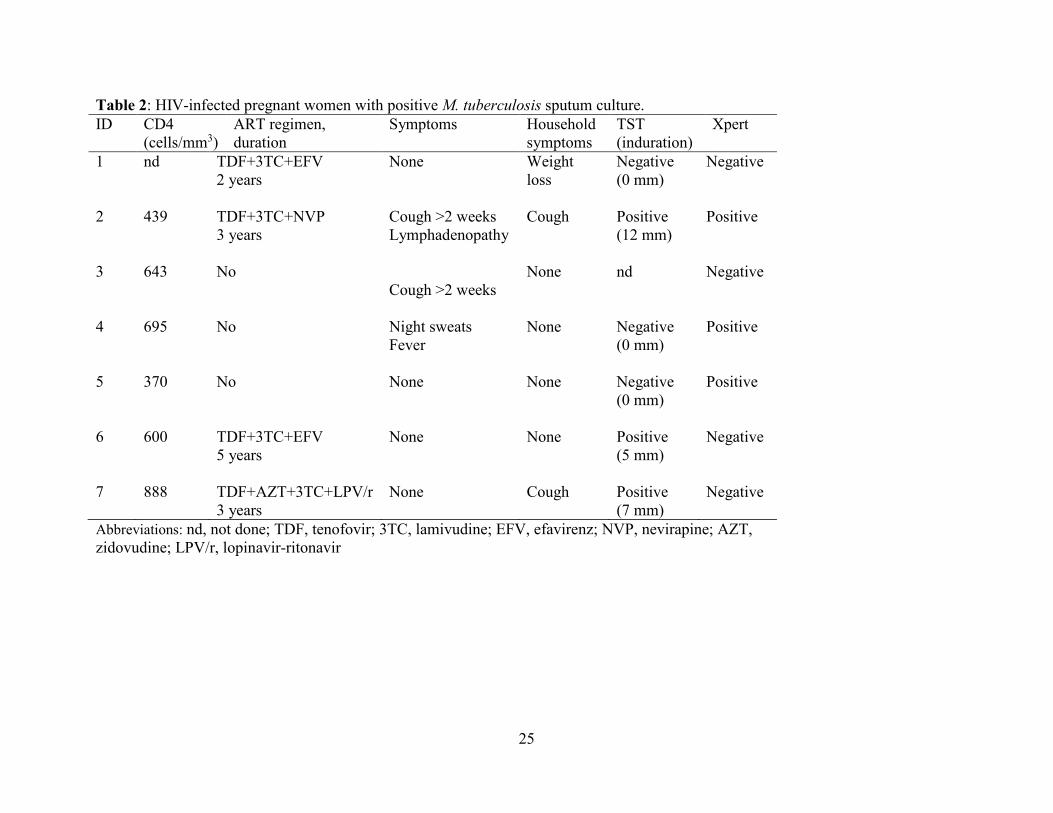
Table 2: HIV-infected pregnant women with positive M. tuberculosis sputum culture.
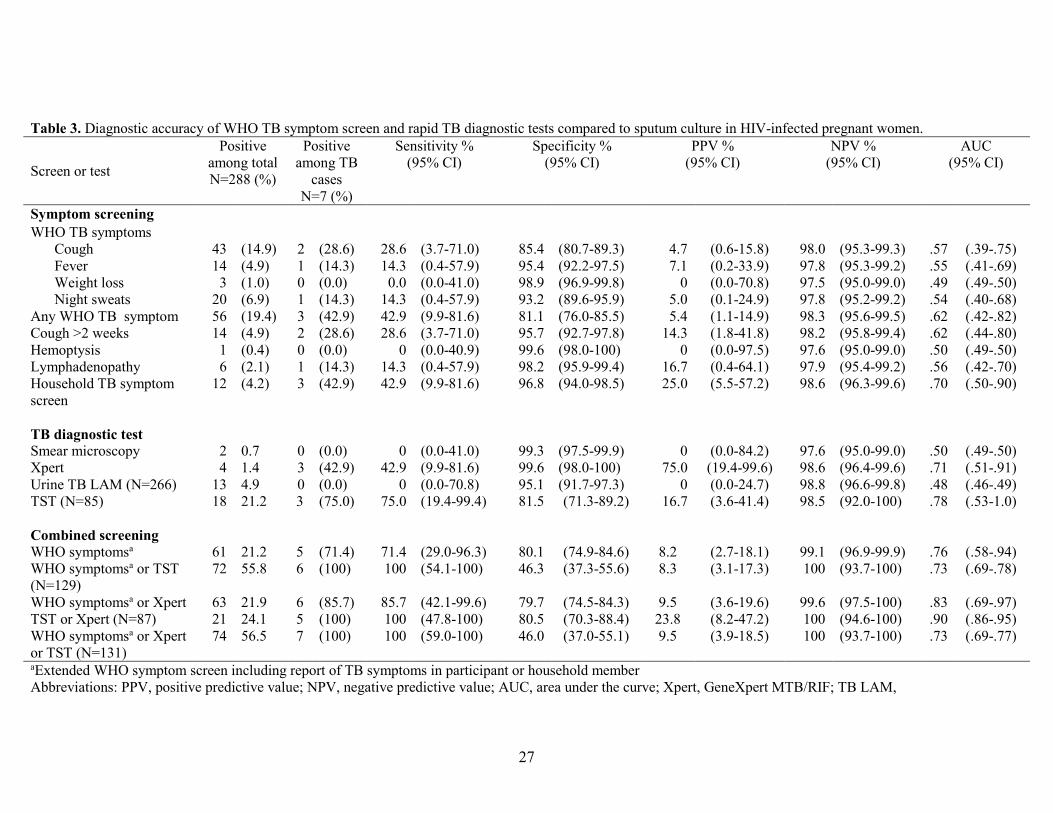
Table 3: Diagnostic accuracy of WHO TB symptom screen and rapid TB diagnostic tests
compared to sputum culture in HIV-infected pregnant women.
v
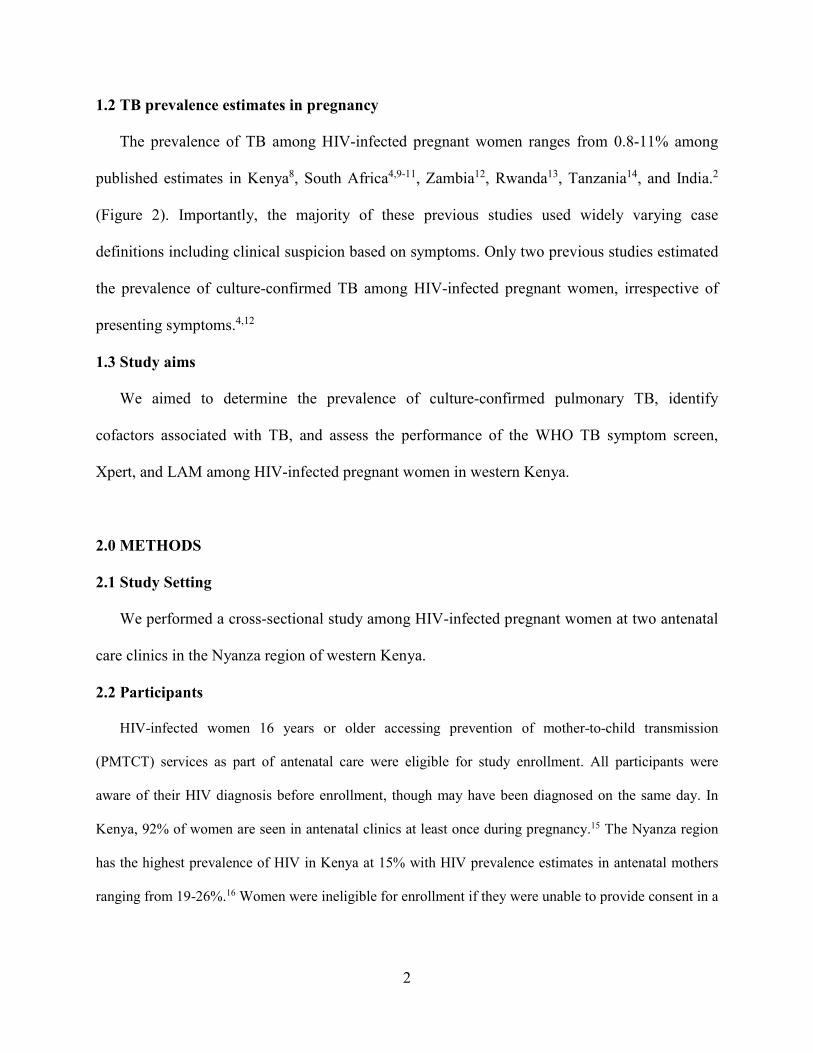
ACKNOWLEDGEMENTS
We thank the staff at the Ahero Sub-district Hospital and Bondo District Hospital antenatal
clinics, KEMRI/CDC laboratory personnel, as well as our study staff and participants.
Additionally I would like to thank Lisa Cranmer, MD, MPH, Daniel Matemo, John Kinuthia,
MBChB, MMed, MPH, Grace John-Stewart, MD, PhD, and David Horne, MD, MPH.
This work was supported by the National Institute of Allergy and Infectious Diseases and the
National Institute of Child Health and Human Development at the National Institutes of Health
[grant number K23 AI 85036-01 to David Horne, K24 HD054314-06 to Grace John-Stewart,
K12 HD000850 to Lisa Cranmer, T32 AI07140 to Sylvia LaCourse], the National Center for
Research Resources at the National Institutes of Health [grant number UL1TR000423 for the use
of REDCap through UW Institute of Translational Health Sciences] and the Firland Foundation
(to David Horne, Grace-John-Stewart, and Sylvia LaCourse).
Preliminary study results were presented at the Infectious Disease Society of America
Meeting (Philadelphia, PA, USA), October 2014; International Union Against Tuberculosis and
Lung Disease World Conference (Barcelona, Spain), November 2014; and the Center HIV
Research in Women Symposium, Albert Einstein-Montefiore Center for AIDS Research (New
Rochelle, NY, USA), December 2014.
1
1.0 INTRODUCTION
Tuberculosis (TB) is a leading cause of morbidity and mortality among women of
childbearing age, particularly in areas of high HIV prevalence.1 Late or missed diagnosis of TB
among pregnant HIV-infected women is associated with poor maternal and infant outcomes.2
Identification and treatment of TB during antenatal care is an opportunity to link pregnant
mothers to TB/HIV treatment and prevent morbidity and mortality in both mother and infant.
1.1 TB screening and diagnostic tests
The World Health Organization (WHO) recommends TB screening of HIV-infected
individuals using a four-part symptom screen including cough, fever, weight loss, and night
sweats.3 However, the WHO TB symptom screen has performed poorly among HIV-infected
pregnant women, perhaps because pregnancy may mask TB symptoms.4,5 The most commonly
used diagnostic tests (acid-fast bacillus [AFB] smear microscopy and chest radiographs),
perform poorly in the setting of HIV-infection,6 and clinicians may be reluctant to order
radiographs in pregnancy7. Newer rapid tests, including GeneXpert MTB/RIF® (Xpert, Cepheid,
Sunnyvale, CA, USA) a DNA PCR-based rapid test, and urine lipoarabinomannan (LAM)
(Determine™ TB LAM; Alere, Waltham, MA, USA), an inexpensive lateral flow urine dipstick
assay, may improve TB detection among HIV-infected pregnant women; however, performance
characteristics in this population are undefined. The gold standard of pulmonary TB diagnosis is
culture, however this requires specially trained personnel, and specialized lab safety equipment.
The ideal TB screening and diagnostic tool in resource limited settings would be highly accurate,
inexpensive, and rapid enough to be performed as a point of care test (Figure 1).
2
1.2 TB prevalence estimates in pregnancy
The prevalence of TB among HIV-infected pregnant women ranges from 0.8-11% among
published estimates in Kenya8, South Africa4,9-11, Zambia12, Rwanda13, Tanzania14, and India.2
(Figure 2). Importantly, the majority of these previous studies used widely varying case
definitions including clinical suspicion based on symptoms. Only two previous studies estimated
the prevalence of culture-confirmed TB among HIV-infected pregnant women, irrespective of
presenting symptoms.4,12
1.3 Study aims
We aimed to determine the prevalence of culture-confirmed pulmonary TB, identify
cofactors associated with TB, and assess the performance of the WHO TB symptom screen,
Xpert, and LAM among HIV-infected pregnant women in western Kenya.
2.0 METHODS
2.1 Study Setting
We performed a cross-sectional study among HIV-infected pregnant women at two antenatal
care clinics in the Nyanza region of western Kenya.
2.2 Participants
HIV-infected women 16 years or older accessing prevention of mother-to-child transmission
(PMTCT) services as part of antenatal care were eligible for study enrollment. All participants were
aware of their HIV diagnosis before enrollment, though may have been diagnosed on the same day. In
Kenya, 92% of women are seen in antenatal clinics at least once during pregnancy.15 The Nyanza region
has the highest prevalence of HIV in Kenya at 15% with HIV prevalence estimates in antenatal mothers
ranging from 19-26%.16 Women were ineligible for enrollment if they were unable to provide consent in a

3
study language (English or Dholuo), were currently on treatment for TB disease or latent TB infection
(LTBI), or were treated for TB or LTBI within the prior year.
2.3 Procedures
2.3.1 Enrollment
We recruited consecutive HIV-infected pregnant women from two antenatal clinics and
screened for study eligibility. Eligible participants who provided written informed consent were
interviewed by study staff using a structured interview tool that included questions on
sociodemographic information, pregnancy history, HIV history (date of diagnosis, medications),
TB and LTBI history, and the presence of TB symptoms in participants or their household
members (as reported by participant). Screening questions for TB symptoms included the WHO
4-part symptom screen (fever, any cough, weight loss, night sweats), prolonged cough (>2
weeks), hemoptysis, and lymphadenopathy. Data extracted from clinic charts included
medication history and CD4 cell count. The HIV status of participants was determined by
antenatal clinic staff as part of routine antenatal care using two positive rapid ELISA tests in
parallel.
2.3.2 TST Testing
TSTs were performed using 5 tuberculin units (0.1ml) of purified protein derivative (RT 23
solution) and read by study nurses using the “ball-point” technique and a ruler within 48 - 96
hours.17,18 A positive TST was defined as >5 mm of induration.
2.3.3 Sputum Collection and TB Laboratory Testing
Participants were instructed on sputum collection and two expectorated sputa specimens
were collected: one as a “spot” sample at the time of enrollment and a second as an early
morning specimen collected by the subject upon awakening on the day of TST read. Sputum and
urine samples were refrigerated and transported on ice at 4-8°C on a daily basis to the ISO

4
15189-accredited KEMRI/CDC Laboratory in Kisumu, Kenya. Specimens were decontaminated
using N-acetyl-L-cysteine and sodium hydroxide and examined by AFB-smear microscopy using
Ziehl-Neelsen technique. If one or more AFB per equivalent of 100 immersion fields was
observed, the slide was considered positive and graded. After re-suspension with phosphate
buffer, equal sample volumes were used to perform mycobacterial culture and Xpert.
Mycobacterial culture was performed using a commercial broth method, MGIT Manual
Mycobacterial Growth System (Becton-Dickinson, Franklin Lakes, NJ). Isolates were identified
as M. tuberculosis using the Capilia TB Test Kit (TAUNS, Numazu, Japan). In general, one
Xpert was performed on fresh sputum using the “spot” specimen. Xpert was performed on the
frozen second sputum sample if the patient was unable to provide a spot sample or if the second
sputum specimen was culture positive for M. tuberculosis. Urine was collected during the initial
visit and LAM testing was performed within 8 hours of collection. Test results were interpreted
using the reference scale card per the manufacturer’s instructions.19
2.3.4 Kenyan National TB Guidelines
Per Kenyan national TB guidelines, it is recommended that all HIV-infected individuals
including women in antenatal care undergo intensified case finding using the WHO 4-part TB
symptom screen. Women with one or more symptoms receive further evaluation for TB that may
include chest radiograph and sputum collection for smear microscopy. However, sputum AFB
culture, tuberculin skin tests (TST), Xpert and LAM were not routinely performed at the
antenatal sites at which the study was performed during the study period. Isoniazid preventive
therapy was not routinely provided at these sites at the time of the study.

5
2.4 Study Endpoints and Statistical Analysis
Pulmonary TB was defined as at least one sputum culture positive for M. tuberculosis and
participants who met this definition were referred for TB care through the Kenya National
Treatment Program. Urine LAM tests with the presence of a band of any intensity (grade 1 or
greater) were considered positive. Univariate logistic regression and Fisher’s exact test were
used as appropriate to assess the association between potential correlates and the outcome of
pulmonary TB. The performance of the WHO TB 4-part symptom screen, AFB-smear, Xpert,
and urine LAM was compared to culture using sensitivity, specificity, positive and negative
predictive values, positive and negative likelihood ratios, and area under the receiver operating
characteristic curve (AUC). All estimates were reported using 95% confidence intervals (CI),
and all statistical tests were two-sided with α = 0.05. Analyses were performed using Stata 13
(StataCorp, College Station, TX).
2.5 Ethics Approval
This study was approved by the Kenyatta National Hospital-University of Nairobi Ethics and
Research Committee and the University of Washington Institutional Review Board.
3.0 RESULTS
Between July 2013 and July 2014, 429 HIV-infected pregnant women attended routine
antenatal care services at the two sites, and 388 were screened for study eligibility (Figure 3). Of
women screened, 76 declined study participation and 6 were excluded from enrollment because
they had been diagnosed with TB in the preceding year. Of the 306 enrolled women, 18 were
excluded from further analysis (14 women were unable to produce sputum and 4 women had
contaminated cultures). The remaining 288 women had one or more sputum samples with valid
culture results for TB evaluation; of these 244 (85%) had two cultures performed.
6
3.1 Baseline characteristics
Median maternal age was 25 years (IQR 22-30), and median gestational age was 26 weeks
(IQR 20-32) (Table 1). Most women (78%) had completed primary education, and 57% were
employed. Twenty-seven percent of women were unaware of their HIV-status prior to the current
pregnancy. Over one-half (54%) of participants were taking combination antiretroviral therapy
(cART) prior to study enrollment. In general, participants were relatively immunocompetent
with a median CD4 cell count of 437 cells/mm3 (IQR 342-565 cells/mm3); only 13.8% of
subjects had a CD4 cell count <250 cells/mm3.
3.2 TST results and TB exposure
Of 246 women who had a TST placed, only 85 (35%) women returned for TST reading
between 48 and 96 hours (Table 1). Eighteen (21%) had a positive TST >5 mm. Twenty-five
(9%) women had a history of TB at a mean of 6.5 years prior to enrollment. Women reporting a
history of TB were more likely to have a positive TST (OR 18 95% CI 1.87-173.63).
3.3 Prevalence of culture-confirmed TB
The prevalence of TB, defined by a positive sputum culture for M. tuberculosis, was 2.4%
(CI 1.0-4.9%) (Figure 3, Table 1). Compared to women without TB, women with TB were more
likely to report a cough lasting longer than 2 weeks (29% vs 4%, p=0.04) and have a positive
TST >5 mm (75% vs 18%, p=0.03) (Table 1). Women with TB had 22.7-fold (95% CI 4.4-
116.6) higher odds of reporting a household member with one of the 4 WHO TB symptoms
compared to women without TB (43% vs 3%, p<0.001).
7
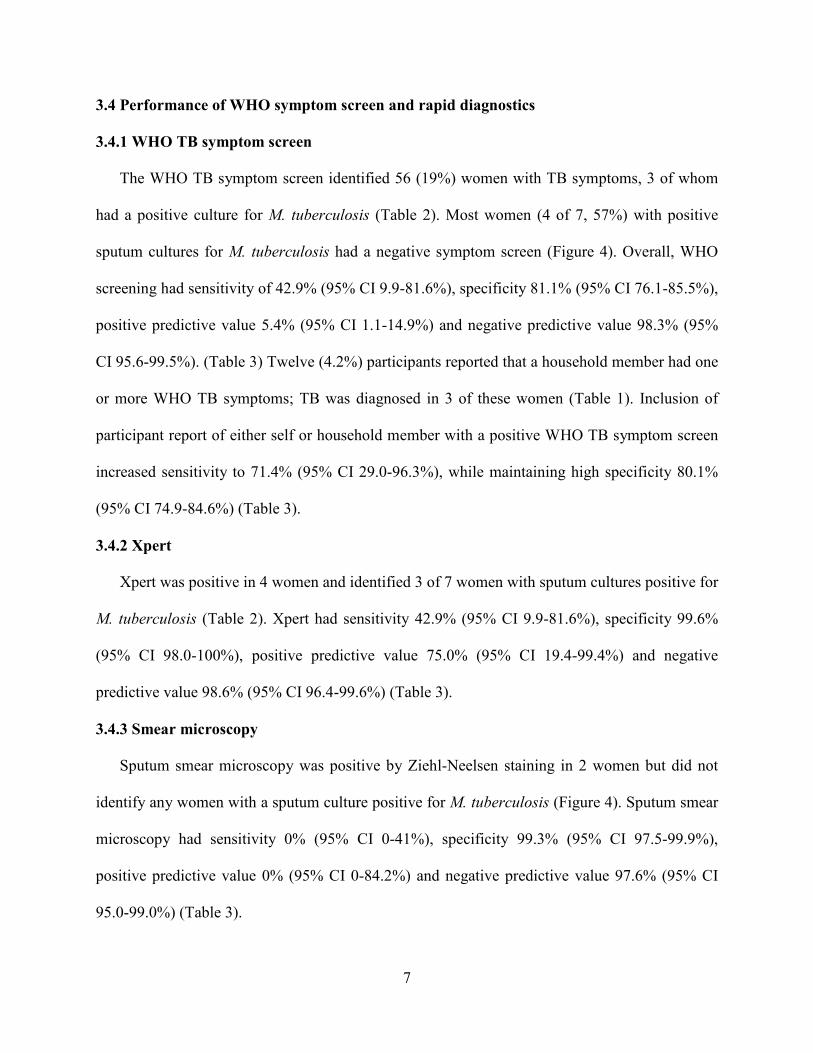
3.4 Performance of WHO symptom screen and rapid diagnostics
3.4.1 WHO TB symptom screen
The WHO TB symptom screen identified 56 (19%) women with TB symptoms, 3 of whom
had a positive culture for M. tuberculosis (Table 2). Most women (4 of 7, 57%) with positive
sputum cultures for M. tuberculosis had a negative symptom screen (Figure 4). Overall, WHO
screening had sensitivity of 42.9% (95% CI 9.9-81.6%), specificity 81.1% (95% CI 76.1-85.5%),
positive predictive value 5.4% (95% CI 1.1-14.9%) and negative predictive value 98.3% (95%
CI 95.6-99.5%). (Table 3) Twelve (4.2%) participants reported that a household member had one
or more WHO TB symptoms; TB was diagnosed in 3 of these women (Table 1). Inclusion of
participant report of either self or household member with a positive WHO TB symptom screen
increased sensitivity to 71.4% (95% CI 29.0-96.3%), while maintaining high specificity 80.1%
(95% CI 74.9-84.6%) (Table 3).
3.4.2 Xpert
Xpert was positive in 4 women and identified 3 of 7 women with sputum cultures positive for
M. tuberculosis (Table 2). Xpert had sensitivity 42.9% (95% CI 9.9-81.6%), specificity 99.6%
(95% CI 98.0-100%), positive predictive value 75.0% (95% CI 19.4-99.4%) and negative
predictive value 98.6% (95% CI 96.4-99.6%) (Table 3).
3.4.3 Smear microscopy
Sputum smear microscopy was positive by Ziehl-Neelsen staining in 2 women but did not
identify any women with a sputum culture positive for M. tuberculosis (Figure 4). Sputum smear
microscopy had sensitivity 0% (95% CI 0-41%), specificity 99.3% (95% CI 97.5-99.9%),
positive predictive value 0% (95% CI 0-84.2%) and negative predictive value 97.6% (95% CI
95.0-99.0%) (Table 3).

8
3.4.4 Urine LAM
Urine LAM testing was performed on 266 women, and was grade 1 or 2 in 13 women
(4.9%), and grade 2 in 2 women (0.8%) (Table 1). Using grade 1 or higher as a threshold for a
positive result, urinary LAM testing had sensitivity 0% (95% CI 0-70.8%), specificity 95.1%
(95% CI 91.7-97.3%), positive predictive value 0% (95% CI 0-24.7%) and negative predictive
value 98.8% (95% CI 96.6-99.8%) (Table 3).
3.4.5 Overlap of WHO TB symptoms screen, rapid diagnostics, and culture confirmed TB
cases
Of the 7 women with culture-confirmed TB, 3 had a positive symptom screen and 3 were
Xpert positive (Figure 4). Two women with culture confirmed TB were both positive by WHO
TB symptom screen and Xpert. One woman with a positive AFB smear had TB symptoms
(cough, night sweats); two women with a positive LAM had TB symptoms (one reported fever
and night sweats, and one reported cough and night sweats). None of the smear or LAM positive
women had positive TB cultures. Women with positive smear microcopy or M. tuberculosis
culture were prescribed anti-tuberculosis therapy by the TB program.
3.4.6 Overall performance of screening and diagnostic tools and combined screening
performance
The area under the curve (AUC) of the receiver operator curve (ROC) allows us to assess
both sensitivity and specificity in tandem (Figure 5). In terms of overall performance of a single
TB screen or diagnostic test as measured by AUC, report of household symptoms (AUC 0.70,
95% CI 0.50-0.90), Xpert (AUC 0.71, 95% CI 0.51-0.91), and TST (AUC 0.78, 95% CI 0.53-
1.0) performed similarly (Table 3, Figure 5). Combining WHO symptom screen with the
household symptom screen increased the discriminatory value of symptom screening (0.62 to

9
0.76) (Figures 5 and 6). Using a combination of TST or Xpert yielded the highest combination of
sensitivity and specificity (AUC 0.90, 95% CI 0.86-0.95). Xpert or WHO symptom screening
including of both the participants and household family member resulted in an AUC of 0.83
(95% CI 0.69-0.77).
4.0 DISCUSSION
4.1 High prevalence of culture confirmed TB
We found a high burden of undiagnosed pulmonary TB disease among Kenyan HIV-infected
pregnant women enrolled in antenatal care. Our estimate of TB prevalence, 2.4% (CI 1.0-4.9%),
is consistent with estimated TB prevalence in HIV-infected adults from a community-based
study in western Kenya (2.1%)20 and in HIV-infected pregnant women in sub-Saharan Africa
(0.3 to 6%).4,9,11,21-24 Notably, we observed a substantial burden of TB disease in HIV-infected
women during pregnancy in the absence of low CD4 cell counts and despite the use of cART.
Compared to previous studies assessing the prevalence of culture-confirmed TB among pregnant
HIV-infected women regardless of symptoms4, our cohort had somewhat higher CD4 counts and
a higher proportion of women on combination ART. Combination ART decreases the risk of TB
by 67%, with increasing CD4 cell counts and duration of therapy associated with greater declines
in risk.25 However, the risk of TB remains higher among HIV-infected individuals at all levels of
immunosuppression compared to those without HIV.26,27
4.2 WHO TB symptom screening
A novel finding of our study is that screening for the presence of WHO TB symptoms in
household members was strongly associated with TB. Inclusion of a positive WHO TB symptom
screen in the participant or a household member increased the sensitivity of TB case finding to

10
71% without compromising specificity. Expansion of TB screening to include symptoms of
household members may provide a mechanism to improve active TB case finding in HIV-
infected pregnant women, and should be validated in larger cohorts. Importantly, presence of
WHO TB symptoms in household members was more predictive than ascertaining a known TB
contact in the household. Antenatal screening of women may provide a unique opportunity to
diagnose not only pregnant women but others in the household through surrogate screening using
the simple WHO symptom screen.
Intensified TB case finding using the WHO 4-part symptom screen of fever, cough, night
sweats, or weight loss among pregnant women failed to identify more than half [4 of 7 (57%)] of
the cases of culture-confirmed pulmonary TB. Low sensitivity of the WHO symptom screen (28-
50%) for excluding TB has been observed in other studies of pregnant HIV-infected women that
performed sputum culture independent of clinical symptoms.4,5,23 An individual participant data
meta-analysis that included cohorts of HIV-infected cART-naïve individuals from sub-Saharan
Africa and Southeast Asia found that the sensitivity of the WHO TB symptom screen was 79%
overall and higher among individuals not previously screened for TB (88%).6 The sensitivity of
the WHO symptom screen may be decreased in the context of cART, and was approximately
50% less sensitive among participants taking cART compared to cART-naïve individuals in a
South African study.28 TB symptoms may be less frequent among women compared to men29,
and pregnancy may further mask symptoms due to an overlap with pregnancy-related
physiologic changes30 or relative suppression of Th1 pro-inflammatory cytokines.1,31 Despite low
sensitivity, prolonged cough was associated with TB in our cohort, which has been also been
observed in pregnant women with TB disease in Tanzania.32

11
4.3 Xpert
Although it has been suggested that Xpert may improve TB screening within antenatal care
settings,33 we are unaware of published estimates regarding its performance in pregnant HIV-
infected women. In our study, Xpert was less sensitive than the results of a meta-analysis that
reported on test performance in HIV-infected individuals.34 In this same meta-analysis, Xpert
performance was decreased among those who were smear negative to 67%. Our sensitivity
estimate of 43% is within the range of sensitivities (40-81%) reported by studies evaluating
smear-negative HIV-infected individuals 35-37 and is most similar to a South African study
evaluating the accuracy of Xpert compared to culture among HIV-infected outpatients regardless
of symptoms prior to cART initiation.37 The use of cryopreserved samples in patients unable to
provide “spot” samples may have contributed to the low sensitivity; however in a meta-analysis
of Xpert performance, the use of cryopreserved samples led to only marginally decreased
sensitivity and similar specificity.34
4.4 Urine TB-LAM
In contrast to sputum Xpert, urine LAM did not contribute to case detection of pulmonary TB
within our study. Contrary to studies of Xpert and LAM among both hospitalized TB suspects
and newly diagnosed HIV outpatients, there was no incremental benefit to the use of urine LAM
to Xpert in our study cohort.38 In previous studies, LAM has performed best in highly
immunocompromised individuals with very low CD4 counts,39 and the mild to modest
immunosuppression observed in our sample may have resulted in lower test sensitivity. We did
not actively investigate for extra-pulmonary TB and may have missed extra-pulmonary TB cases
associated with positive urine LAM testing. From our cross-sectional evaluation, we do not
know if these tests were false positives or may have reflected cases of culture-negative TB

12
disease. Positive urine LAM has been associated with increased mortality among highly
immunocompromised adults who were culture negative for tuberculosis;40 however, this requires
further study in less immunocompromised HIV-infected cohorts with longitudinal follow-up.
4.5 Poor performance of WHO TB symptom screen and rapid diagnostic tests
In HIV-infected pregnant women, the sensitivities of screening tests, including WHO 4-part
symptom screen, Xpert, and AFB sputum smear microscopy, were poor compared to liquid
sputum culture in identifying women with pulmonary TB. This is of particular concern given the
adverse effects of untreated TB on mother and infant. Additionally, the high proportion of false
negative tests for pulmonary TB has implications for effective screening prior to the initiation of
isoniazid preventive therapy (IPT). In our study, more than half of the women found to have
culture confirmed TB would have been offered IPT based on their negative WHO symptom
screen. Although combining TST or Xpert maximized diagnostic accuracy to detect pulmonary
TB [AUC 0.90 (95%CI 0.86-0.95)], there are multiple barriers to the widespread use of TST
including the need for a return visit (35% compliance rate in our study) and refrigeration that
may make it infeasible in low resource settings. With the inclusion of Xpert in the most recent
Kenya national guidelines for TB screening in HIV-infected individuals,41 and the ease of an
extended symptom screen that includes household member TB symptoms, this combination
screening approach [AUC 0.83 (95% CI 0.69-0.97)] may be a more viable option for
determining who is safe for IPT and who requires further TB evaluation using sputum culture.
4.6 Promising future directions
Recent efforts have yielded promising results in developing TB diagnostics in high burden
settings,42,43 including those that may perform well specifically in HIV-infected women,44 and
point-of-care tests45 that may contribute to TB screening in HIV-infected individuals. Our results

13
highlight the urgent need for improved TB diagnostic tests for use in HIV-infected pregnant
women that have been rigorously evaluated in this vulnerable population.46
4.7 Strengths and limitations
Our study had several limitations. We may have underestimated the burden of TB by
performing culture on a single sputum in 28% of patients. Subjects unable to spontaneously
expectorate sputum did not undergo sputum induction, which may have resulted in further under-
diagnosis of TB. We did not perform chest radiographs in subjects and may have missed
radiographically-apparent cases of TB. Xpert testing was performed on only one of 2 sputum
samples; for one positive culture from the 2nd sputum culture, Xpert was performed on a
cryopreserved sputum sample to ensure adequate estimation of sensitivity. Our study had limited
power for estimates of diagnostic performance. A strength of our study is the performance of
diagnostic tests, including culture, in all participants regardless of symptoms.
4.8 Conclusions
In conclusion, we found a significant burden of undiagnosed tuberculosis among HIV-
infected pregnant women. Symptom screening and available diagnostic tests including sputum
smear microscopy, Xpert and urinary LAM testing had poor performance in this population.
Household TB symptom screening improved sensitivity to detect pulmonary TB. Untreated
tuberculosis during pregnancy is associated with poor maternal and infant outcomes, and future
studies to investigate optimal screening algorithms and novel tests in this vulnerable population
are warranted.

14
BIBLIOGRAPHY
1. Mathad JS, Gupta A. Tuberculosis in pregnant and postpartum women: epidemiology,
management, and research gaps. Clinical Infectious Diseases 2012;55:1532-49.
2. Gupta A, Nayak U, Ram M, et al. Postpartum tuberculosis incidence and mortality
among HIV-infected women and their infants in Pune, India, 2002-2005. Clinical
Infectious Diseases 2007;45:241-9.
3. Guidelines for intensified tuberculosis case-finding and isoniazid preventive therapy for
people living with HIV in resource-constrained settings. 2011. at
http://whqlibdoc.who.int/publications/2011/9789241500708_eng.pdf.)
4. Hoffmann CJ, Variava E, Rakgokong M, et al. High prevalence of pulmonary
tuberculosis but low sensitivity of symptom screening among HIV-infected pregnant
women in South Africa. PLoS One 2013;8:e62211.
5. Kancheya N, Luhanga D, Harris J, et al. Integrating active tuberculosis case finding in
antenatal services in Zambia. Int J Tuberc Lung Dis 2014;18:1466-72.
6. Getahun H, Kittikraisak W, Heilig CM, et al. Development of a standardized screening
rule for tuberculosis in people living with HIV in resource-constrained settings:
individual participant data meta-analysis of observational studies. PLoS Med
2011;8:e1000391.
7. Ratnapalan S, Bona N, Chandra K, Koren G. Physicians' perceptions of teratogenic risk
associated with radiography and CT during early pregnancy. Am J Roentgenol
2004;182:1107-9.
8. Jonnalagadda S, Lohman Payne B, Brown E, et al. Latent tuberculosis detection by
interferon gamma release assay during pregnancy predicts active tuberculosis and
mortality in human immunodeficiency virus type 1-infected women and their children. J
Infect Dis 2010;202:1826-35.
9. Pillay T, Khan M, Moodley J, et al. The increasing burden of tuberculosis in pregnant
women, newborns and infants under 6 months of age in Durban, KwaZulu-Natal. S Afr
Med J 2001;91:983-7.
10. Gounder C, Wada N, Kensler C, et al. Active tuberculosis case-finding among pregnant
women presenting to antenatal clinics in Soweto, South Africa. J Acquir Immune Defic
Syndr 2011;57:e77-84.

15
11. Nachega J, Coetzee J, Adendorff T, et al. Tuberculosis active case-finding in a mother-to-
child HIV transmission prevention programme in Soweto, South Africa. AIDS
2003;17:1398-400.
12. Kancheya N, Luhanga D, Harris JB, et al. Integrating active tuberculosis case finding in
antenatal services in Zambia. Int J Tuberc Lung Dis 2014;18:1466-72.
13. Leroy V, Msellati P, Lepage P, et al. Four years of natural history of HIV-1 infection in
african women: a prospective cohort study in Kigali (Rwanda), 1988-1993. Journal of
acquired immune deficiency syndromes and human retrovirology : official publication of
the International Retrovirology Association 1995;9:415-21.
14. Sheriff F, Manji K, Manji M, Chagani M. Pulmonary tuberculosis among pregnant
mothers in Tanzania. Dar Es Salaam Medical Students' Journal 2010;16:5-10.
15. Guidelines for prevention of mother to child transmission (PMTCT) of HIV/AIDS in
Kenya, 4th edition. NASCOP, 2012. at http://www.faces-kenya.org/wp-
content/uploads/2012/11/Guidelines-for-PMTCT-of-HIVAIDS-in-Kenya-1_2012.pdf.)
16. Kenya AIDS Indicator Survey 2012: Final Report. NASCOP, 2014. at
http://www.nacc.or.ke/images/documents/KAIS-2012.pdf.)
17. Cobelens F, Van Deutekom H, Draayer-Jansen I, Schepp-Beelen A, Van Gerven P,
Mensen M. Tuberculin skin test reactions by time of reading among Dutch travellers. Int
J Tuberc Lung Dis 2003;7:758-63.
18. Tuberculin reaction size on five consecutive days. Bull World Health Organ
1955;12:189-96.
19. Alere Determine™ TB LAM Ag Pakage Insert. 2013. at
http://www.alere.com/ww/en/product-details/determine-tb-lam.html.)
20. van't Hoog AH, Laserson KF, Githui WA, et al. High prevalence of pulmonary
tuberculosis and inadequate case finding in rural western Kenya. Am J Respir Crit Care
Med 2011;183:1245-53.
21. Kali PB, Gray GE, Violari A, Chaisson RE, McIntyre JA, Martinson NA. Combining
PMTCT with active case finding for tuberculosis. J Acquir Immune Defic Syndr
2006;42:379-81.
22. Gounder CR, Wada NI, Kensler C, et al. Active tuberculosis case-finding among
pregnant women presenting to antenatal clinics in Soweto, South Africa. J Acquir
Immune Defic Syndr 2011;57:e77-84.

16
23. Modi S, Cavanaugh S, Shiraishi R, et al. Symptom-based screening for tuberculosis
among pregnant women living with HIV in Kenya. Conference of Retroviruses and
Opportunistic Infections (CROI). Boston, Massachusetts2014.
24. Gupta A, Chandrasekhar A, Gupte N, et al. Symptom screening among HIV-infected
pregnant women is acceptable and has high negative predictive value for active
tuberculosis. Clin Infect Dis 2011;53:1015-8.
25. Lawn SD, Wood R, De Cock KM, Kranzer K, Lewis JJ, Churchyard GJ. Antiretrovirals
and isoniazid preventive therapy in the prevention of HIV-associated tuberculosis in
settings with limited health-care resources. Lancet Infect Dis 2010;10:489-98.
26. Gupta A, Wood R, Kaplan R, Bekker LG, Lawn SD. Tuberculosis incidence rates during
8 years of follow-up of an antiretroviral treatment cohort in South Africa: comparison
with rates in the community. PLoS One 2012;7:e34156.
27. Kufa T, Mabuto T, Muchiri E, et al. Incidence of HIV-associated tuberculosis among
individuals taking combination antiretroviral therapy: a systematic review and meta-
analysis. PLoS One 2014;9:e111209.
28. Rangaka MX, Wilkinson RJ, Glynn JR, et al. Effect of antiretroviral therapy on the
diagnostic accuracy of symptom screening for intensified tuberculosis case finding in a
South African HIV clinic. Clin Infect Dis 2012;55:1698-706.
29. Long NH, Diwan VK, Winkvist A. Difference in symptoms suggesting pulmonary
tuberculosis among men and women. J Clin Epidemiol 2002;55:115-20.
30. Hamadeh MA, Glassroth J. Tuberculosis and pregnancy. Chest 1992;101:1114-20.
31. Singh N, Perfect JR. Immune reconstitution syndrome and exacerbation of infections
after pregnancy. Clin Infect Dis 2007;45:1192-9.
32. Sheriff F, Manji K, Manji M, Chagani M. Pulmonary tuberculosis among pregnant
mothers in Tanzania. Dar es Salaam Medical Student Journal 2010;16:5-9.
33. Turnbull ER, Kancheya NG, Harris JB, Topp SM, Henostroza G, Reid SE. A model of
tuberculosis screening for pregnant women in resource-limited settings ssing Xpert
MTB/RIF. J Pregnancy 2012;2012:565049.
34. Steingart KR, Schiller I, Horne DJ, Pai M, Boehme CC, Dendukuri N. Xpert(R)
MTB/RIF assay for pulmonary tuberculosis and rifampicin resistance in adults. Cochrane
Database Syst Rev 2014;1:CD009593.

17
35. Balcells ME, Garcia P, Chanqueo L, et al. Rapid molecular detection of pulmonary
tuberculosis in HIV-infected patients in Santiago, Chile. Int J Tuberc Lung Dis
2012;16:1349-53.
36. Carriquiry G, Otero L, Gonzalez-Lagos E, et al. A diagnostic accuracy study of
Xpert(R)MTB/RIF in HIV-positive patients with high clinical suspicion of pulmonary
tuberculosis in Lima, Peru. PLoS One 2012;7:e44626.
37. Lawn SD, Brooks SV, Kranzer K, et al. Screening for HIV-associated tuberculosis and
rifampicin resistance before antiretroviral therapy using the Xpert MTB/RIF assay: a
prospective study. PLoS Med 2011;8:e1001067.
38. Shah M, Ssengooba W, Armstrong D, et al. Comparative performance of urinary
lipoarabinomannan assays and Xpert MTB/RIF in HIV-infected individuals. AIDS
2014;28:1307-14.
39. Lawn SD. Point-of-care detection of lipoarabinomannan (LAM) in urine for diagnosis of
HIV-associated tuberculosis: a state of the art review. BMC Infect Dis 2012;12:103.
40. Talbot E, Munseri P, Teixeira P, et al. Test characteristics of urinary lipoarabinomannan
and predictors of mortality among hospitalized HIV-infected tuberculosis suspects in
Tanzania. PLoS One 2012;7:e32876.
41. Guidelines on use of antiretroviral drugs for treating and preventing HIV infection: a
rapid advice. NASCOP, 2014. at
http://healthservices.uonbi.ac.ke/sites/default/files/centraladmin/healthservices/Rapid%20
Advice%20Booklet%202014%2024%20June%2012%20noon_0.pdf.)
42. Kaforou M, Wright VJ, Oni T, et al. Detection of tuberculosis in HIV-infected and -
uninfected African adults using whole blood RNA expression signatures: a case-control
study. PLoS Med 2013;10:e1001538.
43. Anderson ST, Kaforou M, Brent AJ, et al. Diagnosis of childhood tuberculosis and host
RNA expression in Africa. N Engl J Med 2014;370:1712-23.
44. Naranbhai V, Moodley D, Chipato T, et al. The association between the ratio of
monocytes: lymphocytes and risk of tuberculosis among HIV-infected postpartum
women. J Acquir Immune Defic Syndr 2014;67:573-5.
45. Drain PK, Mayeza L, Bartman P, et al. Diagnostic accuracy and clinical role of rapid C-
reactive protein testing in HIV-infected individuals with presumed tuberculosis in South
Africa. Int J Tuberc Lung Dis 2014;18:20-6.

18
46. Ransohoff DF, Feinstein AR. Problems of spectrum and bias in evaluating the efficacy of
diagnostic tests. N Engl J Med 1978;299:926-30.

19
APPENDIX: Tables and figures
Characteristic Culture Symptom
screen Smear
Xpert
DNA
PCR
Urine
LAM
Antigen
Cost $$$ $ $ $$ $
Resource
requirement ++++ - + ++ -
Sensitivity Gold
standard variable
Low in
HIV High Low
Results 3 weeks 5 mins <24 hrs 2 hours 15 mins
Resistance testing Yes No No Yes No
Figure 1: Characteristics of TB screening and diagnostic tests.
20
Figure 2: Prevalence of TB in HIV-infected pregnant women.
Pilla
y Kancheya
Kalli
Hoffman
Jonnalagadda
Gupta
Gounder
Leroy
Sherif
f Nachega
Author
2001
2014
2006
2013
2010
2007
2011
1995
2010
2003
Year
S. Africa
Zambia
S. Africa
S. Africa
Kenya
India
S. Africa
Rwanda
Tanzania
S. Africa
Country
14650
664
370
1415
393
715
1427
211
20
120
N
0.8 (0.6, 0.9)
1.5 (0.7, 2.8)
2.2 (0.9, 4.2)
2.5 (1.7, 3.4)
2.8 (1.4, 4.9)
3.4 (2.2, 4.9)
6.0 (4.8, 7.4)
7.9 (4.8, 12.6)
10.0 (1.2, 31.7)
11.0 (5.9, 17.8)
Prevalence % (95% CI)
0 5 10 15 20
TB Prevalence % Study

21
Figure 3: Study flow of HIV-infected pregnant women screened for pulmonary TB in western
Kenya.
429 HIV+
pregnant women
281 TB culture negative
No TB
7 TB culture positive
TB
388 Screened
306 Enrolled
288 >1 Sputum culture available
26 Declined
15 Not approached
76 Declined
6 TB in last year
14 Unable to provide sputum
4 Contaminated culture

22
Table 1. Correlates of culture confirmed pulmonary TB among HIV-infected pregnant women.
All patients TB No TB
Correlate N=288 N=7 N=281 OR 95% CI pa
n(%), or
median (IQR)
n(%), or
median (IQR)
n(%), or
median (IQR)
Sociodemographic
characteristics
Age (years) 25 (22-30) 21 (20-23) 25 (22-30) 0.84 (.69-1.02) 0.07
Gestational age (weeks) 26 (20-32) 24 (18-28) 26 (20-32) 0.96 (.87-1.06) 0.39
BMI (kg/m2) 23.6 (21.9-25.8) 21.3 (20.3-22.3) 23.6 (21.9-25.8) 0.78 (.59-1.03) 0.08
Education (years) 8 (8-10) 8 (7-10) 8 (8-10) 0.98 (.72-1.34) 0.92
Completed primary school
Yes 225 (78.1) 5 (71.4) 220 (78.3) 0.69 (.13-3.67) 0.65
No 63 (21.9) 2 (28.6) 61 (21.7) ref
Employed
Yes 163 (56.6) 3 (42.9) 160 (56.9) 0.57 (.12-2.58) 0.47
No 125 (43.4) 4 (57.1) 121 (43.1) ref
Currently married
Yes 240 (83.3) 7 (100.0) 233 (82.9) - 0.61
No 48 (16.7) 0 (0.0) 48 (17.1)
Residential Conditions
Persons in household 4 (3-5) 3 (2-3) 4 (3-5) 0.48 (.23-1.00) 0.05
Single room household
Yes 100 (34.7) 4 (57.1) 184 (65.5) 1.42 (.31-6.49) 0.68
No 188 (65.3) 3 (42.9) 97 (34.5) ref
HIV
CD4 cell count
(cells/ cell/mm3)(N=239) 437 (342-565) 621 (439-888) 430 (340-558) 1.00 (.99-1.00) 0.11
<250 33 (13.8) 0 (0.0) 33 (14.2) - 1.00
>250 206 (86.2) 6 (100.0) 200 (85.8)
HIV status known prior to
this pregnancy
Yes 210 (72.9) 6 (85.7) 204 (72.6) 2.26 (.27-19.11) 0.68
No 78 (27.1) 1 (14.3) 77 (27.4) ref
23
Table 1 continued
All patients TB No TB
Correlate N=288 N=7 N=281 OR 95% CI pa
n(%), or
median (IQR) n(%), or
median (IQR) n(%), or
median (IQR)
Current ART
PMTCT 62 (20.3) 3 (42.9) 52 (18.5) 2.19 (.47-10.12) 0.10
cART 165 (53.9) 4 (57.1) 152 (54.1) ref
None 79 (25.8) 0 (0) 77 (27.4) -
Current co-trimoxazole
Yes 234 (81.2) 5 (71.4) 229 (81.5) 0.57 (.11-3.01) 0.62
No 54 (18.8) 2 (28.6) 52 (18.5) ref
Partner’s HIV status
Positive 133 (46.1) 3 (42.9) 130 (46.3) 0.57 (.09-3.49) 0.77
Negative 51 (17.7) 2 (28.6) 49 (17.4) ref
Unknown 104 (36.1) 2 (28.6) 102 (36.3) 0.48 (.07-3.51)
TB Symptoms and Exposure
History of TB (n=270)
Yes 25 (9.3) 1 (14.3) 239 (90.9) 1.66 (0.19-14.37) 0.645
No 245 (90.7) 6 (85.7) 24 (9.1) ref
Cough
Yes 43 (14.9) 2 (28.6) 41 (14.6) 2.34 (.44-12.47) 0.28
No 245 (85.1) 5 (71.4) 240 (85.4) ref
Fever
Yes 14 (4.9) 1 (14.3) 13 (4.6) 3.43 (.38-30.67) 0.30
No 274 (95.1) 6 (85.7) 268 (95.4)
Weight loss
Yes 3 (1.0) 0 (0.0) 3 (1.1) - 1.00
No 285 (99.0) 7 (100.0) 278 (98.9)
Night sweats
Yes 20 (6.9) 1 (14.3) 19 (6.8) 2.30 (.26-20.08) 0.40
No 268 (93.1) 6 (85.7) 262 (93.2) ref
Any WHO TB symptom
positiveb
Yes 56 (19.4) 3 (42.9) 53 (18.9) 3.22 (.70-14.85) 0.14
No 232 (80.56) 4 (57.1) 228 (81.1) ref

24
Table 1 continued
All patients TB No TB
Correlate N=288 N=7 N=281 OR 95% CI pa
n(%), or
median (IQR)
n(%), or
median (IQR)
n(%), or
median (IQR)
Cough >2 weeks
Yes 14 (4.9) 2 (28.6) 12 (4.3) 8.97 (1.58-51.01) 0.04
No 274 (95.1) 5 (71.4) 269 (95.7) ref
Lymphadenopathy
Yes 6 (2.1) 1 (14.3) 5 (1.8) 9.2 (0.92-91.2) 0.14
No 282 (97.9) 6 (85.7) 276 (98.2) ref
Hemoptysis
Yes 1 (0.4) 0 (0.0) 1 (0.4) - 1.0
No 287 (99.7) 7 100.0 280 99.6
TST >5mm (N=85)
Yes 18 (21.2) 3 (75.0) 15 (18.5) 13.2 (1.28-135.88) 0.03
No 67 (78.8) 1 (25.0) 66 (81.5) ref
TB exposure
Yes 44 (15.4) 2 (28.6) 42 (15.1) 2.26 (.42-12.02) 0.29
No 242 (84.6) 5 (71.4) 237 (84.9) ref
Household TB contact
(N=286)
Yes 17 (5.9) 1 (14.3) 16 (5.7) 2.74 (.31-24.14) 0.35
No 269 (94.1) 6 (85.7) 263 (94.3) ref
Household WHO TB
symptom positive
Yes 12 (4.2) 3 (42.9) 9 (3.2) 22.67 (4.40-116.57) 0.002
No 276 (95.8) 4 (57.1) 272 (96.8) ref
aFisher’s exact for all categorical variables bCough (any duration), fever, weight loss, or night sweats
Abbreviations: BMI, body mass index; ART, antiretroviral therapy; PMTCT, prevention of maternal to child transmission; cART,
combination antiretroviral therapy; TST, tuberculin skin test; mm, millimeter.
25
Table 2: HIV-infected pregnant women with positive M. tuberculosis sputum culture.
ID CD4
(cells/mm3)
ART regimen,
duration
Symptoms Household
symptoms
TST
(induration)
Xpert
1 nd TDF+3TC+EFV
2 years
None Weight
loss
Negative
(0 mm)
Negative
2 439 TDF+3TC+NVP
3 years
Cough >2 weeks
Lymphadenopathy
Cough Positive
(12 mm)
Positive
3 643 No
Cough >2 weeks
None nd Negative
4 695 No Night sweats
Fever
None Negative
(0 mm)
Positive
5 370 No None None Negative
(0 mm)
Positive
6 600 TDF+3TC+EFV
5 years
None None Positive
(5 mm)
Negative
7 888 TDF+AZT+3TC+LPV/r
3 years
None Cough Positive
(7 mm)
Negative
Abbreviations: nd, not done; TDF, tenofovir; 3TC, lamivudine; EFV, efavirenz; NVP, nevirapine; AZT,
zidovudine; LPV/r, lopinavir-ritonavir
26
Figure 4: Overlap of TB screening and diagnostic tests.
Xpert
4
Culture
7
WHO Sx Screen
56
Smear
2
Urine LAM
13
1
2
1
2
1
27
Table 3. Diagnostic accuracy of WHO TB symptom screen and rapid TB diagnostic tests compared to sputum culture in HIV-infected pregnant women.
Screen or test
Positive
among total
N=288 (%)
Positive
among TB
cases
N=7 (%)
Sensitivity %
(95% CI)
Specificity %
(95% CI)
PPV %
(95% CI)
NPV %
(95% CI)
AUC
(95% CI)
Symptom screening
WHO TB symptoms
Cough 43 (14.9) 2 (28.6) 28.6 (3.7-71.0) 85.4 (80.7-89.3) 4.7 (0.6-15.8) 98.0 (95.3-99.3) .57 (.39-.75)
Fever 14 (4.9) 1 (14.3) 14.3 (0.4-57.9) 95.4 (92.2-97.5) 7.1 (0.2-33.9) 97.8 (95.3-99.2) .55 (.41-.69)
Weight loss 3 (1.0) 0 (0.0) 0.0 (0.0-41.0) 98.9 (96.9-99.8) 0 (0.0-70.8) 97.5 (95.0-99.0) .49 (.49-.50)
Night sweats 20 (6.9) 1 (14.3) 14.3 (0.4-57.9) 93.2 (89.6-95.9) 5.0 (0.1-24.9) 97.8 (95.2-99.2) .54 (.40-.68)
Any WHO TB symptom 56 (19.4) 3 (42.9) 42.9 (9.9-81.6) 81.1 (76.0-85.5) 5.4 (1.1-14.9) 98.3 (95.6-99.5) .62 (.42-.82)
Cough >2 weeks 14 (4.9) 2 (28.6) 28.6 (3.7-71.0) 95.7 (92.7-97.8) 14.3 (1.8-41.8) 98.2 (95.8-99.4) .62 (.44-.80)
Hemoptysis 1 (0.4) 0 (0.0) 0 (0.0-40.9) 99.6 (98.0-100) 0 (0.0-97.5) 97.6 (95.0-99.0) .50 (.49-.50)
Lymphadenopathy 6 (2.1) 1 (14.3) 14.3 (0.4-57.9) 98.2 (95.9-99.4) 16.7 (0.4-64.1) 97.9 (95.4-99.2) .56 (.42-.70)
Household TB symptom
screen
12 (4.2) 3 (42.9) 42.9 (9.9-81.6) 96.8 (94.0-98.5) 25.0 (5.5-57.2) 98.6 (96.3-99.6) .70 (.50-.90)
TB diagnostic test
Smear microscopy 2 0.7 0 (0.0) 0 (0.0-41.0) 99.3 (97.5-99.9) 0 (0.0-84.2) 97.6 (95.0-99.0) .50 (.49-.50)
Xpert 4 1.4 3 (42.9) 42.9 (9.9-81.6) 99.6 (98.0-100) 75.0 (19.4-99.6) 98.6 (96.4-99.6) .71 (.51-.91)
Urine TB LAM (N=266) 13 4.9 0 (0.0) 0 (0.0-70.8) 95.1 (91.7-97.3) 0 (0.0-24.7) 98.8 (96.6-99.8) .48 (.46-.49)
TST (N=85) 18 21.2 3 (75.0) 75.0 (19.4-99.4) 81.5 (71.3-89.2) 16.7 (3.6-41.4) 98.5 (92.0-100) .78 (.53-1.0)
Combined screening
WHO symptomsa 61 21.2 5 (71.4) 71.4 (29.0-96.3) 80.1 (74.9-84.6) 8.2 (2.7-18.1) 99.1 (96.9-99.9) .76 (.58-.94)
WHO symptomsa or TST
(N=129)
72 55.8 6 (100) 100 (54.1-100) 46.3 (37.3-55.6) 8.3 (3.1-17.3) 100 (93.7-100) .73 (.69-.78)
WHO symptomsa or Xpert 63 21.9 6 (85.7) 85.7 (42.1-99.6) 79.7 (74.5-84.3) 9.5 (3.6-19.6) 99.6 (97.5-100) .83 (.69-.97)
TST or Xpert (N=87) 21 24.1 5 (100) 100 (47.8-100) 80.5 (70.3-88.4) 23.8 (8.2-47.2) 100 (94.6-100) .90 (.86-.95)
WHO symptomsa or Xpert
or TST (N=131)
74 56.5 7 (100) 100 (59.0-100) 46.0 (37.0-55.1) 9.5 (3.9-18.5) 100 (93.7-100) .73 (.69-.77)
aExtended WHO symptom screen including report of TB symptoms in participant or household member
Abbreviations: PPV, positive predictive value; NPV, negative predictive value; AUC, area under the curve; Xpert, GeneXpert MTB/RIF; TB LAM,

28
Figure 5: Area under the curve of individual TB screening and diagnostic tests.
WHO Symptom Screen TST
Urine TB-LAM Xpert
AUC=.62 AUC=.78
AUC=.48 AUC=.71

29
Figure 6: Area under the curve (AUC) of combination TB screening and diagnostic tests.
Abbreviations: WHO2= WHO symptom screen including report of TB symptoms in participant or household member
WHO2 WHO2 or Xpert
AUC=.70 AUC=.83
Xpert or TST
AUC=.90

30
VITA
Dr. LaCourse is trained in Internal Medicine and Pediatrics and is currently an Infectious
Disease Fellow at the University of Washington, pursuing a Masters in Public Health in
Epidemiology-Global Health Track. In collaboration with Drs. David Horne (Pulmonary Critical
Care/Global Health) and Grace John-Stewart (Medicine/Pediatrics/Global
Health/Epidemiology/Infectious Disease) she has been involved in a cross-sectional study
evaluating the prevalence of pulmonary TB and MTB infection, including an evaluation of the
performance of the WHO TB symptom screen, Xpert MTB/RIF, and urine TB-LAM tests,
among HIV-infected pregnant women in western Kenya.