© copyright 2021 ravi sankar vaddi
TRANSCRIPT

© Copyright 2021
Ravi Sankar Vaddi
Electrohydrodynamic Actuators for Propulsion and Flow Control
Ravi Sankar Vaddi
A document
submitted in partial fulfillment of the
requirements for the degree of
Doctor of Philosophy
University of Washington
2021
Reading Committee:
Igor V Novosselov, Chair
Alexander V Mamishev
Alberto Aliseda
Program Authorized to Offer Degree:
Mechanical Engineering
University of Washington
Abstract
Electrohydrodynamic Actuators for Propulsion and Flow Control
Ravi Sankar Vaddi
Chair of the Supervisory Committee:
Research Associate Professor, Igor V Novosselov
Department of Mechanical Engineering
Non-thermal plasma (NTP) actuators have been studied in the context of flow control, noise
and drag reduction, lift augmentation, and laminar-turbulent transition control. These actuators
have the advantages of simple design, fast response time, and easy integration. However, insights
into the interaction between Coulombic forces and fluid motion are needed to improve the
performance of NTP devices. This dissertation aims to improve the performance of plasma
actuators for aerodynamic flow control applications. Several analytical and empirical contributions
are described hereafter. First, an analytical model is derived from the first principles for corona
discharge-induced thrust. Second, an empirical model was developed for standard two-electrode
dielectric barrier discharge (DBD) actuators relating plasma volume, actuation voltage, discharge
current, and momentum injection. The third contribution is a novel DC augmented dielectric
barrier discharge (DBD – DCA) actuator. The DBD – DCA with negative DC generates two times
greater thrust force compared to standard DBD. We also present the effect of electrode shape on

the thrust augmentation for DBD – DCA over the linear electrode arrangement. The thrust
measured quadruples with sawtooth electrode DBD – DCA with negative DC compared to
standard DBD. Fourth, the application of an optimized DBD – DCA actuator on a NACA 0012
airfoil; the actuator performances are evaluated in terms of lift and drag coefficients at low angles
of attack. The results suggest that DBD – DCA has the best ability to control an aerial vehicle
without moving parts.
i
TABLE OF CONTENTS
List of Figures ................................................................................................................................ vi
List of Tables ................................................................................................................................ xii
Chapter 1. Introduction ................................................................................................................... 1
1.1 Introduction to Electrohydrodynamic Actuators ............................................................ 1
1.2 Advantages and Disadvantages of EHD Actuators for Aerial Vehicles ......................... 2
1.2.1 Potential advantages of EHD actuators ....................................................................... 3
1.2.2 Disadvantages of EHD actuators ................................................................................ 5
1.3 Scientific and Technology Challenges ............................................................................ 6
1.3.1 Design of EHD actuators ............................................................................................ 6
1.3.2 Improvement of actuator performance ........................................................................ 7
1.3.3 Integration of actuator on an aerial vehicle ................................................................. 8
1.4 Scope of the Dissertation ................................................................................................ 9
1.5 Contributions of the Dissertation .................................................................................. 11
1.6 Outline of the Dissertation ............................................................................................ 12
Chapter 2. Plasma Actuators Background .................................................................................... 14
2.1 Plasma ........................................................................................................................... 14
2.2 Corona Discharge.......................................................................................................... 15
2.2.1 Electrical characterization of corona discharge ........................................................ 16
2.2.2 Corona discharge: ionic wind and thrust .................................................................. 17
2.2.3 Numerical modeling of corona discharge ................................................................. 18
2.3 Dielectric Barrier Discharge ......................................................................................... 19
2.3.1 Electrical characterization of DBD ........................................................................... 22
2.3.2 DBD: Thrust characteristics ...................................................................................... 25
2.3.3 Numerical modeling of DBD .................................................................................... 27
2.3.4 Optimization of DBD ................................................................................................ 28
2.4 Plasma Actuator for Propulsion and Control ................................................................ 30
ii
2.4.1 Propulsion ................................................................................................................. 30
2.4.2 Control ...................................................................................................................... 31
2.5 Chapter Summary ......................................................................................................... 33
Chapter 3. Electrohydrodynamic Flow in a Point to Ring Corona Discharge .............................. 35
3.1 Experimental Setup ....................................................................................................... 35
3.2 Results and Discussion ................................................................................................. 37
3.2.1 Voltage – current characteristics ............................................................................... 37
3.2.2 Voltage – velocity characteristics ............................................................................. 39
3.2.3 Energy transfer efficiency ......................................................................................... 43
3.3 Chapter Summary ......................................................................................................... 44
Chapter 4. Analytical Model for Electrohydrodynamic Thrust .................................................... 46
4.1 Analytical Model Development .................................................................................... 46
4.2 Model Validation – Experimental Setup....................................................................... 57
4.3 Results and Discussion ................................................................................................. 59
4.3.1 Voltage current characteristics .................................................................................. 59
4.3.2 Electrode spacing effect ............................................................................................ 61
4.3.3 EHD thrust model comparison with previous reports ............................................... 62
4.4 Chapter Summary ......................................................................................................... 64
Chapter 5. Propulsion of Insect Scale Robot with EHD Thrusters ............................................... 66
5.1 Fabrication and Assembly of EHD Thrusters ............................................................... 66
5.2 Experimental Method and Results ................................................................................ 68
5.3 Chapter Summary ......................................................................................................... 73
Chapter 6. Corona Discharge Induced Flow on a Flat Plate ......................................................... 75
6.1 Experimental Setup ....................................................................................................... 75
6.2 Modeling ....................................................................................................................... 77
6.3 Results and Discussion ................................................................................................. 78
6.3.1 Numerical results ...................................................................................................... 78
6.3.2 Velocity – voltage characteristics ............................................................................. 79
6.4 Energy Transfer Efficiency ........................................................................................... 81
iii
6.5 Chapter Summary ......................................................................................................... 82
Chapter 7. DBD Plasma Actuator: Empirical Relations for Discharge Current and Momentum 84
7.1 Experimental Setup and Diagnostics ............................................................................ 85
7.1.1 DBD actuator ............................................................................................................ 85
7.1.2 Plasma volume characterization ............................................................................... 86
7.1.3 Electrical measurements and signal processing ........................................................ 87
7.1.4 Wall jet characterization ........................................................................................... 91
7.2 Results and Discussion ................................................................................................. 91
7.2.1 Effect of voltage and frequency on the plasma volume ............................................ 91
7.2.2 Discharge current characteristics .............................................................................. 94
7.2.3 Relationship between discharge current and momentum ......................................... 98
7.3 Chapter Summary ....................................................................................................... 100
Chapter 8. DBD – DCA Plasma Actuator: Effect of Third Electrode ........................................ 102
8.1 Experimental Methods and Diagnostics ..................................................................... 102
8.1.1 Plasma Actuator and Discharge Generation ........................................................... 102
8.1.2 Thrust Measurement Setup ..................................................................................... 104
8.2 Results and Discussion ............................................................................................... 106
8.2.1 Thrust characteristics of DBD ................................................................................ 106
8.2.2 Thrust characteristics of DBD – DCA .................................................................... 107
8.2.3 Effectiveness of actuators ....................................................................................... 111
8.3 Chapter Summary ....................................................................................................... 112
Chapter 9. DBD – DCA Plasma Actuator: Effect of Electrode Shape ....................................... 114
9.1 Experimental Methods and Diagnostics ..................................................................... 114
9.2 Results and Discussion ............................................................................................... 117
9.2.1 Effect of electrode shape on power consumption ................................................... 117
9.2.2 Effect of electrode shape on thrust characteristics .................................................. 118
9.2.3 Effectiveness of actuators ....................................................................................... 122
9.3 Chapter Summary ....................................................................................................... 124
Chapter 10. Flow Control using Plasma Actuators at Low Angles of Attack ............................ 126
iv
10.1 Wind Tunnel and Airfoil ............................................................................................. 126
10.2 Force Measurements ................................................................................................... 128
10.3 Plasma Actuator .......................................................................................................... 130
10.4 Power Supply and Electrical Measurements............................................................... 132
10.5 Results and Discussion ............................................................................................... 133
10.5.1 Baseline performance.......................................................................................... 133
10.5.2 Effect of DCA voltage ........................................................................................ 134
10.5.3 DBD – DCA: function of angle of attack ........................................................... 136
10.5.4 Effect of Reynolds number ................................................................................. 139
10.5.5 Energy Transfer Efficiencies .............................................................................. 141
10.6 Chapter Summary ....................................................................................................... 142
Chapter 11. Investigation of Particles in EHD Systems ............................................................. 144
11.1 Behavior of Ultrafine Particles in EHD Flow ............................................................. 144
11.2 Experimental Methods ................................................................................................ 147
11.2.1 Design and working principle of EHD particle collector ................................... 147
11.2.2 Flow field measurements .................................................................................... 149
11.2.3 Test particles and their preparation ..................................................................... 150
11.2.4 Experimental setup for transmission efficiency .................................................. 153
11.3 Modeling ..................................................................................................................... 155
11.4 Results and Discussion ............................................................................................... 158
11.4.1 Voltage-current characteristics ........................................................................... 158
11.4.2 Numerical results ................................................................................................ 159
11.4.3 Velocity voltage characteristics .......................................................................... 161
11.4.4 Particle transmission ........................................................................................... 162
11.5 Exposure Monitor and In-Situ Analysis ..................................................................... 172
11.5.1 Design of exposure monitor ................................................................................ 175
11.5.2 Particle studies .................................................................................................... 176
11.5.3 Results and discussion ........................................................................................ 177
11.6 Chapter Summary ....................................................................................................... 179
Chapter 12. Conclusions and Future Work ................................................................................. 181
v
12.1 Conclusions ................................................................................................................. 181
12.2 Path Forward ............................................................................................................... 182
12.2.1 Momentum characterization with free stream .................................................... 183
12.2.2 Improved plasma actuator model ........................................................................ 183
12.2.3 Ozone mitigation ................................................................................................. 183
12.2.4 Acoustic noise characterization .......................................................................... 183
12.2.5 Concept plane - plasma actuation ....................................................................... 184
Bibliography ............................................................................................................................... 185
Appendix A. Separation Control using Corona and DBD Actuator..................................... 196
Appendix B. Aerodynamic Forces on Prolate Spheroids ..................................................... 208
vi
LIST OF FIGURES
Figure 1.1. Scope of the dissertation and future work. ..................................................... 11
Figure 2.1. Schematic of positive corona discharge. ........................................................ 16
Figure 2.2. Schematic of the dielectric barrier discharge actuator. The exposed electrode
indicates a high voltage electrode, and the encapsulated electrode is at the ground. 20
Figure 2.3. Working principle of DBD. The electrons are emitted from the exposed electrode
collect on the dielectric surface, to be returned on the subsequent half-cycle of the
discharge. .................................................................................................................. 21
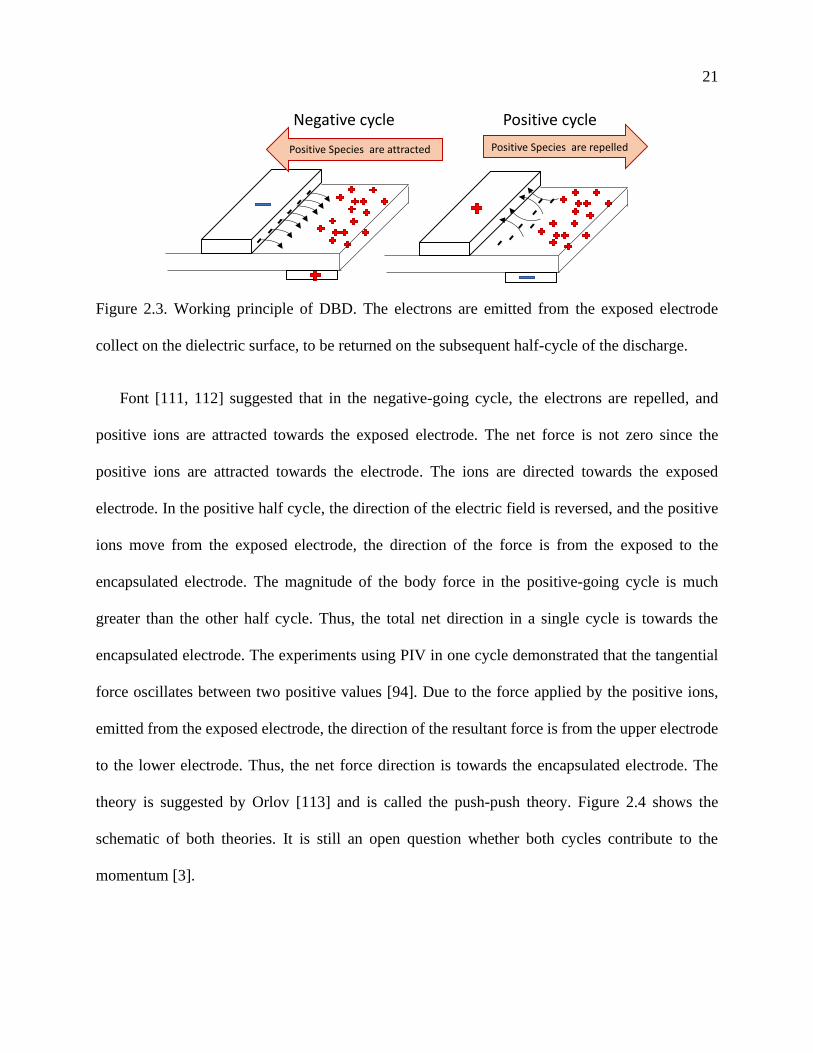
Figure 2.4. Push-push and pull-push theories for dielectric barrier discharge [114]. ....... 22
Figure 2.5. Current and voltage measurements of an asymmetric dielectric barrier discharge.
Regions A and B indicate the microdischarges [120]. .............................................. 23
Figure 2.6. Number of microdischarges with respect to voltage amplitude. Here BD is a positive
semi cycle, and FD is a negative semi cycle [116]. .................................................. 23
Figure 2.7. Streamlines and Q-criterion in the inset colored by velocity magnitude for a boundary
layer flow with a serpentine electrode actuator [160]. .............................................. 29
Figure 2.8. Schematic of the sliding dielectric barrier discharge plasma actuator [168]. . 30
Figure 2.9. The effect of DBD over an airfoil and flow reattachment on a NACA 0015 airfoil
when the plasma actuator is on [100]........................................................................ 33
Figure 3.1. Schematic of the experimental setup – a high voltage is applied between the corona
anode needle and the ion collecting cathode ring. The distance and voltage are varied. 36
Figure 3.2. Current-voltage characteristics of point to ring corona discharge experimental data
and analytical model [6]. ........................................................................................... 38
Figure 3.3. Diagram of the relations among the ionization zone, EHD acceleration region, and
EHD dissipation region of a point-to-ring corona system. ....................................... 40
Figure 3.4. Maximum velocity as a function of corona voltage and electrode geometry for the
experimental data and analytical model [6]. ............................................................. 41
Figure 3.5. Comparison between simulations and experiments for the velocity profiles at the
outlet of the EHD generator; (a) varying corona voltages at a fixed distance, and (b) varying
anode-cathode distance (𝐿) at a fixed corona voltage. ............................................. 42
vii
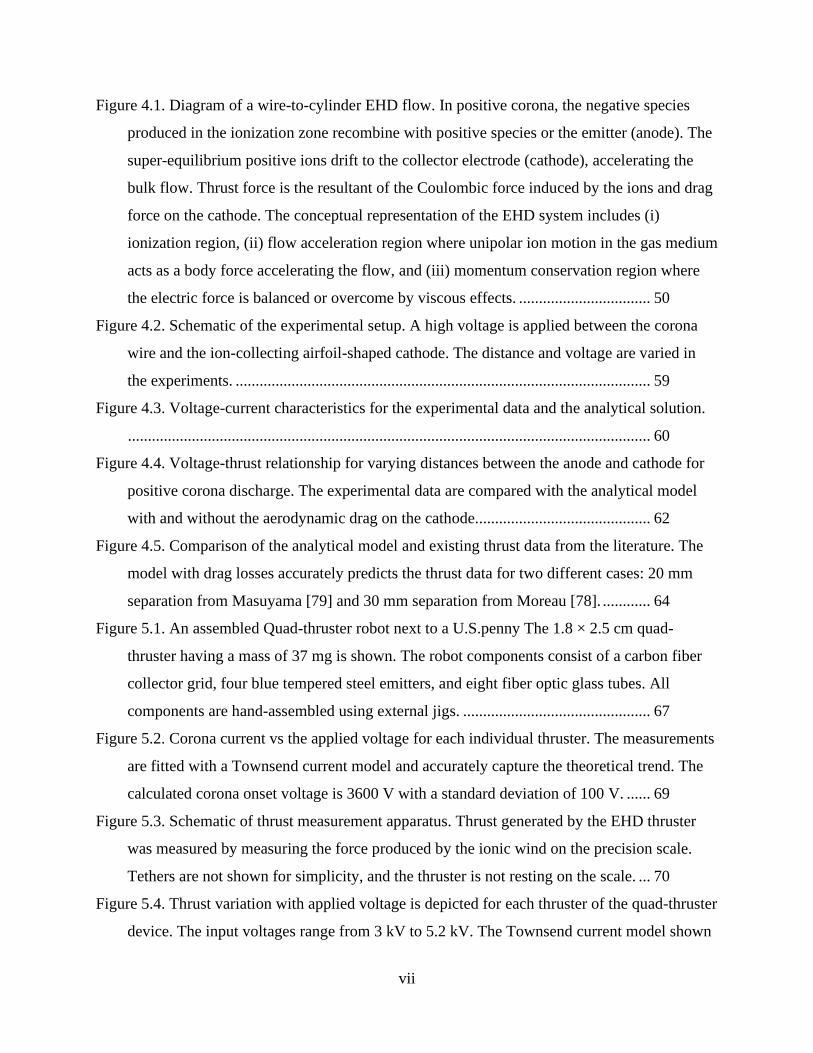
Figure 4.1. Diagram of a wire-to-cylinder EHD flow. In positive corona, the negative species
produced in the ionization zone recombine with positive species or the emitter (anode). The
super-equilibrium positive ions drift to the collector electrode (cathode), accelerating the
bulk flow. Thrust force is the resultant of the Coulombic force induced by the ions and drag
force on the cathode. The conceptual representation of the EHD system includes (i)
ionization region, (ii) flow acceleration region where unipolar ion motion in the gas medium
acts as a body force accelerating the flow, and (iii) momentum conservation region where
the electric force is balanced or overcome by viscous effects. ................................. 50
Figure 4.2. Schematic of the experimental setup. A high voltage is applied between the corona
wire and the ion-collecting airfoil-shaped cathode. The distance and voltage are varied in
the experiments. ........................................................................................................ 59
Figure 4.3. Voltage-current characteristics for the experimental data and the analytical solution.
................................................................................................................................... 60
Figure 4.4. Voltage-thrust relationship for varying distances between the anode and cathode for
positive corona discharge. The experimental data are compared with the analytical model
with and without the aerodynamic drag on the cathode............................................ 62
Figure 4.5. Comparison of the analytical model and existing thrust data from the literature. The
model with drag losses accurately predicts the thrust data for two different cases: 20 mm
separation from Masuyama [79] and 30 mm separation from Moreau [78]. ............ 64
Figure 5.1. An assembled Quad-thruster robot next to a U.S.penny The 1.8 × 2.5 cm quad-
thruster having a mass of 37 mg is shown. The robot components consist of a carbon fiber
collector grid, four blue tempered steel emitters, and eight fiber optic glass tubes. All
components are hand-assembled using external jigs. ............................................... 67
Figure 5.2. Corona current vs the applied voltage for each individual thruster. The measurements
are fitted with a Townsend current model and accurately capture the theoretical trend. The
calculated corona onset voltage is 3600 V with a standard deviation of 100 V. ...... 69
Figure 5.3. Schematic of thrust measurement apparatus. Thrust generated by the EHD thruster
was measured by measuring the force produced by the ionic wind on the precision scale.
Tethers are not shown for simplicity, and the thruster is not resting on the scale. ... 70
Figure 5.4. Thrust variation with applied voltage is depicted for each thruster of the quad-thruster
device. The input voltages range from 3 kV to 5.2 kV. The Townsend current model shown
viii
in Figure 5.2 is used to compute the theoretical upper limit for the measured Coulomb force,
and the data capture this trend................................................................................... 71
Figure 5.5. Efficiency in terms of thrust density versus the corona power for each thruster in the
quad-thruster device. The data points shown displayed are mean values of thrust density and
corona power. ............................................................................................................ 72
Figure 5.6. Frames captured at a frame rate of 240 fps from the quad-thruster in flight. The
thruster is resting on the table with the collector connection dangling down and the emitter
connection straight up. .............................................................................................. 73
Figure 6.1. Schematic diagram of the corona driven EHD wall jet on conducting and non-
conducting/insulating plate; colored lines show electrical field line, solid line – velocity
profile. ....................................................................................................................... 76
Figure 6.2. Schematic of the experimental setup. A DC high voltage is applied between the
copper sawtooth anode and a steel rod cathode, the distance between the anode and cathode
is 9 mm. ..................................................................................................................... 77
Figure 6.3. Computational domain for the numerical simulation. .................................... 78
Figure 6.4. Contour plots of the (a) charge density (C/m3) and (b) streamlines by local 𝑋 (clipped
to 1) for 8 kV case. Maximum – 𝑋 = 100 for both conducting and insulating plates.79
Figure 6.5. Comparison of the velocity profiles between the experimental results and simulations
at (a) D = 10 mm & (b) D = 20 mm of the EHD induced flow on a conducting flat plate. 80
Figure 6.6. Comparison of the velocity profiles for (a) conducting and (b) insulating plates at D =
20 mm. ...................................................................................................................... 81
Figure 7.1. Schematic of the dielectric barrier discharge (DBD) plasma actuator. The plasma
actuator is mounted on an acrylic glass plate, and the blue region is the dielectric layer
separating the electrodes. The velocity is measured using a custom-built glass pitot tube,
and the electrical characteristics are measured using a Rogowski coil..................... 86
Figure 7.2. Plasma discharge region of DBD actuators at 12 kV and 2 kHz. A 98% threshold is
outlined in red to calculate the plasma length and volume. ...................................... 87
Figure 7.3. (a) An example of DBD current at V=18 kV (p-p), f=1 kHz (b) Single
microdischarge pulse in the positive phase with the underlying capacitive current (blue line)
with two thresholds to characterize the microdischarge: (i) threshold of 6 mA (green line),
(ii) the minimum pulse amplitude threshold of 10 mA (cyan line) for distinguishing a
ix
microdischarge. The brown arrow and the shaded region are examples of pulse amplitude
and area respectively. The integration of the shaded area determines the charge associated
with each discharge pulse. ........................................................................................ 88
Figure 7.4. Experimentally evaluated (a) plasma length and (b) projected plasma volume increase
as a function voltage. Plasma length reaches an asymptotic value with frequency, but the
plasma volume continues to increase. ....................................................................... 93
Figure 7.5. Discharge current as a function of applied voltage and frequency for the experimental
data. ........................................................................................................................... 95
Figure 7.6. Discharge current as a function of applied voltage and frequency for the experimental
data. The current varies quadratically with applied voltage, and the power-law relationships
for positive and negative discharge current predict the values accurately. ............... 96
Figure 7.7. Current density for total discharge current and the current density remains the same
for the two applied frequencies. ................................................................................ 97
Figure 7.8. Momentum of the wall jet vs. (a) voltage and (b) discharge current. The wall -jet
momentum collapses onto a single line for both frequencies and is directly proportional to
the discharge current. ................................................................................................ 99
Figure 8.1. Schematic of (a) DBD and (b) DBD – DCA actuator. The plasma actuator is mounted
on a 3D printed plate, and the blue region is the dielectric layer separating the electrodes.
................................................................................................................................. 103
Figure 8.2. Experimental setup schematic for thrust force measurement. ...................... 105
Figure 8.3. Thrust induced by the DBD wall jet as a function of input AC voltage and frequency.
The data is compared with the empirical model with a correction factor (𝜃 = 0.2) accounting
for viscous shear. .................................................................................................... 107
Figure 8.4. Thrust comparison between the DBD and the DBD – DCA with third electrode
grounded as a function of applied voltage. ............................................................. 108
Figure 8.5. Thrust of the DBD – DCA plasma actuator as function of input DC voltage.109
Figure 9.1. Schematic of DBD – DCA actuator. The length L1 and L2 are varied for different
electrode shapes, and the plasma actuator is mounted on a 3D printed plate. ........ 115
Figure 9.2. Schematics and discharge of shaped plasma actuators for (a) linear (b) sawtooth –
coarse (c) sawtooth – fine and (d) finger designs. .................................................. 116
x
Figure 9.3. Electrical power consumption with respect to (a) spanwise length and (b) plasma
length for different electrode shapes at 𝜑𝐴𝐶 = 18 kV for two different frequencies.118
Figure 9.4. Thrust comparison between different electrode shapes for DBD – DCA with third
electrode grounded as a function of the applied voltage for (a) 1 kHz and (b) 2 kHz
frequency. ................................................................................................................ 119
Figure 9.5. Thrust of the DBD – DCA plasma actuator as a function of input DC voltages for
different electrode shapes........................................................................................ 120
Figure 9.6. Effectiveness for different electrode shapes for grounded the third electrode at 𝑓𝐴𝐶 =
2 kHz for a range of voltages. ................................................................................. 123
Figure 10.1. Wind tunnel at the Bowmen building of the University of Washington. From right to
left: honeycomb and screen, converging section, test section, diffuser, fan section.128
Figure 10.2. Schematic of the experimental setup for the lift, drag and pitching moment
measurements on the airfoil with sawtooth DBD – DCA actuator. ........................ 130
Figure 10.3. Sawtooth DBD – DCA actuator installed on NACA 0012 airfoil (a) dimensions of
the plasma actuator (b) geometry of the sawtooth electrode pattern, and (c) actuator
installation position on the airfoil. .......................................................................... 131
Figure 10.4. DBD current with voltage signals at 18 kV(p-p) and 2 kHz applied frequency. 132
Figure 10.5. Comparison of measured aerodynamic coefficients for NACA 0012 airfoil, with
XFOIL calculations [235] and data from the literature [233, 234]. ........................ 134
Figure 10.6. Aerodynamic performance at different 𝜑𝐷𝐶 potentials for two different angles of
attack (a) 0o and (b) 4o (𝑈∞= 15 m/s), DBD - DCA is operated at 𝜑𝑝 − 𝑝 = 18 kV, 𝜑𝑏𝑖𝑎𝑠 =
1.25 kV and 𝑓 = 2 kHz. ........................................................................................... 135
Figure 10.7. Aerodynamic characteristics (a) Lift (b) Drag (c) Pitching moment with/without
plasma actuation at 𝑈∞= 15 m/s. DBD - DCA is operated at 𝜑𝑝 − 𝑝 = 18 kV, 𝜑𝑏𝑖𝑎𝑠 = 1.25
kV, 𝜑𝐷𝐶 = −15 kV and 𝑓 = 2 kHz. ....................................................................... 138
Figure 10.8. Effect of Reynolds number on (a) Lift (b) Drag (c) Pitching Moment for sawtooth
DBD – DCA actuator. ............................................................................................. 140
Figure 11.1. Schematic of EHD particle collector in point to tube configuration. ......... 148
Figure 11.2. Experimental setup for (a) corona current measurement and particle transmission
study (b) EHD driven flow; the flow rate through the particle collector can be controlled
with an external pump and (c) non-EHD experiment with active corona discharge.151
xi
Figure 11.3. Time fluctuations of particle background concentration for corona discharge.152
Figure 11.4. (a) Particle number density (#/cc) distribution for distilled water. Majority of the
particles are in the size range of 36- 86 nm (b) Particle number density distribution (#/cc) in
sodium chloride experiments. ................................................................................. 153
Figure 11.5. Schematic of the computational domain; the model includes the ion generation
region defined by the thresholds of the electric field. ............................................. 155
Figure 11.6. Contour plots of the (a) electric field (V/m), (b) ion concentration (#/cc), the
contours are clipped to 1e+9#/cc, the maximum value is 5.93+9 #/cc (c) velocity (m/s) and
for 3 kV corona voltage between the needle and the ground tube. ......................... 160
Figure 11.7. Comparison of velocity profile between the experimental results and simulations at
the outlet of the EHD induced flow device as shown in Figure 11.6(c). ................ 162
Figure 11.8. Particle transmission efficiency as a function of their size; results for NaCl (unfilled
symbols) and ambient particles (filled symbols) at different corona voltages. ...... 163
Figure 11.9. Velocity streamlines (left) and non-dimensional parameter 𝑋 (right) plotted on
electric field lines for 1 slpm, EHD (~2 slpm), and 5 slpm flowrates. The dash lines on the
streamline plot indicate the location at which velocity profiles are compared. ...... 167
Figure 11.10. Computed velocity profiles in the EHD collector at various axial cross-sections for
5 kV potential difference between the electrodes: a) at the anode electrode (tip of the
needle), b) at the cathode electrode (plane aligned with edge of the tube), c) halfway
distance between anode and cathode, d) at the exit. ............................................... 168
Figure 11.11. Particle transmission efficiency as a function of particle size and flow rate for
corona voltage of 5 kV. ........................................................................................... 169
Figure 11.12. Particle transmission efficiency as a function of particle size and repelling voltage
for corona voltage of 5 kV. ..................................................................................... 171
Figure 11.13. Schematic of the electrostatic precipitator ............................................... 176
Figure 11.14. Size wise collection efficiency for ambient particles for different repelling
voltages. .................................................................................................................. 178
Figure 11.15. EEM of liquid extraction and solid-state fluorescence of cigarette smoke. All
features in LP-EEM are retained in the SP-EEM Schematic of the electrostatic precipitator.
................................................................................................................................. 179
xii
LIST OF TABLES
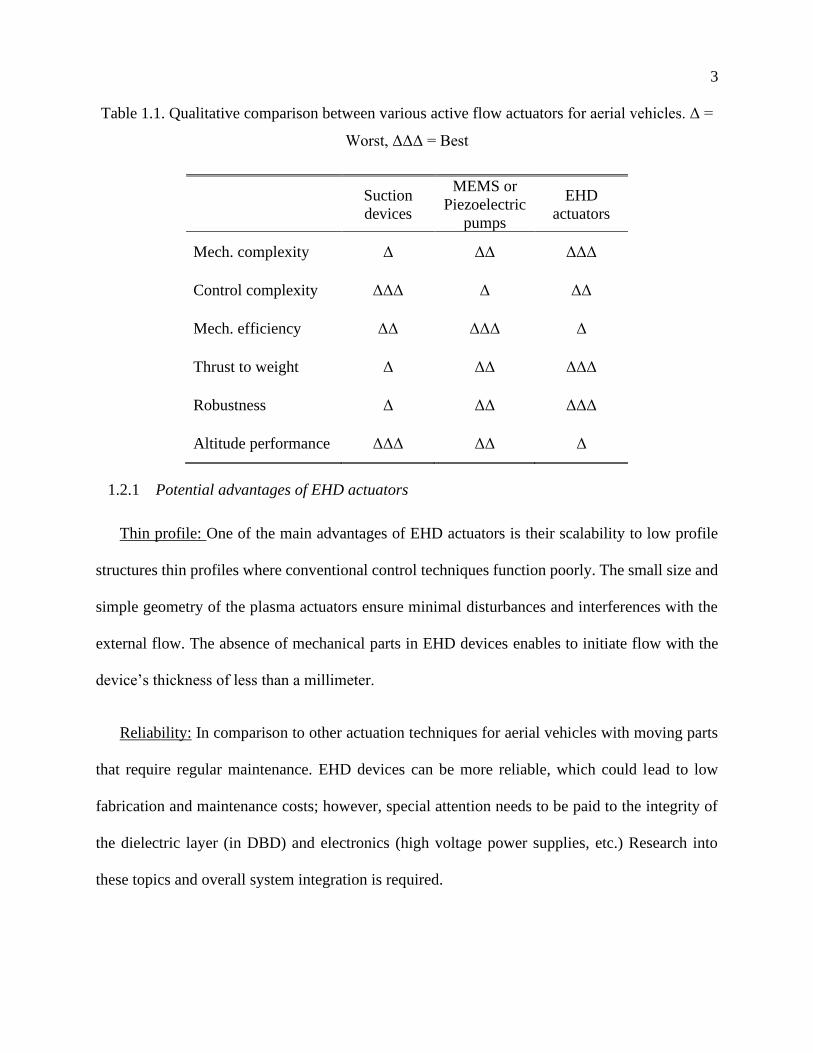
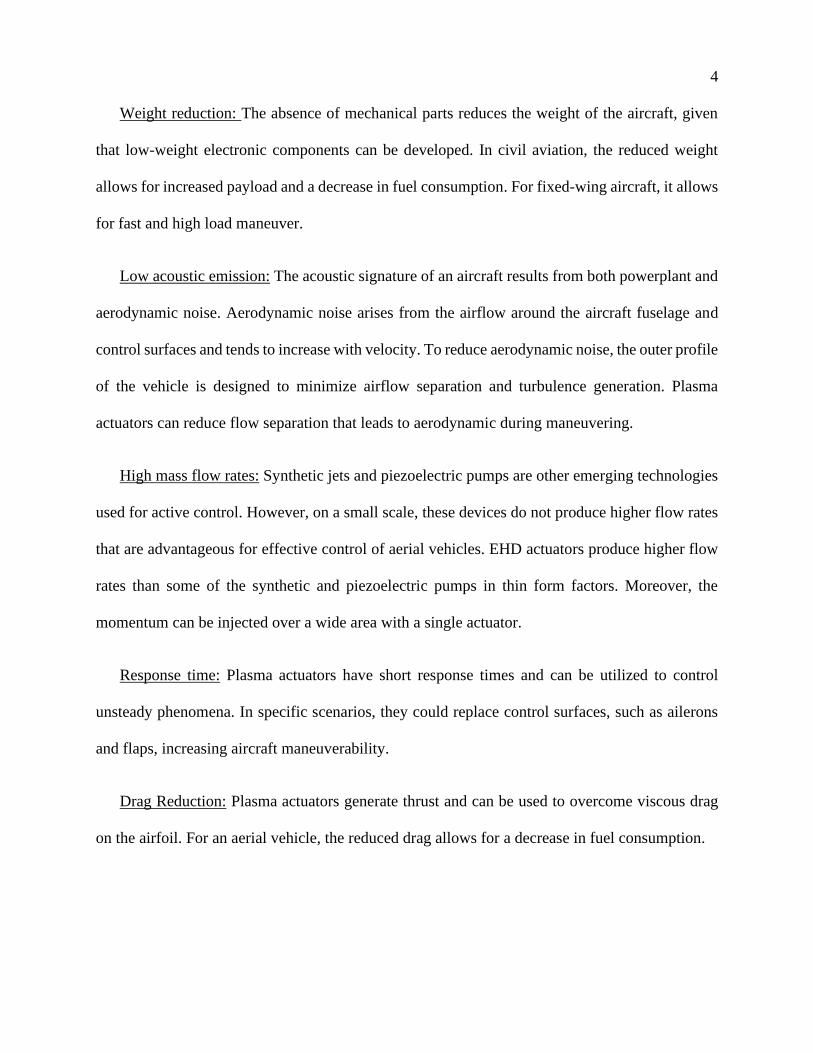
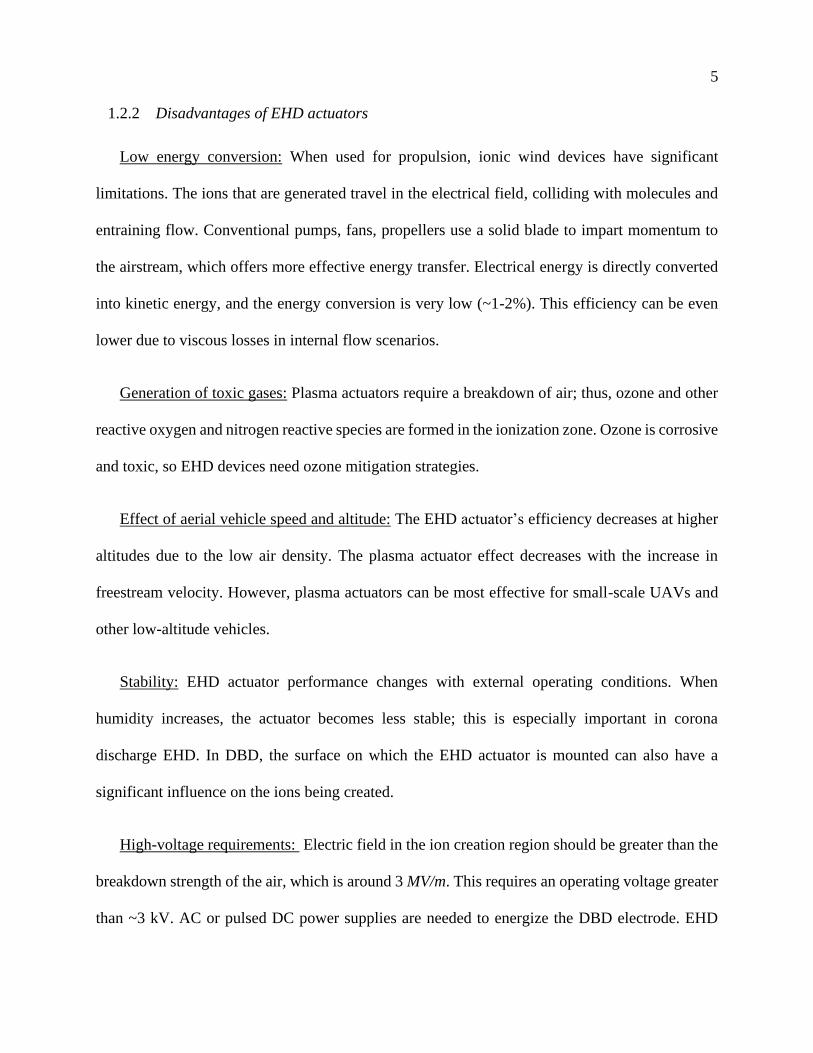
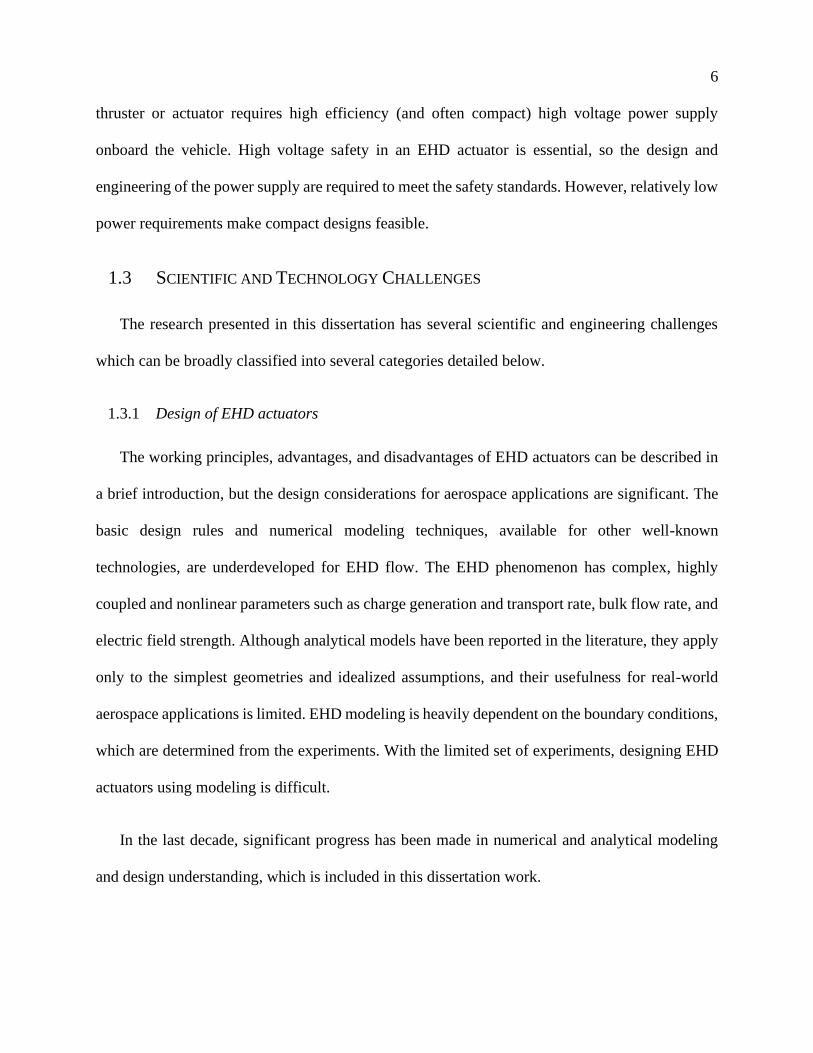
Table 1.1. Qualitative comparison between various active flow actuators for aerial vehicles. Δ =
Worst, ΔΔΔ = Best ...................................................................................................... 3
Table 3.1. Comparison of electrical and fluid power between the experiments and the CFD. 43
Table 4.1. Comparison of analytical expressions from state of the art and our work ...... 57
Table 4.2. Model parameters used for state of the art and the current work. ................... 63
Table 6.1. Comparison of electrical and kinetic power between the experiments and CFD82
Table 7.1. Model parameters used for state of the art and the current work. ................. 100
Table 8.1. Comparison of effectiveness at different operating conditions for DBD and DBD –
DCA at fixed AC voltage of 18 kV. ....................................................................... 112
Table 9.1. Summary of geometric parameters of the plasma actuator in this study ....... 116
Table 9.2. Comparison of effectiveness for DBD – DCA at 𝜑𝐴𝐶 = 18 kV, 𝑓𝐴𝐶 = 2 kHz at
maximum thrust conditions for DCA voltages ....................................................... 124
Table 10.1. Sawtooth DBD – DCA effectiveness at different Reynolds number........... 142
Table 11.1. Numerical schemes ...................................................................................... 157
Table 11.2. Boundary conditions for the numerical simulations .................................... 158
Table 11.3. Comparison of cathode current between the experiments and CFD ........... 159
Table 11.4. Maximum computed ion concentration and electric field strength in the ionization
zone a function of corona voltages ......................................................................... 165

xiii
ACKNOWLEDGEMENTS
It gives me immense pleasure to express my gratitude to the people who helped me on a
wonderful journey, the culmination of this thesis. First and foremost, I would like to say thank you
to Dr. Igor Novosselov for introducing me to this fascinating world of electrohydrodynamics, and
his mentorship. The constant support and encouragement I have received from him, through the
highs and lows of graduate school. I would also like to thank him for allowing me and enabling
me to pursue work with other researchers within the academic community and outside.
I would like to thank Prof. Alexander Mamishev for being a 'second' advisor during my Ph.D.
I would also like to thank Prof. Mamishev for pushing and demanding in many aspects of my
work. I will cherish for a long time the discussion we have had, which on my occasions extended
into the realms of arts, history, general technology, philosophy, and politics. He taught me how to
manage projects and I was fortunate to collaborate with him on grants.
I would like to thank Prof. Alberto for serving as a mentor during my Ph.D. He helped me
learn the basic principles of hot wire anemometry and told me to focus on the fundamentals. I
would like to thank Dr. Sawyer Fuller for introducing me to the insect scale robot community at
the University of Washington. I would also like to thank Prof. Alberto and Dr. Sawyer welcomed
me in their labs and allowed me to use their equipment. I would also like to thank Prof. Dana
Dabiri for his contribution of thoughts, advice, and time as a committee member.
For the last five years, I have enjoyed the good company of several members, past and present
of Novosselov Research Group - including Yifei Guan, Patrick Fillingham, Justin Davis, Gaurav
Mahamuni, Jiayang He, Zhi Yan Chen, Jan Nikolas Knuefer and Anthony Tang. I have pestered
most of them for help with my experimental setups on various occasions that I needed additional
hands and gladly they obliged! The research discussions that I had with them, especially Yifei and
Patrick, gave rise to ideas that eventually shaped this thesis. The lab manager Byron Ockerman
has been very resourceful. I am grateful to all the group members for their help and support.
I would like to thank Aerojet Rocketdyne, Aeronautical Testing Service, and Zepher for
building the wind tunnel, without which this thesis would not be possible. I am especially grateful

xiv
for the thoughts, ideas, and support from Charles Sota. I am grateful for the discussions we have
had, while we are working on the wind tunnel. He helped me learn the basic principles of
aerodynamics and wind tunnel testing.
I am grateful to the Joint Center for Aerospace Technology Innovation, Aerojet Rocketdyne,
Office of Director of National Intelligence ODNI Contract 2017-17073100004, National Institute
of Health for their financial support.
I've also, to my surprise, managed to make and keep a fair number of friends in all my years.
To Sneha, Vaibhav, Akshay, Rohan, Chinmay, and Prasanna, thanks for checking in on me to see
how I was doing. Aditya, Anamol, Rodrigo, and Alicia thanks for surviving your PhDs with me.
A special thanks to Rodrigo for a nigh never-ending adventure as well as being one of the thought
researchers I know.
I am fortunate to have had some fantastic teachers throughout my student years. I am thankful
to all of them, collectively and individually that helped me in getting this far. I would like to
express my sincere gratitude to the person I consider as my guru - Prof. Gururaja Rao. I had the
incredible opportunity to work under him during my undergraduate years, and he has taken a keen
interest in my progress since then. He is a role model to me, and a great source of inspiration.
Finally, I would like to acknowledge my family - my parents Dr. Papayya Sastry and Phani
Purna, brother Sasank for their support and encouragement through the years. In addition, I would
like to thank my wonderful wife Sai Kruthi for her continued support. Grad school has had its
tough moments, I was fortunate enough to have their love and support throughout. I am lucky to
have them.

xv
नारायणं नमसृ्कत्य नरं चैव नरोत्तमम्।
Narayanam namaskritya naram chava narottamam
देव ंसरस्वत ंव्यासं ततो जयमुद रयेत्
Devim sarasvatim vyasam tato jayam udirayet
– Śrīmad Bhāgavata Mahā-purāṇa
The supreme Godhead, the best of humans,
The goddess of learning and the great author
After respecting them our words can be successful
1
Chapter 1. INTRODUCTION
The work presented in this dissertation is motivated by the ever-increasing need for improved
methods and technologies for propulsion and control of aerial vehicles [1-4]. Electrohydrodynamic
(EHD) or plasma actuators have been demonstrated as remarkable devices for separation control,
lift enhancement, and noise reduction. Despite many recent publications on this topic, there remain
some basic questions on momentum injection, thrust, and discharge current and the methods to
improve them. Improved assessment techniques are necessary for plasma actuators that investigate
the relationship between electrical and mechanical quantities. This dissertation examines the
design, integration, and testing of electrohydrodynamic thrusters for propulsion and control of
aerial vehicle applications by developing empirical and analytical models to measure the thrust
force generated by plasma actuators. This work is based on the publications [5-15] by the author.
1.1 INTRODUCTION TO ELECTROHYDRODYNAMIC ACTUATORS
Electrohydrodynamics (EHD) is an interdisciplinary field that describes the interaction of
fluids with an electric field. EHD actuators at their heart are simple devices consisting of sharp
electrodes separated by an air gap and connected to a high voltage generator to apply the potential
between them. When a sufficient potential is applied, an electrical breakdown of air occurs in
which ions are generated in the high electric field region near the high voltage electrode, these ions
drift towards the grounded cathode. The ions collide with the neutral air molecules, resulting in a
macroscopic wind – also known as electrohydrodynamic (EHD) flow or ionic wind.
The success of EHD technology has been limited due to the modest pressure achieved by the
EHD actuators; however, in applications with a low-pressure drop, the EHD-driven flow is
appropriate. Among the advantages of the EHD approach are the ability to operate at a small scale
2
without moving parts, straightforward control of the system, and quiet operation. In propulsion
applications, corona-induced EHD flow directly converts electric energy into kinetic energy and
breaks the size limit associated with moving mechanical parts.
EHD actuators have been used for various applications, including air propulsion [8, 16, 17],
boundary layer modification [18-22], plasma-assisted combustion [23, 24], electrostatic
precipitation [9, 11, 25], convective cooling [26-31], transition delay [32, 33], noise reduction [34-
36], de-icing [37], lift augmentation [38-40], and separation control [2, 41-43]. The transition from
the understanding of principles and operation of EHD to the practical application of the technology
spans many decades of research. The contributions of this dissertation apply primarily to the use
of EHD devices for propulsion and control for aerial vehicles, however, some generalizations can
be made to apply the results to other applications.
1.2 ADVANTAGES AND DISADVANTAGES OF EHD ACTUATORS FOR AERIAL
VEHICLES
EHD air movers were proposed for various industrial applications. Related to aerial vehicle
control and propulsion, the earlier reports date to the 1950s, but the first scientific breakthrough
did not come until 1968 with Velkoff and Ketchmann [18], and subsequent improvements are
made in the design of plasma actuators. EHD actuators have been proposed for use in separation
control, lift enhancement, and noise reduction. However, EHD actuators have some drawbacks,
including the need for a high voltage power supply, ozone generation, and actuator performance
drop with an increase in altitude. This section reviews some of the major advantages and
disadvantages of EHD actuators for aerial vehicles. A comparison of different mechanisms for the
control of aerial vehicles in theory and implementation is shown in Table 1.1 [2].
3
Table 1.1. Qualitative comparison between various active flow actuators for aerial vehicles. Δ =
Worst, ΔΔΔ = Best
Suction
devices
MEMS or
Piezoelectric
pumps
EHD
actuators
Mech. complexity Δ ΔΔ ΔΔΔ
Control complexity ΔΔΔ Δ ΔΔ
Mech. efficiency ΔΔ ΔΔΔ Δ
Thrust to weight Δ ΔΔ ΔΔΔ
Robustness Δ ΔΔ ΔΔΔ
Altitude performance ΔΔΔ ΔΔ Δ
1.2.1 Potential advantages of EHD actuators
Thin profile: One of the main advantages of EHD actuators is their scalability to low profile
structures thin profiles where conventional control techniques function poorly. The small size and
simple geometry of the plasma actuators ensure minimal disturbances and interferences with the
external flow. The absence of mechanical parts in EHD devices enables to initiate flow with the
device’s thickness of less than a millimeter.
Reliability: In comparison to other actuation techniques for aerial vehicles with moving parts
that require regular maintenance. EHD devices can be more reliable, which could lead to low
fabrication and maintenance costs; however, special attention needs to be paid to the integrity of
the dielectric layer (in DBD) and electronics (high voltage power supplies, etc.) Research into
these topics and overall system integration is required.
4
Weight reduction: The absence of mechanical parts reduces the weight of the aircraft, given
that low-weight electronic components can be developed. In civil aviation, the reduced weight
allows for increased payload and a decrease in fuel consumption. For fixed-wing aircraft, it allows
for fast and high load maneuver.
Low acoustic emission: The acoustic signature of an aircraft results from both powerplant and
aerodynamic noise. Aerodynamic noise arises from the airflow around the aircraft fuselage and
control surfaces and tends to increase with velocity. To reduce aerodynamic noise, the outer profile
of the vehicle is designed to minimize airflow separation and turbulence generation. Plasma
actuators can reduce flow separation that leads to aerodynamic during maneuvering.
High mass flow rates: Synthetic jets and piezoelectric pumps are other emerging technologies
used for active control. However, on a small scale, these devices do not produce higher flow rates
that are advantageous for effective control of aerial vehicles. EHD actuators produce higher flow
rates than some of the synthetic and piezoelectric pumps in thin form factors. Moreover, the
momentum can be injected over a wide area with a single actuator.
Response time: Plasma actuators have short response times and can be utilized to control
unsteady phenomena. In specific scenarios, they could replace control surfaces, such as ailerons
and flaps, increasing aircraft maneuverability.
Drag Reduction: Plasma actuators generate thrust and can be used to overcome viscous drag
on the airfoil. For an aerial vehicle, the reduced drag allows for a decrease in fuel consumption.
5
1.2.2 Disadvantages of EHD actuators
Low energy conversion: When used for propulsion, ionic wind devices have significant
limitations. The ions that are generated travel in the electrical field, colliding with molecules and
entraining flow. Conventional pumps, fans, propellers use a solid blade to impart momentum to
the airstream, which offers more effective energy transfer. Electrical energy is directly converted
into kinetic energy, and the energy conversion is very low (~1-2%). This efficiency can be even
lower due to viscous losses in internal flow scenarios.
Generation of toxic gases: Plasma actuators require a breakdown of air; thus, ozone and other
reactive oxygen and nitrogen reactive species are formed in the ionization zone. Ozone is corrosive
and toxic, so EHD devices need ozone mitigation strategies.
Effect of aerial vehicle speed and altitude: The EHD actuator’s efficiency decreases at higher
altitudes due to the low air density. The plasma actuator effect decreases with the increase in
freestream velocity. However, plasma actuators can be most effective for small-scale UAVs and
other low-altitude vehicles.
Stability: EHD actuator performance changes with external operating conditions. When
humidity increases, the actuator becomes less stable; this is especially important in corona
discharge EHD. In DBD, the surface on which the EHD actuator is mounted can also have a
significant influence on the ions being created.
High-voltage requirements: Electric field in the ion creation region should be greater than the
breakdown strength of the air, which is around 3 MV/m. This requires an operating voltage greater
than ~3 kV. AC or pulsed DC power supplies are needed to energize the DBD electrode. EHD
6
thruster or actuator requires high efficiency (and often compact) high voltage power supply
onboard the vehicle. High voltage safety in an EHD actuator is essential, so the design and
engineering of the power supply are required to meet the safety standards. However, relatively low
power requirements make compact designs feasible.
1.3 SCIENTIFIC AND TECHNOLOGY CHALLENGES
The research presented in this dissertation has several scientific and engineering challenges
which can be broadly classified into several categories detailed below.
1.3.1 Design of EHD actuators
The working principles, advantages, and disadvantages of EHD actuators can be described in
a brief introduction, but the design considerations for aerospace applications are significant. The
basic design rules and numerical modeling techniques, available for other well-known
technologies, are underdeveloped for EHD flow. The EHD phenomenon has complex, highly
coupled and nonlinear parameters such as charge generation and transport rate, bulk flow rate, and
electric field strength. Although analytical models have been reported in the literature, they apply
only to the simplest geometries and idealized assumptions, and their usefulness for real-world
aerospace applications is limited. EHD modeling is heavily dependent on the boundary conditions,
which are determined from the experiments. With the limited set of experiments, designing EHD
actuators using modeling is difficult.
In the last decade, significant progress has been made in numerical and analytical modeling
and design understanding, which is included in this dissertation work.
7
1.3.2 Improvement of actuator performance
The EHD actuator performance for aerospace applications depends on numerous factors, such
as the physical dimensions, materials, operating conditions, and EHD actuator location.
1.3.2.1 Physical dimensions
The EHD actuator performance depends on different physical dimensions, including the gap
between electrodes and electrode shape. The electric field between the anode and cathode causes
the breakdown of air and the bulk flow. A shorter distance between the anode and cathode results
in higher electric field strength and higher peak velocity concentrated in a point with a lower
operating voltage range. Meanwhile, a longer distance between the anode and cathode results in
distributed momentum over a wide area and a higher voltage range.
Regarding the electrode shape, the standard shape is linear for both the anode and cathode; the
actuators consist of two rectangular conducting strips separated by a dielectric layer. Shaped
electrodes have been introduced, including triangular, serpentine, square, and horseshoe-shaped
actuators. In linear electrodes, the EHD force primarily acts in the streamwise direction. With the
new geometries, the body force is locally normal to the active electrode edge, resulting in 3D
effects.
1.3.2.2 Materials
When choosing the material for electrodes, there are two important parameters to keep in mind:
the material and thickness 𝑡. Electrodes are typically fabricated using metal foils, and the thickness
must be selected in such a way that does not disrupt the boundary layer. For a DBD plasma
actuator, the general aim is to lower the capacitance of the actuator. Different dielectric materials
8
will have a different dielectric constant 휀. The capacitance is proportional to 휀 𝑡⁄ ratio, and the
power loss through the dielectric is proportional to the capacitance. Therefore, lowering the
capacitance by using thicker dielectrics or more insulating ones decreases the power loss, allowing
a higher voltage and higher body force. However, for a given applied voltage, a thinner dielectric
may produce higher velocities. The use of thicker dielectric materials with low dielectric constants
causes a spreading of the electric field lines on the dielectric surface, lowering the current density
and streamer formation.
1.3.2.3 Operating conditions
The position of the EHD actuator on the airfoil can change fluid dynamic characteristics such
as laminar to turbulent transition, flow separation/reattachment, turbulence level, which will have
different applications based on its position. EHD actuator located on the leading edge will delay
the transition. The transition delay affects friction drag, postponing the stall since the turbulent
boundary layer can withstand the adverse pressure gradient. Furthermore, the laminar flow has
less drag and is more prone to separation at a high angle of attack. The flow reattachment due to
co-flow momentum injection into separated flow on a wing allows to improve the aerodynamic
characteristics like maximum lift and increase in the angle of attack for the wing. EHD actuator
located on the trailing edge can reduce flow separation and change the downwash angle of the
airfoil. The change in the downwash angle creates a moment on the aerodynamic center, and it can
be used for controlling the airfoil at low angles of attack.
1.3.3 Integration of actuator on an aerial vehicle
The path from exploratory study and proof-of-concept experiment to integration in a
commercial product is often the most significant effort in technology development. The successful
9
integration of EHD devices with aircraft requires solving multiple engineering challenges. One
must ensure that a plasma actuator meets the requirements for separation control, drag reduction,
and lift augmentation, design of the system to optimize the aerodynamic performance, design of a
compact high voltage power source for EHD operation, and provide long-term reliability.
1.4 SCOPE OF THE DISSERTATION
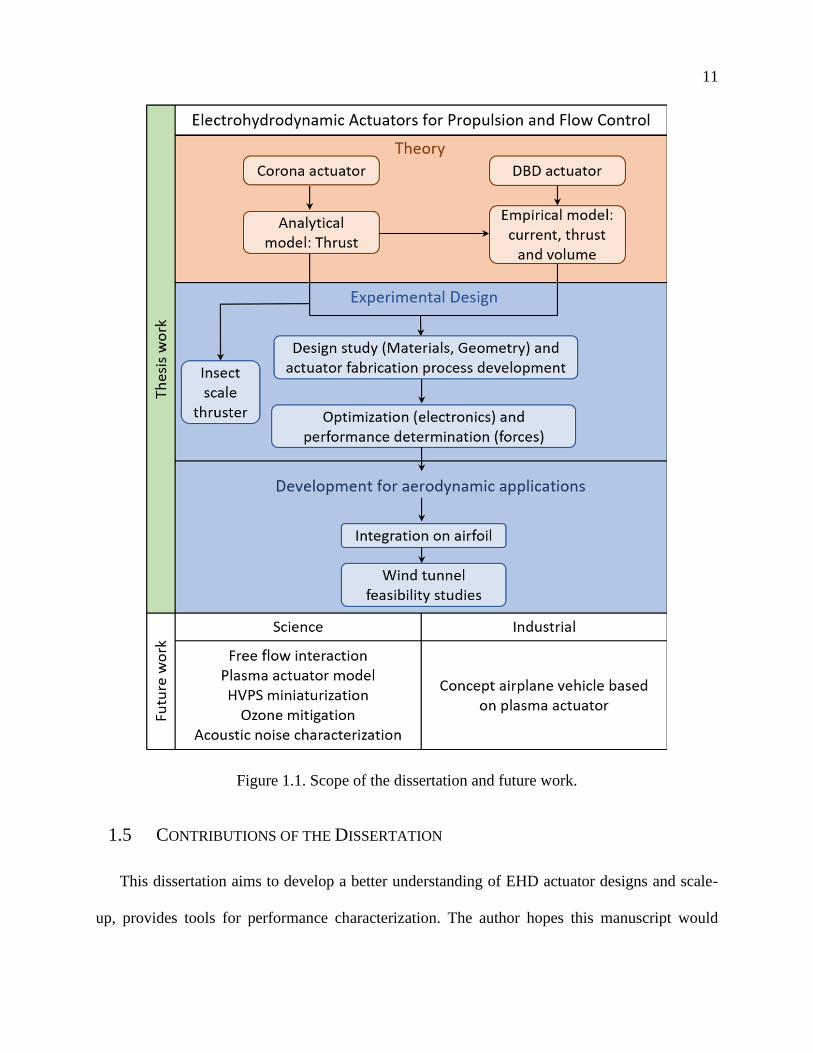
Figure 1.1 shows the scope of this dissertation and future work in a visual format. This
dissertation is a study into the theory, implementation, and testing of EHD actuators for propulsion
and control of aerial vehicles.
Theory: In the area of theory, this dissertation attempts to develop a better understanding of
the fundamental principles for EHD actuators. A generalizable analytical model for thrust
determination is developed for corona discharge from first principles. The thrust expression can
be used to design propulsion systems and can be readily implemented in numerical simulations.
The corona discharge thrust model framework is used to develop a semi-analytical model to
calculate the discharge current, thrust, momentum injection. The developed empirical model
characterizes the dielectric barrier discharge actuator based on the AC inputs. The analytical and
empirical models developed for corona discharge and dielectric barrier discharge can be readily
applied for determining more realistic boundary conditions in numerical simulations.
Experimental design: Two different EHD actuator concepts are presented in this dissertation:
corona-discharge actuator and DBD actuator. The main idea behind the EHD actuators is to induce
momentum on the airfoil to control boundary layer flow for augmentation of lift force and the
aerial vehicle can be controlled without ailerons, flaps. Corona actuator consists of a high voltage
anode and a cathode with a shallow rectangular cavity. As the potential on the anode increases,
10
there will be a spark-over, which means the electrical breakdown across the electrode separation
gap. For DBD actuators, there is a dielectric material between the electrodes to eliminate the
sparkover. Corona actuators are better for providing thrust and DBD actuators are for control
applications. Various designs of plasma actuators with and without dielectric barrier were
fabricated and tested. A design study has been conducted to determine the optimal anode design,
distance between anode and cathode. The baseline prototypes or laboratory scale EHD actuators
are hand-made using commercial off-the-shelf materials and parts, and a fabrication process is
developed. Rigorous tests provide proof of concept validation for EHD actuator performance.
Parametric studies are performed to show the interactions between the thrust, energy transfer
efficiency, and key design parameters of interest, including anode voltage, geometric factors, and
HV electronics.
Development for aerodynamic applications: The road from laboratory scale to commercial
product is long, and the full development is outside the scope of this dissertation. However, this
dissertation does attempt to present the opportunity of EHD actuators for propulsion and control
of aerial vehicles and demonstrates the feasibility of the EHD actuators through design,
construction, and testing of a full-scale wing section with an integrated EHD actuator, and then
test this device in a low-speed wind tunnel. The EHD actuator performance is characterized in a
non-zero free stream environment by test at realistic Reynolds number. Lift, drag, and moment
coefficients are determined for a selected 2D wing section with EHD actuators and reviews the
challenges on the path to the successful integration of EHD actuators for aerospace applications.
In addition, this dissertation attempts to present EHD actuators as propulsion devices for miniature
aerial vehicles (insect scale) through design, construction, and demonstrating the lift-off of a
centimetre scale aerial vehicle.
11
Figure 1.1. Scope of the dissertation and future work.
1.5 CONTRIBUTIONS OF THE DISSERTATION
This dissertation aims to develop a better understanding of EHD actuator designs and scale-
up, provides tools for performance characterization. The author hopes this manuscript would
12
demonstrate the feasibility of EHD actuators on airfoil for propulsion and control and open doors
to the design of UAVs with active EHD flow control. Consequently, specific contributions have
been made to assist the research community with the ongoing research and development of plasma
actuator technology.
• Formulated an analytical model for thrust force determination from first principles for
corona discharge.
• Developed an empirical model for two-electrode DBD actuators relating plasma volume,
discharge current, and momentum injection.
• Designed, fabricated, and tested a novel plasma actuator (DBD – DCA) for increased
performance.
• Demonstrated the control capability of DBD – DCA on an airfoil at low angles of attack.
1.6 OUTLINE OF THE DISSERTATION
This dissertation examines the design, integration, and testing of electrohydrodynamic
actuators for propulsion and control of aerial vehicle applications. Chapter 2 of this work entails a
brief review of the plasma actuators. The main electrical and geometrical parameters that influence
the performance and applications of propulsion and flow control problems are discussed. Chapter
3 presents the experimental study on point to ring corona discharge, the results are compared with
analytical and numerical solutions. Chapter 4 discusses the analytical model developed to
determine electrohydrodynamic thrust and the model is validated with three independent
experimental results. In Chapter 5, the experimental results of a centimeter-scale EHD thruster are
presented, and the lift-off of the EHD quad thruster is demonstrated. Chapter 6 discusses the corona
13
discharge induced wall jet on the conducting and insulating plate for flow control applications.
The flow is studied experimentally and numerically to resolve spatiotemporal characteristics of
charge density, velocity, and electric field. Chapter 7 discusses the empirical model development
for the DBD actuator, including electrical current associated with microdischarges, plasma
volume, and wall jet momentum. The presented empirical model characterizes the DBD wall jet
momentum and discharge current based only on AC inputs. Chapter 8 demonstrates the advantage
of a new DC augmented dielectric barrier discharge (DBD – DCA) on thrust performance and
effectiveness compared to the standard two-electrode DBD. Chapter 9 discusses three different
electrode shapes for increasing the performance of the DBD – DCA actuator and compares them
with linear shape electrodes. In Chapter 10, the best performing DBD – DCA actuator from the
flat plate study is installed on a NACA 0012 airfoil, and wind tunnel test results are presented and
analyzed. Chapter 11 discusses the influence of particles in EHD systems. A new particle charging
method in EHD and a novel aerosol collector based on the EHD particle charging method are
presented. Finally, the overall conclusions and lessons learned and proposed road map forward for
future research are reported in Chapter 12.
14
Chapter 2. PLASMA ACTUATORS BACKGROUND
This section presents a brief background on plasma actuators. Two configurations of plasma
actuators 1. DC Corona discharge 2. AC DBD actuators are presented with their geometric
optimizations and state-of-the-art analytical models. Then the application of plasma actuators to
propulsion and control applications for aerial vehicles is presented.
2.1 PLASMA
Plasma is one of the four fundamental states of matter, and the term was introduced by Noble
Prize winner Irving Langmuir. It consists of gas either partially or fully ionized. It consists of an
equal number of positively charged ions and negatively charged electrons, i.e., it is globally
neutral. In nature, plasma can be commonly found in space, as in star cores, solar wind, and
lightning. Plasma can be artificially generated by heating a neutral gas or subjecting it to a strong
electromagnetic field to the point where the gas becomes electrically conductive. Nowadays,
artificially generated plasma is widely used in industrial applications such as surface treatment
[44, 45], plasma sterilization [46, 47], plasma cutting [48, 49], plasma screens, neon tubes, and for
control and propulsion in the aerospace industry.
The plasma can be classified into thermal and non-thermal depending on the relative
temperature of electrons, ions, and neutral molecules. Thermal plasma has ions, electrons, and
neutral molecules at the same temperature. Non-thermal plasma has ions and neutral molecules at
low temperatures and electrons at higher temperatures. Plasma is called hot if it is fully ionized, or
cold if it is partially ionized. Cold plasmas are usually non-thermal plasmas, and they are usually
used in technological applications. In this dissertation, only cold plasmas are considered because
15
the energy supplied to the actuator to induce the flow is used to produce electrons and not to heat
the surrounding gas. Two types of plasma discharges can be used for plasma actuators:
(1). Corona Discharge
(2). Dielectric Barrier Discharge
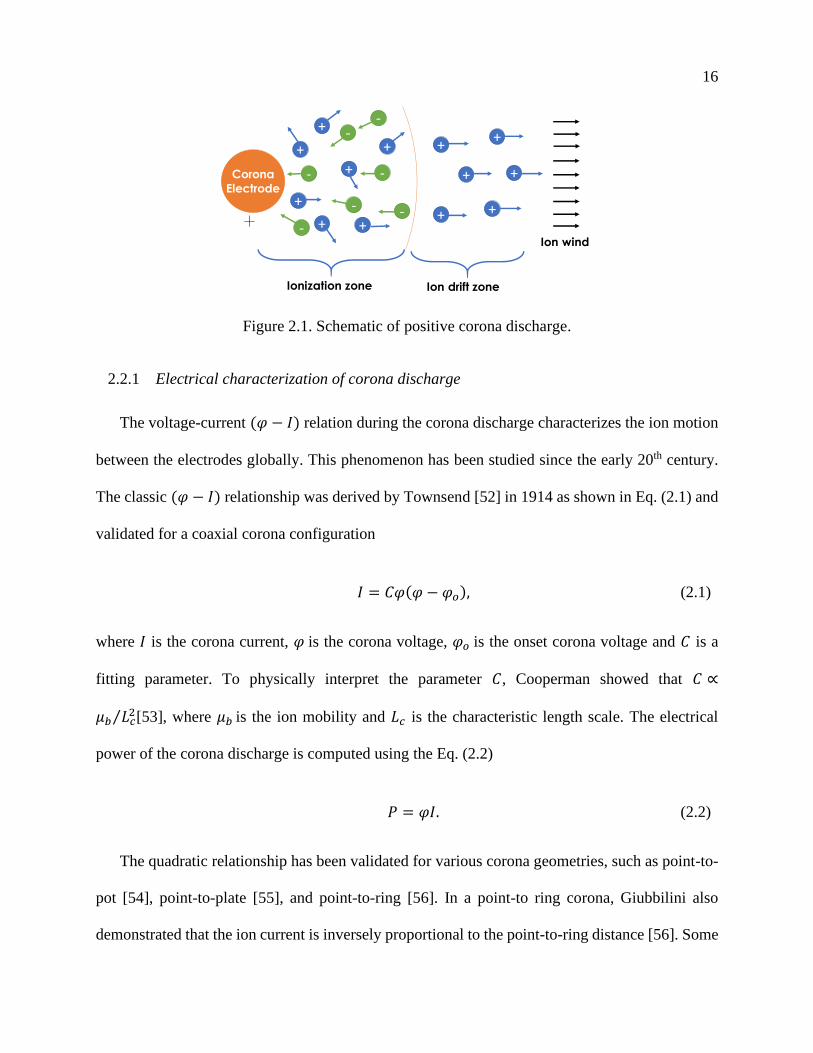
2.2 CORONA DISCHARGE
Corona discharge is an electrical breakdown of air in which ions are generated in the high
electric field region near the high energy anode, these ions drift towards the grounded cathode.
The mechanism of the corona ionic wind is shown in Figure 2.1. When a high voltage is applied,
the neutral air molecules are ionized by the strong electric field at the tip of the corona electrode
[50, 51]. In positive corona discharge, electrons are attracted to the high voltage corona electrode,
positive ions such as O2+ and O+ drift towards the cathode. As the high-velocity ions repelled from
the corona electrode, they collide with the neutral air molecules driving the EHD flow. The ions’
acceleration in the electric field and their interaction with the neutral molecules in the ion drift
region can be modeled as an external force term (Coulomb force) in the Navier-Stokes equations.
A two-part model is required: (i) the description of the ion motion in the electrical field, and (ii)
the effect of the ion drift on the neutral gas in the flow acceleration region.
16
Figure 2.1. Schematic of positive corona discharge.
2.2.1 Electrical characterization of corona discharge
The voltage-current (𝜑 − 𝐼) relation during the corona discharge characterizes the ion motion
between the electrodes globally. This phenomenon has been studied since the early 20th century.
The classic (𝜑 − 𝐼) relationship was derived by Townsend [52] in 1914 as shown in Eq. (2.1) and
validated for a coaxial corona configuration
𝐼 = 𝐶𝜑(𝜑 − 𝜑𝑜), (2.1)
where 𝐼 is the corona current, 𝜑 is the corona voltage, 𝜑𝑜 is the onset corona voltage and 𝐶 is a
fitting parameter. To physically interpret the parameter 𝐶, Cooperman showed that 𝐶 ∝
𝜇𝑏 𝐿𝑐2⁄ [53], where 𝜇𝑏 is the ion mobility and 𝐿𝑐 is the characteristic length scale. The electrical
power of the corona discharge is computed using the Eq. (2.2)
𝑃 = 𝜑𝐼. (2.2)
The quadratic relationship has been validated for various corona geometries, such as point-to-
pot [54], point-to-plate [55], and point-to-ring [56]. In a point-to ring corona, Giubbilini also
demonstrated that the ion current is inversely proportional to the point-to-ring distance [56]. Some
Ionization zone Ion drift zone
Corona
Electrode
+
+ ++
+
+
+
+
+
++
+
+
-
-
-
--
-
-
Ion wind
17
recent studies modify Townsend’s quadratic relationship to better describe the (𝜑 − 𝐼) relationship
for different electrode configurations, e.g., point-to-plate [57], point-to-grid [58], sphere-to-plane
[59], coaxial cylinders [60, 61], wire-cylinder-plate [62], point-to-ring [56, 63, 64], parallel
electrodes [65], multi-electrodes [66], and non-uniform electric fields [67].
2.2.2 Corona discharge: ionic wind and thrust
The theoretical aspect of EHD in gas was first investigated by Robinson [68] as shown in
Eq.(2.3), who demonstrated the ability of electrostatic blowers to generate velocities up to 4 m/s.
𝑣 = 𝑘√𝐼
𝜌𝜇𝑏, (2.3)
where 𝑘 is the geometric parameter, 𝜌 is the gas density, and 𝜇𝑏 us the ion mobility. The concept
of electric wind associated with an EHD thrust was first demonstrated in a one-dimensional model
showing that the EHD thrust is dependent on the electric pressure [69]. Christenson and Moller
have developed an expression for EHD thrust and found that EHD efficiency can be related to ion
mobility [70]. Pekker et al. first derived an ideal 1D EHD thruster model for calculating maximum
thrust and thrust efficiency from the charge conservation equation and the Mott-Gurney law [71].
Mott-Gurney law describes the relation between maximum electric current density and applied
voltage in semiconductors [72]. The current density was shown to vary as 𝐽 ∝ 𝜑(𝜑 − 𝜑𝑜), in
agreement with the Townsend (𝜑 − 𝐼) relationship [52] in 1914. Since then, the form 𝐼 = 𝐶𝜑(𝜑 −
𝜑𝑜) has been widely adopted for corona discharge analysis [55, 73-77]. The thrust induced by the
ions (𝜑 − 𝑇) relationship can be derived based on Townsend's relationship (𝜑 − 𝐼) [78, 79] and
the maximum thrust can be defined based on Mott-Gurney law [78]. Thrust is equal to the Coulomb
force acting on the volume of the fluid between anode and cathode,
18
𝑇 = ∫ 𝜌𝑒𝐸𝑑𝑉 = ∫ 𝜌𝑒𝐸𝐴𝑑𝑥 = ∫𝐽𝐴𝑑𝑥
𝜇𝑏=
𝐼𝑑
𝜇𝑏=
𝐶𝜑(𝜑 − 𝜑𝑜)𝑑
𝜇𝑏, (2.4)
where 𝜌𝑒 is the charge density, 𝑇 is the thrust force, 𝐸 is the electric field and 𝑑 is the distance
between anode and cathode. The thrust efficiency is calculated as given in Eq.(2.5)
𝑇
𝑃=
𝐼𝑑
𝜇𝑏𝜑𝐼=
𝑑
𝜇𝑏𝜑,
(2.5)
where 𝑃 is the electrical power consumed by the corona discharge.
2.2.3 Numerical modeling of corona discharge
The ions' interaction with the neutral molecules can be modeled as an external force term
(Lorentz force) in the Navier-Stokes equations [64, 78]. Insights into the multiphysics nature of
the EHD flow are important for understanding this phenomenon. To correctly predict the flow
established by this force, the following elements need to be considered: (i) the electric field
resulting from the potential difference between the corona and ground electrodes, as well as its
modifications due to the space charge in the high ion concentration in the region; (ii) the ion motion
in the resulting electric field; (iii) the interaction between the ion drift and the neutral gas in the
flow acceleration region; (iv) the viscous and turbulent stresses; and (v) the effects of developing
complex flow patterns as a result of the accelerating flow and device geometry. State-of-the-art
literature evaluates several corona configurations [80-82]. Numerical modeling has been applied
to the design and analysis of electrostatic precipitators (ESP) [83-86] and heat transfer
enhancement [28, 87-90]. Previous EHD flow models use an iterative approach to: (i) calculate
the electric field and electric force under Kaptzov’s hypothesis [91] or Peek’s law [92], and (ii) set
19
a constant space charge on the anode so that the solution matches the cathode current from the
experimental data. This method requires multiple iterations and is therefore inefficient.
An issue with the corona discharge operation is the instability of the discharge. One solution
is introducing a dielectric barrier discharge, where a dielectric material is inserted between the two
electrodes. A direct current (DC) cannot flow through the dielectric material; an AC voltage is
required.
2.3 DIELECTRIC BARRIER DISCHARGE
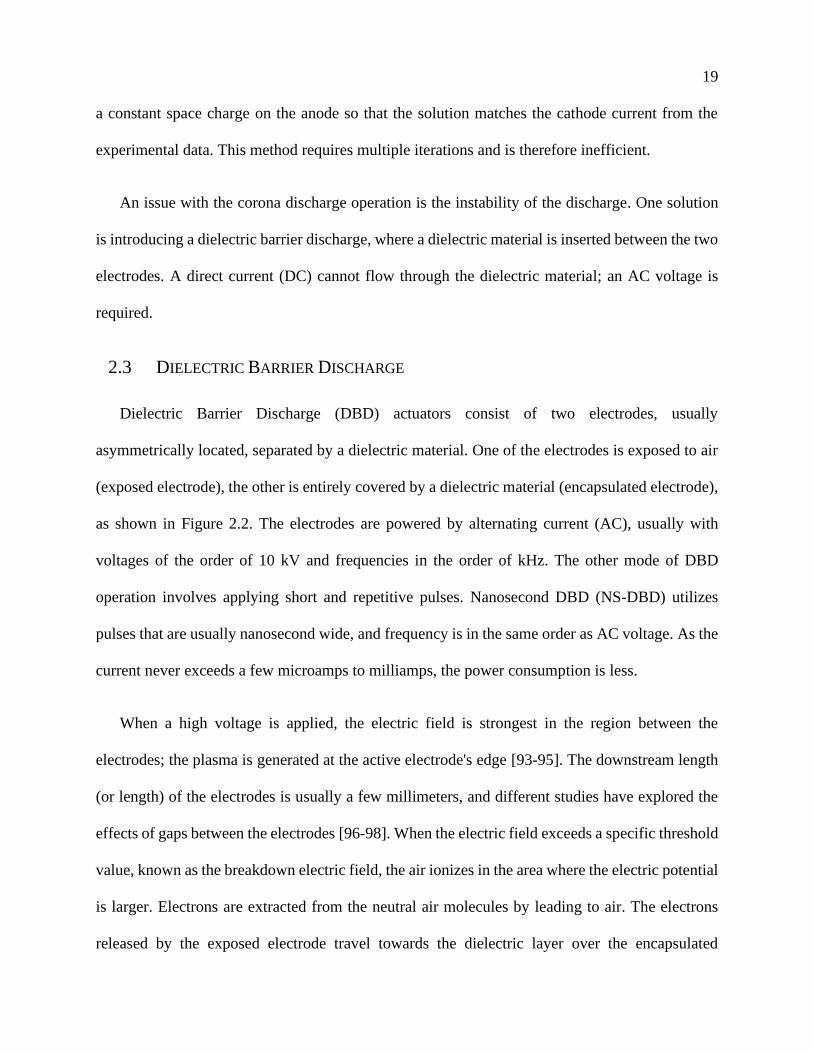
Dielectric Barrier Discharge (DBD) actuators consist of two electrodes, usually
asymmetrically located, separated by a dielectric material. One of the electrodes is exposed to air
(exposed electrode), the other is entirely covered by a dielectric material (encapsulated electrode),
as shown in Figure 2.2. The electrodes are powered by alternating current (AC), usually with
voltages of the order of 10 kV and frequencies in the order of kHz. The other mode of DBD
operation involves applying short and repetitive pulses. Nanosecond DBD (NS-DBD) utilizes
pulses that are usually nanosecond wide, and frequency is in the same order as AC voltage. As the
current never exceeds a few microamps to milliamps, the power consumption is less.
When a high voltage is applied, the electric field is strongest in the region between the
electrodes; the plasma is generated at the active electrode's edge [93-95]. The downstream length
(or length) of the electrodes is usually a few millimeters, and different studies have explored the
effects of gaps between the electrodes [96-98]. When the electric field exceeds a specific threshold
value, known as the breakdown electric field, the air ionizes in the area where the electric potential
is larger. Electrons are extracted from the neutral air molecules by leading to air. The electrons
released by the exposed electrode travel towards the dielectric layer over the encapsulated
20
electrode and back over one AC period. In the negative-going half cycle, the electrons are released
in the air by the exposed electrode and thus ionize the air. The negatively charged electrons are
repelled towards the encapsulated electrode and accumulate on the surface of the dielectric. During
the positive half cycle, the electrons on the dielectric layer go back to the exposed electrode. This
process is highlighted in Figure 2.3 where both half cycles are illustrated. Through collisions,
momentum is transferred to the flow. The plasma is formed as the result of a series of discharges
as electrons are transferred onto and off the dielectric surface [99]. The DBD actuator induces a
pulsed velocity with the same frequency as the AC voltage [2, 22, 100-103]. The effect of the
electrodes' thickness and the dielectric media significantly impacts the actuator's performance [95,
104-107]. A single straight-edged DBD actuator is assumed to produce a two-dimensional flow
field due to the spanwise uniform electric field. Other actuator designs have been considered,
including serrated electrodes that produce a three-dimensional flow field [108-110].
Figure 2.2. Schematic of the dielectric barrier discharge actuator. The exposed electrode indicates
a high voltage electrode, and the encapsulated electrode is at the ground.
Plasma
Encapsulated electrode
Dielectric material
Induced flowExposed electrode
21
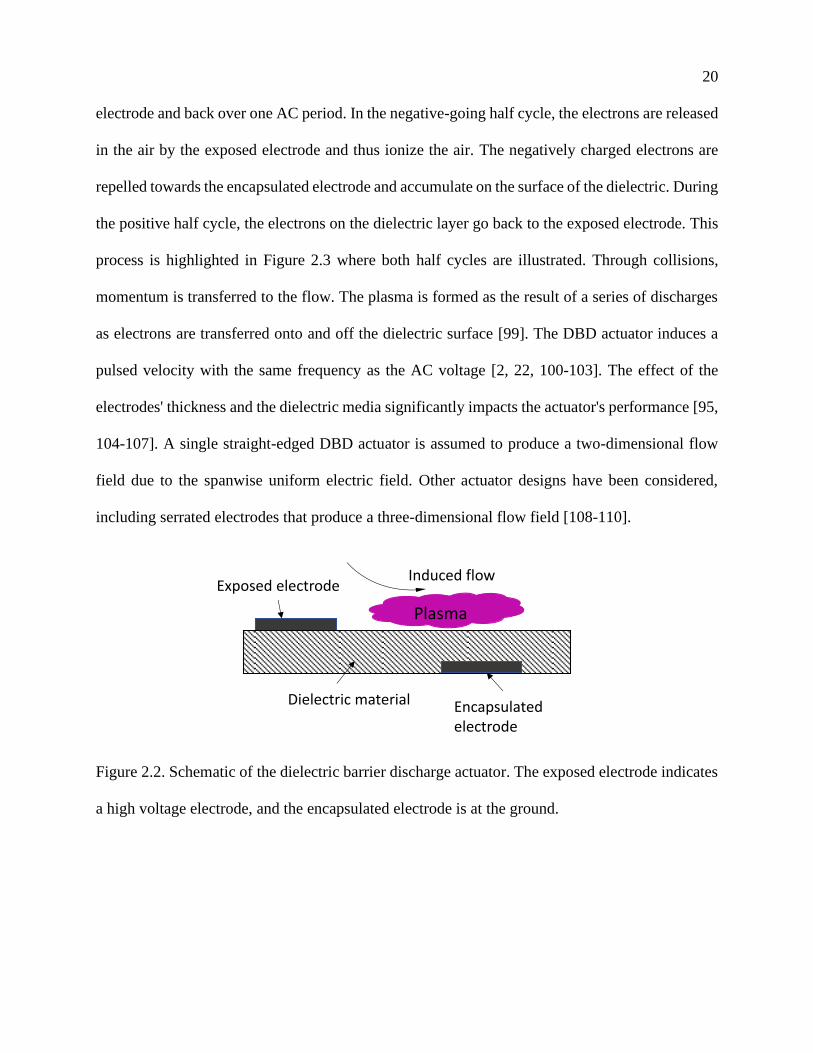
Figure 2.3. Working principle of DBD. The electrons are emitted from the exposed electrode
collect on the dielectric surface, to be returned on the subsequent half-cycle of the discharge.
Font [111, 112] suggested that in the negative-going cycle, the electrons are repelled, and
positive ions are attracted towards the exposed electrode. The net force is not zero since the
positive ions are attracted towards the electrode. The ions are directed towards the exposed
electrode. In the positive half cycle, the direction of the electric field is reversed, and the positive
ions move from the exposed electrode, the direction of the force is from the exposed to the
encapsulated electrode. The magnitude of the body force in the positive-going cycle is much
greater than the other half cycle. Thus, the total net direction in a single cycle is towards the
encapsulated electrode. The experiments using PIV in one cycle demonstrated that the tangential
force oscillates between two positive values [94]. Due to the force applied by the positive ions,
emitted from the exposed electrode, the direction of the resultant force is from the upper electrode
to the lower electrode. Thus, the net force direction is towards the encapsulated electrode. The
theory is suggested by Orlov [113] and is called the push-push theory. Figure 2.4 shows the
schematic of both theories. It is still an open question whether both cycles contribute to the
momentum [3].
Negative cycle Positive cycle
Positive Species are repelledPositive Species are attracted
22
Figure 2.4. Push-push and pull-push theories for dielectric barrier discharge [114].
2.3.1 Electrical characterization of DBD
Traditional metrics to characterize plasma actuators' electrical performance include current,
power and charge transported. The voltage is measured directly from the output of the power
supply unit or utilizing high voltage probes. On the other hand, the current can be measured
through a shunt resistance on the ground electrode [94, 115]. Alternatively, an inductive Rogowski
coil can be used to measure current [116-118]. A Rogowski coil allows to push the response of the
current measurements beyond 100 MHz, which is suitable for microdischarge characterization.
Figure 2.5 shows current and voltage measurements of a DBD. A current measurement through a
non-intrusive current coil can be viewed as a superposition of low-frequency capacitive current,
discharge current, and noise. The capacitive current is often filtered out or ignored because it
corresponds to the transiently stored energy in the dielectric or air and not energy transferred to
fluid motion [96]. On the other hand, the discharge current indicates the amount of charged species
that can participate in the energy transfer to fluid motion. The discharge current comprises
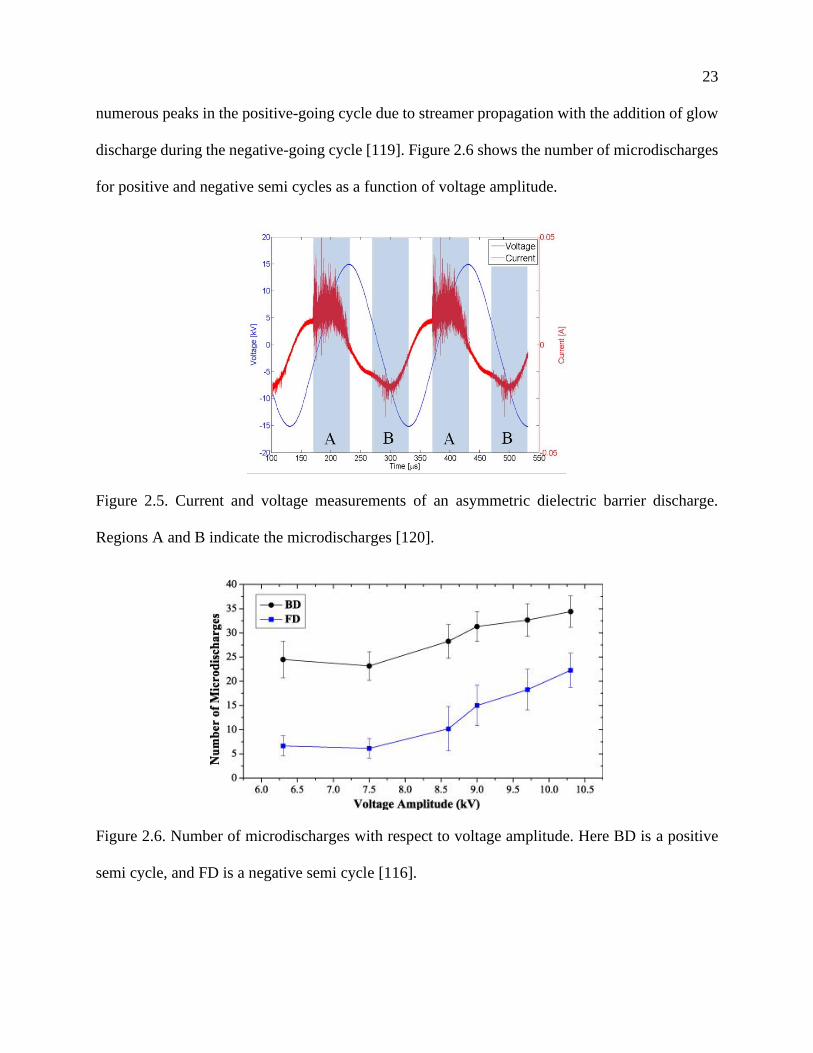
23
numerous peaks in the positive-going cycle due to streamer propagation with the addition of glow
discharge during the negative-going cycle [119]. Figure 2.6 shows the number of microdischarges
for positive and negative semi cycles as a function of voltage amplitude.
Figure 2.5. Current and voltage measurements of an asymmetric dielectric barrier discharge.
Regions A and B indicate the microdischarges [120].
Figure 2.6. Number of microdischarges with respect to voltage amplitude. Here BD is a positive
semi cycle, and FD is a negative semi cycle [116].

24
The electric power 𝑊𝑒𝑙𝑒𝑐 can be computed from voltage and current measurements as shown
in Eq. (2.6)
𝑊𝑒𝑙𝑒𝑐 =
1
𝑇∫ 𝜑(𝑡)𝑖(𝑡)𝑑𝑡
𝑇
0
(2.6)
where 𝑇 is the AC period of DBD, 𝜑(𝑡) and 𝑖(𝑡) are the voltage and current signals. The current
and voltage signals have to be measured with a good oscilloscope with high bandwidth, resolution
and sampling rate. These conditions are essential for accurate capture of individual discharges that
have been shown to occur on average over a 30 ns duration [121]. The high bandwidth and the
sampling rate minimize the noise during the current measurements and can be used to compute the
time-averaged electrical power [52]. An alternative way to compute the power for DBD is to
measure the charge through a capacitor in series between the actuator and the ground [1, 122]. The
capacitor integrates the current; with this technique, there is no need to resolve current spikes. A
typical voltage-charge curve, which is called the Lissajous figure, and the area enclosed by the
curve is the energy dissipated by per period.
The electrical power is typically characterized as a power-law based functions of either 𝑓𝐴𝐶
and 𝜑(𝑡). Some research groups use a quadratic approximation for the power consumption with
increasing operating voltage [115, 123, 124]. Other groups have reported exponent values ranging
between 2 – 3.5 [99, 122, 125, 126], depending on the geometry. Most research groups found a
linear relationship between the power and frequency [94, 115, 124] and Kriegseis found that
𝑊𝑒𝑙𝑒𝑐 ∝ 𝑓𝐴𝐶1.5
[122].
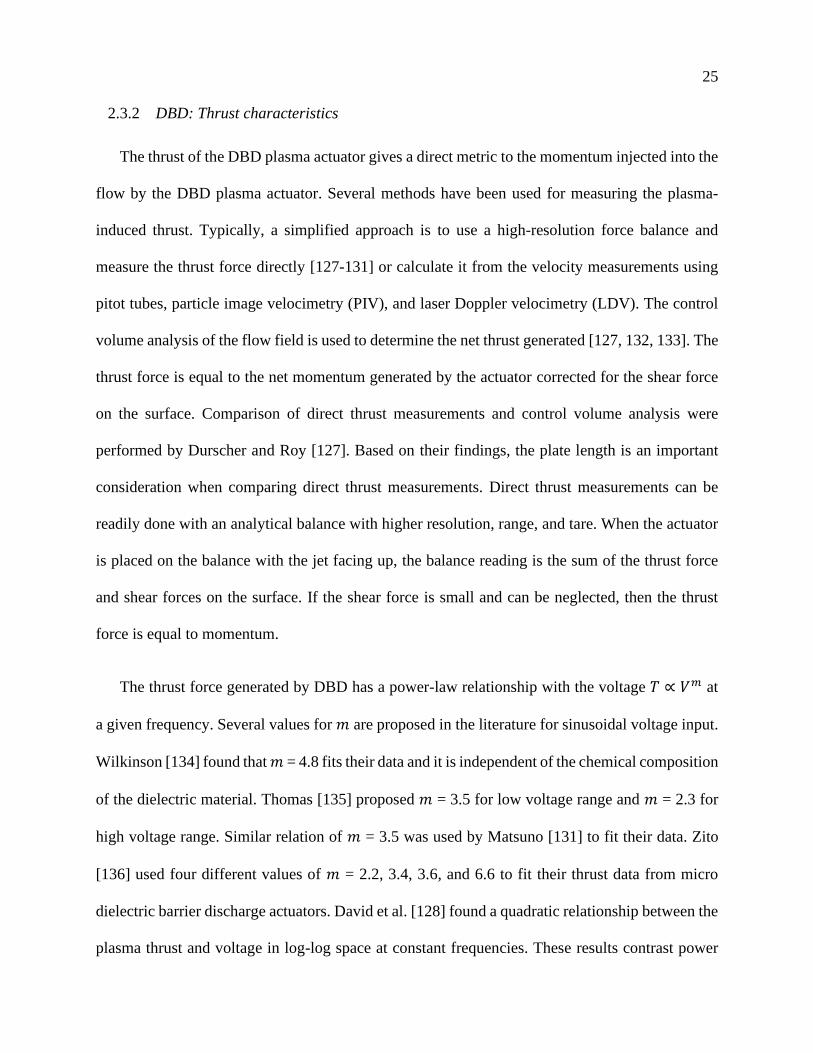
25
2.3.2 DBD: Thrust characteristics
The thrust of the DBD plasma actuator gives a direct metric to the momentum injected into the
flow by the DBD plasma actuator. Several methods have been used for measuring the plasma-
induced thrust. Typically, a simplified approach is to use a high-resolution force balance and
measure the thrust force directly [127-131] or calculate it from the velocity measurements using
pitot tubes, particle image velocimetry (PIV), and laser Doppler velocimetry (LDV). The control
volume analysis of the flow field is used to determine the net thrust generated [127, 132, 133]. The
thrust force is equal to the net momentum generated by the actuator corrected for the shear force
on the surface. Comparison of direct thrust measurements and control volume analysis were
performed by Durscher and Roy [127]. Based on their findings, the plate length is an important
consideration when comparing direct thrust measurements. Direct thrust measurements can be
readily done with an analytical balance with higher resolution, range, and tare. When the actuator
is placed on the balance with the jet facing up, the balance reading is the sum of the thrust force
and shear forces on the surface. If the shear force is small and can be neglected, then the thrust
force is equal to momentum.
The thrust force generated by DBD has a power-law relationship with the voltage 𝑇 ∝ 𝑉𝑚 at
a given frequency. Several values for 𝑚 are proposed in the literature for sinusoidal voltage input.
Wilkinson [134] found that 𝑚 = 4.8 fits their data and it is independent of the chemical composition
of the dielectric material. Thomas [135] proposed 𝑚 = 3.5 for low voltage range and 𝑚 = 2.3 for
high voltage range. Similar relation of 𝑚 = 3.5 was used by Matsuno [131] to fit their data. Zito
[136] used four different values of 𝑚 = 2.2, 3.4, 3.6, and 6.6 to fit their thrust data from micro
dielectric barrier discharge actuators. David et al. [128] found a quadratic relationship between the
plasma thrust and voltage in log-log space at constant frequencies. These results contrast power
26
relationships developed in literature which are approximate over a limited voltage range. A
generalized empirical/ analytical model is developed based on corona discharge for DBD plasma
thrust and found that the thrust has a quadratic relationship with voltage and a power law with
frequency [123, 137].
It is important to understand the effect of external factors such as relative humidity, pressure
and temperature on the thrust induced by dielectric barrier discharge since these actuators would
be installed on aircraft wings. Benard studied the effect of humidity from 40% - 98% RH on
velocity and current [138]. The induced velocity increases with air humidity up to RH<55% and
then it drops, but the DBD actuator could still work. Relative humidity changes the current peaks
as well, decreases the number of current peaks, which means the discharge becomes more
filamentary and it is not a uniform glow [139]. The ambient pressure has a significant impact on
the performance of the DBD: both on the velocity [140] and discharge intensity [141]. The
discharge power and the plasma length increase with a decrease in the pressure [142, 143];
however, the velocity and body force increase with a decrease in pressure, reach a maximum value,
and then decrease [142]. Similar observations for body force are observed in the literature [144]
over a pressure range of 13-101 kPa and demonstrated the pressure at which thrust is maximized.
The factors influencing the pressure at which the thrust was maximized were recently studied, and
a generalized formula describing the relationships between pressure, permittivity, dielectric
thickness, and operating voltage was derived to determine the thrust [145]. The induced velocity
increases linearly with temperature [146]. In the current dissertation, the effects of external factors
are not studied, but they can be explored in the future.
27
2.3.3 Numerical modeling of DBD
The effect of plasma actuator on the flow can be modelled through a body force term as shown
in Eq. (2.7) into the Navier-Stokes equation
𝑓𝐸𝐻𝐷 = 𝜌𝑐�⃗⃗�, (2.7)
where 𝜌𝑐 is the charge density and �⃗⃗� is the electric field. The simplest models such as the Shyy
model [147], models taking some assumptions like force is assumed to be steady in time, the
electric field has a linear spatial distribution in both directions. Another simple model is the one
proposed by Suzen & Huang model [148, 149]. Considering relative permittivity properties of the
working fluid and actuator materials, the simplified DBD models define the charge density as a
one-dimensional boundary condition with a half Gaussian distribution starting at the edge of the
ground electrode closest to the active electrode [150]. The half Gaussian charge distribution has
been experimentally and numerically investigated, and it is typically presented as a function of x-
direction [99, 126, 151-154]. The y-direction is indirectly considered through the Debye length
[113, 155]. Another simple model has been proposed by Orlov [156], which models the actuator
as a lumped element electrical circuit, made of capacitors, resistors, and diodes, to capture the
charge distribution on the surface. These models can significantly reduce the calculation times,
especially for complex scenarios or 3D geometries, such as boundary-layer separation control,
turbine blades, and channel flow [154, 157-159]. However, these models use guessed parameters
like charge density, debye length and this thesis provides empirical relationships for plasma
volume and discharge current. Using these empirical relationships, an approximate boundary
conditions can be determined for numerical simulations.
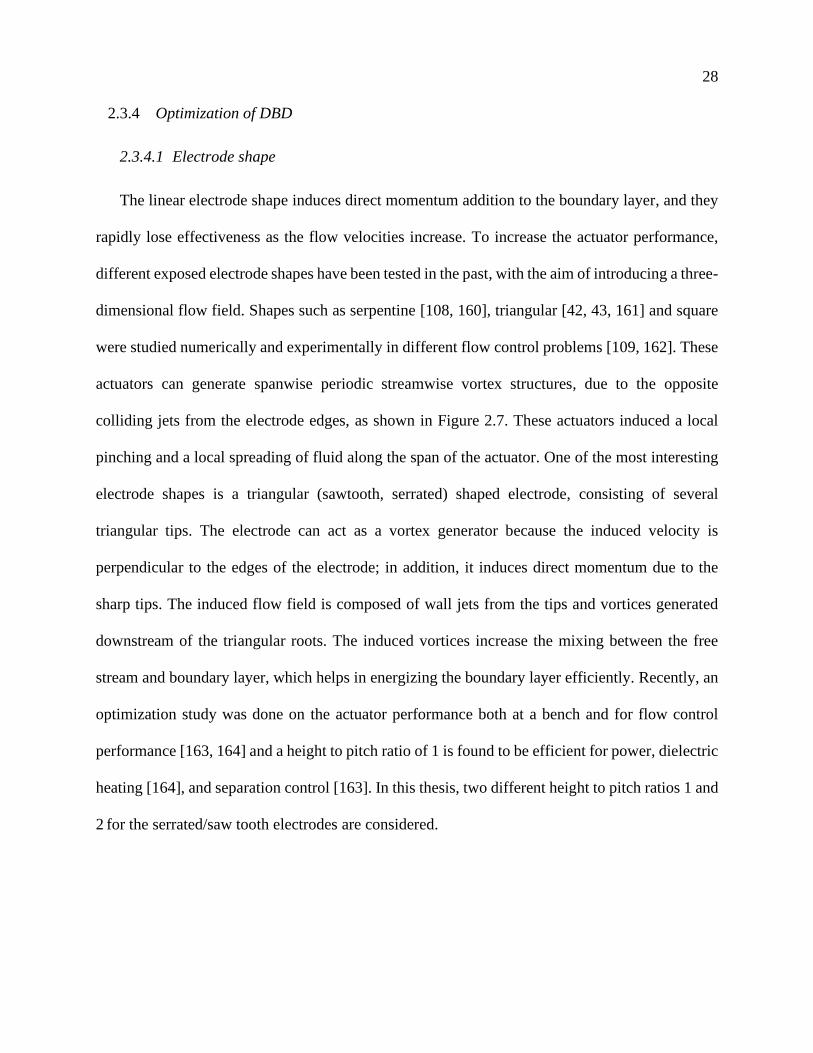
28
2.3.4 Optimization of DBD
2.3.4.1 Electrode shape
The linear electrode shape induces direct momentum addition to the boundary layer, and they
rapidly lose effectiveness as the flow velocities increase. To increase the actuator performance,
different exposed electrode shapes have been tested in the past, with the aim of introducing a three-
dimensional flow field. Shapes such as serpentine [108, 160], triangular [42, 43, 161] and square
were studied numerically and experimentally in different flow control problems [109, 162]. These
actuators can generate spanwise periodic streamwise vortex structures, due to the opposite
colliding jets from the electrode edges, as shown in Figure 2.7. These actuators induced a local
pinching and a local spreading of fluid along the span of the actuator. One of the most interesting
electrode shapes is a triangular (sawtooth, serrated) shaped electrode, consisting of several
triangular tips. The electrode can act as a vortex generator because the induced velocity is
perpendicular to the edges of the electrode; in addition, it induces direct momentum due to the
sharp tips. The induced flow field is composed of wall jets from the tips and vortices generated
downstream of the triangular roots. The induced vortices increase the mixing between the free
stream and boundary layer, which helps in energizing the boundary layer efficiently. Recently, an
optimization study was done on the actuator performance both at a bench and for flow control
performance [163, 164] and a height to pitch ratio of 1 is found to be efficient for power, dielectric
heating [164], and separation control [163]. In this thesis, two different height to pitch ratios 1 and
2 for the serrated/saw tooth electrodes are considered.
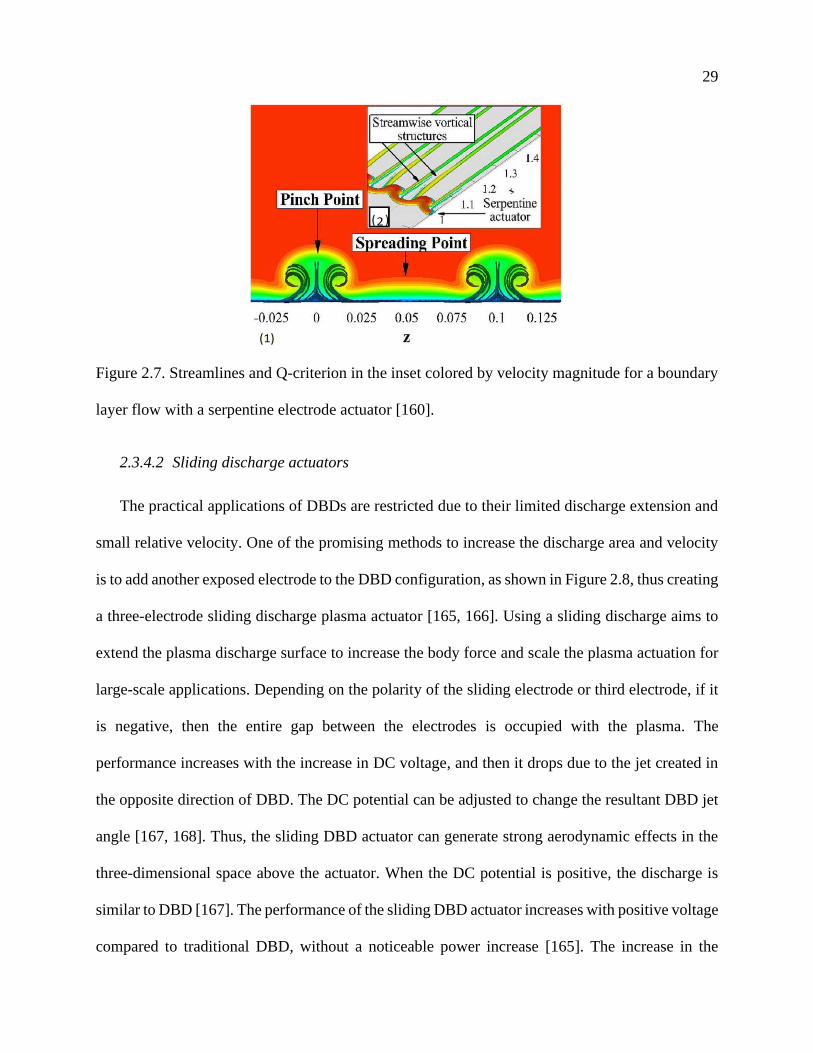
29
Figure 2.7. Streamlines and Q-criterion in the inset colored by velocity magnitude for a boundary
layer flow with a serpentine electrode actuator [160].
2.3.4.2 Sliding discharge actuators
The practical applications of DBDs are restricted due to their limited discharge extension and
small relative velocity. One of the promising methods to increase the discharge area and velocity
is to add another exposed electrode to the DBD configuration, as shown in Figure 2.8, thus creating
a three-electrode sliding discharge plasma actuator [165, 166]. Using a sliding discharge aims to
extend the plasma discharge surface to increase the body force and scale the plasma actuation for
large-scale applications. Depending on the polarity of the sliding electrode or third electrode, if it
is negative, then the entire gap between the electrodes is occupied with the plasma. The
performance increases with the increase in DC voltage, and then it drops due to the jet created in
the opposite direction of DBD. The DC potential can be adjusted to change the resultant DBD jet
angle [167, 168]. Thus, the sliding DBD actuator can generate strong aerodynamic effects in the
three-dimensional space above the actuator. When the DC potential is positive, the discharge is
similar to DBD [167]. The performance of the sliding DBD actuator increases with positive voltage
compared to traditional DBD, without a noticeable power increase [165]. The increase in the
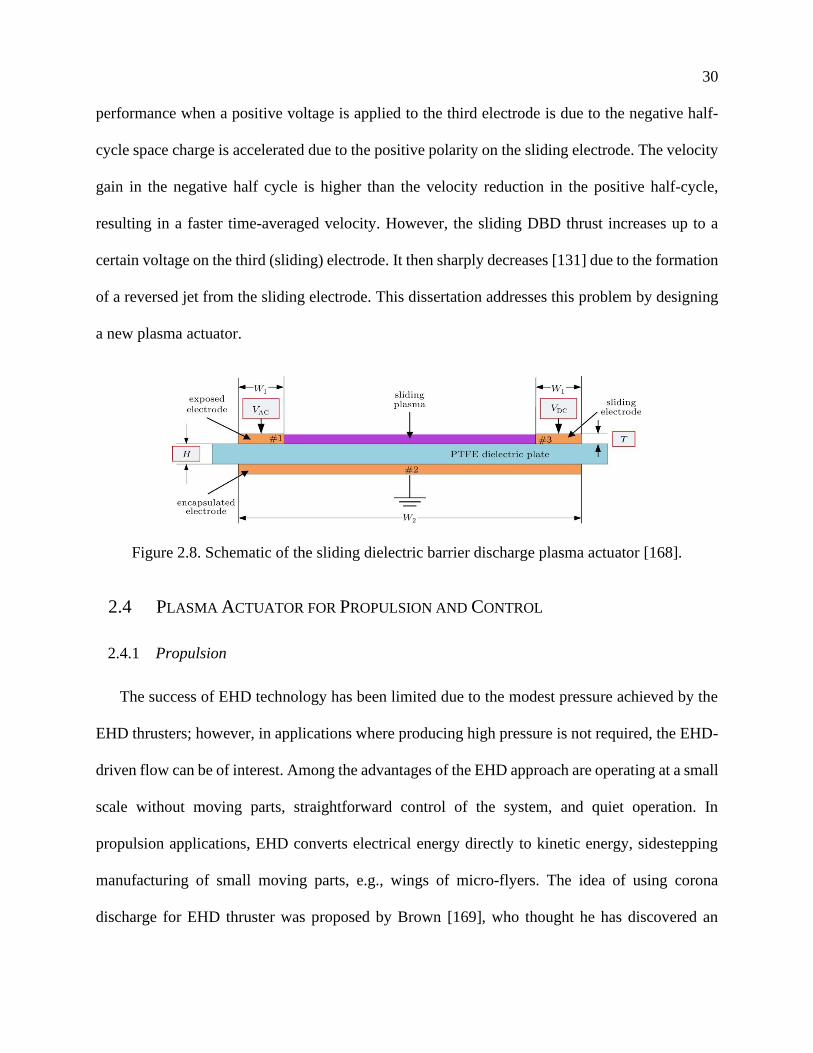
30
performance when a positive voltage is applied to the third electrode is due to the negative half-
cycle space charge is accelerated due to the positive polarity on the sliding electrode. The velocity
gain in the negative half cycle is higher than the velocity reduction in the positive half-cycle,
resulting in a faster time-averaged velocity. However, the sliding DBD thrust increases up to a
certain voltage on the third (sliding) electrode. It then sharply decreases [131] due to the formation
of a reversed jet from the sliding electrode. This dissertation addresses this problem by designing
a new plasma actuator.
Figure 2.8. Schematic of the sliding dielectric barrier discharge plasma actuator [168].
2.4 PLASMA ACTUATOR FOR PROPULSION AND CONTROL
2.4.1 Propulsion
The success of EHD technology has been limited due to the modest pressure achieved by the
EHD thrusters; however, in applications where producing high pressure is not required, the EHD-
driven flow can be of interest. Among the advantages of the EHD approach are operating at a small
scale without moving parts, straightforward control of the system, and quiet operation. In
propulsion applications, EHD converts electrical energy directly to kinetic energy, sidestepping
manufacturing of small moving parts, e.g., wings of micro-flyers. The idea of using corona
discharge for EHD thruster was proposed by Brown [169], who thought he has discovered an
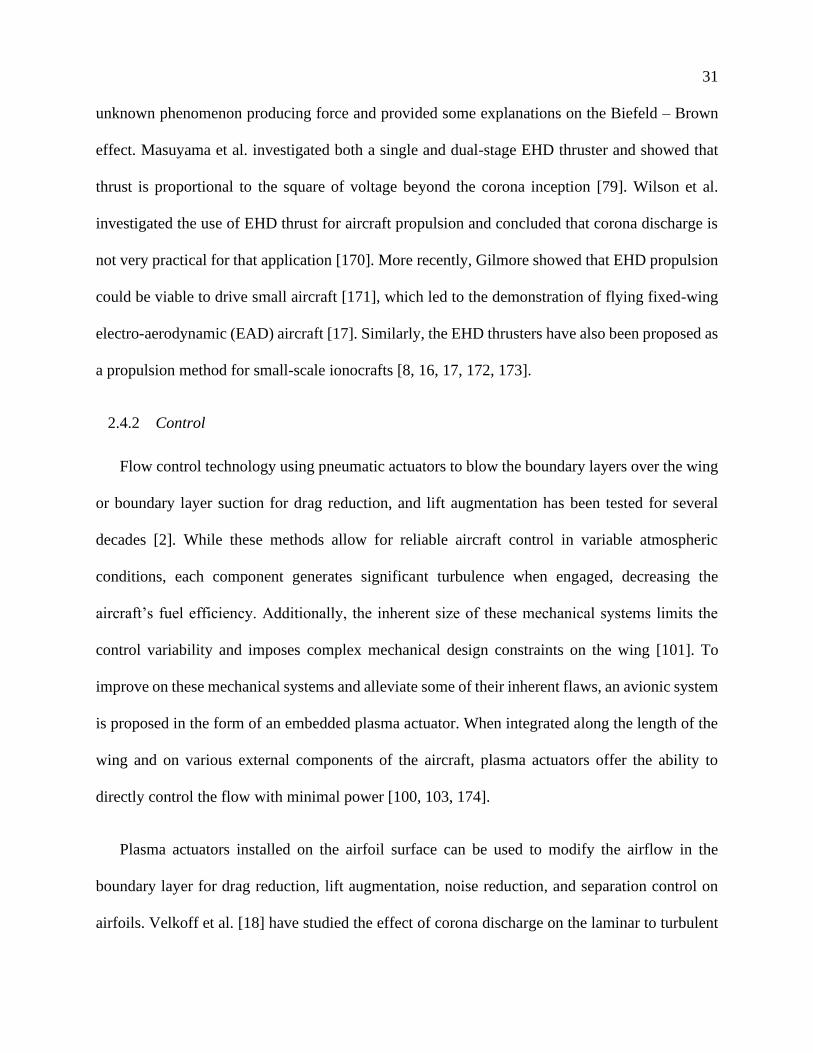
31
unknown phenomenon producing force and provided some explanations on the Biefeld – Brown
effect. Masuyama et al. investigated both a single and dual-stage EHD thruster and showed that
thrust is proportional to the square of voltage beyond the corona inception [79]. Wilson et al.
investigated the use of EHD thrust for aircraft propulsion and concluded that corona discharge is
not very practical for that application [170]. More recently, Gilmore showed that EHD propulsion
could be viable to drive small aircraft [171], which led to the demonstration of flying fixed-wing
electro-aerodynamic (EAD) aircraft [17]. Similarly, the EHD thrusters have also been proposed as
a propulsion method for small-scale ionocrafts [8, 16, 17, 172, 173].
2.4.2 Control
Flow control technology using pneumatic actuators to blow the boundary layers over the wing
or boundary layer suction for drag reduction, and lift augmentation has been tested for several
decades [2]. While these methods allow for reliable aircraft control in variable atmospheric
conditions, each component generates significant turbulence when engaged, decreasing the
aircraft’s fuel efficiency. Additionally, the inherent size of these mechanical systems limits the
control variability and imposes complex mechanical design constraints on the wing [101]. To
improve on these mechanical systems and alleviate some of their inherent flaws, an avionic system
is proposed in the form of an embedded plasma actuator. When integrated along the length of the
wing and on various external components of the aircraft, plasma actuators offer the ability to
directly control the flow with minimal power [100, 103, 174].
Plasma actuators installed on the airfoil surface can be used to modify the airflow in the
boundary layer for drag reduction, lift augmentation, noise reduction, and separation control on
airfoils. Velkoff et al. [18] have studied the effect of corona discharge on the laminar to turbulent
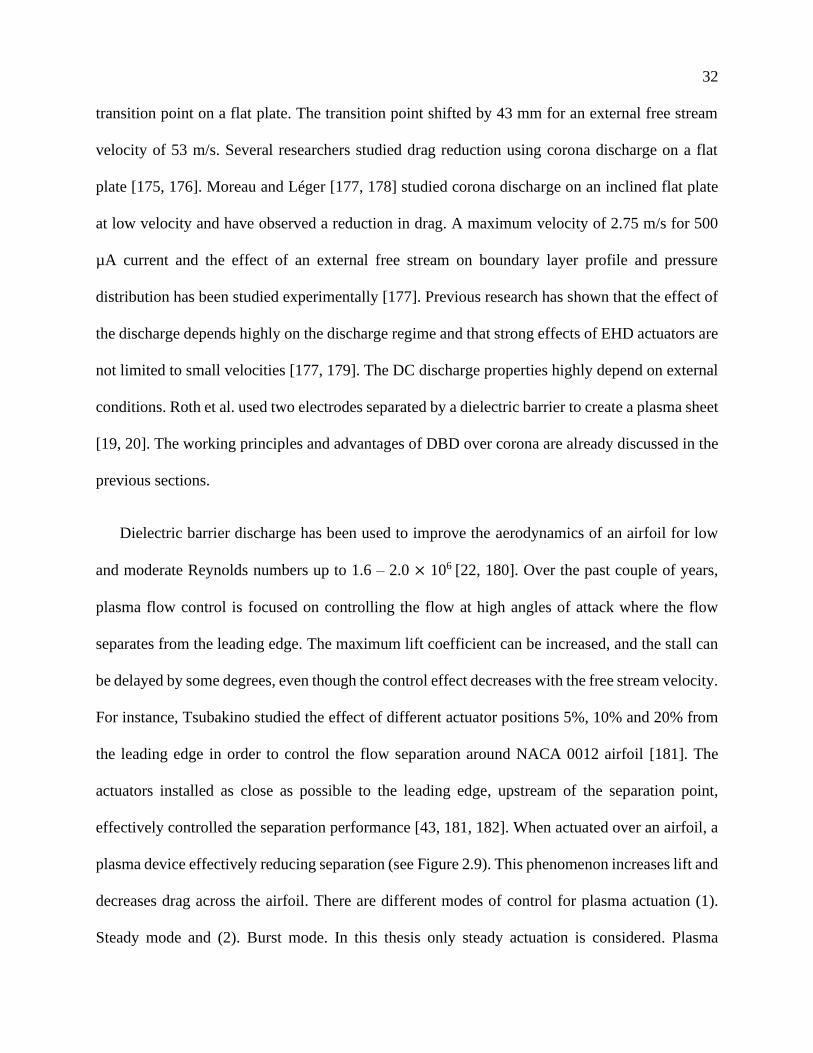
32
transition point on a flat plate. The transition point shifted by 43 mm for an external free stream
velocity of 53 m/s. Several researchers studied drag reduction using corona discharge on a flat
plate [175, 176]. Moreau and Léger [177, 178] studied corona discharge on an inclined flat plate
at low velocity and have observed a reduction in drag. A maximum velocity of 2.75 m/s for 500
µA current and the effect of an external free stream on boundary layer profile and pressure
distribution has been studied experimentally [177]. Previous research has shown that the effect of
the discharge depends highly on the discharge regime and that strong effects of EHD actuators are
not limited to small velocities [177, 179]. The DC discharge properties highly depend on external
conditions. Roth et al. used two electrodes separated by a dielectric barrier to create a plasma sheet
[19, 20]. The working principles and advantages of DBD over corona are already discussed in the
previous sections.
Dielectric barrier discharge has been used to improve the aerodynamics of an airfoil for low
and moderate Reynolds numbers up to 1.6 – 2.0 × 10⁶ [22, 180]. Over the past couple of years,
plasma flow control is focused on controlling the flow at high angles of attack where the flow
separates from the leading edge. The maximum lift coefficient can be increased, and the stall can
be delayed by some degrees, even though the control effect decreases with the free stream velocity.
For instance, Tsubakino studied the effect of different actuator positions 5%, 10% and 20% from
the leading edge in order to control the flow separation around NACA 0012 airfoil [181]. The
actuators installed as close as possible to the leading edge, upstream of the separation point,
effectively controlled the separation performance [43, 181, 182]. When actuated over an airfoil, a
plasma device effectively reducing separation (see Figure 2.9). This phenomenon increases lift and
decreases drag across the airfoil. There are different modes of control for plasma actuation (1).
Steady mode and (2). Burst mode. In this thesis only steady actuation is considered. Plasma
33
actuators installed on different geometries like rounded trailing edge [39], a gurney flap [38, 40],
or on a delta wing [183] have been shown to increase the lift and pitching moment on the airfoil.
DBD actuators are tested on other geometries like a backward-facing step for turbulent flow [184,
185], vehicle model for drag reduction [186], cylinders for drag reduction, and noise reduction
[187]. Most of the past work on the use of plasma actuator as a flow control device has focused on
separation control and lift augmentation on two-dimensional geometries. This dissertation
explores the feasibility of using plasma actuator for flow control at low angles of attack.
Figure 2.9. The effect of DBD over an airfoil and flow reattachment on a NACA 0015 airfoil when
the plasma actuator is on [100].
2.5 CHAPTER SUMMARY
The field of electrohydrodynamic flow has been studied extensively for the past four decades
for a wide variety of uses, with a small subset of those focused on EHD driven airflow. In that
time, a fundamental understanding of the underlying physics has been developed. However, most
of the efforts in analyzing the EHD driven flow still use guessed parameters for analytical and
numerical models, rather than focused research efforts in developing analytical models from first
principles and empirical models from experiments that can help build the EHD aircraft concept.
34
There are currently no analytical/empirical models that can predict the thrust, discharge
characteristics of the plasma actuator.
The area of propulsion and control with plasma actuation received little attention or
development before the last two decades, with most of the documented work occurring in the last
decade. Most of the flow control with plasma actuators has focused on separation, lift
augmentation, and drag reduction at high angles of attack, which will be helpful only in landing
and take-off of aerial vehicles. A relatively little attention has been given to thrust generation and
application of plasma at low angles of attack that can be used for cruise control for UAVs.
With no apparent methodology for model development and control of aerial vehicles at cruise
conditions, there is an opportunity for novel solutions using plasma actuators.
35
Chapter 3. ELECTROHYDRODYNAMIC FLOW IN A POINT TO
RING CORONA DISCHARGE
This work is published in Physics of Plasma [6] and Physical Review Fluids [7]. The CFD
simulations and analytical model are developed by Dr. Yifei Guan [188], and the analytical model
and CFD computation results are presented here for completeness.
In this chapter, an electrohydrodynamic (EHD) flow in an axisymmetric point-to-ring
configuration is investigated experimentally. The electrical current associated with the corona
discharge and the velocity induced by ions is studied over a range of input parameters as corona
voltage and distance between anode and cathode. The corona current is measured on the anode,
and the velocity profile is characterized using hotwire anemometry. The maximum flow velocity
is at the centerline, and it decays rapidly with the radial distance due to the viscous and electric
forces acting on the partially ionized gas. The electric to kinetic energy transfer efficiency is
evaluated for the experiments.
3.1 EXPERIMENTAL SETUP
The EHD flow is studied in a point-to-ring internal pipe geometry. Figure 3.1 shows the
experimental setup. The apparatus consists of a high-voltage corona needle and a grounded ring
electrode. The anode needle is a 0.5-mm-thick tungsten needle with a radius of curvature of 1 μm
at the tip (measured using optical microscopy). The needle's sharpness is essential because it
affects the corona discharge at lower voltages [189]. The tip of the needle is checked regularly for
visible defects to ensure that it does not degrade over time. The ground electrode is a 1.58-mm-
thick solid solder with an inner radius of 10 mm. The enclosure is fabricated using 3D printing in
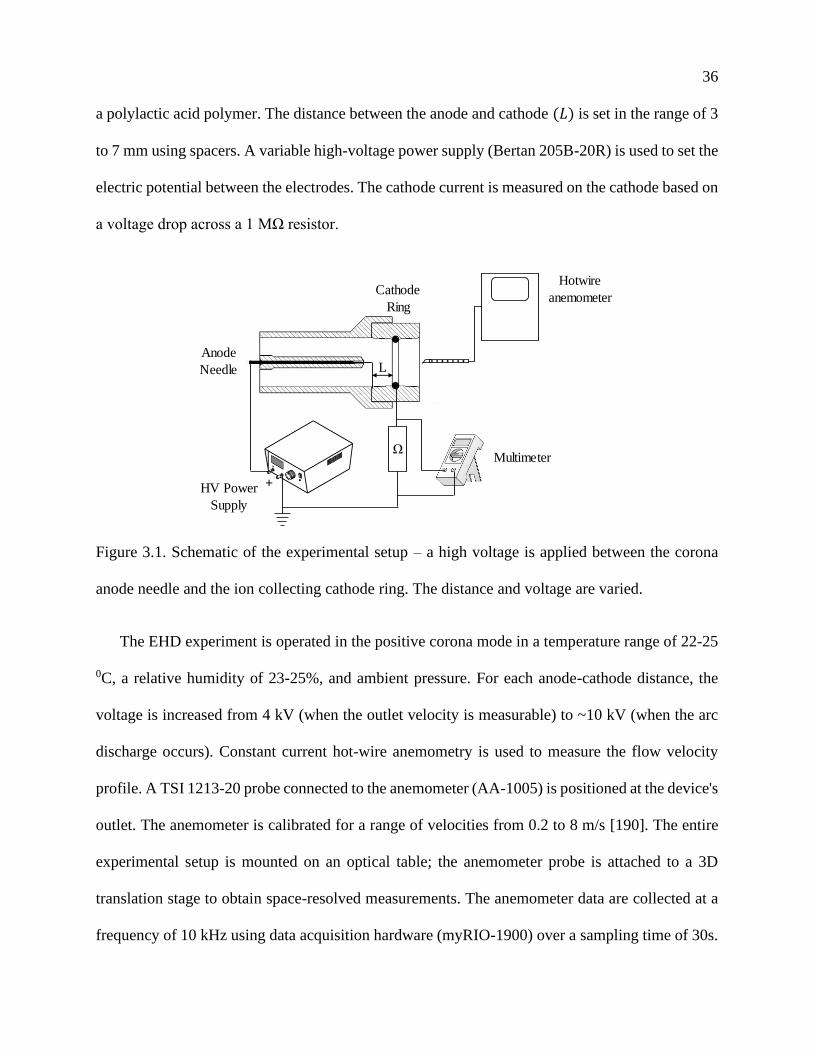
36
a polylactic acid polymer. The distance between the anode and cathode (𝐿) is set in the range of 3
to 7 mm using spacers. A variable high-voltage power supply (Bertan 205B-20R) is used to set the
electric potential between the electrodes. The cathode current is measured on the cathode based on
a voltage drop across a 1 MΩ resistor.
Figure 3.1. Schematic of the experimental setup – a high voltage is applied between the corona
anode needle and the ion collecting cathode ring. The distance and voltage are varied.
The EHD experiment is operated in the positive corona mode in a temperature range of 22-25
0C, a relative humidity of 23-25%, and ambient pressure. For each anode-cathode distance, the
voltage is increased from 4 kV (when the outlet velocity is measurable) to ~10 kV (when the arc
discharge occurs). Constant current hot-wire anemometry is used to measure the flow velocity
profile. A TSI 1213-20 probe connected to the anemometer (AA-1005) is positioned at the device's
outlet. The anemometer is calibrated for a range of velocities from 0.2 to 8 m/s [190]. The entire
experimental setup is mounted on an optical table; the anemometer probe is attached to a 3D
translation stage to obtain space-resolved measurements. The anemometer data are collected at a
frequency of 10 kHz using data acquisition hardware (myRIO-1900) over a sampling time of 30s.
Ω
L
Hotwire
anemometer
Multimeter
HV Power
Supply
Anode
Needle
Cathode
Ring
+
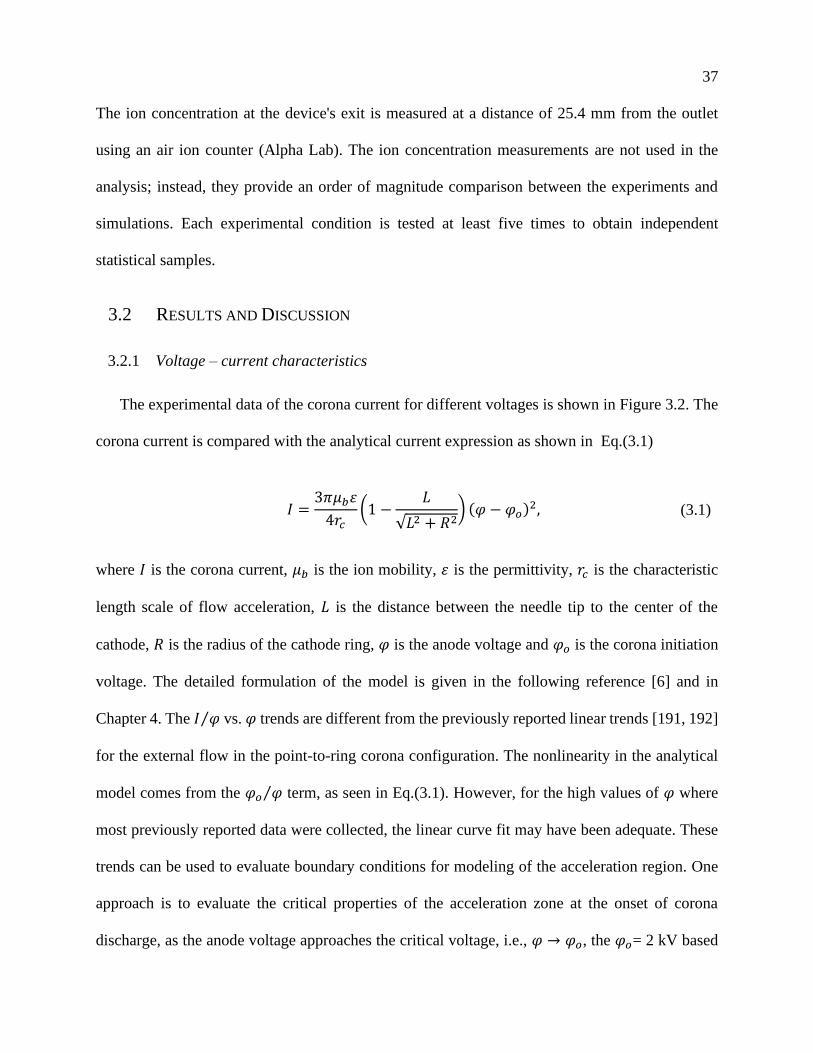
37
The ion concentration at the device's exit is measured at a distance of 25.4 mm from the outlet
using an air ion counter (Alpha Lab). The ion concentration measurements are not used in the
analysis; instead, they provide an order of magnitude comparison between the experiments and
simulations. Each experimental condition is tested at least five times to obtain independent
statistical samples.
3.2 RESULTS AND DISCUSSION
3.2.1 Voltage – current characteristics
The experimental data of the corona current for different voltages is shown in Figure 3.2. The
corona current is compared with the analytical current expression as shown in Eq.(3.1)
𝐼 =3𝜋𝜇𝑏휀
4𝑟𝑐(1 −
𝐿
√𝐿2 + 𝑅2) (𝜑 − 𝜑𝑜)2, (3.1)
where 𝐼 is the corona current, 𝜇𝑏 is the ion mobility, 휀 is the permittivity, 𝑟𝑐 is the characteristic
length scale of flow acceleration, 𝐿 is the distance between the needle tip to the center of the
cathode, 𝑅 is the radius of the cathode ring, 𝜑 is the anode voltage and 𝜑𝑜 is the corona initiation
voltage. The detailed formulation of the model is given in the following reference [6] and in
Chapter 4. The 𝐼 𝜑⁄ vs. 𝜑 trends are different from the previously reported linear trends [191, 192]
for the external flow in the point-to-ring corona configuration. The nonlinearity in the analytical
model comes from the 𝜑𝑜 𝜑⁄ term, as seen in Eq.(3.1). However, for the high values of 𝜑 where
most previously reported data were collected, the linear curve fit may have been adequate. These
trends can be used to evaluate boundary conditions for modeling of the acceleration region. One
approach is to evaluate the critical properties of the acceleration zone at the onset of corona
discharge, as the anode voltage approaches the critical voltage, i.e., 𝜑 → 𝜑𝑜, the 𝜑𝑜= 2 kV based
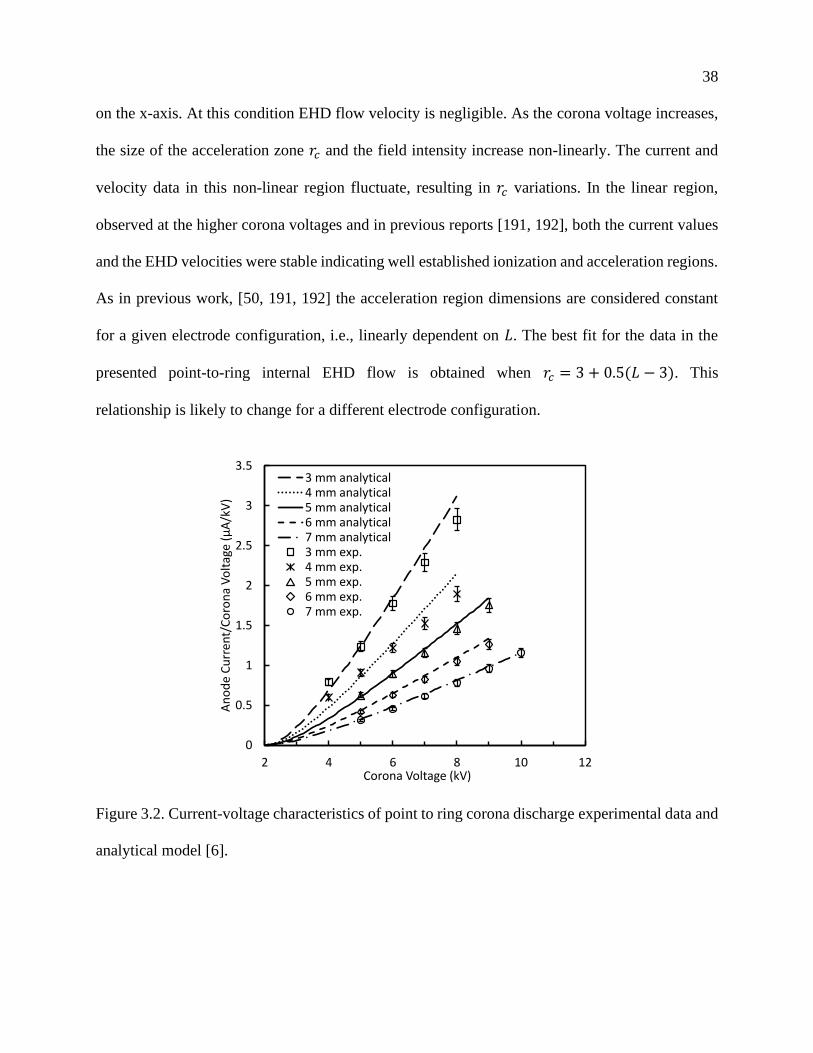
38
on the x-axis. At this condition EHD flow velocity is negligible. As the corona voltage increases,
the size of the acceleration zone 𝑟𝑐 and the field intensity increase non-linearly. The current and
velocity data in this non-linear region fluctuate, resulting in 𝑟𝑐 variations. In the linear region,
observed at the higher corona voltages and in previous reports [191, 192], both the current values
and the EHD velocities were stable indicating well established ionization and acceleration regions.
As in previous work, [50, 191, 192] the acceleration region dimensions are considered constant
for a given electrode configuration, i.e., linearly dependent on 𝐿. The best fit for the data in the
presented point-to-ring internal EHD flow is obtained when 𝑟𝑐 = 3 + 0.5(𝐿 − 3). This
relationship is likely to change for a different electrode configuration.
Figure 3.2. Current-voltage characteristics of point to ring corona discharge experimental data and
analytical model [6].
0
0.5
1
1.5
2
2.5
3
3.5
2 4 6 8 10 12
An
od
e C
urr
ent/
Co
ron
a V
olt
age
(μA
/kV
)
Corona Voltage (kV)
3 mm analytical4 mm analytical5 mm analytical6 mm analytical7 mm analytical3 mm exp.4 mm exp.5 mm exp.6 mm exp.7 mm exp.
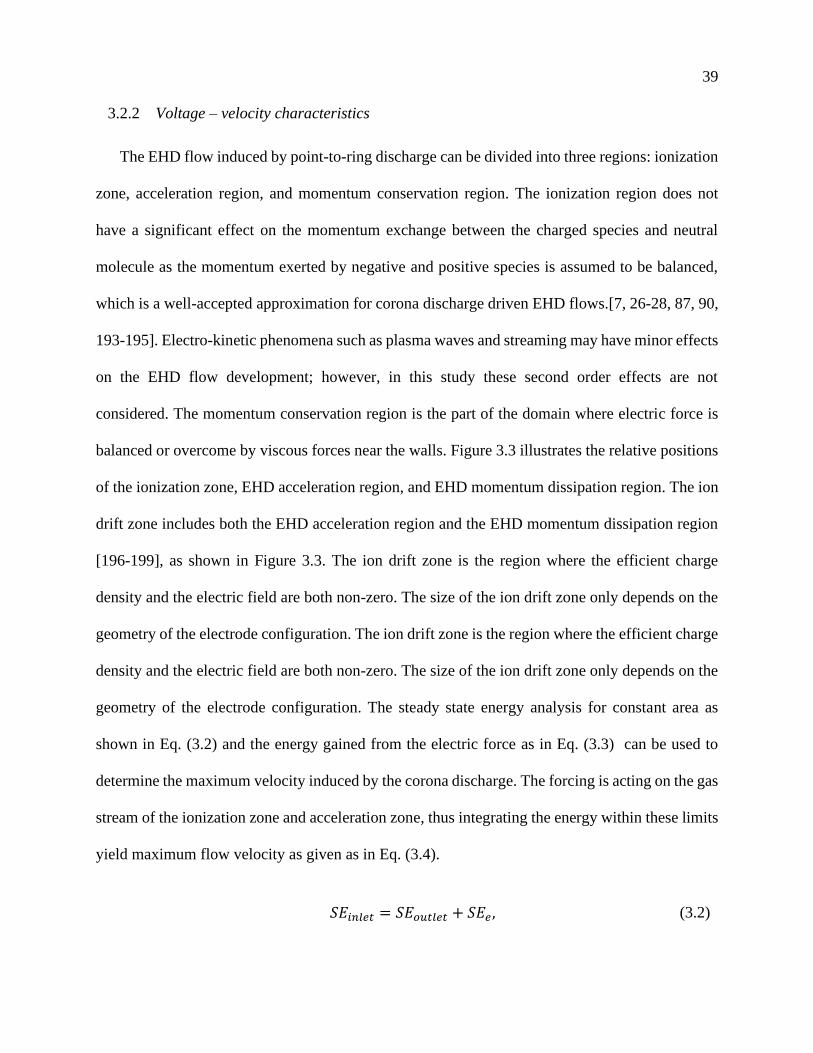
39
3.2.2 Voltage – velocity characteristics
The EHD flow induced by point-to-ring discharge can be divided into three regions: ionization
zone, acceleration region, and momentum conservation region. The ionization region does not
have a significant effect on the momentum exchange between the charged species and neutral
molecule as the momentum exerted by negative and positive species is assumed to be balanced,
which is a well-accepted approximation for corona discharge driven EHD flows.[7, 26-28, 87, 90,
193-195]. Electro-kinetic phenomena such as plasma waves and streaming may have minor effects
on the EHD flow development; however, in this study these second order effects are not
considered. The momentum conservation region is the part of the domain where electric force is
balanced or overcome by viscous forces near the walls. Figure 3.3 illustrates the relative positions
of the ionization zone, EHD acceleration region, and EHD momentum dissipation region. The ion
drift zone includes both the EHD acceleration region and the EHD momentum dissipation region
[196-199], as shown in Figure 3.3. The ion drift zone is the region where the efficient charge
density and the electric field are both non-zero. The size of the ion drift zone only depends on the
geometry of the electrode configuration. The ion drift zone is the region where the efficient charge
density and the electric field are both non-zero. The size of the ion drift zone only depends on the
geometry of the electrode configuration. The steady state energy analysis for constant area as
shown in Eq. (3.2) and the energy gained from the electric force as in Eq. (3.3) can be used to
determine the maximum velocity induced by the corona discharge. The forcing is acting on the gas
stream of the ionization zone and acceleration zone, thus integrating the energy within these limits
yield maximum flow velocity as given as in Eq. (3.4).
𝑆𝐸𝑖𝑛𝑙𝑒𝑡 = 𝑆𝐸𝑜𝑢𝑡𝑙𝑒𝑡 + 𝑆𝐸𝑒 , (3.2)
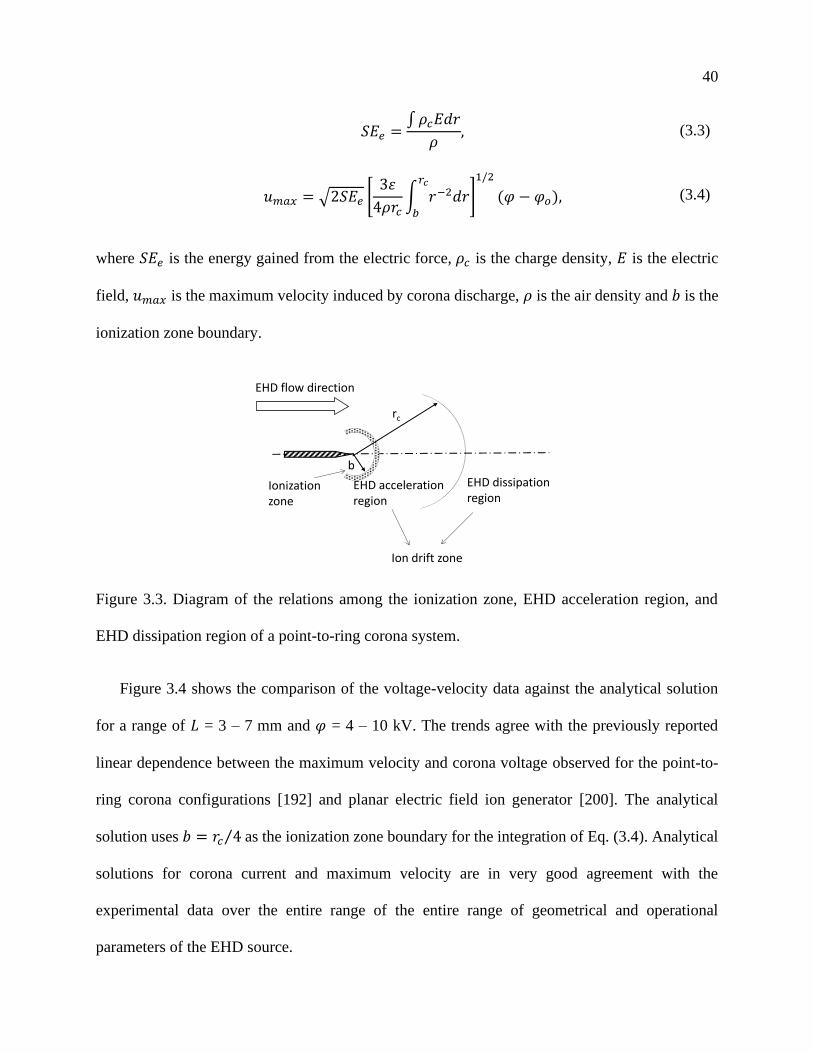
40
𝑆𝐸𝑒 =∫ 𝜌𝑐𝐸𝑑𝑟
𝜌, (3.3)
𝑢𝑚𝑎𝑥 = √2𝑆𝐸𝑒 [3휀
4𝜌𝑟𝑐∫ 𝑟−2𝑑𝑟
𝑟𝑐
𝑏
]
1/2
(𝜑 − 𝜑𝑜), (3.4)
where 𝑆𝐸𝑒 is the energy gained from the electric force, 𝜌𝑐 is the charge density, 𝐸 is the electric
field, 𝑢𝑚𝑎𝑥 is the maximum velocity induced by corona discharge, 𝜌 is the air density and 𝑏 is the
ionization zone boundary.
Figure 3.3. Diagram of the relations among the ionization zone, EHD acceleration region, and
EHD dissipation region of a point-to-ring corona system.
Figure 3.4 shows the comparison of the voltage-velocity data against the analytical solution
for a range of 𝐿 = 3 – 7 mm and 𝜑 = 4 – 10 kV. The trends agree with the previously reported
linear dependence between the maximum velocity and corona voltage observed for the point-to-
ring corona configurations [192] and planar electric field ion generator [200]. The analytical
solution uses 𝑏 = 𝑟𝑐 4⁄ as the ionization zone boundary for the integration of Eq. (3.4). Analytical
solutions for corona current and maximum velocity are in very good agreement with the
experimental data over the entire range of the entire range of geometrical and operational
parameters of the EHD source.
Ionization zone
b
rc
EHD acceleration region
EHD dissipation region
EHD flow direction
Ion drift zone
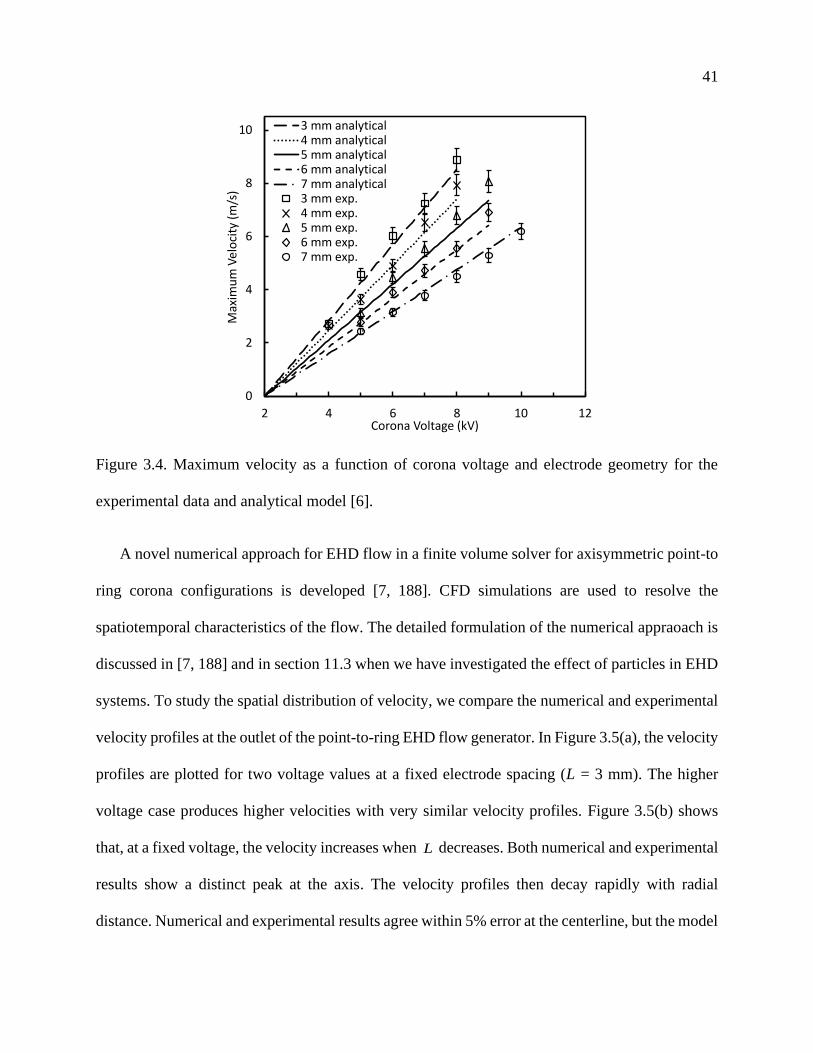
41
Figure 3.4. Maximum velocity as a function of corona voltage and electrode geometry for the
experimental data and analytical model [6].
A novel numerical approach for EHD flow in a finite volume solver for axisymmetric point-to
ring corona configurations is developed [7, 188]. CFD simulations are used to resolve the
spatiotemporal characteristics of the flow. The detailed formulation of the numerical appraoach is
discussed in [7, 188] and in section 11.3 when we have investigated the effect of particles in EHD
systems. To study the spatial distribution of velocity, we compare the numerical and experimental
velocity profiles at the outlet of the point-to-ring EHD flow generator. In Figure 3.5(a), the velocity
profiles are plotted for two voltage values at a fixed electrode spacing (L = 3 mm). The higher
voltage case produces higher velocities with very similar velocity profiles. Figure 3.5(b) shows
that, at a fixed voltage, the velocity increases when L decreases. Both numerical and experimental
results show a distinct peak at the axis. The velocity profiles then decay rapidly with radial
distance. Numerical and experimental results agree within 5% error at the centerline, but the model
0
2
4
6
8
10
2 4 6 8 10 12
Max
imu
m V
elo
city
(m
/s)
Corona Voltage (kV)
3 mm analytical4 mm analytical5 mm analytical6 mm analytical7 mm analytical3 mm exp.4 mm exp.5 mm exp.6 mm exp.7 mm exp.
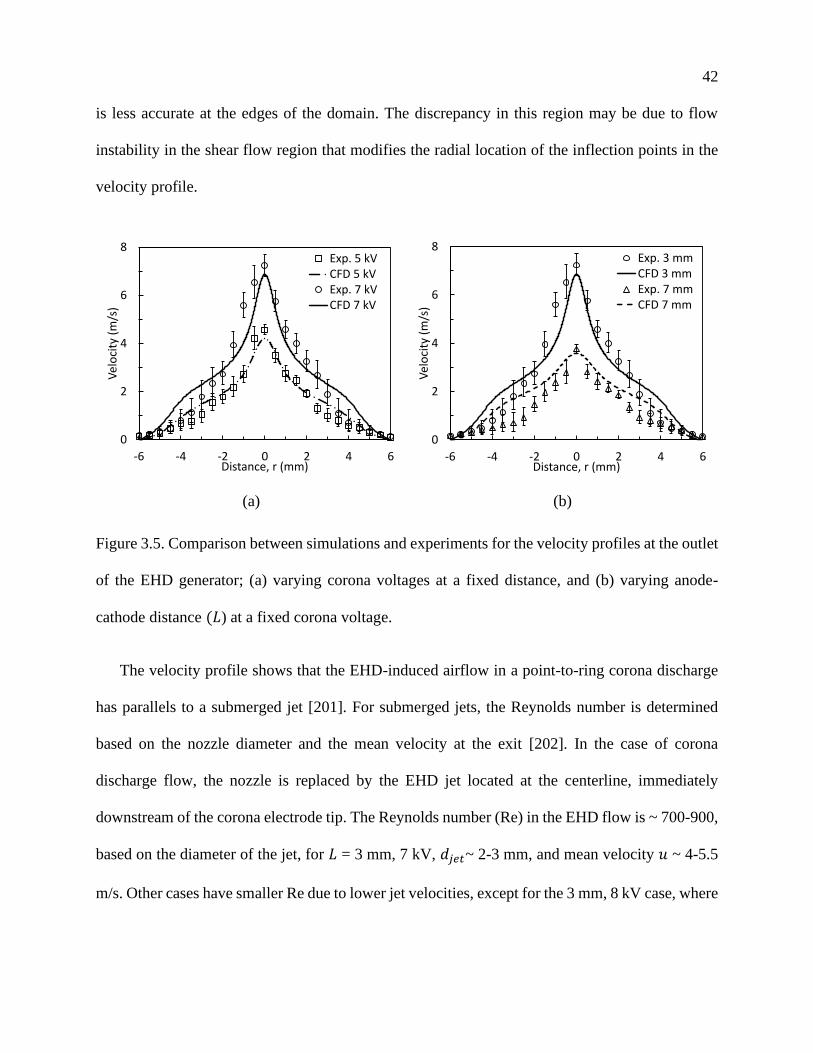
42
is less accurate at the edges of the domain. The discrepancy in this region may be due to flow
instability in the shear flow region that modifies the radial location of the inflection points in the
velocity profile.
(a) (b)
Figure 3.5. Comparison between simulations and experiments for the velocity profiles at the outlet
of the EHD generator; (a) varying corona voltages at a fixed distance, and (b) varying anode-
cathode distance (𝐿) at a fixed corona voltage.
The velocity profile shows that the EHD-induced airflow in a point-to-ring corona discharge
has parallels to a submerged jet [201]. For submerged jets, the Reynolds number is determined
based on the nozzle diameter and the mean velocity at the exit [202]. In the case of corona
discharge flow, the nozzle is replaced by the EHD jet located at the centerline, immediately
downstream of the corona electrode tip. The Reynolds number (Re) in the EHD flow is ~ 700-900,
based on the diameter of the jet, for 𝐿 = 3 mm, 7 kV, 𝑑𝑗𝑒𝑡~ 2-3 mm, and mean velocity 𝑢 ~ 4-5.5
m/s. Other cases have smaller Re due to lower jet velocities, except for the 3 mm, 8 kV case, where
0
2
4
6
8
-6 -4 -2 0 2 4 6
Vel
oci
ty (
m/s
)
Distance, r (mm)
Exp. 5 kVCFD 5 kVExp. 7 kVCFD 7 kV
0
2
4
6
8
-6 -4 -2 0 2 4 6
Vel
oci
ty (
m/s
)
Distance, r (mm)
Exp. 3 mmCFD 3 mmExp. 7 mmCFD 7 mm
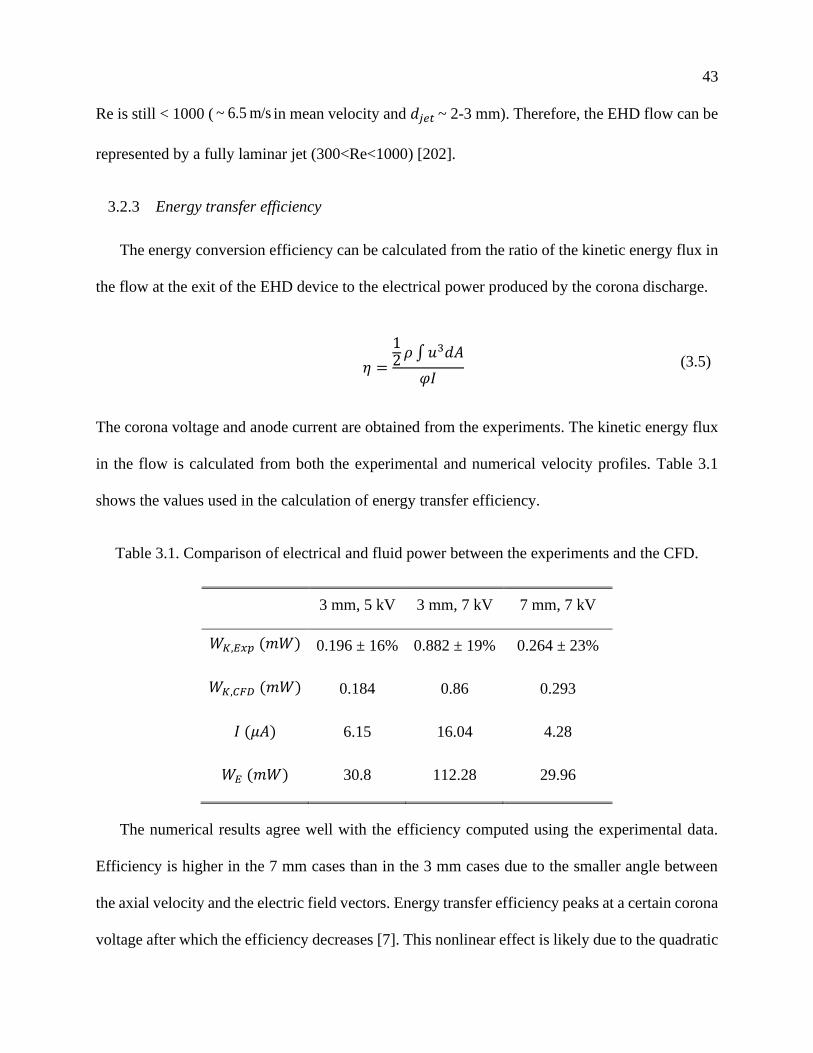
43
Re is still < 1000 ( ~ 6.5 m/s in mean velocity and 𝑑𝑗𝑒𝑡 ~ 2-3 mm). Therefore, the EHD flow can be
represented by a fully laminar jet (300<Re<1000) [202].
3.2.3 Energy transfer efficiency
The energy conversion efficiency can be calculated from the ratio of the kinetic energy flux in
the flow at the exit of the EHD device to the electrical power produced by the corona discharge.
𝜂 =
12 𝜌 ∫ 𝑢3𝑑𝐴
𝜑𝐼 (3.5)
The corona voltage and anode current are obtained from the experiments. The kinetic energy flux
in the flow is calculated from both the experimental and numerical velocity profiles. Table 3.1
shows the values used in the calculation of energy transfer efficiency.
Table 3.1. Comparison of electrical and fluid power between the experiments and the CFD.
3 mm, 5 kV 3 mm, 7 kV 7 mm, 7 kV
𝑊𝐾,𝐸𝑥𝑝 (𝑚𝑊) 0.196 ± 16% 0.882 ± 19% 0.264 ± 23%
𝑊𝐾,𝐶𝐹𝐷 (𝑚𝑊) 0.184 0.86 0.293
𝐼 (𝜇𝐴) 6.15 16.04 4.28
𝑊𝐸 (𝑚𝑊) 30.8 112.28 29.96
The numerical results agree well with the efficiency computed using the experimental data.
Efficiency is higher in the 7 mm cases than in the 3 mm cases due to the smaller angle between
the axial velocity and the electric field vectors. Energy transfer efficiency peaks at a certain corona
voltage after which the efficiency decreases [7]. This nonlinear effect is likely due to the quadratic
44
relationship between the corona voltage and anode current. The increase in corona voltage results
in a quadratic increase in the anode current and a cubic increase in the electric power 𝜑𝐼 ∝ 𝜑3.
Maximum velocity at the centerline is linearly proportional to the corona voltage based on the Eq.
Eq. (3.4) and previously reported experimental observations, but the kinetic power 1
2𝜌 ∫ 𝑢3𝑑𝐴 is
not proportional to 𝜑3 because 𝑢 is not proportional to 𝜑 anywhere but on the centerline. At the
high values of the corona voltage, the field lines also diverge due to the high space at the corona
needle resulting in a negative work of the electric field.
3.3 CHAPTER SUMMARY
This work presents an experimental investigation of corona discharge-driven flow. The
experimental data for flow in the point–to-ring internal geometry includes voltage, current, and
velocity profile measurements. The experimental corona current is compared with the relationship
found by analytical derivation. The model agrees within ~10% of the experimental measurements
in the point-to-ring configuration. The conductance term 𝐼 𝜑⁄ has a nonlinear relationship with the
corona voltage 𝜑 for low electric field values. The linear trends described in the literature hold for
higher corona voltages. The analytical model captures the linearity of the EHD flow velocity with
the corona voltage, as shown in the experimental data for the maximum velocity presented here
and elsewhere. The maximum velocity is located at the centerline in this configuration. Unlike in
canonical internal pipe flow, the velocity profile in the point-to-ring EHD flow is analogous to a
submerged jet [201], for which the Re is determined by the dimension of the acceleration zone and
mean velocity. Jet values of Re 300 1000= − correspond to the laminar regime in the flow
acceleration region [202]. The exit velocity profile is used to calculate the electric to kinetic energy
transfer efficiency. The efficiency is highest when the point-to-ring distance is largest, due to a
45
smaller angle between the electric field gradient and the flow direction and to the lower viscous
losses. The efficiency peaks at intermediate corona voltages, for a given electrode distance, due to
the quadratic current-voltage relation and the nonlinear decrease of velocity away from the
centerline, as well as the field line distortions caused by space charge effect near the ionization
region.
46
Chapter 4. ANALYTICAL MODEL FOR
ELECTROHYDRODYNAMIC THRUST
This analytical model is published in Proceedings of Royal Society A: Mathematical, Physical
and Engineering Sciences [5].
In this chapter, we extend the analytical model for EHD flow [6] to formulate the expression
for EHD thrust in 1-dimensional planar coordinates. The electric current density derived from the
model is presented in the form of Mott-Gurney law. After the correction for the drag force, the
EHD thrust model yields good agreement with the experimental data from three independent
experimental studies, including our experiments and the previously published data [78, 79]. The
EHD thrust expression derived from the first principles can be used in the design of propulsion
systems and can be readily implemented in numerical simulations.
4.1 ANALYTICAL MODEL DEVELOPMENT
Corona discharge generates a flow of charged species, and the assessment of the charge
densities and the electric field is essential for the evaluation of the EHD force acting on the fluid.
The charged species are generated in the region where the field strength exceeds the threshold for
the breakdown of molecules in the fluid. For a wire-to-rod corona discharge, shown in Figure 4.1,
ionization occurs near the wire. As the electric field strength decreases away from the emitter
electrode, the ionization is hindered; however, the charged species moving in the inner electrode
transfer their momentum to neutral molecules via elastic collisions. The charged species
concentration in corona discharge can be calculated using the charge continuity equation,
considering that three types of charged species are present positive ions, negative ions, and
47
electrons. The density 𝑁𝑘 of the charged species 𝑘 is described by the conservation equation [6,
196]
𝜕𝑁𝑘
𝜕𝑡+ ∇ ∙ [(𝐮 + 𝜇𝑏𝐄)𝑁𝑘 − 𝐷𝑒∇𝑁𝑘] = 𝜔𝑘 , (4.1)
where 𝐮 is the velocity vector of the bulk flow, 𝐄 is the electric field, 𝜇𝑘 is the ion mobility of
charged species 𝑘, and 𝐷𝑘 is the ion diffusivity of the charged species and 𝜔𝑘 is the production
rate of species 𝑘. The ionization can be conceptualized as a combination of two processes (1)
ionization process of charged species generation and (2) recombination process where charges
recombine. Transport of charged species in the field, their capture by the emitter electrode or
ejection from the ionization region can aid or hinder the specific reaction in the plasma volume.
One can avoid complex plasma chemistry considerations in the analysis of corona-induced EHD
in air by making two key assumptions. (i) The ionization occurs only in the region when the electric
field strength is greater than a threshold value ~3𝐸 + 06 𝑉/𝑚 [55]. (ii) The total momentum
transferred to the neutral gas molecules in the ionization region is negligible compared to the ion
drift region as shown in Figure 4.1. In the ionization region, the momentum transfer is partially
offset by the positive and negative species traveling in opposite directions and by a relatively small
volume of the ionization region compared to the ion drift region. We assume that the momentum
injection takes place in the ion drift region, where the net charge density is given by ∑ 𝑁𝑘 =𝑘 𝜌𝑒.
With these two assumptions, the reduced charge continuity equation can be written as
𝜕𝜌𝑒
𝜕𝑡+ ∇ ∙ [(𝐮 + 𝜇𝑏𝐄)𝜌𝑒 − 𝐷𝑒∇𝜌𝑒] = 0 , (4.2)
48
where 𝜌𝑒 is the charge density, 𝜇𝑏 is the ion mobility and is approximated as a constant
2.0 × 10⁻⁴ 𝑚2 𝑉 ∙ 𝑠⁄ [7, 90], and 𝐷𝑒 is the ion diffusivity and can be determined using the
electrical mobility equation.
𝐷𝑒 =
𝜇𝑏𝑘𝐵𝑇𝑒
𝑞 ,
(4.3)
where 𝑘𝐵 is the Boltzmann constant, 𝑇𝑒 is the absolute temperature, and 𝑞 is the elementary charge.
The analytical expressions for (𝜑 − 𝐼) and (𝜑 − 𝑇) can be derived for steady-state conditions in
planar coordinates from the simplified governing for charge density, Eq.(4.2).
Since the ion drift velocity is considerably higher than the EHD-induced bulk flow, the ion
motion is assumed to be quasi-steady, and the Eq. (4.2) can be rewritten as
∇ ∙ [(𝐮 + 𝜇𝑏𝐄)𝜌𝑒 − 𝐷𝑒∇𝜌𝑒] = 0 , (4.4)
The forcing on the ions due to the electric field set up by potential between the electrodes is
significantly greater, the space charge diffusion has not been typically considered [55]
𝐮 + 𝜇𝑏𝐄
𝐷𝑒~𝑂(104). (4.5)
The diffusion term can be neglected, and Eq (4.4) can be further reduced
∇ ∙ [(𝐮 + 𝜇𝑏𝐄)𝜌𝑒] = 0. (4.6)
49
Guan et al. [7] have shown that space charge density influences the electric field lines (and
thus the ion drift direction) in the vicinity of the ionization region for geometries with high angles
(>45⁰) between the bulk flow direction and the line connecting anode and cathode in a point-to-
ring geometry. In the geometry where the flow direction is aligned with electrode geometry, the
space charge effect is significantly lower, and for the purpose of this derivation, is not considered.
The electro-convective velocity due to external flow is negligible compared to the drift velocity
(|𝐮|
|𝜇𝑏𝐄|= 𝑂(10−2)) in air discharge [55]. The continuity equation can be reduced to
∇ ∙ [𝜇𝑏𝜌𝑒𝐄] = 0, (4.7)
where 𝜇𝑏𝜌𝑒𝐄 = 𝐉 is the current flux. The electric field satisfies Gauss's law
∇ ∙ 𝐄 =
𝜌𝑒
휀 , (4.8)
where 휀 is the permittivity, and for air, it is close to the permittivity of the space. Combining with
Eq.(4.8), the ion transport equation can be written as
𝜇𝑏
휀𝜌𝑒
2 − 𝜇𝑏∇𝜌𝑒∇𝜑 = 0. (4.9)
Note that Eq.(4.9) is the same as in Sigmond [55]. Derivations for cartesian coordinates are similar
to Guan [6]. Eq.(4.9) can be rearranged as
∇𝜑 =
𝜌𝑒2
휀∇𝜌𝑒. (4.10)
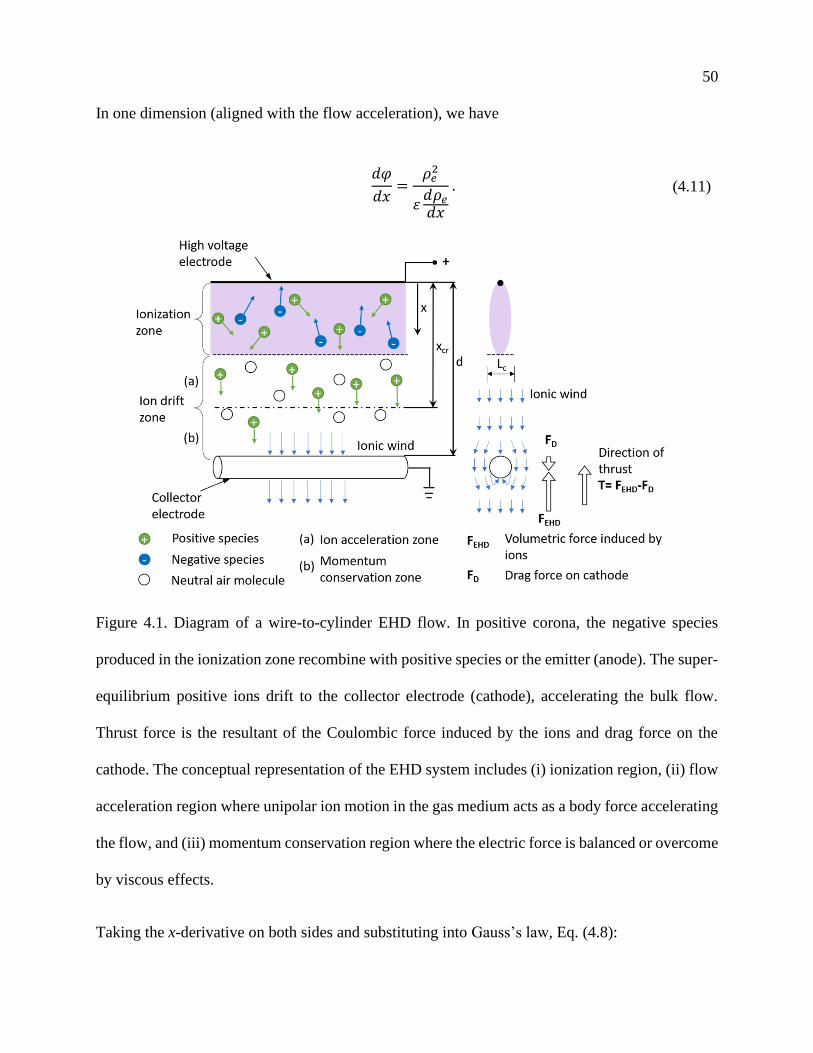
50
In one dimension (aligned with the flow acceleration), we have
𝑑𝜑
𝑑𝑥=
𝜌𝑒2
휀𝑑𝜌𝑒
𝑑𝑥
. (4.11)
Figure 4.1. Diagram of a wire-to-cylinder EHD flow. In positive corona, the negative species
produced in the ionization zone recombine with positive species or the emitter (anode). The super-
equilibrium positive ions drift to the collector electrode (cathode), accelerating the bulk flow.
Thrust force is the resultant of the Coulombic force induced by the ions and drag force on the
cathode. The conceptual representation of the EHD system includes (i) ionization region, (ii) flow
acceleration region where unipolar ion motion in the gas medium acts as a body force accelerating
the flow, and (iii) momentum conservation region where the electric force is balanced or overcome
by viscous effects.
Taking the x-derivative on both sides and substituting into Gauss’s law, Eq. (4.8):
51
𝑑2𝜑
𝑑𝑥2= −
𝜌𝑒
휀=
2𝜌𝑒𝑑𝜌𝑒
𝑑𝑥(휀
𝑑𝜌𝑒
𝑑𝑥) − 𝜌𝑒
2 (휀𝑑2𝜌𝑒
𝑑𝑥2 )
(휀𝑑𝜌𝑒
𝑑𝑥)
2 . (4.12)
Rearranging
3 (
𝑑𝜌𝑒
𝑑𝑥)
2
= 𝜌𝑒 (휀𝑑2𝜌𝑒
𝑑𝑥2) (4.13)
and seeking the solution in the form
𝜌𝑒 = 𝐾𝑥𝑛 , (4.14)
then substituting into Eq.(4.13), the following expression is yielded
3𝑛2𝑥2(𝑛−1) = 𝑛(𝑛 − 1)𝑥2𝑛−2. (4.15)
From Eq. (4.15) 𝑛 = −1/2 and 𝜌𝑒 = 𝐾𝑥−1
2, substitute to 𝐸 = −𝑑
𝑑𝑥𝜑
−𝑑
𝑑𝑥𝜑 = −
𝜌𝑒2
(휀𝑑𝜌𝑒
𝑑𝑥)
=2𝐾
휀𝑥1/2 (4.16)
𝑑𝜑 = −2𝐾
휀𝑥1/2𝑑𝑥. (4.17)
Integrating on both sides gives
𝜑𝑐 − 𝜑 = −
4𝐾
3휀𝑥3 2⁄ . (4.18)
52
The coefficient 𝐾 can be written as
𝐾 =
3휀
4𝑥3 2⁄(𝜑 − 𝜑𝑐), (4.19)
where 𝜑 is the applied anode potential and 𝜑𝑐 is the constant potential in a corona discharge, which
can be considered as potential at the x-location of the corona onset, or corona initiation voltage 𝜑𝑜.
The ion current flux between the anode and cathode is
𝐽 = 𝜇𝑏𝜌𝑒𝐸 =
9𝜇𝑏휀(𝜑 − 𝜑𝑜)2
8𝑥3. (4.20)
The relationship in Eq.(4.20) shows that 𝐽 ∝ 𝑥−3 and has a similar form to Mott-Gurney law
[71, 78], i.e., 𝐽 =9𝜇𝑏𝜀𝜑2
8𝑑3 , which describes the space charge saturation limit, where 𝑑 is the distance
between the electrodes and 𝜑 is the applied potential. In corona discharge, the charged species are
produced only after the onset potential is reached, so if 𝜑 is replaced by 𝜑 − 𝜑𝑜 and 𝑥 = 𝑑, the
current flux relation becomes takes the form of Mott-Gurney law.
The EHD flow in planar wire-to-cylinder geometry can be divided into three regions:
ionization zone, acceleration zone, and momentum conservation region. To define the conditions
in the acceleration region, consider 𝑥𝑐𝑟, which is the characteristic length scale of the flow
acceleration. For wire-to-cylinder geometry, the ionization and drift regions can be approximated
as an infinite plane (in the y-direction) where 𝑥𝑐𝑟 is the distance from the emitter to an examination
position, as shown in Figure 4.1. The current flux at the location (𝑥𝑐𝑟) can be written as
53
𝐽𝑐𝑟 = 𝜇𝑏𝜌𝑒𝐸 =9𝜇𝑏휀(𝜑 − 𝜑𝑜)2
8𝑥𝑐𝑟 3 , (4.21)
𝐼 = ∫ 𝐽𝑐𝑟𝑑𝐴 = 𝐽𝑐𝑟𝐴, (4.22)
where 𝐴 is the cross-sectional area associated with ion interaction with the fluid at the location
𝑥𝑐𝑟. For planar geometry (infinite length electrodes), the zone of ion interaction with the fluid can
be normalized to a unit length (𝐿𝑐 × 1). Substituting cross-section area into Eq.(4.21) gives the
current expression
𝐼 =
9𝜇𝑏휀(𝜑 − 𝜑𝑜)2
8𝐿𝑐𝑥𝑐𝑟. (4.23)
To simplify, we introduce a characteristic dimension (Lc) that defines the ion-flow interaction
region, then Eq.(4.23) can be reduced to
𝐼 =9𝜇𝑏휀(𝜑 − 𝜑𝑜)2
8𝐿𝑐2
. (4.24)
This current-voltage relationship is similar to Townsend’s quadratic relationship for the coaxial
cylinder electrode configuration 𝐼 = 𝐶𝜑(𝜑 − 𝜑𝑜), where 𝐶 is a fitting coefficient, typically
obtained from the experiments, and it is dependent on the geometry. The physical interpretation of
the parameter 𝐶 is proposed by Cooperman for duct-type electrostatic precipitator as 𝐶 ∝ 𝜇𝑏 𝐿𝑐2⁄ ,
where 𝜇𝑏 is the ion mobility and 𝐿𝑐 is the characteristic length scale [53]. Our derivation also shows
a similar physical interpretation of the Townsend constant:
54
𝐶 =9𝜇𝑏휀
8𝐿𝑐2
. (4.25)
The derived (𝜑 − 𝐼) relationship Eq.(4.23) is more general than formulations given by
Townsend [52], the values of 𝜑𝑜 and 𝐿𝑐 must be determined for any specific geometry. Once the
(𝜑 − 𝐼) the relationship is defined, force induced by EHD can be computed as the Coulomb force
acting on the volume of fluid by the non-equilibrium concentration of ions between the anode and
cathode
𝐹𝐸𝐻𝐷 = ∫ 𝑓𝑑𝑉 = ∫ 𝜌𝑒𝐸𝑑𝑉 = ∫ 𝜌𝑒𝐸𝐴𝐿𝑑𝑥𝑑
0
=𝐼𝑑
𝜇𝑏 =
9휀(𝜑 − 𝜑𝑜)2𝑑
8𝐿𝑐2
, (4.26)
where 𝐹𝐸𝐻𝐷 is the volumetric force induced by the ions, and 𝑓 is the force per unit volume.
Previous research [78, 79] shows the use of Townsend's current relation in Eq.(4.26) to
determine the EHD force by fitting the constant 𝐶. However, the measured thrust does not always
agree with the calculated EHD force, because the measured thrust is the result of the Coulombic
and drag forces. Predicted thrust force from Townsend's current voltage relationship can be 70%
greater than the measured one [78, 203], likely due to losses associated with drag and the 3D field
effects. The determination of drag on the cathode in a wire-to-cylinder system requires the
knowledge of the velocity profile. However, the velocity measurements can be challenging near
the high voltage emitter and may not be available. It has been proposed that the mean ionic wind
velocity associated with the corona discharge can be determined using the Bernoulli equation, see
Moreau et al. [78] The mean velocity 𝑣 and pressure 𝑃 in the ionization zone as shown in Figure
4.1 can be approximated
55
𝑃 =1
2𝜌𝑣2, (4.27)
where 𝜌 is the density of the fluid. The pressure gradient in the one-dimension coordinate system
induced by the corona discharge can be written as
𝑓 =𝑑𝑃
𝑑𝑥 (4.28)
Combining Eq.(4.26) and Eq. (4.28), the expression for pressure can be written as
𝑃 = ∫ 𝑓 𝑑𝑥 =𝐼𝑑
𝜇𝑏𝐴. (4.29)
The mean velocity of EHD flow can be determined from the eq (4.27)
𝑣 = √2𝐼𝑑
𝜇𝑏𝜌𝐴. (4.30)
The mean electric wind velocity can also be calculated using momentum balance over the entire
domain by neglecting the pressure and viscous terms
𝜌𝑒𝐸 = 𝜌𝑣𝑑𝑣
𝑑𝑥, (4.31)
∫ 𝜌𝑒𝐸𝑑𝑥 = ∫ 𝜌𝑣𝑑𝑣, (4.32)
substituting Eq.(4.26) and integrating over the gap between anode and cathode gives
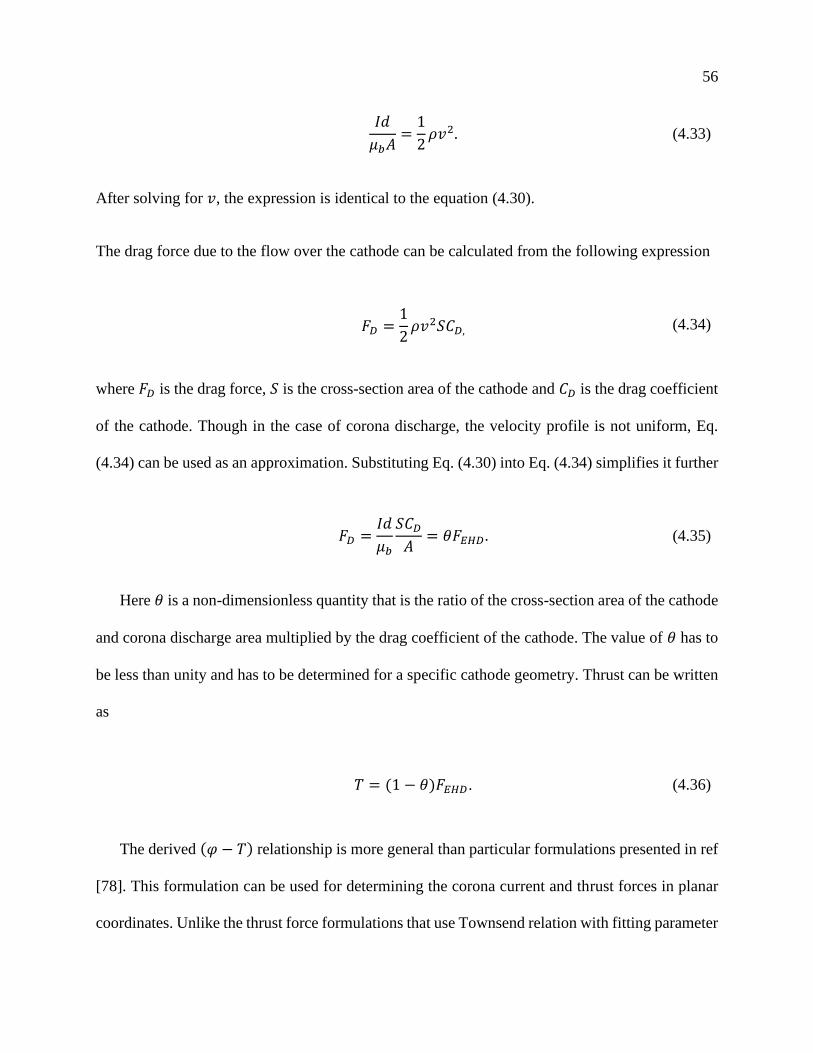
56
𝐼𝑑
𝜇𝑏𝐴=
1
2𝜌𝑣2. (4.33)
After solving for 𝑣, the expression is identical to the equation (4.30).
The drag force due to the flow over the cathode can be calculated from the following expression
𝐹𝐷 =1
2𝜌𝑣2𝑆𝐶𝐷, (4.34)
where 𝐹𝐷 is the drag force, 𝑆 is the cross-section area of the cathode and 𝐶𝐷 is the drag coefficient
of the cathode. Though in the case of corona discharge, the velocity profile is not uniform, Eq.
(4.34) can be used as an approximation. Substituting Eq. (4.30) into Eq. (4.34) simplifies it further
𝐹𝐷 =𝐼𝑑
𝜇𝑏
𝑆𝐶𝐷
𝐴= 𝜃𝐹𝐸𝐻𝐷 . (4.35)
Here 𝜃 is a non-dimensionless quantity that is the ratio of the cross-section area of the cathode
and corona discharge area multiplied by the drag coefficient of the cathode. The value of 𝜃 has to
be less than unity and has to be determined for a specific cathode geometry. Thrust can be written
as
𝑇 = (1 − 𝜃)𝐹𝐸𝐻𝐷. (4.36)
The derived (𝜑 − 𝑇) relationship is more general than particular formulations presented in ref
[78]. This formulation can be used for determining the corona current and thrust forces in planar
coordinates. Unlike the thrust force formulations that use Townsend relation with fitting parameter
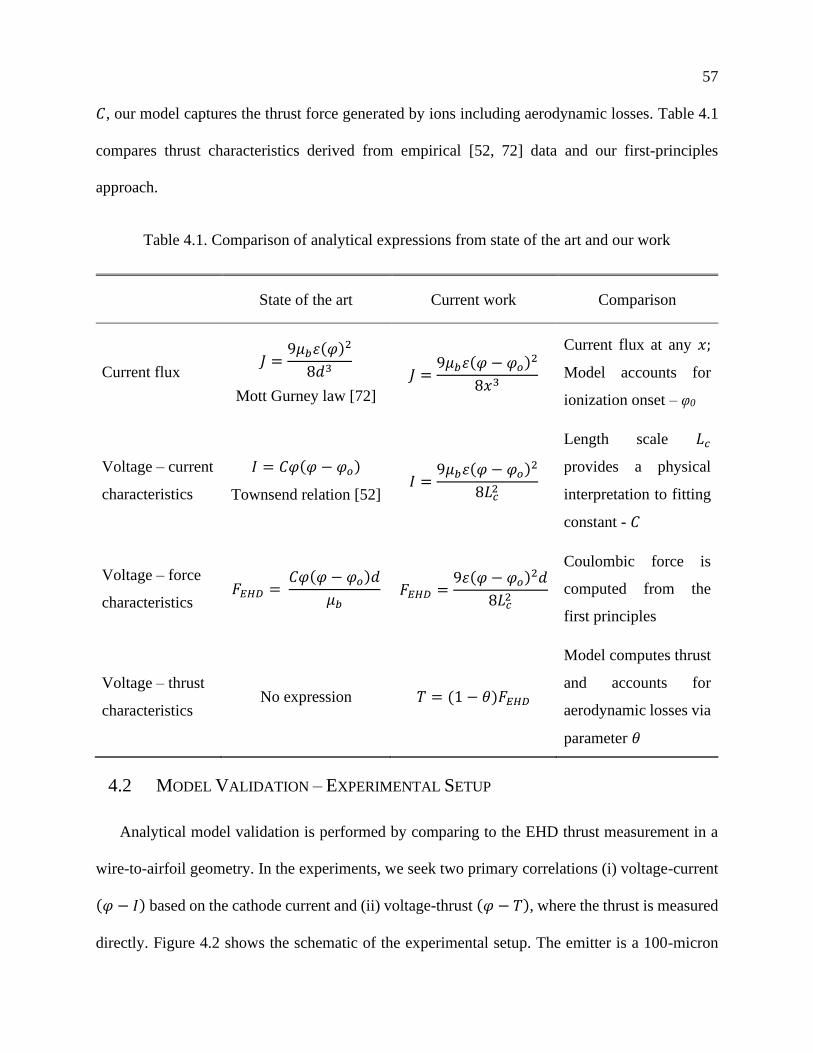
57
𝐶, our model captures the thrust force generated by ions including aerodynamic losses. Table 4.1
compares thrust characteristics derived from empirical [52, 72] data and our first-principles
approach.
Table 4.1. Comparison of analytical expressions from state of the art and our work
State of the art Current work Comparison
Current flux 𝐽 =
9𝜇𝑏휀(𝜑)2
8𝑑3
Mott Gurney law [72]
𝐽 =9𝜇𝑏휀(𝜑 − 𝜑𝑜)2
8𝑥3
Current flux at any 𝑥;
Model accounts for
ionization onset – φ0
Voltage – current
characteristics
𝐼 = 𝐶𝜑(𝜑 − 𝜑𝑜)
Townsend relation [52] 𝐼 =
9𝜇𝑏휀(𝜑 − 𝜑𝑜)2
8𝐿𝑐2
Length scale 𝐿𝑐
provides a physical
interpretation to fitting
constant - 𝐶
Voltage – force
characteristics 𝐹𝐸𝐻𝐷 =
𝐶𝜑(𝜑 − 𝜑𝑜)𝑑
𝜇𝑏 𝐹𝐸𝐻𝐷 =
9휀(𝜑 − 𝜑𝑜)2𝑑
8𝐿𝑐2
Coulombic force is
computed from the
first principles
Voltage – thrust
characteristics No expression 𝑇 = (1 − 𝜃)𝐹𝐸𝐻𝐷
Model computes thrust
and accounts for
aerodynamic losses via
parameter 𝜃
4.2 MODEL VALIDATION – EXPERIMENTAL SETUP
Analytical model validation is performed by comparing to the EHD thrust measurement in a
wire-to-airfoil geometry. In the experiments, we seek two primary correlations (i) voltage-current
(𝜑 − 𝐼) based on the cathode current and (ii) voltage-thrust (𝜑 − 𝑇), where the thrust is measured
directly. Figure 4.2 shows the schematic of the experimental setup. The emitter is a 100-micron
58
diameter tungsten wire, the cathode is a symmetrical airfoil (NACA 0024) fabricated of a 25-
micron copper sheet and has a length of 25 mm. A thruster frame of 100 mm wide was built of a
polylactic acid polymer. The frame was suspended from an analytical balance Metler Toledo (AE
240) with 40 g capacity and 0.01 g resolution. The distance between the electrodes (d) was varied
in the range of 10 to 30 mm using spacers. The thruster mass is ~ 26 g in the 10 mm spacer
configuration. A high voltage power supply (Glassman, model EH30P3) was used to set the
electric potential between the electrodes. The cathode current was measured based on a voltage
drop across a 0.5 MΩ resistor. The electrical connections of both electrodes were established by
thin wire (100 μm in diameter) to minimize added weight. The thruster was hung from a hook on
the underside of the balance using cotton strings to electrically isolate the balance and to avoid
current leakage. The thrust was measured as a reduction in weight measure by the analytical
balance. The experimental procedure is as follows: (i) the high voltage is switched off and the
weight of the thruster is measured using the analytical balance (ii) the high voltage is switched on
and the difference in the balance measurements is determined, the voltage value is increased in the
increments of 1 kV. The experiment was operated in the positive corona mode in a room
temperature range of 22-25 ⁰C, relative humidity of 24-26%, and ambient pressure. For each
distance (d), the voltage was increased from 7 kV (when the thrust force becomes measurable) to
~ 29 kV (power supply limit or until a spark-over occurs). To verify the measurements, each
experiment was repeated five times.
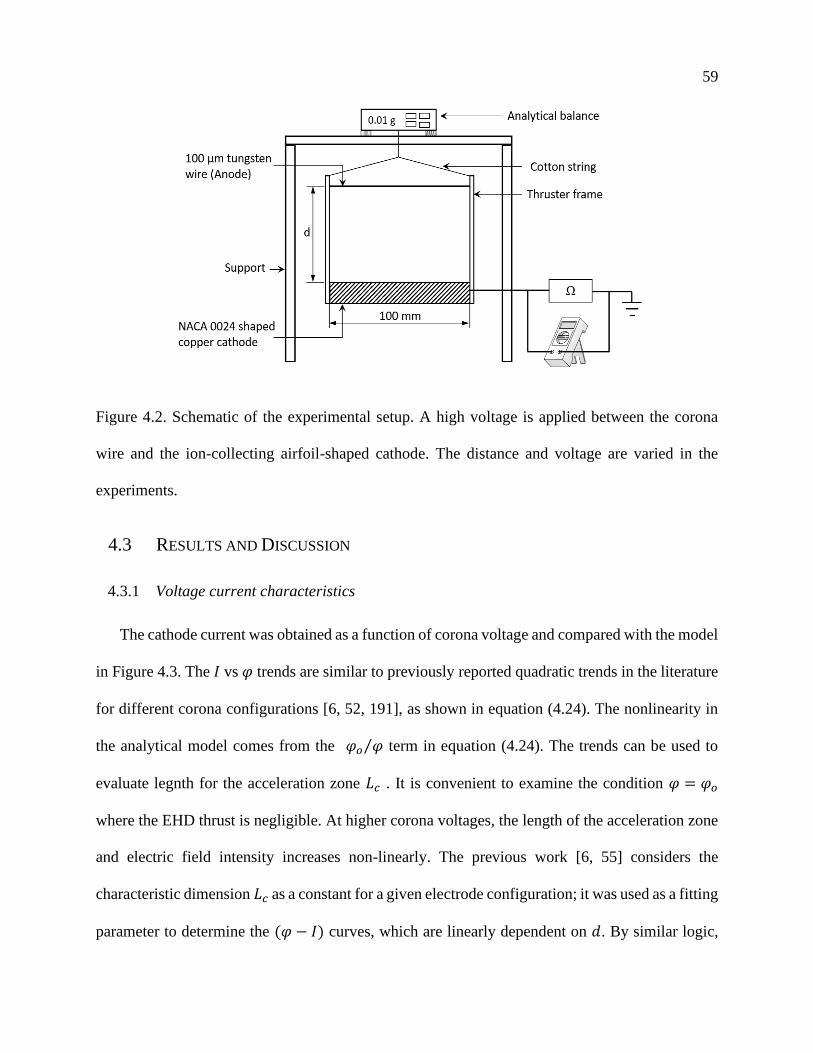
59
Figure 4.2. Schematic of the experimental setup. A high voltage is applied between the corona
wire and the ion-collecting airfoil-shaped cathode. The distance and voltage are varied in the
experiments.
4.3 RESULTS AND DISCUSSION
4.3.1 Voltage current characteristics
The cathode current was obtained as a function of corona voltage and compared with the model
in Figure 4.3. The 𝐼 vs 𝜑 trends are similar to previously reported quadratic trends in the literature
for different corona configurations [6, 52, 191], as shown in equation (4.24). The nonlinearity in
the analytical model comes from the 𝜑𝑜 𝜑⁄ term in equation (4.24). The trends can be used to
evaluate legnth for the acceleration zone 𝐿𝑐 . It is convenient to examine the condition 𝜑 = 𝜑𝑜
where the EHD thrust is negligible. At higher corona voltages, the length of the acceleration zone
and electric field intensity increases non-linearly. The previous work [6, 55] considers the
characteristic dimension 𝐿𝑐 as a constant for a given electrode configuration; it was used as a fitting
parameter to determine the (𝜑 − 𝐼) curves, which are linearly dependent on 𝑑. By similar logic,
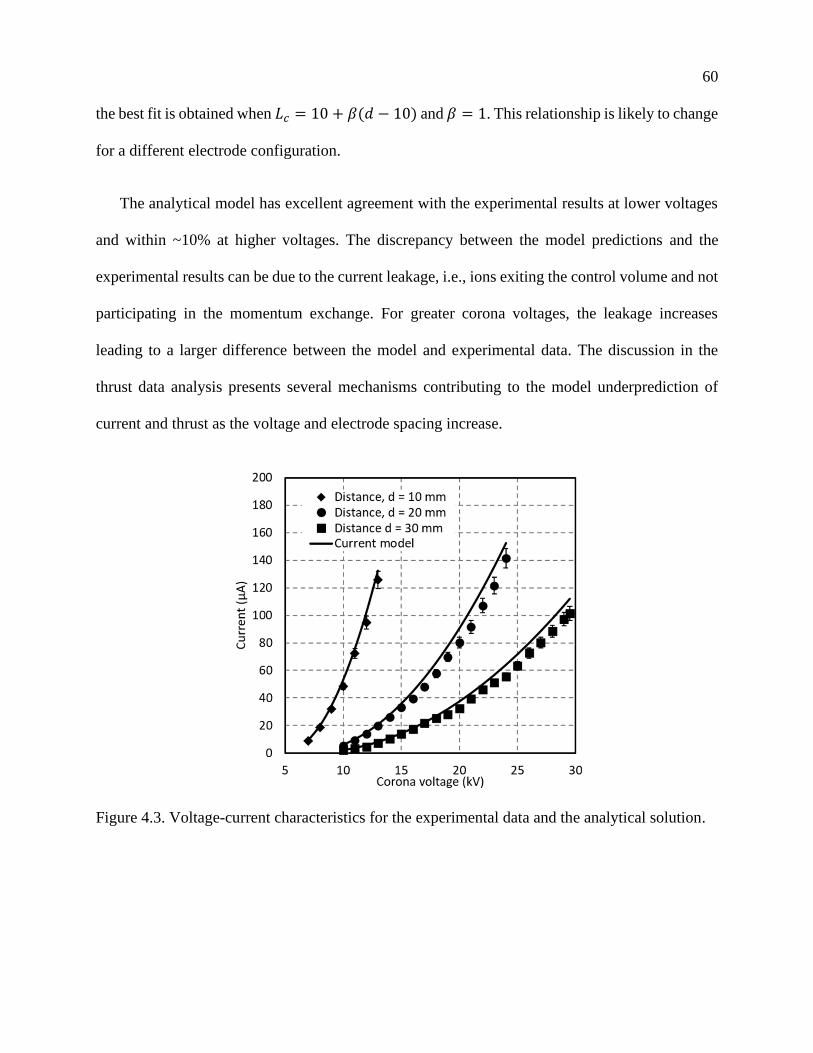
60
the best fit is obtained when 𝐿𝑐 = 10 + 𝛽(𝑑 − 10) and 𝛽 = 1. This relationship is likely to change
for a different electrode configuration.
The analytical model has excellent agreement with the experimental results at lower voltages
and within ~10% at higher voltages. The discrepancy between the model predictions and the
experimental results can be due to the current leakage, i.e., ions exiting the control volume and not
participating in the momentum exchange. For greater corona voltages, the leakage increases
leading to a larger difference between the model and experimental data. The discussion in the
thrust data analysis presents several mechanisms contributing to the model underprediction of
current and thrust as the voltage and electrode spacing increase.
Figure 4.3. Voltage-current characteristics for the experimental data and the analytical solution.
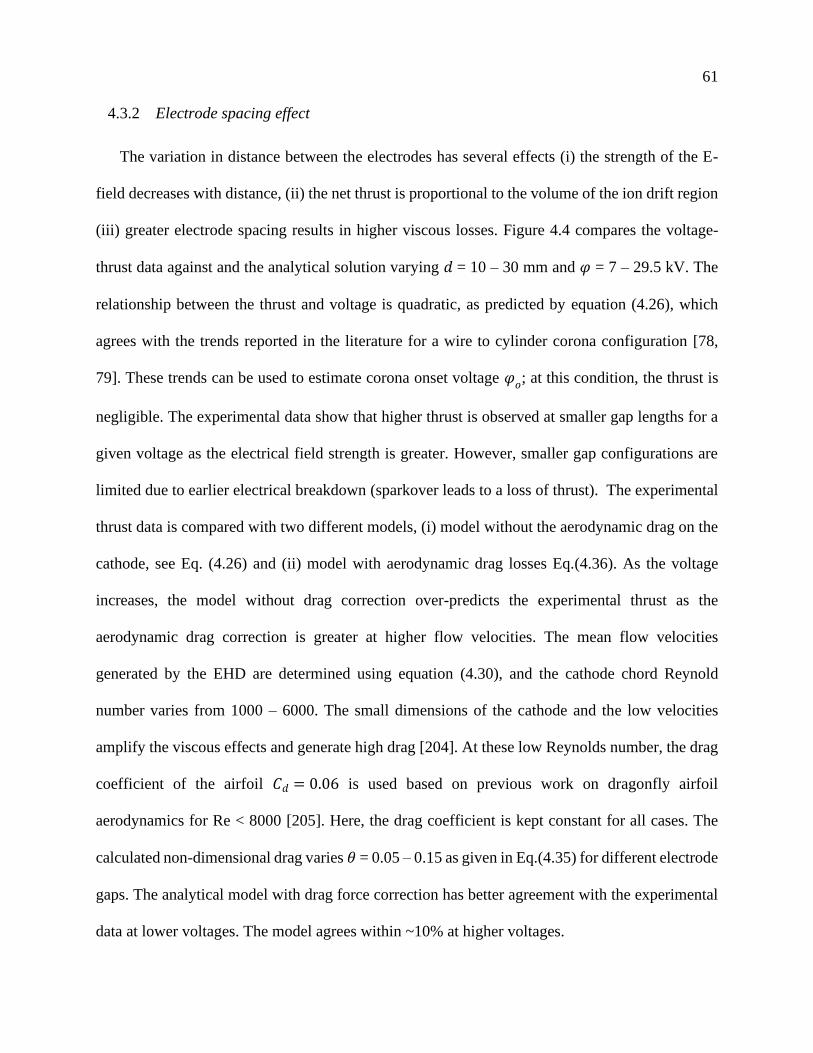
61
4.3.2 Electrode spacing effect
The variation in distance between the electrodes has several effects (i) the strength of the E-
field decreases with distance, (ii) the net thrust is proportional to the volume of the ion drift region
(iii) greater electrode spacing results in higher viscous losses. Figure 4.4 compares the voltage-
thrust data against and the analytical solution varying 𝑑 = 10 – 30 mm and 𝜑 = 7 – 29.5 kV. The
relationship between the thrust and voltage is quadratic, as predicted by equation (4.26), which
agrees with the trends reported in the literature for a wire to cylinder corona configuration [78,
79]. These trends can be used to estimate corona onset voltage 𝜑𝑜; at this condition, the thrust is
negligible. The experimental data show that higher thrust is observed at smaller gap lengths for a
given voltage as the electrical field strength is greater. However, smaller gap configurations are
limited due to earlier electrical breakdown (sparkover leads to a loss of thrust). The experimental
thrust data is compared with two different models, (i) model without the aerodynamic drag on the
cathode, see Eq. (4.26) and (ii) model with aerodynamic drag losses Eq.(4.36). As the voltage
increases, the model without drag correction over-predicts the experimental thrust as the
aerodynamic drag correction is greater at higher flow velocities. The mean flow velocities
generated by the EHD are determined using equation (4.30), and the cathode chord Reynold
number varies from 1000 – 6000. The small dimensions of the cathode and the low velocities
amplify the viscous effects and generate high drag [204]. At these low Reynolds number, the drag
coefficient of the airfoil 𝐶𝑑 = 0.06 is used based on previous work on dragonfly airfoil
aerodynamics for Re < 8000 [205]. Here, the drag coefficient is kept constant for all cases. The
calculated non-dimensional drag varies 𝜃 = 0.05 – 0.15 as given in Eq.(4.35) for different electrode
gaps. The analytical model with drag force correction has better agreement with the experimental
data at lower voltages. The model agrees within ~10% at higher voltages.
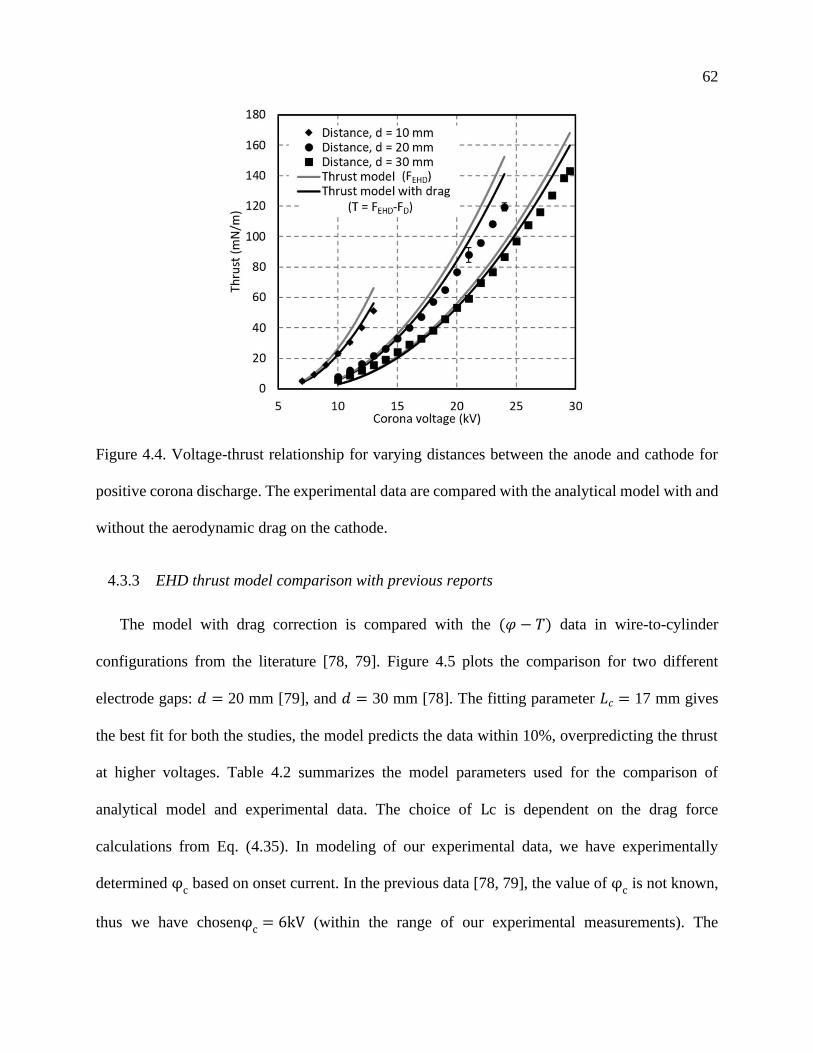
62
Figure 4.4. Voltage-thrust relationship for varying distances between the anode and cathode for
positive corona discharge. The experimental data are compared with the analytical model with and
without the aerodynamic drag on the cathode.
4.3.3 EHD thrust model comparison with previous reports
The model with drag correction is compared with the (𝜑 − 𝑇) data in wire-to-cylinder
configurations from the literature [78, 79]. Figure 4.5 plots the comparison for two different
electrode gaps: 𝑑 = 20 mm [79], and 𝑑 = 30 mm [78]. The fitting parameter 𝐿𝑐 = 17 mm gives
the best fit for both the studies, the model predicts the data within 10%, overpredicting the thrust
at higher voltages. Table 4.2 summarizes the model parameters used for the comparison of
analytical model and experimental data. The choice of Lc is dependent on the drag force
calculations from Eq. (4.35). In modeling of our experimental data, we have experimentally
determined φc based on onset current. In the previous data [78, 79], the value of φc is not known,
thus we have chosenφc = 6kV (within the range of our experimental measurements). The
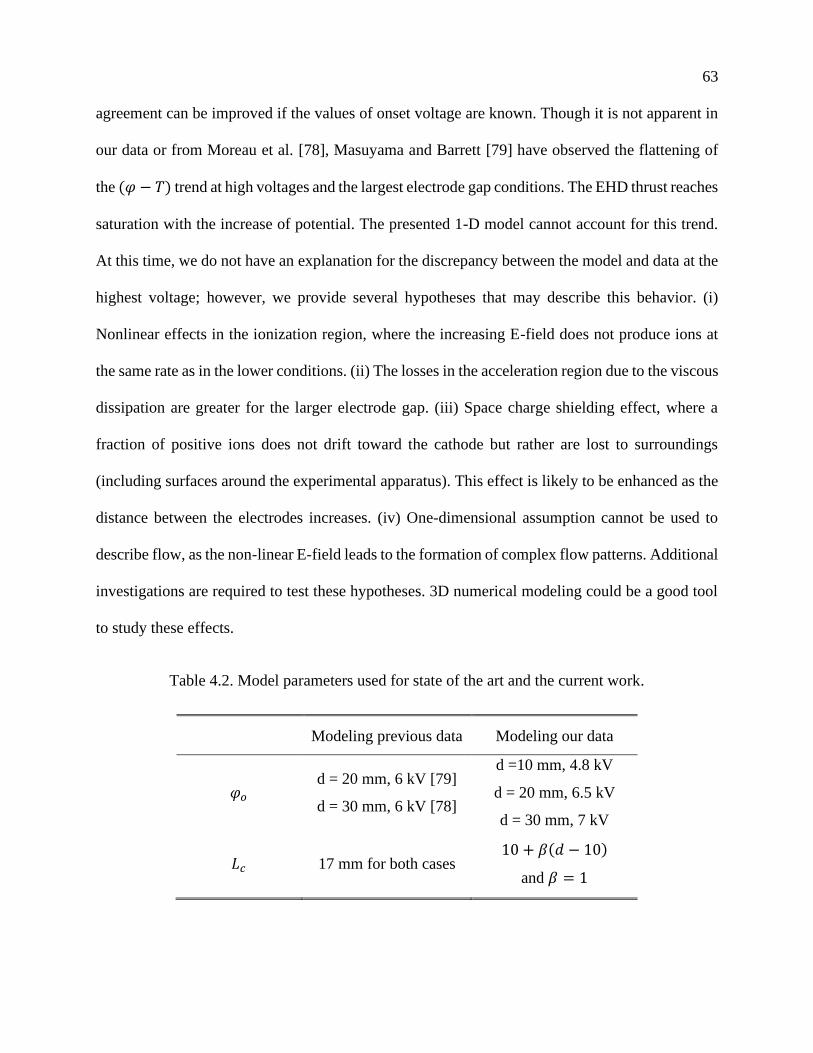
63
agreement can be improved if the values of onset voltage are known. Though it is not apparent in
our data or from Moreau et al. [78], Masuyama and Barrett [79] have observed the flattening of
the (𝜑 − 𝑇) trend at high voltages and the largest electrode gap conditions. The EHD thrust reaches
saturation with the increase of potential. The presented 1-D model cannot account for this trend.
At this time, we do not have an explanation for the discrepancy between the model and data at the
highest voltage; however, we provide several hypotheses that may describe this behavior. (i)
Nonlinear effects in the ionization region, where the increasing E-field does not produce ions at
the same rate as in the lower conditions. (ii) The losses in the acceleration region due to the viscous
dissipation are greater for the larger electrode gap. (iii) Space charge shielding effect, where a
fraction of positive ions does not drift toward the cathode but rather are lost to surroundings
(including surfaces around the experimental apparatus). This effect is likely to be enhanced as the
distance between the electrodes increases. (iv) One-dimensional assumption cannot be used to
describe flow, as the non-linear E-field leads to the formation of complex flow patterns. Additional
investigations are required to test these hypotheses. 3D numerical modeling could be a good tool
to study these effects.
Table 4.2. Model parameters used for state of the art and the current work.
Modeling previous data Modeling our data
𝜑𝑜 d = 20 mm, 6 kV [79]
d = 30 mm, 6 kV [78]
d =10 mm, 4.8 kV
d = 20 mm, 6.5 kV
d = 30 mm, 7 kV
𝐿𝑐 17 mm for both cases 10 + 𝛽(𝑑 − 10)
and 𝛽 = 1
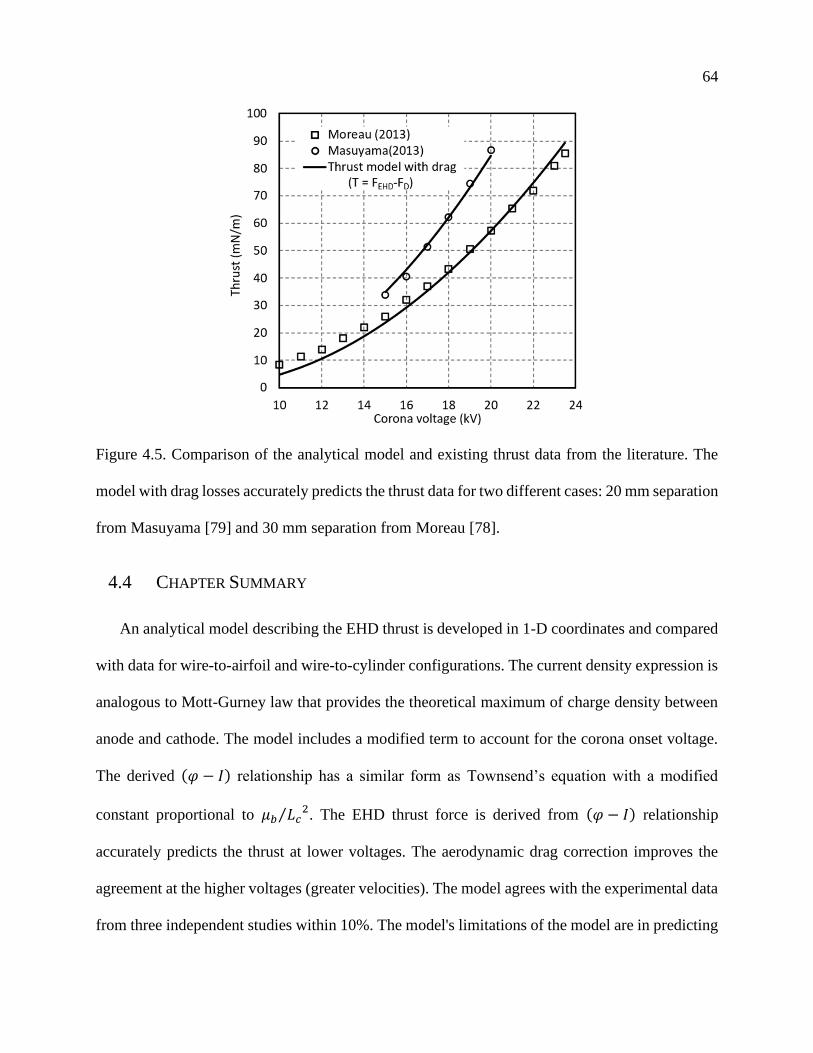
64
Figure 4.5. Comparison of the analytical model and existing thrust data from the literature. The
model with drag losses accurately predicts the thrust data for two different cases: 20 mm separation
from Masuyama [79] and 30 mm separation from Moreau [78].
4.4 CHAPTER SUMMARY
An analytical model describing the EHD thrust is developed in 1-D coordinates and compared
with data for wire-to-airfoil and wire-to-cylinder configurations. The current density expression is
analogous to Mott-Gurney law that provides the theoretical maximum of charge density between
anode and cathode. The model includes a modified term to account for the corona onset voltage.
The derived (𝜑 − 𝐼) relationship has a similar form as Townsend’s equation with a modified
constant proportional to 𝜇𝑏 𝐿𝑐2⁄ . The EHD thrust force is derived from (𝜑 − 𝐼) relationship
accurately predicts the thrust at lower voltages. The aerodynamic drag correction improves the
agreement at the higher voltages (greater velocities). The model agrees with the experimental data
from three independent studies within 10%. The model's limitations of the model are in predicting
65
the thrust at the increasing voltages; these are likely the results of the simplified assumptions in
the viscous losses, ionization region modeling including space charge effects, increased
dimensionality of the electric field in large electrode gap geometries.
66
Chapter 5. PROPULSION OF INSECT SCALE ROBOT WITH EHD
THRUSTERS
This work is published in PLOS One [8]. The fabrication and experiments are performed with
the assistance of Hari Krishna Hari Prasad [206], and the fabrication methodology and
experimental results are presented here for completeness.
In this chapter, we utilize laser machining fabrication to build EHD thrusters for centimeter-
sized aerial robots. The process allows for a greater variety of electrode materials and eliminates
the need for a clean room facility. For example, it allows fabricating a complete four-thruster
device in a matter of minutes. Our four-thruster device measures 1.8 × 2.5 cm and is composed of
steel emitters and a lightweight carbon fiber mesh. We measured the electrical current and thrust
of each thruster of our four-thruster design, showing agreement with the Townsend relation. The
peak thrust of our device, at 5.2 kV, was measured to be 3.03 times its 37 mg (363.0 μN) mass
using a precision balance. In free flight, we demonstrated liftoff at 4.6 kV.
5.1 FABRICATION AND ASSEMBLY OF EHD THRUSTERS
Our fabrication process emphasizes speed and simplicity by minimizing the number of
components and fabrication time.
Previous work has used a silicon-on-insulator process for the fabrication of EHD thruster [16].
The emitter and collector electrodes were made from silicon patterned with a photolithographic
mask. After a deep reactive ion etch (DRIE) process ablates through the wafer, the electrodes are
once more etched with hydrofluoric acid (HF). In that work, insulating standoffs to separate the
emitter from the collector were made from fused silica capillary tubing with an outer diameter of
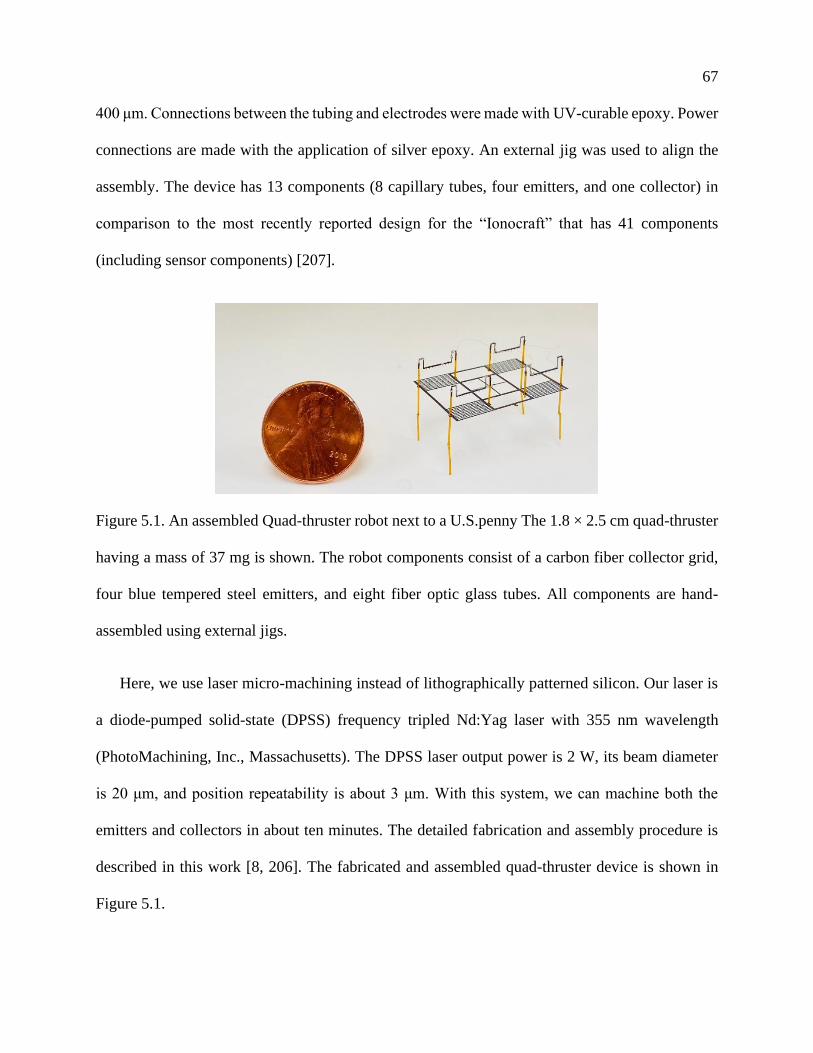
67
400 μm. Connections between the tubing and electrodes were made with UV-curable epoxy. Power
connections are made with the application of silver epoxy. An external jig was used to align the
assembly. The device has 13 components (8 capillary tubes, four emitters, and one collector) in
comparison to the most recently reported design for the “Ionocraft” that has 41 components
(including sensor components) [207].
Figure 5.1. An assembled Quad-thruster robot next to a U.S.penny The 1.8 × 2.5 cm quad-thruster
having a mass of 37 mg is shown. The robot components consist of a carbon fiber collector grid,
four blue tempered steel emitters, and eight fiber optic glass tubes. All components are hand-
assembled using external jigs.
Here, we use laser micro-machining instead of lithographically patterned silicon. Our laser is
a diode-pumped solid-state (DPSS) frequency tripled Nd:Yag laser with 355 nm wavelength
(PhotoMachining, Inc., Massachusetts). The DPSS laser output power is 2 W, its beam diameter
is 20 μm, and position repeatability is about 3 μm. With this system, we can machine both the
emitters and collectors in about ten minutes. The detailed fabrication and assembly procedure is
described in this work [8, 206]. The fabricated and assembled quad-thruster device is shown in
Figure 5.1.
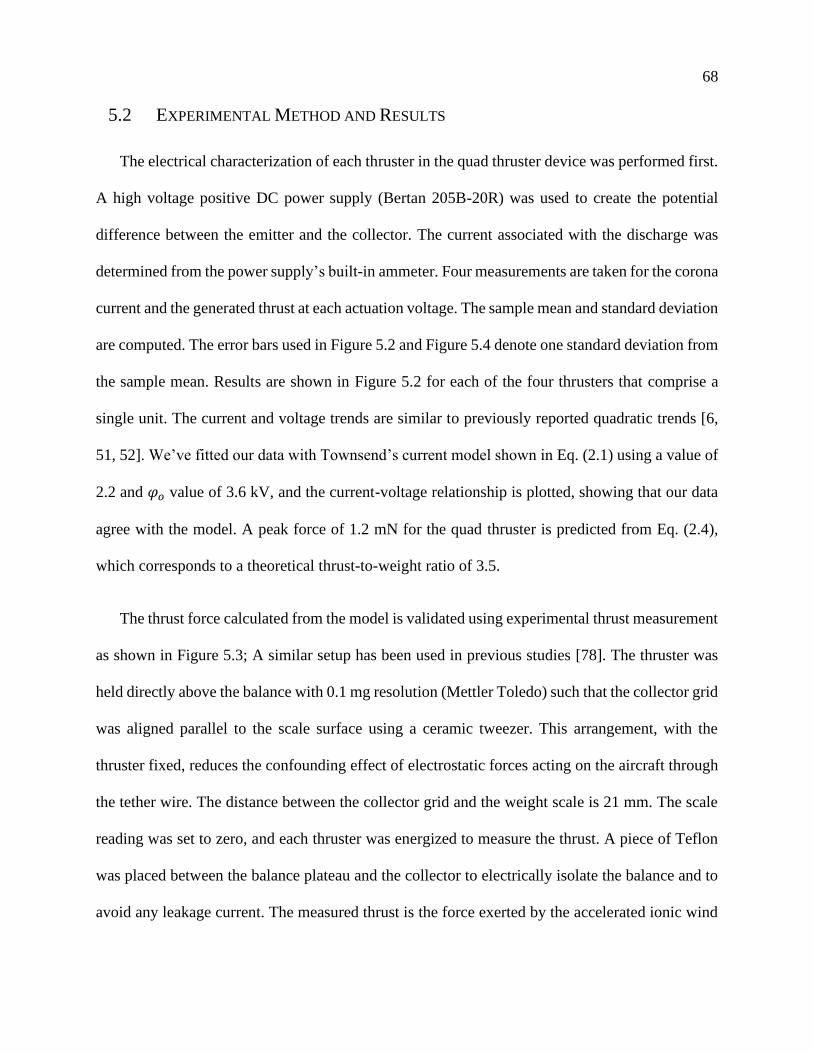
68
5.2 EXPERIMENTAL METHOD AND RESULTS
The electrical characterization of each thruster in the quad thruster device was performed first.
A high voltage positive DC power supply (Bertan 205B-20R) was used to create the potential
difference between the emitter and the collector. The current associated with the discharge was
determined from the power supply’s built-in ammeter. Four measurements are taken for the corona
current and the generated thrust at each actuation voltage. The sample mean and standard deviation
are computed. The error bars used in Figure 5.2 and Figure 5.4 denote one standard deviation from
the sample mean. Results are shown in Figure 5.2 for each of the four thrusters that comprise a
single unit. The current and voltage trends are similar to previously reported quadratic trends [6,
51, 52]. We’ve fitted our data with Townsend’s current model shown in Eq. (2.1) using a value of
2.2 and 𝜑𝑜 value of 3.6 kV, and the current-voltage relationship is plotted, showing that our data
agree with the model. A peak force of 1.2 mN for the quad thruster is predicted from Eq. (2.4),
which corresponds to a theoretical thrust-to-weight ratio of 3.5.
The thrust force calculated from the model is validated using experimental thrust measurement
as shown in Figure 5.3; A similar setup has been used in previous studies [78]. The thruster was
held directly above the balance with 0.1 mg resolution (Mettler Toledo) such that the collector grid
was aligned parallel to the scale surface using a ceramic tweezer. This arrangement, with the
thruster fixed, reduces the confounding effect of electrostatic forces acting on the aircraft through
the tether wire. The distance between the collector grid and the weight scale is 21 mm. The scale
reading was set to zero, and each thruster was energized to measure the thrust. A piece of Teflon
was placed between the balance plateau and the collector to electrically isolate the balance and to
avoid any leakage current. The measured thrust is the force exerted by the accelerated ionic wind
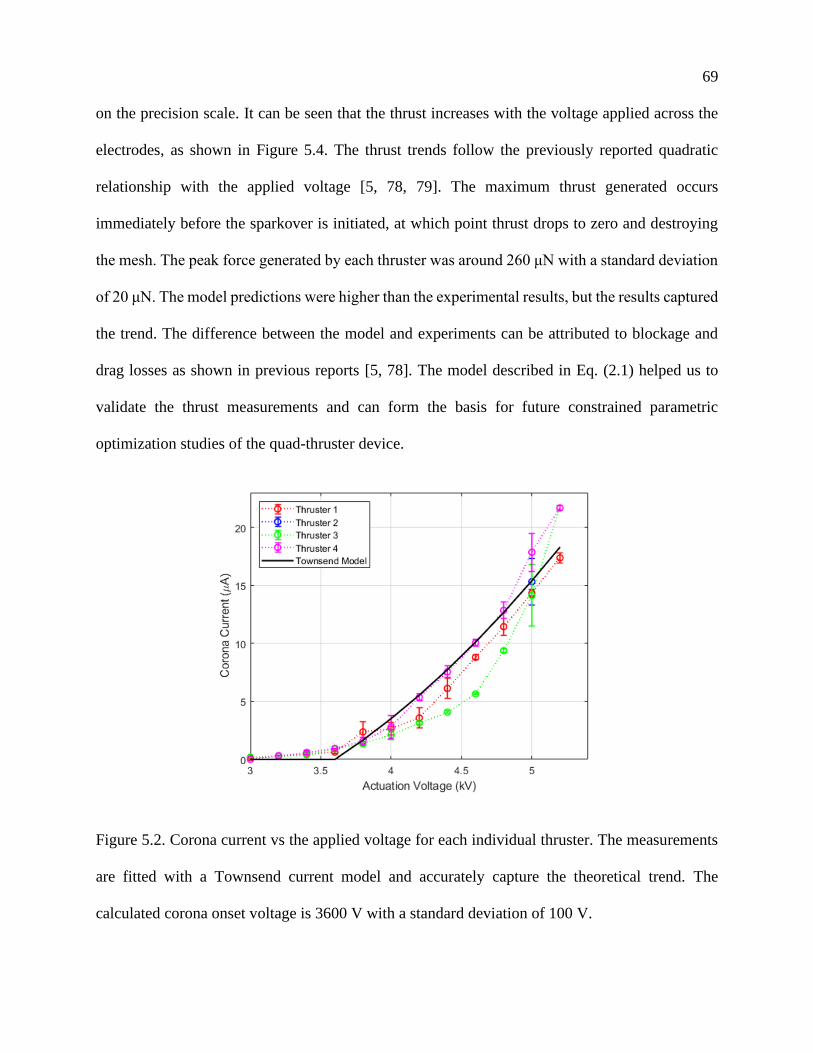
69
on the precision scale. It can be seen that the thrust increases with the voltage applied across the
electrodes, as shown in Figure 5.4. The thrust trends follow the previously reported quadratic
relationship with the applied voltage [5, 78, 79]. The maximum thrust generated occurs
immediately before the sparkover is initiated, at which point thrust drops to zero and destroying
the mesh. The peak force generated by each thruster was around 260 μN with a standard deviation
of 20 μN. The model predictions were higher than the experimental results, but the results captured
the trend. The difference between the model and experiments can be attributed to blockage and
drag losses as shown in previous reports [5, 78]. The model described in Eq. (2.1) helped us to
validate the thrust measurements and can form the basis for future constrained parametric
optimization studies of the quad-thruster device.
Figure 5.2. Corona current vs the applied voltage for each individual thruster. The measurements
are fitted with a Townsend current model and accurately capture the theoretical trend. The
calculated corona onset voltage is 3600 V with a standard deviation of 100 V.
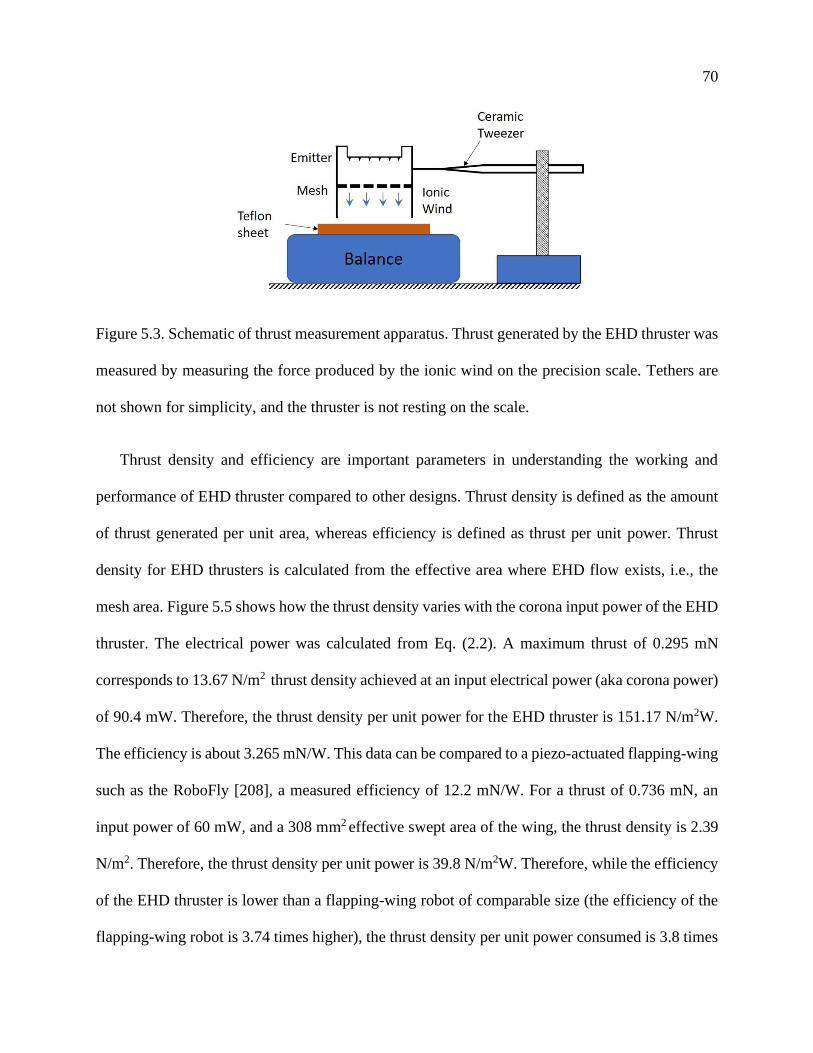
70
Figure 5.3. Schematic of thrust measurement apparatus. Thrust generated by the EHD thruster was
measured by measuring the force produced by the ionic wind on the precision scale. Tethers are
not shown for simplicity, and the thruster is not resting on the scale.
Thrust density and efficiency are important parameters in understanding the working and
performance of EHD thruster compared to other designs. Thrust density is defined as the amount
of thrust generated per unit area, whereas efficiency is defined as thrust per unit power. Thrust
density for EHD thrusters is calculated from the effective area where EHD flow exists, i.e., the
mesh area. Figure 5.5 shows how the thrust density varies with the corona input power of the EHD
thruster. The electrical power was calculated from Eq. (2.2). A maximum thrust of 0.295 mN
corresponds to 13.67 N/m2 thrust density achieved at an input electrical power (aka corona power)
of 90.4 mW. Therefore, the thrust density per unit power for the EHD thruster is 151.17 N/m2W.
The efficiency is about 3.265 mN/W. This data can be compared to a piezo-actuated flapping-wing
such as the RoboFly [208], a measured efficiency of 12.2 mN/W. For a thrust of 0.736 mN, an
input power of 60 mW, and a 308 mm2 effective swept area of the wing, the thrust density is 2.39
N/m2. Therefore, the thrust density per unit power is 39.8 N/m2W. Therefore, while the efficiency
of the EHD thruster is lower than a flapping-wing robot of comparable size (the efficiency of the
flapping-wing robot is 3.74 times higher), the thrust density per unit power consumed is 3.8 times
71
higher for the EHD thruster. This is important because the thrust density correlates to the mass of
the thruster, and therefore this metric represents a scale-independent (and propulsion-type-
independent) measure of efficiency.
Figure 5.4. Thrust variation with applied voltage is depicted for each thruster of the quad-thruster
device. The input voltages range from 3 kV to 5.2 kV. The Townsend current model shown in
Figure 5.2 is used to compute the theoretical upper limit for the measured Coulomb force, and the
data capture this trend.
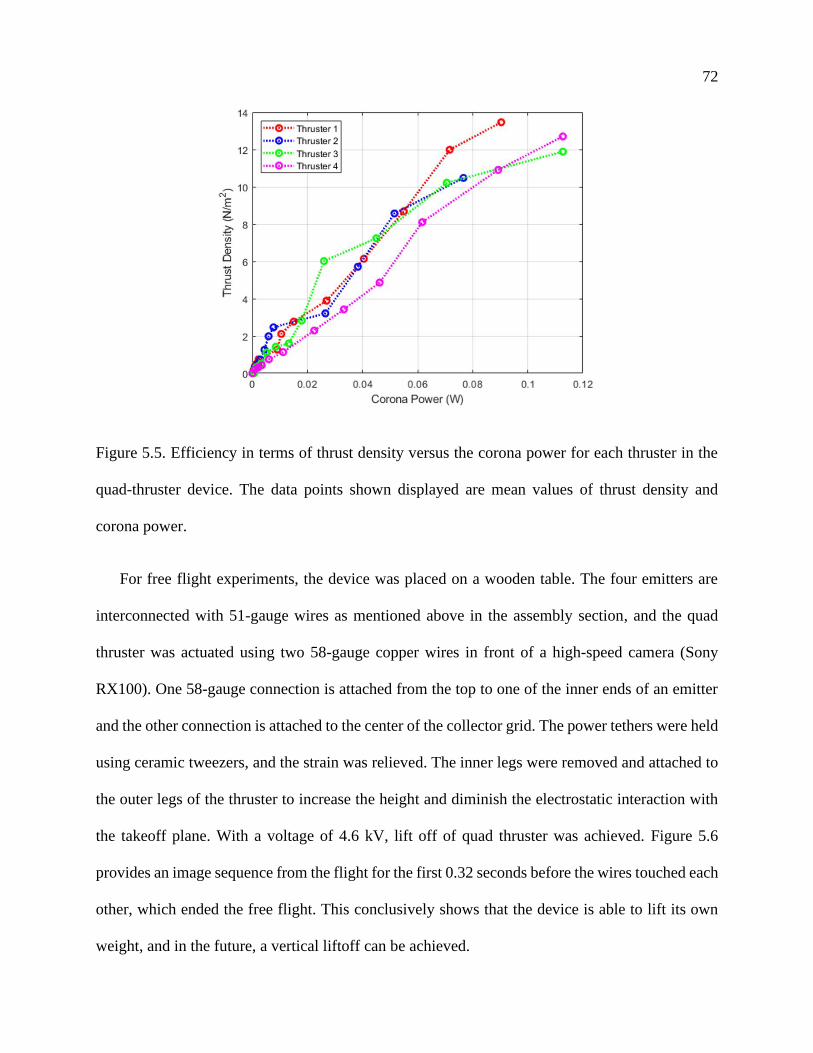
72
Figure 5.5. Efficiency in terms of thrust density versus the corona power for each thruster in the
quad-thruster device. The data points shown displayed are mean values of thrust density and
corona power.
For free flight experiments, the device was placed on a wooden table. The four emitters are
interconnected with 51-gauge wires as mentioned above in the assembly section, and the quad
thruster was actuated using two 58-gauge copper wires in front of a high-speed camera (Sony
RX100). One 58-gauge connection is attached from the top to one of the inner ends of an emitter
and the other connection is attached to the center of the collector grid. The power tethers were held
using ceramic tweezers, and the strain was relieved. The inner legs were removed and attached to
the outer legs of the thruster to increase the height and diminish the electrostatic interaction with
the takeoff plane. With a voltage of 4.6 kV, lift off of quad thruster was achieved. Figure 5.6
provides an image sequence from the flight for the first 0.32 seconds before the wires touched each
other, which ended the free flight. This conclusively shows that the device is able to lift its own
weight, and in the future, a vertical liftoff can be achieved.
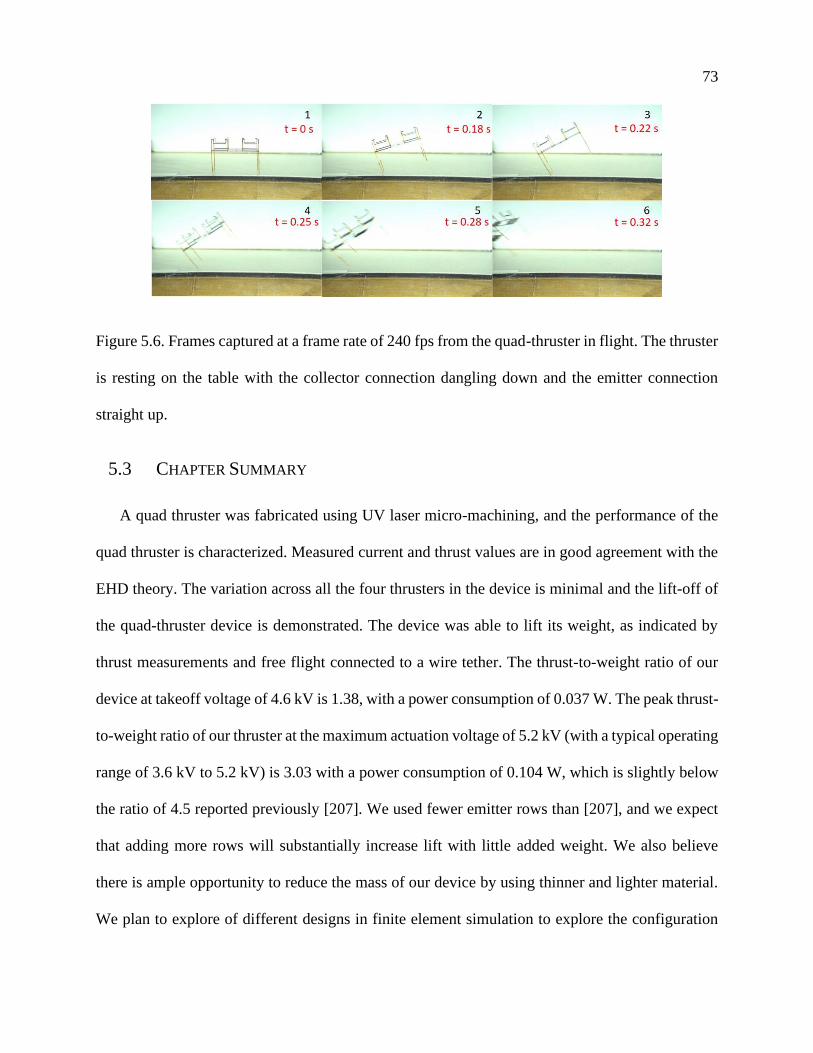
73
Figure 5.6. Frames captured at a frame rate of 240 fps from the quad-thruster in flight. The thruster
is resting on the table with the collector connection dangling down and the emitter connection
straight up.
5.3 CHAPTER SUMMARY
A quad thruster was fabricated using UV laser micro-machining, and the performance of the
quad thruster is characterized. Measured current and thrust values are in good agreement with the
EHD theory. The variation across all the four thrusters in the device is minimal and the lift-off of
the quad-thruster device is demonstrated. The device was able to lift its weight, as indicated by
thrust measurements and free flight connected to a wire tether. The thrust-to-weight ratio of our
device at takeoff voltage of 4.6 kV is 1.38, with a power consumption of 0.037 W. The peak thrust-
to-weight ratio of our thruster at the maximum actuation voltage of 5.2 kV (with a typical operating
range of 3.6 kV to 5.2 kV) is 3.03 with a power consumption of 0.104 W, which is slightly below
the ratio of 4.5 reported previously [207]. We used fewer emitter rows than [207], and we expect
that adding more rows will substantially increase lift with little added weight. We also believe
there is ample opportunity to reduce the mass of our device by using thinner and lighter material.
We plan to explore of different designs in finite element simulation to explore the configuration

74
space in greater detail. All of this work will contribute significantly to boosting the thrust-to-weight
ratio of our quad thruster device which is fundamental for EHD propelled centimeter-scale aerial
robots.
75
Chapter 6. CORONA DISCHARGE INDUCED FLOW ON A FLAT
PLATE
In this chapter, electrohydrodynamic (EHD) flow induced by planar corona discharge in the
wall boundary layer region is investigated experimentally and via a multiphysics computational
model. The EHD has many potential engineering applications; its optimization requires a
mechanistic understanding of ion and flow transport. The corona EHD actuator consisting of two
electrodes located in the wall boundary layer creates an EHD driven wall jet. The applied voltage
between the electrodes is varied, and the resulting effects in the charge density and flow field are
measured. Constant current hotwire anemometry is used to measure velocity profile. The airflow
near the wall acts as a jet and it reaches a maximum of 1.7 m/s with an energy conversion efficiency
of ~2%. The velocity decreases sharply in the normal direction. Multiphysics numerical model
couples ion transport equation and the Navier Stokes equations to solve for the spatiotemporal
distribution of electric field, charge density and flow field. The numerical results match
experimental data shedding new insights into mass, charge, and momentum transport phenomena.
The EHD driven flow can be applied to flow control strategies and the design of novel particle
collectors. This work is published in International Symposium on Electrohydrodynamics 2019, St.
Petersburg, Russia [12].
6.1 EXPERIMENTAL SETUP
The EHD flow is studied on a conducting and non-conducting flat plate with a shallow
rectangular cavity. Figure 6.1 shows the schematic representation of corona-discharge induced
flow in the wall boundary layer region on a flat plate with a cavity. Its objective is to accelerate
the flow near the wall to modify the boundary layer profile. The serrated edge copper electrode
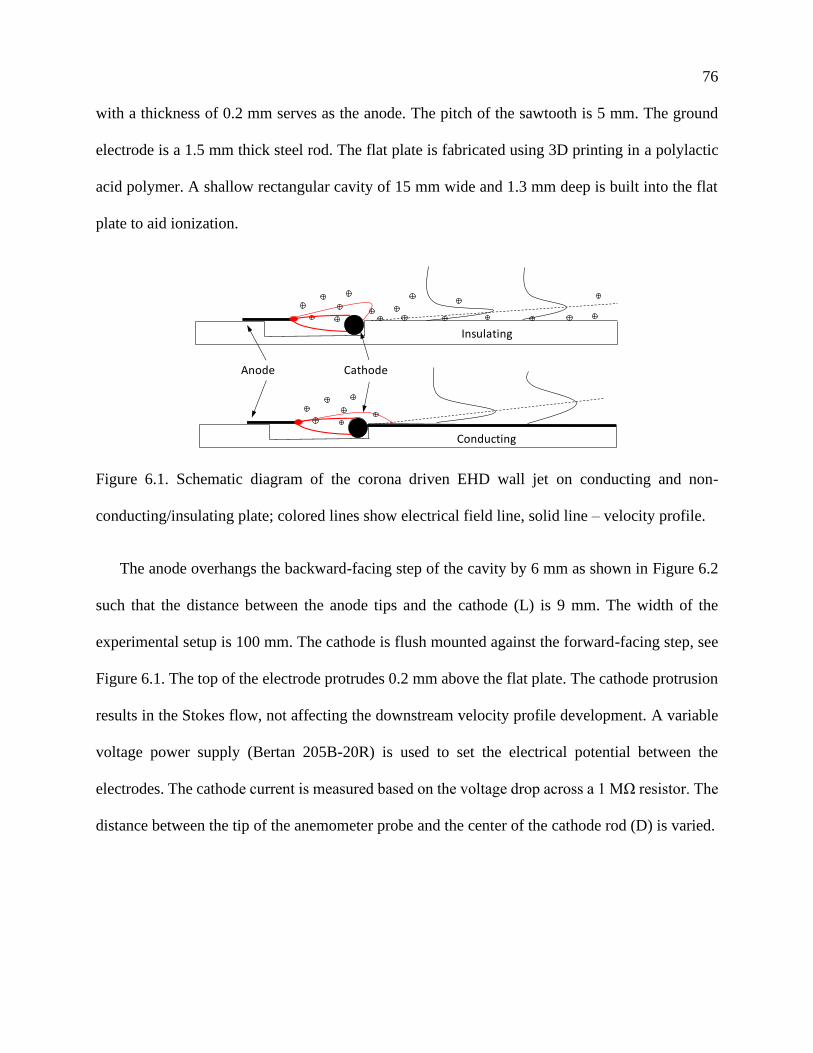
76
with a thickness of 0.2 mm serves as the anode. The pitch of the sawtooth is 5 mm. The ground
electrode is a 1.5 mm thick steel rod. The flat plate is fabricated using 3D printing in a polylactic
acid polymer. A shallow rectangular cavity of 15 mm wide and 1.3 mm deep is built into the flat
plate to aid ionization.
Figure 6.1. Schematic diagram of the corona driven EHD wall jet on conducting and non-
conducting/insulating plate; colored lines show electrical field line, solid line – velocity profile.
The anode overhangs the backward-facing step of the cavity by 6 mm as shown in Figure 6.2
such that the distance between the anode tips and the cathode (L) is 9 mm. The width of the
experimental setup is 100 mm. The cathode is flush mounted against the forward-facing step, see
Figure 6.1. The top of the electrode protrudes 0.2 mm above the flat plate. The cathode protrusion
results in the Stokes flow, not affecting the downstream velocity profile development. A variable
voltage power supply (Bertan 205B-20R) is used to set the electrical potential between the
electrodes. The cathode current is measured based on the voltage drop across a 1 MΩ resistor. The
distance between the tip of the anemometer probe and the center of the cathode rod (D) is varied.
Insulating
Conducting
Anode Cathode
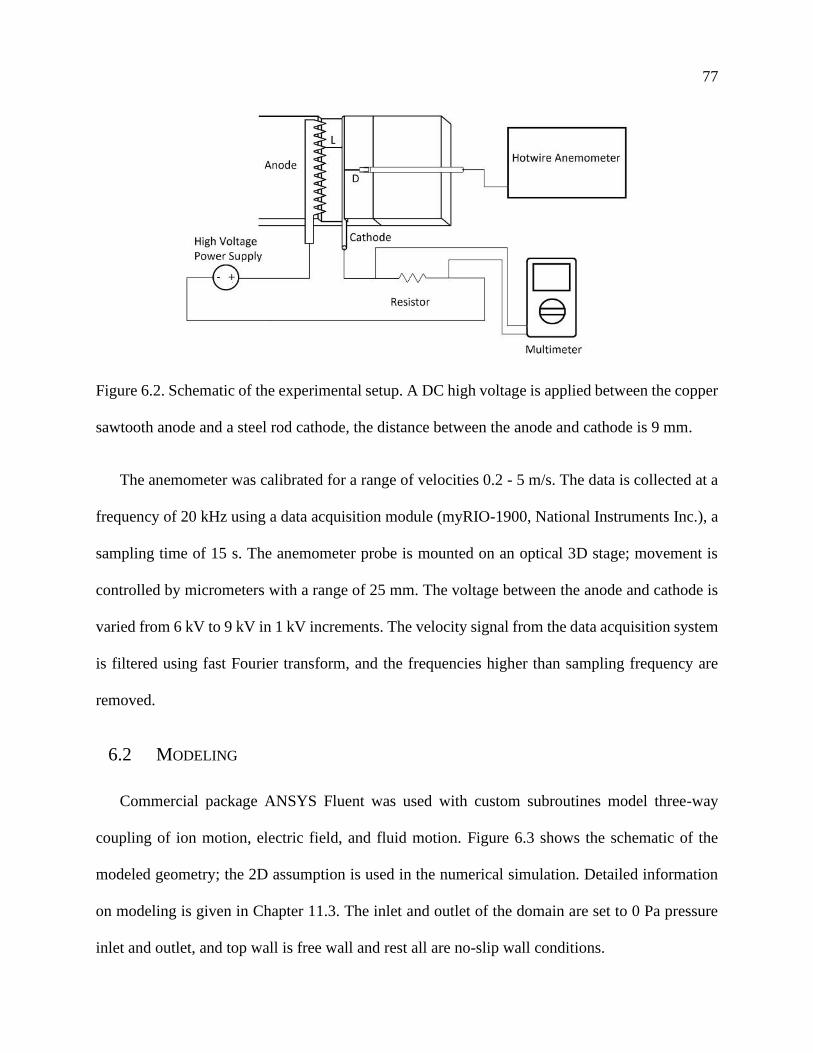
77
Figure 6.2. Schematic of the experimental setup. A DC high voltage is applied between the copper
sawtooth anode and a steel rod cathode, the distance between the anode and cathode is 9 mm.
The anemometer was calibrated for a range of velocities 0.2 - 5 m/s. The data is collected at a
frequency of 20 kHz using a data acquisition module (myRIO-1900, National Instruments Inc.), a
sampling time of 15 s. The anemometer probe is mounted on an optical 3D stage; movement is
controlled by micrometers with a range of 25 mm. The voltage between the anode and cathode is
varied from 6 kV to 9 kV in 1 kV increments. The velocity signal from the data acquisition system
is filtered using fast Fourier transform, and the frequencies higher than sampling frequency are
removed.
6.2 MODELING
Commercial package ANSYS Fluent was used with custom subroutines model three-way
coupling of ion motion, electric field, and fluid motion. Figure 6.3 shows the schematic of the
modeled geometry; the 2D assumption is used in the numerical simulation. Detailed information
on modeling is given in Chapter 11.3. The inlet and outlet of the domain are set to 0 Pa pressure
inlet and outlet, and top wall is free wall and rest all are no-slip wall conditions.
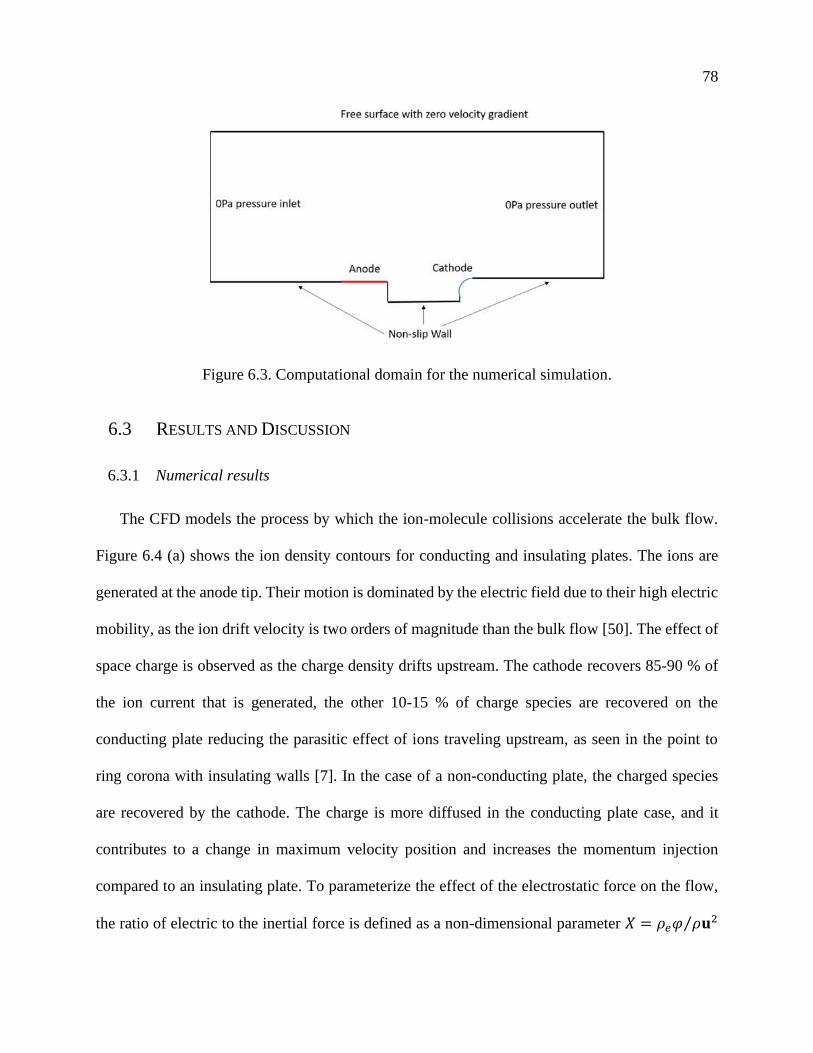
78
Figure 6.3. Computational domain for the numerical simulation.
6.3 RESULTS AND DISCUSSION
6.3.1 Numerical results
The CFD models the process by which the ion-molecule collisions accelerate the bulk flow.
Figure 6.4 (a) shows the ion density contours for conducting and insulating plates. The ions are
generated at the anode tip. Their motion is dominated by the electric field due to their high electric
mobility, as the ion drift velocity is two orders of magnitude than the bulk flow [50]. The effect of
space charge is observed as the charge density drifts upstream. The cathode recovers 85-90 % of
the ion current that is generated, the other 10-15 % of charge species are recovered on the
conducting plate reducing the parasitic effect of ions traveling upstream, as seen in the point to
ring corona with insulating walls [7]. In the case of a non-conducting plate, the charged species
are recovered by the cathode. The charge is more diffused in the conducting plate case, and it
contributes to a change in maximum velocity position and increases the momentum injection
compared to an insulating plate. To parameterize the effect of the electrostatic force on the flow,
the ratio of electric to the inertial force is defined as a non-dimensional parameter 𝑋 = 𝜌𝑒𝜑 𝜌𝐮2⁄
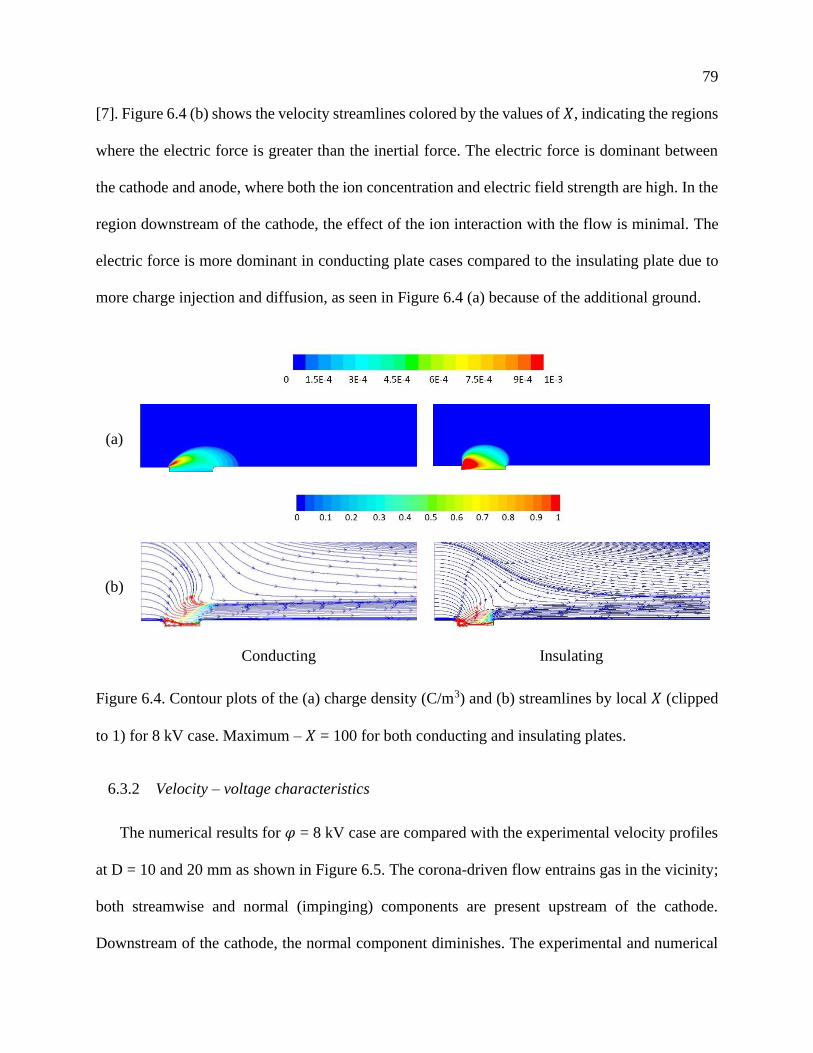
79
[7]. Figure 6.4 (b) shows the velocity streamlines colored by the values of 𝑋, indicating the regions
where the electric force is greater than the inertial force. The electric force is dominant between
the cathode and anode, where both the ion concentration and electric field strength are high. In the
region downstream of the cathode, the effect of the ion interaction with the flow is minimal. The
electric force is more dominant in conducting plate cases compared to the insulating plate due to
more charge injection and diffusion, as seen in Figure 6.4 (a) because of the additional ground.
(a)
(b)
Conducting Insulating
Figure 6.4. Contour plots of the (a) charge density (C/m3) and (b) streamlines by local 𝑋 (clipped
to 1) for 8 kV case. Maximum – 𝑋 = 100 for both conducting and insulating plates.
6.3.2 Velocity – voltage characteristics
The numerical results for 𝜑 = 8 kV case are compared with the experimental velocity profiles
at D = 10 and 20 mm as shown in Figure 6.5. The corona-driven flow entrains gas in the vicinity;
both streamwise and normal (impinging) components are present upstream of the cathode.
Downstream of the cathode, the normal component diminishes. The experimental and numerical
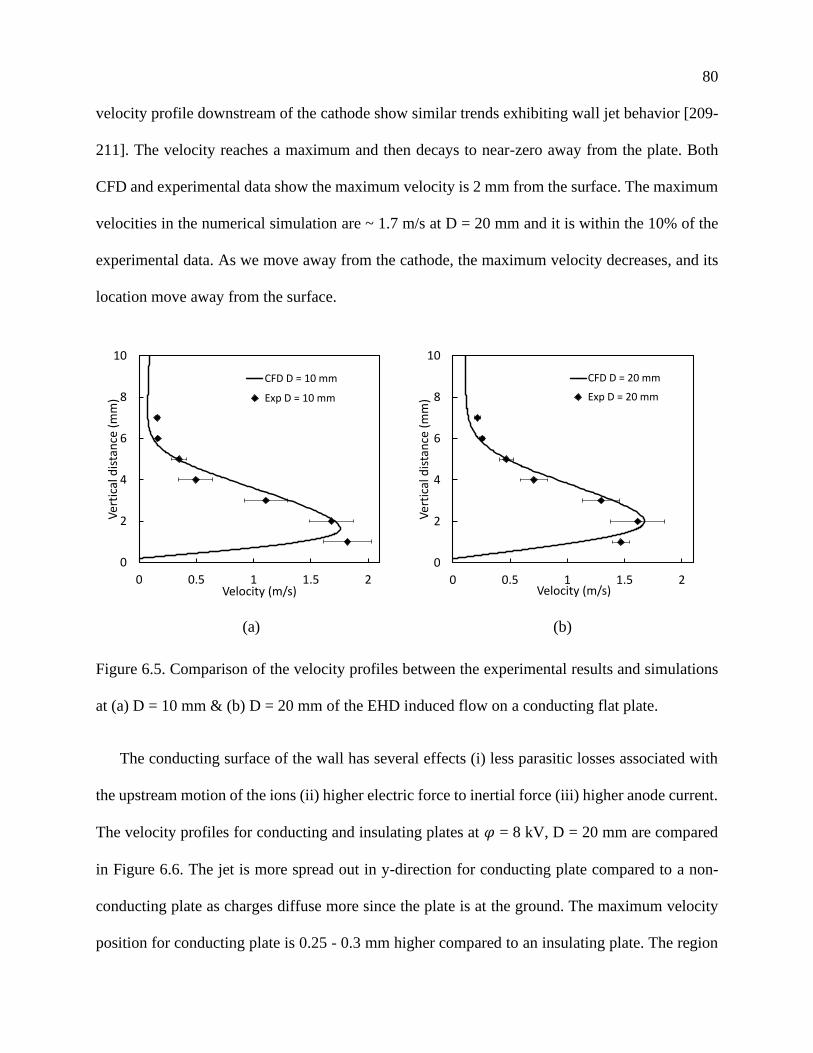
80
velocity profile downstream of the cathode show similar trends exhibiting wall jet behavior [209-
211]. The velocity reaches a maximum and then decays to near-zero away from the plate. Both
CFD and experimental data show the maximum velocity is 2 mm from the surface. The maximum
velocities in the numerical simulation are ~ 1.7 m/s at D = 20 mm and it is within the 10% of the
experimental data. As we move away from the cathode, the maximum velocity decreases, and its
location move away from the surface.
(a) (b)
Figure 6.5. Comparison of the velocity profiles between the experimental results and simulations
at (a) D = 10 mm & (b) D = 20 mm of the EHD induced flow on a conducting flat plate.
The conducting surface of the wall has several effects (i) less parasitic losses associated with
the upstream motion of the ions (ii) higher electric force to inertial force (iii) higher anode current.
The velocity profiles for conducting and insulating plates at 𝜑 = 8 kV, D = 20 mm are compared
in Figure 6.6. The jet is more spread out in y-direction for conducting plate compared to a non-
conducting plate as charges diffuse more since the plate is at the ground. The maximum velocity
position for conducting plate is 0.25 - 0.3 mm higher compared to an insulating plate. The region
0
2
4
6
8
10
0 0.5 1 1.5 2
Ver
tica
l dis
tan
ce (
mm
)
Velocity (m/s)
CFD D = 10 mm
Exp D = 10 mm
0
2
4
6
8
10
0 0.5 1 1.5 2
Ver
tica
l dis
tan
ce (
mm
)
Velocity (m/s)
CFD D = 20 mm
Exp D = 20 mm
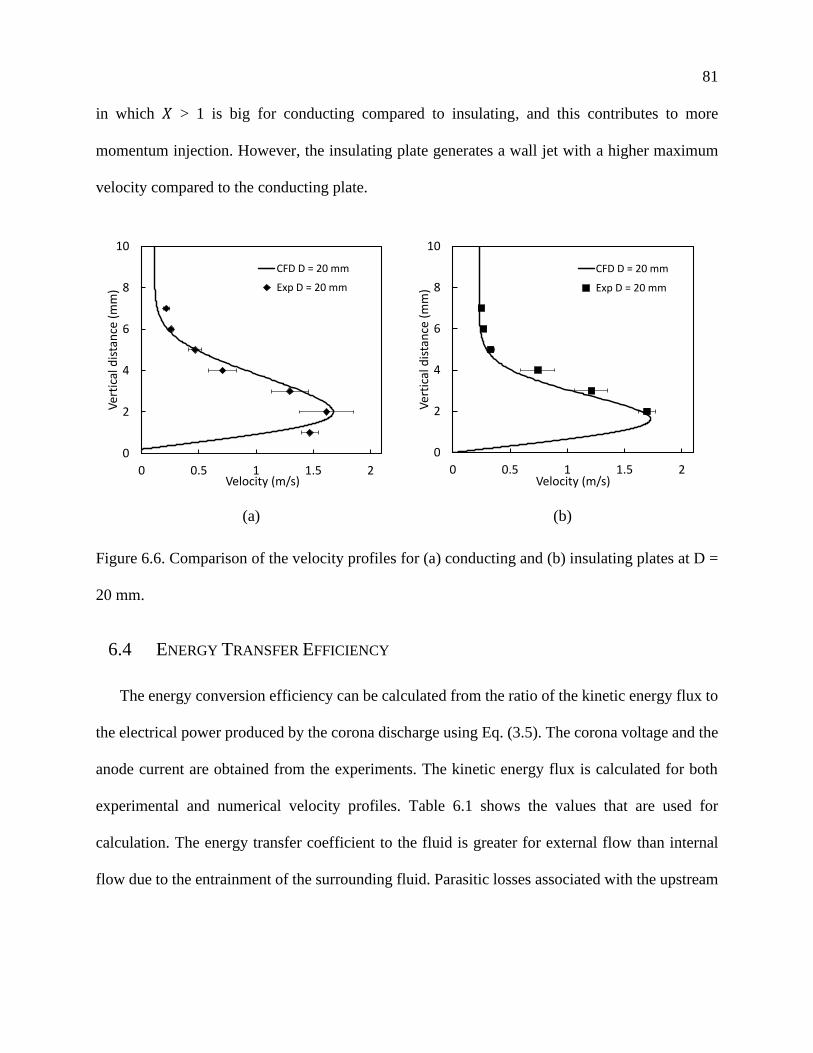
81
in which 𝑋 > 1 is big for conducting compared to insulating, and this contributes to more
momentum injection. However, the insulating plate generates a wall jet with a higher maximum
velocity compared to the conducting plate.
(a) (b)
Figure 6.6. Comparison of the velocity profiles for (a) conducting and (b) insulating plates at D =
20 mm.
6.4 ENERGY TRANSFER EFFICIENCY
The energy conversion efficiency can be calculated from the ratio of the kinetic energy flux to
the electrical power produced by the corona discharge using Eq. (3.5). The corona voltage and the
anode current are obtained from the experiments. The kinetic energy flux is calculated for both
experimental and numerical velocity profiles. Table 6.1 shows the values that are used for
calculation. The energy transfer coefficient to the fluid is greater for external flow than internal
flow due to the entrainment of the surrounding fluid. Parasitic losses associated with the upstream
0
2
4
6
8
10
0 0.5 1 1.5 2
Ver
tica
l dis
tan
ce (
mm
)
Velocity (m/s)
CFD D = 20 mm
Exp D = 20 mm
0
2
4
6
8
10
0 0.5 1 1.5 2
Ver
tica
l dis
tan
ce (
mm
)
Velocity (m/s)
CFD D = 20 mm
Exp D = 20 mm

82
motion of the ions and the formation of the flow recirculation zone due to adverse pressure gradient
are avoided by introducing the conducting surface downstream of the cathode.
Table 6.1. Comparison of electrical and kinetic power between the experiments and CFD
Conducting Insulating
𝑊𝐾,𝐸𝑥𝑝 (𝑚𝑊) 6.1 ± 15.2% 5.4 ± 19%
𝑊𝐾,𝐶𝐹𝐷 (𝑚𝑊) 5.9 5.23
𝐼 (𝜇𝐴) 35 33.4
𝑊𝐸 (𝑚𝑊) 280 267
Energy transfer efficiency is 2.17 % ± 0.33% based on experimental and 2.1% based on CFD
results for conducting plate and 2.02 % ± 0.38% and 1.95% for insulating plate. It was previously
shown that the energy transfer efficiency is non-linear to corona voltage [7]. The energy transfer
efficiency for external flows is higher than in the point-to-ring internal flow (~ 1%) [7]. Further
improvement in the energy transfer efficiency can be achieved by optimization of electrode
geometry configuration, operational condition. As discussed in this chapter, the surface corona
discharge near the wall can be used to modify the airflow in the boundary layer, drag reduction,
and separation control on airfoils. The effect of surface corona discharge on airfoils will be
discussed in Appendix A.
6.5 CHAPTER SUMMARY
This work presents an experimental and numerical investigation of planar corona discharge in
the wall boundary layer for conducting and insulating plate. The experimental data includes
voltage, current, and velocity profile measurements. Multiphysics numerical simulation sheds
83
insights into the interaction of force exerted by the motion of the ions in the electrical field on the
airflow. The addition of charge flux as a generation of ions allows for the direct computation of
electric body force. The numerical simulations agree with experimental data within 10%. The
velocity profile of the corona driven is similar to a wall jet downstream of the cathode. The
conducting plate entrains more momentum than the insulating plate because of a bigger region
where electric force 𝑋 > 1 is dominant. Parametrization of the EHD wall jet and comparison with
the traditional wall jet can be achieved using CFD modeling. The integrated velocity profile is
used to calculate the electric to kinetic energy transfer efficiency. The efficiency is ~2%, which is
greater than in the internal flow geometry due to higher flow entrainment. Energy transfer
efficiency can be optimized by electrode geometry configuration, operational conditions.
84
Chapter 7. DBD PLASMA ACTUATOR: EMPIRICAL RELATIONS
FOR DISCHARGE CURRENT AND MOMENTUM
This work is published in Journal of Physics D: Applied Physics [13]. The optical
measurements and velocity measurements are performed by Anthony Tang [13], and the results
are shown for completeness.
We present an experimental investigation of the DBD actuators, including electrical current
associated with microdischarges, plasma volume, and the wall jet momentum over a range of
alternating current (AC) frequencies (0.5 – 2 kHz) and peak-to-peak voltages up to 19.5 kV. This
experimental work can serve as the foundation for improved DBD models. Discharge current is
measured with a high temporal resolution, and plasma volume is characterized optically. The
momentum induced by the DBD wall jet is computed based on the axial velocities measured
downstream of the actuator using a custom-built pitot tube. Discharge current analysis
demonstrated asymmetry between the positive and negative semi-cycle; both currents yielded a
power-law relationship with empirical fitting coefficients. Plasma length varies linearly and
volume quadratically with voltage. Although plasma length reached an asymptotic value at a
higher frequency, the plasma volume grows due to the increasing height of the ionization region.
In a simple 2D configuration, the DBD wall jet momentum shows near-linear dependency with
discharge current in the range of voltages and frequencies considered in this chapter.
85
7.1 EXPERIMENTAL SETUP AND DIAGNOSTICS
7.1.1 DBD actuator
In the experimental setup, the electrodes are placed on opposite sides of the thin dielectric layer
in the asymmetric configuration, as shown in Figure 7.1. Both electrodes have straight edges
producing a uniform spanwise discharge, and thus, a 2D velocity profile. The dielectric material
used in this study is Kapton (7700 VPM @ 25 °C). Each actuator has 1 layer of Kapton-FN (FEP
layered Kapton) and 4 layers of Kapton-HN with a total thickness of ~330 μm (including the
adhesive). The DBD actuator is installed on the 6ʺ by 8ʺ acrylic plastic sheet. The ground electrode
(copper, 50 µm thick, 25 mm long, 110 mm wide) is flush-mounted on the acrylic plate. This
encapsulation prevents plasma formation on the lower side of the dielectric material. The upper
electrode (copper, 50 µm thick, 15 mm long, 110 mm wide) is glued onto the top of the Kapton
dielectric layer. There is no overlap between the electrodes in the x-direction. The high-voltage
(HV) electrode is exposed to atmospheric pressure air. The air-exposed HV electrode is connected
to a Trek PM04014 power supply that provides up to 20 kV AC high voltage. The voltage and
frequency were varied from 12 kV – 19.5 kV and 0.5 kHz – 2 kHz. This paper will use the
coordinate system established in Figure 7.1.

86
Figure 7.1. Schematic of the dielectric barrier discharge (DBD) plasma actuator. The plasma
actuator is mounted on an acrylic glass plate, and the blue region is the dielectric layer separating
the electrodes. The velocity is measured using a custom-built glass pitot tube, and the electrical
characteristics are measured using a Rogowski coil.
7.1.2 Plasma volume characterization
Optical measurements can be employed to reveal the light emitted during the plasma actuation,
and they can be used to characterize the plasma area or projected plasma volume region. Previous
studies have explored the one-dimensional plasma length and the plasma length's temporal
evolution [96, 99, 116]. The plasma region is captured using a camera, and thresholds are used to
identify the plasma regions. Figure 7.2 below illustrates the plasma volume projection onto the x-
y plane during the typical operation of the actuator. The threshold for this analysis is chosen to be
98% spectral intensity.
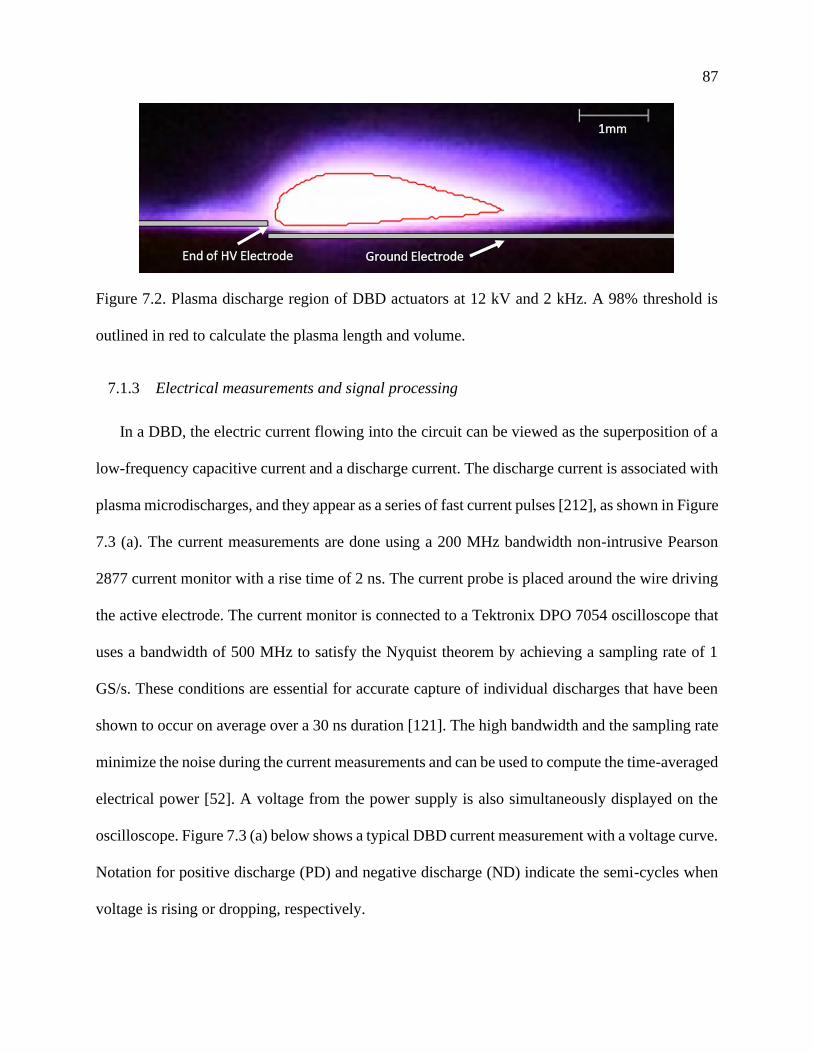
87
Figure 7.2. Plasma discharge region of DBD actuators at 12 kV and 2 kHz. A 98% threshold is
outlined in red to calculate the plasma length and volume.
7.1.3 Electrical measurements and signal processing
In a DBD, the electric current flowing into the circuit can be viewed as the superposition of a
low-frequency capacitive current and a discharge current. The discharge current is associated with
plasma microdischarges, and they appear as a series of fast current pulses [212], as shown in Figure
7.3 (a). The current measurements are done using a 200 MHz bandwidth non-intrusive Pearson
2877 current monitor with a rise time of 2 ns. The current probe is placed around the wire driving
the active electrode. The current monitor is connected to a Tektronix DPO 7054 oscilloscope that
uses a bandwidth of 500 MHz to satisfy the Nyquist theorem by achieving a sampling rate of 1
GS/s. These conditions are essential for accurate capture of individual discharges that have been
shown to occur on average over a 30 ns duration [121]. The high bandwidth and the sampling rate
minimize the noise during the current measurements and can be used to compute the time-averaged
electrical power [52]. A voltage from the power supply is also simultaneously displayed on the
oscilloscope. Figure 7.3 (a) below shows a typical DBD current measurement with a voltage curve.
Notation for positive discharge (PD) and negative discharge (ND) indicate the semi-cycles when
voltage is rising or dropping, respectively.
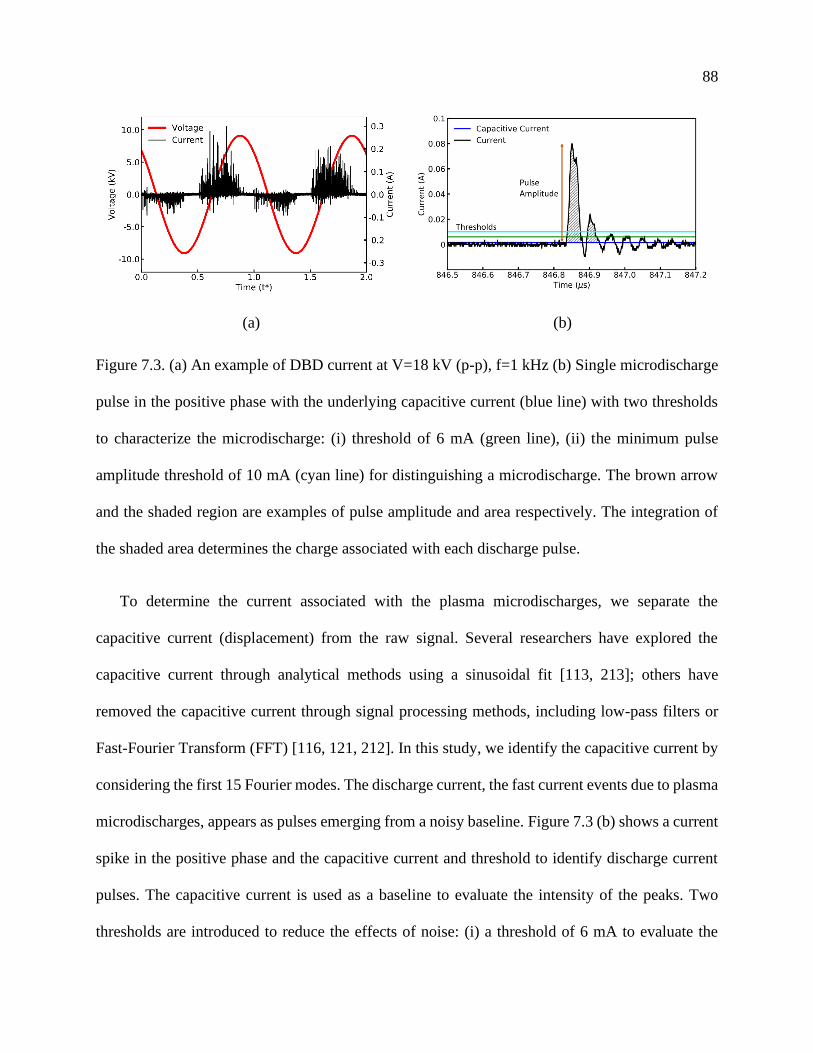
88
(a) (b)
Figure 7.3. (a) An example of DBD current at V=18 kV (p-p), f=1 kHz (b) Single microdischarge
pulse in the positive phase with the underlying capacitive current (blue line) with two thresholds
to characterize the microdischarge: (i) threshold of 6 mA (green line), (ii) the minimum pulse
amplitude threshold of 10 mA (cyan line) for distinguishing a microdischarge. The brown arrow
and the shaded region are examples of pulse amplitude and area respectively. The integration of
the shaded area determines the charge associated with each discharge pulse.
To determine the current associated with the plasma microdischarges, we separate the
capacitive current (displacement) from the raw signal. Several researchers have explored the
capacitive current through analytical methods using a sinusoidal fit [113, 213]; others have
removed the capacitive current through signal processing methods, including low-pass filters or
Fast-Fourier Transform (FFT) [116, 121, 212]. In this study, we identify the capacitive current by
considering the first 15 Fourier modes. The discharge current, the fast current events due to plasma
microdischarges, appears as pulses emerging from a noisy baseline. Figure 7.3 (b) shows a current
spike in the positive phase and the capacitive current and threshold to identify discharge current
pulses. The capacitive current is used as a baseline to evaluate the intensity of the peaks. Two
thresholds are introduced to reduce the effects of noise: (i) a threshold of 6 mA to evaluate the
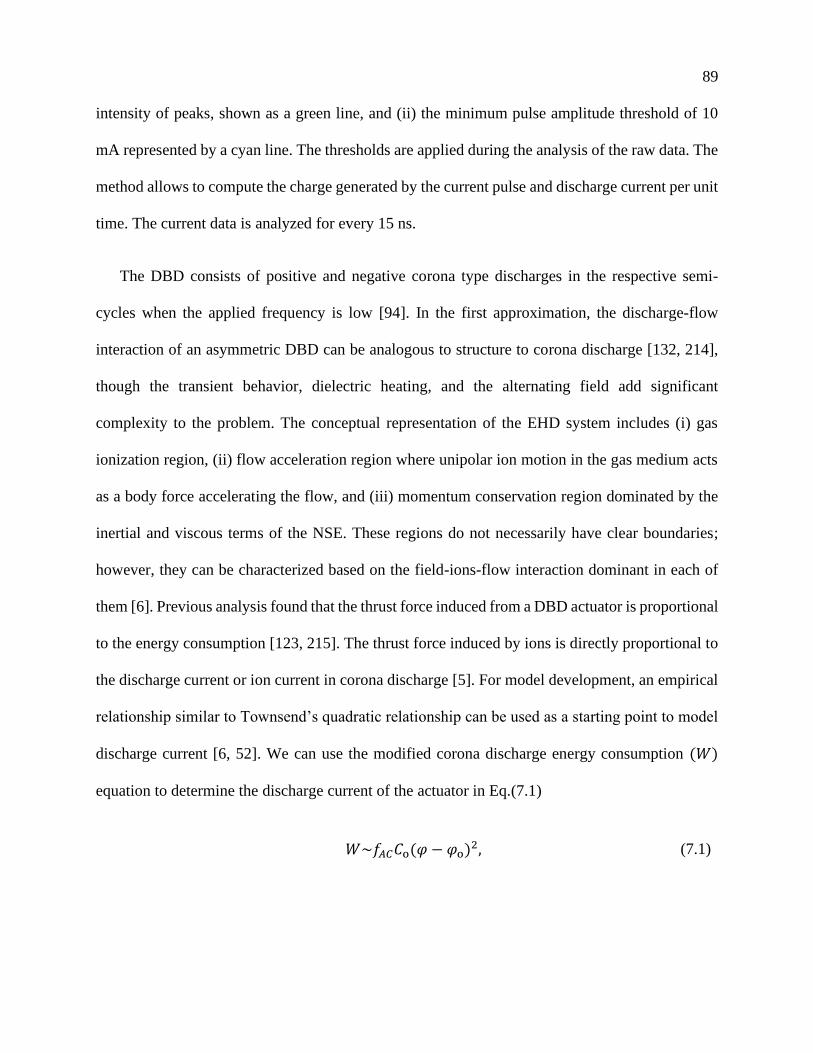
89
intensity of peaks, shown as a green line, and (ii) the minimum pulse amplitude threshold of 10
mA represented by a cyan line. The thresholds are applied during the analysis of the raw data. The
method allows to compute the charge generated by the current pulse and discharge current per unit
time. The current data is analyzed for every 15 ns.
The DBD consists of positive and negative corona type discharges in the respective semi-
cycles when the applied frequency is low [94]. In the first approximation, the discharge-flow
interaction of an asymmetric DBD can be analogous to structure to corona discharge [132, 214],
though the transient behavior, dielectric heating, and the alternating field add significant
complexity to the problem. The conceptual representation of the EHD system includes (i) gas
ionization region, (ii) flow acceleration region where unipolar ion motion in the gas medium acts
as a body force accelerating the flow, and (iii) momentum conservation region dominated by the
inertial and viscous terms of the NSE. These regions do not necessarily have clear boundaries;
however, they can be characterized based on the field-ions-flow interaction dominant in each of
them [6]. Previous analysis found that the thrust force induced from a DBD actuator is proportional
to the energy consumption [123, 215]. The thrust force induced by ions is directly proportional to
the discharge current or ion current in corona discharge [5]. For model development, an empirical
relationship similar to Townsend’s quadratic relationship can be used as a starting point to model
discharge current [6, 52]. We can use the modified corona discharge energy consumption (𝑊)
equation to determine the discharge current of the actuator in Eq.(7.1)
𝑊~𝑓𝐴𝐶𝐶o(𝜑 − 𝜑o)2, (7.1)
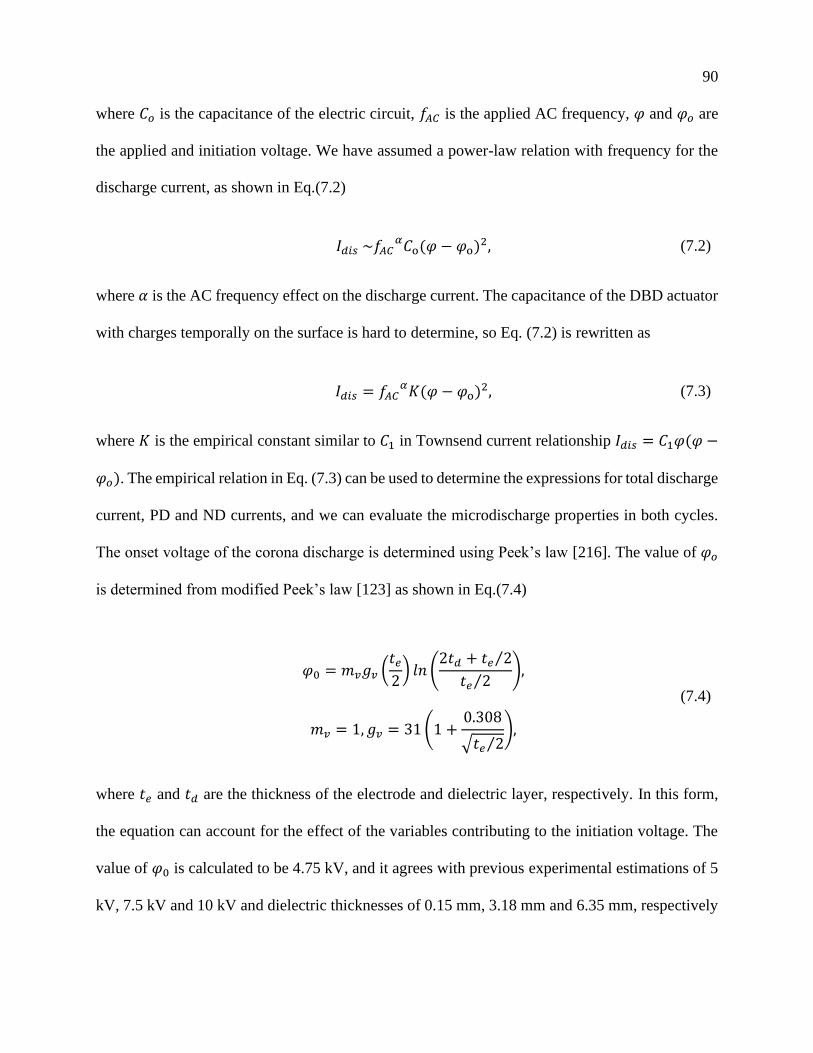
90
where 𝐶𝑜 is the capacitance of the electric circuit, 𝑓𝐴𝐶 is the applied AC frequency, 𝜑 and 𝜑𝑜 are
the applied and initiation voltage. We have assumed a power-law relation with frequency for the
discharge current, as shown in Eq.(7.2)
𝐼𝑑𝑖𝑠 ~𝑓𝐴𝐶𝛼𝐶o(𝜑 − 𝜑o)2, (7.2)
where 𝛼 is the AC frequency effect on the discharge current. The capacitance of the DBD actuator
with charges temporally on the surface is hard to determine, so Eq. (7.2) is rewritten as
𝐼𝑑𝑖𝑠 = 𝑓𝐴𝐶𝛼𝐾(𝜑 − 𝜑o)2, (7.3)
where 𝐾 is the empirical constant similar to 𝐶1 in Townsend current relationship 𝐼𝑑𝑖𝑠 = 𝐶1𝜑(𝜑 −
𝜑𝑜). The empirical relation in Eq. (7.3) can be used to determine the expressions for total discharge
current, PD and ND currents, and we can evaluate the microdischarge properties in both cycles.
The onset voltage of the corona discharge is determined using Peek’s law [216]. The value of 𝜑𝑜
is determined from modified Peek’s law [123] as shown in Eq.(7.4)
𝜑0 = 𝑚𝑣𝑔𝑣 (𝑡𝑒
2) 𝑙𝑛 (
2𝑡𝑑 + 𝑡𝑒 2⁄
𝑡𝑒 2⁄),
𝑚𝑣 = 1, 𝑔𝑣 = 31 (1 +0.308
√𝑡𝑒 2⁄),
(7.4)
where 𝑡𝑒 and 𝑡𝑑 are the thickness of the electrode and dielectric layer, respectively. In this form,
the equation can account for the effect of the variables contributing to the initiation voltage. The
value of 𝜑0 is calculated to be 4.75 kV, and it agrees with previous experimental estimations of 5
kV, 7.5 kV and 10 kV and dielectric thicknesses of 0.15 mm, 3.18 mm and 6.35 mm, respectively
91
[135]. The 𝜑𝑜 value is used for developing different power-law relationships for the discharge
current, the plasma volume, and the momentum induced by the wall jet.
7.1.4 Wall jet characterization
The flow field induced by ions characterizes the fluid mechanical properties of the plasma
actuators. To measure the time-averaged ionic wind velocity, we employ a custom-made glass
pitot tube with a 0.4 mm inner diameter and 0.5 mm outside diameter. Compared to traditional
stainless steel pitot tubes, the glass tube minimizes electrical interaction with the discharge. This
method has been previously used to characterize plasma actuators’ performance [96, 212, 217].
The pitot tube mounted to an optical table and controlled in the x and y-axis, is connected to a
Furness Controls FCO354 differential pressure transmitter (0 – 30 Pa) connected to a data logger.
In this experiment, only x-velocity measurements are taken at varying x positions (10 mm, 15 mm,
40 mm, and 75 mm) downstream on the active electrode edge. At each x position, the y-velocity
profile is obtained from the surface to 6 mm above the plate at increments of 0.25 mm or 0.5 mm
(at a higher location). The DBD actuator’s total momentum per meter spanwise can be found from
the following expression
𝑀 = 𝜌 ∫ 𝑈2(𝑦)𝑑𝑦.𝑦 = ∞
𝑦 = 0
(7.5)
7.2 RESULTS AND DISCUSSION
7.2.1 Effect of voltage and frequency on the plasma volume
In this section, the impacts of voltage and frequency on the effective plasma region are
discussed. Figure 7.4(a) presents the plasma length, measured from the edge of the plasma actuator
to the furthest point downstream, as a function of voltage (12 kV – 19.5 kV) at varying frequencies
92
(0.5 kHz – 2 kHz). The plasma region measurements are time-averaged of at least four images for
each condition. Recent studies have explored the discharge's temporal difference in the positive
and negative cycles [218]. It is possible the plasma volume changes between the PD and ND, and
the limitation of this work is that the photographs' exposure time (1/3 s) does not allow to capture
of transient phenomena. For that reason, the individual contributions of PD and ND are not
analyzed in this work, and only total discharge current is used in the empirical correlations. The
results support previously reported results, both experimental and numerical, that plasma length
increases linearly with applied voltage [99, 113]. However, increases in frequency appear to
asymptotically increase plasma lengths until 2 kHz. This asymptotic limit may correspond to the
asymptotic limit between the max velocity and frequency at similar voltages where max velocities
did not increase after frequencies larger than approximately 2 kHz [94]. However, Orlov reported
the plasma length asymptotically approaches a limit at approximately 6 kHz while at 5 kV [113];
thus there may be different asymptotic limits with varying dielectrics and electrode configuration.
At our maximum conditions of 19.5 kV and 2 kHz, the dielectric layer breakdown occurred after
60 min of operation, which was not often sufficient to take the entire set of the velocity data; thus,
we did not explore higher frequency conditions. It was possible to operate the actuator at lower
voltages and higher frequencies and then develop universal power-law equations. However, as we
attempted to maximize the momentum injection, this exploration is out of the paper's scope, and
further experimentation at a broader range of frequencies is necessary.
While the physical mechanisms such as ion recombination may play a role in limiting the
plasma length, the thickness of the dielectric material has been previously noted to play a
significant role in plasma extension length. These results support previously reported lengths
between 3 mm and 8 mm when the dielectric is less than 1 mm [96, 99, 153]. Thicker dielectrics
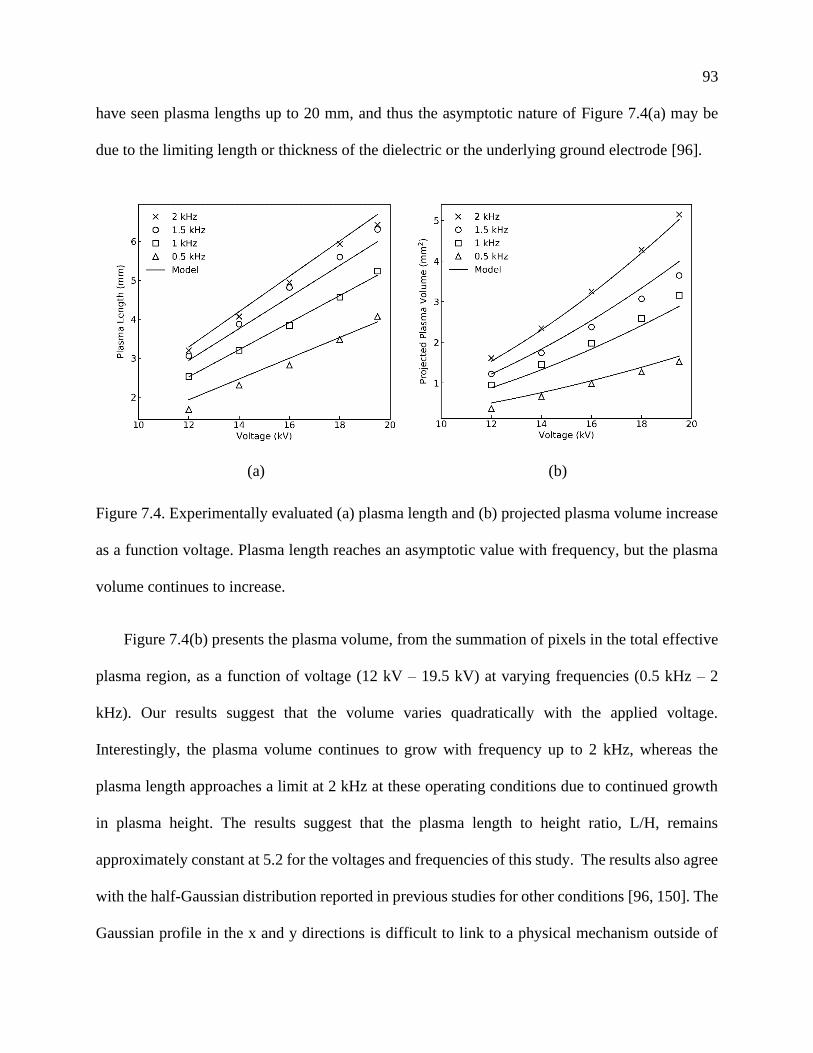
93
have seen plasma lengths up to 20 mm, and thus the asymptotic nature of Figure 7.4(a) may be
due to the limiting length or thickness of the dielectric or the underlying ground electrode [96].
(a) (b)
Figure 7.4. Experimentally evaluated (a) plasma length and (b) projected plasma volume increase
as a function voltage. Plasma length reaches an asymptotic value with frequency, but the plasma
volume continues to increase.
Figure 7.4(b) presents the plasma volume, from the summation of pixels in the total effective
plasma region, as a function of voltage (12 kV – 19.5 kV) at varying frequencies (0.5 kHz – 2
kHz). Our results suggest that the volume varies quadratically with the applied voltage.
Interestingly, the plasma volume continues to grow with frequency up to 2 kHz, whereas the
plasma length approaches a limit at 2 kHz at these operating conditions due to continued growth
in plasma height. The results suggest that the plasma length to height ratio, L/H, remains
approximately constant at 5.2 for the voltages and frequencies of this study. The results also agree
with the half-Gaussian distribution reported in previous studies for other conditions [96, 150]. The
Gaussian profile in the x and y directions is difficult to link to a physical mechanism outside of
94
time-averaged space charge interactions and electric field interactions with the dielectric. The L/H
reduces to ~ 5.07 for the highest frequency, influencing the spatial distribution of body forces
acting on the fluid and thus the resulting wall jet profile. Though the space charge distribution
changes (shape of the ionization region), the preliminary analysis (See Figure 7.7) shows that
average charge density does not change significantly between 1 and 2 kHz.
The empirical expressions for the plasma length and height can be determined through curve
fitting. In this voltage range, plasma length (𝐿𝑃) is found to vary linearly with voltage and by
power-law with frequency as expressed in Eq. (7.6) and plasma volume (𝑉𝑃) is found to exhibit a
power-law relationship with both voltage and frequency as expressed in Eq.(7.7)
𝐿𝑃 = 𝐾1𝑓𝐴𝐶𝛼1(𝜑 − 𝜑𝑜), (7.6)
𝑉𝑃 = 𝐾2𝑓𝐴𝐶𝛼(𝜑 − 𝜑𝑜)𝛾. (7.7)
In numerical modeling for a source term, one needs to define the volume of charge injection.
A gaussian ion-concentration distribution can then be applied to the empirical plasma length and
height, and this relationship eliminates the dependency on a guessed Debye length. Subsequent
coupling of body force and the Navier-Stokes equation allows for modeling the EHD force term.
7.2.2 Discharge current characteristics
Temporally resolved current measurements allow characterizing the microdischarges for both
the positive and negative cycles. During the microdischarge, the charged species are transported
towards the electrodes, thus generating an electrical signal in the form of a pulse superimposed on
a slow-moving capacitive current. The latter can be subtracted, and the current associated with
microdischarges can be analyzed. In the PD portion of the cycle, the electrons move towards the
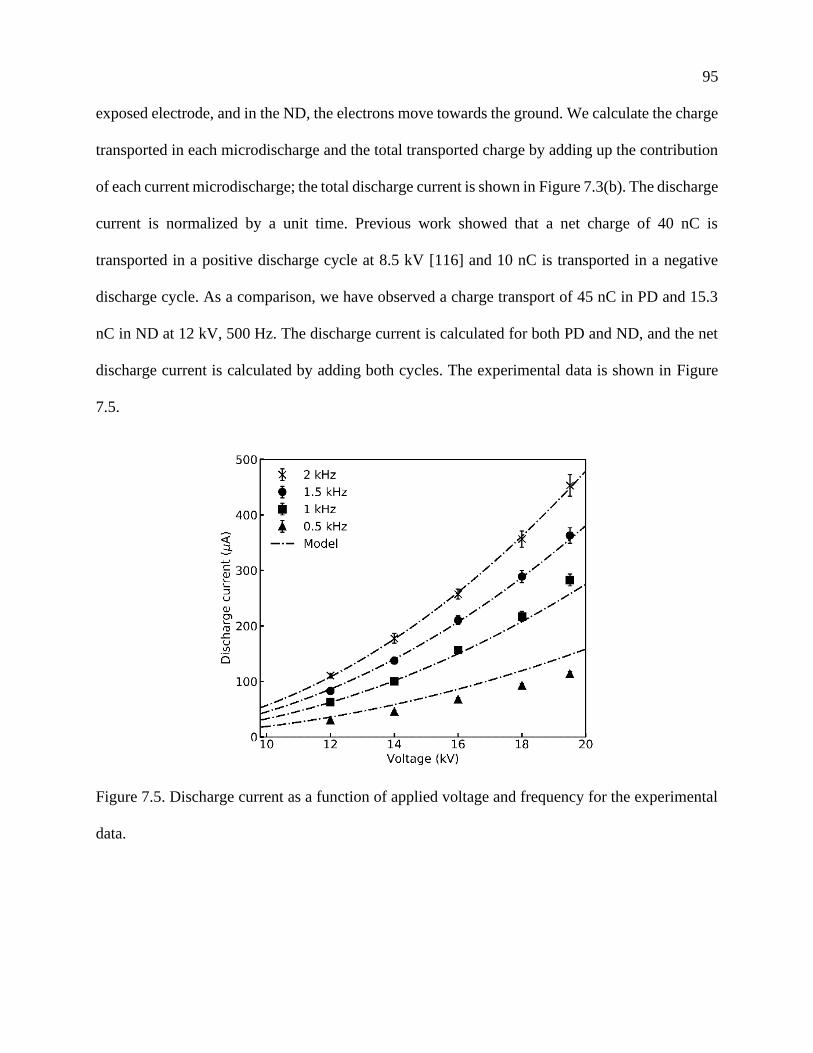
95
exposed electrode, and in the ND, the electrons move towards the ground. We calculate the charge
transported in each microdischarge and the total transported charge by adding up the contribution
of each current microdischarge; the total discharge current is shown in Figure 7.3(b). The discharge
current is normalized by a unit time. Previous work showed that a net charge of 40 nC is
transported in a positive discharge cycle at 8.5 kV [116] and 10 nC is transported in a negative
discharge cycle. As a comparison, we have observed a charge transport of 45 nC in PD and 15.3
nC in ND at 12 kV, 500 Hz. The discharge current is calculated for both PD and ND, and the net
discharge current is calculated by adding both cycles. The experimental data is shown in Figure
7.5.
Figure 7.5. Discharge current as a function of applied voltage and frequency for the experimental
data.
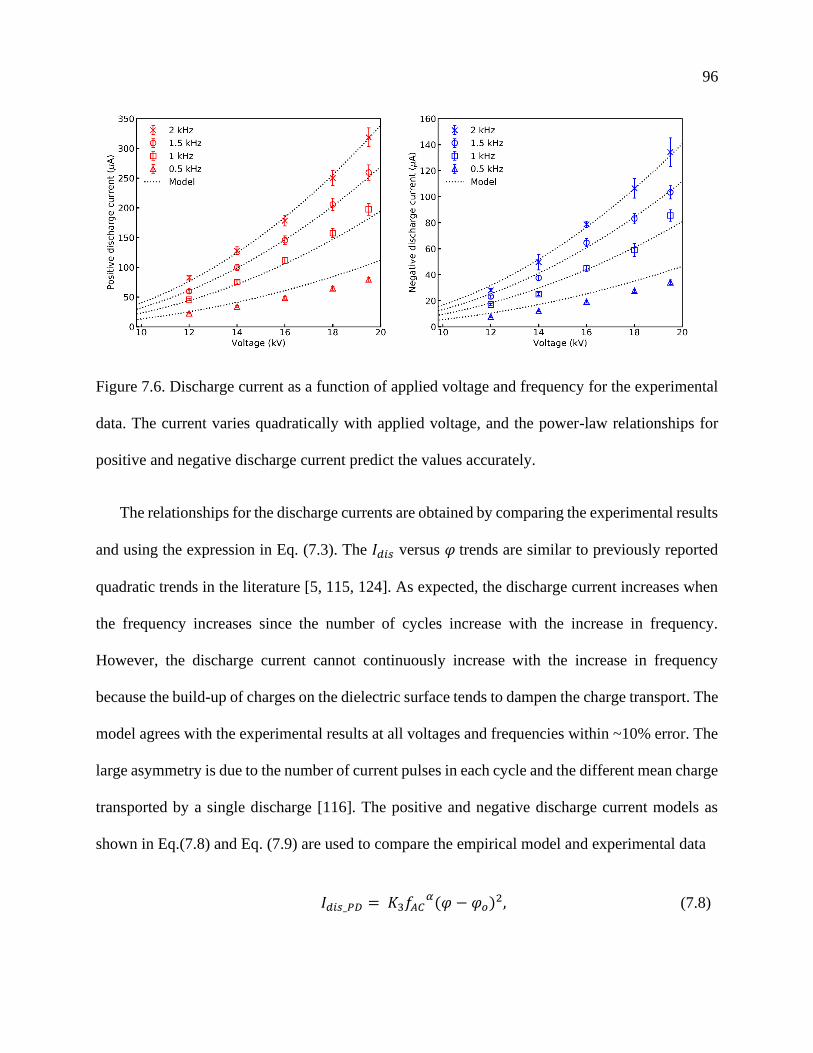
96
Figure 7.6. Discharge current as a function of applied voltage and frequency for the experimental
data. The current varies quadratically with applied voltage, and the power-law relationships for
positive and negative discharge current predict the values accurately.
The relationships for the discharge currents are obtained by comparing the experimental results
and using the expression in Eq. (7.3). The 𝐼𝑑𝑖𝑠 versus 𝜑 trends are similar to previously reported
quadratic trends in the literature [5, 115, 124]. As expected, the discharge current increases when
the frequency increases since the number of cycles increase with the increase in frequency.
However, the discharge current cannot continuously increase with the increase in frequency
because the build-up of charges on the dielectric surface tends to dampen the charge transport. The
model agrees with the experimental results at all voltages and frequencies within ~10% error. The
large asymmetry is due to the number of current pulses in each cycle and the different mean charge
transported by a single discharge [116]. The positive and negative discharge current models as
shown in Eq.(7.8) and Eq. (7.9) are used to compare the empirical model and experimental data
𝐼𝑑𝑖𝑠_𝑃𝐷 = 𝐾3𝑓𝐴𝐶𝛼(𝜑 − 𝜑𝑜)2, (7.8)
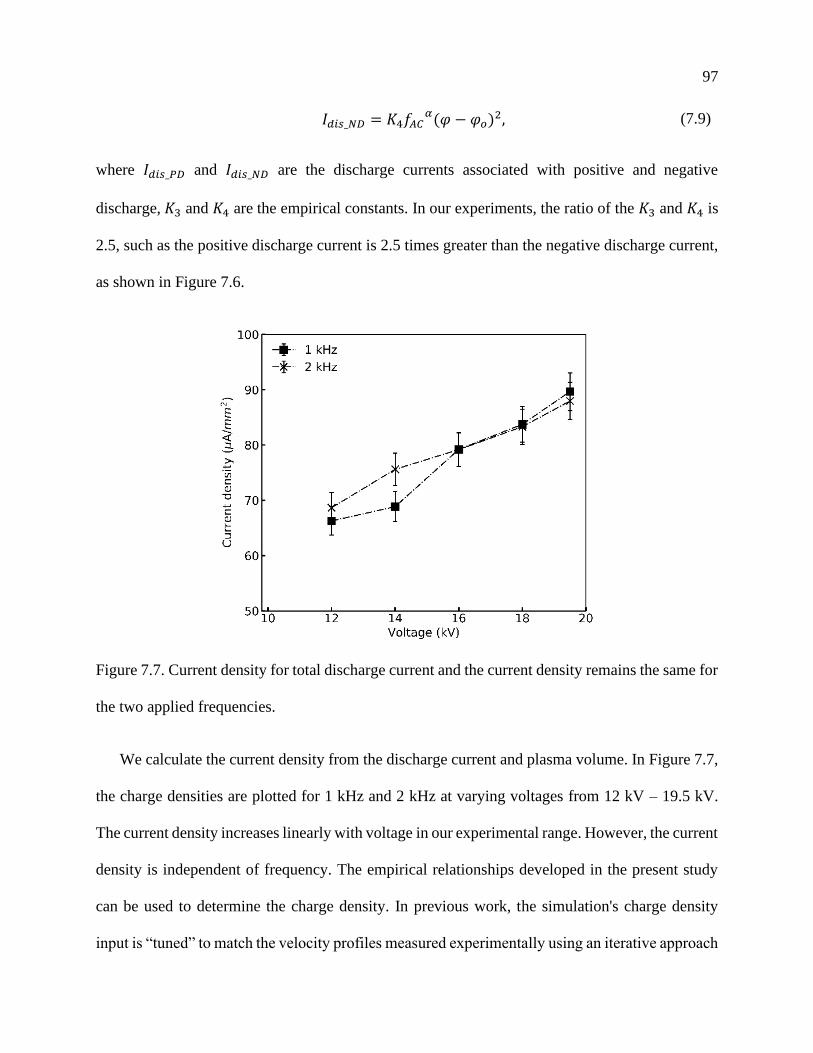
97
𝐼𝑑𝑖𝑠_𝑁𝐷 = 𝐾4𝑓𝐴𝐶𝛼(𝜑 − 𝜑𝑜)2, (7.9)
where 𝐼𝑑𝑖𝑠_𝑃𝐷 and 𝐼𝑑𝑖𝑠_𝑁𝐷 are the discharge currents associated with positive and negative
discharge, 𝐾3 and 𝐾4 are the empirical constants. In our experiments, the ratio of the 𝐾3 and 𝐾4 is
2.5, such as the positive discharge current is 2.5 times greater than the negative discharge current,
as shown in Figure 7.6.
Figure 7.7. Current density for total discharge current and the current density remains the same for
the two applied frequencies.
We calculate the current density from the discharge current and plasma volume. In Figure 7.7,
the charge densities are plotted for 1 kHz and 2 kHz at varying voltages from 12 kV – 19.5 kV.
The current density increases linearly with voltage in our experimental range. However, the current
density is independent of frequency. The empirical relationships developed in the present study
can be used to determine the charge density. In previous work, the simulation's charge density
input is “tuned” to match the velocity profiles measured experimentally using an iterative approach
98
[219]. The discharge current and discharge volume computed in this manuscript can be used as
input parameters for a numerical model, addressing time-resolved flow and detailed species
transport modeling. The expressions in Eq. Eq.(7.8) and Eq. (7.9) can be used to gain insight into
the momentum transfer process in positive and negative cycles.
7.2.3 Relationship between discharge current and momentum
Analysis of wall jet momentum arguably is more important for the characterization of the wall
jet. It is also less susceptible to errors associated with probe positioning and geometry as multiple
data points are taken at each x location. Figure 7.8(a) shows the DBD wall jet momentum
calculated using equation (7.5) at x = 15 mm. The x = 10 mm location is not used; for the 19.5 kV
condition, the 10mm case had lower velocities than 15 mm. This is likely due to (i) probe
interaction with plasma volume (plasma length ~ 7 mm), (ii) the flow was still accelerating (X >1)
where the ratio of Coulombic force and an inertial term in the Navier-Stokes equation is presented
as a nondimensional parameter X. Excluding the 19.5 kV case, the momentum calculated at x = 10
mm is nearly identical to the momentum calculated at x = 15 mm. The momentum increases with
the applied voltage and frequency for all studied conditions.
To understand the relationship between the fluid dynamic and plasma discharge, the induced
wall jet momentum induced is plotted against the voltage and discharge current in Figure 7.8. As
expected, the increase in voltage and frequency leads to higher momentum. We do not have
sufficient data to quantify the trend. However, the comparison of momentum and total discharge
current combines both frequency and voltage effects, reducing the data to a single line. In this
analysis, only 8 data points are included over a relatively narrow range of frequencies. The least-
square fit shows that the momentum increases linearly with the discharge current, as shown in
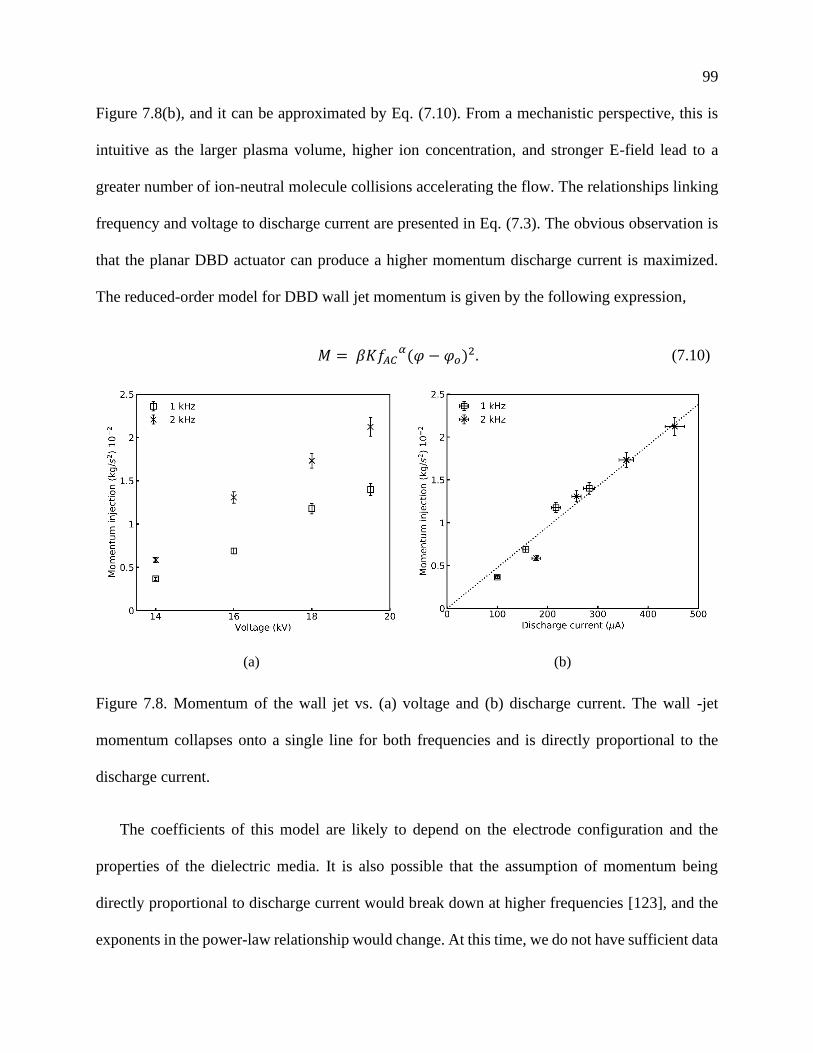
99
Figure 7.8(b), and it can be approximated by Eq. (7.10). From a mechanistic perspective, this is
intuitive as the larger plasma volume, higher ion concentration, and stronger E-field lead to a
greater number of ion-neutral molecule collisions accelerating the flow. The relationships linking
frequency and voltage to discharge current are presented in Eq. (7.3). The obvious observation is
that the planar DBD actuator can produce a higher momentum discharge current is maximized.
The reduced-order model for DBD wall jet momentum is given by the following expression,
𝑀 = 𝛽𝐾𝑓𝐴𝐶𝛼(𝜑 − 𝜑𝑜)2. (7.10)
(a) (b)
Figure 7.8. Momentum of the wall jet vs. (a) voltage and (b) discharge current. The wall -jet
momentum collapses onto a single line for both frequencies and is directly proportional to the
discharge current.
The coefficients of this model are likely to depend on the electrode configuration and the
properties of the dielectric media. It is also possible that the assumption of momentum being
directly proportional to discharge current would break down at higher frequencies [123], and the
exponents in the power-law relationship would change. At this time, we do not have sufficient data
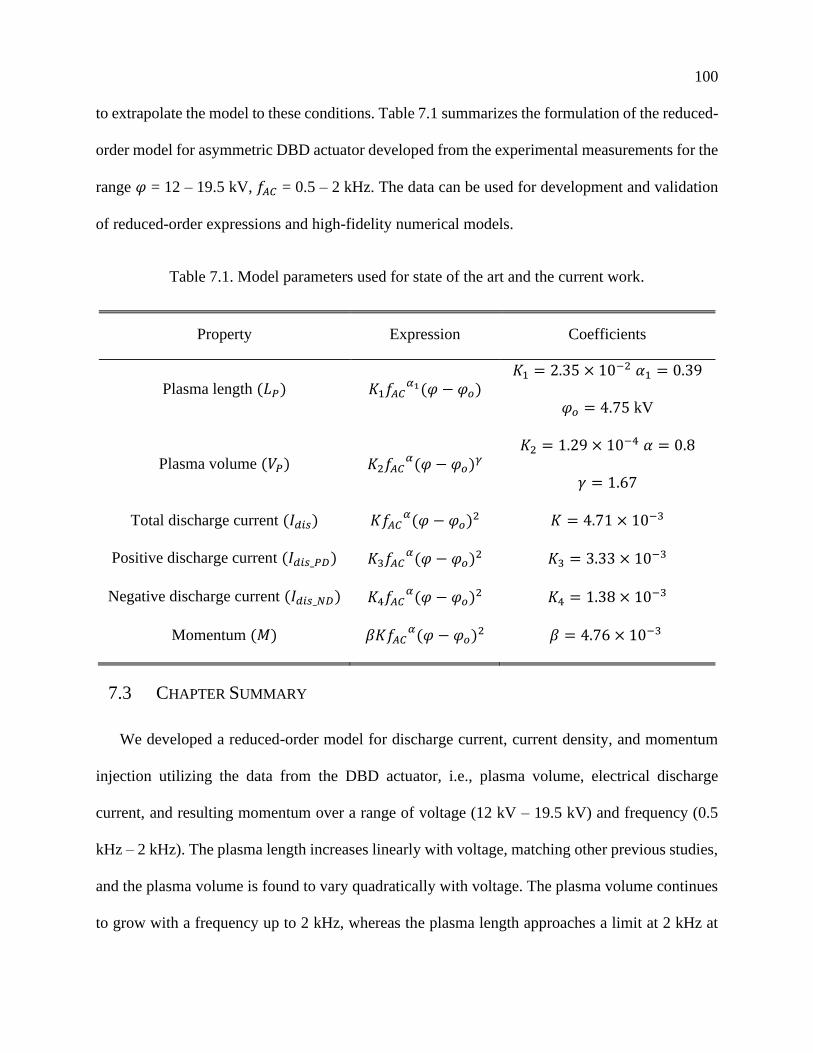
100
to extrapolate the model to these conditions. Table 7.1 summarizes the formulation of the reduced-
order model for asymmetric DBD actuator developed from the experimental measurements for the
range 𝜑 = 12 – 19.5 kV, 𝑓𝐴𝐶 = 0.5 – 2 kHz. The data can be used for development and validation
of reduced-order expressions and high-fidelity numerical models.
Table 7.1. Model parameters used for state of the art and the current work.
Property Expression Coefficients
Plasma length (𝐿𝑃) 𝐾1𝑓𝐴𝐶𝛼1(𝜑 − 𝜑𝑜)
𝐾1 = 2.35 × 10⁻² 𝛼1 = 0.39
𝜑𝑜 = 4.75 kV
Plasma volume (𝑉𝑃) 𝐾2𝑓𝐴𝐶𝛼(𝜑 − 𝜑𝑜)𝛾
𝐾2 = 1.29 × 10⁻⁴ 𝛼 = 0.8
𝛾 = 1.67
Total discharge current (𝐼𝑑𝑖𝑠) 𝐾𝑓𝐴𝐶𝛼(𝜑 − 𝜑𝑜)2 𝐾 = 4.71 × 10⁻³
Positive discharge current (𝐼𝑑𝑖𝑠_𝑃𝐷) 𝐾3𝑓𝐴𝐶𝛼(𝜑 − 𝜑𝑜)2 𝐾3 = 3.33 × 10⁻³
Negative discharge current (𝐼𝑑𝑖𝑠_𝑁𝐷) 𝐾4𝑓𝐴𝐶𝛼(𝜑 − 𝜑𝑜)2 𝐾4 = 1.38 × 10⁻³
Momentum (𝑀) 𝛽𝐾𝑓𝐴𝐶𝛼(𝜑 − 𝜑𝑜)2 𝛽 = 4.76 × 10⁻³
7.3 CHAPTER SUMMARY
We developed a reduced-order model for discharge current, current density, and momentum
injection utilizing the data from the DBD actuator, i.e., plasma volume, electrical discharge
current, and resulting momentum over a range of voltage (12 kV – 19.5 kV) and frequency (0.5
kHz – 2 kHz). The plasma length increases linearly with voltage, matching other previous studies,
and the plasma volume is found to vary quadratically with voltage. The plasma volume continues
to grow with a frequency up to 2 kHz, whereas the plasma length approaches a limit at 2 kHz at
101
these operating conditions. The increase in volume is due to continued growth in plasma height,
suggesting that plasma volume can be a better input in CFD modeling.
The current associated with microdischarges was measured using a Rogowski coil with high
temporal resolution. The charge transported in each microdischarge and the corresponding
discharge current were calculated for both PD and ND semi-cycles. The discharge current analysis
yielded a power law for the positive and negative discharge current associated with
microdischarges in the form 𝐼𝑑𝑖𝑠 = 𝐾𝑓𝛼(𝜑 − 𝜑𝑜)2. Comparing the expressions, there is an
asymmetry in the discharge currents between positive and negative cycles. The current density
was calculated using discharge current and plasma volume. The discharge current density increases
with voltage, and it is independent of frequency.
The discharge current expressions can be used for CFD calibration and assigning boundary
conditions providing a more robust estimation of charge density and the discharge volume. The
PD and ND semi-cycle current expressions can be used to understand each semi-cycle relative
contribution to the momentum. In time-resolved modeling, these data can be used for model
validation, providing insight into the nature of ion/field/flow interaction at each point of the AC
cycle. The discharge current expressions and baseline velocity were used to develop a reduced-
order model of DBD momentum injection, and the analysis of the plasma volume can be used in
multiphysics modeling of the DBD. Empirical data for plasma volume correlates with EHD body
force; it allows to improve the simplified DBD models. The simplified DBD model benefits from
simulating plasma body force while eliminating the dependency on estimations based on the Debye
length and charge density.
102
Chapter 8. DBD – DCA PLASMA ACTUATOR: EFFECT OF THIRD
ELECTRODE
This chapter aims to demonstrate the advantage of a DC augmented dielectric barrier discharge
(DBD – DCA) and to characterize its thrust and efficiency. Thrust force associated with the
induced wall jet is measured in quiescent conditions over a range of input parameters, i.e., AC
voltage, frequency, and DC voltage. The effects of positive and negative DC voltage on thrust
augmentation are compared to the standard two-electrode DBD. The effectiveness of the actuator
is evaluated for several operating conditions.
8.1 EXPERIMENTAL METHODS AND DIAGNOSTICS
8.1.1 Plasma Actuator and Discharge Generation
In this experimental study, two types of plasma actuators have been considered (a) DBD
actuator and (b) DBD – DCA actuator. Both actuators have two 0.05 mm thick copper electrodes,
one exposed electrode, and one encapsulated electrode separated by a dielectric material, as shown
in Figure 8.1. All the electrodes have straight edges producing a uniform spanwise discharge. Each
actuator has four layers of Kapton – HN and one layer of Kapton – CRC (corona resistant) with a
total thickness of ~ 300 𝜇𝑚 (including the adhesive). The plasma actuator is installed on the 0.15
m by 0.2 m flat polylactic acid polymer (PLA) plate. The exposed electrode of length 15 mm is
glued onto the top of the Kapton dielectric layer. The ground electrode (encapsulated electrode) of
length 25 mm is flush-mounted on the PLA flat plate. This encapsulation prevents plasma
formation on the lower side of the dielectric material. There is no overlap between the exposed
and encapsulated electrodes.
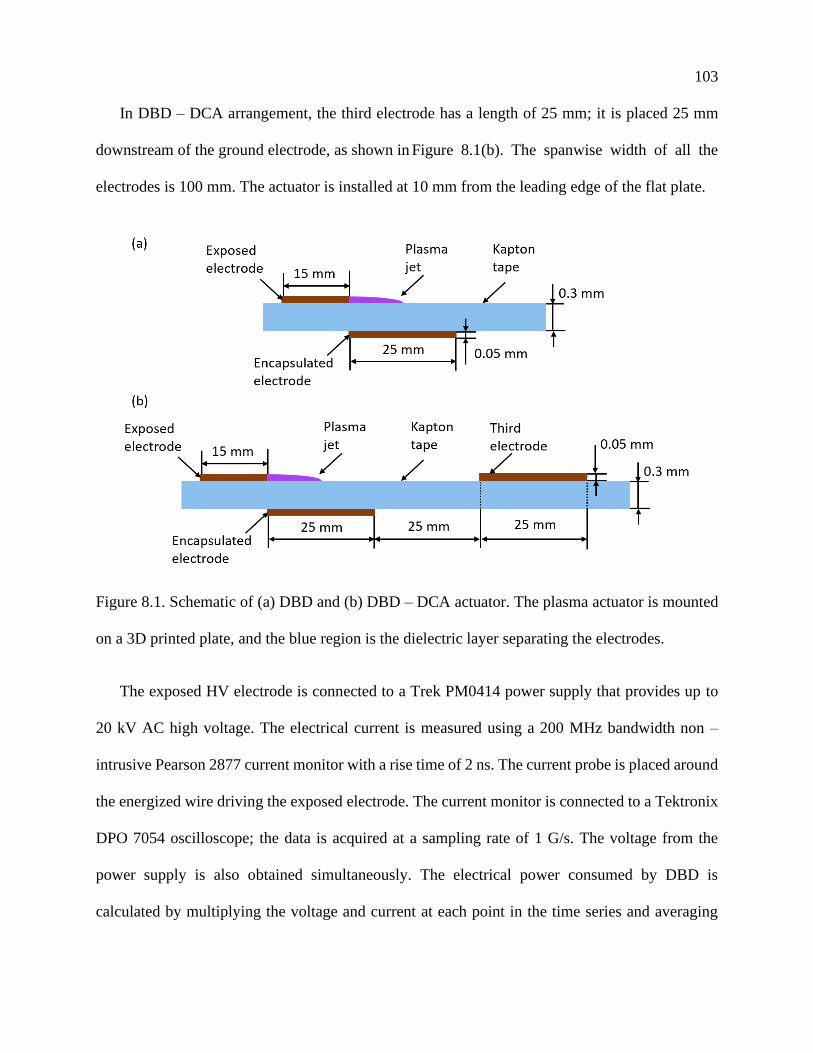
103
In DBD – DCA arrangement, the third electrode has a length of 25 mm; it is placed 25 mm
downstream of the ground electrode, as shown in Figure 8.1(b). The spanwise width of all the
electrodes is 100 mm. The actuator is installed at 10 mm from the leading edge of the flat plate.
Figure 8.1. Schematic of (a) DBD and (b) DBD – DCA actuator. The plasma actuator is mounted
on a 3D printed plate, and the blue region is the dielectric layer separating the electrodes.
The exposed HV electrode is connected to a Trek PM0414 power supply that provides up to
20 kV AC high voltage. The electrical current is measured using a 200 MHz bandwidth non –
intrusive Pearson 2877 current monitor with a rise time of 2 ns. The current probe is placed around
the energized wire driving the exposed electrode. The current monitor is connected to a Tektronix
DPO 7054 oscilloscope; the data is acquired at a sampling rate of 1 G/s. The voltage from the
power supply is also obtained simultaneously. The electrical power consumed by DBD is
calculated by multiplying the voltage and current at each point in the time series and averaging
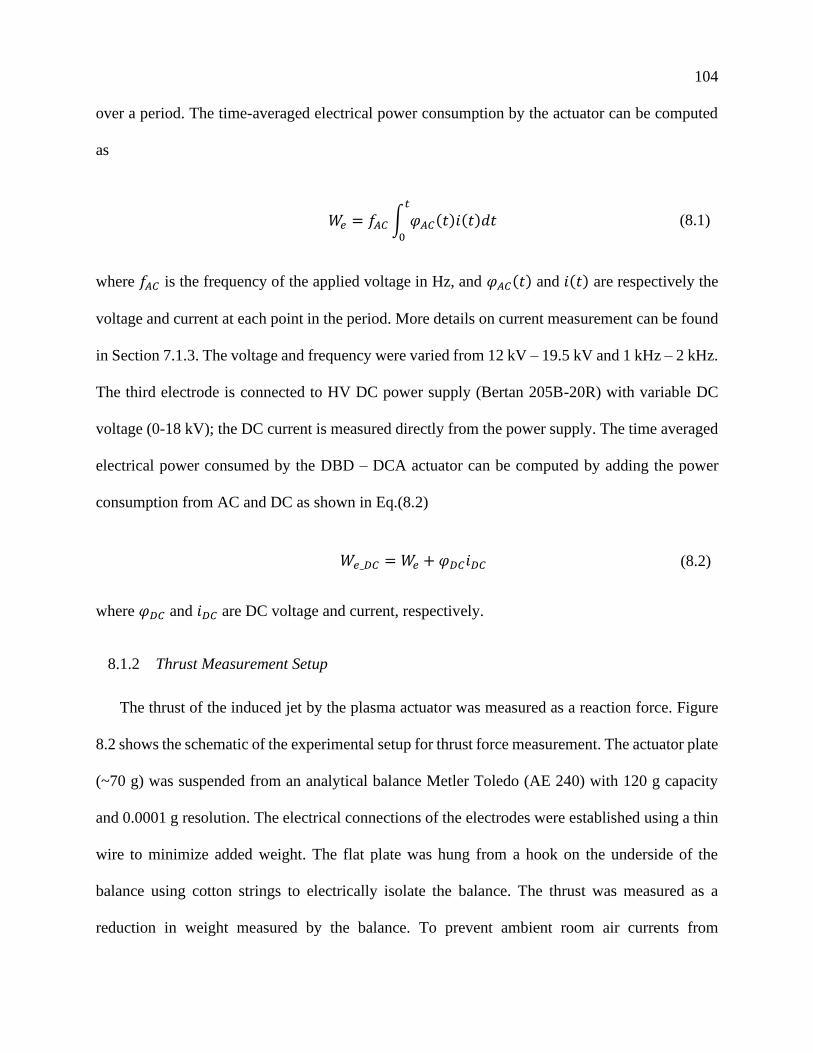
104
over a period. The time-averaged electrical power consumption by the actuator can be computed
as
𝑊𝑒 = 𝑓𝐴𝐶 ∫ 𝜑𝐴𝐶(𝑡)𝑖(𝑡)𝑑𝑡
𝑡
0
(8.1)
where 𝑓𝐴𝐶 is the frequency of the applied voltage in Hz, and 𝜑𝐴𝐶(𝑡) and 𝑖(𝑡) are respectively the
voltage and current at each point in the period. More details on current measurement can be found
in Section 7.1.3. The voltage and frequency were varied from 12 kV – 19.5 kV and 1 kHz – 2 kHz.
The third electrode is connected to HV DC power supply (Bertan 205B-20R) with variable DC
voltage (0-18 kV); the DC current is measured directly from the power supply. The time averaged
electrical power consumed by the DBD – DCA actuator can be computed by adding the power
consumption from AC and DC as shown in Eq.(8.2)
𝑊𝑒_𝐷𝐶 = 𝑊𝑒 + 𝜑𝐷𝐶𝑖𝐷𝐶 (8.2)
where 𝜑𝐷𝐶 and 𝑖𝐷𝐶 are DC voltage and current, respectively.
8.1.2 Thrust Measurement Setup
The thrust of the induced jet by the plasma actuator was measured as a reaction force. Figure
8.2 shows the schematic of the experimental setup for thrust force measurement. The actuator plate
(~70 g) was suspended from an analytical balance Metler Toledo (AE 240) with 120 g capacity
and 0.0001 g resolution. The electrical connections of the electrodes were established using a thin
wire to minimize added weight. The flat plate was hung from a hook on the underside of the
balance using cotton strings to electrically isolate the balance. The thrust was measured as a
reduction in weight measured by the balance. To prevent ambient room air currents from
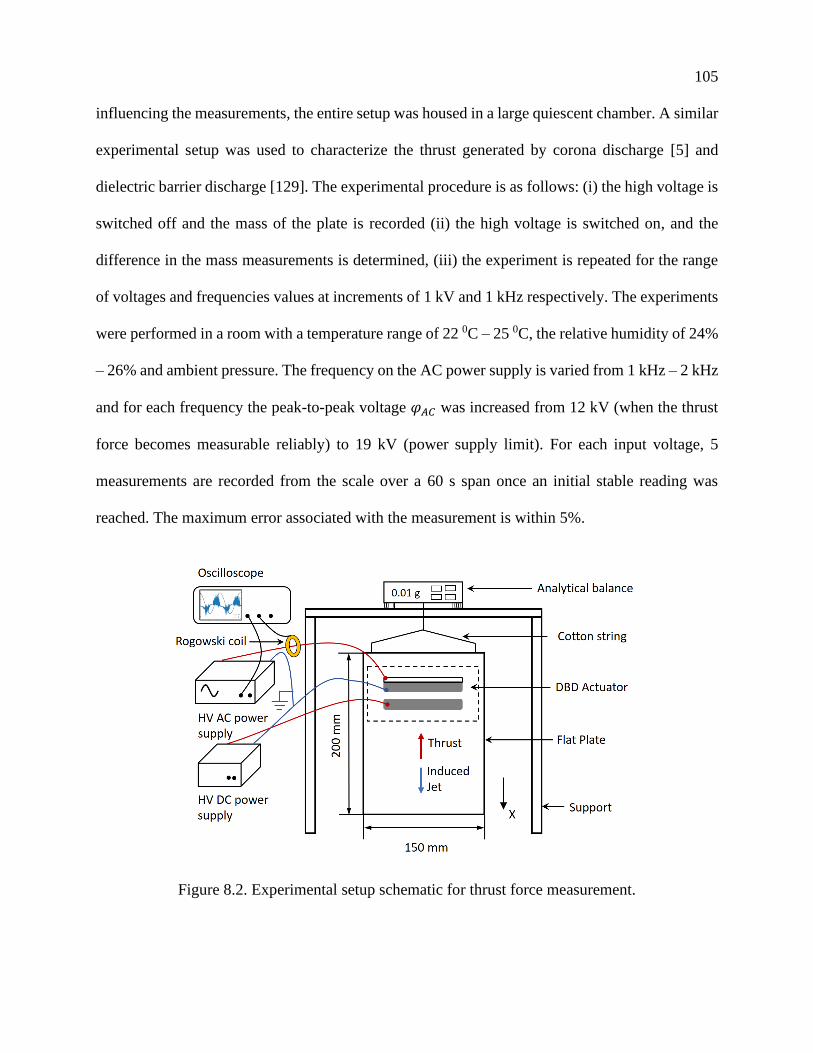
105
influencing the measurements, the entire setup was housed in a large quiescent chamber. A similar
experimental setup was used to characterize the thrust generated by corona discharge [5] and
dielectric barrier discharge [129]. The experimental procedure is as follows: (i) the high voltage is
switched off and the mass of the plate is recorded (ii) the high voltage is switched on, and the
difference in the mass measurements is determined, (iii) the experiment is repeated for the range
of voltages and frequencies values at increments of 1 kV and 1 kHz respectively. The experiments
were performed in a room with a temperature range of 22 0C – 25 0C, the relative humidity of 24%
– 26% and ambient pressure. The frequency on the AC power supply is varied from 1 kHz – 2 kHz
and for each frequency the peak-to-peak voltage 𝜑𝐴𝐶 was increased from 12 kV (when the thrust
force becomes measurable reliably) to 19 kV (power supply limit). For each input voltage, 5
measurements are recorded from the scale over a 60 s span once an initial stable reading was
reached. The maximum error associated with the measurement is within 5%.
Figure 8.2. Experimental setup schematic for thrust force measurement.
106
8.2 RESULTS AND DISCUSSION
8.2.1 Thrust characteristics of DBD
The thrust force data is used to determine the momentum injection associated with the DBD
wall jet. Figure 8.3 shows the thrust data for the range of 𝜑𝐴𝐶 = 12 kV – 19 kV and 𝑓𝐴𝐶 = 0.5 kHz
– 2 kHz. The thrust increases with 𝜑𝐴𝐶 and 𝑓𝐴𝐶 , and follows a trend that is proportional to 𝑓𝐴𝐶𝛼𝜑𝐴𝐶
2
as shown in Eq. (8.3), which agrees with the reported results in the literature [13, 137]
𝐹𝐸𝐻𝐷 = 𝐾1𝑓𝐴𝐶𝛼(𝜑𝐴𝐶 − 𝜑𝑜)2 (8.3)
where 𝐹𝐸𝐻𝐷 is the force due to force induced by the ions, 𝐾1 = 22.4 × 10⁻⁶ and 𝛼 = 0.8 are
experimental constants previously proposed in Ref [13], 𝜑𝑜 is the initiation voltage. At 𝜑𝐴𝐶 = 18
kV and 𝑓𝐴𝐶 = 2 kHz, the thrust was at 12.46 mN/m for this experiment. Previous work reports a
momentum injection of 17.3 mN/m based on the velocity measurements at X = 15 mm from the
exposed electrode [13] (plate length ~ 40 mm). The measured thrust in this experiment (plate
length = 200 mm) is the result of the momentum injection driven by EHD and viscous losses, so
Eq. (8.3) is modified to account for viscous shear as shown in Eq. (8.4).
𝑇 = (1 − 𝜃) 𝐹𝐸𝐻𝐷 (8.4)
Here 𝜃 is a non-dimensionless quantity that accounts for the shear forces. The value of 𝜃 has to be
less than unity and is dependent on plate length and other factors that are not studied here
separately, such as electrode arrangement, plate roughness, etc. The experimental data can be used
to determine 𝜃 in Eq. (8.4). Here, 𝜃 = 0.2 has the best correlation suggesting that in our experiment,
the viscous drag on the 200 mm plate from the DBD wall jet is ~20%. Experiments by Durscher
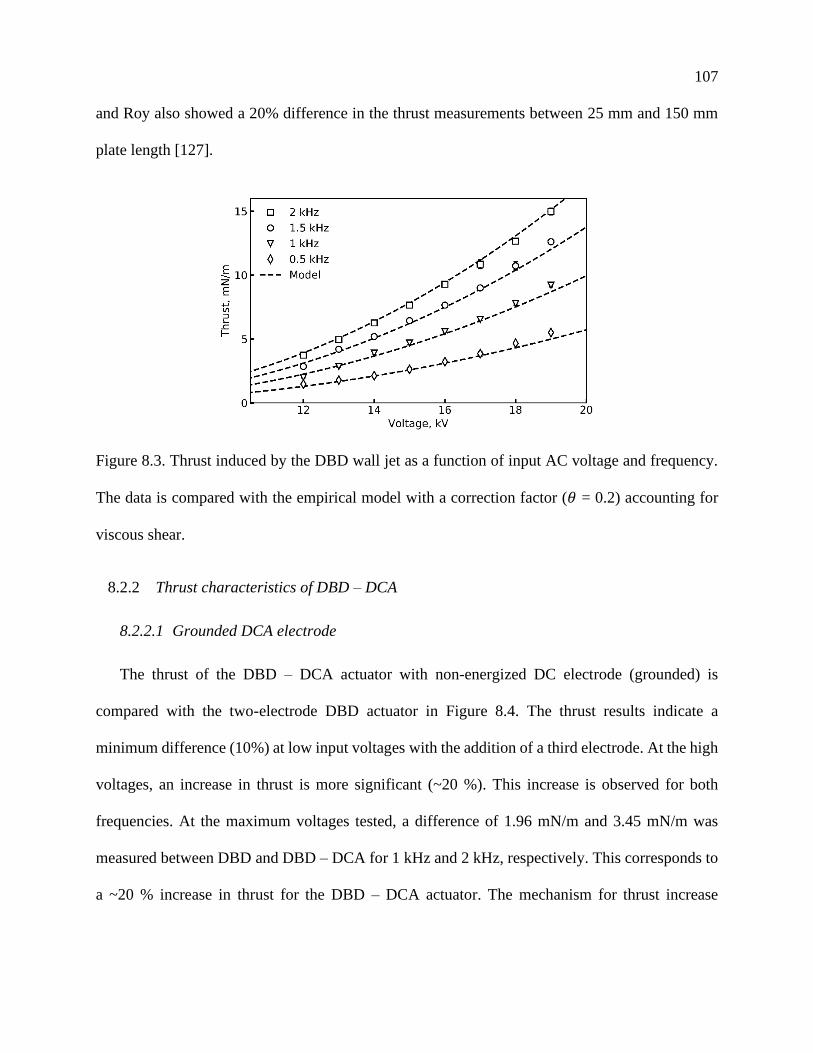
107
and Roy also showed a 20% difference in the thrust measurements between 25 mm and 150 mm
plate length [127].
Figure 8.3. Thrust induced by the DBD wall jet as a function of input AC voltage and frequency.
The data is compared with the empirical model with a correction factor (𝜃 = 0.2) accounting for
viscous shear.
8.2.2 Thrust characteristics of DBD – DCA
8.2.2.1 Grounded DCA electrode
The thrust of the DBD – DCA actuator with non-energized DC electrode (grounded) is
compared with the two-electrode DBD actuator in Figure 8.4. The thrust results indicate a
minimum difference (10%) at low input voltages with the addition of a third electrode. At the high
voltages, an increase in thrust is more significant (~20 %). This increase is observed for both
frequencies. At the maximum voltages tested, a difference of 1.96 mN/m and 3.45 mN/m was
measured between DBD and DBD – DCA for 1 kHz and 2 kHz, respectively. This corresponds to
a ~20 % increase in thrust for the DBD – DCA actuator. The mechanism for thrust increase
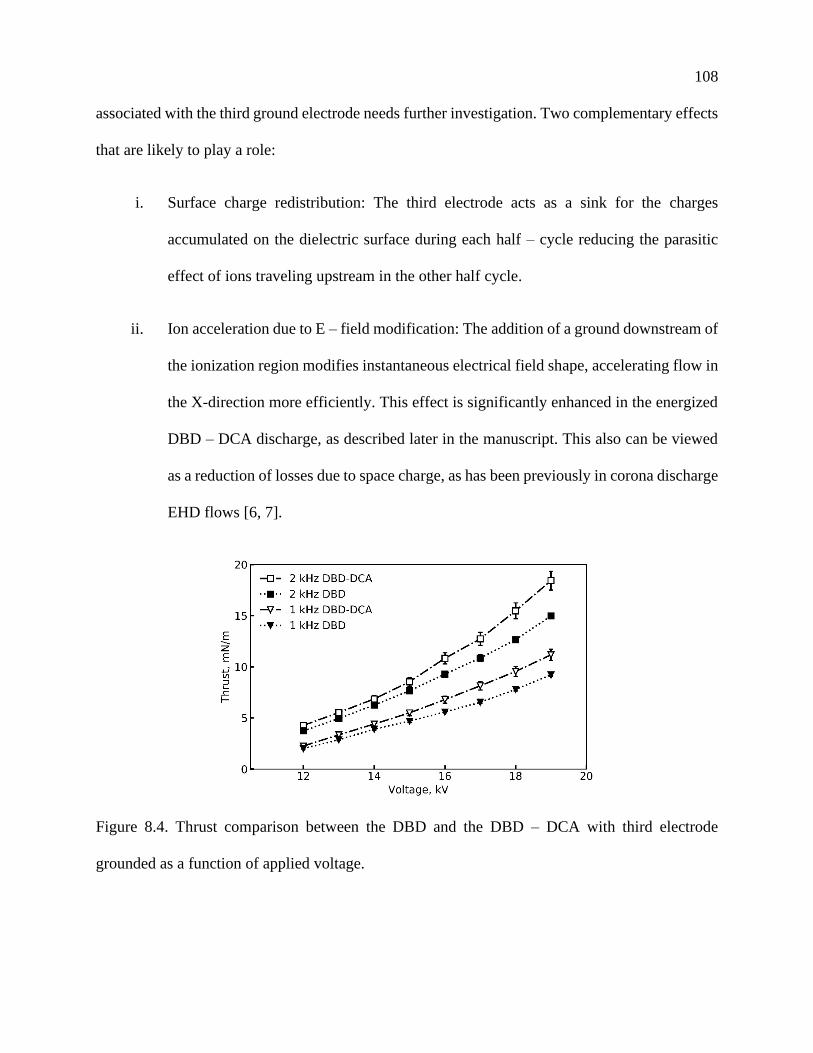
108
associated with the third ground electrode needs further investigation. Two complementary effects
that are likely to play a role:
i. Surface charge redistribution: The third electrode acts as a sink for the charges
accumulated on the dielectric surface during each half – cycle reducing the parasitic
effect of ions traveling upstream in the other half cycle.
ii. Ion acceleration due to E – field modification: The addition of a ground downstream of
the ionization region modifies instantaneous electrical field shape, accelerating flow in
the X-direction more efficiently. This effect is significantly enhanced in the energized
DBD – DCA discharge, as described later in the manuscript. This also can be viewed
as a reduction of losses due to space charge, as has been previously in corona discharge
EHD flows [6, 7].
Figure 8.4. Thrust comparison between the DBD and the DBD – DCA with third electrode
grounded as a function of applied voltage.
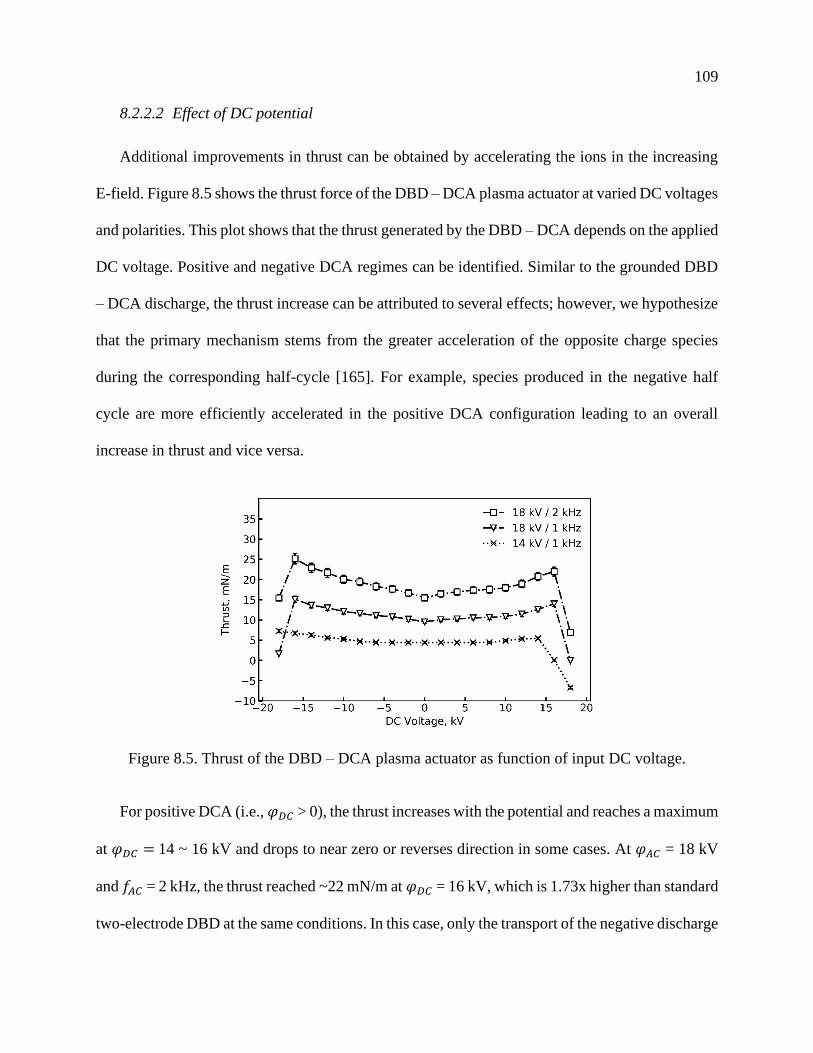
109
8.2.2.2 Effect of DC potential
Additional improvements in thrust can be obtained by accelerating the ions in the increasing
E-field. Figure 8.5 shows the thrust force of the DBD – DCA plasma actuator at varied DC voltages
and polarities. This plot shows that the thrust generated by the DBD – DCA depends on the applied
DC voltage. Positive and negative DCA regimes can be identified. Similar to the grounded DBD
– DCA discharge, the thrust increase can be attributed to several effects; however, we hypothesize
that the primary mechanism stems from the greater acceleration of the opposite charge species
during the corresponding half-cycle [165]. For example, species produced in the negative half
cycle are more efficiently accelerated in the positive DCA configuration leading to an overall
increase in thrust and vice versa.
Figure 8.5. Thrust of the DBD – DCA plasma actuator as function of input DC voltage.
For positive DCA (i.e., 𝜑𝐷𝐶 > 0), the thrust increases with the potential and reaches a maximum
at 𝜑𝐷𝐶 = 14 ~ 16 kV and drops to near zero or reverses direction in some cases. At 𝜑𝐴𝐶 = 18 kV
and 𝑓𝐴𝐶 = 2 kHz, the thrust reached ~22 mN/m at 𝜑𝐷𝐶 = 16 kV, which is 1.73x higher than standard
two-electrode DBD at the same conditions. In this case, only the transport of the negative discharge
110
is enhanced in the X-direction because of the electric field created between the exposed, the
ground, and the positive DCA electrode. The thrust gained in the negative half-cycle is higher than
the reduction in the positive half-cycle, resulting in an overall higher thrust. As the DC voltage
increased further, the thrust is reversed. It is likely due to the onset positive discharge on the DCA
electrode and subsequent generation of the EHD jet in the “− X” direction [131, 220].
In the negative DBD – DCA (𝜑𝐷𝐶 < 0) the thrust trends are similar as in positive DCA. The
positive ions are accelerated towards the third electrode in the positive-going cycle. The thrust
increases up to 𝜑𝐷𝐶 = −16 kV, and sharply decreased when 𝜑𝐴𝐶 = 18 kV, whereas it continues to
increase when 𝜑𝐴𝐶 = 14 kV case. The induced counter jet is formed later than in the positive DCA
case. The mechanistic explanation for higher thrust achieved in the negative DCA is likely related
to a greater abundance of positive species (i.e., higher discharge current) [13]. Secondary effects
such as surface charge modification and lower recombination rates of charges may exist; however,
these were not quantified in this work.
For both DC polarities, the thrust increase in the complementary half-cycle exceeds the
reduction in another half cycle, increasing the overall thrust. Tang et al. has shown that the AC
cycle is composed of positive and negative corona-type discharges, has a positive discharge current
is 2.5x higher than that of negative discharge current [13]. The increase in the thrust is apparent in
the negative DCA; however, it generates only 25% more thrust force than that of positive DCA.
The likely explanation is that the negative semi-cycle generates a higher velocity than the positive
one [94, 221].
The effect of frequency and AC voltage on thrust characteristics is also shown in Figure 8.5.
The thrust is plotted for two voltages at a fixed frequency (1 kHz); not surprisingly, the higher
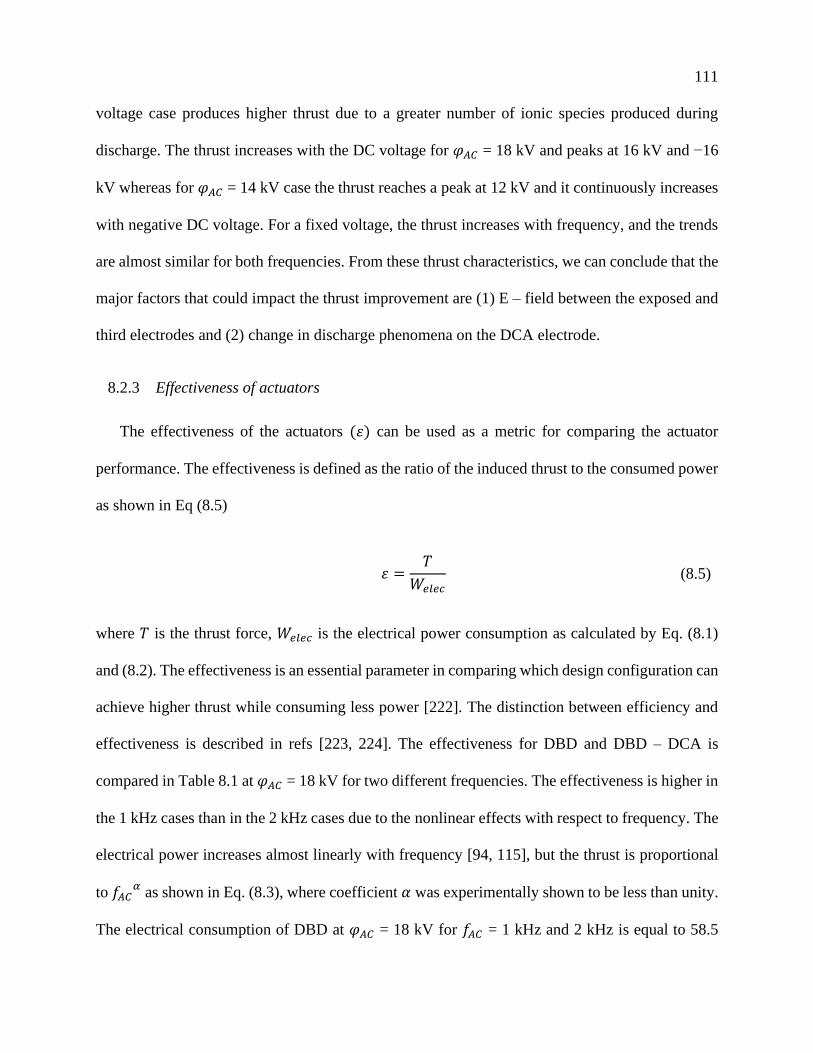
111
voltage case produces higher thrust due to a greater number of ionic species produced during
discharge. The thrust increases with the DC voltage for 𝜑𝐴𝐶 = 18 kV and peaks at 16 kV and −16
kV whereas for 𝜑𝐴𝐶 = 14 kV case the thrust reaches a peak at 12 kV and it continuously increases
with negative DC voltage. For a fixed voltage, the thrust increases with frequency, and the trends
are almost similar for both frequencies. From these thrust characteristics, we can conclude that the
major factors that could impact the thrust improvement are (1) E – field between the exposed and
third electrodes and (2) change in discharge phenomena on the DCA electrode.
8.2.3 Effectiveness of actuators
The effectiveness of the actuators (휀) can be used as a metric for comparing the actuator
performance. The effectiveness is defined as the ratio of the induced thrust to the consumed power
as shown in Eq (8.5)
휀 =𝑇
𝑊𝑒𝑙𝑒𝑐 (8.5)
where 𝑇 is the thrust force, 𝑊𝑒𝑙𝑒𝑐 is the electrical power consumption as calculated by Eq. (8.1)
and (8.2). The effectiveness is an essential parameter in comparing which design configuration can
achieve higher thrust while consuming less power [222]. The distinction between efficiency and
effectiveness is described in refs [223, 224]. The effectiveness for DBD and DBD – DCA is
compared in Table 8.1 at 𝜑𝐴𝐶 = 18 kV for two different frequencies. The effectiveness is higher in
the 1 kHz cases than in the 2 kHz cases due to the nonlinear effects with respect to frequency. The
electrical power increases almost linearly with frequency [94, 115], but the thrust is proportional
to 𝑓𝐴𝐶𝛼
as shown in Eq. (8.3), where coefficient 𝛼 was experimentally shown to be less than unity.
The electrical consumption of DBD at 𝜑𝐴𝐶 = 18 kV for 𝑓𝐴𝐶 = 1 kHz and 2 kHz is equal to 58.5
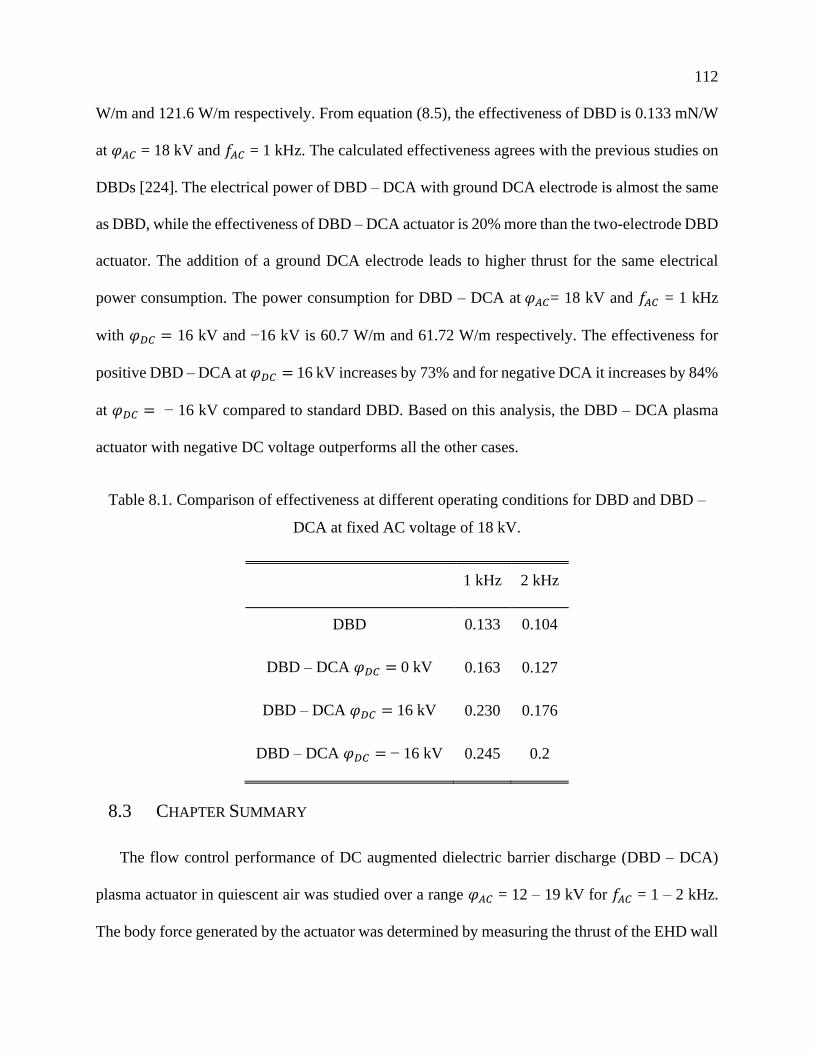
112
W/m and 121.6 W/m respectively. From equation (8.5), the effectiveness of DBD is 0.133 mN/W
at 𝜑𝐴𝐶 = 18 kV and 𝑓𝐴𝐶 = 1 kHz. The calculated effectiveness agrees with the previous studies on
DBDs [224]. The electrical power of DBD – DCA with ground DCA electrode is almost the same
as DBD, while the effectiveness of DBD – DCA actuator is 20% more than the two-electrode DBD
actuator. The addition of a ground DCA electrode leads to higher thrust for the same electrical
power consumption. The power consumption for DBD – DCA at 𝜑𝐴𝐶= 18 kV and 𝑓𝐴𝐶 = 1 kHz
with 𝜑𝐷𝐶 = 16 kV and −16 kV is 60.7 W/m and 61.72 W/m respectively. The effectiveness for
positive DBD – DCA at 𝜑𝐷𝐶 = 16 kV increases by 73% and for negative DCA it increases by 84%
at 𝜑𝐷𝐶 = − 16 kV compared to standard DBD. Based on this analysis, the DBD – DCA plasma
actuator with negative DC voltage outperforms all the other cases.
Table 8.1. Comparison of effectiveness at different operating conditions for DBD and DBD –
DCA at fixed AC voltage of 18 kV.
1 kHz 2 kHz
DBD 0.133 0.104
DBD – DCA 𝜑𝐷𝐶 = 0 kV 0.163 0.127
DBD – DCA 𝜑𝐷𝐶 = 16 kV 0.230 0.176
DBD – DCA 𝜑𝐷𝐶 = − 16 kV 0.245 0.2
8.3 CHAPTER SUMMARY
The flow control performance of DC augmented dielectric barrier discharge (DBD – DCA)
plasma actuator in quiescent air was studied over a range 𝜑𝐴𝐶 = 12 – 19 kV for 𝑓𝐴𝐶 = 1 – 2 kHz.
The body force generated by the actuator was determined by measuring the thrust of the EHD wall
113
jet in the X-direction. The DBD – DCA actuator has an additional exposed electrode, to which
high DC voltage is applied. The DBD acts as an ionizer, and the third electrode is positioned
downstream of the encapsulated electrode, thus creating a stronger E-field for accelerating the
ions. The DBD – DCA with the grounded third electrode enhances the thrust by 20 % compared
to standard DBD.
The effects of positive and negative DC voltage on thrust were parameterized. The thrust
increases with the DC voltage reach a maximum; then, the thrust drops rapidly. For the same DC
potential, the negative DCA produces 25% more thrust than the positive DCA. At 𝜑𝐴𝐶 = 18 kV
and 𝑓𝐴𝐶 = 2 kHz, a thrust force of 25.13 mN/m at 𝜑𝐷𝐶 = − 16 kV, which was ~2x greater than the
DBD actuator. The actuator's effectiveness (thrust to power ratio) was calculated for DBD and
DBD – DCA over a range of operating conditions. The effectiveness of the DBD – DCA is 84%
more than the two-electrode DBD plasma actuator.
114
Chapter 9. DBD – DCA PLASMA ACTUATOR: EFFECT OF
ELECTRODE SHAPE
The advantage of the DBD – DCA plasma actuator compared to standard DBD is discussed in
the previous Chapter 8. In this chapter, we introduce three different electrode shapes, and we
compare the performance to the linear electrode. The electrical power consumption is evaluated
based on the recorded electrical signals for all electrode shapes. The induced thrust is measured
over a range of input parameters, i.e., AC voltage (𝜑𝐴𝐶), frequency (𝑓𝐴𝐶), and DC voltage (𝜑𝐷𝐶).
The effects of positive and negative DC voltage on thrust augmentation for different electrode
shapes are compared to the standard linear shape electrode DBD – DCA actuator.
9.1 EXPERIMENTAL METHODS AND DIAGNOSTICS
In this experimental study, a DBD – DCA plasma actuator with four different electrode shapes
has been evaluated. The actuator consists of three 0.05 mm thick copper electrodes separated by a
dielectric material, as shown in Figure 9.1. Each actuator has 4 layers of Kapton – HN and one
layer of Kapton – CRC with a total thickness of ~300 μm. The plasma actuator is installed on the
0.15 m by 0.2 m flat polylactic acid polymer (PLA) plate. The exposed electrode of length L1 mm
is glued onto the top of the Kapton dielectric layer. Four types of electrode shapes are used: saw
tooth – coarse & fine (Figure 9.2 (b) and (c)), fingers (Figure 9.2 (d)) and conventional linear shape
(Figure 9.2 (a)). Figure 9.2 shows the plasma discharge of the actuators; the bright purple region
shows the induced plasma. The contoured electrodes have greater plasma length compared to
linear geometry. The plasma length for the linear, sawtooth – coarse, sawtooth – fine and finger-
shaped electrodes are 100 mm, 220 mm, 412 mm, and 238 mm, respectively. The ground electrode
of width (25+ L2) mm is flush-mounted on the PLA flat plate, as shown in Figure 9.1. This
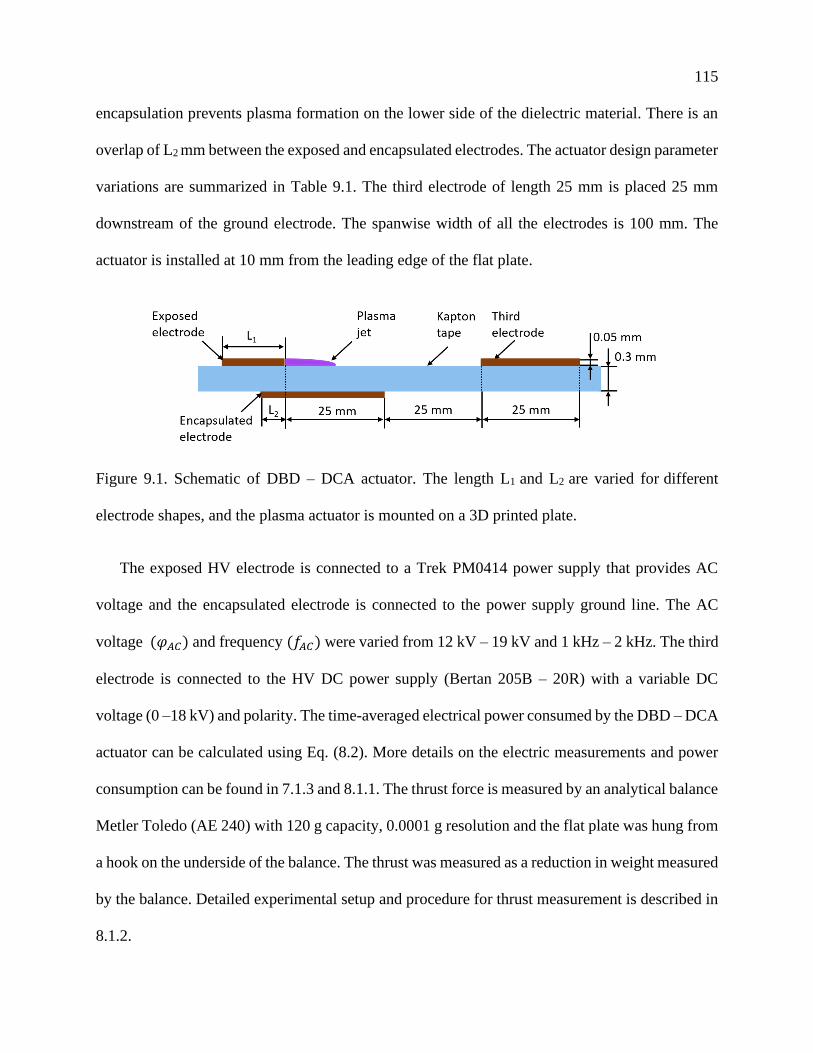
115
encapsulation prevents plasma formation on the lower side of the dielectric material. There is an
overlap of L2 mm between the exposed and encapsulated electrodes. The actuator design parameter
variations are summarized in Table 9.1. The third electrode of length 25 mm is placed 25 mm
downstream of the ground electrode. The spanwise width of all the electrodes is 100 mm. The
actuator is installed at 10 mm from the leading edge of the flat plate.
Figure 9.1. Schematic of DBD – DCA actuator. The length L1 and L2 are varied for different
electrode shapes, and the plasma actuator is mounted on a 3D printed plate.
The exposed HV electrode is connected to a Trek PM0414 power supply that provides AC
voltage and the encapsulated electrode is connected to the power supply ground line. The AC
voltage (𝜑𝐴𝐶) and frequency (𝑓𝐴𝐶) were varied from 12 kV – 19 kV and 1 kHz – 2 kHz. The third
electrode is connected to the HV DC power supply (Bertan 205B – 20R) with a variable DC
voltage (0 –18 kV) and polarity. The time-averaged electrical power consumed by the DBD – DCA
actuator can be calculated using Eq. (8.2). More details on the electric measurements and power
consumption can be found in 7.1.3 and 8.1.1. The thrust force is measured by an analytical balance
Metler Toledo (AE 240) with 120 g capacity, 0.0001 g resolution and the flat plate was hung from
a hook on the underside of the balance. The thrust was measured as a reduction in weight measured
by the balance. Detailed experimental setup and procedure for thrust measurement is described in
8.1.2.
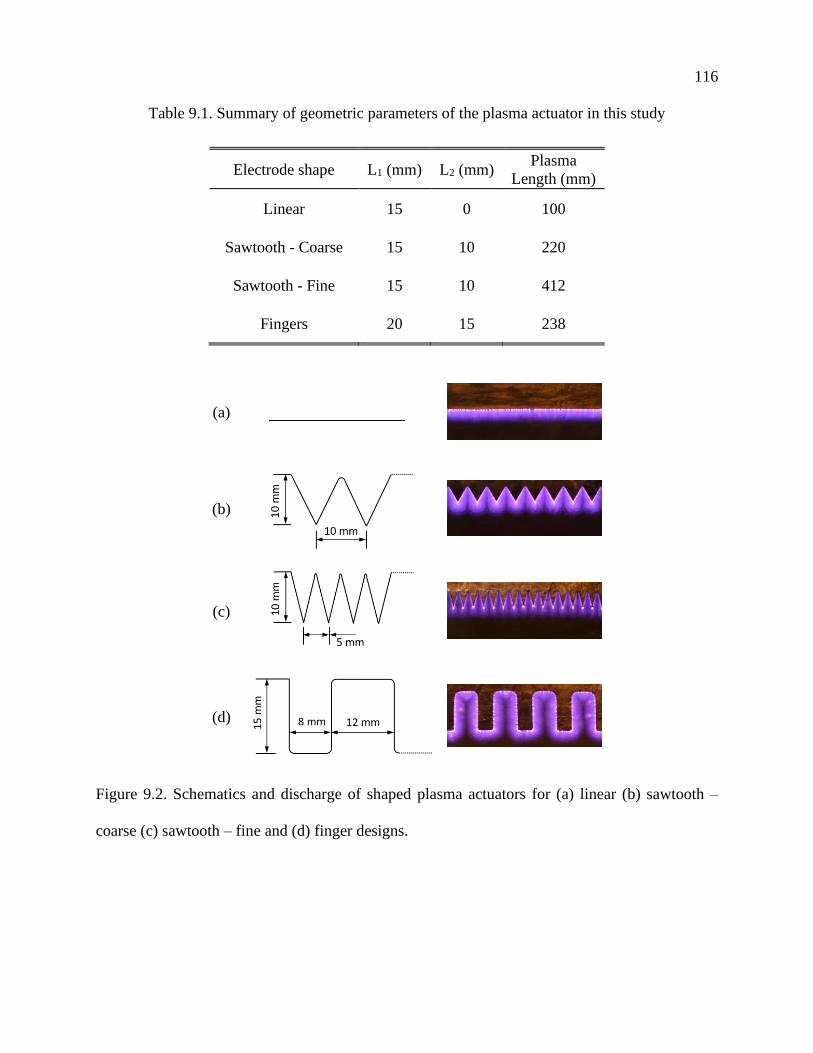
116
Table 9.1. Summary of geometric parameters of the plasma actuator in this study
Electrode shape L1 (mm) L2 (mm) Plasma
Length (mm)
Linear 15 0 100
Sawtooth - Coarse 15 10 220
Sawtooth - Fine 15 10 412
Fingers 20 15 238
(a)
(b)
(c)
(d)
Figure 9.2. Schematics and discharge of shaped plasma actuators for (a) linear (b) sawtooth –
coarse (c) sawtooth – fine and (d) finger designs.
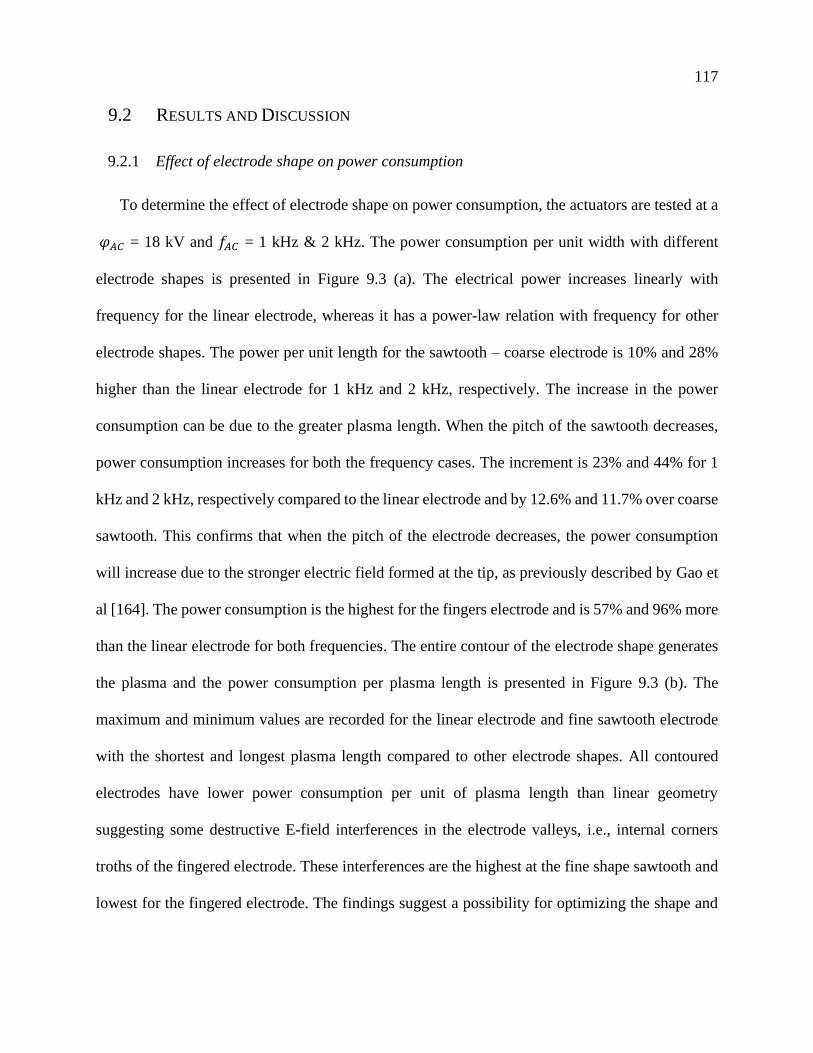
117
9.2 RESULTS AND DISCUSSION
9.2.1 Effect of electrode shape on power consumption
To determine the effect of electrode shape on power consumption, the actuators are tested at a
𝜑𝐴𝐶 = 18 kV and 𝑓𝐴𝐶 = 1 kHz & 2 kHz. The power consumption per unit width with different
electrode shapes is presented in Figure 9.3 (a). The electrical power increases linearly with
frequency for the linear electrode, whereas it has a power-law relation with frequency for other
electrode shapes. The power per unit length for the sawtooth – coarse electrode is 10% and 28%
higher than the linear electrode for 1 kHz and 2 kHz, respectively. The increase in the power
consumption can be due to the greater plasma length. When the pitch of the sawtooth decreases,
power consumption increases for both the frequency cases. The increment is 23% and 44% for 1
kHz and 2 kHz, respectively compared to the linear electrode and by 12.6% and 11.7% over coarse
sawtooth. This confirms that when the pitch of the electrode decreases, the power consumption
will increase due to the stronger electric field formed at the tip, as previously described by Gao et
al [164]. The power consumption is the highest for the fingers electrode and is 57% and 96% more
than the linear electrode for both frequencies. The entire contour of the electrode shape generates
the plasma and the power consumption per plasma length is presented in Figure 9.3 (b). The
maximum and minimum values are recorded for the linear electrode and fine sawtooth electrode
with the shortest and longest plasma length compared to other electrode shapes. All contoured
electrodes have lower power consumption per unit of plasma length than linear geometry
suggesting some destructive E-field interferences in the electrode valleys, i.e., internal corners
troths of the fingered electrode. These interferences are the highest at the fine shape sawtooth and
lowest for the fingered electrode. The findings suggest a possibility for optimizing the shape and
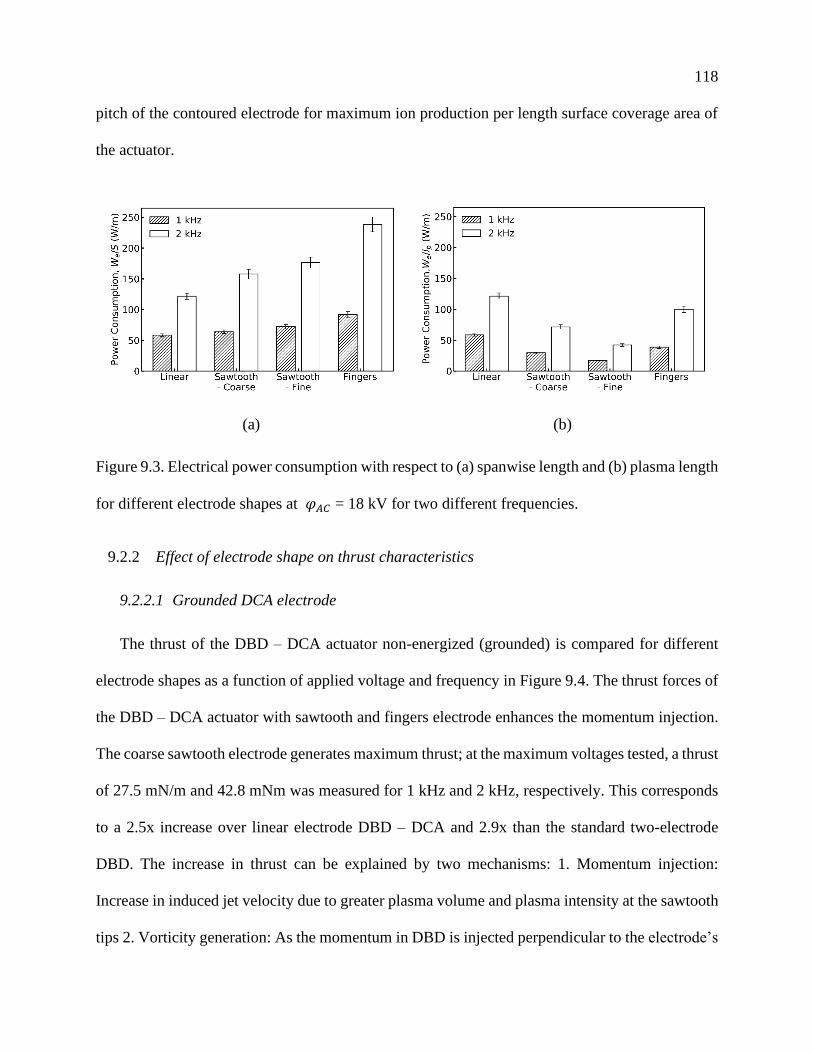
118
pitch of the contoured electrode for maximum ion production per length surface coverage area of
the actuator.
(a) (b)
Figure 9.3. Electrical power consumption with respect to (a) spanwise length and (b) plasma length
for different electrode shapes at 𝜑𝐴𝐶 = 18 kV for two different frequencies.
9.2.2 Effect of electrode shape on thrust characteristics
9.2.2.1 Grounded DCA electrode
The thrust of the DBD – DCA actuator non-energized (grounded) is compared for different
electrode shapes as a function of applied voltage and frequency in Figure 9.4. The thrust forces of
the DBD – DCA actuator with sawtooth and fingers electrode enhances the momentum injection.
The coarse sawtooth electrode generates maximum thrust; at the maximum voltages tested, a thrust
of 27.5 mN/m and 42.8 mNm was measured for 1 kHz and 2 kHz, respectively. This corresponds
to a 2.5x increase over linear electrode DBD – DCA and 2.9x than the standard two-electrode
DBD. The increase in thrust can be explained by two mechanisms: 1. Momentum injection:
Increase in induced jet velocity due to greater plasma volume and plasma intensity at the sawtooth
tips 2. Vorticity generation: As the momentum in DBD is injected perpendicular to the electrode’s
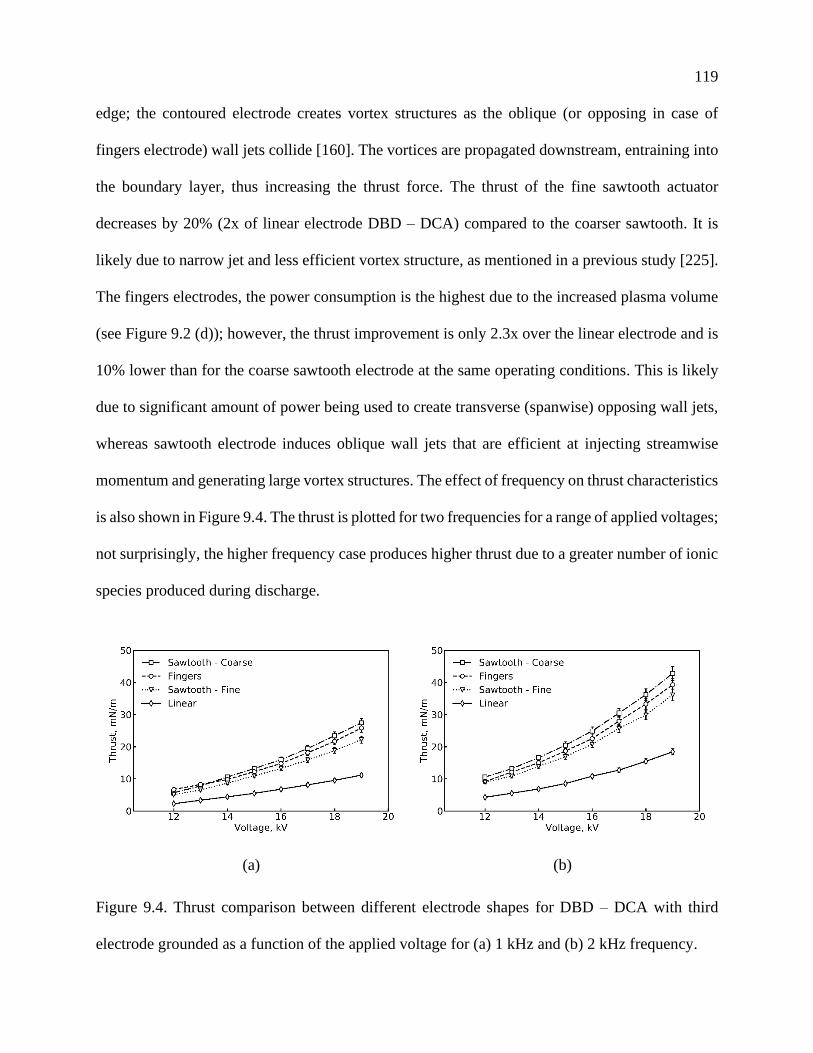
119
edge; the contoured electrode creates vortex structures as the oblique (or opposing in case of
fingers electrode) wall jets collide [160]. The vortices are propagated downstream, entraining into
the boundary layer, thus increasing the thrust force. The thrust of the fine sawtooth actuator
decreases by 20% (2x of linear electrode DBD – DCA) compared to the coarser sawtooth. It is
likely due to narrow jet and less efficient vortex structure, as mentioned in a previous study [225].
The fingers electrodes, the power consumption is the highest due to the increased plasma volume
(see Figure 9.2 (d)); however, the thrust improvement is only 2.3x over the linear electrode and is
10% lower than for the coarse sawtooth electrode at the same operating conditions. This is likely
due to significant amount of power being used to create transverse (spanwise) opposing wall jets,
whereas sawtooth electrode induces oblique wall jets that are efficient at injecting streamwise
momentum and generating large vortex structures. The effect of frequency on thrust characteristics
is also shown in Figure 9.4. The thrust is plotted for two frequencies for a range of applied voltages;
not surprisingly, the higher frequency case produces higher thrust due to a greater number of ionic
species produced during discharge.
(a) (b)
Figure 9.4. Thrust comparison between different electrode shapes for DBD – DCA with third
electrode grounded as a function of the applied voltage for (a) 1 kHz and (b) 2 kHz frequency.
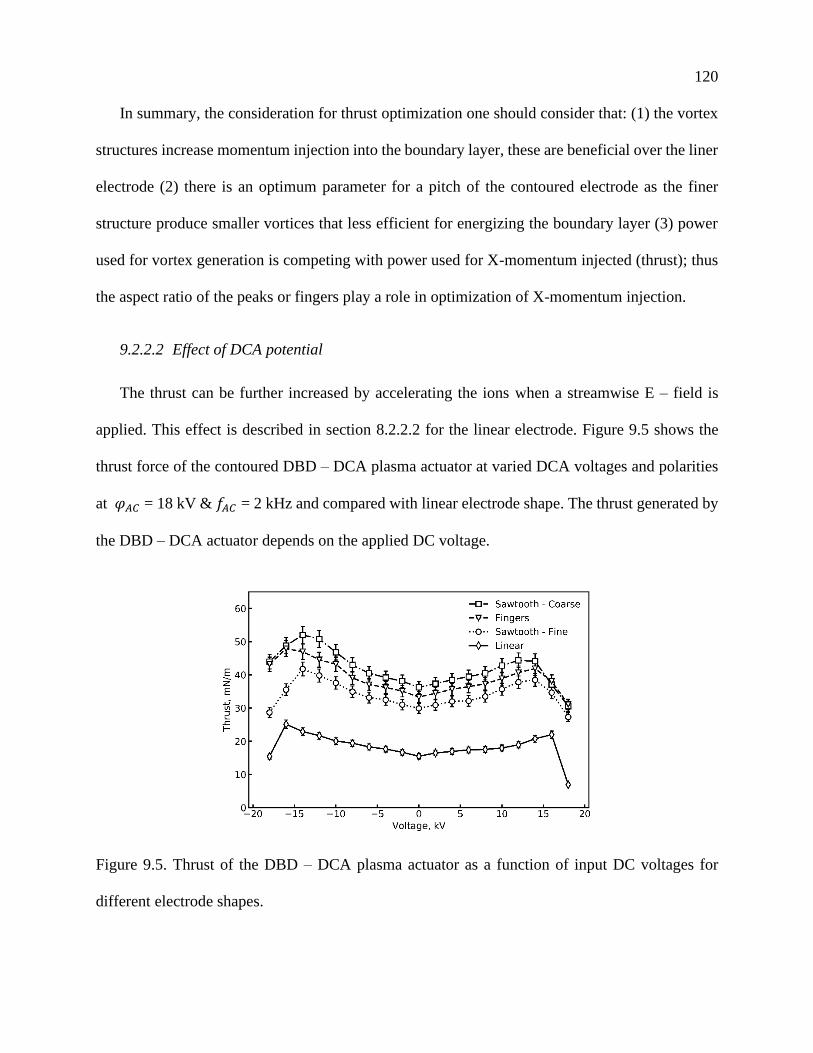
120
In summary, the consideration for thrust optimization one should consider that: (1) the vortex
structures increase momentum injection into the boundary layer, these are beneficial over the liner
electrode (2) there is an optimum parameter for a pitch of the contoured electrode as the finer
structure produce smaller vortices that less efficient for energizing the boundary layer (3) power
used for vortex generation is competing with power used for X-momentum injected (thrust); thus
the aspect ratio of the peaks or fingers play a role in optimization of X-momentum injection.
9.2.2.2 Effect of DCA potential
The thrust can be further increased by accelerating the ions when a streamwise E – field is
applied. This effect is described in section 8.2.2.2 for the linear electrode. Figure 9.5 shows the
thrust force of the contoured DBD – DCA plasma actuator at varied DCA voltages and polarities
at 𝜑𝐴𝐶 = 18 kV & 𝑓𝐴𝐶 = 2 kHz and compared with linear electrode shape. The thrust generated by
the DBD – DCA actuator depends on the applied DC voltage.
Figure 9.5. Thrust of the DBD – DCA plasma actuator as a function of input DC voltages for
different electrode shapes.
121
For positive DCA (i.e., 𝜑𝐷𝐶 > 0), the thrust increases with the potential and reaches a
maximum at 𝜑𝐷𝐶 = 14 ~ 16 kV and drops for high DC voltages. The sawtooth – coarse electrode
reaches a maximum thrust of 44.34 mN/m at 𝜑𝐷𝐶 = 12 kV, which is 2x times higher than linear
electrode DBD – DCA at 𝜑𝐷𝐶 = 16 kV. For sawtooth – fine and fingers electrodes, the thrust
reached 38.4 mN/m and 41.8 mN/m at 𝜑𝐷𝐶 = 14 kV, which is 1.75x and 1.9x times higher than
the linear electrode. The charge transported in the negative discharge is enhanced in the X-
direction because of the electric field created between the electrodes. As the DC voltage increased
further, a jet in the “−X” direction is generated, leading to thrust reduction.
In the negative DCA ((i.e., 𝜑𝐷𝐶 < 0), the thrust trends are similar as in the positive DCA. The
positive ions are accelerated towards the third electrode in the positive-going cycle. The thrust
increases up to 𝜑𝐷𝐶 = −14 – −16 kV, and then sharply decreases. For both the polarities, the flow
acceleration during the complementary half-cycle exceeds the reduction in the other half-cycle,
thus increasing the overall thrust. The increase in the thrust is apparent in the negative DCA, as
there is a greater abundance of positive species (~2x compared to negative species) in the DBD
discharge, as quantified by the discharge current [13]. The linear electrode generates 25% more
thrust force than the positive DCA. The coarse sawtooth electrode generates a maximum thrust of
~52 mN/m at 𝜑𝐷𝐶 = 14 kV, which is 2x times higher than maximum thrust in linear electrode
negative DCA case. For fine sawtooth and fingers electrodes, the thrust reached a maximum of
41.7 mN/m and 47.8 mN/m, which is 1.7x and 1.9x higher than linear electrode negative DCA
case. The drop in the thrust as a function of DCA voltage (induced by counter jet) occurs earlier
than in the linear electrode for all the electrode shapes case for both the polarities. This is likely
due to the sharp tips on the electrodes changing the discharge characteristics. Secondary effects
122
such as surface charge modification, and vortex structure change due to the third electrode may
exist; however, these effects are not quantified in the current work.
9.2.3 Effectiveness of actuators
The effectiveness of the actuator is an important parameter in comparing which design
configurations can achieve higher thrust while consuming less power [222]. Note that for control
purposes, the interaction with the free stream would play a significant role. The effectiveness is
the ratio of the induced thrust to the consumed power, as shown in Eq. (8.5). The effectiveness for
DBD – DCA with grounded electrode for different electrode shapes is shown in Figure 9.6 at a
fixed frequency of 2 kHz for a range of voltages. The effectiveness is higher for coarse sawtooth
electrode compared to all the electrode shapes. Coarse sawtooth DBD – DCA actuator has the best
performance in terms of power conversion: its power consumption is 1.28x higher than the linear
electrode, while the thrust generated is 2.5x larger than linear DBD – DCA. The effectiveness for
the sawtooth – coarse DBD – DCA is 1.85x higher than the linear electrode. When the pitch of the
electrode decreases, the effectiveness decreases by 21.4% as the thrust force decreases by 15% and
the power consumption increase by 12%. The fingers electrode effectiveness is within 10% of the
linear electrode since the power consumption is maximum among all the cases. Based on this, the
DBD – DCA actuator with sawtooth – coarse electrode outperforms all the other cases.
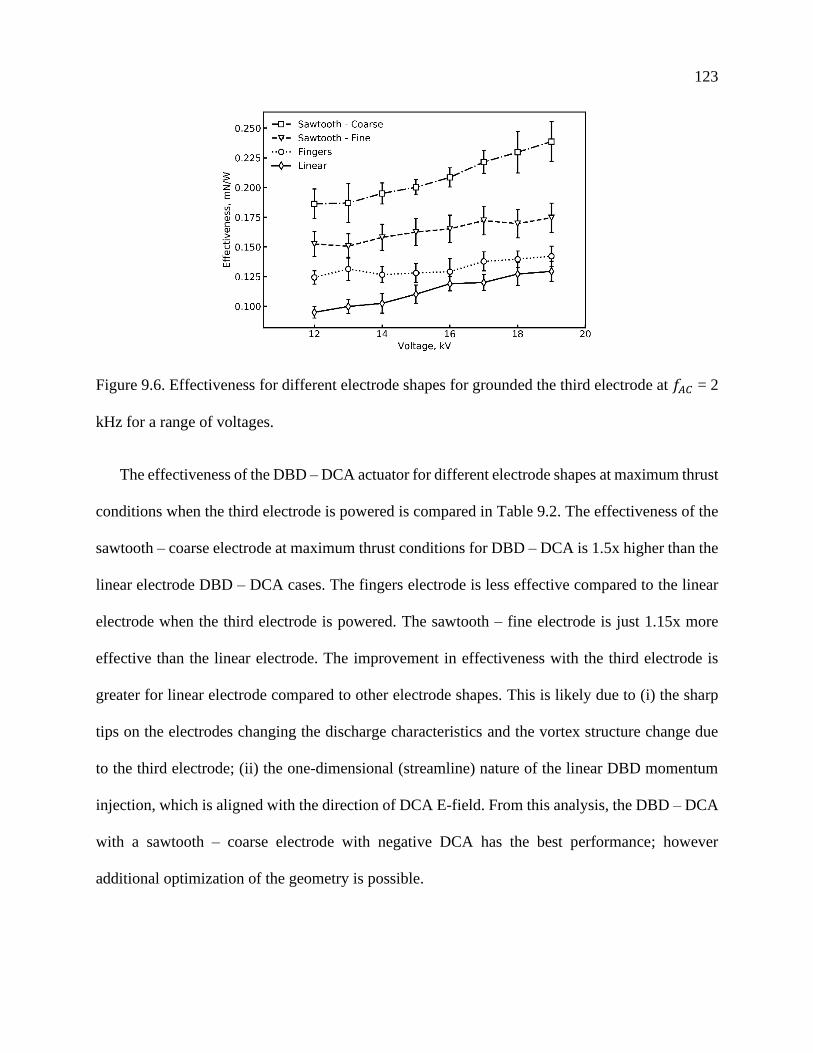
123
Figure 9.6. Effectiveness for different electrode shapes for grounded the third electrode at 𝑓𝐴𝐶 = 2
kHz for a range of voltages.
The effectiveness of the DBD – DCA actuator for different electrode shapes at maximum thrust
conditions when the third electrode is powered is compared in Table 9.2. The effectiveness of the
sawtooth – coarse electrode at maximum thrust conditions for DBD – DCA is 1.5x higher than the
linear electrode DBD – DCA cases. The fingers electrode is less effective compared to the linear
electrode when the third electrode is powered. The sawtooth – fine electrode is just 1.15x more
effective than the linear electrode. The improvement in effectiveness with the third electrode is
greater for linear electrode compared to other electrode shapes. This is likely due to (i) the sharp
tips on the electrodes changing the discharge characteristics and the vortex structure change due
to the third electrode; (ii) the one-dimensional (streamline) nature of the linear DBD momentum
injection, which is aligned with the direction of DCA E-field. From this analysis, the DBD – DCA
with a sawtooth – coarse electrode with negative DCA has the best performance; however
additional optimization of the geometry is possible.
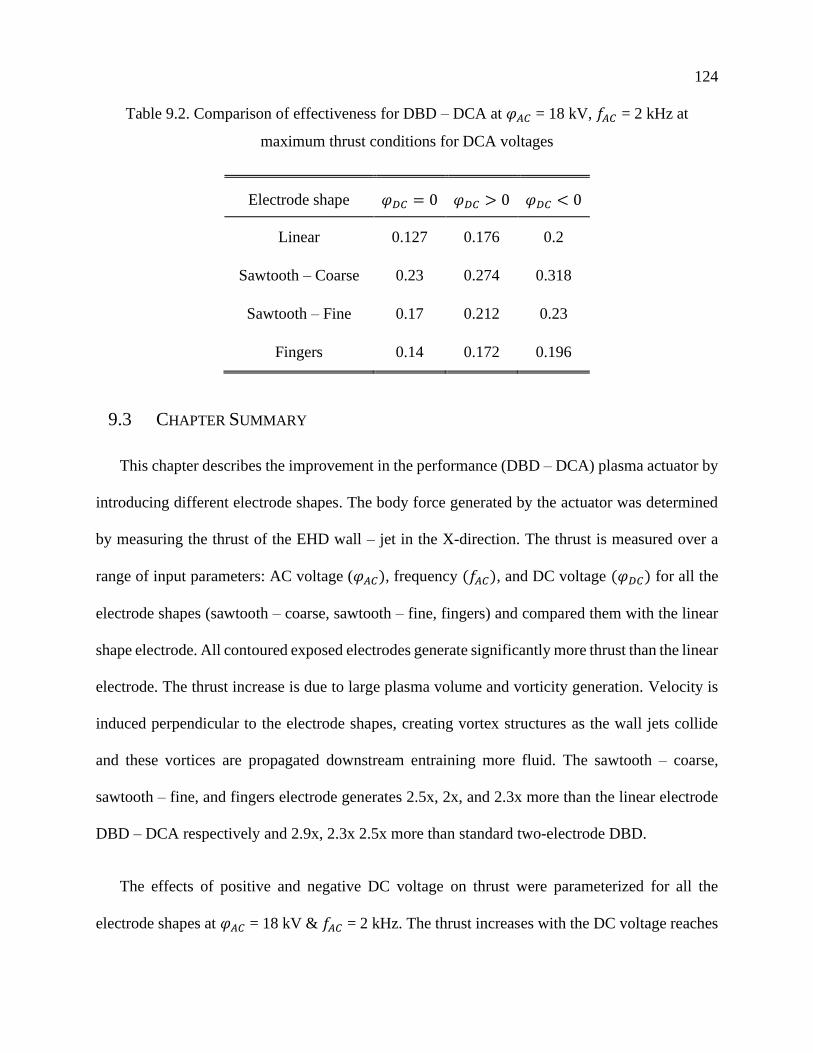
124
Table 9.2. Comparison of effectiveness for DBD – DCA at 𝜑𝐴𝐶 = 18 kV, 𝑓𝐴𝐶 = 2 kHz at
maximum thrust conditions for DCA voltages
Electrode shape 𝜑𝐷𝐶 = 0 𝜑𝐷𝐶 > 0 𝜑𝐷𝐶 < 0
Linear 0.127 0.176 0.2
Sawtooth – Coarse 0.23 0.274 0.318
Sawtooth – Fine 0.17 0.212 0.23
Fingers 0.14 0.172 0.196
9.3 CHAPTER SUMMARY
This chapter describes the improvement in the performance (DBD – DCA) plasma actuator by
introducing different electrode shapes. The body force generated by the actuator was determined
by measuring the thrust of the EHD wall – jet in the X-direction. The thrust is measured over a
range of input parameters: AC voltage (𝜑𝐴𝐶), frequency (𝑓𝐴𝐶), and DC voltage (𝜑𝐷𝐶) for all the
electrode shapes (sawtooth – coarse, sawtooth – fine, fingers) and compared them with the linear
shape electrode. All contoured exposed electrodes generate significantly more thrust than the linear
electrode. The thrust increase is due to large plasma volume and vorticity generation. Velocity is
induced perpendicular to the electrode shapes, creating vortex structures as the wall jets collide
and these vortices are propagated downstream entraining more fluid. The sawtooth – coarse,
sawtooth – fine, and fingers electrode generates 2.5x, 2x, and 2.3x more than the linear electrode
DBD – DCA respectively and 2.9x, 2.3x 2.5x more than standard two-electrode DBD.
The effects of positive and negative DC voltage on thrust were parameterized for all the
electrode shapes at 𝜑𝐴𝐶 = 18 kV & 𝑓𝐴𝐶 = 2 kHz. The thrust increases with the DC voltage reaches
125
a maximum value and drops when counter jet forms due to reverse discharge between DCA and
exposed electrode. For the same potential, the negative DC voltage generates more thrust than
positive DCA for all the electrode shapes. At 18 kV and 2 kHz, the sawtooth – coarse electrode
generates a maximum thrust force of 52 mN/m, which was 2x times higher than maximum thrust
induced by linear electrode negative DBD – DCA and 4x more than the standard two-electrode
DBD. For sawtooth – fine and fingers electrode cases, the thrust reached a maximum of 41.7 mN/m
and 47.8 mN/m, which is 1.7x and 1.9x higher than linear electrode negative DCA case and 3.3x
and 3.8x more than standard two-electrode DBD. The actuator's effectiveness was calculated for
the DBD – DCA actuator for different electrode shapes when the ground electrode is grounded
over a range of operating conditions. The effectiveness of the sawtooth – coarse electrode is 1.85x
more than the linear electrode. The effectiveness of the sawtooth – coarse electrode DBD – DCA,
when the third electrode is powered, is 1.5x higher than the linear electrode DBD – DCA cases.
126
Chapter 10. FLOW CONTROL USING PLASMA ACTUATORS AT
LOW ANGLES OF ATTACK
This study characterizes the effect of sawtooth DBD – DCA on the performance of NACA
0012 airfoil at low angles of attack in a subsonic wind tunnel. Force measurements were obtained
to calculate the lift and drag coefficients and the pitching moment coefficient for 𝛼 = 00 – 80. The
effect of the plasma actuator on the aerodynamic coefficients was determined for three Reynolds
numbers. The effects of the DC voltage on the third electrode were also studied to estimate the
control efficiency.
10.1 WIND TUNNEL AND AIRFOIL
The experiments were conducted in an open return subsonic wind tunnel at the University of
Washington with a 0.7 m × 0.383 m rectangular cross-section and a 1.2 m long test section. The
tunnel consists of a modular inlet with a series of 10 screens to condition the flow. Inlet is followed
by a settling chamber and 10:1 contraction that attaches to the test section. The sidewalls of the
test section are plexiglass, allowing for optical access. Downstream of the test section is a short
diffuser section connected to a 40 hp, 3 – phase 460 VAC blower controlled by a variable
frequency drive. The wind tunnel is shown in Figure 10.1.
The NACA 0012 airfoil was used in this study. This airfoil is chosen for its generic shape and
well-known aerodynamic characteristics. The active control of the airfoil was also studied
extensively, e.g., control of dynamic stall using plasma actuators [226-228], plasma slats, and flaps
[38, 40, 229]. These studies provided data on loads and flow visualization. The airfoil has a 190.5
mm chord (𝑐) and 381 mm span (𝑏). The size of the airfoil was selected to minimize the blockage
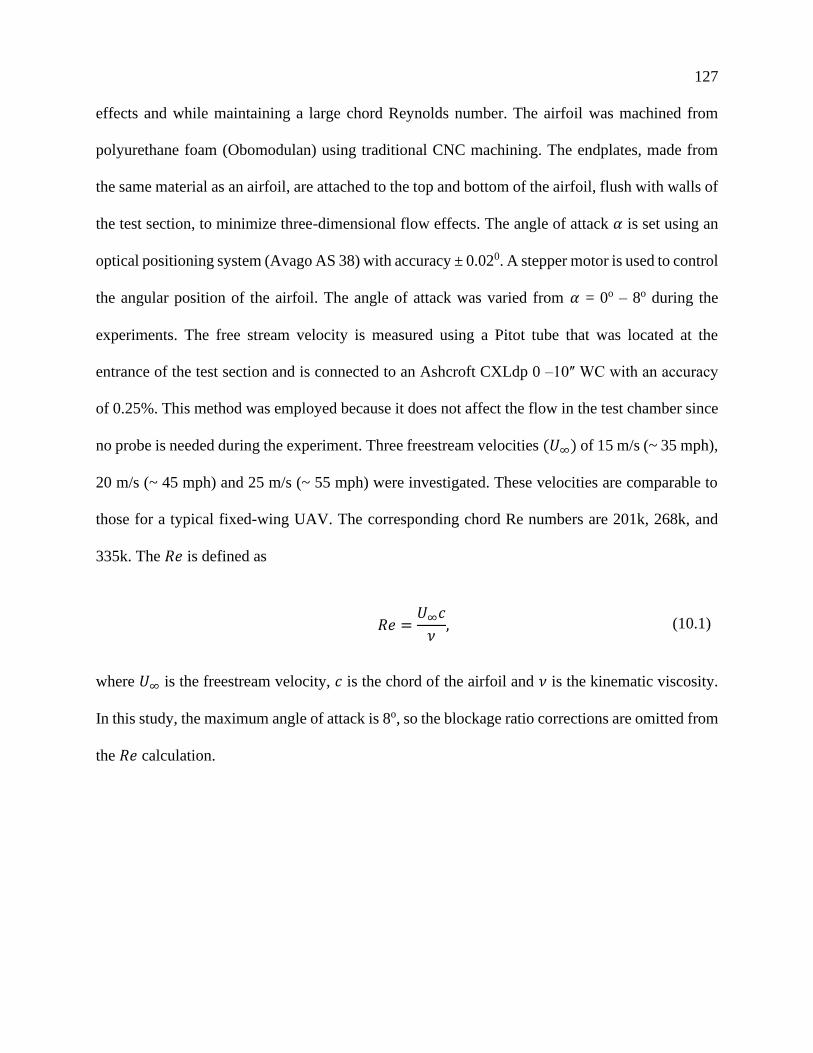
127
effects and while maintaining a large chord Reynolds number. The airfoil was machined from
polyurethane foam (Obomodulan) using traditional CNC machining. The endplates, made from
the same material as an airfoil, are attached to the top and bottom of the airfoil, flush with walls of
the test section, to minimize three-dimensional flow effects. The angle of attack 𝛼 is set using an
optical positioning system (Avago AS 38) with accuracy ± 0.020. A stepper motor is used to control
the angular position of the airfoil. The angle of attack was varied from 𝛼 = 0o – 8o during the
experiments. The free stream velocity is measured using a Pitot tube that was located at the
entrance of the test section and is connected to an Ashcroft CXLdp 0 –10ʺ WC with an accuracy
of 0.25%. This method was employed because it does not affect the flow in the test chamber since
no probe is needed during the experiment. Three freestream velocities (𝑈∞) of 15 m/s (~ 35 mph),
20 m/s (~ 45 mph) and 25 m/s (~ 55 mph) were investigated. These velocities are comparable to
those for a typical fixed-wing UAV. The corresponding chord Re numbers are 201k, 268k, and
335k. The 𝑅𝑒 is defined as
𝑅𝑒 =𝑈∞𝑐
𝜈, (10.1)
where 𝑈∞ is the freestream velocity, 𝑐 is the chord of the airfoil and 𝜈 is the kinematic viscosity.
In this study, the maximum angle of attack is 8o, so the blockage ratio corrections are omitted from
the 𝑅𝑒 calculation.
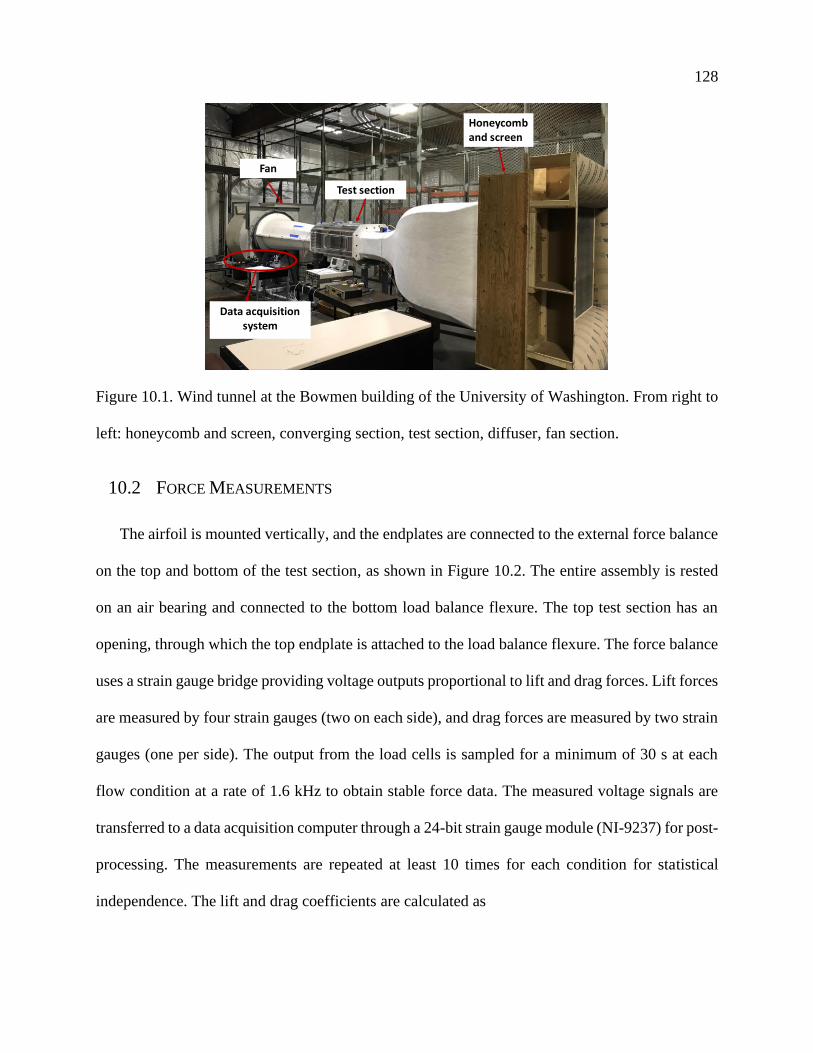
128
Figure 10.1. Wind tunnel at the Bowmen building of the University of Washington. From right to
left: honeycomb and screen, converging section, test section, diffuser, fan section.
10.2 FORCE MEASUREMENTS
The airfoil is mounted vertically, and the endplates are connected to the external force balance
on the top and bottom of the test section, as shown in Figure 10.2. The entire assembly is rested
on an air bearing and connected to the bottom load balance flexure. The top test section has an
opening, through which the top endplate is attached to the load balance flexure. The force balance
uses a strain gauge bridge providing voltage outputs proportional to lift and drag forces. Lift forces
are measured by four strain gauges (two on each side), and drag forces are measured by two strain
gauges (one per side). The output from the load cells is sampled for a minimum of 30 s at each
flow condition at a rate of 1.6 kHz to obtain stable force data. The measured voltage signals are
transferred to a data acquisition computer through a 24-bit strain gauge module (NI-9237) for post-
processing. The measurements are repeated at least 10 times for each condition for statistical
independence. The lift and drag coefficients are calculated as
Honeycomb and screen
Test section
Fan
Data acquisition system
129
𝐶𝐿 =𝐿
12 𝜌𝑈∞
2 𝑐𝑏, (10.2)
𝐶𝐷 =
𝐷
12 𝜌𝑈∞
2 𝑐𝑏,
(10.3)
where 𝐿 and 𝐷 are the time-averaged lift and drag, respectively, 𝜌 is the air density 𝑐 is the chord
and 𝑏 is the span of the airfoil model. The measurement range is 711 N for the lift force and 106
N for the drag force, with an accuracy of 0.04% and 0.03% of the full range, respectively. The
resulting uncertainties in the force coefficients are less than 3%. The pitching moment coefficient
is calculated using Eq.(10.4) about quarter chord location based on the measured lift force at the
leading and trailing edges of the airfoil.
𝐶𝑀 =𝑀
12 𝜌𝑈∞
2 𝑐𝑏, (10.4)
where 𝑀 is the pitching moment calculated at quarter chord.
130
Figure 10.2. Schematic of the experimental setup for the lift, drag and pitching moment
measurements on the airfoil with sawtooth DBD – DCA actuator.
10.3 PLASMA ACTUATOR
The plasma actuator consists of three 0.05 mm thick copper electrodes separated by four layers
of Kapton film (7700 VPM @ 25 ◦C) of thickness 0.088 mm as shown in Figure 10.3(a). The
exposed high voltage electrode is fabricated using electro-discharge machining to produce a
sawtooth pattern, as shown in Figure 10.3(b). The sawtooth pattern was selected based on a
preliminary optimization study [230]. Gao et al. also reported that sawtooth a pitch-to-height ratio
of 1 is favorable for power consumption, dielectric heating, and velocity induced by plasma [164].
The trough of the sawtooth is rounded to eliminate the high electric field concentration. The
exposed and encapsulated electrodes are overlapped such that the ground electrode edge is aligned
with the troughs of the sawtooth pattern. The width of the ground electrode is 25 mm and is long
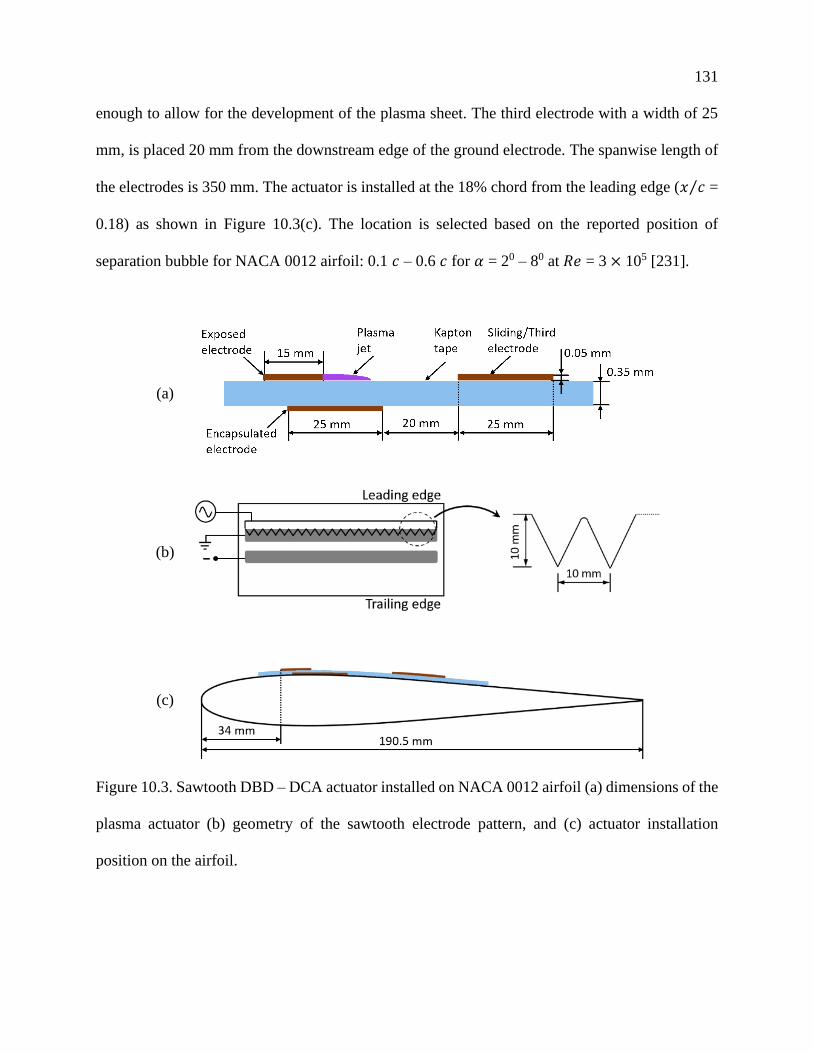
131
enough to allow for the development of the plasma sheet. The third electrode with a width of 25
mm, is placed 20 mm from the downstream edge of the ground electrode. The spanwise length of
the electrodes is 350 mm. The actuator is installed at the 18% chord from the leading edge (𝑥 𝑐⁄ =
0.18) as shown in Figure 10.3(c). The location is selected based on the reported position of
separation bubble for NACA 0012 airfoil: 0.1 𝑐 – 0.6 𝑐 for 𝛼 = 20 – 80 at 𝑅𝑒 = 3 × 10⁵ [231].
(a)
(b)
(c)
Figure 10.3. Sawtooth DBD – DCA actuator installed on NACA 0012 airfoil (a) dimensions of the
plasma actuator (b) geometry of the sawtooth electrode pattern, and (c) actuator installation
position on the airfoil.
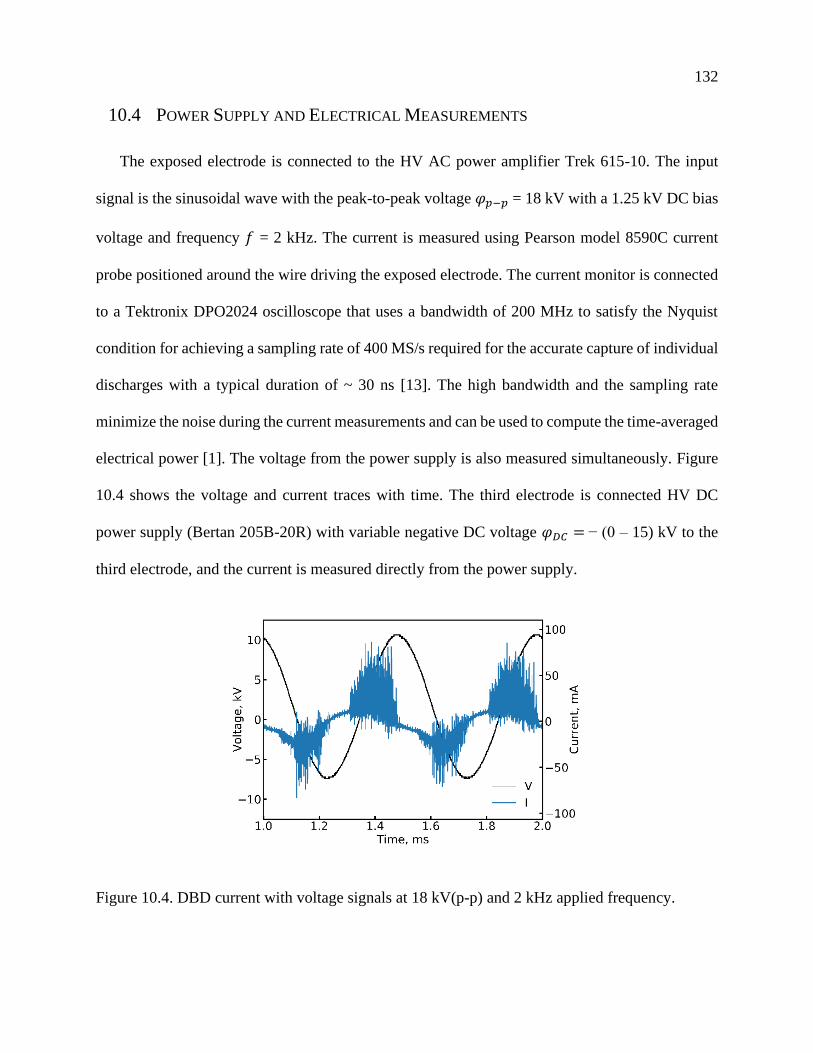
132
10.4 POWER SUPPLY AND ELECTRICAL MEASUREMENTS
The exposed electrode is connected to the HV AC power amplifier Trek 615-10. The input
signal is the sinusoidal wave with the peak-to-peak voltage 𝜑𝑝−𝑝 = 18 kV with a 1.25 kV DC bias
voltage and frequency 𝑓 = 2 kHz. The current is measured using Pearson model 8590C current
probe positioned around the wire driving the exposed electrode. The current monitor is connected
to a Tektronix DPO2024 oscilloscope that uses a bandwidth of 200 MHz to satisfy the Nyquist
condition for achieving a sampling rate of 400 MS/s required for the accurate capture of individual
discharges with a typical duration of ~ 30 ns [13]. The high bandwidth and the sampling rate
minimize the noise during the current measurements and can be used to compute the time-averaged
electrical power [1]. The voltage from the power supply is also measured simultaneously. Figure
10.4 shows the voltage and current traces with time. The third electrode is connected HV DC
power supply (Bertan 205B-20R) with variable negative DC voltage 𝜑𝐷𝐶 = − (0 – 15) kV to the
third electrode, and the current is measured directly from the power supply.
Figure 10.4. DBD current with voltage signals at 18 kV(p-p) and 2 kHz applied frequency.
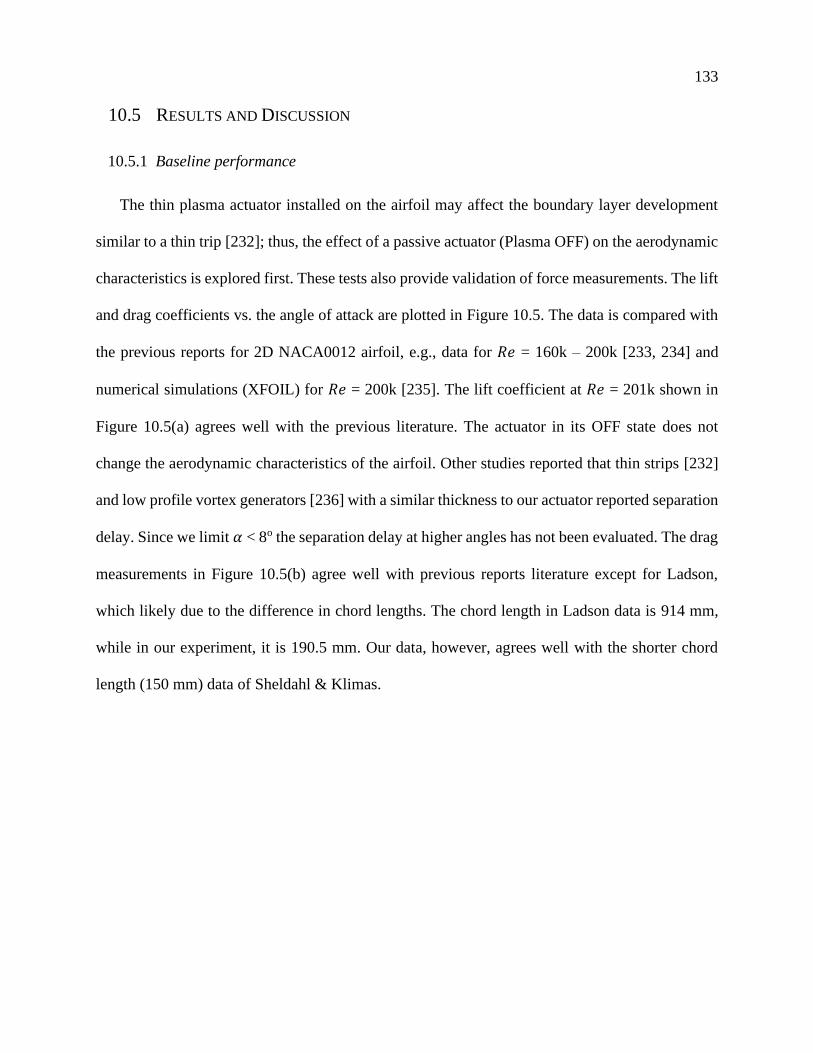
133
10.5 RESULTS AND DISCUSSION
10.5.1 Baseline performance
The thin plasma actuator installed on the airfoil may affect the boundary layer development
similar to a thin trip [232]; thus, the effect of a passive actuator (Plasma OFF) on the aerodynamic
characteristics is explored first. These tests also provide validation of force measurements. The lift
and drag coefficients vs. the angle of attack are plotted in Figure 10.5. The data is compared with
the previous reports for 2D NACA0012 airfoil, e.g., data for 𝑅𝑒 = 160k – 200k [233, 234] and
numerical simulations (XFOIL) for 𝑅𝑒 = 200k [235]. The lift coefficient at 𝑅𝑒 = 201k shown in
Figure 10.5(a) agrees well with the previous literature. The actuator in its OFF state does not
change the aerodynamic characteristics of the airfoil. Other studies reported that thin strips [232]
and low profile vortex generators [236] with a similar thickness to our actuator reported separation
delay. Since we limit 𝛼 < 8o the separation delay at higher angles has not been evaluated. The drag
measurements in Figure 10.5(b) agree well with previous reports literature except for Ladson,
which likely due to the difference in chord lengths. The chord length in Ladson data is 914 mm,
while in our experiment, it is 190.5 mm. Our data, however, agrees well with the shorter chord
length (150 mm) data of Sheldahl & Klimas.
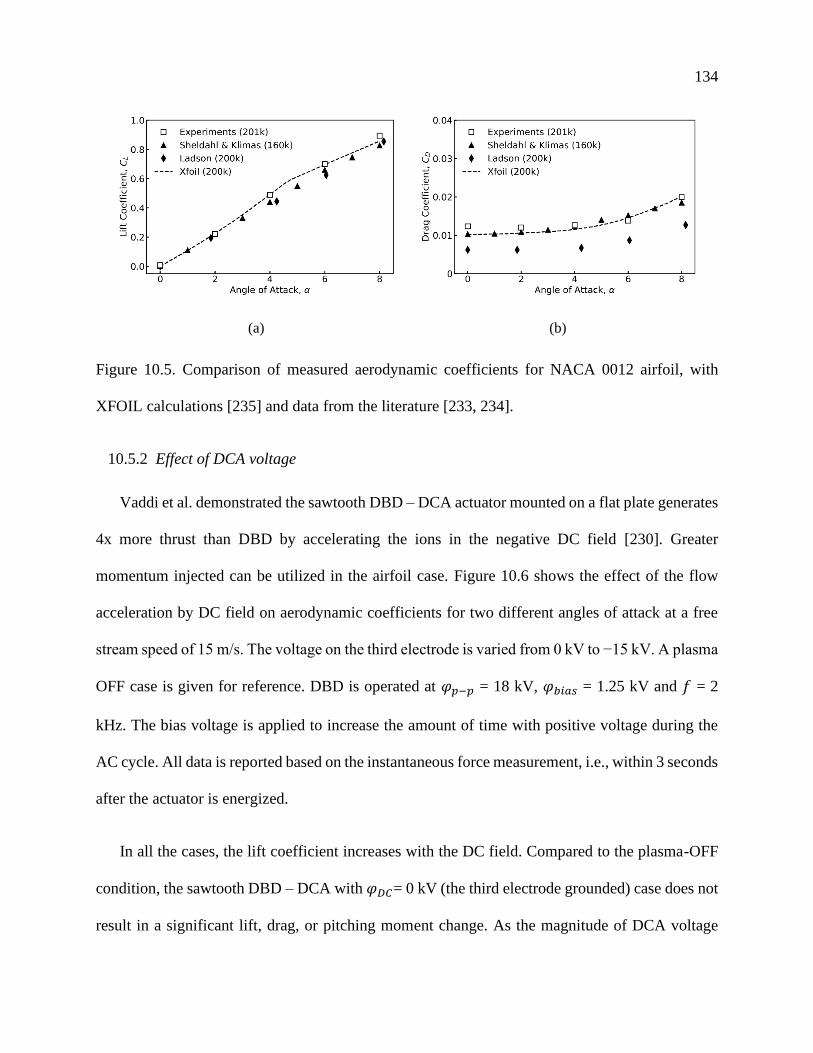
134
(a) (b)
Figure 10.5. Comparison of measured aerodynamic coefficients for NACA 0012 airfoil, with
XFOIL calculations [235] and data from the literature [233, 234].
10.5.2 Effect of DCA voltage
Vaddi et al. demonstrated the sawtooth DBD – DCA actuator mounted on a flat plate generates
4x more thrust than DBD by accelerating the ions in the negative DC field [230]. Greater
momentum injected can be utilized in the airfoil case. Figure 10.6 shows the effect of the flow
acceleration by DC field on aerodynamic coefficients for two different angles of attack at a free
stream speed of 15 m/s. The voltage on the third electrode is varied from 0 kV to −15 kV. A plasma
OFF case is given for reference. DBD is operated at 𝜑𝑝−𝑝 = 18 kV, 𝜑𝑏𝑖𝑎𝑠 = 1.25 kV and 𝑓 = 2
kHz. The bias voltage is applied to increase the amount of time with positive voltage during the
AC cycle. All data is reported based on the instantaneous force measurement, i.e., within 3 seconds
after the actuator is energized.
In all the cases, the lift coefficient increases with the DC field. Compared to the plasma-OFF
condition, the sawtooth DBD – DCA with 𝜑𝐷𝐶= 0 kV (the third electrode grounded) case does not
result in a significant lift, drag, or pitching moment change. As the magnitude of DCA voltage
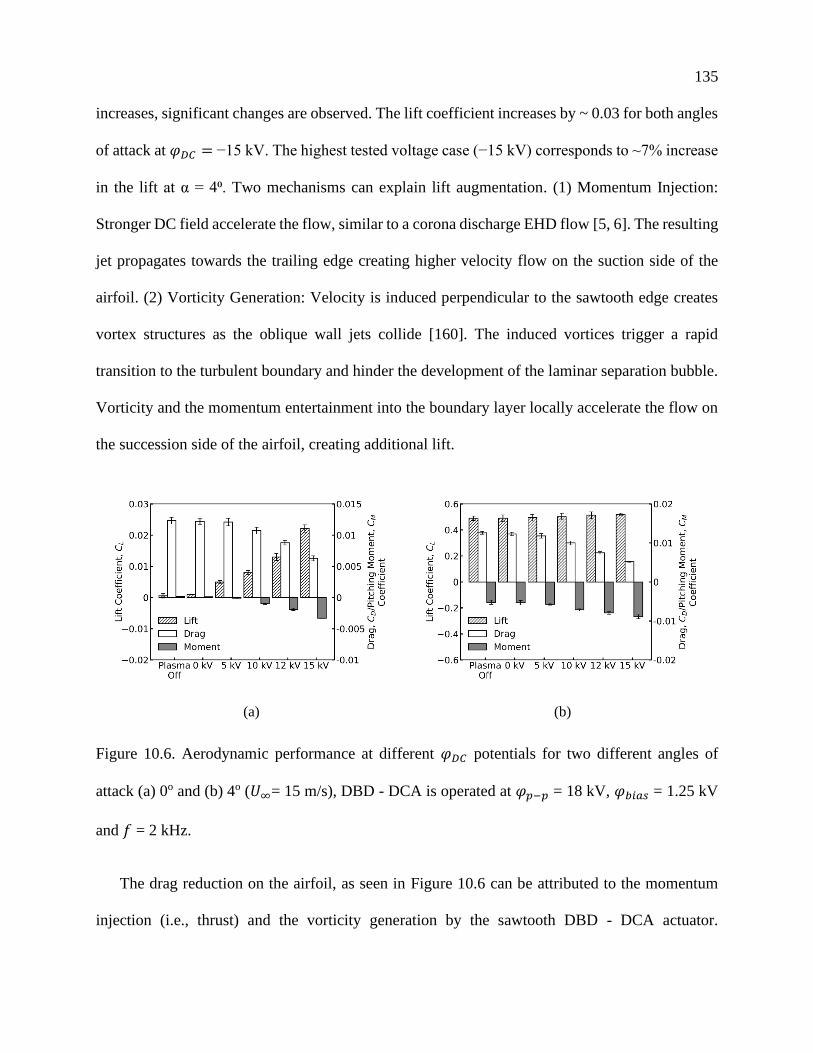
135
increases, significant changes are observed. The lift coefficient increases by ~ 0.03 for both angles
of attack at 𝜑𝐷𝐶 = −15 kV. The highest tested voltage case (−15 kV) corresponds to ~7% increase
in the lift at α = 4⁰. Two mechanisms can explain lift augmentation. (1) Momentum Injection:
Stronger DC field accelerate the flow, similar to a corona discharge EHD flow [5, 6]. The resulting
jet propagates towards the trailing edge creating higher velocity flow on the suction side of the
airfoil. (2) Vorticity Generation: Velocity is induced perpendicular to the sawtooth edge creates
vortex structures as the oblique wall jets collide [160]. The induced vortices trigger a rapid
transition to the turbulent boundary and hinder the development of the laminar separation bubble.
Vorticity and the momentum entertainment into the boundary layer locally accelerate the flow on
the succession side of the airfoil, creating additional lift.
(a) (b)
Figure 10.6. Aerodynamic performance at different 𝜑𝐷𝐶 potentials for two different angles of
attack (a) 0o and (b) 4o (𝑈∞= 15 m/s), DBD - DCA is operated at 𝜑𝑝−𝑝 = 18 kV, 𝜑𝑏𝑖𝑎𝑠 = 1.25 kV
and 𝑓 = 2 kHz.
The drag reduction on the airfoil, as seen in Figure 10.6 can be attributed to the momentum
injection (i.e., thrust) and the vorticity generation by the sawtooth DBD - DCA actuator.
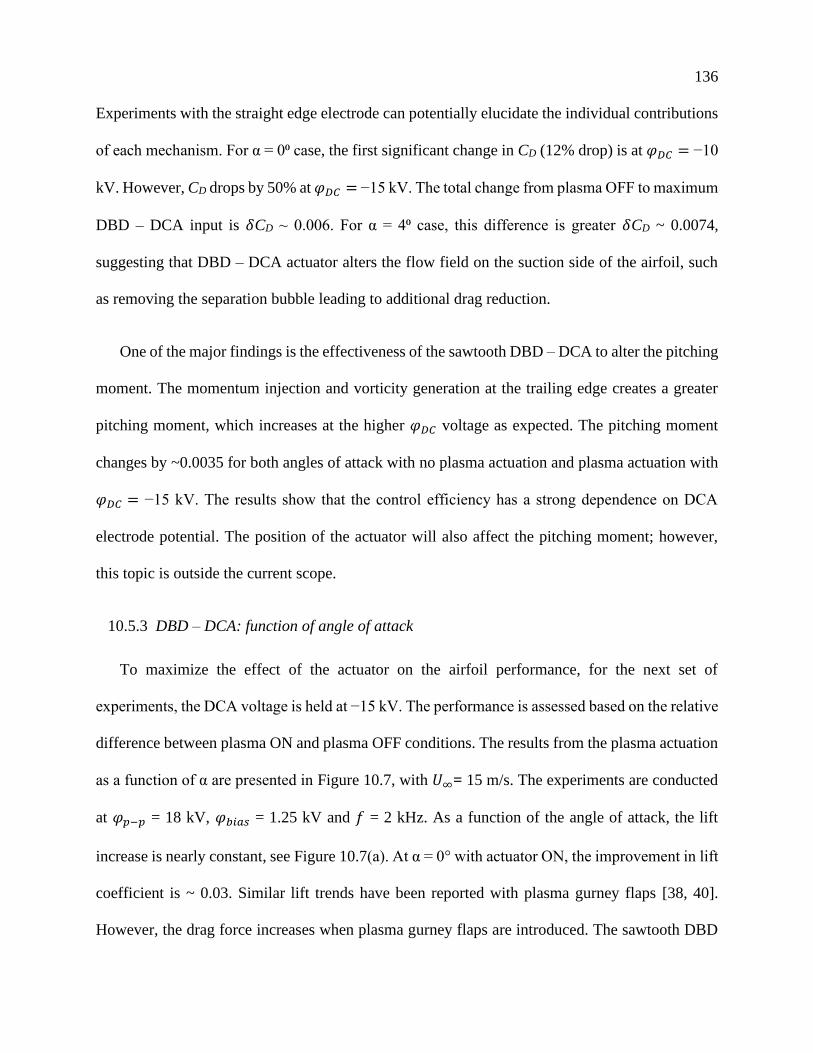
136
Experiments with the straight edge electrode can potentially elucidate the individual contributions
of each mechanism. For α = 0⁰ case, the first significant change in CD (12% drop) is at 𝜑𝐷𝐶 = −10
kV. However, CD drops by 50% at 𝜑𝐷𝐶 = −15 kV. The total change from plasma OFF to maximum
DBD – DCA input is 𝛿CD ~ 0.006. For α = 4⁰ case, this difference is greater 𝛿CD ~ 0.0074,
suggesting that DBD – DCA actuator alters the flow field on the suction side of the airfoil, such
as removing the separation bubble leading to additional drag reduction.
One of the major findings is the effectiveness of the sawtooth DBD – DCA to alter the pitching
moment. The momentum injection and vorticity generation at the trailing edge creates a greater
pitching moment, which increases at the higher 𝜑𝐷𝐶 voltage as expected. The pitching moment
changes by ~0.0035 for both angles of attack with no plasma actuation and plasma actuation with
𝜑𝐷𝐶 = −15 kV. The results show that the control efficiency has a strong dependence on DCA
electrode potential. The position of the actuator will also affect the pitching moment; however,
this topic is outside the current scope.
10.5.3 DBD – DCA: function of angle of attack
To maximize the effect of the actuator on the airfoil performance, for the next set of
experiments, the DCA voltage is held at −15 kV. The performance is assessed based on the relative
difference between plasma ON and plasma OFF conditions. The results from the plasma actuation
as a function of α are presented in Figure 10.7, with 𝑈∞= 15 m/s. The experiments are conducted
at 𝜑𝑝−𝑝 = 18 kV, 𝜑𝑏𝑖𝑎𝑠 = 1.25 kV and 𝑓 = 2 kHz. As a function of the angle of attack, the lift
increase is nearly constant, see Figure 10.7(a). At α = 0° with actuator ON, the improvement in lift
coefficient is ~ 0.03. Similar lift trends have been reported with plasma gurney flaps [38, 40].
However, the drag force increases when plasma gurney flaps are introduced. The sawtooth DBD
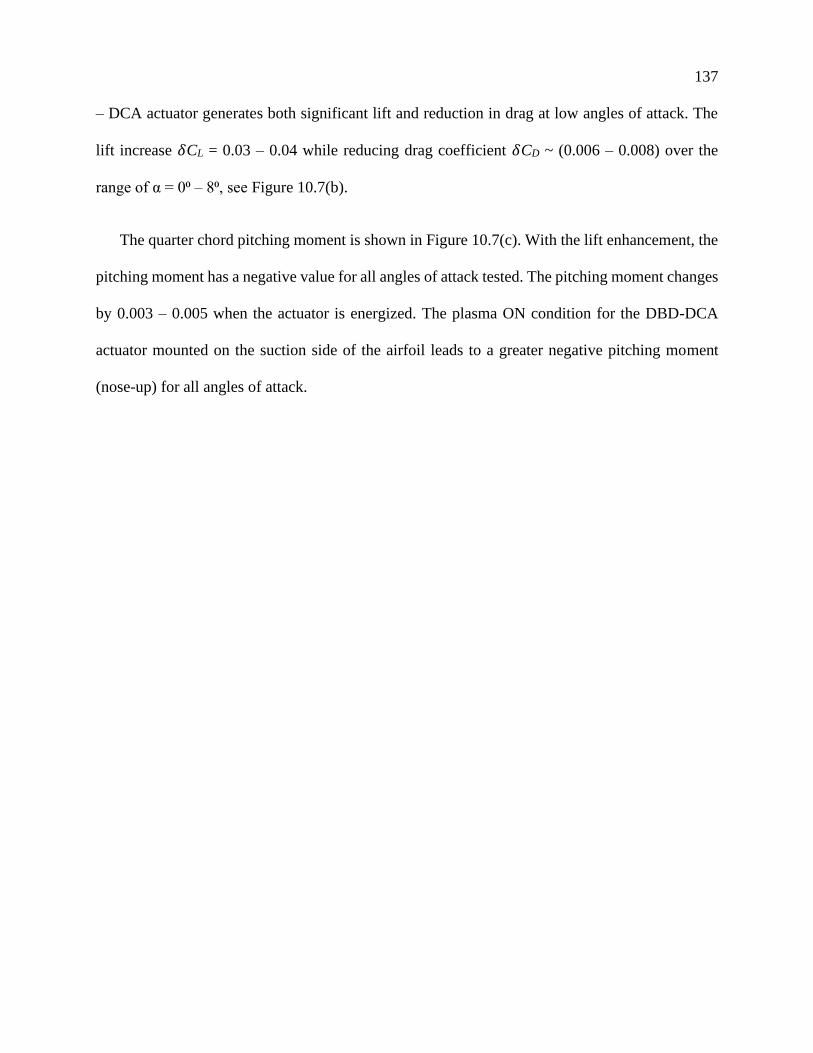
137
– DCA actuator generates both significant lift and reduction in drag at low angles of attack. The
lift increase 𝛿CL = 0.03 – 0.04 while reducing drag coefficient 𝛿CD ~ (0.006 – 0.008) over the
range of α = 0⁰ – 8⁰, see Figure 10.7(b).
The quarter chord pitching moment is shown in Figure 10.7(c). With the lift enhancement, the
pitching moment has a negative value for all angles of attack tested. The pitching moment changes
by 0.003 – 0.005 when the actuator is energized. The plasma ON condition for the DBD-DCA
actuator mounted on the suction side of the airfoil leads to a greater negative pitching moment
(nose-up) for all angles of attack.
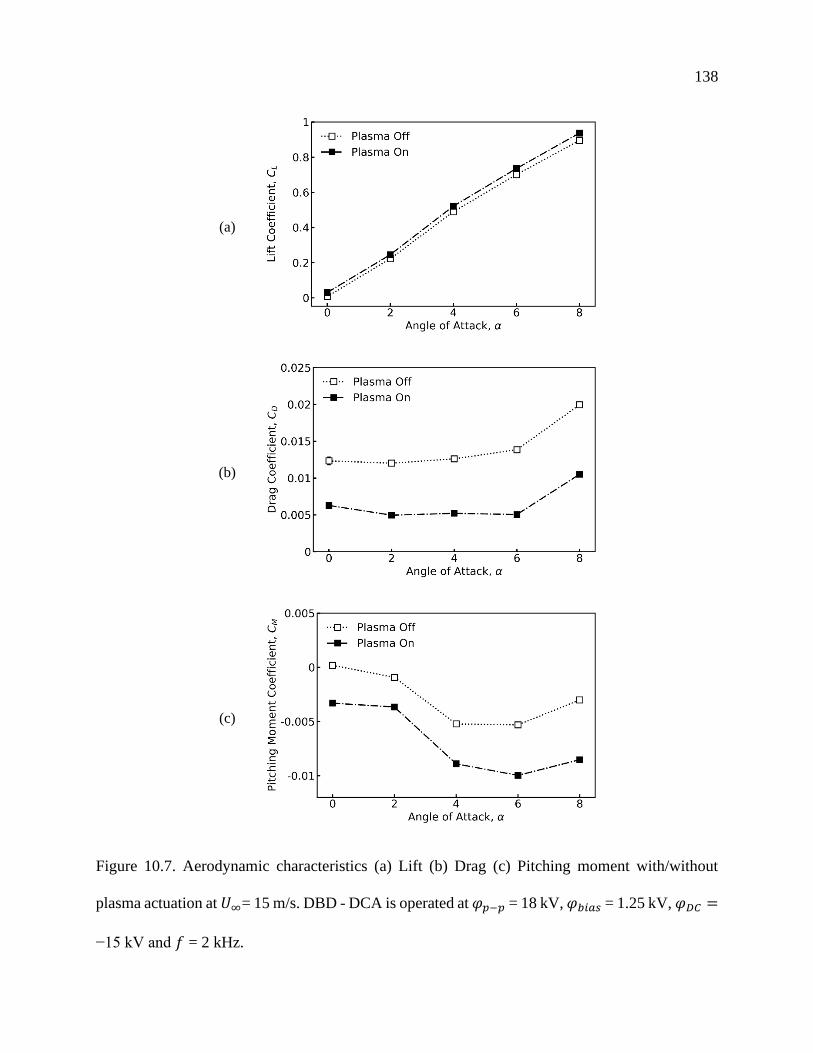
138
(a)
(b)
(c)
Figure 10.7. Aerodynamic characteristics (a) Lift (b) Drag (c) Pitching moment with/without
plasma actuation at 𝑈∞= 15 m/s. DBD - DCA is operated at 𝜑𝑝−𝑝 = 18 kV, 𝜑𝑏𝑖𝑎𝑠 = 1.25 kV, 𝜑𝐷𝐶 =
−15 kV and 𝑓 = 2 kHz.
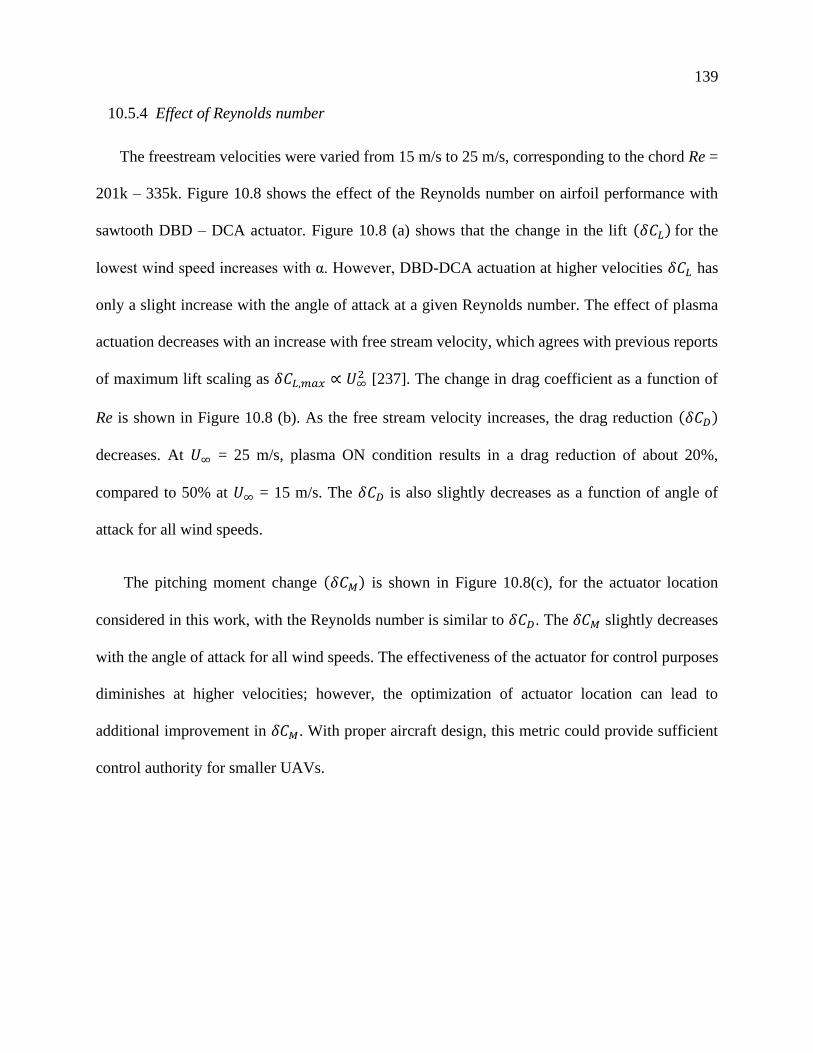
139
10.5.4 Effect of Reynolds number
The freestream velocities were varied from 15 m/s to 25 m/s, corresponding to the chord Re =
201k – 335k. Figure 10.8 shows the effect of the Reynolds number on airfoil performance with
sawtooth DBD – DCA actuator. Figure 10.8 (a) shows that the change in the lift (𝛿𝐶𝐿) for the
lowest wind speed increases with α. However, DBD-DCA actuation at higher velocities 𝛿𝐶𝐿 has
only a slight increase with the angle of attack at a given Reynolds number. The effect of plasma
actuation decreases with an increase with free stream velocity, which agrees with previous reports
of maximum lift scaling as 𝛿𝐶𝐿,𝑚𝑎𝑥 ∝ 𝑈∞2 [237]. The change in drag coefficient as a function of
Re is shown in Figure 10.8 (b). As the free stream velocity increases, the drag reduction (𝛿𝐶𝐷)
decreases. At 𝑈∞ = 25 m/s, plasma ON condition results in a drag reduction of about 20%,
compared to 50% at 𝑈∞ = 15 m/s. The 𝛿𝐶𝐷 is also slightly decreases as a function of angle of
attack for all wind speeds.
The pitching moment change (𝛿𝐶𝑀) is shown in Figure 10.8(c), for the actuator location
considered in this work, with the Reynolds number is similar to 𝛿𝐶𝐷. The 𝛿𝐶𝑀 slightly decreases
with the angle of attack for all wind speeds. The effectiveness of the actuator for control purposes
diminishes at higher velocities; however, the optimization of actuator location can lead to
additional improvement in 𝛿𝐶𝑀. With proper aircraft design, this metric could provide sufficient
control authority for smaller UAVs.
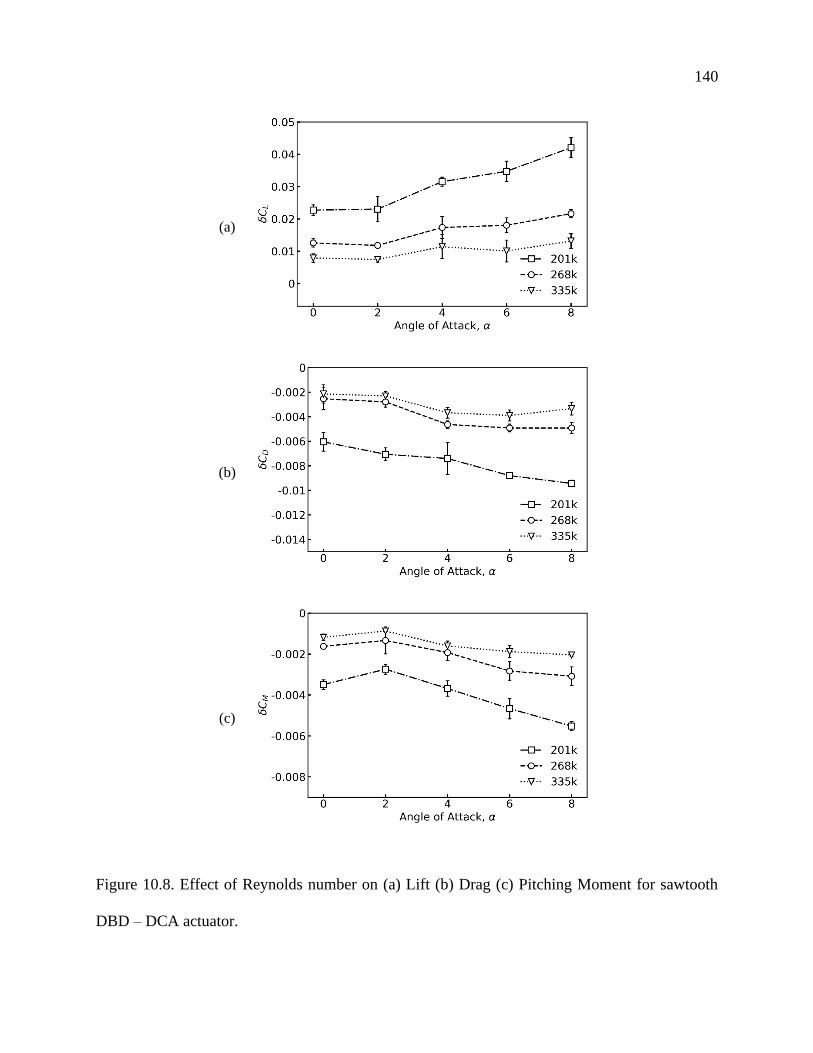
140
(a)
(b)
(c)
Figure 10.8. Effect of Reynolds number on (a) Lift (b) Drag (c) Pitching Moment for sawtooth
DBD – DCA actuator.
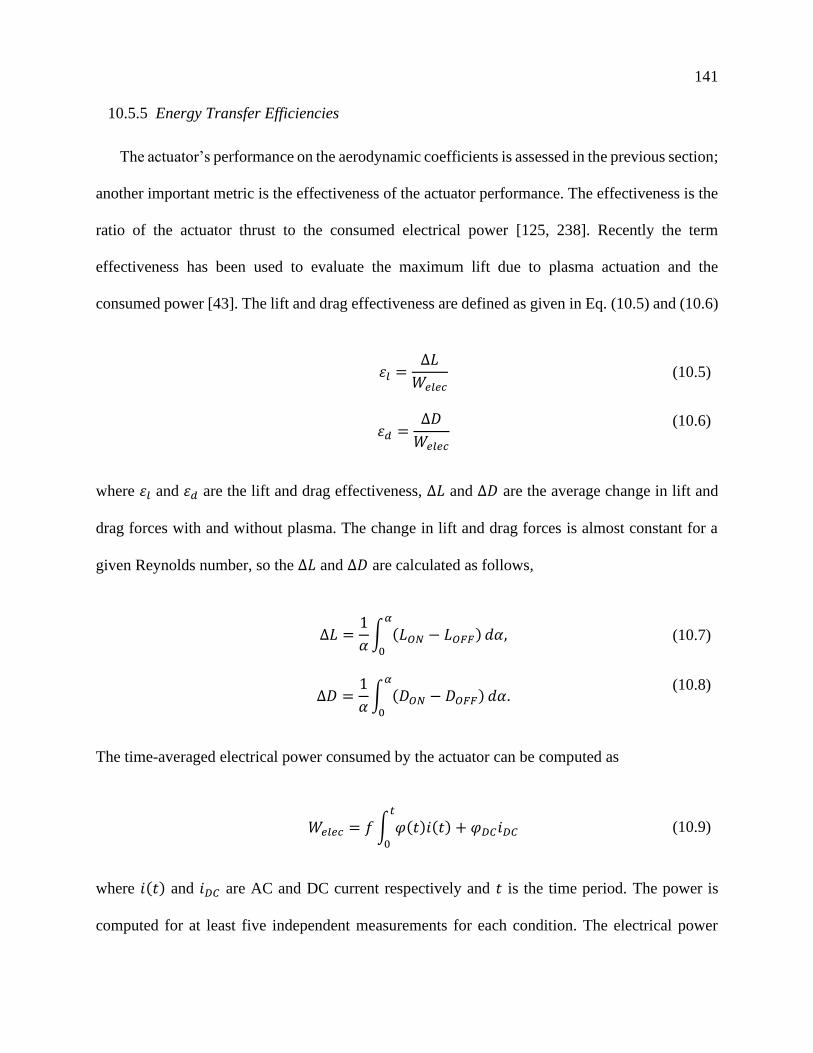
141
10.5.5 Energy Transfer Efficiencies
The actuator’s performance on the aerodynamic coefficients is assessed in the previous section;
another important metric is the effectiveness of the actuator performance. The effectiveness is the
ratio of the actuator thrust to the consumed electrical power [125, 238]. Recently the term
effectiveness has been used to evaluate the maximum lift due to plasma actuation and the
consumed power [43]. The lift and drag effectiveness are defined as given in Eq. (10.5) and (10.6)
휀𝑙 =∆𝐿
𝑊𝑒𝑙𝑒𝑐 (10.5)
휀𝑑 =
∆𝐷
𝑊𝑒𝑙𝑒𝑐
(10.6)
where 휀𝑙 and 휀𝑑 are the lift and drag effectiveness, ∆𝐿 and ∆𝐷 are the average change in lift and
drag forces with and without plasma. The change in lift and drag forces is almost constant for a
given Reynolds number, so the ∆𝐿 and ∆𝐷 are calculated as follows,
∆𝐿 =1
𝛼∫ (𝐿𝑂𝑁 − 𝐿𝑂𝐹𝐹)
𝛼
0
𝑑𝛼, (10.7)
∆𝐷 =
1
𝛼∫ (𝐷𝑂𝑁 − 𝐷𝑂𝐹𝐹)
𝛼
0
𝑑𝛼. (10.8)
The time-averaged electrical power consumed by the actuator can be computed as
𝑊𝑒𝑙𝑒𝑐 = 𝑓 ∫ 𝜑(𝑡)𝑖(𝑡) + 𝜑𝐷𝐶𝑖𝐷𝐶
𝑡
0
(10.9)
where 𝑖(𝑡) and 𝑖𝐷𝐶 are AC and DC current respectively and 𝑡 is the time period. The power is
computed for at least five independent measurements for each condition. The electrical power
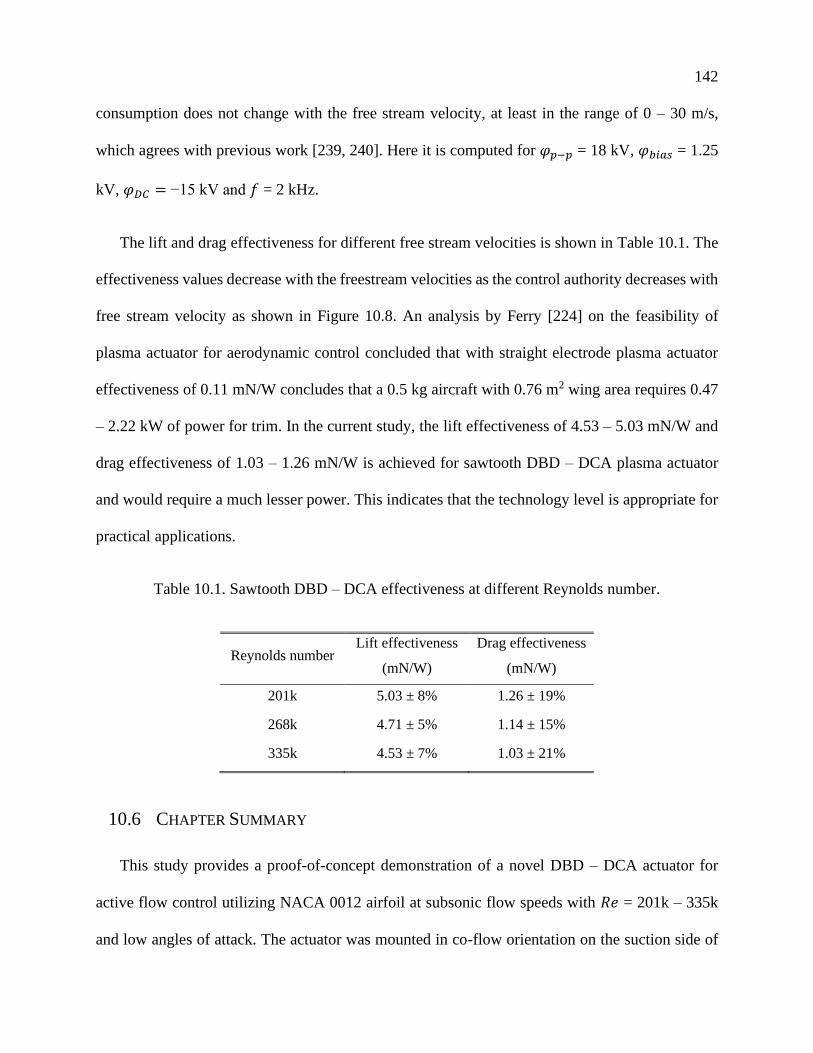
142
consumption does not change with the free stream velocity, at least in the range of 0 – 30 m/s,
which agrees with previous work [239, 240]. Here it is computed for 𝜑𝑝−𝑝 = 18 kV, 𝜑𝑏𝑖𝑎𝑠 = 1.25
kV, 𝜑𝐷𝐶 = −15 kV and 𝑓 = 2 kHz.
The lift and drag effectiveness for different free stream velocities is shown in Table 10.1. The
effectiveness values decrease with the freestream velocities as the control authority decreases with
free stream velocity as shown in Figure 10.8. An analysis by Ferry [224] on the feasibility of
plasma actuator for aerodynamic control concluded that with straight electrode plasma actuator
effectiveness of 0.11 mN/W concludes that a 0.5 kg aircraft with 0.76 m2 wing area requires 0.47
– 2.22 kW of power for trim. In the current study, the lift effectiveness of 4.53 – 5.03 mN/W and
drag effectiveness of 1.03 – 1.26 mN/W is achieved for sawtooth DBD – DCA plasma actuator
and would require a much lesser power. This indicates that the technology level is appropriate for
practical applications.
Table 10.1. Sawtooth DBD – DCA effectiveness at different Reynolds number.
Reynolds number Lift effectiveness
(mN/W)
Drag effectiveness
(mN/W)
201k 5.03 ± 8% 1.26 ± 19%
268k 4.71 ± 5% 1.14 ± 15%
335k 4.53 ± 7% 1.03 ± 21%
10.6 CHAPTER SUMMARY
This study provides a proof-of-concept demonstration of a novel DBD – DCA actuator for
active flow control utilizing NACA 0012 airfoil at subsonic flow speeds with 𝑅𝑒 = 201k – 335k
and low angles of attack. The actuator was mounted in co-flow orientation on the suction side of
143
the airfoil: the active AC electrode was positioned at 18% chord and the DCA electrode at 48%
chord. Effects of DCA potential, angle of attack, wind speeds on airfoil performance were
investigated. The DCA potential increases the lift coefficient, reduced drag, and significantly
affects the pitching moment of the airfoil. These effects can be explained by two mechanisms (1)
increase of momentum injection due to DCA effect, (2) Vorticity generation due to a sawtooth-
shaped electrode.
The lift curve with plasma actuation is almost parallel to no actuation for all angles of attack
𝛼 = 00 – 80 and the change in CL~0.03 – 0.04. The 𝛿𝐶𝐿with and without plasma actuation decreases
with free stream velocity, and the scaling factor agrees with the literature. The drag coefficient
decreases with the 𝜑𝐷𝐶 and a drag reduction of 50% is measured when 𝜑𝐷𝐶 = −15 kV at 𝑈∞ = 15
m/s. Consistent 𝛿𝐶𝑀 shows DBD – DCA can be used for active flow at low angles of attack for
low-velocity UAVs. One of the limitations of plasma actuators is their ineffectiveness at high
velocities; future research should address the performance of DBD-DCA actuators at higher wind
speeds. To improve control authority, the research should explore different positions and
orientations of the actuator. Another topic of interest is gain insight into the interaction between
the free flow and the momentum injection into the flow boundary layer for sawtooth DBD – DCA
either by flow visualization or surface pressure measurements.
144
Chapter 11. INVESTIGATION OF PARTICLES IN EHD SYSTEMS
Previous chapters Chapter 5 & Chapter 10 discussed the successful integration of the EHD
system for propulsion and control of aerial vehicles. It demonstrated the benefits of EHD wind on
thrust and aerodynamic forces and discussed key results from wind tunnel testing. In this chapter,
we focus on a concern related to environmental pollution and how we can use the EHD technology
to build sensors to detect pollutants. The fundamental mechanisms of particle collection within an
EHD system are discussed, and a new particle charging method in EHD and a novel particle sensor
based on the EHD particle charging method are presented. This work is published in Journal of
Aerosol Science [9] and International Symposium on Electrohydrodynamics 2019 [11].
11.1 BEHAVIOR OF ULTRAFINE PARTICLES IN EHD FLOW
Gas-phase collisions between the particles and ion medium play an important role in governing
the behavior of aerosols [241-244] and dusty plasmas [245, 246]. The presence of the electric field
and the ion medium plays a major role in particle trapping since particles acquire a charge from
ion collisions [247]. The electrostatic force on a charged particle in the electric field can be greater
than gravitational, inertial, and thermal forces. Electrostatic precipitator (ESP) devices can collect
fine and ultrafine particles and are widely used in sampling and filtration applications.
Conventional ESPs employ a point-plate, point-cylinder, wire-plate, point-ring configuration. In a
typical electrostatic particle collector, the flow is induced by an external source; the corona
discharge-induced flow is typically not considered. However, the ionic interaction used to collect
the particles can be used to generate the flow and enhance particle charging in corona discharge-
driven flow. It is challenging to gain insight into the particle charging mechanism in the high ion
145
concentration and electric field environment due to the complexity of the physical phenomena and
a lack of experimental data.
Corona discharge is an electrical breakdown of air in which ions are generated in the high
electric field region near the high energy anode; these ions drift towards the grounded cathode.
The collisions of ions with the neutral air molecules result in a macroscopic wind, which is also
known as electro-hydrodynamic (EHD) flow or ionic wind. The EHD effect has been used for
plasma-assisted combustion [23, 24], convective cooling [26-29] and control of the aircraft [2, 78].
The application of EHD technology has been limited due to the modest pressure values achieved
by the EHD blowers. However, in the applications with the low-pressure drop, the EHD driven
flow can provide novel solutions [7, 172, 248]. Among the benefits of the EHD approach are the
ability to operate at a small scale without moving parts and quiet operation [8, 16, 78]. The current-
voltage relationship describes the ion transport between the electrodes. The classical voltage to the
current relationship was derived by Townsend for a coaxial corona configuration [249]. This
quadratic relationship has been observed for other configurations, i.e., point to plate [50] and point
to ring corona [7]. A generalized analytical model for voltage to current and voltage to velocity
relationship for EHD driven flow has been recently developed [6]. The maximum velocity for
point-to-ring electrode configuration was recorded at ~9 m/s; the analytical model provides a good
comparison with the experimental data.
Particle charging mechanisms have been an active research area, field and diffusion charging
expressions [250-253] were developed for large particles (0.3 μm – 10 μm). Fuchs [254] and
Marlow and Brock [242] developed diffusion charging expression for smaller particles, a
combined field and diffusion charging expression was proposed by Liu and Kapadia [255]. Most
146
particle charging expressions were developed for spherical particles; however, recent experimental
results for square particles demonstrated enhanced particle charging due to corners and edges
[256]. Experimental and numerical studies have demonstrated a good agreement in the size range
of 0.3 μm – 10 μm [257-259]. Multiple experimental studies for the PM in the size range of 30 nm
– 400 nm [260-263] agree with the theoretical models. Nanoparticle generation and behavior in
low-temperature plasma produced by DBD discharge were studied [264], and particles smaller
than 20 nm are generated [265, 266]. Several researchers have also shown that for particles smaller
than 30 nm, a fraction of particles was not charged and not collected [244, 267-272]. This
phenomenon is called partial charging. Experimental and theoretical studies conducted by Dey et
al. [262], Pui et al. [267], Li et al. [268], Liu and Pui [273] showed that Fuchs theory successfully
predicted the charging probability of ultrafine particles. However, the scientific literature does not
provide experimental data or numerical modeling related to the collection of nanoparticles in EHD
dominated flow associated with high ion concentration and strong electric field.
In this chapter, we analyze particle transmission in the primary needle-to-tube EHD flow. The
flow is studied experimentally and by numerical simulations to obtain the spatiotemporal
characteristics of ion concentration, velocity, and electric field. Particles are aspirated by the
corona discharge-driven flow, charged due to their collision with ions, and are collected onto the
ground electrode. Nanoparticle transmission efficiency is determined experimentally at various
corona voltages for ambient and NaCl particles showing low transmission (high collection)
efficiency for particles below 20 nm. The experimental data suggest that the particles smaller than
20 nm can attain and hold a unit charge in the vicinity of the ionization region of the corona-
induced EHD flow, leading to their increased collection. A novel particle collector based on the
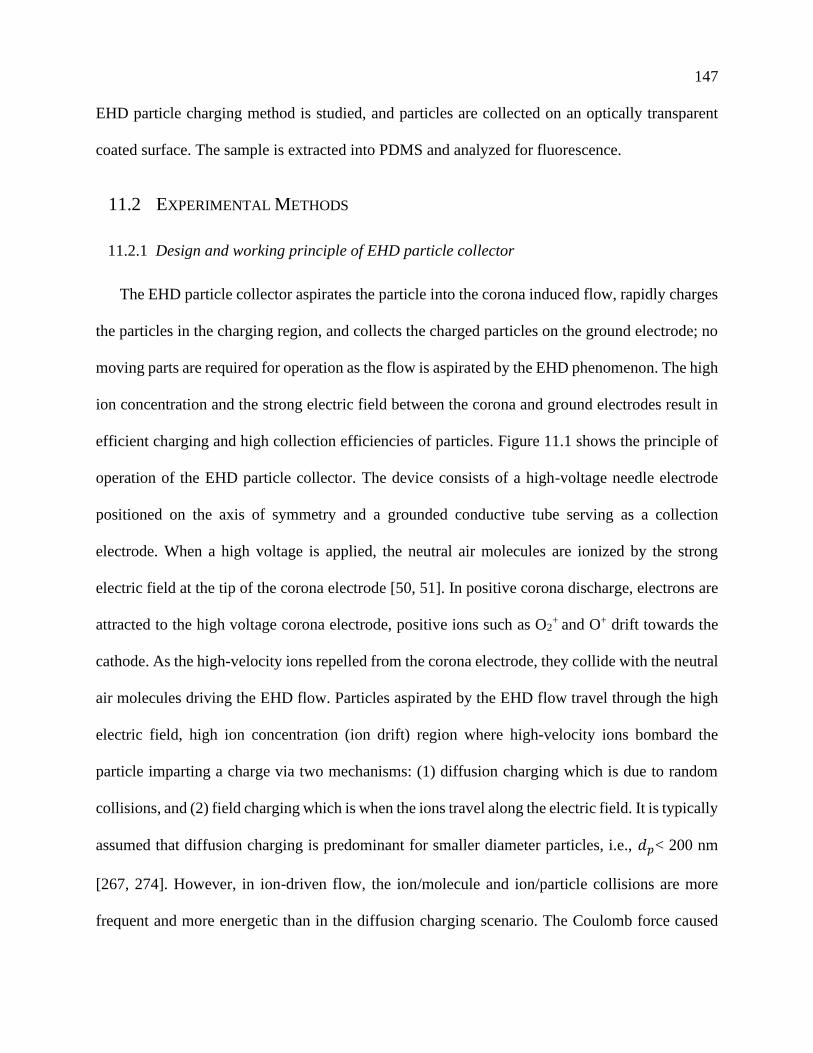
147
EHD particle charging method is studied, and particles are collected on an optically transparent
coated surface. The sample is extracted into PDMS and analyzed for fluorescence.
11.2 EXPERIMENTAL METHODS
11.2.1 Design and working principle of EHD particle collector
The EHD particle collector aspirates the particle into the corona induced flow, rapidly charges
the particles in the charging region, and collects the charged particles on the ground electrode; no
moving parts are required for operation as the flow is aspirated by the EHD phenomenon. The high
ion concentration and the strong electric field between the corona and ground electrodes result in
efficient charging and high collection efficiencies of particles. Figure 11.1 shows the principle of
operation of the EHD particle collector. The device consists of a high-voltage needle electrode
positioned on the axis of symmetry and a grounded conductive tube serving as a collection
electrode. When a high voltage is applied, the neutral air molecules are ionized by the strong
electric field at the tip of the corona electrode [50, 51]. In positive corona discharge, electrons are
attracted to the high voltage corona electrode, positive ions such as O2+ and O+ drift towards the
cathode. As the high-velocity ions repelled from the corona electrode, they collide with the neutral
air molecules driving the EHD flow. Particles aspirated by the EHD flow travel through the high
electric field, high ion concentration (ion drift) region where high-velocity ions bombard the
particle imparting a charge via two mechanisms: (1) diffusion charging which is due to random
collisions, and (2) field charging which is when the ions travel along the electric field. It is typically
assumed that diffusion charging is predominant for smaller diameter particles, i.e., 𝑑𝑝< 200 nm
[267, 274]. However, in ion-driven flow, the ion/molecule and ion/particle collisions are more
frequent and more energetic than in the diffusion charging scenario. The Coulomb force caused
148
by the electric field between the corona electrode and grounded collection substrate forces particles
towards the collection electrode.
The EHD device used in this study consists of a corona needle and a ground collection
electrode, as shown in Figure 11.1. The high voltage needle is a 0.5 mm thick tungsten wire with
a tip curvature of 1 μm (measured using optical microscopy); the sharp tip yields high electric field
strength and results in consistent EHD flow velocity data. As shown in the previous studies [275],
needle sharpness affects the generation of the corona at lower voltages. The corona needle is
regularly inspected for pitting using optical microscopy to ensure the consistent performance of
the device. The ground electrode is an aluminum tube ID 7 mm with a rounded edge, the radius of
curvature is 3 mm, and the tube length is 25 mm. The ground electrode has a rounded edge (radius
of curvature 3 mm) to reduce the local E-field leading to spark-over, thus allowing the operation
over a wider voltage range. The electrode holder is fabricated using 3D printing from Polylactic
Acid material (PLA). The needle is located on the axis of symmetry at a 3 mm distance from the
edge of the ground electrode, see Figure 11.5.
Figure 11.1. Schematic of EHD particle collector in point to tube configuration.
149
11.2.2 Flow field measurements
The flow velocity is important in particle transmission study as it affects the particle residence
time in the charging and the collection regions. Previous reports used an external pump to aspirate
the particles through the corona region, the flow rate can be controlled to achieve maximum
collection efficiency [276, 277]. In the current work, particles are aspirated without the aid of an
external pump and it is important to characterize the velocity generated by the corona discharge
induced flow. A hot-wire anemometer (AN-1005) is used to measure the velocity profile at the
device's outlet. These velocity measurements are also used for calculations of the flow sampling
rate. TSI 1213-20 hot wire probe connected to anemometer is positioned at the outlet of the device.
The anemometer is calibrated for the range of 0.2 m/s – 5 m/s using the standard calibration
procedure. The data from the anemometer is collected at a frequency of 10 kHz with a data
acquisition module (National Instruments, myRIO-1900) for a sampling time of 10 seconds. A
variable high voltage positive power supply (Bertan 205B-20R) is used to create the potential
difference between the needle and the grounded tube. The corona current is measured on the
cathode using a voltage drop across a 1 MΩ resistor, as shown in Figure 11.2(a). The onset of
corona generation was observed at 2 kV; however, the current measurements in the experiments
below 3 kV were not consistent in the day-to-day operations. In this work, the voltage on the needle
is varied from 3 kV to 5 kV. For corona voltage above ~6 kV, spark over events occurred. All
experiments were performed in ambient air at temperatures of 22 C – 25 C, relative humidity range
of 30% – 35%, and pressure of 1 atm.
150
11.2.3 Test particles and their preparation
The transmission efficiency of the device is determined for two particle types (i) ambient
particles from a typical laboratory environment, the particle chemical composition or their origin
are not known, and (ii) NaCl particles generated in the well-mixed aerosol chamber [278, 279].
Both particle types have been previously used in electrostatic particle studies as test particles [11,
25, 260, 261].We estimated that the particles exceed their saturation charge due to the high charge
density environment as they travel through the charging region (as shown in Figure 11.7), and a
charge neutralizer is not used. A particle sizer (TSI SMPS 3910) is used to monitor the particle
concentration. For ambient particles, their number concentration upstream was typically 3×10³
count/cc with a median diameter of 45 nm. Previous reports have indicated that non-equilibrium
low-temperature plasma generates small particles with a diameter less than 20 nm [265, 266]. . We
have performed a series of experiments to determine the particles that are generated from corona
discharge. The particle concentration spikes 10% and 5% for 10 nm and 20 nm particles,
respectively. The concentration has dropped to the baseline level after 10 seconds, indicating that
only a short burst of particles was produced at the onset of corona discharge, as shown in Figure
11.3. The background particles would not change the transmission efficiency results as the particle
concentration reaches saturation.
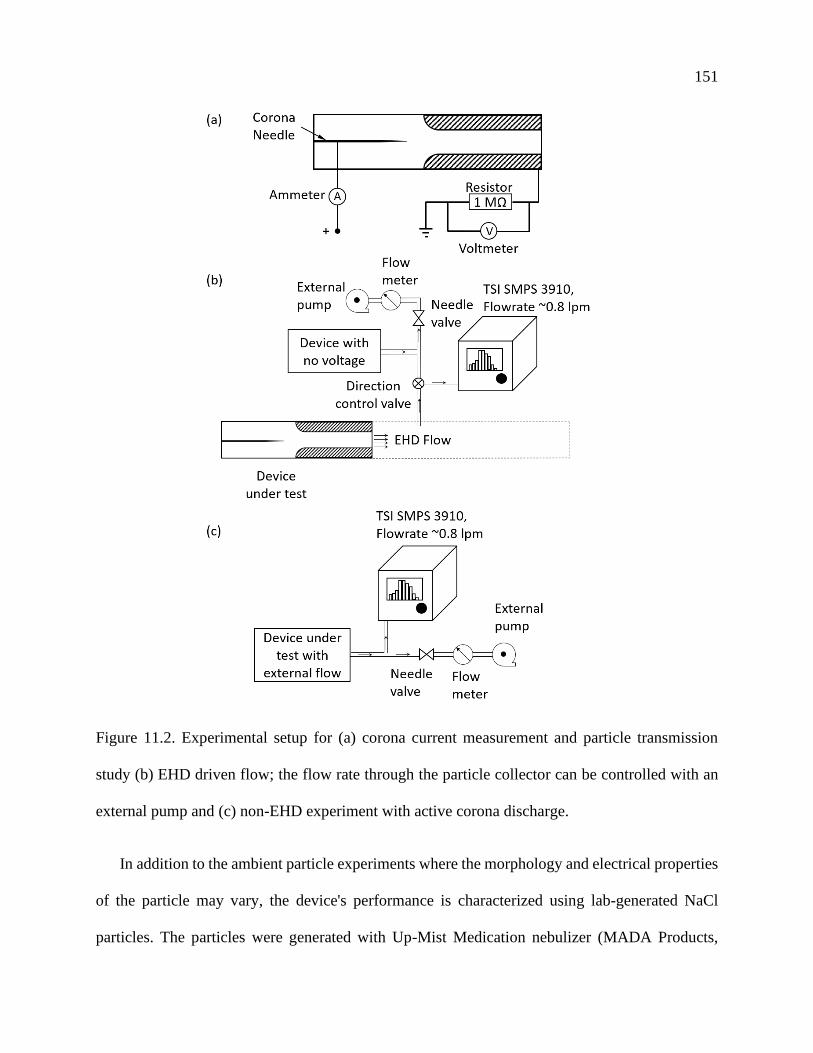
151
Figure 11.2. Experimental setup for (a) corona current measurement and particle transmission
study (b) EHD driven flow; the flow rate through the particle collector can be controlled with an
external pump and (c) non-EHD experiment with active corona discharge.
In addition to the ambient particle experiments where the morphology and electrical properties
of the particle may vary, the device's performance is characterized using lab-generated NaCl
particles. The particles were generated with Up-Mist Medication nebulizer (MADA Products,
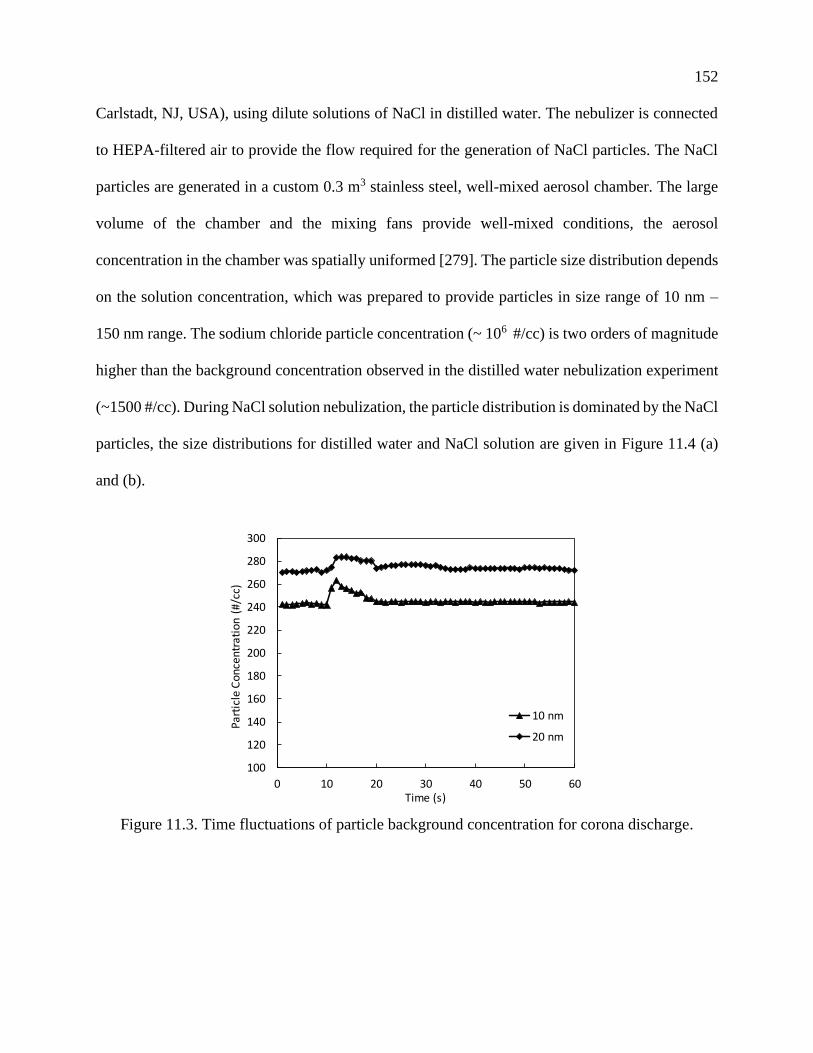
152
Carlstadt, NJ, USA), using dilute solutions of NaCl in distilled water. The nebulizer is connected
to HEPA-filtered air to provide the flow required for the generation of NaCl particles. The NaCl
particles are generated in a custom 0.3 m3 stainless steel, well-mixed aerosol chamber. The large
volume of the chamber and the mixing fans provide well-mixed conditions, the aerosol
concentration in the chamber was spatially uniformed [279]. The particle size distribution depends
on the solution concentration, which was prepared to provide particles in size range of 10 nm –
150 nm range. The sodium chloride particle concentration (~ 106 #/cc) is two orders of magnitude
higher than the background concentration observed in the distilled water nebulization experiment
(~1500 #/cc). During NaCl solution nebulization, the particle distribution is dominated by the NaCl
particles, the size distributions for distilled water and NaCl solution are given in Figure 11.4 (a)
and (b).
Figure 11.3. Time fluctuations of particle background concentration for corona discharge.
100
120
140
160
180
200
220
240
260
280
300
0 10 20 30 40 50 60
Par
ticl
e C
on
cen
trat
ion
(#/
cc)
Time (s)
10 nm
20 nm
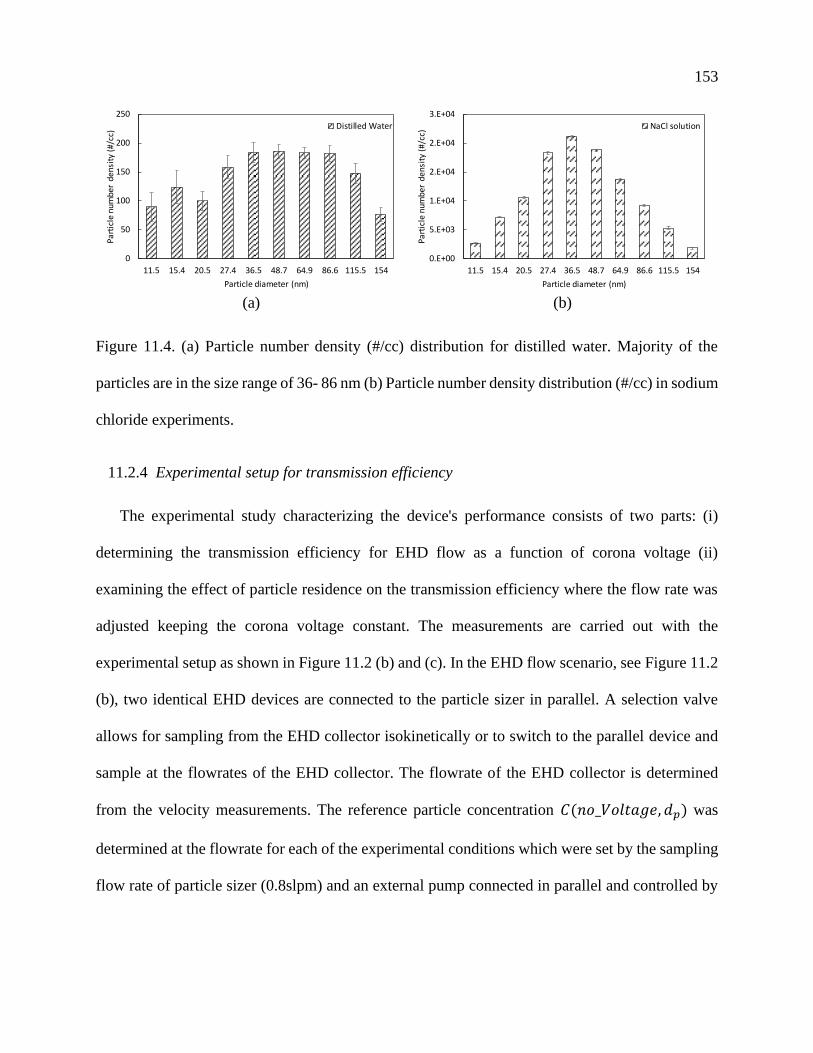
153
(a) (b)
Figure 11.4. (a) Particle number density (#/cc) distribution for distilled water. Majority of the
particles are in the size range of 36- 86 nm (b) Particle number density distribution (#/cc) in sodium
chloride experiments.
11.2.4 Experimental setup for transmission efficiency
The experimental study characterizing the device's performance consists of two parts: (i)
determining the transmission efficiency for EHD flow as a function of corona voltage (ii)
examining the effect of particle residence on the transmission efficiency where the flow rate was
adjusted keeping the corona voltage constant. The measurements are carried out with the
experimental setup as shown in Figure 11.2 (b) and (c). In the EHD flow scenario, see Figure 11.2
(b), two identical EHD devices are connected to the particle sizer in parallel. A selection valve
allows for sampling from the EHD collector isokinetically or to switch to the parallel device and
sample at the flowrates of the EHD collector. The flowrate of the EHD collector is determined
from the velocity measurements. The reference particle concentration 𝐶(𝑛𝑜_𝑉𝑜𝑙𝑡𝑎𝑔𝑒, 𝑑𝑝) was
determined at the flowrate for each of the experimental conditions which were set by the sampling
flow rate of particle sizer (0.8slpm) and an external pump connected in parallel and controlled by
0
50
100
150
200
250
11.5 15.4 20.5 27.4 36.5 48.7 64.9 86.6 115.5 154
Part
icle
num
ber
dens
ity
(#/c
c)
Particle diameter (nm)
Distilled Water
0.E+00
5.E+03
1.E+04
2.E+04
2.E+04
3.E+04
11.5 15.4 20.5 27.4 36.5 48.7 64.9 86.6 115.5 154
Pa
rtic
le n
um
be
r d
en
sity
(#
/cc)
Particle diameter (nm)
NaCl solution
154
a needle valve. The flow rate of the reference flow is measured using a flowmeter (4140 D, TSI,
Shoreview, MN). The flowmeter is calibrated aginst Gilibrator.
To investigate the effect of particle residence on the transmission efficiency, additional flow
control was added to increase or reduce the particle residence time in the ionization and the
collection regions while maintaining an active corona discharge. The device was connected by a
T connector to the ultrafine particle sizer (TSI SMPS 3910) and an external pump with adjustable
flow rate, see Figure 11.2(c). Electrostatic dissipative tubing is used for fluidic connections to
minimize particle losses. Both reference (no electric field) and EHD collector devices have
identical geometries and fluidic connections, see Figure 11.2 (b). A particle sizer (TSI SMPS 3910)
in the single size bin mode is used to measure the particle concentrations. The comparison of
particle number concentration from the experiments with and without corona provides the
transmission efficiency of the device. Similar methodology has been used in previous studies, e.g.,
[247, 280] and it can be described by the expression:
𝜂 =𝐶(𝑉𝑜𝑙𝑡𝑎𝑔𝑒, 𝑑𝑝)
𝐶(𝑛𝑜_𝑉𝑜𝑙𝑡𝑎𝑔𝑒, 𝑑𝑝), (11.1)
where 𝜂 is the transmission efficiency, 𝑑𝑝 is the particle diameter indicating a specific particle size
range, and 𝐶 is the particle concentration in the prescribed size bin. The transmission efficiency
expression is similar to the uncharged ratio as described in previous literature [281, 282]. In the
current study, the data is recorded based on the measurement for individual size bin, instead the
entire size spectrum scan to address temporal fluctuation in the particle concentration and size
distribution in the environment. The sampling time was 60 seconds, and each experiment was
repeated at least three times to obtain statistically relevant particle size data. The ozone
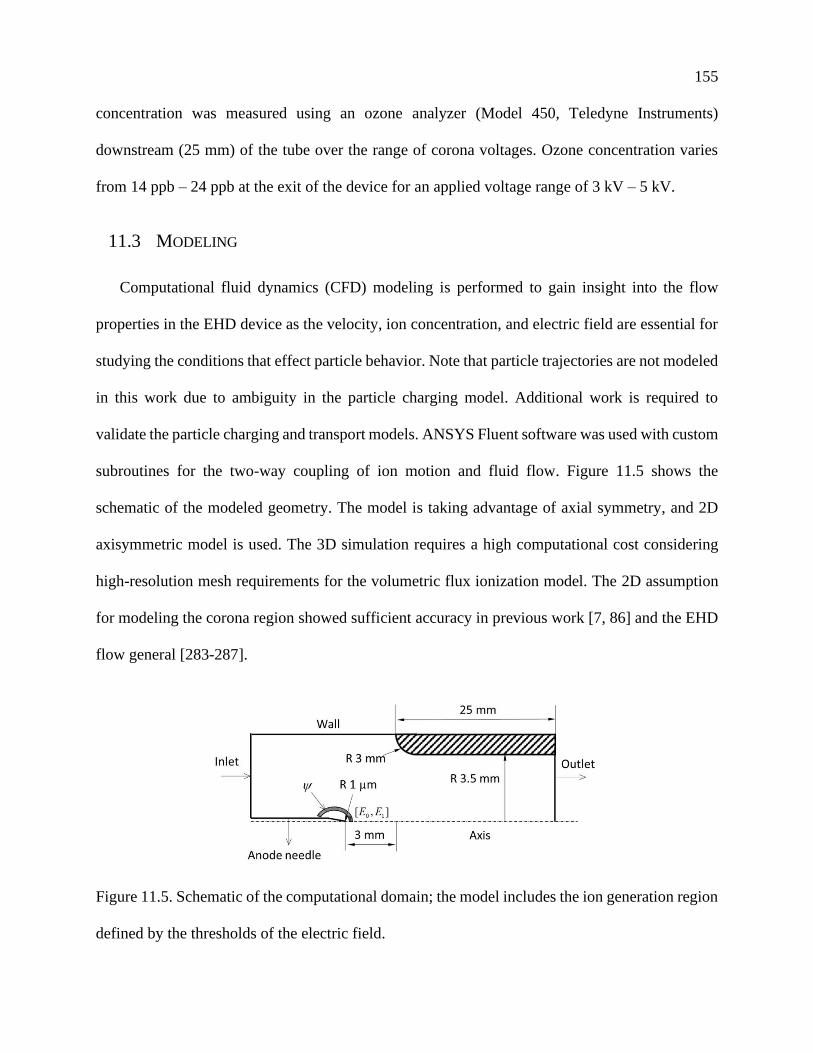
155
concentration was measured using an ozone analyzer (Model 450, Teledyne Instruments)
downstream (25 mm) of the tube over the range of corona voltages. Ozone concentration varies
from 14 ppb – 24 ppb at the exit of the device for an applied voltage range of 3 kV – 5 kV.
11.3 MODELING
Computational fluid dynamics (CFD) modeling is performed to gain insight into the flow
properties in the EHD device as the velocity, ion concentration, and electric field are essential for
studying the conditions that effect particle behavior. Note that particle trajectories are not modeled
in this work due to ambiguity in the particle charging model. Additional work is required to
validate the particle charging and transport models. ANSYS Fluent software was used with custom
subroutines for the two-way coupling of ion motion and fluid flow. Figure 11.5 shows the
schematic of the modeled geometry. The model is taking advantage of axial symmetry, and 2D
axisymmetric model is used. The 3D simulation requires a high computational cost considering
high-resolution mesh requirements for the volumetric flux ionization model. The 2D assumption
for modeling the corona region showed sufficient accuracy in previous work [7, 86] and the EHD
flow general [283-287].
Figure 11.5. Schematic of the computational domain; the model includes the ion generation region
defined by the thresholds of the electric field.
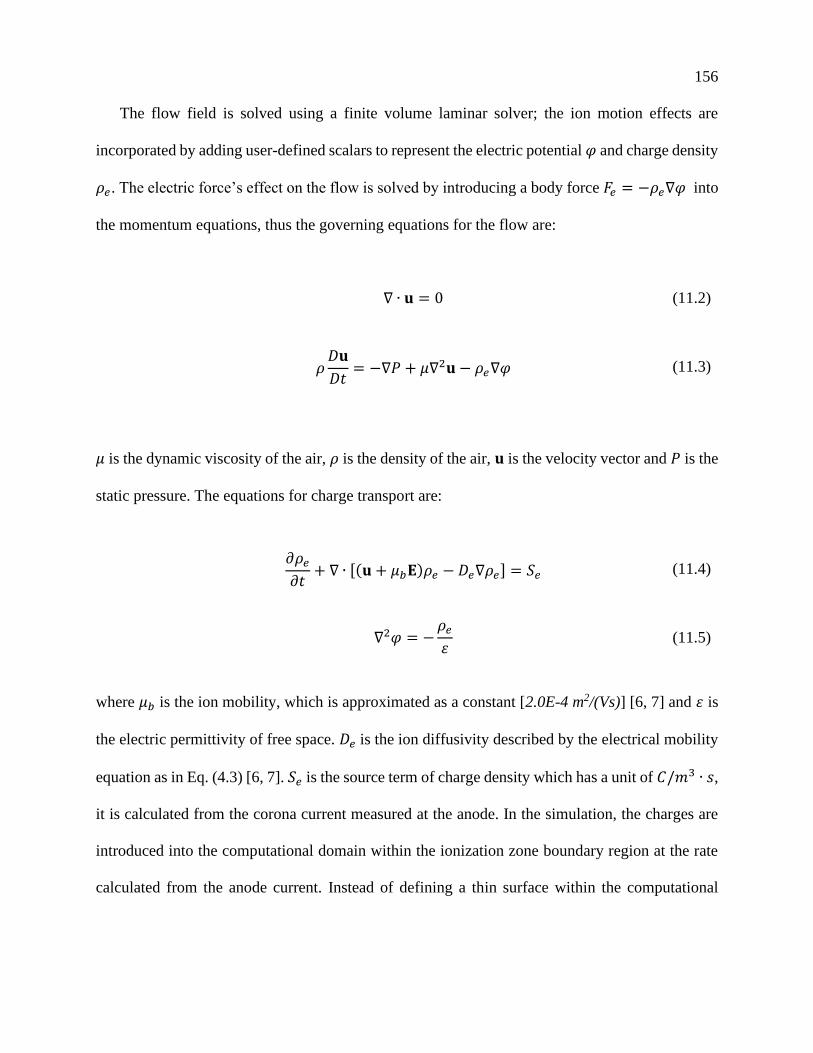
156
The flow field is solved using a finite volume laminar solver; the ion motion effects are
incorporated by adding user-defined scalars to represent the electric potential 𝜑 and charge density
𝜌𝑒. The electric force’s effect on the flow is solved by introducing a body force 𝐹𝑒 = −𝜌𝑒∇𝜑 into
the momentum equations, thus the governing equations for the flow are:
∇ ∙ 𝐮 = 0 (11.2)
𝜌𝐷𝐮
𝐷𝑡= −∇𝑃 + 𝜇∇2𝐮 − 𝜌𝑒∇𝜑 (11.3)
𝜇 is the dynamic viscosity of the air, 𝜌 is the density of the air, 𝐮 is the velocity vector and 𝑃 is the
static pressure. The equations for charge transport are:
𝜕𝜌𝑒
𝜕𝑡+ ∇ ∙ [(𝐮 + 𝜇𝑏𝐄)𝜌𝑒 − 𝐷𝑒∇𝜌𝑒] = 𝑆𝑒 (11.4)
∇2𝜑 = −𝜌𝑒
휀 (11.5)
where 𝜇𝑏 is the ion mobility, which is approximated as a constant [2.0E-4 m2/(Vs)] [6, 7] and 휀 is
the electric permittivity of free space. 𝐷𝑒 is the ion diffusivity described by the electrical mobility
equation as in Eq. (4.3) [6, 7]. 𝑆𝑒 is the source term of charge density which has a unit of 𝐶/𝑚3 ∙ 𝑠,
it is calculated from the corona current measured at the anode. In the simulation, the charges are
introduced into the computational domain within the ionization zone boundary region at the rate
calculated from the anode current. Instead of defining a thin surface within the computational
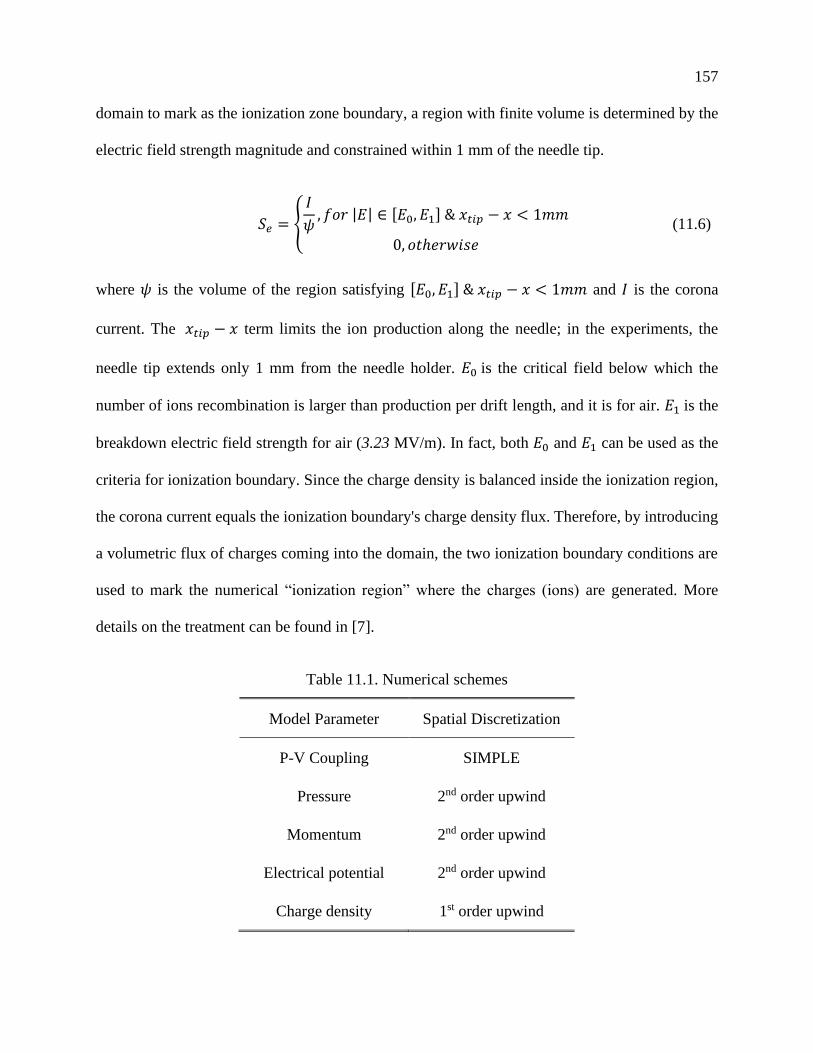
157
domain to mark as the ionization zone boundary, a region with finite volume is determined by the
electric field strength magnitude and constrained within 1 mm of the needle tip.
𝑆𝑒 = {
𝐼
𝜓, 𝑓𝑜𝑟 |𝐸| ∈ [𝐸0, 𝐸1] & 𝑥𝑡𝑖𝑝 − 𝑥 < 1𝑚𝑚
0, 𝑜𝑡ℎ𝑒𝑟𝑤𝑖𝑠𝑒
(11.6)
where 𝜓 is the volume of the region satisfying [𝐸0, 𝐸1] & 𝑥𝑡𝑖𝑝 − 𝑥 < 1𝑚𝑚 and 𝐼 is the corona
current. The 𝑥𝑡𝑖𝑝 − 𝑥 term limits the ion production along the needle; in the experiments, the
needle tip extends only 1 mm from the needle holder. 𝐸0 is the critical field below which the
number of ions recombination is larger than production per drift length, and it is for air. 𝐸1 is the
breakdown electric field strength for air (3.23 MV/m). In fact, both 𝐸0 and 𝐸1 can be used as the
criteria for ionization boundary. Since the charge density is balanced inside the ionization region,
the corona current equals the ionization boundary's charge density flux. Therefore, by introducing
a volumetric flux of charges coming into the domain, the two ionization boundary conditions are
used to mark the numerical “ionization region” where the charges (ions) are generated. More
details on the treatment can be found in [7].
Table 11.1. Numerical schemes
Model Parameter Spatial Discretization
P-V Coupling SIMPLE
Pressure 2nd order upwind
Momentum 2nd order upwind
Electrical potential 2nd order upwind
Charge density 1st order upwind
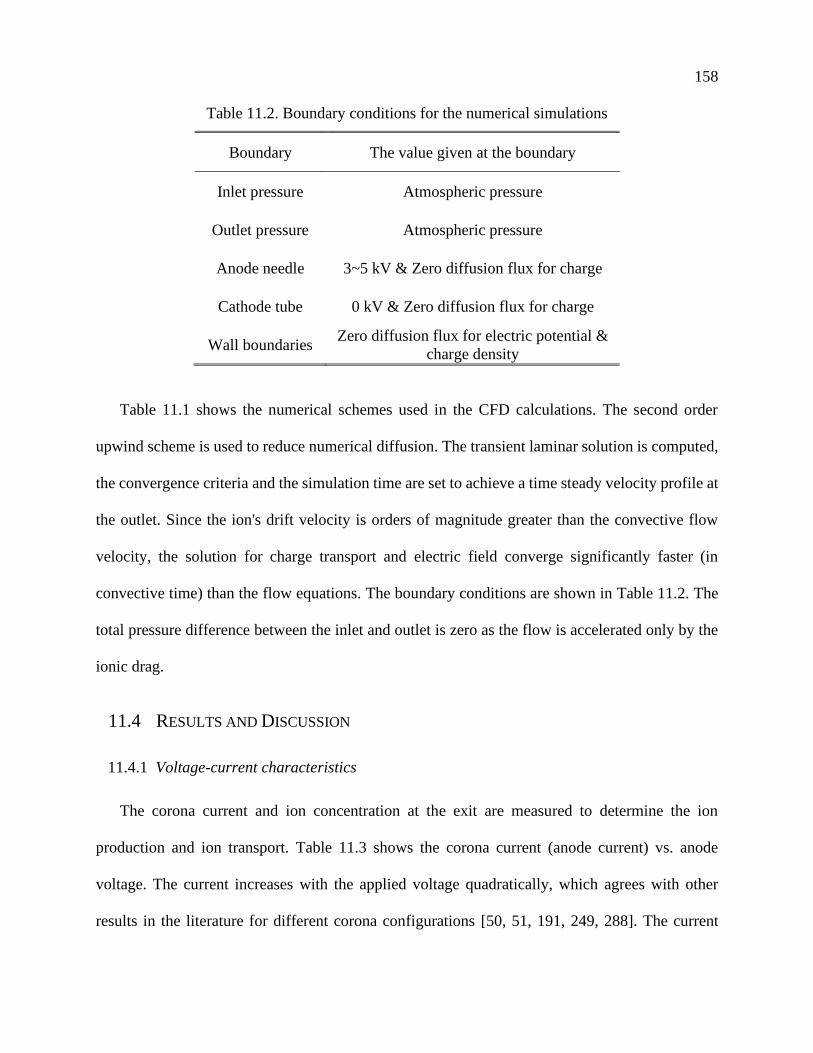
158
Table 11.2. Boundary conditions for the numerical simulations
Boundary The value given at the boundary
Inlet pressure Atmospheric pressure
Outlet pressure Atmospheric pressure
Anode needle 3~5 kV & Zero diffusion flux for charge
Cathode tube 0 kV & Zero diffusion flux for charge
Wall boundaries Zero diffusion flux for electric potential &
charge density
Table 11.1 shows the numerical schemes used in the CFD calculations. The second order
upwind scheme is used to reduce numerical diffusion. The transient laminar solution is computed,
the convergence criteria and the simulation time are set to achieve a time steady velocity profile at
the outlet. Since the ion's drift velocity is orders of magnitude greater than the convective flow
velocity, the solution for charge transport and electric field converge significantly faster (in
convective time) than the flow equations. The boundary conditions are shown in Table 11.2. The
total pressure difference between the inlet and outlet is zero as the flow is accelerated only by the
ionic drag.
11.4 RESULTS AND DISCUSSION
11.4.1 Voltage-current characteristics
The corona current and ion concentration at the exit are measured to determine the ion
production and ion transport. Table 11.3 shows the corona current (anode current) vs. anode
voltage. The current increases with the applied voltage quadratically, which agrees with other
results in the literature for different corona configurations [50, 51, 191, 249, 288]. The current
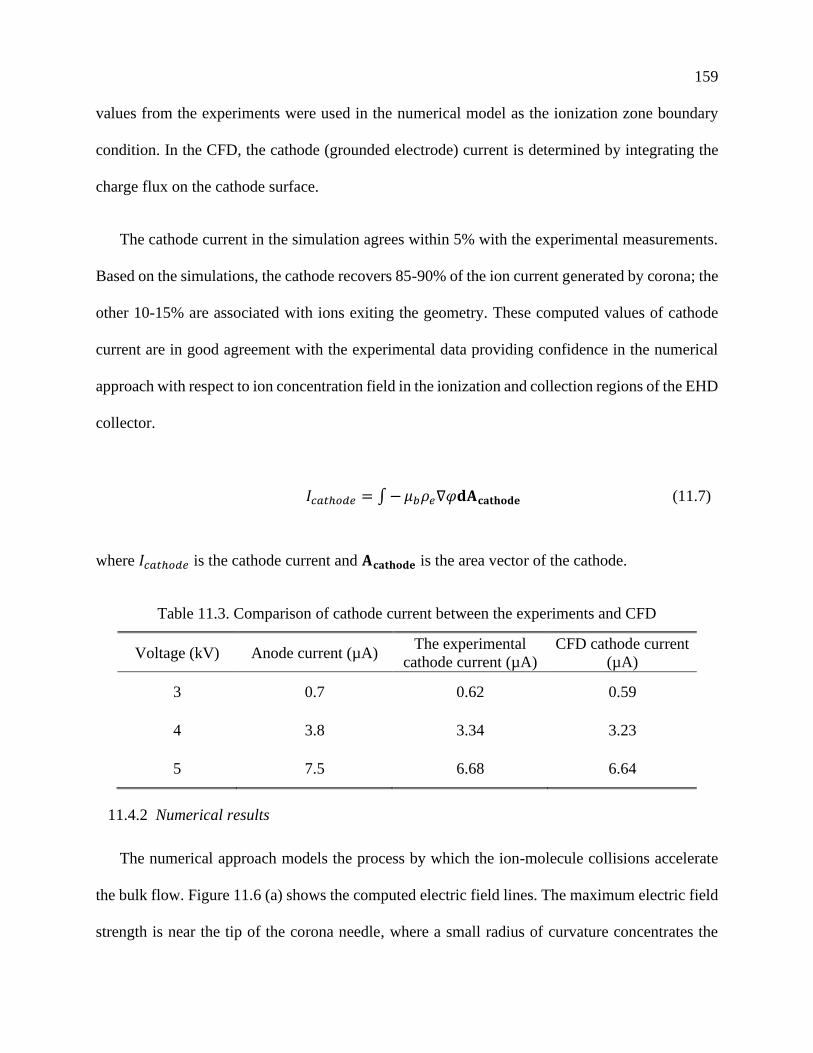
159
values from the experiments were used in the numerical model as the ionization zone boundary
condition. In the CFD, the cathode (grounded electrode) current is determined by integrating the
charge flux on the cathode surface.
The cathode current in the simulation agrees within 5% with the experimental measurements.
Based on the simulations, the cathode recovers 85-90% of the ion current generated by corona; the
other 10-15% are associated with ions exiting the geometry. These computed values of cathode
current are in good agreement with the experimental data providing confidence in the numerical
approach with respect to ion concentration field in the ionization and collection regions of the EHD
collector.
𝐼𝑐𝑎𝑡ℎ𝑜𝑑𝑒 = ∫ − 𝜇𝑏𝜌𝑒∇𝜑𝐝𝐀𝐜𝐚𝐭𝐡𝐨𝐝𝐞 (11.7)
where 𝐼𝑐𝑎𝑡ℎ𝑜𝑑𝑒 is the cathode current and 𝐀𝐜𝐚𝐭𝐡𝐨𝐝𝐞 is the area vector of the cathode.
Table 11.3. Comparison of cathode current between the experiments and CFD
Voltage (kV) Anode current (µA) The experimental
cathode current (µA)
CFD cathode current
(µA)
3 0.7 0.62 0.59
4 3.8 3.34 3.23
5 7.5 6.68 6.64
11.4.2 Numerical results
The numerical approach models the process by which the ion-molecule collisions accelerate
the bulk flow. Figure 11.6 (a) shows the computed electric field lines. The maximum electric field
strength is near the tip of the corona needle, where a small radius of curvature concentrates the
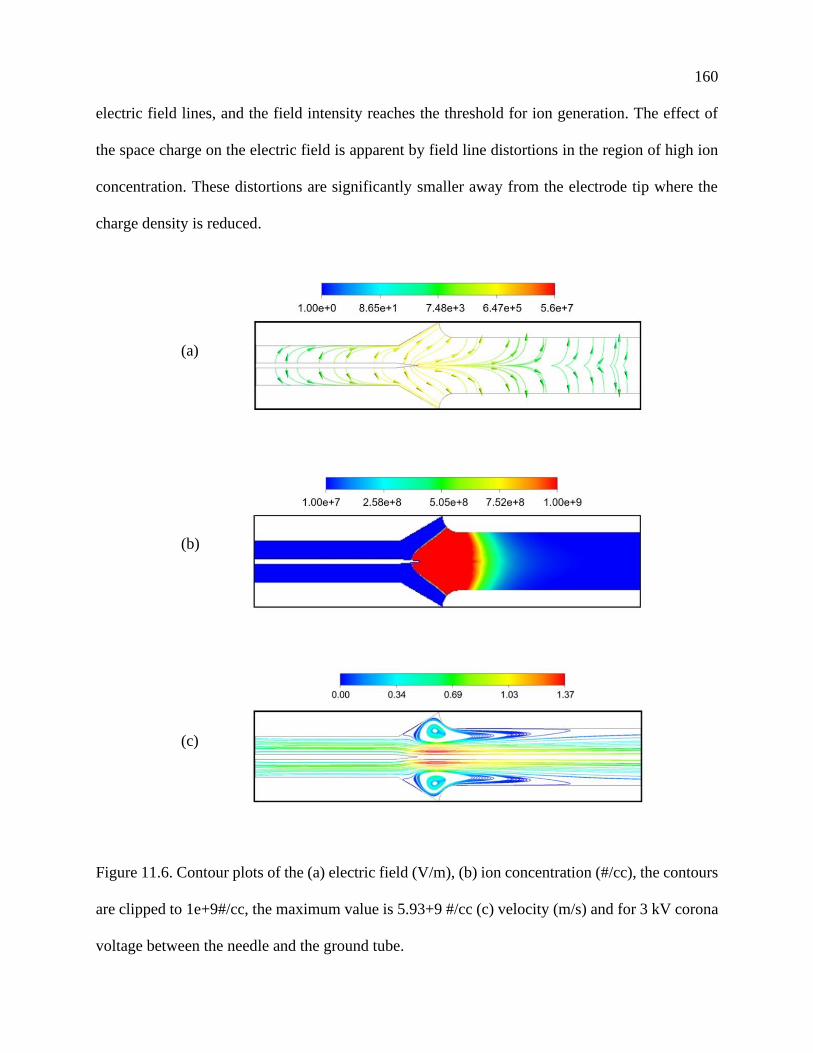
160
electric field lines, and the field intensity reaches the threshold for ion generation. The effect of
the space charge on the electric field is apparent by field line distortions in the region of high ion
concentration. These distortions are significantly smaller away from the electrode tip where the
charge density is reduced.
(a)
(b)
(c)
Figure 11.6. Contour plots of the (a) electric field (V/m), (b) ion concentration (#/cc), the contours
are clipped to 1e+9#/cc, the maximum value is 5.93+9 #/cc (c) velocity (m/s) and for 3 kV corona
voltage between the needle and the ground tube.
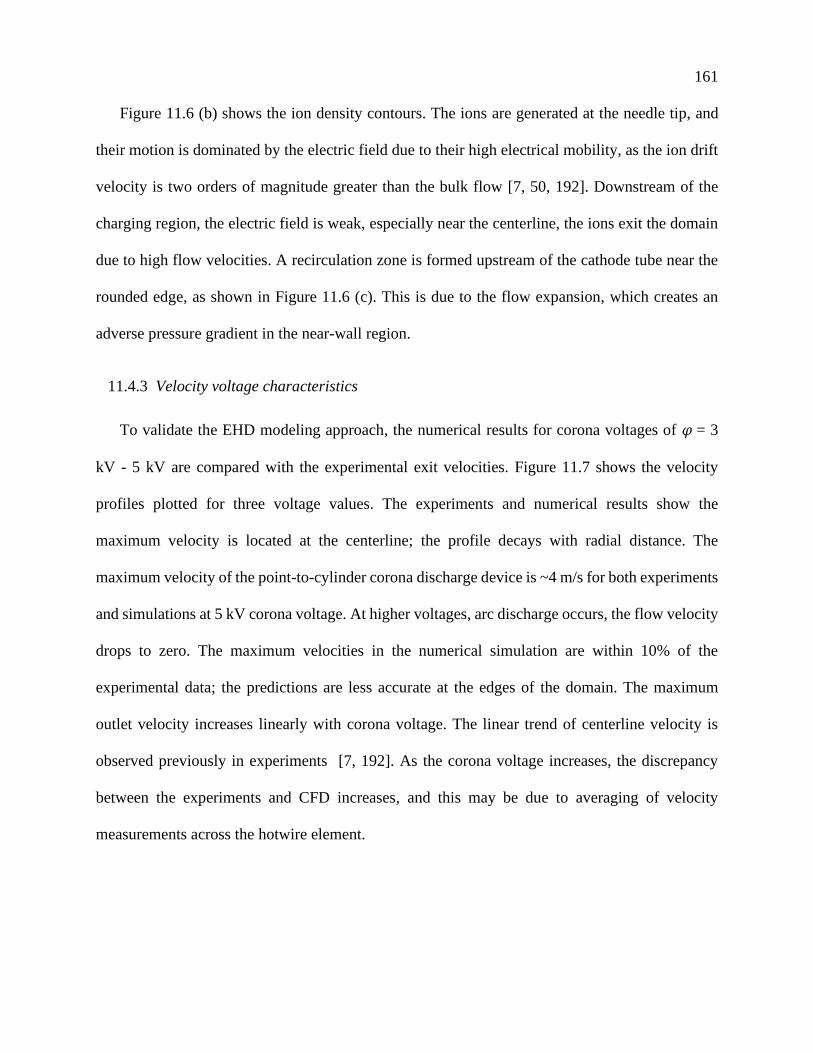
161
Figure 11.6 (b) shows the ion density contours. The ions are generated at the needle tip, and
their motion is dominated by the electric field due to their high electrical mobility, as the ion drift
velocity is two orders of magnitude greater than the bulk flow [7, 50, 192]. Downstream of the
charging region, the electric field is weak, especially near the centerline, the ions exit the domain
due to high flow velocities. A recirculation zone is formed upstream of the cathode tube near the
rounded edge, as shown in Figure 11.6 (c). This is due to the flow expansion, which creates an
adverse pressure gradient in the near-wall region.
11.4.3 Velocity voltage characteristics
To validate the EHD modeling approach, the numerical results for corona voltages of 𝜑 = 3
kV - 5 kV are compared with the experimental exit velocities. Figure 11.7 shows the velocity
profiles plotted for three voltage values. The experiments and numerical results show the
maximum velocity is located at the centerline; the profile decays with radial distance. The
maximum velocity of the point-to-cylinder corona discharge device is ~4 m/s for both experiments
and simulations at 5 kV corona voltage. At higher voltages, arc discharge occurs, the flow velocity
drops to zero. The maximum velocities in the numerical simulation are within 10% of the
experimental data; the predictions are less accurate at the edges of the domain. The maximum
outlet velocity increases linearly with corona voltage. The linear trend of centerline velocity is
observed previously in experiments [7, 192]. As the corona voltage increases, the discrepancy
between the experiments and CFD increases, and this may be due to averaging of velocity
measurements across the hotwire element.
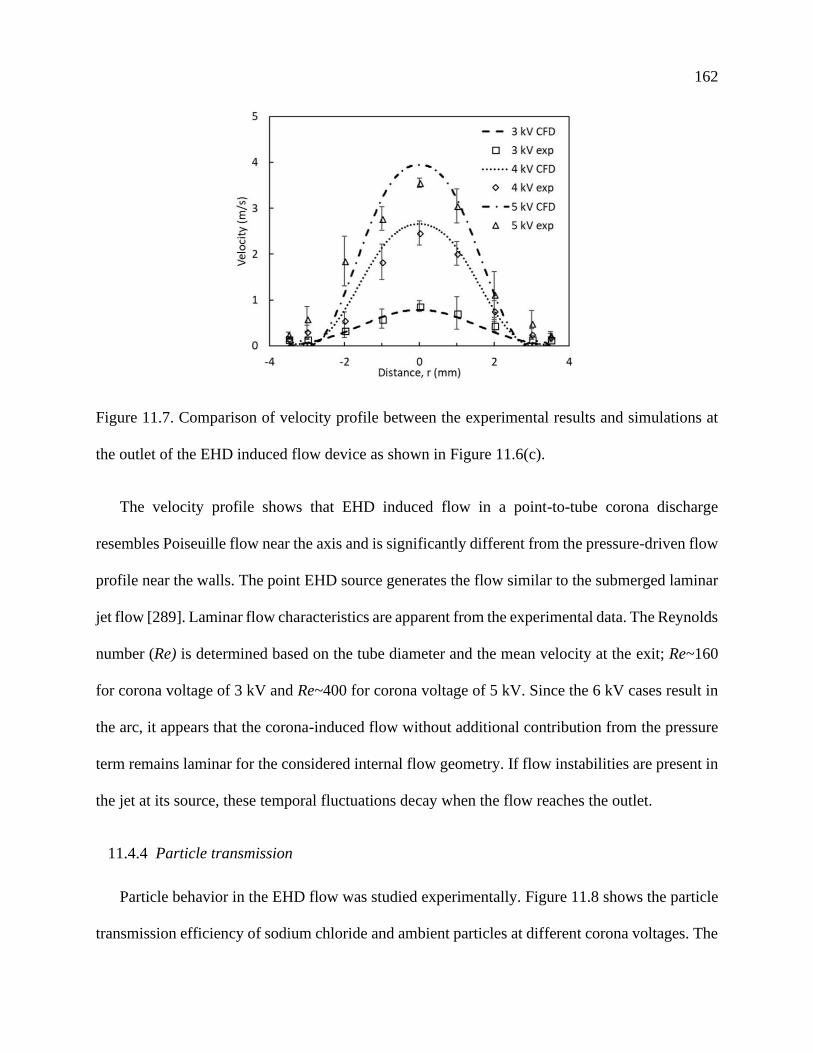
162
Figure 11.7. Comparison of velocity profile between the experimental results and simulations at
the outlet of the EHD induced flow device as shown in Figure 11.6(c).
The velocity profile shows that EHD induced flow in a point-to-tube corona discharge
resembles Poiseuille flow near the axis and is significantly different from the pressure-driven flow
profile near the walls. The point EHD source generates the flow similar to the submerged laminar
jet flow [289]. Laminar flow characteristics are apparent from the experimental data. The Reynolds
number (Re) is determined based on the tube diameter and the mean velocity at the exit; Re~160
for corona voltage of 3 kV and Re~400 for corona voltage of 5 kV. Since the 6 kV cases result in
the arc, it appears that the corona-induced flow without additional contribution from the pressure
term remains laminar for the considered internal flow geometry. If flow instabilities are present in
the jet at its source, these temporal fluctuations decay when the flow reaches the outlet.
11.4.4 Particle transmission
Particle behavior in the EHD flow was studied experimentally. Figure 11.8 shows the particle
transmission efficiency of sodium chloride and ambient particles at different corona voltages. The
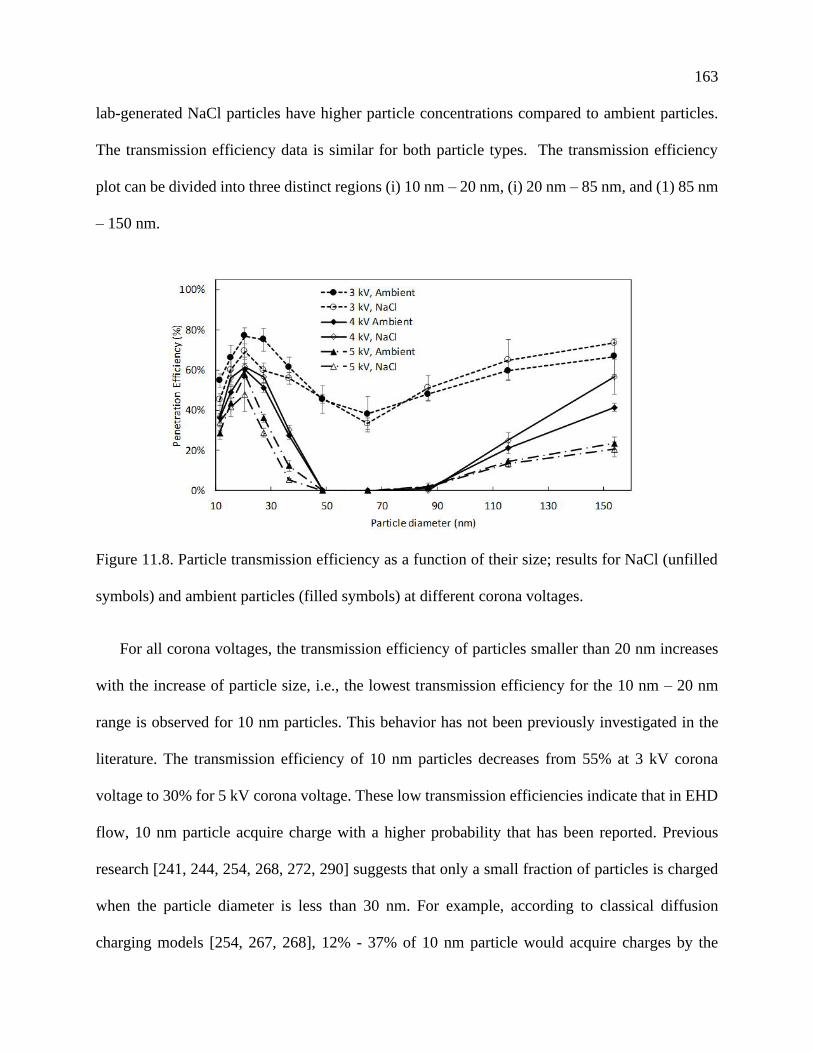
163
lab-generated NaCl particles have higher particle concentrations compared to ambient particles.
The transmission efficiency data is similar for both particle types. The transmission efficiency
plot can be divided into three distinct regions (i) 10 nm – 20 nm, (i) 20 nm – 85 nm, and (1) 85 nm
– 150 nm.
Figure 11.8. Particle transmission efficiency as a function of their size; results for NaCl (unfilled
symbols) and ambient particles (filled symbols) at different corona voltages.
For all corona voltages, the transmission efficiency of particles smaller than 20 nm increases
with the increase of particle size, i.e., the lowest transmission efficiency for the 10 nm – 20 nm
range is observed for 10 nm particles. This behavior has not been previously investigated in the
literature. The transmission efficiency of 10 nm particles decreases from 55% at 3 kV corona
voltage to 30% for 5 kV corona voltage. These low transmission efficiencies indicate that in EHD
flow, 10 nm particle acquire charge with a higher probability that has been reported. Previous
research [241, 244, 254, 268, 272, 290] suggests that only a small fraction of particles is charged
when the particle diameter is less than 30 nm. For example, according to classical diffusion
charging models [254, 267, 268], 12% - 37% of 10 nm particle would acquire charges by the
164
thermal ions, and the contribution of the field charging is negligible for this particle size. In our
experiments, 45% - 70% of 10 nm particles were collected thus acquired at least one charge when
passed through the charging region of the EHD driven flow. As the corona voltage increases, the
ion concentration and the ion mobility (ion velocity) increases, leading to more frequent and more
energetic collisions with the particles. With respect to the increasing transmission efficiency in the
10 nm – 20 nm size range, the previous studies show that it is unlikely for these smaller particles
to receive and hold multiple charges [242, 267, 272] independent of particle type. As the particle
size increases from 10 nm – 20 nm, their electrical mobility decreases resulting in higher
transmission efficiency. Similar trends have been observed in our experiments from 10 nm – 20
nm between NaCl and ambient particles for the range of applied voltages.
The particle size range of 20 nm – 85 nm exhibits a more traditional behavior; as the particle
size increases, the transmission efficiency decreases, due to the ability of the particles to carry
multiple charges [244, 267, 268, 281, 282] resulting in the higher electrical mobility thus, the lower
transmission efficiency. Here the electrical mobility increases faster than the inertial and the drag
forces governing the particle motion. For particles greater than 85 nm, the transmission efficiency
increases with the increase of their diameter. The drag and inertial forces on the particle increase
resulting in the decrease in the migration velocity even though particles attain multiple charges.
This trend is consistent with the previous research showing that for polydisperse particles, the
transmission efficiency reaches a minimum and then increases for larger particles [244, 262, 268,
272]. However, one of the key findings presented in the current work is the different the ratio of
charged to uncharged particle in 10 nm – 20 nm region. We demonstrate that for 10 nm – 20 nm
particles, the ratio is approaching unity, as all particles are collected in the presence of repelling
electrode; thus, all particles must possess one or more charges. At this time, we do not have a way
165
to quantify the number of charges as a function of particle size, particle morphology or chemical
composition.
The particle-laden flow passes through the charging region where both ion concentration and
electrical field are high resulting in the high collision frequency between the ions and the particle
in the flow. The collisions with high-energy ions result in high particle charging efficiency and
lower particle transmission. The highest charging rate is at the tip of the electrode as the ion
concentration (2.44E+11 #/cc), and electric field strength (7.49E+07 V/m) are the highest. The
maximum ion concentration and electric field strength for different corona voltages are given in
Table 11.4. The ion concentration reduces away from the tip due to radial ion motion caused by
the ion drift towards the ground electrode and the space charge effect.
Table 11.4. Maximum computed ion concentration and electric field strength in the ionization
zone a function of corona voltages
Voltage (kV) Ion concentration
(#/cc)
Electric field strength
(V/m)
3 5.93 E+09 5.6E+07
4 8.62E+10 6.78E+07
5 2.44E+11 7.49E+07
To summarize, the trends of particle transmission in EHD driven flow is similar to the
previously reported results for particle greater than 20 nm. However, the significantly lower
transmission of 10 nm particles is observed likely due to the efficient charging in the region of
high ion concentration / high electrical field within the corona discharge. Here, we also do not
quantify the exact number of charges on the particle as a function of ion concentration or electrical
field strength; the detailed analytical or empirical model for the dynamic particle charging process
166
in the corona region is not available. The charges acquired on the particle surface may be stripped
from the particle by collision with neutral molecules as the particle travels through the domain into
the region with a less intense E-field with lower charge density.
To gain insight into the particle charging and capture dynamics, a series of experiments and
numerical simulations were performed (i) by varying the particle residence time in the charging
zone and (ii) by varying the particle mobility in the collection zone. The flow rates (thus the
residence times) are controlled by the external pump, as shown in Figure 11.2(a). Though the flow
in these experiments is not driven by EHD, all particles travel through the ion drift region. The
residence time is a function of the bulk flow rate as well as the local flow field effect that is affected
by the addition to the body force generated by the corona discharge. Figure 11.9 shows the results
of the numerical simulations. The baseline case is the EHD driven flow at 5 kV and flow rate of
~2 slpm (U = 0.9 m/s, Re~400) as determined by both CFD and by integrating the experimental
velocity profile. Two additional cases are examined where the flow rates were set to 1 slpm
(U=0.45 m/s, Re~200) and 5 slpm (U=2.25 m/s, Re~ 1000) to investigate the effect of the residence
time. The corona induced flow has a significant effect on the velocity profile. Figure 11.9 (right)
shows flow streamlines colored by the non-dimensional parameter 𝑋 defined as the ratio of
electrostatic force to the inertial force 𝑋 = 𝜌𝑒𝜑 𝜌𝐮2⁄ [7]. As the flow rate increases, the inertial
term contribution acting on the flow and the particles increases as shown by the smaller region of
𝑋 > 1. For the 5 slpm case, this EHD dominated region exists only near the needle tip while for
the lower flowrates all streamlines (thus the particle entering the device) experience 𝑋 > 1
condition.
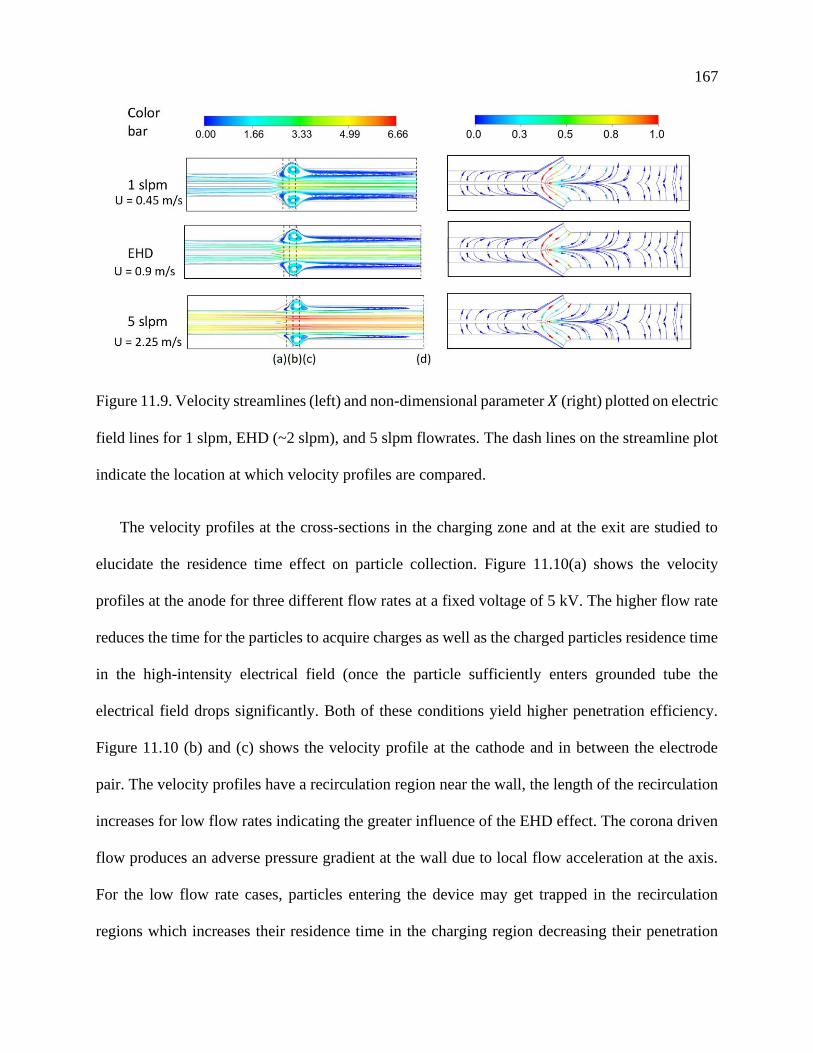
167
Figure 11.9. Velocity streamlines (left) and non-dimensional parameter 𝑋 (right) plotted on electric
field lines for 1 slpm, EHD (~2 slpm), and 5 slpm flowrates. The dash lines on the streamline plot
indicate the location at which velocity profiles are compared.
The velocity profiles at the cross-sections in the charging zone and at the exit are studied to
elucidate the residence time effect on particle collection. Figure 11.10(a) shows the velocity
profiles at the anode for three different flow rates at a fixed voltage of 5 kV. The higher flow rate
reduces the time for the particles to acquire charges as well as the charged particles residence time
in the high-intensity electrical field (once the particle sufficiently enters grounded tube the
electrical field drops significantly. Both of these conditions yield higher penetration efficiency.
Figure 11.10 (b) and (c) shows the velocity profile at the cathode and in between the electrode
pair. The velocity profiles have a recirculation region near the wall, the length of the recirculation
increases for low flow rates indicating the greater influence of the EHD effect. The corona driven
flow produces an adverse pressure gradient at the wall due to local flow acceleration at the axis.
For the low flow rate cases, particles entering the device may get trapped in the recirculation
regions which increases their residence time in the charging region decreasing their penetration
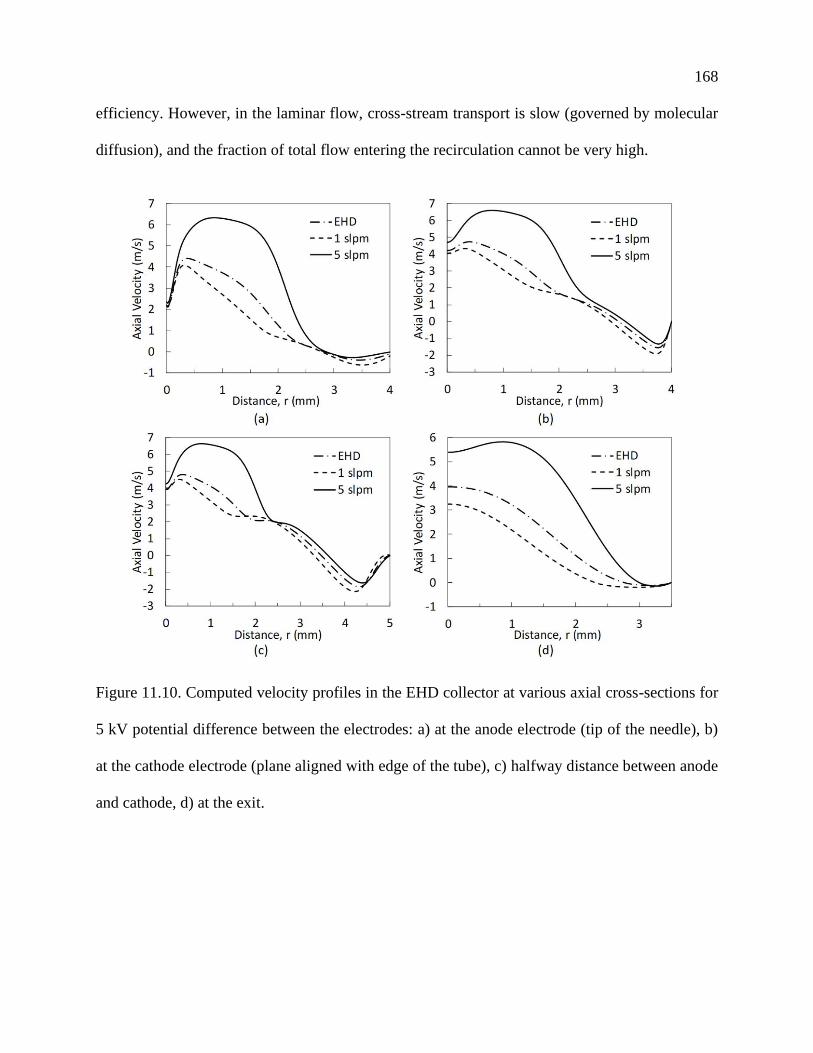
168
efficiency. However, in the laminar flow, cross-stream transport is slow (governed by molecular
diffusion), and the fraction of total flow entering the recirculation cannot be very high.
Figure 11.10. Computed velocity profiles in the EHD collector at various axial cross-sections for
5 kV potential difference between the electrodes: a) at the anode electrode (tip of the needle), b)
at the cathode electrode (plane aligned with edge of the tube), c) halfway distance between anode
and cathode, d) at the exit.
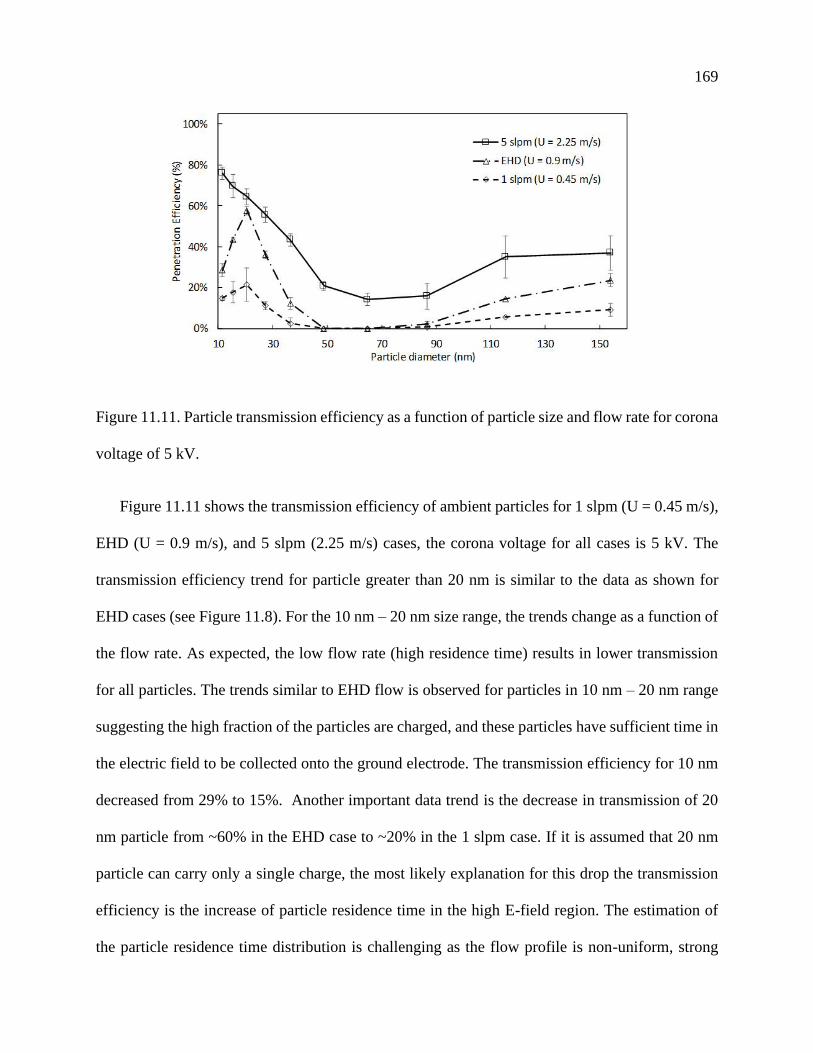
169
Figure 11.11. Particle transmission efficiency as a function of particle size and flow rate for corona
voltage of 5 kV.
Figure 11.11 shows the transmission efficiency of ambient particles for 1 slpm (U = 0.45 m/s),
EHD (U = 0.9 m/s), and 5 slpm (2.25 m/s) cases, the corona voltage for all cases is 5 kV. The
transmission efficiency trend for particle greater than 20 nm is similar to the data as shown for
EHD cases (see Figure 11.8). For the 10 nm – 20 nm size range, the trends change as a function of
the flow rate. As expected, the low flow rate (high residence time) results in lower transmission
for all particles. The trends similar to EHD flow is observed for particles in 10 nm – 20 nm range
suggesting the high fraction of the particles are charged, and these particles have sufficient time in
the electric field to be collected onto the ground electrode. The transmission efficiency for 10 nm
decreased from 29% to 15%. Another important data trend is the decrease in transmission of 20
nm particle from ~60% in the EHD case to ~20% in the 1 slpm case. If it is assumed that 20 nm
particle can carry only a single charge, the most likely explanation for this drop the transmission
efficiency is the increase of particle residence time in the high E-field region. The estimation of
the particle residence time distribution is challenging as the flow profile is non-uniform, strong
170
recirculation patterns exist in the particle charging region due to the local momentum source. The
higher flow rate case is dominated by the pressure-driven flow as indicated by the parameter 𝑋.
As the residence time decreases, the transmission efficiency of 10 nm particle increases from 29%
to 75% and decreases for the sizes up to 85 nm and then increases, which similar to previously
reported results [244, 262, 268, 272, 290].
In the EHD driven case, the flow residence time in the region dominated by EHD (𝑋 > 1) is
~8 ms – 10 ms. As the flow rate increases to 5 slpm, the residence time drops to ~ 2 ms – 3 ms,
and it increases to ~ 17 ms – 20 ms for 1 slpm. The residence time of particle aspirated by the flow
is not calculated due to challenges related to the particle charging models in the EHD driven flow.
However, based on the experimental results, the fraction of 10 nm - 20 nm particles acquiring
charge is as high as 80% for the case with the largest EHD dominated region. The EHD dominated
region is also varying in size, thus, a greater portion of the flow (and the particles) passes through
it at the lower velocity cases.
The particle forcing in the collection region is varied by introducing a repelling electrode along
the axis of symmetry. A voltage of 100 V is applied to the repelling electrode, to increase the
Coulombic force acting on the particle in the region between the repelling electrode and the
collection tube. The applied voltage on the repelling voltage has no effect on the ionization current
(i.e., ion concentration in the charging did not change). Figure 11.12 shows the penetration
efficiency of particles with and without repelling voltage. For all the particles, the penetration
efficiency decreases with the addition of repelling voltage. The transmission efficiency of 10 nm
particles decreases from 28 % to 3 % and for 20 nm particles decreases from 58 % to 3.5 %. Similar
results have been observed in previous reports [11, 247, 277]. These low transmission efficiencies
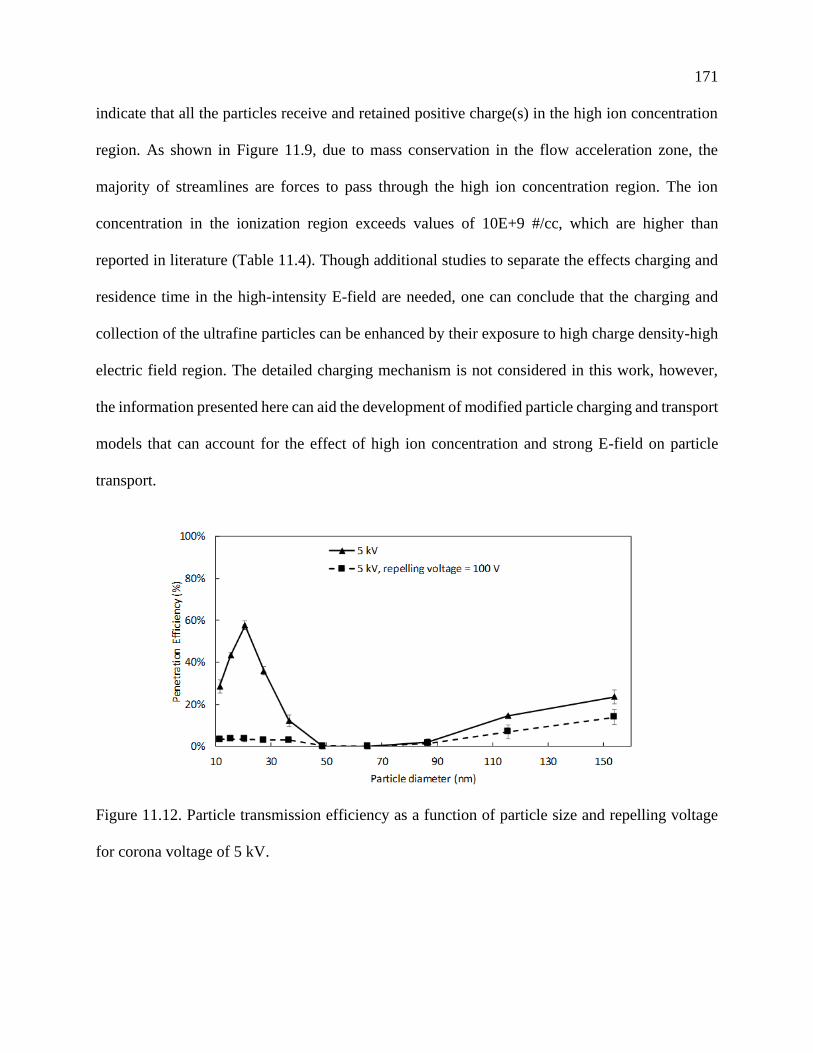
171
indicate that all the particles receive and retained positive charge(s) in the high ion concentration
region. As shown in Figure 11.9, due to mass conservation in the flow acceleration zone, the
majority of streamlines are forces to pass through the high ion concentration region. The ion
concentration in the ionization region exceeds values of 10E+9 #/cc, which are higher than
reported in literature (Table 11.4). Though additional studies to separate the effects charging and
residence time in the high-intensity E-field are needed, one can conclude that the charging and
collection of the ultrafine particles can be enhanced by their exposure to high charge density-high
electric field region. The detailed charging mechanism is not considered in this work, however,
the information presented here can aid the development of modified particle charging and transport
models that can account for the effect of high ion concentration and strong E-field on particle
transport.
Figure 11.12. Particle transmission efficiency as a function of particle size and repelling voltage
for corona voltage of 5 kV.
172
11.5 EXPOSURE MONITOR AND IN-SITU ANALYSIS
Exposure to airborne particulates, such as particulate emissions from combustion and other
manufacturing processes, engineered nanomaterials (ENMs) or endotoxins contained in bacterial
cell walls can trigger or exacerbate asthma or cardiovascular diseases. Several studies [291, 292]
have compared the relative toxicity of size-fractioned particulates from different sources or
locations. Several researchers have reported efforts to develop wearable PM monitors and
collectors [278, 279, 293-295]. The use of filters in the wearable sampler is limited due to high
pump power consumption, large form factors, and cumbersome setup. Electrostatic collectors can
be used to overcome some of these limitations [296]. However, determination of the chemical
composition of particles involves liquid extraction as pre-processing steps, which makes offline
laboratory analysis cumbersome.
Combustion-generated ultrafine particles (UFP) consist of elemental carbon (EC) and organic
carbon (OC). Brown carbon (BrC), characterized by a significant fraction of OC, is a major air
pollution component with known health risks [297] and adverse environmental impacts [298].
Though the severity and mortality of many diseases have been linked to UFP exposure, there is
uncertainty about specific causative agents' influence. Size distributions, particle morphologies,
optical properties, and chemical compositions of these aerosols vary significantly [299, 300]. The
UFP chemical composition determines the potential for biochemical reactions with tissue and cells.
BrC forms from the incomplete combustion of fossil, biomass, and other carbonaceous fuels. More
than 100 polycyclic aromatic hydrocarbons (PAHs) cluster together to form liquid-like particles
[301]. The planar nature and inherent stability of aromatic compounds are linked to the formation
of soot particles [302, 303]. The size of PAHs in young soot has been approximated by molecular
dynamics simulations to be between four rings (Pyrene) and 19 rings (circumcoronene) [304, 305].
173
The PAHs participating in PM formation or components condensed on PM during the secondary
growth [306, 307] can be oxidized in the flame [308, 309]; however, a significant organic fraction
is retained by the particle, especially in the low temperature (incomplete) combustion [310].
Total organic carbon (TOC) is an established method for estimating the PM samples' organic
fraction [311, 312]. Though the organic fraction in BrC contains a variety of complex hydrocarbon
compounds [308, 313], PAHs have been reported to be a major cause of oxidative damage [314-
316]. The United States Environmental Protection Agency (EPA) has established a panel of 16
PAH compounds as priority pollutants representing a range of molecular structures with MW=128
to 278 g/mol. More recent reports [317] suggest that larger PAH molecules have a greater
carcinogenic impact [318]. PAHs are good candidates for analysis by spectroscopic techniques as
they have high absorption coefficients and quantum yields [319]. While fluorescence spectroscopy
is very sensitive (~1 ng/mL) for PAH detection [314-316], by itself, it is not specific.
EEM introduces an orthogonal dimension to the standard fluorescence analysis by scanning
over a range of single-wavelength-excitations and stacking fluorescence emissions at each
excitation wavelength, which provides a three-dimensional (3D) spectral fingerprint. In this 3D
matrix, fluorescence red-shifts for higher molecular weights of OC compounds. This variation
allows to further differentiate the types of compounds in a complex mixture with overlapping
individual spectra. EEM has been previously used for the analysis of combustion PM [320-323].
The challenges of deconvolving the overlapping peaks can be addressed by data-driven techniques
[310, 324]. However, similar to the standard laboratory methods, EEM analysis of aerosol samples
suffers labor-intensive steps involving sample collection on filters, solvent extraction, filtration,
and serial dilutions, which is not amenable for miniaturized sensors. Solid-phase (SP) extraction
174
into transparent media suitable for spectroscopic interrogation can eliminate these steps enabling
in-situ analysis required to develop miniaturized sensors. PDMS provides an attractive option
among solid-phase solvents as it is inert, non-toxic, non-flammable, and optically transparent. As
PDMS has a relatively low fluorescent background, it is well suited for EEM analysis. For
example, liquid phase (LP) -EEM, combined with machine learning for spectra deconvolution, has
been used for source identification [324] and source apportionment of environmental samples
[325].
Collection of particles on an optically clear substrate is advantageous and can use fluorescence
analysis without the extraction of particles. EEM analysis presents an attractive technique among
fluorescence-based methods as the multiple single-wavelength-excitations allow simultaneous
determination of multiple fluorescent components. EEM analysis has been used previously to
analyze fluorophore solutions and for qualitative analysis of organic compound composition in
soot [326-328]. Collection of airborne particles on a filter, their extraction into a solvent like
cyclohexane and fluorescence analysis is time-consuming. Collection on a transparent substrate
followed by solid-phase extraction into the PDMS layer enables in-situ analysis. This section
demonstrates a novel electrostatic precipitator (ESP) to collect particles on an optically transparent
coated surface and is driven by corona discharge-induced flow. The sample is extracted into PDMS
and analyzed for fluorescence. The approach is tested using a laboratory-generated PM, i.e.,
cigarette smoke, the solid phase EEM [329] is compared to the liquid extraction into
cyclohexane[310, 324, 330, 331].
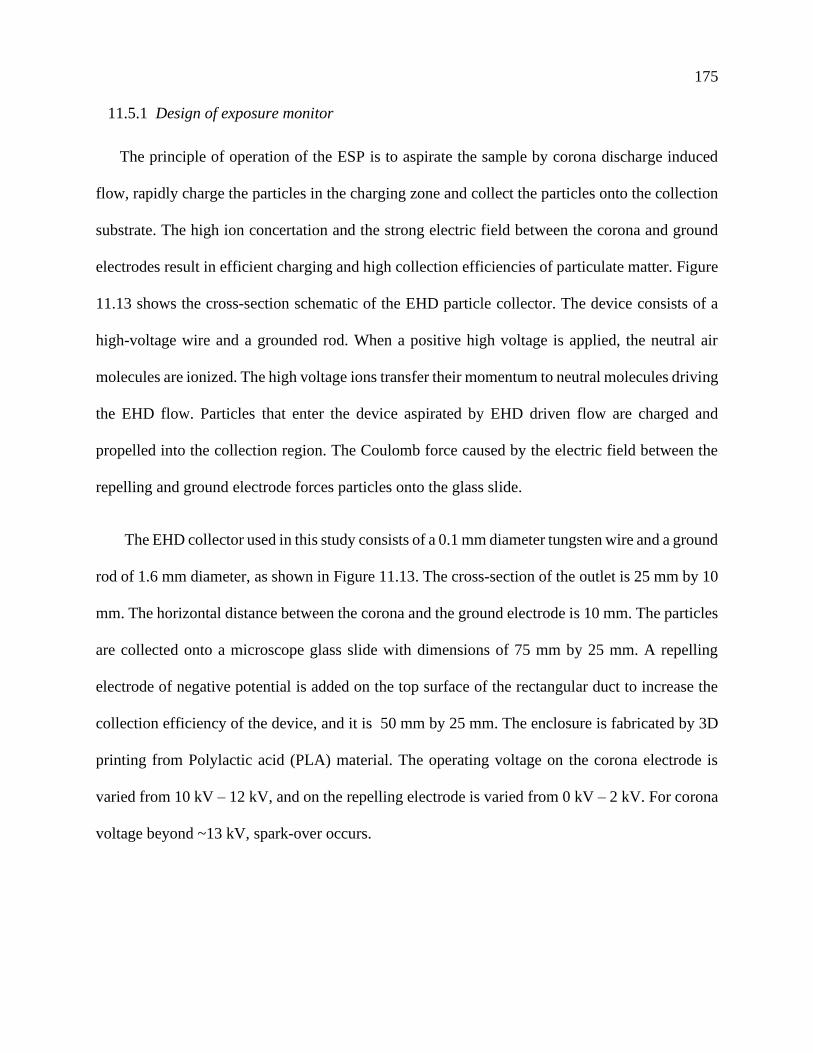
175
11.5.1 Design of exposure monitor
The principle of operation of the ESP is to aspirate the sample by corona discharge induced
flow, rapidly charge the particles in the charging zone and collect the particles onto the collection
substrate. The high ion concertation and the strong electric field between the corona and ground
electrodes result in efficient charging and high collection efficiencies of particulate matter. Figure
11.13 shows the cross-section schematic of the EHD particle collector. The device consists of a
high-voltage wire and a grounded rod. When a positive high voltage is applied, the neutral air
molecules are ionized. The high voltage ions transfer their momentum to neutral molecules driving
the EHD flow. Particles that enter the device aspirated by EHD driven flow are charged and
propelled into the collection region. The Coulomb force caused by the electric field between the
repelling and ground electrode forces particles onto the glass slide.
The EHD collector used in this study consists of a 0.1 mm diameter tungsten wire and a ground
rod of 1.6 mm diameter, as shown in Figure 11.13. The cross-section of the outlet is 25 mm by 10
mm. The horizontal distance between the corona and the ground electrode is 10 mm. The particles
are collected onto a microscope glass slide with dimensions of 75 mm by 25 mm. A repelling
electrode of negative potential is added on the top surface of the rectangular duct to increase the
collection efficiency of the device, and it is 50 mm by 25 mm. The enclosure is fabricated by 3D
printing from Polylactic acid (PLA) material. The operating voltage on the corona electrode is
varied from 10 kV – 12 kV, and on the repelling electrode is varied from 0 kV – 2 kV. For corona
voltage beyond ~13 kV, spark-over occurs.
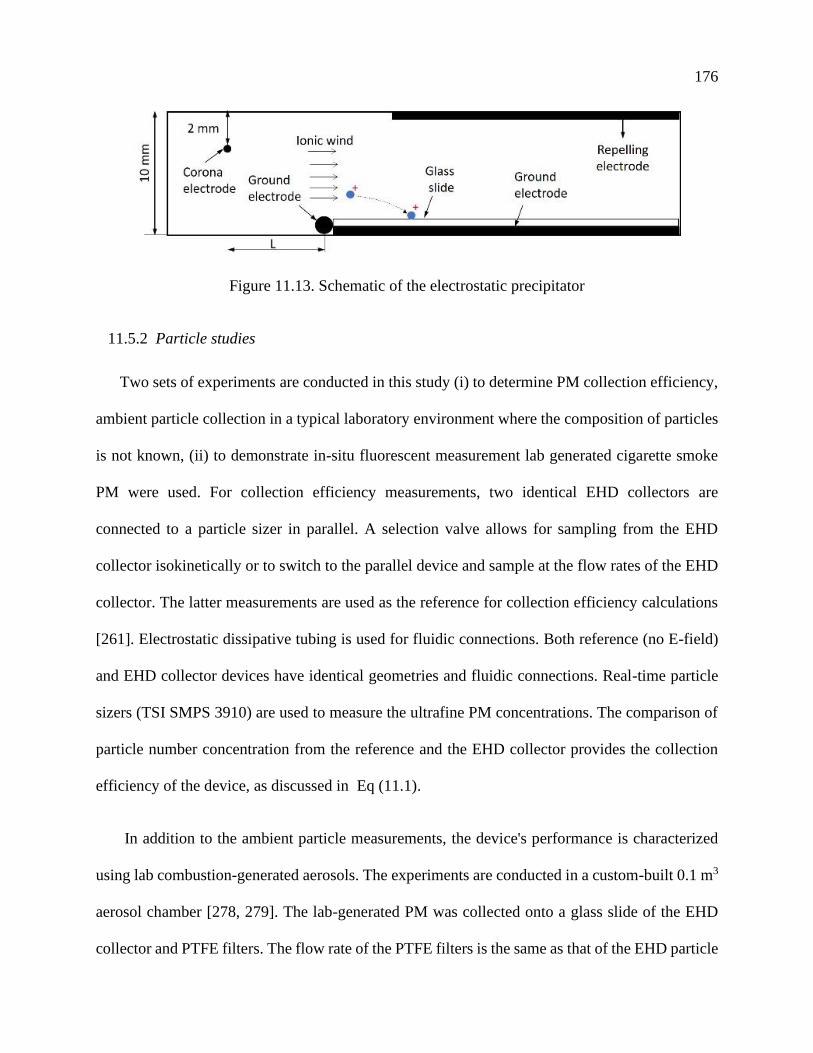
176
Figure 11.13. Schematic of the electrostatic precipitator
11.5.2 Particle studies
Two sets of experiments are conducted in this study (i) to determine PM collection efficiency,
ambient particle collection in a typical laboratory environment where the composition of particles
is not known, (ii) to demonstrate in-situ fluorescent measurement lab generated cigarette smoke
PM were used. For collection efficiency measurements, two identical EHD collectors are
connected to a particle sizer in parallel. A selection valve allows for sampling from the EHD
collector isokinetically or to switch to the parallel device and sample at the flow rates of the EHD
collector. The latter measurements are used as the reference for collection efficiency calculations
[261]. Electrostatic dissipative tubing is used for fluidic connections. Both reference (no E-field)
and EHD collector devices have identical geometries and fluidic connections. Real-time particle
sizers (TSI SMPS 3910) are used to measure the ultrafine PM concentrations. The comparison of
particle number concentration from the reference and the EHD collector provides the collection
efficiency of the device, as discussed in Eq (11.1).
In addition to the ambient particle measurements, the device's performance is characterized
using lab combustion-generated aerosols. The experiments are conducted in a custom-built 0.1 m3
aerosol chamber [278, 279]. The lab-generated PM was collected onto a glass slide of the EHD
collector and PTFE filters. The flow rate of the PTFE filters is the same as that of the EHD particle
177
collector. Sylgard 184 components were mixed in an appropriate weight ratio to obtain
Polydimethylsiloxane (PDMS) solution. After collection, the glass slide was removed from the
device and coated with the PDMS solution. We cured the coating for 24 hours at room temperature.
Extraction of organic compounds into PDMS was allowed for 24 hours. The glass slide was placed
in the custom holder at an angle of 60 degrees to the line of excitation. Collection optics was placed
perpendicular to the excitation light.
EEM data was recorded using a spectrofluorometer (Aqualog-880-C, HORIBA Instruments
Inc. Edison, NJ). Spectra were recorded for excitation wavelength between 200 nm to 600 nm with
2nm increments. For each excitation wavelength, emission was recorded. To account for Rayleigh
scattering, the EEM of blank glass was subtracted. The remaining Rayleigh and Raman scattering
peaks were removed using in-house software. The filter sample was extracted into cyclohexane to
provide reference measurement. A comparison of liquid-phase extraction EEM (LP-EEM) and
solid-phase EEM (SP-EEM) is presented.
11.5.3 Results and discussion
Particle behavior in the EHD flow was studied experimentally at 12 kV potential applied
between the electrodes. The flow rate induced by corona discharge at these voltage conditions is
16.01 ± 0.37 slpm. Figure 11.14 shows the collection efficiency of ambient particles at a fixed
corona voltage and different repelling voltages. The collection efficiency plot can be divided into
two regions i) 10 nm – 50 nm, ii) 50 nm – 150 nm. The collection efficiency increases from 10 nm
– 50 nm and stays relatively constant up to 150 nm for operation without repelling voltage. As the
particle size increases, the particles can carry multiple charges [262, 268], resulting in higher
electrical mobility. For all the repelling voltages, the collection efficiency increases from 10 nm –
178
50 nm. This behavior has been previously reported in the literature [247]. For example, the
collection efficiency of 10 nm increases from 30% (no repelling voltage) to 90% for 2 kV repelling
voltage. These high collection efficiencies indicate that high ion concentration and high E-field
intensity lead to high charging efficiency for a wide range of particle sizes.
Figure 11.14. Size wise collection efficiency for ambient particles for different repelling voltages.
Lab generated particulate matter (Cigarette smoke) is collected onto the glass slide in the EHD
collector at the optimum operating conditions (12 kV corona voltage and 2 kV repelling voltage)
and PTFE filters. EEM analysis shows that SP-EEM of cigarette smoke is similar to its LP-EEM,
see Figure 11.15. Hence, the fluorescence of combustion-generated PM can be analyzed using
solid-phase extraction. The fluorescence intensity of SP-EEM was greater than in LP-EEM which
likely due to sample dilution in the liquid analysis. The scattering in SP-EEM was greater
compared to LP-EEM for the same concentration, which required additional post-processing using
a custom MatLab algorithm. Also, the PAH extraction efficiency of PDMS is possibly lower
compared to cyclohexane. To address these two issues and increase the sensitivity of SP-EEMs,
further research is needed.
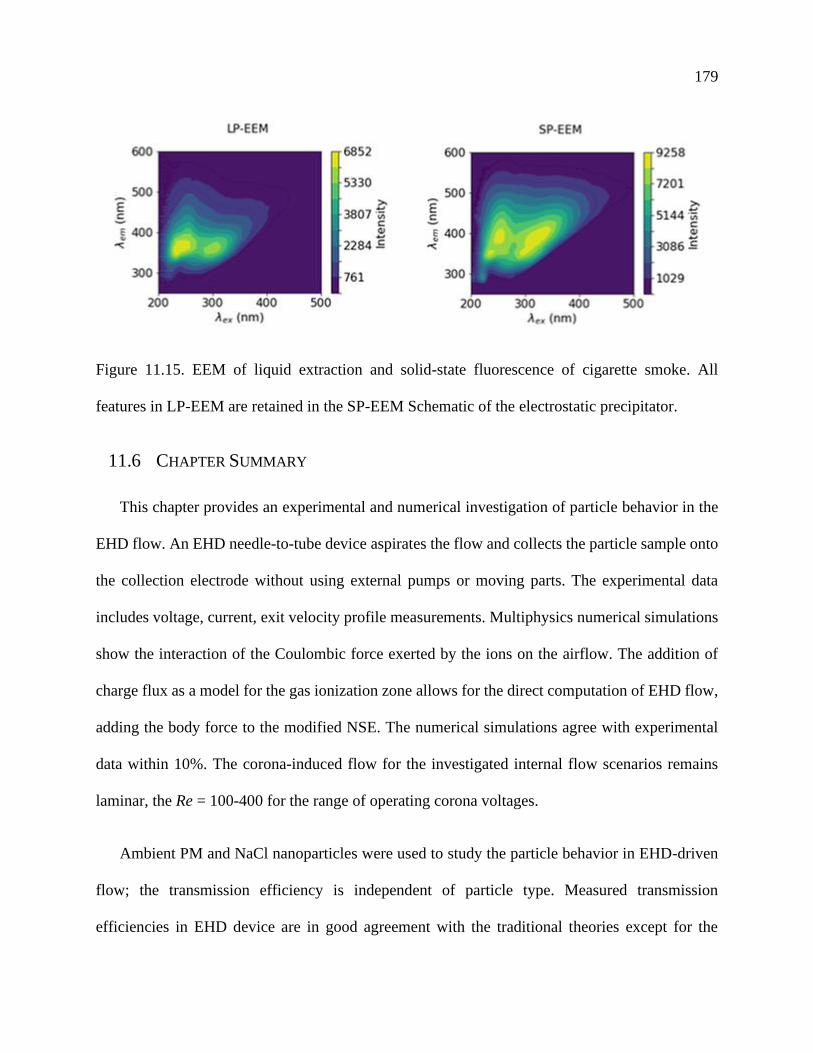
179
Figure 11.15. EEM of liquid extraction and solid-state fluorescence of cigarette smoke. All
features in LP-EEM are retained in the SP-EEM Schematic of the electrostatic precipitator.
11.6 CHAPTER SUMMARY
This chapter provides an experimental and numerical investigation of particle behavior in the
EHD flow. An EHD needle-to-tube device aspirates the flow and collects the particle sample onto
the collection electrode without using external pumps or moving parts. The experimental data
includes voltage, current, exit velocity profile measurements. Multiphysics numerical simulations
show the interaction of the Coulombic force exerted by the ions on the airflow. The addition of
charge flux as a model for the gas ionization zone allows for the direct computation of EHD flow,
adding the body force to the modified NSE. The numerical simulations agree with experimental
data within 10%. The corona-induced flow for the investigated internal flow scenarios remains
laminar, the Re = 100-400 for the range of operating corona voltages.
Ambient PM and NaCl nanoparticles were used to study the particle behavior in EHD-driven
flow; the transmission efficiency is independent of particle type. Measured transmission
efficiencies in EHD device are in good agreement with the traditional theories except for the
180
particles in the 10 nm – 20 nm range. The particle transmission for flow for EHD driven flow is
significantly lower. The transmission efficiency for smaller particles is lower than reported by
previous research, likely due to the high fraction of 10 nm - 20 nm particles acquiring a unit charge
in the EHD dominated region (X>1). As the particle size increases from 10 nm to 20 nm, their
electrical mobility reduces due to increased particle mass while still possessing only a single
charge. This hypothesis is further tested by varying the particle residence time and particle mobility
in the EHD dominated region. The transmission efficiency drops to 15% – 20% indicating that the
fraction of 10 nm – 20 nm particles with at least one charge is greater than 80% – 85% when the
particle residence time increases. The charging to uncharged particle ratio is approaching unity in
the particle mobility experiments as all the particles are collected in the presence of repelling
electrode; thus, all particles must possess one or more charges. These results suggest the charging
of nanoparticles can be enhanced by their prolonged exposure to ion bombardment in the high
charge density, high electric field region.
An exposure monitor was developed based on corona-driven EHD flow collection for PM. The
collection efficiency of the device is around ~95% for the corona voltage of 12 kV, and repelling
voltage of 2 kV over a broad range of particle sizes indicates that high ion concentration and high
E-field intensity lead to high charging for ultrafine PM. Cigarette smoke is collected onto the glass
slide using the optimized conditions and onto a reference PTFE filter. The fluorescence excitation-
emission matrix is compared between the liquid extract and solid-state fluorescence. SP-EEM is
similar to LP-EEM, enabling sensor development for in-situ analysis of combustion-generated PM.
181
Chapter 12. CONCLUSIONS AND FUTURE WORK
12.1 CONCLUSIONS
This dissertation has furthered the development of plasma actuation for propulsion and control
of aerial vehicles by developing a deeper understanding of the momentum injection by the plasma
actuator. This work also presents methods to improve the momentum and change in aerodynamic
forces due to plasma actuation on NACA 0012 at low angles of attack that can be feasible for
realistic applications.
Initially, an analytical model that couples space charge, electric field, and momentum transfer
is developed in 1D planar coordinates from first principles. The electric current density is
analogous to Mott – Gurney law. The derived (𝜑 − 𝐼) relationship has a similar form as
Townsend’s relation and is in good agreement with the experimental data. The
electrohydrodynamic thrust force is derived from (𝜑 − 𝐼) relationship and a correction factor for
the drag force is introduced for accurate predictions. The model is validated for three independent
experiments and agrees within 10%. This thrust model allows for the prediction of thrust force and
provides a mathematical framework for the interaction between charged species and fluid.
The second accomplishment is a reduced-order model development for discharge current,
current density, and momentum injection utilizing the data from the DBD actuator, i.e., plasma
volume, electrical discharge current, and resulting velocity profile. The discharge current analysis
yielded an expression similar to the derived (𝜑 − 𝐼) relationship. The discharge current is directly
proportional to the momentum injection and power law in the form of 𝑀 = 𝛽𝐾𝑓𝐴𝐶𝛼 (𝜑 − 𝜑0)2 is
obtained. As with DBD actuators, this empirical model can be used to determine the momentum
182
injected by the actuators and the discharge current expression can be used for accurate boundary
conditions in multiphysics modeling of the DBD.
Along with the empirical model for DBD, a new DC augmented dielectric barrier discharge
(DBD – DCA) plasma actuator with increased performance was developed. The thrust force of the
DBD – DCA plasma actuator with negative DCA generates ~2x greater force than standard DBD.
The thrust of the DBD – DCA actuator was increased by introducing various electrode shapes. The
maximum thrust generated by the coarse saw tooth electrode DBD – DCA was 52 mN/m and was
4x more than the standard DBD, 2x more than the linear electrode DBD – DCA. By conducting a
parametric study on DBD – DCA actuator, we gain an understanding of the conditions required
for thrust augmentation.
Finally, the aerodynamic forces on NACA 0012 with the best performing coarse sawtooth
electrode DBD – DCA were calculated at low angles of attack. The plasma actuation has increased
the lift coefficient by 15% and decreased the drag by 50%. These aerodynamic force measurements
allow for calculating forces on aircraft that are crucial for understanding flight control
performance.
The presented thesis provides insight into the plasma actuation for aerial vehicles. The results
assisted in developing new plasma actuators and can be applied for controlling an aerial vehicle
without any moving parts.
12.2 PATH FORWARD
This section proposes future efforts required to bring the plasma actuation technology to a
successful airplane integration; it focuses on both scientific and engineering development.
183
12.2.1 Momentum characterization with free stream
Most of the research conducted in this dissertation has focused on the thrust characterization
of the actuators in quiescent environments. Future research should extend the study in determining
the interaction between the free flow and DBD momentum injection, vortex structures, and the
effect of the third electrode with the free stream velocity.
12.2.2 Improved plasma actuator model
The analytical and semi-empirical models presented in this dissertation provide a step forward
in the plasma actuators modeling and performance characterization. The analytical/semi-empirical
expressions can be incorporated into a commercial CFD package to simulate the plasma actuator
characteristics. The semi-empirical/analytical expressions coupled with CFD can be used to
optimize geometry for improved performance.
12.2.3 Ozone mitigation
Plasma actuators often create ozone as a by-product of the ion generation process in the
atmospheric air. Ozone can be corrosive to some materials, toxic in high concentrations, and
therefore ozone must be mitigated before it leaves the system. Recently ozone mitigation catalysis
methods are proposed, and similar methods can be implemented for plasma actuators.
12.2.4 Acoustic noise characterization
Adaptation of a concept that utilizes the principles of EHD to produce thrust, in conjunction
with low noise electrical power generators for UAV applications, can lead to a substantial
reduction in overall noise. An EHD-propelled UAV offers an attractive alternative to conventional
aircraft propulsion, and the noise reduction should be quantified.
184
12.2.5 Concept plane - plasma actuation
This dissertation has shown the effect of plasma actuators on the aerodynamic coefficients over
a range of wind speeds and AOA for a 2D airfoil section. Based on the 2D tests from the wind
tunnel, a concept plane based on plasma actuation can be developed. Control performance of
plasma actuation has to be determined.
185
BIBLIOGRAPHY
[1] E. Moreau, "Airflow control by non-thermal plasma actuators," Journal of physics D: applied physics, vol. 40, no. 3, p. 605, 2007.
[2] G. Touchard, "Plasma actuators for aeronautics applications-State of art review," IJ PEST, vol. 2, no. 1, pp. 1-25, 2008. [3] T. C. Corke, C. L. Enloe, and S. P. Wilkinson, "Dielectric Barrier Discharge Plasma Actuators for Flow Control *," Annu. Rev. Fluid
Mech., vol. 42, no. 1, pp. 505-529, 2010, doi: 10.1146/annurev-fluid-121108-145550.
[4] I. Adamovich et al., "The 2017 Plasma Roadmap: Low temperature plasma science and technology," Journal of Physics D: Applied Physics, vol. 50, no. 32, p. 323001, 2017.
[5] R. S. Vaddi, Y. Guan, A. Mamishev, and I. Novosselov, "Analytical model for electrohydrodynamic thrust," Proceedings A:
Mathematical, Physical and Engineering Sciences, vol. 476, no. 2241, 2020. [6] Y. Guan, R. S. Vaddi, A. Aliseda, and I. Novosselov, "Analytical model of electro-hydrodynamic flow in corona discharge," Physics of
Plasmas, vol. 25, no. 8, 2018, doi: 10.1063/1.5029403.
[7] Y. Guan, R. S. Vaddi, A. Aliseda, and I. Novosselov, "Experimental and numerical investigation of electrohydrodynamic flow in a point-to-ring corona discharge," Physical Review Fluids, vol. 3, no. 4, p. 043701, 2018.
[8] H. K. Hari Prasad, R. S. Vaddi, Y. M. Chukewad, E. Dedic, I. Novosselov, and S. B. Fuller, "A laser-microfabricated
electrohydrodynamic thruster for centimeter-scale aerial robots," PloS one, vol. 15, no. 4, pp. e0231362-e0231362, 2020, doi: 10.1371/journal.pone.0231362.
[9] R. S. Vaddi, Y. Guan, and I. Novosselov, "Behavior of ultrafine particles in electro-hydrodynamic flow induced by corona discharge,"
Journal of aerosol science, vol. 148, 2020, doi: 10.1016/j.jaerosci.2020.105587. [10] P. Fillingham, R. S. Vaddi, A. Bruning, G. Israel, and I. V. Novosselov, "Drag, lift, and torque on a prolate spheroid resting on a smooth
surface in a linear shear flow," Powder technology, vol. 377, pp. 958-965, 2021, doi: 10.1016/j.powtec.2020.09.042.
[11] R. S. Vaddi, G. Mahamuni, and I. Novosselov, "Development of an EHD induced wind driven personal exposure monitor and in-situ analysis of characterization of exposure," presented at the International Symposium on Electrohydrodynamics, ISEHD'19, St.
Petersburg, Russia, 2019. [12] R. S. Vaddi, Y. Guan, Z. Y. Chen, A. Mamishev, and I. Novosselov, "Experimental and Numerical Investigation of Corona Discharge
Induced Flow on a Flat Plate," presented at the International Symposium on Electrohydrodynamics, ISEHD'19, St. Petersburg, Russia,
2019. [13] A. C. B. Tang, R. S. Vaddi, A. Mamishev, and I. V. Novosselov, "Empirical Relations for Discharge Current and Momentum Injection
in DBD Plasma Actuator," Journal of physics. D, Applied physics, 2021, doi: 10.1088/1361-6463/abec0b.
[14] R. S. Vaddi, C. Sota, A. Mamishev, and I. Novosselov, "Active Flow Control of NACA 0012 Airfoil using Sawtooth Direct Current Augmented Dielectric Barrier Discharge Plasma Actuator," arXiv preprint arXiv:2106.11453, 2021.
[15] Y. Guan, R. S. Vaddi, A. Aliseda, and I. Novosselov, "Comparison of Analytical and Numerical Models for Point to Ring Electro-
Hydrodynamic Flow," presented at the International Symposium on Electrohydrodynamics, ISEHD'19, St. Petersburg, Russia, 2019. [16] D. S. Drew and K. S. J. Pister, "First takeoff of a flying microrobot with no moving parts," ed, 2017, pp. 1-5.
[17] H. Xu et al., "Flight of an aeroplane with solid-state propulsion," Nature, vol. 563, no. 7732, p. 532, 2018, doi: 10.1038/s41586-018-
0707-9. [18] J. Ketcham and H. R. Velkoff, "Effect of an electrostatic field on boundary- layer transition," AIAA Journal, vol. 6, no. 7, pp. 1381-
1383, 1968, doi: 10.2514/3.4756.
[19] D. M. S. J. Reece Roth, "Electrohydrodynamic Flow Control with a Glow-Discharge Surface Plasma," AIAA Journal, vol. 38, no. 7, p. 7, 2000.
[20] S. P. Wilkinson, D. M. Sherman, and J. R. Roth, "Boundary Layer Flow Control with a One Atmosphere Uniform Glow Discharge
Surface Plasma - NASA/CR-1998-207309," ed: Sponsoring Organization: NASA Langley Research Center, 1998. [21] K.-S. Choi, T. Jukes, and R. Whalley, "Turbulent boundary-layer control with plasma actuators," Philosophical Transactions of the
Royal Society of London A: Mathematical, Physical and Engineering Sciences, vol. 369, no. 1940, pp. 1443-1458, 2011.
[22] X. Zhang, Y. Huang, X. Wang, W. Wang, K. Tang, and H. Li, "Turbulent boundary layer separation control using plasma actuator at Reynolds number 2000000," Chinese Journal of Aeronautics, vol. 29, no. 5, pp. 1237-1246, 2016, doi: 10.1016/j.cja.2016.08.006.
[23] Y. Ju and W. Sun, "Plasma assisted combustion: Progress, challenges, and opportunities," Combustion and Flame, vol. 162, no. 3, pp.
529-532, 2015, doi: 10.1016/j.combustflame.2015.01.017. [24] A. Y. Starikovskii, N. B. Anikin, I. N. Kosarev, E. I. Mintoussov, S. M. Starikovskaia, and V. P. Zhukov, "Plasma-assisted combustion,"
vol. 78, ed, 2006, pp. 1265-1298.
[25] I. A. Krichtafovitch, V. L. Gorobets, S. V. Karpov, and A. V. Mamishev, "Electrostatic Fluid Accelerator and Air Purifier - the Second Wind," presented at the Annual Meeting of the Electrostatics Society of America, Edmonton, Canada, 2005.
[26] D. B. Go, S. V. Garimella, and T. S. Fisher, "Numerical Simulation of Microscale Ionic Wind for Local Cooling Enhancement," ed.
USA, 2006, pp. 45-53.
[27] D. B. Go, S. V. Garimella, T. S. Fisher, and R. K. Mongia, "Ionic winds for locally enhanced cooling," Journal of Applied Physics, vol.
102, no. 5, 2007, doi: 10.1063/1.2776164.
[28] D. B. Go, R. A. Maturana, T. S. Fisher, and S. V. Garimella, "Enhancement of external forced convection by ionic wind," International Journal of Heat and Mass Transfer, vol. 51, no. 25, pp. 6047-6053, 2008, doi: 10.1016/j.ijheatmasstransfer.2008.05.012.
[29] N. E. Jewell-Larsen, C. P. Hsu, I. Krichtafovitch, S. Montgomery, J. Dibene, and A. Mamishev, "CFD analysis of electrostatic fluid
accelerators for forced convection cooling," Dielectrics and Electrical Insulation, IEEE Transactions on, vol. 15, no. 6, 2008, doi: 10.1109/TDEI.2008.4712680.
[30] C.-C. Wang and S. Roy, "Electrodynamic enhancement of film cooling of turbine blades," Journal of Applied Physics, vol. 104, no. 7,
pp. 073305-073305-10, 2008, doi: 10.1063/1.2990074. [31] P. Zhao, S. Portugal, and S. Roy, "Efficient needle plasma actuators for flow control and surface cooling," Applied physics letters, vol.
107, no. 3, p. 33501, 2015, doi: 10.1063/1.4927051.
[32] P. C. Dörr and M. J. Kloker, "Crossflow transition control by upstream flow deformation using plasma actuators," Journal of applied physics, vol. 121, no. 6, p. 063303, 2017, doi: 10.1063/1.4975791.
186
[33] N. Szulga, O. Vermeersch, M. Forte, and G. Casalis, "Experimental and Numerical Study of Boundary Layer Transition Control Over an Airfoil Using a DBD Plasma Actuator," Procedia IUTAM, vol. 14, pp. 403-412, 2015, doi: 10.1016/j.piutam.2015.03.067.
[34] D. Li Yong Wang Xunnian Zhang, "Control strategies for aircraft airframe noise reduction," Chinese journal of aeronautics, vol. 26,
no. 2, pp. 249-260, 2013, doi: 10.1016/j.cja.2013.02.001. [35] L. Al-Sadawi, T. P. Chong, and J.-H. Kim, "Aerodynamic noise reduction by plasma actuators for a flat plate with blunt trailing edge,"
Journal of Sound and Vibration, vol. 439, pp. 173-193, 2019, doi: 10.1016/j.jsv.2018.08.029.
[36] G. P. G. da Silva, J. P. Eguea, J. A. G. Croce, and F. M. Catalano, "Slat aerodynamic noise reduction using dielectric barrier discharge plasma actuators," Aerospace Science and Technology, vol. 97, p. 105642, 2020.
[37] J. Cai, Y. Tian, X. Meng, X. Han, D. Zhang, and H. Hu, "An experimental study of icing control using DBD plasma actuator,"
Experiments in fluids, vol. 58, no. 8, pp. 1-8, 2017, doi: 10.1007/s00348-017-2378-y. [38] P. F. Zhang, A. B. Liu, and J. J. Wang, "Aerodynamic Modification of NACA 0012 Airfoil by Trailing-Edge Plasma Gurney Flap,"
AIAA Journal, vol. 47, no. 10, pp. 2467-2474, 2009, doi: 10.2514/1.43379.
[39] M. Kotsonis, R. Pul, and L. Veldhuis, "Influence of circulation on a rounded-trailing-edge airfoil using plasma actuators," Experiments in fluids, vol. 55, no. 7, pp. 1-14, 2014, doi: 10.1007/s00348-014-1772-y.
[40] L.-H. Feng, T.-Y. Shi, and Y.-G. Liu, "Lift Enhancement of an Airfoil and an Unmanned Aerial Vehicle by Plasma Gurney Flaps,"
AIAA Journal, vol. 55, no. 5, pp. 1622-1632, 2017, doi: 10.2514/1.J055426. [41] K. Kato, C. Breitsamter, and S. Obi, "Flow separation control over a Gö 387 airfoil by nanosecond pulse-periodic discharge,"
Experiments in fluids, vol. 55, no. 8, pp. 1-19, 2014, doi: 10.1007/s00348-014-1795-4.
[42] L. Wang, C. W. Wong, Z. Lu, Z. Wu, and Y. Zhou, "Novel Sawtooth Dielectric Barrier Discharge Plasma Actuator for Flow Separation Control," AIAA Journal, vol. 55, no. 4, pp. 1405-1416, 2017, doi: 10.2514/1.J055507.
[43] F. Messanelli, E. Frigerio, E. Tescaroli, and M. Belan, "Separation Control by Plasma Actuators: Effects of Direct Momentum Injection
and Vortex Generation," Flow, turbulence and combustion, vol. 104, no. 4, pp. 895-926, 2019, doi: 10.1007/s10494-019-00092-2. [44] B.-G. Cho, S.-H. Hwang, M. Park, J. K. Park, Y.-B. Park, and H. G. Chae, "The effects of plasma surface treatment on the mechanical
properties of polycarbonate/carbon nanotube/carbon fiber composites," Composites. Part B, Engineering, vol. 160, pp. 436-445, 2019, doi: 10.1016/j.compositesb.2018.12.062.
[45] Y. Hong et al., "Air-plasma surface modification of epoxy resin substrate to improve electroless copper plating of printed circuit board,"
Vacuum, vol. 170, p. 108967, 2019, doi: 10.1016/j.vacuum.2019.108967. [46] M. Raguse et al., "Understanding of the importance of the spore coat structure and pigmentation in theBacillus subtilisspore resistance
to low-pressure plasma sterilization," Journal of physics. D, Applied physics, vol. 49, no. 28, p. 285401, 2016, doi: 10.1088/0022-
3727/49/28/285401. [47] A. Sakudo, Y. Yagyu, and T. Onodera, "Disinfection and Sterilization Using Plasma Technology: Fundamentals and Future Perspectives
for Biological Applications," International journal of molecular sciences, vol. 20, no. 20, p. 5216, 2019, doi: 10.3390/ijms20205216.
[48] K. Ananthakumar, D. Rajamani, E. Balasubramanian, and J. Paulo Davim, "Measurement and optimization of multi-response characteristics in plasma arc cutting of Monel 400™ using RSM and TOPSIS," Measurement : journal of the International Measurement
Confederation, vol. 135, pp. 725-737, 2019, doi: 10.1016/j.measurement.2018.12.010.
[49] A. Parthiban, J. P. Prasath, P. Vivek, and R. Pugazhenthi, "Experimental Investigation of Plasma ARC Cutting for Stainless Steel Sheet," International Journal of Mechanical and Production Engineering Research and Development, vol. 8, no. 1, pp. 907-914, 2018, doi:
10.24247/ijmperdfeb2018110.
[50] R. S. Sigmond, "Simple approximate treatment of unipolar space‐charge‐dominated coronas: The Warburg law and the saturation current," Journal of Applied Physics, vol. 53, no. 2, pp. 891-898, 1982, doi: 10.1063/1.330557.
[51] J. S. Townsend, Electricity in gases. Oxford: Clarendon Press, 1915.
[52] J. S. Townsend, "XI. The potentials required to maintain currents between coaxial cylinders," The London, Edinburgh, and Dublin Philosophical Magazine and Journal of Science, vol. 28, no. 163, pp. 83-90, 1914.
[53] P. Cooperman, "A theory for space-charge-limited currents with application to electrical precipitation," Transactions of the American
Institute of Electrical Engineers, Part I: Communication and Electronics, vol. 79, no. 1, pp. 47-50, 1960. [54] R. Sigmond and M. Goldman, "Electrical Breakdown and Discharges in Gases-Part B, Macroscopic Processes and Discharges," Eds.
EE Kunhardt and LH Luessen, Plenum, NY, 1981.
[55] R. Sigmond, "Simple approximate treatment of unipolar space‐charge‐dominated coronas: The Warburg law and the saturation current," Journal of Applied Physics, vol. 53, no. 2, pp. 891-898, 1982.
[56] P. Giubbilini, "The current‐voltage characteristics of point‐to‐ring corona," Journal of applied physics, vol. 64, no. 7, pp. 3730-3732,
1988. [57] X. Meng, H. Zhang, and J. Zhu, "A general empirical formula of current–voltage characteristics for point-to-plane geometry corona
discharges," Journal of Physics D: Applied Physics, vol. 41, no. 6, p. 065209, 2008.
[58] K. Yamada, "An empirical formula for negative corona discharge current in point-grid electrode geometry," Journal of applied physics, vol. 96, no. 5, pp. 2472-2475, 2004.
[59] S. I. Wais and D. D. Giliyana, "Sphere-to-plane electrodes configuration of positive and negative plasma corona discharge," Am J Mod
Phys, vol. 2, no. 2, pp. 46-52, 2013. [60] P. Mikropoulos and V. Zagkanas, "A computational method for positive corona inception in the coaxial cylindrical electrode
arrangement in air under variable atmospheric conditions," in Proceeding of the 16 th International Symposium on High Voltage
Engineering. Paper B-10, 2009. [61] Y. Zheng, B. Zhang, and J. He, "Current-voltage characteristics of dc corona discharges in air between coaxial cylinders," Physics of
Plasmas, vol. 22, no. 2, p. 023501, 2015.
[62] A. A. Martins, "Simulation of a wire-cylinder-plate positive corona discharge in nitrogen gas at atmospheric pressure," Physics of Plasmas, vol. 19, no. 6, p. 063502, 2012.
[63] P. Giubbilini, "Mobility measurement of large ions in air from a point-to-ring corona source," Journal of applied physics, vol. 81, no. 5,
pp. 2101-2104, 1997. [64] Y. Zhang, L. Liu, Y. Chen, and J. Ouyang, "Characteristics of ionic wind in needle-to-ring corona discharge," Journal of Electrostatics,
vol. 74, pp. 15-20, 2015.
187
[65] V. T. Dau, T. X. Dinh, T. T. Bui, C.-D. Tran, H. T. Phan, and T. Terebessy, "Corona based air-flow using parallel discharge electrodes," Experimental Thermal and Fluid Science, vol. 79, pp. 52-56, 2016.
[66] M. J. Johnson, R. Tirumala, and D. B. Go, "Analysis of geometric scaling of miniature, multi-electrode assisted corona discharges for
ionic wind generation," Journal of Electrostatics, vol. 74, pp. 8-14, 2015. [67] R. Tirumala and D. B. Go, "Comparative study of corona discharge simulation techniques for electrode configurations inducing non-
uniform electric fields," Journal of Electrostatics, vol. 72, no. 2, pp. 99-106, 2014.
[68] M. Robinson, "Movement of air in the electric wind of the corona discharge," Transactions of the American Institute of Electrical Engineers, Part I : Communication and Electronics, vol. 80, no. 2, p. 8, 1961.
[69] S.-I. Cheng, "Glow discharge as an advanced propulsion device," ARS Journal, vol. 32, no. 12, pp. 1910-1916, 1962.
[70] E. A. Christenson and P. S. Moller, "Ion-neutral propulsion in atmospheric media," AIAA Journal, vol. 5, no. 10, pp. 1768-1773, 1967. [71] L. Pekker and M. Young, "Model of ideal electrohydrodynamic thruster," Journal of Propulsion and Power, vol. 27, no. 4, pp. 786-792,
2011.
[72] N. F. Mott, Electronic processes in ionic crystals, 2d ed. ed. (Ionic crystals). Oxford: Oxford, Clarendon Press, 1948. [73] P. A. Durbin, "Asymptotic analysis of corona discharge from thin electrodes," 1986.
[74] S. Mukkavilli, C. Lee, K. Varghese, and L. Tavlarides, "Modeling of the electrostatic corona discharge reactor," IEEE transactions on
plasma science, vol. 16, no. 6, pp. 652-660, 1988. [75] J.-S. Chang, P. A. Lawless, and T. Yamamoto, "Corona discharge processes," IEEE Transactions on plasma science, vol. 19, no. 6, pp.
1152-1166, 1991.
[76] F. Yang et al., "Corona driven air propulsion for cooling of electronics," in XIIIth International Symposium on High Voltage Engineering, 2003, vol. 1, no. 4.
[77] L. Li, S. J. Lee, W. Kim, and D. Kim, "An empirical model for ionic wind generation by a needle-to-cylinder dc corona discharge,"
Journal of Electrostatics, vol. 73, pp. 125-130, 2015. [78] E. Moreau, N. Benard, J.-D. Lan-Sun-Luk, and J.-P. Chabriat, "Electrohydrodynamic force produced by a wire-to-cylinder dc corona
discharge in air at atmospheric pressure," Journal of Physics D: Applied Physics, vol. 46, no. 47, p. 475204, 2013. [79] K. Masuyama and S. R. Barrett, "On the performance of electrohydrodynamic propulsion," Proceedings of the Royal Society A:
Mathematical, Physical and Engineering Sciences, vol. 469, no. 2154, p. 20120623, 2013.
[80] K. Adamiak and P. Atten, "Simulation of corona discharge in point–plane configuration," Journal of electrostatics, vol. 61, no. 2, pp. 85-98, 2004.
[81] L. Zhao and K. Adamiak, "EHD flow in air produced by electric corona discharge in pin–plate configuration," Journal of electrostatics,
vol. 63, no. 3, pp. 337-350, 2005. [82] L. Zhao and K. Adamiak, "Numerical simulation of the effect of EHD flow on corona discharge in compressed air," IEEE Transactions
on Industry Applications, vol. 49, no. 1, pp. 298-304, 2013.
[83] P. Lawless and L. Sparks, "Interactive computer model for calculating VI curves in ESPs (electrostatic precipitators): Version 1. 0. Report for July 1984-July 1986," Research Triangle Inst., Durham, NC (USA), 1986.
[84] S. Cristina, G. Dinelli, and M. Feliziani, "Numerical computation of corona space charge and VI characteristic in DC electrostatic
precipitators," IEEE Transactions on industry applications, vol. 27, no. 1, pp. 147-153, 1991. [85] T. Yamamoto, M. Okuda, and M. Okubo, "Three-dimensional ionic wind and electrohydrodynamics of tuft/point corona electrostatic
precipitator," IEEE Transactions on Industry Applications, vol. 39, no. 6, pp. 1602-1607, 2003.
[86] K. Adamiak, "Numerical models in simulating wire-plate electrostatic precipitators: a review," Journal of Electrostatics, vol. 71, no. 4, pp. 673-680, 2013.
[87] N. Jewell-Larsen, P. Zhang, C.-P. Hsu, I. Krichtafovitch, and A. Mamishev, "Coupled-physics modeling of electrostatic fluid
accelerators for forced convection cooling," in 9th AIAA/ASME Joint Thermophysics and Heat Transfer Conference, 2006, p. 3607. [88] D. B. Go, S. V. Garimella, and T. S. Fisher, "Numerical simulation of microscale ionic wind for local cooling enhancement," in Thermal
and Thermomechanical Phenomena in Electronics Systems, 2006. ITHERM'06. The Tenth Intersociety Conference on, 2006: IEEE, pp.
45-53. [89] D. B. Go, S. V. Garimella, T. S. Fisher, and R. K. Mongia, "Ionic winds for locally enhanced cooling," Journal of Applied Physics, vol.
102, no. 5, p. 053302, 2007.
[90] N. Jewell-Larsen, C. Hsu, I. Krichtafovitch, S. Montgomery, J. Dibene, and A. V. Mamishev, "CFD analysis of electrostatic fluid accelerators for forced convection cooling," IEEE Transactions on Dielectrics and Electrical Insulation, vol. 15, no. 6, 2008.
[91] N. A. Kaptsov, "Electrical phenomena in gases and vacuum," ed. Gostehizdat, Moscow, 1950.
[92] F. Peek, "The law of corona and the dielectric strength of air," Proceedings of the American Institute of Electrical Engineers, vol. 30, no. 7, pp. 1485-1561, 1911.
[93] J. Kriegseis, C. Schwarz, A. Duchmann, S. Grundmann, and C. Tropea, "PIV-based estimation of DBD plasma-actuator force terms,"
in 50th AIAA aerospace sciences meeting including the new horizons forum and aerospace exposition, 2012, p. 411. [94] M. Forte, J. Jolibois, J. Pons, E. Moreau, G. Touchard, and M. Cazalens, "Optimization of a dielectric barrier discharge actuator by
stationary and non-stationary measurements of the induced flow velocity: application to airflow control," Experiments in Fluids, vol.
43, no. 6, pp. 917-928, 2007, doi: 10.1007/s00348-007-0362-7. [95] E. Moreau, J. Cazour, and N. Benard, "Influence of the air-exposed active electrode shape on the electrical, optical and mechanical
characteristics of a surface dielectric barrier discharge plasma actuator," Journal of Electrostatics, vol. 93, pp. 146-153, 2018.
[96] N. Benard and E. Moreau, "Electrical and mechanical characteristics of surface AC dielectric barrier discharge plasma actuators applied to airflow control," Experiments in Fluids, vol. 55, no. 11, p. 1846, 2014.
[97] G. Neretti, P. Seri, M. Taglioli, A. Shaw, F. Iza, and C. A. Borghi, "Geometry optimization of linear and annular plasma synthetic jet
actuators," Journal of Physics D: Applied Physics, vol. 50, no. 1, p. 015210, 2016. [98] E. Defoort, R. Bellanger, C. Batiot-Dupeyrat, and E. Moreau, "Ionic wind produced by a DC needle-to-plate corona discharge with a
gap of 15 mm," Journal of Physics D: Applied Physics, vol. 53, no. 17, p. 175202, 2020.
[99] C. L. Enloe, T. E. McLaughlin, R. D. VanDyken, K. D. Kachner, E. J. Jumper, and T. C. Corke, "Mechanisms and responses of a single dielectric barrier plasma actuator: plasma morphology," AIAA Journal, vol. 42, no. 3, p. 589, 2004, doi: 10.2514/1.2305.
[100] J. Reece Roth and X. Dai, "Optimization of the aerodynamic plasma actuator as an electrohydrodynamic (EHD) electrical device," vol.
19, ed, 2006, pp. 14604-14631.
188
[101] T. Matsuno, H. Kawazoe, and R. C. Nelson, "Aerodynamic control of high performance aircraft using pulsed plasma actuators," ed, 2009.
[102] M. Han, J. Li, Z. Niu, H. Liang, G. Zhao, and W. Hua, "Aerodynamic performance enhancement of a flying wing using nanosecond
pulsed DBD plasma actuator," Chinese Journal of Aeronautics, vol. 28, no. 2, pp. 377-384, 2015, doi: 10.1016/j.cja.2015.02.006. [103] S. Grundmann, M. Frey, and C. Tropea, "Unmanned aerial vehicle (UAV) with plasma actuators for separation control," in 47th AIAA
Aerospace Sciences Meeting including The New Horizons Forum and Aerospace Exposition, 2009, p. 698.
[104] A. R. Hoskinson and N. Hershkowitz, "Differences between dielectric barrier discharge plasma actuators with cylindrical and rectangular exposed electrodes," Journal of Physics D: Applied Physics, vol. 43, no. 6, p. 065205, 2010, doi: 10.1088/0022-3727/43/6/065205.
[105] J. Omidi and K. Mazaheri, "Micro-plasma actuator mechanisms in interaction with fluid flow for wind energy applications: Physical
parameters," Physics of Fluids, vol. 32, no. 7, p. 077107, 2020. [106] F. Rodrigues, J. Pascoa, and M. Trancossi, "Analysis of innovative plasma actuator geometries for boundary layer control," in ASME
2016 International Mechanical Engineering Congress and Exposition, 2016: American Society of Mechanical Engineers Digital
Collection. [107] E. Moreau, K. Bayoda, and N. Benard, "Streamer propagation and pressure waves produced by a nanosecond pulsed surface sliding
discharge: effect of the high voltage electrode shape," Journal of Physics D: Applied Physics, 2020.
[108] R. J. Durscher and S. Roy, "Three-dimensional flow measurements induced from serpentine plasma actuators in quiescent air," Journal of physics. D, Applied physics, vol. 45, no. 3, p. 035202, 2012, doi: 10.1088/0022-3727/45/3/035202.
[109] R. Joussot, A. Leroy, R. Weber, H. Rabat, S. Loyer, and D. Hong, "Plasma morphology and induced airflow characterization of a DBD
actuator with serrated electrode," Journal of physics. D, Applied physics, vol. 46, no. 12, p. 125204, 2013, doi: 10.1088/0022-3727/46/12/125204.
[110] F. Rodrigues, A. Mushyam, J. Pascoa, and M. Trancossi, "A new plasma actuator configuration for improved efficiency: The stair-
shaped dielectric barrier discharge actuator," Journal of Physics D: Applied Physics, vol. 52, no. 38, p. 385201, 2019. [111] G. I. Font, "Boundary Layer Control with Atmospheric Plasma Discharges," AIAA Journal, vol. 44, no. 7, pp. 1572-1578, 2006, doi:
10.2514/1.18542. [112] G. Font and W. Morgan, "Plasma discharges in atmospheric pressure oxygen for boundary layer separation control," in 35th AIAA Fluid
Dynamics Conference and Exhibit, 2005, p. 4632.
[113] D. M. Orlov, Modelling and simulation of single dielectric barrier discharge plasma actuators. Thesis (Ph.D.), University of Notre Dame, 2006.
[114] G. R. Tathiri, E. Esmaeilzadeh, S. M. Mirsajedi, and H. M. Moghaddam, "Experimental Investigation of “Why an AC Dielectric Barrier
Discharge Plasma Actuator is Preferred to DC Corona Wind Actuator in Boundary Layer Flow Control?," Journal of Applied Fluid Mechanics, vol. 7, no. 3, pp. 525-534, 2014.
[115] J. Pons, E. Moreau, and G. Touchard, "Asymmetric surface dielectric barrier discharge in air at atmospheric pressure: electrical
properties and induced airflow characteristics," Journal of physics. D, Applied physics, vol. 38, no. 19, pp. 3635-3642, 2005, doi: 10.1088/0022-3727/38/19/012.
[116] I. Biganzoli, R. Barni, and C. Riccardi, "Temporal evolution of a surface dielectric barrier discharge for different groups of plasma
microdischarges," Journal of physics. D, Applied physics, vol. 46, no. 2, p. 025201, 2013, doi: 10.1088/0022-3727/46/2/025201. [117] I. Biganzoli, R. Barni, C. Riccardi, A. Gurioli, and R. Pertile, "Optical and electrical characterization of a surface dielectric barrier
discharge plasma actuator," Plasma sources science & technology, vol. 22, no. 2, p. 25009, 2013, doi: 10.1088/0963-0252/22/2/025009.
[118] I. Biganzoli, R. Barni, and C. Riccardi, "Note: On the use of Rogowski coils as current probes for atmospheric pressure dielectric barrier discharges," Review of scientific instruments, vol. 84, no. 1, pp. 016101-016101, 2013, doi: 10.1063/1.4773233.
[119] C. Louste, G. Artana, E. Moreau, and G. Touchard, "Sliding discharge in air at atmospheric pressure: electrical properties," Journal of
Electrostatics, vol. 63, no. 6-10, pp. 615-620, 2005. [120] C. A. Borghi, A. Cristofolini, G. Grandi, G. Neretti, and P. Seri, "A plasma aerodynamic actuator supplied by a multilevel generator
operating with different voltage waveforms," Plasma sources science & technology, vol. 24, no. 4, p. 45018, 2015, doi: 10.1088/0963-
0252/24/4/045018. [121] J.-C. Laurentie, J. Jolibois, and E. Moreau, "Surface dielectric barrier discharge: Effect of encapsulation of the grounded electrode on
the electromechanical characteristics of the plasma actuator," Journal of Electrostatics, vol. 67, no. 2-3, pp. 93-98, 2009.
[122] J. Kriegseis, B. Möller, S. Grundmann, and C. Tropea, "Capacitance and power consumption quantification of dielectric barrier discharge (DBD) plasma actuators," Journal of electrostatics, vol. 69, no. 4, pp. 302-312, 2011, doi: 10.1016/j.elstat.2011.04.007.
[123] J.-S. Yoon and J.-H. Han, "One-equation modeling and validation of dielectric barrier discharge plasma actuator thrust," Journal of
Physics D: Applied Physics, vol. 47, no. 40, p. 405202, 2014. [124] B. Dong, J. M. Bauchire, J. M. Pouvesle, P. Magnier, and D. Hong, "Experimental study of a DBD surface discharge for the active
control of subsonic airflow," Journal of physics. D, Applied physics, vol. 41, no. 15, p. 155201, 2008, doi: 10.1088/0022-
3727/41/15/155201. [125] J. Kriegseis, A. Duchmann, C. Tropea, and S. Grundmann, "On the classification of dielectric barrier discharge plasma actuators: A
comprehensive performance evaluation study," Journal of Applied Physics, vol. 114, no. 5, 2013, doi: 10.1063/1.4817366.
[126] C. L. Enloe et al., "Mechanisms and responses of a dielectric barrier plasma actuator: Geometric effects," AIAA journal, vol. 42, no. 3, pp. 595-604, 2004.
[127] R. Durscher and S. Roy, "Evaluation of thrust measurement techniques for dielectric barrier discharge actuators," Experiments in fluids,
vol. 53, no. 4, pp. 1165-1176, 2012, doi: 10.1007/s00348-012-1349-6. [128] D. E. Ashpis and M. C. Laun, "Characterization of DBD Plasma Actuators Performance without External Flow-Part I: Thrust-Voltage
Quadratic Relationship in Logarithmic Space for Sinusoidal Excitation," in 47th AIAA Plasmadynamics and Lasers Conference, 2016,
p. 4013. [129] D. E. Ashpis and M. C. Laun, "Dielectric Barrier Discharge Plasma Actuator Thrust Measurement Methodology Incorporating Antithrust
Hypothesis," AIAA journal. American Institute of Aeronautics and Astronautics, vol. 55, no. 12, p. 4181, 2017, doi: 10.2514/1.J055856.
[130] D. E. Ashpis, M. C. Laun, and E. L. Griebeler, "Progress Toward Accurate Measurement of Dielectric Barrier Discharge Plasma Actuator Power," AIAA Journal, vol. 55, no. 7, pp. 2254-2268, 2017, doi: 10.2514/1.J055816.
[131] T. Matsuno, M. Sugahara, H. Kawazoe, and H. Nishida, "Development of serrated multi-electrode plasma actuators for enhanced force
production," in 54th AIAA Aerospace Sciences Meeting, 2016, p. 1691.
189
[132] A. R. Hoskinson, N. Hershkowitz, and D. E. Ashpis, "Force measurements of single and double barrier DBD plasma actuators in quiescent air," Journal of Physics D: Applied Physics, vol. 41, no. 24, p. 245209, 2008, doi: 10.1088/0022-3727/41/24/245209.
[133] M. Kotsonis, S. Ghaemi, L. Veldhuis, and F. Scarano, "Measurement of the body force field of plasma actuators," Journal of physics.
D, Applied physics, vol. 44, no. 4, p. 045204, 2011, doi: 10.1088/0022-3727/44/4/045204. [134] S. P. Wilkinson, E. Siochi, G. Sauti, T.-B. Xu, M. Meador, and H. Guo, "Evaluation of dielectric-barrier-discharge actuator substrate
materials," in 45th AIAA Plasmadynamics and Lasers Conference, 2014, p. 2810.
[135] F. O. Thomas, T. C. Corke, M. Iqbal, A. Kozlov, and D. Schatzman, "Optimization of Dielectric Barrier Discharge Plasma Actuators for Active Aerodynamic Flow Control," AIAA Journal, vol. 47, no. 9, pp. 2169-2178, 2009, doi: 10.2514/1.41588.
[136] J. Zito, D. Arnold, T. Houba, J. Soni, R. Durscher, and S. Roy, "Microscale dielectric barrier discharge plasma actuators: Performance
characterization and numerical comparison," in 43rd AIAA Plasmadynamics and Lasers Conference, 2012, p. 3091. [137] J.-S. Yoon and J.-H. Han, "Semiempirical Thrust Model of Dielectric Barrier Plasma Actuator for Flow Control," Journal of Aerospace
Engineering, vol. 28, no. 1, p. 4014041, 2015, doi: 10.1061/(ASCE)AS.1943-5525.0000353.
[138] N. Benard, N. Balcon, and E. Moreau, "Electric wind produced by a surface dielectric barrier discharge operating over a wide range of relative humidity," in 47th AIAA Aerospace Sciences Meeting including The New Horizons Forum and Aerospace Exposition, 2009, p.
488.
[139] M. Wicks and F. O. Thomas, "Effect of Relative Humidity on Dielectric Barrier Discharge Plasma Actuator Body Force," AIAA Journal, vol. 53, no. 9, pp. 2801-2805, 2015, doi: 10.2514/1.J053810.
[140] X. Che et al., "Study of flow fields induced by surface dielectric barrier discharge actuator in low-pressure air," Physics of plasmas, vol.
21, no. 4, p. 43508, 2014, doi: 10.1063/1.4871722. [141] J. Kriegseis, K. Barckmann, J. Frey, S. Grundmann, and C. Tropea, "Simultaneous investigation of pressure effects and airflow influence
on DBD plasma actuators," in 51st AIAA Aerospace Sciences Meeting including the New Horizons Forum and Aerospace Exposition,
2013, p. 756. [142] N. Benard, N. Balcon, and E. Moreau, "Electric wind produced by a surface dielectric barrier discharge operating in air at different
pressures: aeronautical control insights," Journal of physics. D, Applied physics, vol. 41, no. 4, p. 042002, 2008, doi: 10.1088/0022-3727/41/4/042002.
[143] Y. Wu, Y. Li, M. Jia, H. Song, and H. Liang, "Effect of pressure on the emission characteristics of surface dielectric barrier discharge
plasma," Sensors and actuators. A. Physical., vol. 203, pp. 1-5, 2013, doi: 10.1016/j.sna.2013.07.023. [144] J. Soni and S. Roy, "Low pressure characterization of dielectric barrier discharge actuators," Applied physics letters, vol. 102, no. 11, p.
112908, 2013, doi: 10.1063/1.4796176.
[145] Z. Wu, J. Xu, P. Chen, K. Xie, and N. Wang, "Maximum Thrust of Single Dielectric Barrier Discharge Thruster at Low Pressure," AIAA Journal, vol. 56, no. 6, pp. 2235-2241, 2018, doi: 10.2514/1.J056641.
[146] P. Versailles, V. Gingras-Gosselin, and H. D. Vo, "Impact of Pressure and Temperature on the Performance of Plasma Actuators," AIAA
Journal, vol. 48, no. 4, pp. 859-863, 2010, doi: 10.2514/1.43852. [147] B. Jayaraman, Y.-C. Cho, and W. Shyy, "Modeling of dielectric barrier discharge plasma actuator," Journal of Applied physics, vol.
103, no. 5, p. 053304, 2008.
[148] Y. Suzen and G. Huang, "Simulations of flow separation control using plasma actuators," in 44th AIAA Aerospace Sciences Meeting and Exhibit, 2006, p. 877.
[149] J. Huang, T. C. Corke, and F. O. Thomas, "Plasma actuators for separation control of low-pressure turbine blades," AIAA journal, vol.
44, no. 1, pp. 51-57, 2006. [150] T. Brauner, S. Laizet, N. Benard, and E. Moreau, "Modelling of dielectric barrier discharge plasma actuators for direct numerical
simulations," in 8th AIAA Flow Control Conference, 2016, p. 3774.
[151] A. R. Hoskinson, "Measurements and simulations of surface dielectric barrier discharges used as plasma actuators," ed: ProQuest Dissertations Publishing, 2009.
[152] C. L. Enloe, T. E. McLaughlin, G. I. Font, and J. W. Baughn, "Parameterization of Temporal Structure in the Single-Dielectric-Barrier
Aerodynamic Plasma Actuator," AIAA Journal, vol. 44, no. 6, pp. 1127-1136, 2006, doi: 10.2514/1.16297. [153] C. Enloe, T. McLaughlin, R. Van Dyken, and J. Fischer, "Plasma structure in the aerodynamic plasma actuator," in 42nd AIAA Aerospace
Sciences Meeting and Exhibit, 2004, p. 844.
[154] U. Seth, P. Traoré, F. Duran-Olivencia, E. Moreau, and P. Vazquez, "Parametric study of a DBD plasma actuation based on the Suzen-Huang model," Journal of Electrostatics, vol. 93, pp. 1-9, 2018.
[155] T. Brauner, S. Laizet, N. Benard, and E. Moreau, "Modelling of dielectric barrier discharge plasma actuators for direct numerical
simulations," ed: AAAI, 2016. [156] T. C. Corke and D. Orlov, "Modelling and simulation of single dielectric barrier discharge plasma actuators," T. C. Corke, Ed., ed:
ProQuest Dissertations Publishing, 2006.
[157] C. L. Enloe, G. I. Font, T. E. McLaughlin, and D. M. Orlov, "Surface Potential and Longitudinal Electric Field Measurements in the Aerodynamic Plasma Actuator," AIAA Journal, vol. 46, no. 11, pp. 2730-2740, 2008, doi: 10.2514/1.33973.
[158] Z. Li, B. Hu, S. Lan, J. Zhang, and J. Huang, "Control of turbulent channel flow using a plasma-based body force," Computers & fluids,
vol. 119, pp. 26-36, 2015, doi: 10.1016/j.compfluid.2015.07.001. [159] K. Mazaheri, J. Omidi, and K. Kiani, "Simulation of DBD plasma actuator effect on aerodynamic performance improvement using a
modified phenomenological model," Computers & Fluids, vol. 140, pp. 371-384, 2016.
[160] M. Riherd and S. Roy, "Serpentine geometry plasma actuators for flow control," Journal of Applied Physics, vol. 114, no. 8, 2013, doi: 10.1063/1.4818622.
[161] C. W. Wong, L. Wang, W. Ma, and Y. Zhou, "New Sawtooth Plasma Actuator Configuration and Mechanism Behind Improved Control
Performance," AIAA Journal, vol. 58, no. 4, pp. 1881-1886, 2020, doi: 10.2514/1.J058814. [162] Z. Liu, M. Zhang, and L. Wang, "Investigation on 3D flow field induced by a plasma actuator with serrated electrode," Science bulletin
(Beijing), vol. 61, no. 6, pp. 481-487, 2016, doi: 10.1007/s11434-016-1030-1.
[163] F. Messanelli and M. Belan, "A Comparison Between DBD and Corona Actuators with Non-Straight Electrodes," in Progress in Turbulence VI: Springer, 2016, pp. 197-201.
[164] K. P. Guoqiang Gao, Lei Dong, Wenfu Wei, Guangning Wu, "Parametric study on the characteristics of a SDBD actuator with a
serrated electrode," Plasma science & technology, vol. 19, no. 6, pp. 66-73, 2017, doi: 10.1088/2058-6272/aa5b39.
190
[165] R. Sosa, H. Kelly, D. Grondona, A. Márquez, V. Lago, and G. Artana, "Electrical and plasma characteristics of a quasi-steady sliding discharge," Journal of physics. D, Applied physics, vol. 41, no. 3, p. 035202, 2008, doi: 10.1088/0022-3727/41/3/035202.
[166] R. Sosa, E. Arnaud, E. Memin, and G. Artana, "Study of the flow induced by a sliding discharge," IEEE transactions on dielectrics and
electrical insulation, vol. 16, no. 2, pp. 305-311, 2009, doi: 10.1109/TDEI.2009.4815157. [167] B. Zheng, J. Chen, C. Ge, X. Ke, and H. Liang, "Flow visualization and mechanisms of three-electrode sliding discharge plasma
actuator," Proceedings of the Institution of Mechanical Engineers. Part G, Journal of aerospace engineering, vol. 233, no. 13, pp. 4788-
4799, 2019, doi: 10.1177/0954410019830266. [168] B.-R. Zheng, M. Xue, and C. Ge, "Dynamic evolution of vortex structures induced by tri-electrode plasma actuator," Chinese physics
B, vol. 29, no. 2, p. 24704, 2020, doi: 10.1088/1674-1056/ab671f.
[169] B. T. Townsend, "Electrokinetic apparatus," ed: Google Patents, 1960. [170] J. Wilson, H. D. Perkins, and W. K. Thompson, "An investigation of ionic wind propulsion," 2009.
[171] C. K. Gilmore and S. R. Barrett, "Electrohydrodynamic thrust density using positive corona-induced ionic winds for in-atmosphere
propulsion," Proceedings of the Royal Society A: Mathematical, Physical and Engineering Sciences, vol. 471, no. 2175, p. 20140912, 2015.
[172] D. Drew, D. S. Contreras, and K. S. J. Pister, "First thrust from a microfabricated atmospheric ion engine," ed, 2017, pp. 346-349.
[173] V. Y. Khomich and I. E. Rebrov, "In-atmosphere electrohydrodynamic propulsion aircraft with wireless supply onboard," Journal of Electrostatics, vol. 95, pp. 1-12, 2018, doi: 10.1016/j.elstat.2018.07.005.
[174] D. F. Opaits, Dielectric barrier discharge plasma actuator for flow control, final report. Cleveland, Ohio: Thesis (Ph.D)--Princeton
University, 2012. [175] F. Soetomo, G. M. Colver, and K. Forouraghi, "Micro-force measurement of drag on a small flat plate in the presence of a corona
discharge," Journal of Electrostatics, vol. 64, no. 7, pp. 525-530, 2006, doi: 10.1016/j.elstat.2005.10.006.
[176] M. Malik, L. Weinstein, and M. Hussaini, "Ion wind drag reduction," in 21st Aerospace Sciences Meeting, 1983, p. 231. [177] L. Léger, E. Moreau, G. Artana, and G. Touchard, "Influence of a DC corona discharge on the airflow along an inclined flat plate,"
Journal of Electrostatics, vol. 51, no. 1-4, pp. 300-306, 2001, doi: 10.1016/S0304-3886(01)00089-4. [178] L. Leger, E. Moreau, and G. Touchard, "Electrohydrodynamic airflow control along a flat plate by a DC surface corona discharge-
Velocity profile and wall pressure measurements," in 1st Flow Control Conference, 2002, p. 2833.
[179] G. Artana, J. D'Adamo, L. Leger, E. Moreau, and G. Touchard, "Flow control with electrohydrodynamic actuators," AIAA Journal, vol. 40, pp. 1773-1779, 2002, doi: 10.2514/3.15259.
[180] M. Sato, K. Asada, T. Nonomura, H. Aono, A. Yakeno, and K. Fujii, "Mechanisms for turbulent separation control using plasma actuator
at Reynolds number of 1.6× 10⁶," Physics of Fluids, vol. 31, no. 9, p. 095107, 2019. [181] D. Tsubakino, Y. Tanaka, and K. Fujii, "Effective layout of plasma actuators for a flow separation control on a wing," in 45th AIAA
Aerospace Sciences Meeting and Exhibit, 2007, p. 474.
[182] J.-J. Wang, K.-S. Choi, L.-H. Feng, T. N. Jukes, and R. D. Whalley, "Recent developments in DBD plasma flow control," Progress in aerospace sciences, vol. 62, pp. 52-78, 2013, doi: 10.1016/j.paerosci.2013.05.003.
[183] M. P. Patel, T. T. Ng, S. Vasudevan, T. C. Corke, and C. He, "Plasma Actuators for Hingeless Aerodynamic Control of an Unmanned
Air Vehicle," Journal of Aircraft, vol. 44, no. 4, pp. 1264-1274, 2007, doi: 10.2514/1.25368. [184] P. Sujar-Garrido, N. Benard, E. Moreau, and J. P. Bonnet, "Dielectric barrier discharge plasma actuator to control turbulent flow
downstream of a backward-facing step," Experiments in fluids, vol. 56, no. 4, pp. 1-16, 2015, doi: 10.1007/s00348-015-1939-1.
[185] N. Benard et al., "Turbulent separated shear flow control by surface plasma actuator: experimental optimization by genetic algorithm approach," Experiments in fluids, vol. 57, no. 2, pp. 1-17, 2016, doi: 10.1007/s00348-015-2107-3.
[186] D. Kim, H. Do, and H. Choi, "Drag reduction on a three-dimensional model vehicle using a wire-to-plate DBD plasma actuator,"
Experiments in fluids, vol. 61, no. 6, 2020, doi: 10.1007/s00348-020-02961-3. [187] X. Zhang, K.-S. Choi, Y. Huang, and H.-x. Li, "Flow control over a circular cylinder using virtual moving surface boundary layer
control," Experiments in fluids, vol. 60, no. 6, pp. 1-15, 2019, doi: 10.1007/s00348-019-2745-y.
[188] Y. Guan, Study of laminar electrohydrodynamic flows. Thesis (Ph. D.)-University of Washington, 2019. [189] Y.-s. Cheng, H.-C. Yeh, and G. M. Kanapilly, "Collection efficiencies of a point-to-plane electrostatic precipitator," The American
Industrial Hygiene Association Journal, vol. 42, no. 8, pp. 605-610, 1981.
[190] P. Stainback and K. Nagabushana, "Review of hot-wire anemometry techniques and the range of their applicability for various flows," Electronic Journal of Fluids Engineering, vol. 1, p. 4, 1993.
[191] P. Giubbilini, "The current-voltage characteristics of point-to-ring corona," Journal of Applied Physics, vol. 64, 1988.
[192] L. L. Yu Zhang, Yang Chen, Jiting Ouyang, "Characteristics of ionic wind in needle-to-ring corona discharge," Journal of Electrostatics, vol. 74, p. 6, 2015.
[193] B. L. Owsenek and J. Seyed-Yagoobi, "Theoretical and experimental study of electrohydrodynamic heat transfer enhancement through
wire-plate corona discharge," Journal of heat transfer, vol. 119, no. 3, p. 7, 1997. [194] F. A. Davide Cagnoni, Thomas Christen, Nicola Parolini, Ivica Stevanovic, Carlo de Falco, "Multiphysics simulation of corona
discharge induced ionic wind," Journal of Applied Physics, vol. 114, no. 233301, p. 10, 2013.
[195] H. Yala and Y. Zebboudj, "Finite-element solution of monopolar corona in a coaxial system," European physical journal. Applied physics, vol. 19, no. 2, pp. 123-129, 2002, doi: 10.1051/epjap:2002058.
[196] M. R. Bouazza, K. Yanallah, F. Pontiga, and J. H. Chen, "A simplified formulation of wire-plate corona discharge in air: Application to
the ion wind simulation," Journal of Electrostatics, vol. 92, pp. 54-65, 2018, doi: 10.1016/j.elstat.2018.02.001. [197] K. Yanallah and F. Pontiga, "A semi-analytical stationary model of a point-to-plane corona discharge," Plasma sources science &
technology, vol. 21, no. 4, p. 045007, 2012, doi: 10.1088/0963-0252/21/4/045007.
[198] S. Chen, J. C. P. Y. Nobelen, and S. Nijdam, "A self-consistent model of ionic wind generation by negative corona discharges in air with experimental validation," Plasma sources science & technology, vol. 26, no. 9, p. 95005, 2017, doi: 10.1088/1361-6595/aa86b8.
[199] P. Seimandi, G. Dufour, and F. Rogier, "An asymptotic model for steady wire-to-wire corona discharges," Mathematical and computer
modelling, vol. 50, no. 3, pp. 574-583, 2009, doi: 10.1016/j.mcm.2009.03.005. [200] C. Kim, D. Park, K. C. Noh, and J. Hwang, "Velocity and energy conversion efficiency characteristics of ionic wind generator in a
multistage configuration," Journal of electrostatics, vol. 68, no. 1, pp. 36-41, 2010, doi: 10.1016/j.elstat.2009.09.001.
191
[201] L. D. Landau, E. M. Lifshitz, J. B. Sykes, and W. H. Reid, Fluid Mechanics (Course of theoretical physics, no. 6). Pergamon press inc, 1959.
[202] K. McNaughton and C. Sinclair, "Submerged jets in short cylindrical flow vessels," Journal of Fluid Mechanics, vol. 25, no. 2, pp. 367-
375, 1966. [203] N. Monrolin, F. Plouraboue, and O. Praud, "Electrohydrodynamic Thrust for In-Atmosphere Propulsion," AIAA J., vol. 55, no. 12, pp.
4296-4305, 2017, doi: 10.2514/1.J055928.
[204] H. Schlichting and K. Gersten, Boundary-Layer Theory, 9th ed. 2017 ed. Berlin, Heidelberg: Berlin, Heidelberg: Springer Berlin Heidelberg, 2017.
[205] D.-E. Levy and A. Seifert, "Simplified dragonfly airfoil aerodynamics at Reynolds numbers below 8000," Physics of Fluids, vol. 21,
no. 7, 2009, doi: 10.1063/1.3166867. [206] H. K. Hari Prasad, Development and control of micro-ionic thrusters for centimeter-scale aerial robots. Thesis (M.S.)-University of
Washington, 2020.
[207] D. S. Drew, N. O. Lambert, C. B. Schindler, and K. S. J. Pister, "Toward Controlled Flight of the Ionocraft: A Flying Microrobot Using Electrohydrodynamic Thrust With Onboard Sensing and No Moving Parts," IEEE robotics and automation letters, vol. 3, no. 4, pp.
2807-2813, 2018, doi: 10.1109/LRA.2018.2844461.
[208] Y. M. Chukewad, A. T. Singh, J. M. James, and S. B. Fuller, "A new robot fly design that is easier to fabricate and capable of flight and ground locomotion," in 2018 IEEE/RSJ International Conference on Intelligent Robots and Systems (IROS), 2018: IEEE, pp. 4875-
4882.
[209] M. Glauert, "The wall jet," Journal of Fluid Mechanics, vol. 1, no. 6, pp. 625-643, 1956. [210] W. K. George, H. Abrahamsson, J. Eriksson, R. I. Karlsson, L. Löfdahl, and M. Wosnik, "A similarity theory for the turbulent plane
wall jet without external stream," Journal of Fluid Mechanics, vol. 425, pp. 367-411, 2000.
[211] P. Fillingham and I. V. Novosselov, "Wall jet similarity of impinging planar underexpanded jets," International Journal of Heat and Fluid Flow, vol. 81, p. 108516, 2020/02/01/ 2020, doi: https://doi.org/10.1016/j.ijheatfluidflow.2019.108516.
[212] A. Debien, N. Benard, and E. Moreau, "Streamer inhibition for improving force and electric wind produced by DBD actuators," Journal of Physics D: Applied Physics, vol. 45, no. 21, p. 215201, 2012.
[213] T. C. Corke, M. L. Post, and D. M. Orlov, "Single dielectric barrier discharge plasma enhanced aerodynamics: physics, modeling and
applications," Experiments in Fluids, vol. 46, no. 1, pp. 1-26, 2009. [214] A. R. Hoskinson and N. Hershkowitz, "Modelling of dielectric barrier discharge plasma actuators with thick electrodes," Journal of
physics. D, Applied physics, vol. 44, no. 8, p. 085202, 2011, doi: 10.1088/0022-3727/44/8/085202.
[215] J. R. Roth, "Aerodynamic flow acceleration using paraelectric and peristaltic electrohydrodynamic effects of a one atmosphere uniform glow discharge plasma," Physics of plasmas, vol. 10, no. 5, pp. 2117-2126, 2003.
[216] M. N. Lyulyukin, A. S. Besov, and A. V. Vorontsov, "The Influence of Corona Electrodes Thickness on the Efficiency of
Plasmachemical Oxidation of Acetone," Plasma chemistry and plasma processing, vol. 31, no. 1, pp. 23-39, 2011, doi: 10.1007/s11090-010-9265-0.
[217] J. Pons, E. Moreau, and G. Touchard, "Electrical and aerodynamic characteristics of atmospheric pressure barrier discharges in ambient
air," 2004. [218] K. Kourtzanidis, G. Dufour, and F. Rogier, "Self-consistent modeling of a surface AC dielectric barrier discharge actuator: In-depth
analysis of positive and negative phases," Journal of Physics D: Applied Physics, vol. 54, no. 4, p. 045203, 2020.
[219] P. G. Huang, D. E. Ashpis, J. D. Jacob, and Y. B. Suzen, "Numerical Simulations of Plasma Based Flow Control Applications," ed, 2005.
[220] T. Matsuno, M. Kawaguchi, N. Fujita, G. Yamada, and H. Kawazoe, "Jet vectoring and enhancement of flow control performance of
trielectrode plasma actuator utilizing sliding discharge," in 6th AIAA Flow Control Conference, 2012, p. 3238. [221] J. Boeuf, Y. Lagmich, and L. Pitchford, "Contribution of positive and negative ions to the electrohydrodynamic force in a dielectric
barrier discharge plasma actuator operating in air," Journal of applied physics, vol. 106, no. 2, p. 023115, 2009.
[222] C. Porter, J. Baughn, T. McLaughlin, L. Enloe, and G. Font, "Temporal force measurements on an aerodynamic plasma actuator," in 44th AIAA Aerospace Sciences Meeting and Exhibit, 2006, p. 104.
[223] R. Durscher and S. Roy, "Novel multi-barrier plasma actuators for increased thrust," in 48th AIAA Aerospace Sciences Meeting including
the New Horizons Forum and Aerospace Exposition, 2010, p. 965. [224] J. Ferry and J. Rovey, "Thrust measurement of dielectric barrier discharge plasma actuators and power requirements for aerodynamic
control," in 5th Flow Control Conference, 2010, p. 4982.
[225] M. Belan and F. Messanelli, "Compared ionic wind measurements on multi-tip corona and DBD plasma actuators," Journal of electrostatics, vol. 76, pp. 278-287, 2015, doi: 10.1016/j.elstat.2015.06.008.
[226] N. L. Whiting, D. Castaneda, N. J. Webb, and M. Samimy, "Control of Dynamic Stall over a NACA 0012 Airfoil Using NS-DBD
Plasma Actuators," in AIAA Scitech 2020 Forum, 2020, p. 1568. [227] H. Abdelraouf, A. M. N. Elmekawy, and S. Z. Kassab, "Simulations of flow separation control numerically using different plasma
actuator models," Alexandria engineering journal, vol. 59, no. 5, pp. 3881-3896, 2020, doi: 10.1016/j.aej.2020.06.044.
[228] M. Abdollahzadeh, J. C. Pascoa, and P. J. Oliveira, "Comparison of DBD plasma actuators flow control authority in different modes of actuation," Aerospace science and technology, vol. 78, pp. 183-196, 2018, doi: 10.1016/j.ast.2018.04.013.
[229] L.-H. Feng, T. N. Jukes, K.-S. Choi, and J.-J. Wang, "Flow control over a NACA 0012 airfoil using dielectric-barrier-discharge plasma
actuator with a Gurney flap," Experiments in fluids, vol. 52, no. 6, pp. 1533-1546, 2012, doi: 10.1007/s00348-012-1263-y. [230] R. S. Vaddi, A. Mamishev, and I. Novosselov, "Direct Current Augmented Dielectric Barrier Discharge Plasma Actuator: Effect of
Electrode Shape," AIAA Journal (submitted), 2021.
[231] J. Winslow, H. Otsuka, B. Govindarajan, and I. Chopra, "Basic Understanding of Airfoil Characteristics at Low Reynolds Numbers," Journal of Aircraft, vol. 55, no. 3, pp. 1050-1061, 2018, doi: 10.2514/1.C034415.
[232] L. W. Traub, "Experimental Investigation of the Effect of Trip Strips at Low Reynolds Number," Journal of Aircraft, vol. 48, no. 5, pp.
1776-1784, 2011, doi: 10.2514/1.C031375. [233] R. E. Sheldahl and P. C. Klimas, "Aerodynamic characteristics of seven symmetrical airfoil sections through 180-degree angle of attack
for use in aerodynamic analysis of vertical axis wind turbines," Sandia National Labs., Albuquerque, NM (USA), 1981.
192
[234] C. L. Ladson, Effects of independent variation of Mach and Reynolds numbers on the low-speed aerodynamic characteristics of the NACA 0012 airfoil section. National Aeronautics and Space Administration, Scientific and Technical Information Division, 1988.
[235] M. Drela, "XFOIL: An analysis and design system for low Reynolds number airfoils," in Low Reynolds number aerodynamics: Springer,
1989, pp. 1-12. [236] J. C. Lin, "Review of research on low-profile vortex generators to control boundary-layer separation," Progress in aerospace sciences,
vol. 38, no. 4, pp. 389-420, 2002, doi: 10.1016/S0376-0421(02)00010-6.
[237] T. Corke, B. Mertz, and M. Patel, "Plasma flow control optimized airfoil," in 44th AIAA Aerospace Sciences Meeting and Exhibit, 2006, p. 1208.
[238] K. Masuyama and S. R. H. Barrett, "On the performance of electrohydrodynamic propulsion," Proceedings: Mathematical, Physical
and Engineering Sciences, vol. 469, no. 2154, pp. 1-16, 2013, doi: 10.1098/rspa.2012.0623. [239] N. Benard, P. Noté, M. Caron, and E. Moreau, "Highly time-resolved investigation of the electric wind caused by surface DBD at various
ac frequencies," Journal of electrostatics, vol. 88, pp. 41-48, 2017, doi: 10.1016/j.elstat.2017.01.018.
[240] R. Pereira, D. Ragni, and M. Kotsonis, "Effect of external flow velocity on momentum transfer of dielectric barrier discharge plasma actuators," Journal of applied physics, vol. 116, no. 10, p. 103301, 2014, doi: 10.1063/1.4894518.
[241] N. A. Fuchs, "On the stationary charge distribution on aerosol particles in a bipolar ionic atmosphere," Geofisica pura e applicata,
journal article vol. 56, no. 1, pp. 185-193, September 01 1963, doi: 10.1007/bf01993343. [242] W. H. Marlow and J. R. Brock, "Unipolar charging of small aerosol particles," Journal of Colloid And Interface Science, vol. 50, no. 1,
pp. 32-38, 1975, doi: 10.1016/0021-9797(75)90250-7.
[243] M. H. Lee et al., "Enhanced collection efficiency of nanoparticles by electrostatic precipitator with needle-cylinder configuration," Journal of Nanoscience and Nanotechnology, vol. 16, no. 7, pp. 6884-6888, 2016, doi: 10.1166/jnn.2016.11322.
[244] Y. Zhuang, Y. Jin Kim, T. Gyu Lee, and P. Biswas, "Experimental and theoretical studies of ultra-fine particle behavior in electrostatic
precipitators," Journal of Electrostatics, vol. 48, no. 3, pp. 245-260, 2000, doi: 10.1016/S0304-3886(99)00072-8. [245] L. Ravi and S. L. Girshick, "Coagulation of nanoparticles in a plasma," Physical review. E, Statistical, nonlinear, and soft matter physics,
vol. 79, no. 2 Pt 2, p. 026408, 2009, doi: 10.1103/PhysRevE.79.026408. [246] J. Pelletier, "Dusty plasmas: physics, chemistry and technological impacts in plasma processing," Plasma Physics and Controlled
Fusion, vol. 42, no. 2, pp. 227-227, 2000, doi: 10.1088/0741-3335/42/2/701.
[247] S.-H. Huang and C.-C. Chen, "Ultrafine aerosol penetration through electrostatic precipitators," Environmental Science & Technology, vol. 36, no. 21, pp. 4625-4632, 2002, doi: 10.1021/es011157+.
[248] N. E. Jewell-Larsen, D. A. Parker, I. A. Krichtafovitch, and A. V. Mamishev, "Numerical simulation and optimization of electrostatic
air pumps," ed, 2004, pp. 106-109. [249] J. S. Townsend, "The potentials requires to maintain currents between coaxial cylinders," The London, Edinburgh and Dublin
philosophical magazine and journal of science, vol. 28, no. 163, p. 8, 1914.
[250] M. Pauthenier and M. Moreau-Hanot, "La charge des particules sphériques dans un champ ionisé," Journal de Physique et le Radium, vol. 3, no. 12, pp. 590-613, 1932.
[251] H. Rohmann, "Methode zur Messung der Größe von Schwebeteilchen," Zeitschrift für Physik, vol. 17, no. 1, p. 13, 1923.
[252] H. J. White, "Particle Charging in Electrostatic Precipitation," American Institute of Electrical Engineers, Transactions of the, vol. 70, no. 2, pp. 1186-1191, 1951, doi: 10.1109/T-AIEE.1951.5060545.
[253] H. J. White, Industrial electrostatic precipitation. Reading, Mass.: Reading, Mass., Addison-Wesley Pub. Co., 1963.
[254] N. Fuchs, "The charges on the particles of aerocolloids," Izv. Akad. Nauk. SSSR, Ser. Geogr. Geofiz, vol. 11, pp. 341-348, 1947. [255] B. Y. H. Liu and A. Kapadia, "Combined field and diffusion charging of aerosol particles in the continuum regime," Journal of Aerosol
Science, vol. 9, no. 3, pp. 227-242, 1978, doi: 10.1016/0021-8502(78)90045-9.
[256] L. Unger, D. Boulaud, and J. P. Borra, "Unipolar field charging of particles by electrical discharge: effect of particle shape," Journal of Aerosol Science, vol. 35, no. 8, pp. 965-979, 2004, doi: 10.1016/j.jaerosci.2004.01.006.
[257] S. J. Park and S. S. Kim, "Electrohydrodynamic flow and particle transport mechanism in electrostatic precipitators with cavity walls,"
Aerosol Sci. Technol., vol. 33, no. 3, pp. 205-221, 2000. [258] J. H. Goo and J. W. Lee, "Stochastic simulation of particle charging and collection characteristics for a wire-plate electrostatic
precipitator of short length," Journal of Aerosol Science, vol. 28, no. 5, pp. 875-893, 1997, doi: 10.1016/S0021-8502(96)00475-2.
[259] V. T. Dau, T. X. Dinh, C.-D. Tran, T. Terebessy, T. C. Duc, and T. T. Bui, "Particle precipitation by bipolar corona discharge ion winds," Journal of Aerosol Science, vol. 124, pp. 83-94, 2018, doi: 10.1016/j.jaerosci.2018.07.007.
[260] A. Miller, G. Frey, G. King, and C. Sunderman, "A handheld electrostatic precipitator for sampling airborne particles and nanoparticles,"
Aerosol Science and Technology, vol. 44, no. 6, pp. 417-427, 2010. [261] J. Roux, R. Sarda-Estève, G. Delapierre, M. Nadal, C. Bossuet, and L. Olmedo, "Development of a new portable air sampler based on
electrostatic precipitation," Environmental Science and Pollution Research, vol. 23, no. 9, pp. 8175-8183, 2016, doi: 10.1007/s11356-
015-5522-3. [262] L. Dey and C. Venkataraman, "A Wet Electrostatic Precipitator (WESP) for Soft Nanoparticle Collection," Aerosol Science and
Technology, vol. 46, no. 7, pp. 750-759, 2012, doi: 10.1080/02786826.2012.664295.
[263] K. H. Yoo, J. S. Lee, and M. D. Oh, "Charging and Collection of Submicron Particles in Two-Stage Parallel-Plate Electrostatic Precipitators," Aerosol Science and Technology, vol. 27, no. 3, pp. 308-323, 1997, doi: 10.1080/02786829708965476.
[264] N. Jidenko and J. P. Borra, "Kinematics of charged nanometric particles in silent discharges," Journal of Physics D: Applied Physics,
vol. 38, no. 4, pp. 617-620, 2005, doi: 10.1088/0022-3727/38/4/014. [265] J. P. Borra, N. Jidenko, J. Hou, and A. Weber, "Vaporization of bulk metals into single-digit nanoparticles by non-thermal plasma
filaments in atmospheric pressure dielectric barrier discharges," Journal of Aerosol Science, vol. 79, pp. 109-125, 2015, doi:
10.1016/j.jaerosci.2014.09.002. [266] N. Jidenko, C. Jimenez, F. Massines, and J. P. Borra, "Nano-particle size-dependent charging and electro-deposition in dielectric barrier
discharges at atmospheric pressure for thin sio x film deposition," Journal of Physics D: Applied Physics, vol. 40, no. 14, pp. 4155-
4163, 2007, doi: 10.1088/0022-3727/40/14/009. [267] D. Y. H. Pui, S. Fruin, and P. H. McMurry, "Unipolar Diffusion Charging of Ultrafine Aerosols," Aerosol Science and Technology, vol.
8, no. 2, pp. 173-187, 1988, doi: 10.1080/02786828808959180.
193
[268] M. Li and P. D. Christofides, "Collection efficiency of nanosize particles in a two-stage electrostatic precipitator," Industrial & engineering chemistry research, vol. 45, no. 25, pp. 8484-8491, 2006.
[269] P. Intra and N. Tippayawong, "An Overview of Unipolar Charger Developments for Nanoparticle Charging," Aerosol Air Qual. Res.,
vol. 11, no. 2, pp. 187-209, 2011, doi: 10.4209/aaqr.2010.10.0082. [270] C. Qi, D.-R. Chen, and P. Greenberg, "Performance study of a unipolar aerosol mini-charger for a personal nanoparticle sizer," Journal
of Aerosol Science, vol. 39, no. 5, pp. 450-459, 2008, doi: 10.1016/j.jaerosci.2008.01.003.
[271] R. C. Flagan and J. H. Seinfeld, Fundamentals of air pollution engineering. Courier Corporation, 2012. [272] G.-Y. Lin and C.-J. Tsai, "Numerical Modeling of Nanoparticle Collection Efficiency of Single-Stage Wire-in-Plate Electrostatic
Precipitators," Aerosol Science and Technology, vol. 44, no. 12, pp. 1122-1130, 2010, doi: 10.1080/02786826.2010.512320.
[273] B. Y. H. Liu and D. Y. H. Pui, "On unipolar diffusion charging of aerosols in the continuum regime," Journal of Colloid And Interface Science, vol. 58, no. 1, pp. 142-149, 1977, doi: 10.1016/0021-9797(77)90377-0.
[274] W. C. Hinds, Aerosol technology : properties, behavior, and measurement of airborne particles, 2nd ed. New York: Wiley, 1999, pp.
xx, 483 pages. [275] Y.-S. Cheng, H.-C. Yeh, and G. M. Kanapilly, "Collection efficiencies of a point-to- plane electrostatic precipitator," American
Industrial Hygiene Association Journal, vol. 42, no. 8, pp. 605-610, 1981, doi: 10.1080/15298668191420350.
[276] J. Dixkens and H. Fissan, "Development of an electrostatic precipitator for off- line particle analysis," Aerosol Science and Technology, vol. 30, no. 5, pp. 438-453, 1999, doi: 10.1080/027868299304480.
[277] G. Mahamuni, B. Ockerman, and I. Novosselov, "Electrostatic Capillary Collector for In-Situ Spectroscopic Analysis of Aerosols,"
Aerosol Science and Technology, pp. 1-40, 2019, doi: 10.1080/02786826.2019.1600653. [278] J. He et al., "Evaluation of micro-well collector for capture and analysis of aerosolized Bacillus subtilis spores," PloS one, vol. 13, no.
5, p. e0197783, 2018.
[279] J. He and I. V. Novosselov, "Design and evaluation of an aerodynamic focusing micro-well aerosol collector," Aerosol Science and Technology, vol. 51, no. 9, pp. 1016-1026, 2017, doi: 10.1080/02786826.2017.1329515.
[280] M. Yao and G. Mainelis, "Investigation of Cut-Off Sizes and Collection Efficiencies of Portable Microbial Samplers," Aerosol Science and Technology, vol. 40, no. 8, pp. 595-606, 2006, doi: 10.1080/02786820600729146.
[281] M. Adachi, Y. Kousaka, and K. Okuyama, "Unipolar and bipolar diffusion charging of ultrafine aerosol particles," Journal of Aerosol
Science, vol. 16, no. 2, pp. 109-123, 1985, doi: 10.1016/0021-8502(85)90079-5. [282] F. J. Romay and D. Y. H. Pui, "On the Combination Coefficient of Positive Ions with Ultrafine Neutral Particles in the Transition and
Free-Molecule Regimes," Aerosol Science and Technology, vol. 17, no. 2, pp. 134-147, 1992, doi: 10.1080/02786829208959566.
[283] C. Druzgalski, M. Andersen, and A. Mani, "Direct numerical simulation of electroconvective instability and hydrodynamic chaos near an ion-selective surface," Physics of Fluids, vol. 25, no. 11, p. 110804, 2013.
[284] Y. Guan and I. Novosselov, "Two Relaxation Time Lattice Boltzmann Method Coupled to Fast Fourier Transform Poisson Solver:
Application to Electroconvective Flow," Journal of Computational Physics (accepted for publication), 2019, doi: 10.1016/j.jcp.2019.07.029.
[285] Y. Guan, J. Riley, and I. Novosselov, "Three-dimensional electroconvective vortices in cross flow," Physical Review E, vol. 101, no. 3,
p. 033103, 03/03/ 2020, doi: 10.1103/PhysRevE.101.033103. [286] Y. Guan and I. Novosselov, "Numerical analysis of electroconvection in cross-flow with unipolar charge injection," Physical Review
Fluids, vol. 4, no. 10, p. 103701, 10/01/ 2019, doi: 10.1103/PhysRevFluids.4.103701.
[287] Y. Guan, S. L. Brunton, and I. Novosselov, "Sparse nonlinear models of chaotic electroconvection," arXiv preprint arXiv:2009.11862, 2020.
[288] Y. Kimio, "An empirical formula for negative corona discharge current in point-grid electrode geometry," Journal of Applied Physics,
vol. 96, no. 5, pp. 2472-2475, 2004. [289] L. D. Landau, Fluid mechanics. London : Reading, Mass.: London : Pergamon Press ; Reading, Mass. : Addison-Wesley Pub. Co., 1959.
[290] G. M. Alonso, A. Hernandez-Sierra, and E. Alguacil, "Electrical charging of aerosol nanoparticles and sonne practical applications,"
Rev. Metal, vol. 39, pp. 41-57, 2003. [291] J. Schwartz, A. Zanobetti, and T. Bateson, "Morbidity and Mortality Among Elderly Residents of Cities with Daily PM Measurements,"
Revised Analyses of Time-Series Studies of Air Pollution and Health, vol. Special Report, pp. 25-72
[292] E. Samoli et al., "Estimating the exposure- response relationships between particulate matter and mortality within the APHEA multicity project.(Research)," Environmental Health Perspectives, vol. 113, no. 1, p. 88, 2005, doi: 10.1289/ehp.7387.
[293] X. Lin, K. Willeke, V. Ulevicius, and S. Grinshpun, "Effect of Sampling Time on the Collection Efficiency of All-Glass Impingers,"
American Industrial Hygiene Association Journal, vol. 58, no. 7, pp. 480-488, 1997, doi: 10.1080/15428119791012577. [294] D. Schmechel et al., "A Two- stage Personal Cyclone Sampler for the Collection of Fungal Aerosols and Direct ELISA and PCR Sample
Analysis," vol. 119, ed, 2007, pp. S188-S188.
[295] Glen E Duncan et al., "Using the design-feedback iterative cycle to improve the usability of a personal air pollution monitor," Submitted to Environmental Health ENHE-D-18-00238, July 2018.
[296] T.-Y. Wen, I. Krichtafovitch, and A. V. Mamishev, "The key energy performance of novel electrostatic precipitators," Journal of
Building Engineering, vol. 2, pp. 77-84, 2015, doi: 10.1016/j.jobe.2015.04.006. [297] A. Peters et al., "Translocation and potential neurological effects of fine and ultrafine particles a critical update," Particle and fibre
toxicology, vol. 3, no. 1, p. 13, 2006.
[298] S. Fuzzi et al., "Particulate matter, air quality and climate: lessons learned and future needs," Atmospheric chemistry and physics, vol. 15, no. 14, pp. 8217-8299, 2015.
[299] M. Elbayoumi, N. A. Ramli, and N. F. F. Md Yusof, "Spatial and temporal variations in particulate matter concentrations in twelve
schools environment in urban and overpopulated camps landscape," Building and Environment, vol. 90, pp. 157-167, 8// 2015, doi: http://dx.doi.org/10.1016/j.buildenv.2015.03.036.
[300] M. M. Patel et al., "Spatial and Temporal Variations in Traffic-related Particulate Matter at New York City High Schools," Atmospheric
environment (Oxford, England : 1994), vol. 43, no. 32, pp. 4975-4981, 2009, doi: 10.1016/j.atmosenv.2009.07.004. [301] R. A. Dobbins, "Soot inception temperature and the carbonization rate of precursor particles," Combustion and Flame, vol. 130, no. 3,
pp. 204-214, 2002.
194
[302] S. E. Stein and A. Fahr, "High-temperature stabilities of hydrocarbons," The Journal of Physical Chemistry, vol. 89, no. 17, pp. 3714-3725, 1985.
[303] M. Commodo et al., "On the early stages of soot formation: Molecular structure elucidation by high-resolution atomic force
microscopy," Combustion and Flame, vol. 205, pp. 154-164, 2019. [304] D. Chen, J. Akroyd, S. Mosbach, D. Opalka, and M. Kraft, "Solid–liquid transitions in homogenous ovalene, hexabenzocoronene and
circumcoronene clusters: A molecular dynamics study," Combustion and Flame, vol. 162, no. 2, pp. 486-495, 2015.
[305] D. Aubagnac-Karkar, A. El Bakali, and P. Desgroux, "Soot particles inception and PAH condensation modelling applied in a soot model utilizing a sectional method," COMBUSTION AND FLAME, vol. 189, pp. 190-206, 2018.
[306] J. Davis, K. Tiwari, and I. Novosselov, "Soot morphology and nanostructure in complex flame flow patterns via secondary particle
surface growth," Fuel, vol. 245, pp. 447-457, 2019/06/01/ 2019, doi: https://doi.org/10.1016/j.fuel.2019.02.058. [307] J. Davis, "Characterization of combustion generated particulates produced in an inverted gravity flame reactor " Ph.D., University of
Washington, Seattle, 2019.
[308] C. P. West et al., "Molecular Composition and the Optical Properties of Brown Carbon Generated by the Ethane Flame," ACS Earth and Space Chemistry, vol. 4, no. 7, pp. 1090-1103, 2020/07/16 2020, doi: 10.1021/acsearthspacechem.0c00095.
[309] J. Davis, E. Molnar, and I. Novosselov, "Nanostructure transition of young soot aggregates to mature soot aggregates in diluted diffusion
flames," Carbon, vol. 159, pp. 255-265, 2020/04/15/ 2020, doi: https://doi.org/10.1016/j.carbon.2019.12.043. [310] G. Mahamuni et al., "Excitation–Emission Matrix Spectroscopy for Analysis of Chemical Composition of Combustion Generated
Particulate Matter," Environmental Science & Technology, vol. 54, no. 13, pp. 8198-8209, 2020/07/07 2020, doi:
10.1021/acs.est.0c01110. [311] J. J. Cao et al., "Spatial and seasonal variations of atmospheric organic carbon and elemental carbon in Pearl River Delta Region, China,"
Atmospheric Environment, vol. 38, no. 27, pp. 4447-4456, 2004/09/01/ 2004, doi: 10.1016/j.atmosenv.2004.05.016.
[312] J. C. Chow, J. G. Watson, L. W. A. Chen, J. Rice, and N. H. Frank, "Quantification of PM2.5 organic carbon sampling artifacts in US networks," (in English), Atmospheric Chemistry and Physics, vol. 10, no. 12, pp. 5223-5239, 2010/06/15/ 2010, doi:
https://doi.org/10.5194/acp-10-5223-2010. [313] P. Lin, L. T. Fleming, S. A. Nizkorodov, J. Laskin, and A. Laskin, "Comprehensive Molecular Characterization of Atmospheric Brown
Carbon by High Resolution Mass Spectrometry with Electrospray and Atmospheric Pressure Photoionization," Analytical Chemistry,
vol. 90, no. 21, pp. 12493-12502, 2018/11/06/ 2018, doi: 10.1021/acs.analchem.8b02177. [314] Y. Wei, I.-K. Han, M. Hu, M. Shao, J. Zhang, and X. Tang, "Personal exposure to particulate PAHs and anthraquinone and oxidative
DNA damages in humans," Chemosphere, vol. 81, no. 10, pp. 1280-1285, 2010/11/01/ 2010, doi: 10.1016/j.chemosphere.2010.08.055.
[315] S. Bonetta et al., "DNA damage in A549 cells exposed to different extracts of PM2.5 from industrial, urban and highway sites," Chemosphere, vol. 77, no. 7, pp. 1030-1034, 2009/11/01/ 2009, doi: 10.1016/j.chemosphere.2009.07.076.
[316] Y. Wei, I.-K. Han, M. Shao, M. Hu, J. Zhang, and X. Tang, "PM2.5 Constituents and Oxidative DNA Damage in Humans," Environ.
Sci. Technol., vol. 43, no. 13, pp. 4757-4762, 2009/07/01/ 2009, doi: 10.1021/es803337c. [317] V. Samburova, B. Zielinska, and A. Khlystov, "Do 16 Polycyclic Aromatic Hydrocarbons Represent PAH Air Toxicity?," Toxics, vol.
5, no. 3, 2017/08/15/ 2017, doi: 10.3390/toxics5030017.
[318] IARC, Some non-heterocyclic polycyclic aromatic hydrocarbons and some related exposures (International Agency for Research on Cancer monographs on the evaluation of carcinogenic risks to humans). Lyon, France: Geneva: IARC Press, International Agency for
Research on Cancer, 2010.
[319] I. Berlman, Handbook of florescence spectra of Aromatic Molecules. Elsevier (in en), 2012, p. 488. [320] H. J. Lee, A. Laskin, J. Laskin, and S. A. Nizkorodov, "Excitation–emission spectra and fluorescence quantum yields for fresh and aged
biogenic secondary organic aerosols," Environmental science & technology, vol. 47, no. 11, pp. 5763-5770, 2013.
[321] S. M. Phillips and G. D. Smith, "Further evidence for charge transfer complexes in brown carbon aerosols from excitation–emission matrix fluorescence spectroscopy," The Journal of Physical Chemistry A, vol. 119, no. 19, pp. 4545-4551, 2015.
[322] Q. Chen, F. Ikemori, and M. Mochida, "Light absorption and excitation–emission fluorescence of urban organic aerosol components
and their relationship to chemical structure," Environmental Science & Technology, vol. 50, no. 20, pp. 10859-10868, 2016. [323] J. T. Matos, S. M. Freire, R. M. Duarte, and A. C. Duarte, "Natural organic matter in urban aerosols: Comparison between water and
alkaline soluble components using excitation–emission matrix fluorescence spectroscopy and multiway data analysis," Atmospheric
Environment, vol. 102, pp. 1-10, 2015. [324] J. W. Rutherford et al., "Excitation emission matrix fluorescence spectroscopy for combustion generated particulate matter source
identification," Atmospheric Environment, vol. 220, p. 117065, 2020/01/01/ 2020, doi: https://doi.org/10.1016/j.atmosenv.2019.117065.
[325] J. W. Rutherford, "Source Apportionment of Combustion Generated Particulate Matter Air Pollution using Excitation Emission Matrix Fluorescence Spectroscopy and Machine Learning," 2019.
[326] T. Aizawa and H. Kosaka, "Investigation of early soot formation process in a diesel spray flame via excitation—emission matrix using
a multi-wavelength laser source," International Journal of Engine Research, vol. 9, no. 1, pp. 79-97, 2008, doi: 10.1243/14680874JER01407.
[327] K. Booksh, A. Muroski, and M. Myrick, "Single-measurement excitation/emission matrix spectrofluorometer for determination of
hydrocarbons in ocean water. 2. Calibration and quantitation of naphthalene and styrene," Analytical Chemistry, vol. 68, no. 20, pp. 3539-3544, 1996, doi: 10.1021/ac9602534.
[328] R. D. Jiji, G. A. Cooper, and K. S. Booksh, "Excitation-emission matrix fluorescence based determination of carbamate pesticides and
polycyclic aromatic hydrocarbons," Analytica Chimica Acta, vol. 397, no. 1, pp. 61-72, 1999, doi: 10.1016/S0003-2670(99)00392-X. [329] G. Mahamuni et al., "Solid-phase excitation-emission matrix spectroscopy for chemical analysis of combustion aerosols," PLOS ONE,
vol. 16, no. 5, p. e0251664, 2021, doi: 10.1371/journal.pone.0251664.
[330] G. Mahamuni, "Excitation Emission Matrix Fluorescence Spectroscopy based Sensing of Combustion Generated Particulate Matter," Ph.D., Mechanical Engineering, University of Washington, 2020.
[331] J. W. Rutherford, T. V. Larson, T. Gould, E. Seto, I. V. Novosselov, and J. D. Posner, "Source apportionment of environmental
combustion sources using excitation emission matrix fluorescence spectroscopy and machine learning," Atmospheric Environment, vol. 259, p. 118501, 2021/08/15/ 2021, doi: https://doi.org/10.1016/j.atmosenv.2021.118501.
[332] S. Peronaci and M. Baselli, Aerodynamics of an airfoil with plasma actuators of different kinds and geometries. Thesis (M.S.) -
Politecnico di Milano, 2015.
195
[333] P. Fillingham, K. Kottapalli, X. Zhan, and I. V. Novosselov, "Characterization of adhesion force in aerodynamic particle resuspension," Journal of aerosol science, vol. 128, pp. 89-98, 2019, doi: 10.1016/j.jaerosci.2018.11.006.
[334] Z. Lanying, F. Najjar, S. Balachandar, and P. Fischer, "Forces on a finite-sized particle located close to a wall in a linear shear flow,"
Physics of fluids (1994), vol. 21, no. 3, p. 33302, 2009, doi: 10.1063/1.3082232. [335] A. Richter and P. A. Nikrityuk, "Drag forces and heat transfer coefficients for spherical, cuboidal and ellipsoidal particles in cross flow
at sub-critical Reynolds numbers," International journal of heat and mass transfer, vol. 55, no. 4, pp. 1343-1354, 2012, doi:
10.1016/j.ijheatmasstransfer.2011.09.005. [336] L. W. Rong, Z. Y. Zhou, and A. B. Yu, "Lattice–Boltzmann simulation of fluid flow through packed beds of uniform ellipsoids," Powder
technology, vol. 285, pp. 146-156, 2015, doi: 10.1016/j.powtec.2015.06.047.
[337] C. Ke, S. Shu, H. Zhang, H. Yuan, and D. Yang, "On the drag coefficient and averaged Nusselt number of an ellipsoidal particle in a fluid," Powder technology, vol. 325, pp. 134-144, 2018, doi: 10.1016/j.powtec.2017.10.049.

196
APPENDIX A. SEPARATION CONTROL USING CORONA AND
DBD ACTUATOR
In this chapter, we study the effect of plasma actuators on aerodynamic forces on a NACA
0012 airfoil. The force measurements in the wind tunnel are done for two different kinds of plasma
actuators 1. Corona actuator 2. DBD actuator. These quantitative results are followed by
qualitative analysis like aerodynamic force coefficient augmentation, and electro-mechanical
efficiencies.
A.1. PLASMA ACTUATORS
In this thesis, we have considered two different tip angles 300 & 600 for the serrated/saw tooth
electrodes as shown in Figure A.1. The plasma actuators consist of copper electrodes made from
0.05 mm thick foil. All the electrodes have a 350 mm working span to have enough tips. The
sawtooth electrodes are fabricated using electro-discharge machining. All the cathode electrodes
were made of 25 mm wide, 0.05 mm thick copper tape exception of the cathode of the corona,
which was a copper rod with a diameter of 1.6 mm.
(1)
(2)
Figure A.1. Electrodes under test, 1 is the multi-tip electrode with a fine pitch of 5 mm and 2 is
the multi-tip electrode with a coarse pitch of 10 mm.
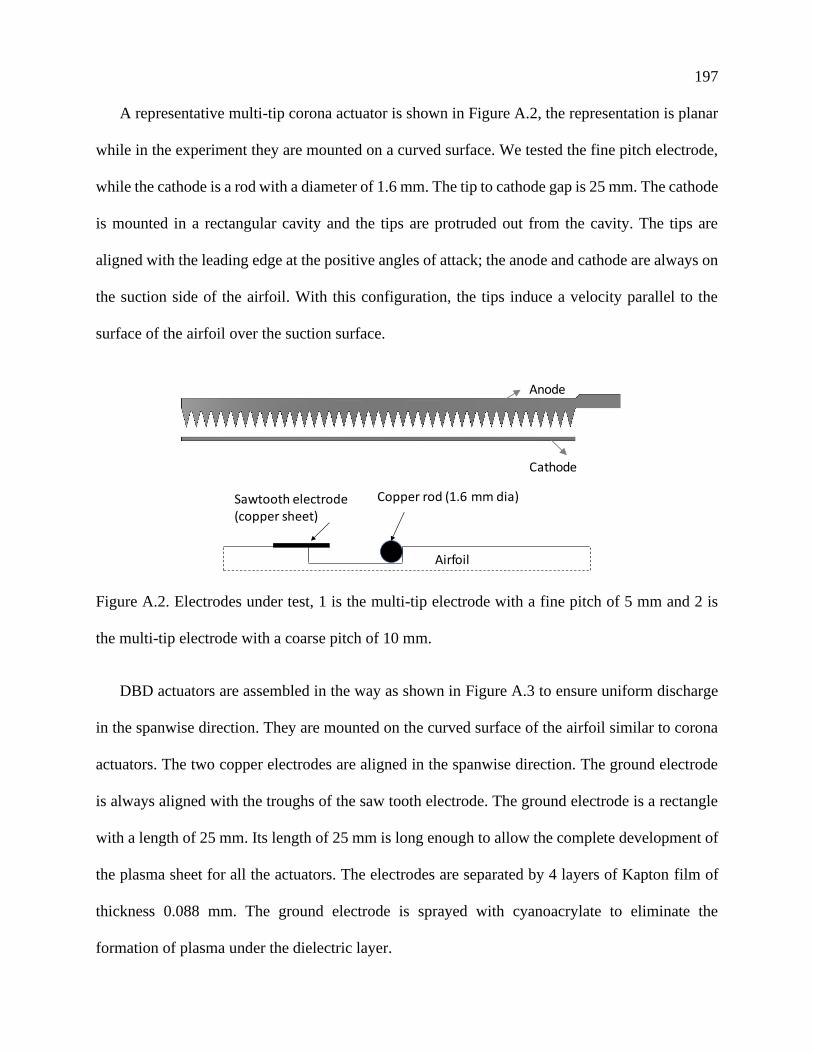
197
A representative multi-tip corona actuator is shown in Figure A.2, the representation is planar
while in the experiment they are mounted on a curved surface. We tested the fine pitch electrode,
while the cathode is a rod with a diameter of 1.6 mm. The tip to cathode gap is 25 mm. The cathode
is mounted in a rectangular cavity and the tips are protruded out from the cavity. The tips are
aligned with the leading edge at the positive angles of attack; the anode and cathode are always on
the suction side of the airfoil. With this configuration, the tips induce a velocity parallel to the
surface of the airfoil over the suction surface.
Figure A.2. Electrodes under test, 1 is the multi-tip electrode with a fine pitch of 5 mm and 2 is
the multi-tip electrode with a coarse pitch of 10 mm.
DBD actuators are assembled in the way as shown in Figure A.3 to ensure uniform discharge
in the spanwise direction. They are mounted on the curved surface of the airfoil similar to corona
actuators. The two copper electrodes are aligned in the spanwise direction. The ground electrode
is always aligned with the troughs of the saw tooth electrode. The ground electrode is a rectangle
with a length of 25 mm. Its length of 25 mm is long enough to allow the complete development of
the plasma sheet for all the actuators. The electrodes are separated by 4 layers of Kapton film of
thickness 0.088 mm. The ground electrode is sprayed with cyanoacrylate to eliminate the
formation of plasma under the dielectric layer.
Anode
Cathode
Copper rod (1.6 mm dia)Sawtooth electrode (copper sheet)
Airfoil
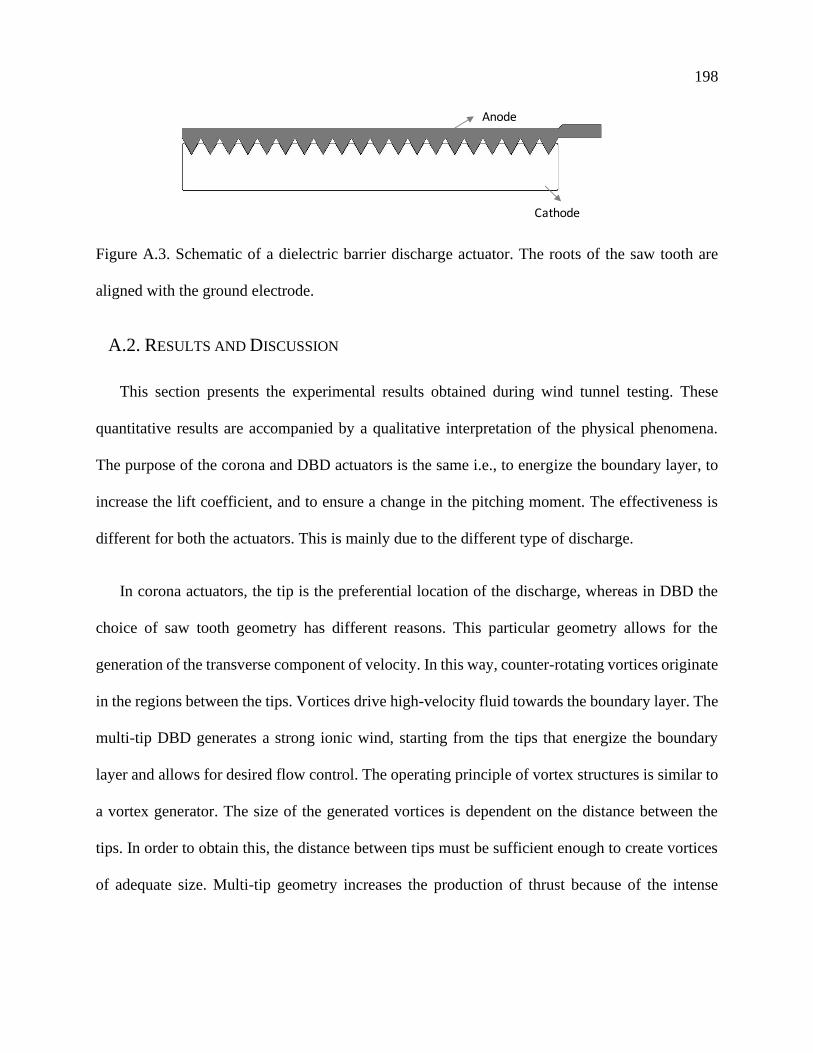
198
Figure A.3. Schematic of a dielectric barrier discharge actuator. The roots of the saw tooth are
aligned with the ground electrode.
A.2. RESULTS AND DISCUSSION
This section presents the experimental results obtained during wind tunnel testing. These
quantitative results are accompanied by a qualitative interpretation of the physical phenomena.
The purpose of the corona and DBD actuators is the same i.e., to energize the boundary layer, to
increase the lift coefficient, and to ensure a change in the pitching moment. The effectiveness is
different for both the actuators. This is mainly due to the different type of discharge.
In corona actuators, the tip is the preferential location of the discharge, whereas in DBD the
choice of saw tooth geometry has different reasons. This particular geometry allows for the
generation of the transverse component of velocity. In this way, counter-rotating vortices originate
in the regions between the tips. Vortices drive high-velocity fluid towards the boundary layer. The
multi-tip DBD generates a strong ionic wind, starting from the tips that energize the boundary
layer and allows for desired flow control. The operating principle of vortex structures is similar to
a vortex generator. The size of the generated vortices is dependent on the distance between the
tips. In order to obtain this, the distance between tips must be sufficient enough to create vortices
of adequate size. Multi-tip geometry increases the production of thrust because of the intense
Cathode
Anode
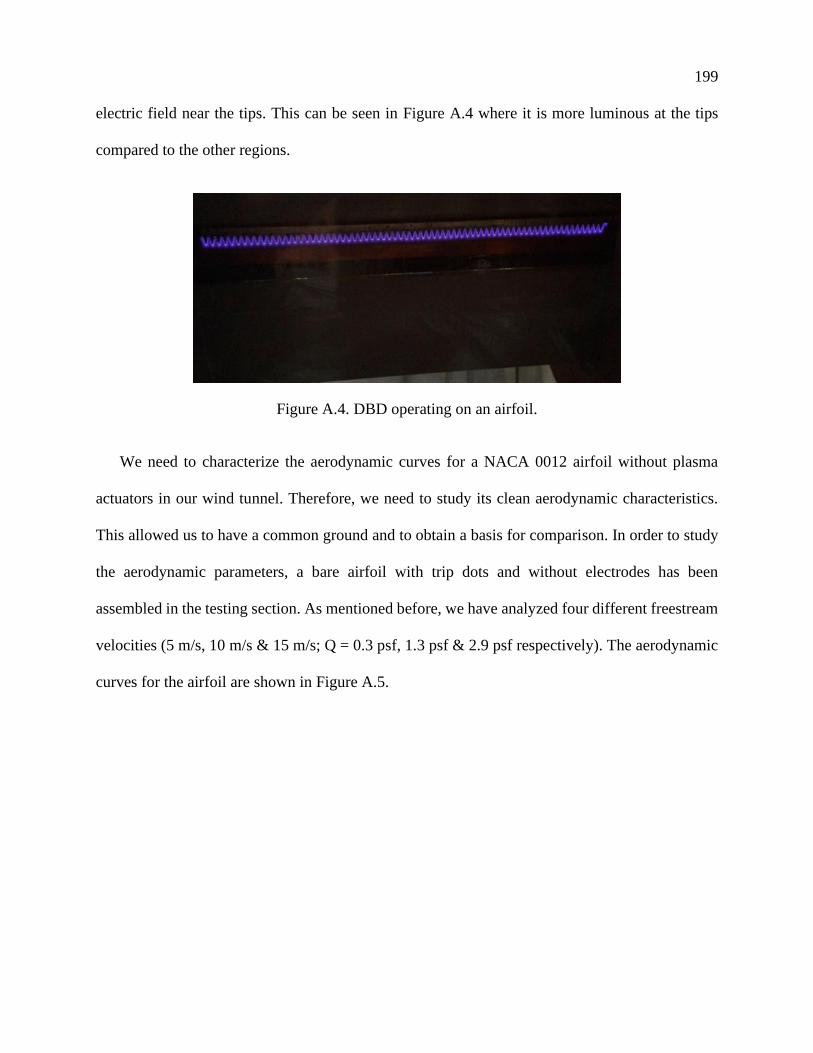
199
electric field near the tips. This can be seen in Figure A.4 where it is more luminous at the tips
compared to the other regions.
Figure A.4. DBD operating on an airfoil.
We need to characterize the aerodynamic curves for a NACA 0012 airfoil without plasma
actuators in our wind tunnel. Therefore, we need to study its clean aerodynamic characteristics.
This allowed us to have a common ground and to obtain a basis for comparison. In order to study
the aerodynamic parameters, a bare airfoil with trip dots and without electrodes has been
assembled in the testing section. As mentioned before, we have analyzed four different freestream
velocities (5 m/s, 10 m/s & 15 m/s; Q = 0.3 psf, 1.3 psf & 2.9 psf respectively). The aerodynamic
curves for the airfoil are shown in Figure A.5.
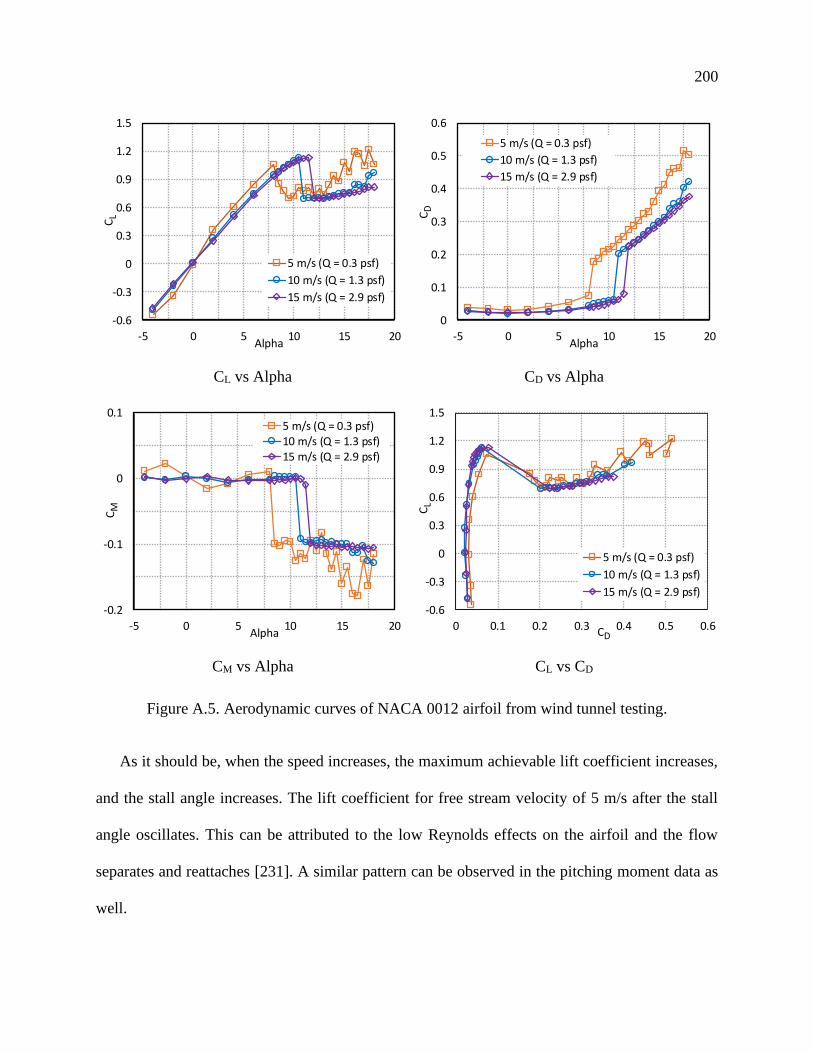
200
CL vs Alpha CD vs Alpha
CM vs Alpha CL vs CD
Figure A.5. Aerodynamic curves of NACA 0012 airfoil from wind tunnel testing.
As it should be, when the speed increases, the maximum achievable lift coefficient increases,
and the stall angle increases. The lift coefficient for free stream velocity of 5 m/s after the stall
angle oscillates. This can be attributed to the low Reynolds effects on the airfoil and the flow
separates and reattaches [231]. A similar pattern can be observed in the pitching moment data as
well.
-0.6
-0.3
0
0.3
0.6
0.9
1.2
1.5
-5 0 5 10 15 20
CL
Alpha
5 m/s (Q = 0.3 psf)
10 m/s (Q = 1.3 psf)
15 m/s (Q = 2.9 psf)
0
0.1
0.2
0.3
0.4
0.5
0.6
-5 0 5 10 15 20
CD
Alpha
5 m/s (Q = 0.3 psf)
10 m/s (Q = 1.3 psf)
15 m/s (Q = 2.9 psf)
-0.2
-0.1
0
0.1
-5 0 5 10 15 20
CM
Alpha
5 m/s (Q = 0.3 psf)10 m/s (Q = 1.3 psf)15 m/s (Q = 2.9 psf)
-0.6
-0.3
0
0.3
0.6
0.9
1.2
1.5
0 0.1 0.2 0.3 0.4 0.5 0.6
CL
CD
5 m/s (Q = 0.3 psf)
10 m/s (Q = 1.3 psf)
15 m/s (Q = 2.9 psf)
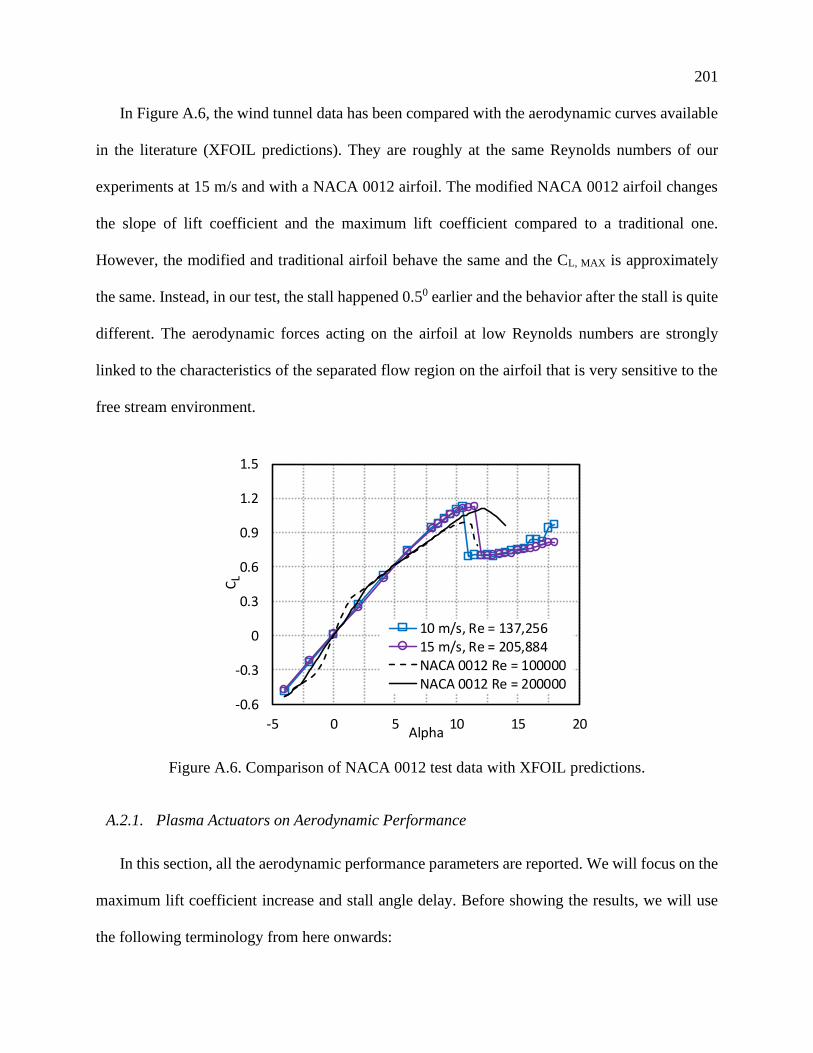
201
In Figure A.6, the wind tunnel data has been compared with the aerodynamic curves available
in the literature (XFOIL predictions). They are roughly at the same Reynolds numbers of our
experiments at 15 m/s and with a NACA 0012 airfoil. The modified NACA 0012 airfoil changes
the slope of lift coefficient and the maximum lift coefficient compared to a traditional one.
However, the modified and traditional airfoil behave the same and the CL, MAX is approximately
the same. Instead, in our test, the stall happened 0.50 earlier and the behavior after the stall is quite
different. The aerodynamic forces acting on the airfoil at low Reynolds numbers are strongly
linked to the characteristics of the separated flow region on the airfoil that is very sensitive to the
free stream environment.
Figure A.6. Comparison of NACA 0012 test data with XFOIL predictions.
A.2.1. Plasma Actuators on Aerodynamic Performance
In this section, all the aerodynamic performance parameters are reported. We will focus on the
maximum lift coefficient increase and stall angle delay. Before showing the results, we will use
the following terminology from here onwards:
-0.6
-0.3
0
0.3
0.6
0.9
1.2
1.5
-5 0 5 10 15 20
CL
Alpha
10 m/s, Re = 137,25615 m/s, Re = 205,884NACA 0012 Re = 100000NACA 0012 Re = 200000
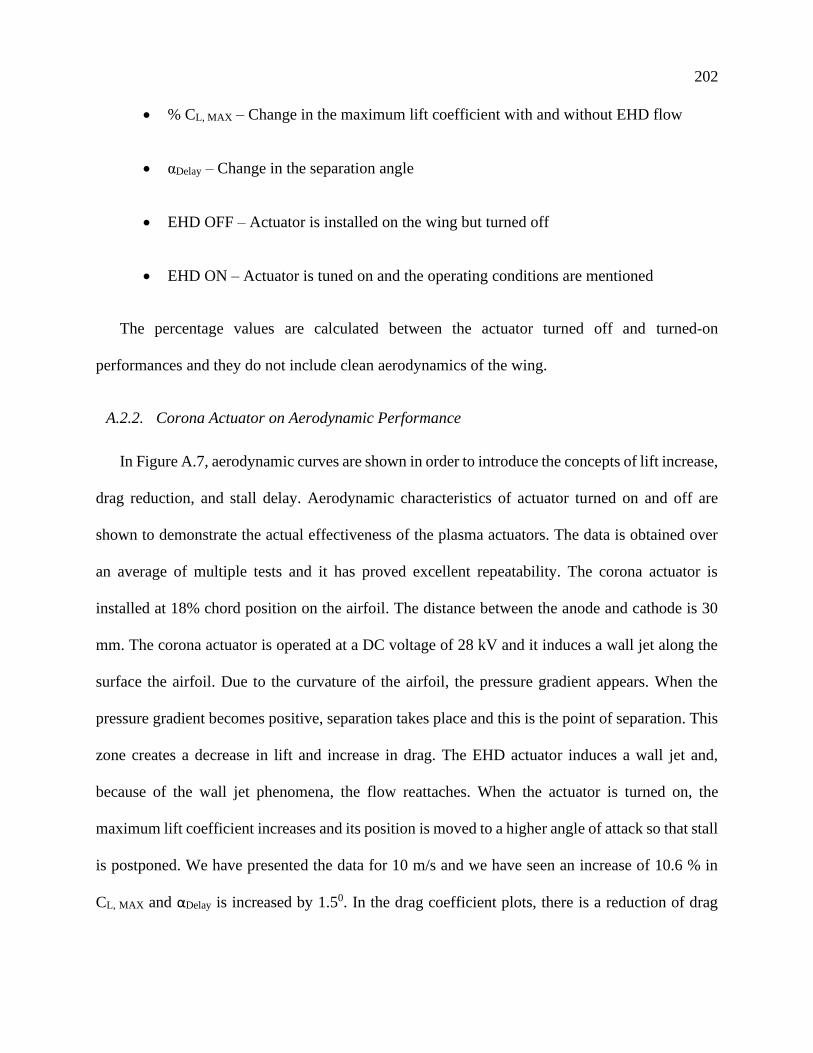
202
• % CL, MAX – Change in the maximum lift coefficient with and without EHD flow
• αDelay – Change in the separation angle
• EHD OFF – Actuator is installed on the wing but turned off
• EHD ON – Actuator is tuned on and the operating conditions are mentioned
The percentage values are calculated between the actuator turned off and turned-on
performances and they do not include clean aerodynamics of the wing.
A.2.2. Corona Actuator on Aerodynamic Performance
In Figure A.7, aerodynamic curves are shown in order to introduce the concepts of lift increase,
drag reduction, and stall delay. Aerodynamic characteristics of actuator turned on and off are
shown to demonstrate the actual effectiveness of the plasma actuators. The data is obtained over
an average of multiple tests and it has proved excellent repeatability. The corona actuator is
installed at 18% chord position on the airfoil. The distance between the anode and cathode is 30
mm. The corona actuator is operated at a DC voltage of 28 kV and it induces a wall jet along the
surface the airfoil. Due to the curvature of the airfoil, the pressure gradient appears. When the
pressure gradient becomes positive, separation takes place and this is the point of separation. This
zone creates a decrease in lift and increase in drag. The EHD actuator induces a wall jet and,
because of the wall jet phenomena, the flow reattaches. When the actuator is turned on, the
maximum lift coefficient increases and its position is moved to a higher angle of attack so that stall
is postponed. We have presented the data for 10 m/s and we have seen an increase of 10.6 % in
CL, MAX and αDelay is increased by 1.50. In the drag coefficient plots, there is a reduction of drag
203
coefficient for all the angles of attack and we can see a reduction of drag at 110 and the increase in
lift force. The drag coefficient is decreased by ~70% until 110
(a) (b)
Figure A.7. Corona actuator performance on (a) lift and (b) drag coefficients for free stream
velocity of 10 m/s (Re = 134,089).
A.2.3. DBD Actuator on Aerodynamic Performance
Aerodynamic performance of the airfoil by DBD actuators is discussed in this section. DBD
actuators are usually two metal sheets flush mounted between a dielectric layer and an alternating
voltage is applied between the electrodes. We have installed the electrodes on two different
positions on the airfoil 18% and 25% of the chord. Lift, drag and pitching moment characteristics
of the airfoil with and without EHD flow generated by DBD are given in Figure A.8 and Figure
A.9. We have determined the aerodynamic parameters for two different free stream velocities (5
m/s & 10 m/s). For the free stream velocity of 5 m/s, EHD phenomenon is noticeable at a lower
angle of attacks, whereas with the increase of free stream velocity EHD phenomenon is not as
significant as it is at 5m/s free stream velocity. Due to the entrainment of the flow by the EHD, the
-0.2
0
0.2
0.4
0.6
0.8
1
1.2
0 5 10 15 20
Lift
Co
effi
cien
t, C
L
Angle of Attack, α
EHD OFF
EHD ON
-0.05
0
0.05
0.1
0.15
0.2
0.25
0 5 10 15 20D
rag
Co
effi
cien
t, C
DAngle of Attack, α
EHD OFF
EHD ON
204
surface pressure distribution changes, which leads to the increase in lift coefficient. The maximum
lift coefficient and the stall angle in all the cases have increased. The CL,MAX has increased by
28.8% and 5% when the actuator is at 18% chord and 26.22% and 8.9% when the actuator is at
25% chord for free stream velocities of 5 m/s and 10 m/s respectively. Similar results are reported
in the literature as well [332]. As the lift force has increased due to EHD, which in turn creates a
moment and this additional moment created on the airfoil can be used to control the aircraft. The
actuators are operated at 13.5 kV p-p, 2 kHz sinusoidal wave.
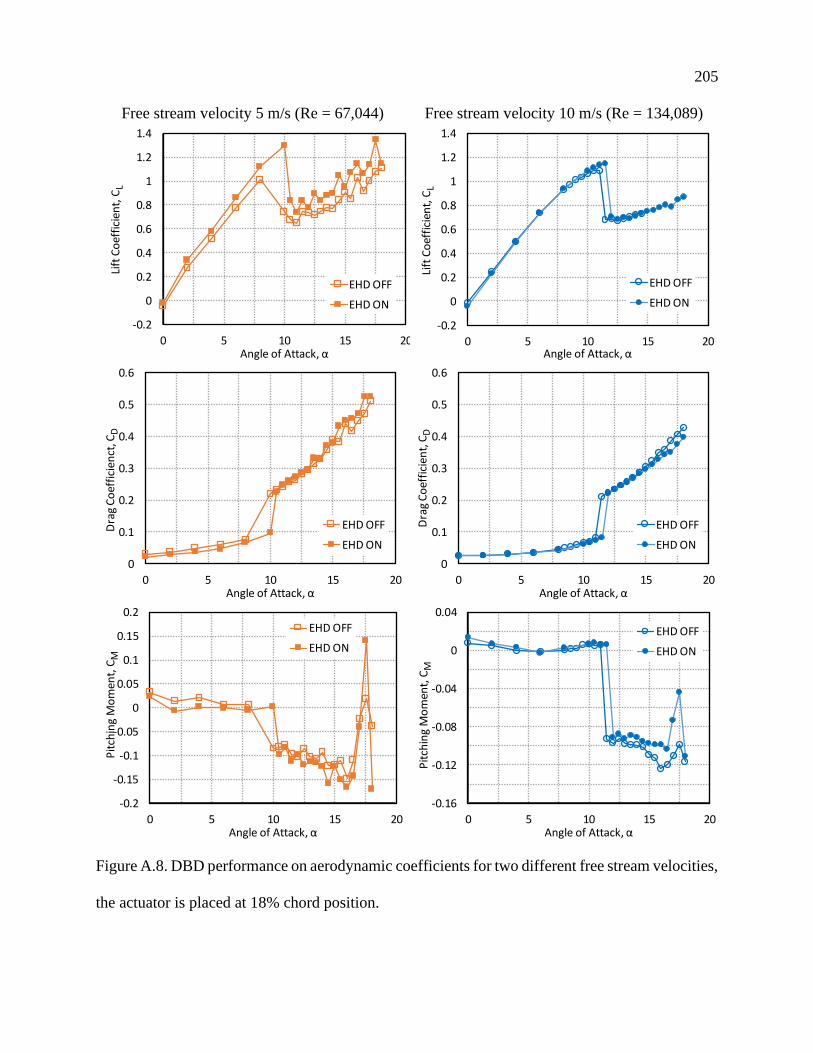
205
Free stream velocity 5 m/s (Re = 67,044) Free stream velocity 10 m/s (Re = 134,089)
Figure A.8. DBD performance on aerodynamic coefficients for two different free stream velocities,
the actuator is placed at 18% chord position.
-0.2
0
0.2
0.4
0.6
0.8
1
1.2
1.4
0 5 10 15 20
Lift
Co
effi
cien
t, C
L
Angle of Attack, α
EHD OFF
EHD ON
-0.2
0
0.2
0.4
0.6
0.8
1
1.2
1.4
0 5 10 15 20
Lift
Co
effi
cien
t, C
L
Angle of Attack, α
EHD OFF
EHD ON
0
0.1
0.2
0.3
0.4
0.5
0.6
0 5 10 15 20
Dra
g C
oef
fici
enct
, CD
Angle of Attack, α
EHD OFF
EHD ON
0
0.1
0.2
0.3
0.4
0.5
0.6
0 5 10 15 20
Dra
g C
oef
fici
ent,
CD
Angle of Attack, α
EHD OFF
EHD ON
-0.2
-0.15
-0.1
-0.05
0
0.05
0.1
0.15
0.2
0 5 10 15 20
Pit
chin
g M
om
ent,
CM
Angle of Attack, α
EHD OFF
EHD ON
-0.16
-0.12
-0.08
-0.04
0
0.04
0 5 10 15 20
Pit
chin
g M
om
ent,
CM
Angle of Attack, α
EHD OFF
EHD ON
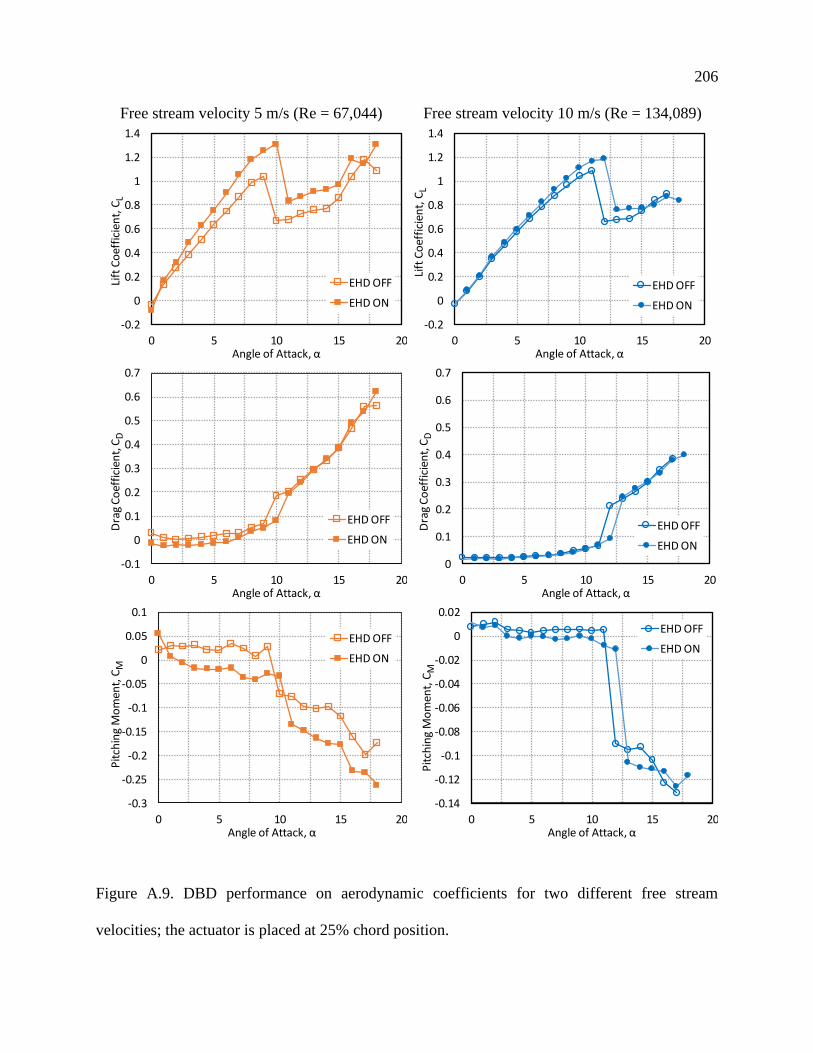
206
Free stream velocity 5 m/s (Re = 67,044) Free stream velocity 10 m/s (Re = 134,089)
Figure A.9. DBD performance on aerodynamic coefficients for two different free stream
velocities; the actuator is placed at 25% chord position.
-0.2
0
0.2
0.4
0.6
0.8
1
1.2
1.4
0 5 10 15 20
Lift
Co
effi
cien
t, C
L
Angle of Attack, α
EHD OFF
EHD ON
-0.2
0
0.2
0.4
0.6
0.8
1
1.2
1.4
0 5 10 15 20
Lift
Co
effi
cien
t, C
L
Angle of Attack, α
EHD OFF
EHD ON
-0.1
0
0.1
0.2
0.3
0.4
0.5
0.6
0.7
0 5 10 15 20
Dra
g C
oef
fici
ent,
CD
Angle of Attack, α
EHD OFF
EHD ON
0
0.1
0.2
0.3
0.4
0.5
0.6
0.7
0 5 10 15 20
Dra
g C
oef
fici
ent,
CD
Angle of Attack, α
EHD OFF
EHD ON
-0.3
-0.25
-0.2
-0.15
-0.1
-0.05
0
0.05
0.1
0 5 10 15 20
Pit
chin
g M
om
ent,
CM
Angle of Attack, α
EHD OFF
EHD ON
-0.14
-0.12
-0.1
-0.08
-0.06
-0.04
-0.02
0
0.02
0 5 10 15 20
Pit
chin
g M
om
ent,
CM
Angle of Attack, α
EHD OFF
EHD ON
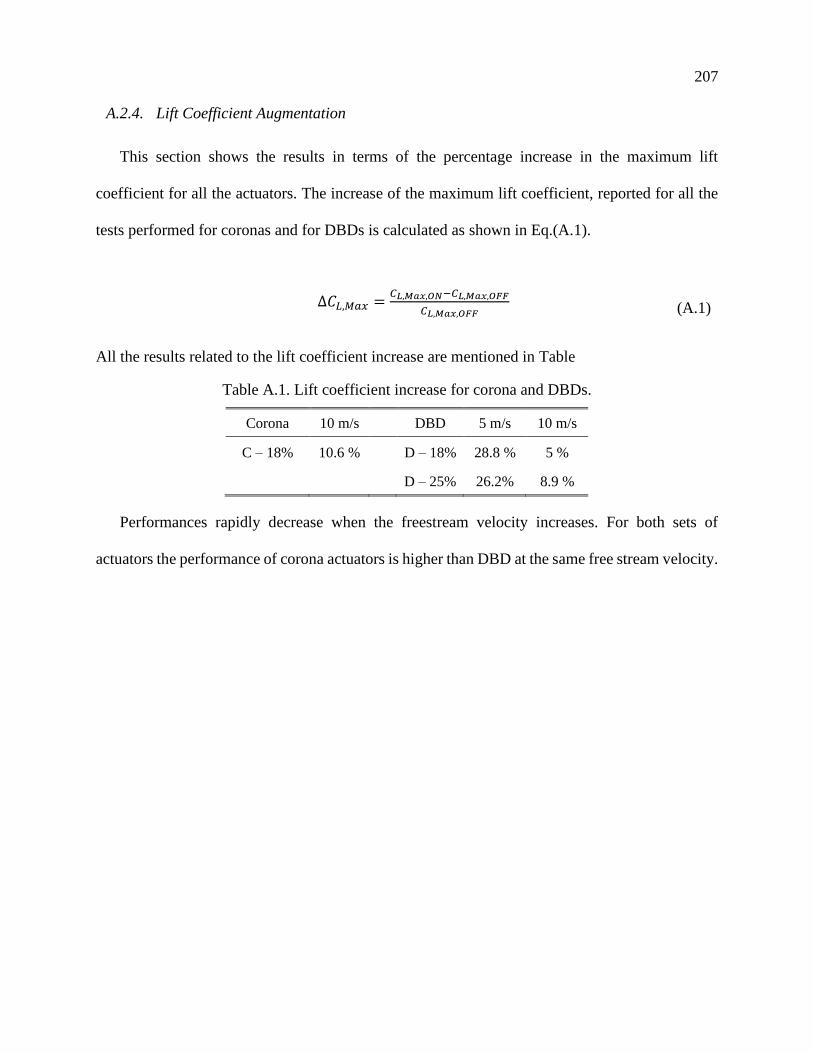
207
A.2.4. Lift Coefficient Augmentation
This section shows the results in terms of the percentage increase in the maximum lift
coefficient for all the actuators. The increase of the maximum lift coefficient, reported for all the
tests performed for coronas and for DBDs is calculated as shown in Eq.(A.1).
Δ𝐶𝐿,𝑀𝑎𝑥 =𝐶𝐿,𝑀𝑎𝑥,𝑂𝑁−𝐶𝐿,𝑀𝑎𝑥,𝑂𝐹𝐹
𝐶𝐿,𝑀𝑎𝑥,𝑂𝐹𝐹 (A.1)
All the results related to the lift coefficient increase are mentioned in Table
Table A.1. Lift coefficient increase for corona and DBDs.
Corona 10 m/s DBD 5 m/s 10 m/s
C – 18% 10.6 % D – 18% 28.8 % 5 %
D – 25% 26.2% 8.9 %
Performances rapidly decrease when the freestream velocity increases. For both sets of
actuators the performance of corona actuators is higher than DBD at the same free stream velocity.
208
APPENDIX B. AERODYNAMIC FORCES ON PROLATE
SPHEROIDS
The aerodynamic forces acting on a spherical particle are well studied and there are currently
no established relations for forces on non-spherical particles. We developed new relations for drag
coefficient on prolate-spheroidal particles attached to a surface in a linear shear flow and in
uniform flow using direct numerical simulations. Some of the work is published in Powder
Technology [10].
B.1. METHODOLOGY
B.1.1. Problem Description
Typical particles of interest for aerodynamic resampling will be on the order of microns in
height, and therefore under any aerodynamic removal scenario will be resting in the linear viscous
sublayer [333]. Particles lie with their long axis parallel to the surface. In this chapter, rigid prolate
spheroids resting on the surface parallel to their long axis in a linear shear flow. The x-,y- and z-
coordinates represent the streamwise, wall-normal and spanwise directions respectively. The
incidence angle 𝜃 is defined as the rotation of the spheroid about the y-axis, as shown in Figure
B.1.
The aspect ratio (AR), 𝜂, of the particles as the ratio of the major axis to the minor axis
𝜂 =𝑏
𝑎, (B.1)
Such that an aspect ratio of 1 represents a sphere. In this work for particle in linear shear flow,
aspect ratios of 1.5, 2,3 and 5 each at angles of 00, 300, 450, 600 and 900. For particle study in
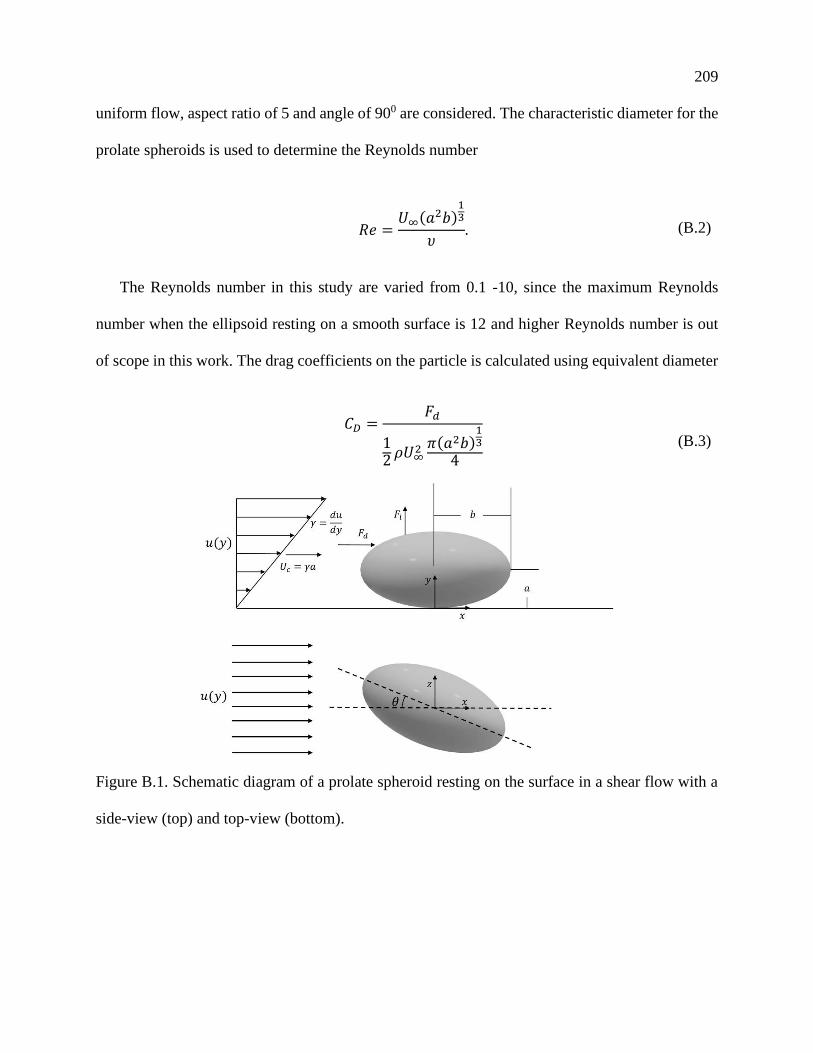
209
uniform flow, aspect ratio of 5 and angle of 900 are considered. The characteristic diameter for the
prolate spheroids is used to determine the Reynolds number
𝑅𝑒 =
𝑈∞(𝑎2𝑏)13
𝜐. (B.2)
The Reynolds number in this study are varied from 0.1 -10, since the maximum Reynolds
number when the ellipsoid resting on a smooth surface is 12 and higher Reynolds number is out
of scope in this work. The drag coefficients on the particle is calculated using equivalent diameter
𝐶𝐷 =𝐹𝑑
12 𝜌𝑈∞
2 𝜋(𝑎2𝑏)13
4
(B.3)
Figure B.1. Schematic diagram of a prolate spheroid resting on the surface in a shear flow with a
side-view (top) and top-view (bottom).
210
B.1.2. Computational Approach
The commercial finite volume solver Ansys Fluent 18.2 was used to solve the three-
dimensional, steady, incompressible Navier Stokes equations. For the particle in uniform flow
case, the computational domain is considered as a large box with dimensions 40 𝑑𝑝 × 15 𝑑𝑝 ×
20 𝑑𝑝. The ellipsoid particle is placed in the centre of the computational domain and an incident
angle of 900. For particle in the linear shear flow case, the computational domain with dimensions
40 𝑑𝑝 × 10 𝑑𝑝 × 20 𝑑𝑝 is considered. To avoid the singularity at the contact point between the
particle and the surface, particles were modelled with a small gap of 0.01 𝑑𝑝 away from the
surface. The width of the domain is only considered as 20 𝑑𝑝, as we have determined that by
increasing the size of the computational domain, the drag and lift coefficient changes are minimal.
Velocity inlet and pressure outlet are applied in this simulation to determine the effects of Reynolds
number on drag coefficient.
B.2. RESULTS AND DISCUSSION
B.2.1. Drag Coefficient - Linear Shear Flow
The drag coefficient for a sphere resting on a surface has been previously studied, and a
relationship based on the Reynolds number has been established [334]
𝐶𝐷 = 1.7009 ×24
𝑅𝑒(1 + 0.104𝑅𝑒0.75) (B.4)
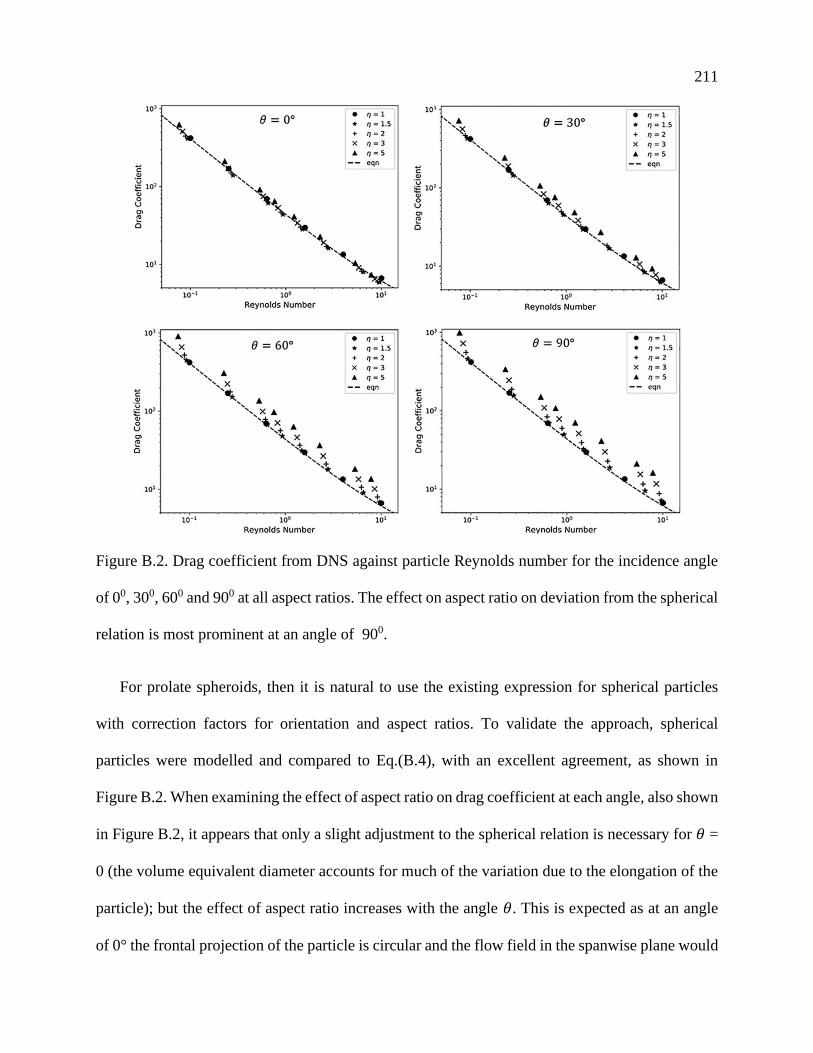
211
Figure B.2. Drag coefficient from DNS against particle Reynolds number for the incidence angle
of 00, 300, 600 and 900 at all aspect ratios. The effect on aspect ratio on deviation from the spherical
relation is most prominent at an angle of 900.
For prolate spheroids, then it is natural to use the existing expression for spherical particles
with correction factors for orientation and aspect ratios. To validate the approach, spherical
particles were modelled and compared to Eq.(B.4), with an excellent agreement, as shown in
Figure B.2. When examining the effect of aspect ratio on drag coefficient at each angle, also shown
in Figure B.2, it appears that only a slight adjustment to the spherical relation is necessary for 𝜃 =
0 (the volume equivalent diameter accounts for much of the variation due to the elongation of the
particle); but the effect of aspect ratio increases with the angle 𝜃. This is expected as at an angle
of 0° the frontal projection of the particle is circular and the flow field in the spanwise plane would
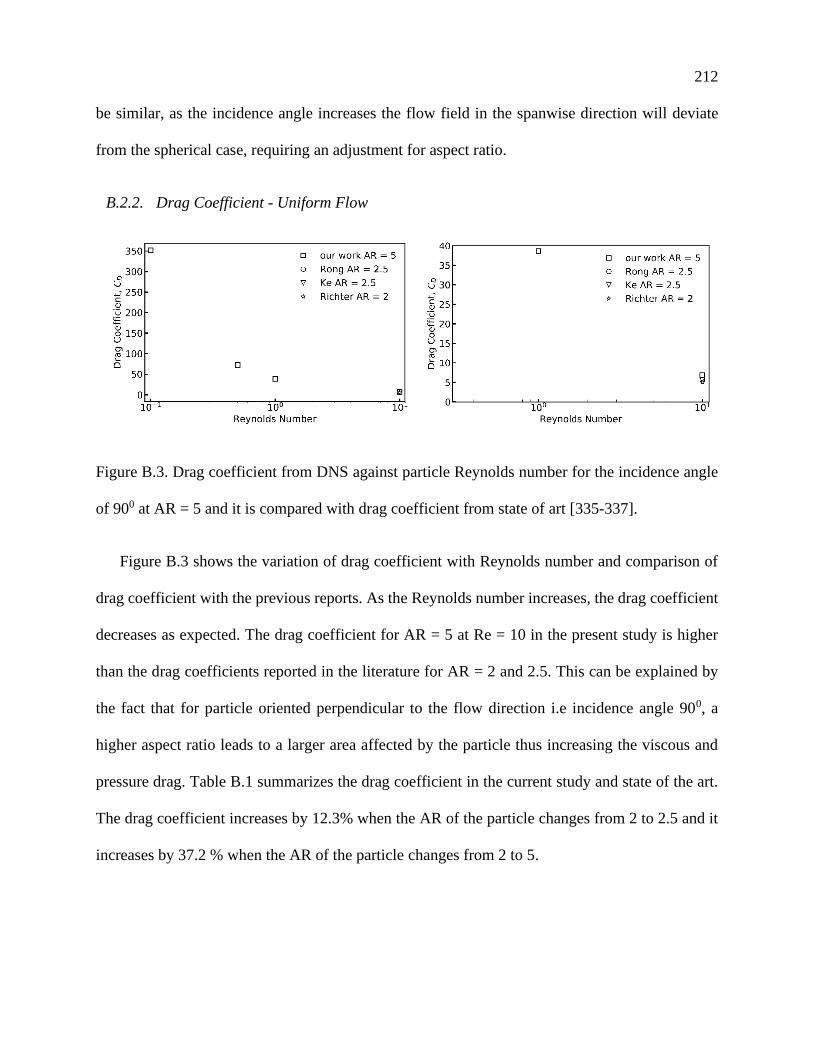
212
be similar, as the incidence angle increases the flow field in the spanwise direction will deviate
from the spherical case, requiring an adjustment for aspect ratio.
B.2.2. Drag Coefficient - Uniform Flow
Figure B.3. Drag coefficient from DNS against particle Reynolds number for the incidence angle
of 900 at AR = 5 and it is compared with drag coefficient from state of art [335-337].
Figure B.3 shows the variation of drag coefficient with Reynolds number and comparison of
drag coefficient with the previous reports. As the Reynolds number increases, the drag coefficient
decreases as expected. The drag coefficient for AR = 5 at Re = 10 in the present study is higher
than the drag coefficients reported in the literature for AR = 2 and 2.5. This can be explained by
the fact that for particle oriented perpendicular to the flow direction i.e incidence angle 900, a
higher aspect ratio leads to a larger area affected by the particle thus increasing the viscous and
pressure drag. Table B.1 summarizes the drag coefficient in the current study and state of the art.
The drag coefficient increases by 12.3% when the AR of the particle changes from 2 to 2.5 and it
increases by 37.2 % when the AR of the particle changes from 2 to 5.
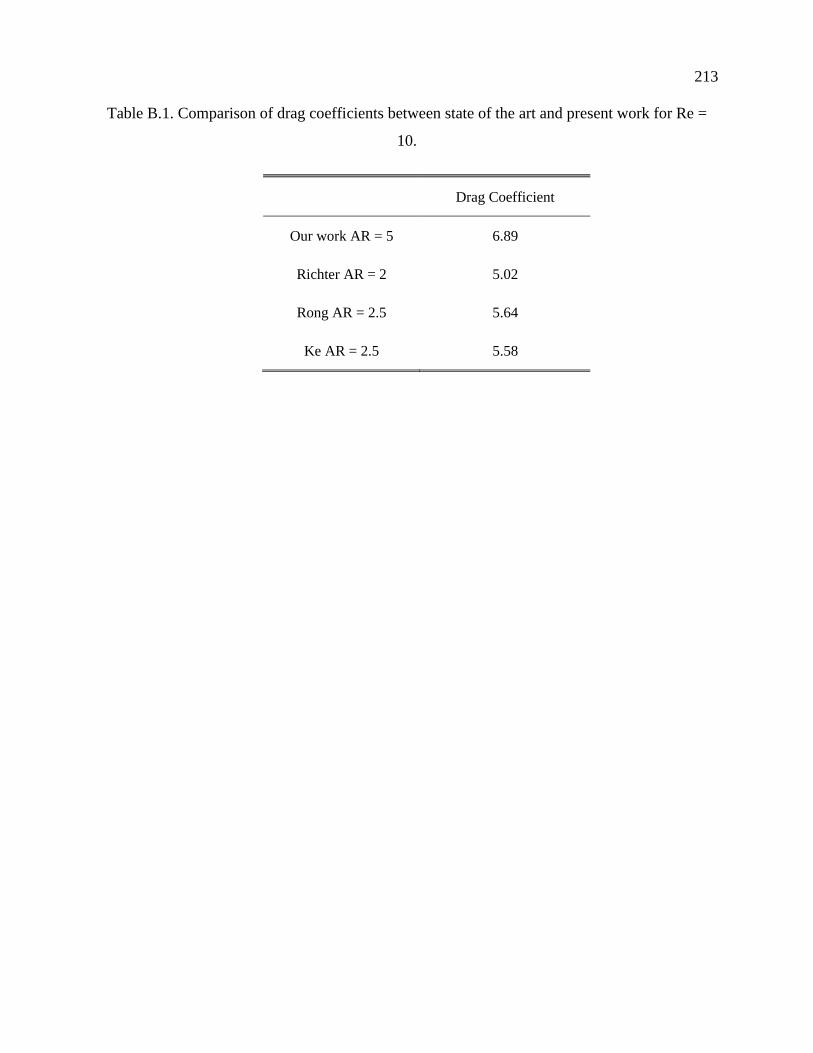
213
Table B.1. Comparison of drag coefficients between state of the art and present work for Re =
10.
Drag Coefficient
Our work AR = 5 6.89
Richter AR = 2 5.02
Rong AR = 2.5 5.64
Ke AR = 2.5 5.58