… · delinquency trajectory on utilization of government resources in the criminal justice...
TRANSCRIPT

NatioNal Crime PreveNtioN CeNtre / CeNtre NatioNal de PréveNtioN du Crime
www.publicsafety.gc.ca/ncpc www.securitepublique.gc.ca/cnpc
crime Acting to prevent
Agir pour prévenir
BETTER BEGINNINGS, BETTER FUTURES STUDY: DELINQUENCY TRAJECTORIES
OF AT-RISK YOUTH
ReseaRch RepoRt 2011-03


1.Queen’sUniversity,PsychologyDepartment, 62ArchStreet,Kingston,Ontario K7L3N62.Queen’sUniversity,BetterBeginnings,BetterFutures, 98BarrieStreet,Kingston,Ontario K7L3N6
BETTER BEGINNINGS, BETTER FUTURES STUDY: DELINQUENCY TRAJECTORIES
OF AT-RISK YOUTH
ReseaRch RepoRt 2011-03
WendyCraig1
KellyPetrunka2
ShahriarKhan2

Published by:NationalCrimePreventionCentre(NCPC)PublicSafetyCanadaOttawa,OntarioCanadaK1A0P8
Visit the Public Safety website and add your name to the NCPC Mailing List: www.PublicSafety.gc.ca/NCPC
Catalogue number: ps18-1/2011e-pDF ISBN: 978-1-100-18384-8
©HerMajestytheQueeninRightofCanada,2011
Thismaterialmaybefreelyreproducedfornon-commercialpurposesprovidedthatthesourceisacknowledged.
La présente publication est aussi disponible en français. Elle s’intitule : ÉtudePartir d’un bon pas pour un avenir meilleur:trajectoiresdeladélinquancedesjeunesàrisque.

1
Table of ContentsExecutive summary ................................................................................................................................................ 2
Introduction .............................................................................................................................................................. 4
Development of Delinquent Behaviours ......................................................................................................... 4
Risk and protective Factors ............................................................................................................................. 5
estimated costs associated with Delinquency .............................................................................................. 6
Objectives of the study .......................................................................................................................................... 7
Method ........................................................................................................................................................................ 8
Results ........................................................................................................................................................................ 11
trajectories of Delinquency ............................................................................................................................. 11
Grade 3 Risk and protective Factors by trajectories of Delinquency ......................................................... 12
Grade 9 outcomes by trajectories of Delinquency ....................................................................................... 16
estimated costs associated with Delinquency trajectories ........................................................................ 18
Discussion ................................................................................................................................................................. 21
Developmental trajectories of Delinquency .................................................................................................. 21
Risk and protective Factors associated with Delinquency trajectories ..................................................... 22
Grade 9 outcomes associated with Delinquency trajectories .................................................................... 24
estimated economic costs associated with Delinquency trajectories ...................................................... 24
Limitations .......................................................................................................................................................... 25
Conclusion ................................................................................................................................................................. 26
References ................................................................................................................................................................. 27
Appendix .................................................................................................................................................................... 30
List of Tables
table 1. estimated costs of Government Resources ................................................................................. 10
table 2. percentage of Boys vs. Girls in each trajectory .......................................................................... 12
table 3. summary of significant Grade 3 Risk Factors by trajectory Group .......................................... 14
table 4. summary of significant Grade 3 protective Factors by trajectory Group ................................ 15
table 5. summary of significant Grade 9 outcomes by trajectory Group .............................................. 17
table 6. Results of estimated Government Resource Utilization by Domain by trajectory Group ....... 20

2
Executive summaryManystudiesofjuveniledelinquencyoverthepasttwodecadeshavefocusedonolder,serious,andviolentjuvenileoffenders.Youngerdelinquentshavebeenignoredpartlybecausetheirnumberisrelativelysmallandtheirthreat isoftennotas immediate.Understandingthetrajectoriesofdelinquencyatayoungageandtheriskandprotectivefactorsassociatedwiththosedevelopmentaltrajectoriescaninformthedevelopmentofearlyriskassessmentsandthedevelopmentoftargetedpreventionandinterventionprograms.Theobjectivesoftheresearchweretoidentifyearlytrajectoriesofdelinquencyforbothboysandgirlsfromage8(Grade3),age11(Grade6),andage14(Grade9)inalongitudinalsampleofat-riskyouthfromamulti-informantperspective,assessriskandprotectivefactorsthatmayinfluencethelikelihoodthatyouthwillengageincriminalbehaviourinadolescence,andexaminewhetheryouthintheidentifieddelinquencytrajectoriesdiffersubstantiallyintermsofdelinquency,involvementwiththecriminaljusticesystem,emotionalandbehaviouralproblems,experienceofabuse,academic/schoolfunctioning,andhealth/healthriskbehaviours.Additionally,thisstudyaimedatestimatingthecostsassociatedwitheachdelinquencytrajectoryonutilizationofgovernmentresourcesinthecriminaljusticesystem,remedialeducation,healthcareandsocialservices,andsocialassistance.
Inordertoexaminetheseresearchquestions,analyseswereconductedusingtheBetter Beginnings, Better Futures data.Thesedatafollowed842childrenlivinginfivedisadvantagedcommunitiesinOntario.ThesamechildrenwereassessedwhentheywereinGrades3,6,and9withmeasureslargelybasedontheNationalLongitudinalSurveyofChildrenandYouth(NLSCY).Threekeyinformantsourceswereusedtoassesschildren’sdelinquency(parents,teachersandself-reportyouthratings).InGrade3,children’slevelsofdelinquencywereassessedbyteachers.InGrade6,thechildrenwereassessedbyparents,teachersandtheyouth,whileinGrade9,theywereassessedbyparentsandtheyouth.Inadditiontotheabove,31riskfactorsand17protectivefactorsfordelinquencywereexaminedwhenthechildrenwereinGrade3.WhenthechildrenwereinGrade9,41outcomemeasureswereexaminedinthefollowingdomains:emotionalandbehaviouralproblems,delinquencyproblems,abuse,involvementwiththecriminaljusticesystem,functioninginschool,andhealthandhealthriskactivities.Finally,monetarycostsassociatedwiththecriminaljusticesystem,remedialeducation,healthcareandsocialservices,andsocialassistancewereestimatedforeachparticipant.
Theliteratureondelinquenttrajectoriesidentifiesthreemaindelinquencygroupsamongchildrenandyouth:alowdelinquencygroup,ahighdelinquencygroup,andadesistingdelinquencygroup.Thetrajectoryanalysesofthecurrentresearchindicatedthatthereweresixdelinquencytrajectorygroups.Childrenintwoofthetrajectorieshadverylowratingsofdelinquencyacrosstime(lowest delinquencygroupandthesecond lowestdelinquencygroup).Twoothertrajectoriesshowedasimilarpatternofdelinquencyratingsthatwasdecreasingovertime.Inthemoderate desistersgroup,childrenhadmoderatelevelsofdelinquencyatGrade3followedbylowlevelsofdelinquencyatGrades6and9.Inthehighest desisters groupchildrenhadthehighestlevelofreporteddelinquencybehavioursatGrade3,followedbyamarkeddecreaseinreporteddelinquencyatGrades6and9.Thefifthtrajectorygroup,namedescalators,hadverylowlevelsofreporteddelinquencyatGrade3andincreasedmarkedlyintheirreporteddelinquencyovertime.ByGrade9,childreninthistrajectorygrouphadthesecondhighestdelinquencyscores.Thefinalgroup,high delinquency,startedwithmoderatelevelsofreporteddelinquencyatGrade3,markedbythehighestreportedlevelsofdelinquencyatGrades6and9ofanyofthetrajectorygroups.
Childrenatriskfordelinquency(i.e.,thoseinthehigh delinquency,escalators,andthetwodesisters trajectorygroups)scoredsignificantlyhigheron17ofthe31individual,family,peer,andneighbourhoodrisk factors.Forexample,children fromthese four trajectorygroupsexperiencedmorehyperactive,oppositional-defiant,andphysicallyaggressivebehaviours;familyriskfactorsincludedsingleparenthood,lessparentaleducation,publichousing,andhostile-ineffectiveparenting.Theseresultshighlighttheneedtofurtherdevelopandrefineassessmenttoolstoincludetheseriskfactorsassociatedwithdelinquency.ByGrade9,thehigh delinquencyandescalatorsgroupsalsohadsignificantlymoreproblemsthanthe
3
Executive summary
othergroups;theyexhibitedmoreemotional/behavioural,health,criminal,andschoolfunctioningproblems.EarlyidentificationatschoolandinvolvementinspecialeducationprogramsearlymayhavesignificantlyreducedthesenegativeoutcomesinGrade9.
Finally,theeconomicanalysesidentifiedthatyouthinthehigh delinquency, escalators,andthetwodesisterstrajectorygroupscostasignificantamountofmoney;forexample,approximately80%oftheestimatedcoststosociety(e.g.,onutilizationofgovernmentresourcesinthecriminal justicesystem,remedialeducation,healthcareandsocialservices,andsocialassistance)werefromthesefourtrajectorygroupswhichrepresent18%ofthesample.Furthermore,80%oftheestimatedcriminaljusticecostswereduetotheyouthinthehigh delinquencyandescalatorsgroups.
Thefindingsof thecurrentstudyhighlightsomekeyconclusions.First, thereareearly indicators tothedevelopmentalpathwaystodelinquency.Theriskfactorsassociatedwithdelinquencyinvolvement(e.g.,inattention/hyperactivityproblems,oppositionaldefiantproblems,lowfamilyfunctioning,havingateenagemother)canbeidentifiedasearlyasGrade3andcaninformtheimplementationofanassessmentand/orscreeningtoolforchildrenandyouthat-riskofdelinquency.Second,delinquencyinvolvementdoesnotjustemerge,itdevelopsovertime,andwithoutintervention,theproblemsaccumulateandmaybecomeseriousandsignificantbyasearlyasGrade9.Third,investmentinprevention,suchaseducationalsupport,canreducecriminaljusticecostsanddelinquencyinvolvement.Themostatriskgroups(high delinquencyandescalatorsgroups)fordelinquencyinvolvementaccountedforthemajorityoftheestimatedreactivecosts(e.g.,criminaljustice,healthcareandsocialservices,socialassistance)andnotthepreventativecosts(e.g.,remedialeducation).Specifically,thehigh delinquencyandescalatorsgroupsaccountedfor46%ofthereactivecostscomparedto32%forthetwodesistersgroupsand22%forthetwolow delinquencygroups;forthepreventativecosts,high delinquencyandescalatorsgroupsaccountedfor38%ofthecostscomparedto44%forthetwodesistergroupsand18%forthetwolow delinquencygroups.
Althoughmoreresearchisneededtounderstandthedelinquencytrajectoriesofgirls,thoseat-riskofdelinquencyappeartorequiremoresupport.Althoughourhighriskgroupofgirlswaslimited,therearesomepreliminaryindicationsfromthisresearchthattheyareataheightenedriskforproblems(e.g.,emotionalproblems,havingdelinquentfriends,policeinvolvement)andtheestimatedcostsassociatedwiththeirproblemsmaybehigherthanforboysbecausetheyappearnotonlythroughthecriminaljusticesystem,butalsothroughthehealthcaresystem.

4
IntroductionDelinquencyisoneofthemostprevalentproblembehavioursengagedinbyCanadianyouth.StatisticsCanada(Savoie,2006)indicatesthatoverone-thirdofyouthhavebeeninvolvedinsomeformofdelinquencyby theageof fourteenand thatchildhooddelinquency tends topredictviolentbehaviours throughoutthecourseofalifetime.Althoughdelinquencycoversawiderangeofbehaviours,manyofwhichdonotgoreportedtothepolice,about5%ofCanadianyouthhavebeenchargedwithfederaloffences(Savoie,2006).Engaginginearlydelinquentbehaviour(i.e.,beforeageten)hasbeenlinkedtonegativepsychological,emotional,health,social,academic,employment,andlatercriminaloutcomes(Boydetal.,2005;Lacourse,Nagin,Tremblay,Vitaro,&Claes,2003).Nonetheless,notallearlystartersgoontobecomeseriousdelinquents.Thegrowingbodyofknowledgethatformsdevelopmentalpreventionscienceallowsfortheidentificationofriskfactorsassociatedwithdelinquency;thedevelopmentofscreeningprocedurestoidentifychildrenatriskofdelinquency;andtheimplementationofpreventiveinterventionforchangingtheriskfactorsassociatedwithdelinquencyandreducingchildren’sprobabilityofengaginginantisocialbehaviour.Inthispaper,weexaminethedevelopmentaltrajectoriesofdelinquency,andtheassociatedindividual,family,peer,andschoolcorrelatesandoutcomesinordertoinformthepreventionofdelinquency.Wealsoprovideaneconomicanalysisofthecostsassociatedwithearlypathwaysassociatedwithdelinquentbehaviours.
Development of Delinquent Behaviours
Severalstudieshaveusedtrajectoryanalysistodistinguishindividualpatternsofdelinquentbehaviourfromchildhoodtoadolescence(e.g.,Hoeve,Blokland,Dubas,Loeber,Gerris,&VanDerLann,2008;Schonberg&Shaw,2007;Wiesner&Windle,2006).Areviewofthesestudieshighlightsseveralimportantthemes.First,onaverage,betweenthreeandsixgroupsofdelinquentbehaviourstendtobeidentifiedbythetrajectorymethodology.Therearethreeconsistenttrajectories(althoughdifferentiallylabelled)acrossthesestudies:alowdelinquencygroup(representingthemajorityofyouthwhorarelyengageindelinquentbehaviour),ahighdelinquencygroup(representingasmallminorityofyouthwithanearlystageofhighlevelofdelinquentbehaviourandincreaseovertime),andadesistingdelinquencygroup(representingaminorityof youthwhostartwithahigh levelofdelinquentbehaviouranddecreasewithtime).Instudieswheremorethanthreetrajectorieshavebeenfound,thethreeconsistentgroupsareusuallysubdividedintoothergroups.Forexample,Lacourse,Côté,Nagin,Vitaro,Brendgen,andTremblay(2002)foundsixtrajectoriesthatincludedthethreeaboveaswellasalowrising,alowdecline,andamediumdeclineofinvolvementincrime.Thesecondimportantconsistencyacrossstudiesisthatbytheendofadolescence,mosttrajectorygroupsareonthedeclinewithrespecttodelinquentbehaviour.
Methodologicaldifferencesmayaccountforsomeofthediscrepanciesinthesestudies’results.First,whileallthestudiesincludedself-reportmeasures,somealsoincludedcourtrecords(Hoeveetal.,2008)andteachers’andparents’ratings(Lacourseetal.,2002).Second,thestudiesvariedwiththegeographicalregion,forexamplesomestudieshaveparticipantsfromurbanUnitedStates(Hoeveetal.,2008)orurbanFrench-speakingCanadians(Lacourseetal.,2002).Third,thestudiesvariedwithrespecttotheageoftheparticipantsandhaveprimarilyfocusedonolderstudents.Fourth,withafewexceptions,thestudiesincludedonlyboys.Althoughfewergirlsthanboysengageinhighlevelsofproblembehaviours,thosegirlswhodostartearlyandpersistinantisocialbehavioursexperiencementalhealthproblemsatlevelsequaltotheirantisocialmalecounterparts(Odgersetal.,2008).Thus,therearelimiteddataavailableonthetrajectoriesofdelinquencyingirls.Fifth,someofthestudiesconceptualizeddelinquencybroadlyandexaminedexternalizingbehaviours(i.e.,conductproblems,physicalaggression,oppositionalbehaviour,hyperactivity)asopposedtodelinquency(definedbyviolationsoftheCriminal Code).Sixth,studiesvariedwithrespecttothenumberofassessmentsandthetimingofassessmentsusedtoderivethetrajectories.Thus,thedifferencesintheshapeandthenumberofthetrajectoriesmayinpartbeinfluencedbytheoperationalizingofdelinquencyandthestudydesign.Despitethesemethodologicaldifferencesacrossstudies,theconsistentfindingofatleastthreesimilartrajectoriesondifferentpopulationsandculturesprovidesstrongtestre-testreliabilityfortheexistenceofthethreemaindelinquenttrajectories.

5
Introduction
Risk and Protective Factors
Identifyingthetrajectoriesofdelinquencyprovidesanunderstandingofhowthisbehaviourchangeswithage,genderandotherriskfactors.Therearetwotypesofriskfactorsthataretypicallydefinedasstaticanddynamic.Staticriskfactorsrefertohistoricalvariablesthatareresistanttochangesuchasageatfirstoffence,priorcriminalhistorywhereasdynamicriskfactorsarechangeable(Andrews&Bonta,1998).Themostusefulriskfactorstoidentifyfromapreventionandinterventionperspectivearedynamic,becausethesefactorsareamenabletochange.Identificationoftheindividual,family,peer,andcommunityriskandprotectivecorrelatesofeachofthetrajectorygroupscanprovidespecificdirectionforthedevelopmentofpreventionandinterventionprograms.
Thedevelopmentofdelinquentbehaviourisinfluencedbyriskandprotectivefactorsresidingbothwithinindividualsandtheirenvironments.Riskfactorsarethosethatleaddirectlytoproblembehaviourwhereasprotective factorsoperate tobuffer risk.Protective factorsgenerally refer to influences thatmodify,ameliorate, or alter a person’s response to some risky environmental conditions that may result inmaladaptivebehaviour.Rutter (1986)pointsout that: (1)protective factorsdonotnecessarilymeanpositiveexperiences;(2)protectivefactorsaredetectableonlyforhigh-riskindividuals;and,(3)protectivefactorscanbenon-environmentalandpartofthebiologicalmake-upoftheindividual.Protectivefactorsshouldnotbeconsideredtobemerelyflipsidesofriskfactors.Protectivefactorsoperateunderconditionsofrisk.Thatistosay,protectivefactorsoperatetopreventdelinquencyunderhigh-riskconditionsoramonghigh-riskindividuals.
Thereisacumulativeeffectofriskandprotectivefactorsbothwithinandacrosstime.Atagivenpointintime,childrenareatgreaterriskforjuveniledelinquencyiftheyexperiencemultipleriskfactors(Lerner,1996).Overtime,thereisaprogressiveaccumulationoftheconsequencesofindividualfactors(cumulativecontinuity)andtheresponsestheyelicitduringsocialinteractions(interactionalcontinuity).Withinthisdevelopmentalframework,lifephasesandtransitionsareparticularlyimportantinunderstandingbehaviourbecausetheypresenteithercrisesorchallenges,engenderingstressthatcanunderminedevelopmentorrevealingresourcesandopportunities(Lerner,1996).Adevelopmentalperspectiveconsidersbothstabilityandtransformationsinbehaviourintheirdevelopmentalcontext.Thechallengeistoexplaintheemergenceandthechangeinformandfrequencyofantisocialanddelinquentbehavioursoverthecourseofdevelopment.
Thecorrelatesofjuveniledelinquencyaresimilarinmalesandfemales.Itremainsunclear,however,theextent to which the outcomes of early externalizing problems are the same for both genders.Thedevelopmentaltrajectoriesofaggressivegirlsmayinvolvesimilarprocessestothoseofboysbutresult indifferentoutcomes.For example, girls’ trajectories todelinquency indicate there is strongcomorbiditywithdepressionandsuicidalideation,aswellaphysicalandsexualvictimization(Moffitt,Caspi,Rutter,&Silva, 2001). Thedevelopmental trajectoriesof aggressivegirls exemplify the jointprocessesofcumulativeandinteractionalcontinuity.Theyaremaintainedbyindividualcharacteristicsofthegirlsthemselvesandbytheirinteractionswithinthefamily,school,peer,andmaritalsystems.Thereisemergingevidence that the risksexperiencedbyaggressivegirlsmaybe transferred to thenextgenerationthroughtheirineffectiveparentingpracticesaswellastheirgenes(Serbinetal.,2004).Insummary,manyriskandprotectivefactorshavebeenidentifiedbyresearchers.However,thereexistlimiteddataongirls’involvementindelinquencyandwhethertherearespecificornonspecificriskandprotectivefactorsforgirls.

6
Better Beginnings, Better Futures Study: Delinquency Trajectories of At-Risk Youth
Estimated Costs Associated with Delinquency
Therearesignificantindividual,justice,healthandsocialservices,andsocietalcostsassociatedwithdelinquency.Thesehighintra-personal,interpersonal,andsocietalcostshighlighttheneedtoincreaseourunderstandingofdelinquencybehaviour,beforeitemerges.Despitethewelldocumentedindividual,physical,psychologicalandmentalhealth,social,andcriminaloutcomesofengaging indelinquentbehaviours,therearelimiteddataavailableinCanadaonthecostsassociatedwithit.Thereislimitedresearchon thecostsofdelinquencybeyondcostssavingsofearlypreventionprogramson futuredelinquency,andthecoststothecriminaljusticesystem.AntisocialyouthtendtobemultipleoffendersandCohen(1998)foundthattheaveragedelinquentcommits68-80crimesovertheirdelinquencytimeperiodandcostssocietybetween$1.3-$1.5million(U.S.dollars).Earlyinterventionprogramshavethepotential to reduce the long termcostsofdelinquency.CohenandPiquero (2009)estimated thatabeneficialpreventionprogramofdivertinga14-year-oldhighriskjuvenilefromalifeofcrimecouldsavefrom$2.6millionto$5.3million(U.S.dollars).
Fewstudiesofearlychildhoodpreventionprogramsforchildrenhaveincludedaneconomicanalysis(e.g.,Barnett&Masse,2007;Karoly,Kilburn,&Cannon,2005;Mrazek&Brown,2002;Nores,Belfield,Barnett,&Schweinhart,2005;Petersetal.,2010;Reynolds,Temple,Robertson,&Mann,2002;Waddell,Hua,Garland,Peters,&McEwan,2007).Alltheseearlychildhoodinterventionstudieshavereportedeconomicanalysesbasedonfollow-updataforchildren,andinsomecasestheirparents,tothechild’sageof15,21,and/or40.Economicanalysesresultsfromthesestudiesprovidetherationaletopolicymakersforinvestinginearlychildhoodinterventions.Formosteconomicanalysesofearlychildhoodeducationprograms,economicbenefitsaretypicallydividedintothreecategories:benefitstoprogramparticipants(e.g., increasedincomefromimprovededucation),benefitstonon-programparticipants(e.g.,reducedcoststocrimevictims),andbenefitstogovernment/taxpayers(e.g.,decreasedremedialeducationcosts,decreasedcosts to the justice system).TheCanadianstudyof early intervention,discussedinthispaper,isonBetter Beginnings, Better Futures(BBBF;Petersetal.,2010).Thecostingperspective of the Canadian BBBF economic analysis was the government / taxpayers; Karoly etal. (1998) refer to this analysis as cost-savings analysis to differentiate it from the more traditionalcost-benefitanalysis.Inthispaper,weexaminethesocial,health,educationalandjuvenilejusticecostsforeachofourtrajectoriesofdelinquency.

7
Objectives of the studyThecurrentstudyuseddatadrawnfromalongitudinalresearchstudy,Better Beginnings, Better Futures (Peters,Petrunka,&Arnold,2003),whichexaminedthelong-termimpactsofanearlychildhoodpreventionprogram.Morespecifically,theresearchprojectusedalongitudinalsampleof842at-riskyouthfromamulti-informantperspective(i.e.,parents,teachers,self-reportedyouthratings)to:(1) identifyearlytrajectoriesofdelinquencyforbothboysandgirlsatage8(Grade3),age11(Grade6),andage14(Grade9);(2)examineriskandprotectivefactorsattheindividual,family,peer,school,andcommunitylevelsthatmayinfluencethelikelihoodthatyouthwillengageincriminalbehaviourinadolescence;(3)examinewhetheryouthintheidentifieddelinquencytrajectoriesdiffersubstantiallyinGrade9onemotionalandbehaviouralproblems,delinquency,experienceofabuse,involvementwiththecriminaljusticesystem,academic/schoolfunctioning,andhealth/healthriskbehaviours;and(4)estimatethecoststogovernmentassociatedwitheachdelinquencytrajectoryonutilizationofgovernmentresourcesinthecriminaljusticesystem,remedialeducation,healthcareandsocialservices,andsocialassistance.
TheBBBFdataaretheonlyexistingCanadiandatathatincludealargenumberofmaleandfemaleyouthlivinginneighbourhoodscharacterizedbypoverty.Thedatasetisalsodiverseintermsofethnicityandotherfamilydemographicvariables.Theresultsarefurtherinstructivegiventhisisthefirstearlychildhoodpreventionproject inCanadato includeaneconomicanalysisof theestimatedcostsandsavingstogovernment.Thus,thisresearchhasthepotentialtoprovideempirically-basedinformationforcommunitiesinCanadaregardingidentifyingchildrenandyouthatriskof involvement inantisocialanddelinquentbehaviours,aswellasfordesigningpreventionandinterventionprogramsthatarecommunity-basedandthat targetempirically-basedriskandprotectivefactorsassociatedwithdelinquencyamongchildrenandyouth.

8
MethodParticipants
IntheBBBFsample,thelongitudinalresearchcohortwascomprisedofafocalcohortandafollowing cohort.Childreninthefocalcohort(n=721)werebornin1989andwererecruitedtothelongitudinalstudybetweenJuniorKindergarten(JK)andGrade3,mostlythroughtheschoolsystem.Childreninthefollowingcohort(n=238)werebornin1990,andwererecruitedtothelongitudinalstudywhentheywereinGrade3.Forthisstudy,therewere842participants(396girlsand446boys),representing88%oftheoriginalsample.Theseparticipantsrepresentthelongitudinalfollow-upoftheBBBFstudyandhaddataatages8(Grade3),11(Grade6),and14(Grade9).
Attritionwasmainlyduetotwofactors:(1)familiesrelocatedandtheresearcherswereunabletocontactthem;and(2)familiesdeclinedtobeinterviewed.Asatestforattritionbias,weemployedlogisticregressiontoexaminesociodemographicdifferencesinchildrenandfamilieswhodroppedoutoftheresearchcohortbetweenGrade3and6andbetweenGrade6and9,andfamilieswhocompletedallyearsofdatacollection.Theseanalysesindicatednosignificantdifferencesinsociodemographicvariablesbetweentheretainedandlostcases.
Approximately30%ofthehouseholdswereheadedbysingleparents,34%ofparentsdidnotcompletehighschool,59%offamilieswerelivingbelowStatisticsCanadaLowIncomeCutOffline,and19%werelivinginpublichousing.Therewerenosignificantgenderdifferencesonanyofthedemographicvariables.AppendixAprovidesmoreinformationonthefamilydemographicswhenthechildrenwereinGrade3.
Measures Delinquency
ChilddelinquencymeasureswerecreatedusingitemsfromtheNationalLongitudinalSurveyofChildrenandYouth(NLSCY;StatisticsCanada,1995).Threedifferentmeasureswerecreated,oneforparents,oneforteachers,andonefortheyouththemselves.RatingsinGrade3wereprovidedbyteachersonly,whileratingsinGrade6wereprovidedbyparents,teachersandyouth,andratingsinGrade9byparentsandyouth.ItemsfortheparentsandteacherversionsandtheGrade6youthversionwereratedonathree-pointscale:0=never or not true,1=sometimes or somewhat true,and2=often or very true(e.g.“vandalizes”,“steals”,“destroysthings”,and“tellsliesorcheats”).AtGrade9,theyouthindicatedwhetherornotinthepast12months,theywerepartofagang(0=no,1=yes)andtheremainingnineitemswererated0=never,1=once or twice,2=three or four times,or3=five or more times(e.g.,“stayedoutallnightwithoutpermission”,“stolensomething,”“solddrugs”,and“intentionallydestroyed/damagedthings”).Usingprincipalcomponentfactoranalyses,delinquencyitemsfromteachers,parents,andyouthwerecombinedseparatelyateachofthethreegradestocreateGrades3,6,and9delinquencyscales:theGrade3delinquencyscalewascreatedbycombiningthreeteacherrateditems;theGrade6measurehad13items(6parents,5teachers,and2youth);andtheGrade9measureofdelinquencyincluded16items(6parentsand10youth).Allthreescaleshadhighreliability.
Risk and Protective Factors
Riskandprotectivefactorsinformationaboutchildren,theirfamilies,andneighbourhoodswasobtainedbyparentandchildinterviews,teacherquestionnaires,andCanadianEducationQualityandAccountabilityOffice(EQAO)academicachievementtestresultswhenthechildrenwereinGrade3.Thespecificdetailscanberequesteddirectlyfromtheauthors.
Attheindividual childlevel,weexaminedchildren’semotionalandbehaviouralproblems(anxiety,depression,hyperactivity,oppositional-defiant,passivevictimization,physicalaggression),numberofseriousinjuries,socialfunctioning(conflictmanagement,cooperation,outgoing,self-concept,relationshipwithsiblings,

9
Method
numberofpeopleimportanttochild),andcognitiveandacademicfunctioning(MathematicsPerformanceonprovincialstandardizedtest,AchenbachAcademicandAdaptiveFunctioning,WISCBlockDesign,PeabodyPictureVocabularyTestscore,graderepetition,useofspecialeducationservices).
Atthefamilylevel,weexaminedsociodemographicfactors(parent’seducationlevel,income,maritalstatus,mobility,teenageparent),familyfunctioning(hostile-ineffectiveparenting,consistent-effectiveparenting),substanceuse(highriskdrinkinganddruguse),andparent’semotionalfunctioning(depression,stress,socialsupport).
At thepeer level,weexaminedhowwell thechildgotalongwithhis/herpeers.At theschool level,weexaminedparents’perceptionsoftheschoolandhowinvolvedtheparentswereatschool.Finally,attheneighbourhood level,weaskedparentstodescribehowsatisfiedtheywerewiththeirhomeandneighbourhood,whethertheylivedinpublichousing,andhowsafetheyfeltfromcrime.
Grade 9 Outcomes
Weexamined41outcomeswhenyouthwereinGrade9alongseveraldomainsobtainedbyparentandyouth interviews, teacherquestionnaires,andCanadianEducationQualityandAccountabilityOffice(EQAO)academicachievementtestresultsatGrade9.Thespecificdetailscanberequesteddirectlyfromtheauthors.
Toassessyouthemotional and behavioural problems,ratingswerecollectedfromparents,teachers,andyouth.Theratingscalesincludeemotional-anxietydisorder,physicalaggression,oppositional-defiant,hyperactivity,anddepression.Toassessyouthdelinquency,parentscompleteda“youthtrouble”scale,andyouthwereaskediftheywerepartofagangandthetypesofdelinquentactivitiestheirfriendsengagedin.Youths’experiences with abusewerealsoassessed;youthwereaskediftheyhadbeentreatedunfairlybecauseoftheirgender,race,skincolor,orreligionandiftheyhadbeenbulliedorphysicallyabused.Youthinvolvement with the criminal justice systemwasdeterminedthroughaseriesofquestionsintheyouthinterview(hadtheyeverbeenarrested,numberofarrests,numberofclosefriendsarrested,everbeentocourt,andtimeincustodyorotherprograms).
Youths’functioning in schoolwasassessedthroughaseriesofquestionsaskedofparents,teachers,andyouths.Parentswereaskedifthechildhadrepeatedanygradesorbeensuspended.Teacherswereaskedifthestudenthadbeensuspended,receivedspecialeducationservices,andcurrentacademicachievement.Studentswereaskedhowoftentheyleft/droppedoutofschoolandhowoftentheyskippedclass.Students’resultsonthestandardizedOntarioprovincialmathematicsachievementtestatGrade9werealsoexamined.
Finally,youthwereaskedaseriesofquestionsabouttheirhealth and health risk activities.Specifically,youthwere asked about their use of alcohol, tobacco, and illegal drugs, and had they ever been drunk.Youthwerealsoaskedtoratetheirstresslevel,indicatehowoftentheyhadbeenseriouslyinjured,weretheysexuallyactive,weretheyhavingunprotectedsex,andhadtheyeverbeenpregnantorgottensomeonepregnant.Youthandparentswerealsoaskedtoratetheyouth’sgeneralhealth,andyouth’sbodymassindexwascalculatedbasedontheirself-reportedheightandweight.
Estimated Costs of Government Resources Associated with Delinquency
Weidentified12measuresinourdatasetthatcouldbemonetizedtoreflectchildren’sandparents’utilizationofgovernmentresourcesinhealthcareandsocialservices,remedialeducation,thecriminaljusticesystem,andsocialassistance(seeTable1forsummary).ThesemeasureswerecollectedfromchildrenandtheirparentsbeginningwhenthechildrenwereinJuniorKindergarten(JK)uptoandincludingGrade9(morespecificdetailsforhoweachofthe12outcomeswasmonetizedcanberequestedfromtheauthors).

10
Better Beginnings, Better Futures Study: Delinquency Trajectories of At-Risk Youth
Statistical Analyses
Foracompletedescriptionofthestatisticalanalyses,pleaseseeAppendixB.
Table 1. esTimaTed CosTs of GovernmenT resourCes
GovernmenT resourCe esTimaTed CosTs in Canadian dollarsa
Health Care and social services
Visitstoafamilyphysician $29.44pervisitinOntariobasedon2001dollarfigures(Browne,Gafni,&Roberts,2002)
Hospitalemergencyroomuse $195.76pervisitinOntariobasedon2001dollarfigures(Browneetal.,2002)
Numberofseriousinjuries TheaveragecostofanunintentionalinjuryinCanadawas$4,000in1996.(Angusetal.,1998)
Numberofovernightstaysinhospital $816.35perovernightstayinahospitalinOntariobasedon2001dollarfigures.(Browneetal.,2002)
Visitswithanursepractitioner $19pervisitinOntariobasedon2001dollarfigures(Browneetal.,2002)
FamilyinvolvementwithChildren’sAidSociety $60pervisitinOntariobasedon2001dollarfigures(Browneetal.,2002)
remedial education
Graderepetition $6,151peryearinOntariobasedon2002/03schoolyeardollarfigures.
Useofspecialeducationservices $6,794averagecostperchildreceivingspecialeducationservicesinOntariobasedon2001/02schoolyeardollarfigures.
Criminal Justice system
Arrests $500Canadiannationalaveragecostperpoliceinvestigationin1998(Hepworth,2000)
Courtappearances $1,250Canadiannationalaveragecourtcosts(Hepworth,2000)
social assistance Programs
SocialWelfareAssistance $842permonthinOntariobasedon2003estimatedminimumvalueofbasicsocialassistanceforasingleparentwithonedependentchild(NationalCouncilonWelfare,2004)
OntarioDisabilitySupportProgram $829(singleparentwithonechild)and$940(twoparentswithonechild)permonthinOntariobasedon2003estimatedminimumpayments(OntarioMinistryofCommunityandSocialServices,2003)
a A3%discountratewasappliedforallestimatedcostdata(e.g.,Karolyetal.,1998;Karolyetal.,2005; Reynoldsetal.,2002).
11
ResultsTrajectories of Delinquency
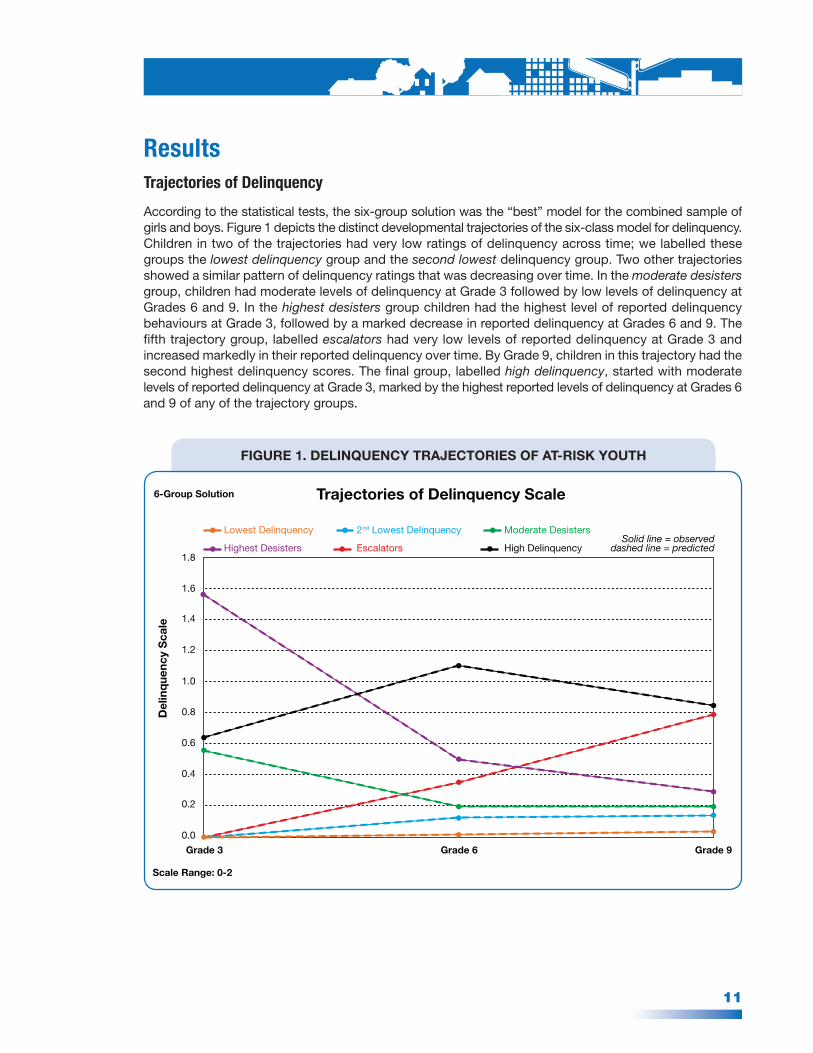
Accordingtothestatisticaltests,thesix-groupsolutionwasthe“best”modelforthecombinedsampleofgirlsandboys.Figure1depictsthedistinctdevelopmentaltrajectoriesofthesix-classmodelfordelinquency.Childrenintwoofthetrajectorieshadverylowratingsofdelinquencyacrosstime;welabelledthesegroupsthelowest delinquencygroupandthesecond lowestdelinquencygroup.Twoothertrajectoriesshowedasimilarpatternofdelinquencyratingsthatwasdecreasingovertime.Inthemoderate desistersgroup,childrenhadmoderatelevelsofdelinquencyatGrade3followedbylowlevelsofdelinquencyatGrades6and9.Inthehighest desistersgroupchildrenhadthehighestlevelofreporteddelinquencybehavioursatGrade3,followedbyamarkeddecreaseinreporteddelinquencyatGrades6and9.Thefifthtrajectorygroup,labelledescalatorshadverylowlevelsofreporteddelinquencyatGrade3andincreasedmarkedlyintheirreporteddelinquencyovertime.ByGrade9,childreninthistrajectoryhadthesecondhighestdelinquencyscores.Thefinalgroup,labelledhigh delinquency,startedwithmoderatelevelsofreporteddelinquencyatGrade3,markedbythehighestreportedlevelsofdelinquencyatGrades6and9ofanyofthetrajectorygroups.
fiGure 1. delinquenCy TraJeCTories of aT-risk youTH
1.8
1.6
1.4
1.2
1.0
0.8
0.6
0.4
0.2
0.0
Grade 3 Grade 6 Grade 9
Scale Range: 0-2
Del
inq
uenc
y S
cale
Solid line = observeddashed line = predicted
6-Group Solution Trajectories of Delinquency Scale
Trouble de lapersonnalité/
troubleagressif
Lowest Delinquency 2nd Lowest Delinquency Moderate Desisters
Highest Desisters Escalators High Delinquency

12
Better Beginnings, Better Futures Study: Delinquency Trajectories of At-Risk Youth
Table2depictsthepercentagesofchildrenineachofthegroups.Chi-squarestestedforgenderdifferencesinthegroupmembershipofeachtrajectorygroup;asignificantgroupbygendereffectwasfound,thatistherewasasignificantdifferenceintheproportionofmalescomparedtotheproportionoffemales(p <.003).We thencomparedwhether theproportionofmales versus femalesdiffered for eachofthesixtrajectorygroupsseparately.Thereweresignificantlymorefemalesthanmalesinthetwo low delinquency trajectorygroups,p<.05forbothanalyses.Thereweremoremalesthanfemalesinthefourremainingtrajectorygroups,butonlythedifferencesforthetrajectorygroupsshowingmarkeddecreasesindelinquencyovertime(themoderate and highest desisters)weresignificant(p<.05forbothanalyses).
Table 2. PerCenTaGe of boys vS. Girls in eaCH TraJeCTory
Trajectory Group males% (n)
females% (n)
LowestDelinquency* 6.7%(30) 10.6%(42)
SecondLowestDelinquency* 70.4%(314) 76.5%(303)
ModerateDesisters* 13.5%(60) 8.1%(32)
HighestDesisters* 3.4%(15) 1.0%(4)
Escalators 4.0%(18) 2.8%(11)
HighDelinquency 2.0%(9) 1.0%(4)
*p<.05
Grade 3 Risk and Protective Factors by Trajectories of Delinquency
We examined 31 risk factors and 17 protective factors at the individual, family, peer, school, andneighbourhoodlevelsthatmayinfluenceyouthdelinquentbehaviours.SinceGrade3istheearliestdatapointusedtodeterminingthetrajectorygroups,weselectedGrade3riskandprotectivefactorsforthisanalysistoaddresswhetherthesefactorswereassociatedwiththedifferentdevelopmentaltrajectoriesofdelinquency,andwhetherthesefactorsweredifferentiallyassociatedforgirlsandboys.1
Ofthe31riskfactors,17werefoundtobestatisticallysignificantatp<.001withthefullsample:8ofthe10individual childriskfactors;5ofthe12familyriskfactors;2ofthe6schoolriskfactors;theonepeer riskfactor;and1ofthe2neighbourhoodriskfactors(seeAppendixCformoredetails).ByGrade3,therewasevidencethatchildreninthehigh delinquency, escalators,andthetwodesisterstrajectorygroupswereexperiencingmany risk factorsat the individual, family,school,andpeer levels.Forexample,comparedtothelowdelinquencygroups,childrenfromthesefourtrajectorygroupsexperiencedmorehyperactive,oppositional-defiant,andphysicallyaggressivebehaviours; family risk factors includedsingleparenthood,lessparentaleducation,publichousing,andhostile-ineffectiveparenting.
1EachGrade3outcomevariablewasexamined through twosetsof analysis,one for the full sample (malesand females combined)andtheotherformalesonly(duetothelownumbersoffemalesinourhigh delinquencyandhighest desisters groups).Genderofchildwasusedconsistentlyasacontrolvariableforallfullsampleanalyses,buttheanalysesforthe“male only”samplelookedatthebivariaterelationshipbetweenmalechildrenandtrajectorygroups.Weemployedacombination ofanalysisofvariance(ANOVA)andlogisticregressiondependingonthetypeofoutcomevariableinquestion(i.e.,ANOVA forcontinuousvariables,andlogisticregressionforbinaryvariables)tocomparethemeansorproportionsofvarianceofthe variable.OmnibusForchi-squaretestswerereportedtoindicatethesignificanceofoverallrelationship,andBonferronitests werecarriedouttoexaminepairwisecomparisons.
13
Results
Whenexaminingpairwisecomparisonsforthe17significantriskfactors,thehighest desistersgrouphadthemostfrequentnumberofsignificantpairwisecomparisons;inotherwords,thisgroupofchildrenexperiencedmoreriskthanchildrenintheother5trajectorygroups.Specifically,theyscoredhigherthanthelowest delinquencygrouponallparentandteacherratingofchildbehaviourproblems,theirmothershadalowereducationlevel,andtheyhadpoorsiblingandpeerrelationships(seeTable3formoredetails).Thatis,thesechildrenwereexperiencingmoreindividual,familyandpeerproblems.
Thehigh delinquencygroupandthemoderate desistersgroupalsoexhibitedhighlevelsofrisk,especiallywhencomparedtothetwolowestdelinquencygroups.Forexample,thehigh delinquencygroupwascharacterizedbybothparentsandteachersasscoringhighonhyperactivity,oppositionaldefiance,andphysicalaggression.Theyweremorelikelytocomefromasinglefamily,liveinpublichousing,experiencehostileineffectiveparenting,andhavepoorsiblingandpeerrelationshipsthanthelowest delinquency group.Thehigh delinquencygrouphad11significantriskfactorsinGrade3,theescalatorgrouphadsix,whilethe lowest delinquencygrouphadnone.Specifically,accordingtoparents,theescalatorgroupscoredhigherthanthelowest delinquencygrouponhyperactivity,oppositionaldefiantbehavioursandphysicalaggression.Comparedtothelowest delinquencygroup,theyweremorelikelytohaveateenagemother, liveinpublichousingandhavepoorsiblingrelationships.Thus,parentshadidentifiedthesechildrenasexperiencingmoreproblems,andtheyhadmanyfamilyriskfactors.

14
Better Beginnings, Better Futures Study: Delinquency Trajectories of At-Risk Youth
Table 3. summary of siGnifiCanT Grade 3 risk faCTors by TraJeCTory GrouP
aThisindicatesthatchildreninthehigh delinquencytrajectorygroupreceivedstatisticallysignificanthigherratingsof hyperactivitythanchildreninthetwolowest delinquencygroups.
Note:onlystatisticallypairwisecomparisonsatp<.01areshown.
Highdelinquency
(1)
escalators(2)
desisters low delinquency
Highest(3)
moderate(4)
2nd lowest
(5)
lowest(6)
CHild
Parent Ratings of Child:
Hyperactivity 1>5,6a 2>6 3>6 4>6 5>6
Oppositional-Defiant 1>4,5,6 2>5,6 3>5,6
PhysicalAggression 1>5,6 2>6 3>4,5,6 4>5,6
Teacher Ratings of Child:
Hyperactivity 1>5,6 3>2,5,6 4>5,6
Depression 3>2,5,6 4>5,6
Oppositional-Defiant 1>2,5,6 3>1,2,4,5,6 4>2,5,6
PassiveVictimization 3>6 4>5,6
PhysicalAggression 1>2,5,6 3>1,2,4,5,6 4>2,5,6
family
Mother’sEducation 3<6 4<5,6
SingleParent(%yes) 1>5,6 4>6
TeenageMother(%yes) 2>5,6 4>6
LivinginPublicHousing(%yes)
1>6 2>6
Hostile-IneffectiveParenting 1>5,6 4>6
PoorSiblingRelationships 1>6 2>4,5,6 3>4,5,6
sCHool
PeabodyPictureVocabularyTestScores
4<6
ReceivedSpecialEducationServices(%yes)
4>5,6
Peers
PoorPeerRelationships(parentrated)
1>6 3>4,5,6

15
Results
Ofthe17protectivefactors,7werefoundtobesignificantatp <.001withthefullsample(seeAppendixC),allintheindividual childprotectivedomain.Thetwolowest delinquencygroupsshowedsignificantlyhigherlevelsofsocialskills(e.g.,conflictmanagement,helping/cooperation,outgoing/assertive)andadaptivefunctioningthanchildreninthetwodesistersgroups(seeTable4).Teachersalsoratedthehigh delinquency andescalatorsgroupsasshowingmoreconflictmanagementskillsthanthehighestdesistersgroup.
Table 4. summary of siGnifiCanT Grade 3 ProTeCTive faCTors by TraJeCTory GrouP
Highdelinquency
(1)
escalators(2)
desisterslow
delinquency
Highest(3)
moderate(4)
2nd lowest
(5)
lowest(6)
CHild
Parent Ratings of Child:
ConflictManagement 5>1,3,4a 6>1,2,3,4
Helping/Cooperation 5>1 6>1
Teacher Ratings of Child:
LowAnxiety 5<3,4 6<3,4
ConflictManagement 1>3 2>3,4 4>3 5>3,4 6>3,4
Helping/Cooperation 2>3 5>3,4 6>3,4
Outgoing/Assertive 5>3,4 6>3,4
sCHool
AdaptiveFunctioning 5>3,4 6>1,2,3,4,5
aThisindicatesthatchildreninthesecond lowest delinquencytrajectorygroupreceivedstatisticallysignificanthigher ratingsofconflictmanagementthanchildreninthehigh delinquencyandthetwodesisterstrajectorygroups.
Note:onlystatisticallypairwisecomparisonsatp<.01areshown.
Whenexamininggenderdifferencesonthe31riskand17protectivefactors,5riskand2protectivefactorswere found tobesignificantatp<.001 (seeAppendixC for fulldetails).Specifically,we found thatteachers rated girls as showing fewer hyperactive, depressive, oppositional-defiant, and physicallyaggressivebehaviours.Teachersalsoratedgirlsasshowingmoreconflictmanagementandhelping/cooperativebehaviours.Parentsratedgirlsasshowingfewerhyperactivebehaviours.
16
Better Beginnings, Better Futures Study: Delinquency Trajectories of At-Risk Youth
Grade 9 Outcomes by Trajectories of Delinquency
WeexaminedtherelationshipsbetweenGrade9outcomevariablesanddelinquencytrajectoriesinasimilarmanneraswedidfortheGrade3riskandprotectivevariables.2However,giventhesmallsamplesizesforsometrajectorygroups,wereclassifiedthe6groupsoftrajectoriesinto4groupsbycombiningmoderate desistersandhighest desisters(andcallingitdesisters)andbycombiningthelowestandsecond lowesttrajectories(callingit low delinquency);theothertwogroups,escalatorsandhigh delinquency,remainedthesameasbefore.Forcontinuousvariables,adjustedgroupmeansarereportedandfordichotomousvariables,oddsratiosarereported.
Ofthe41Grade9outcomesexamined,31werefoundtobesignificantatp<.001withthefullsample(seeAppendixDformoredetails).Tobrieflysummarize: intheEmotional and Behavioural Problemsdomain7of 10outcomeswere significant; in theDelinquency Problems domainall 3 independentmeasuresofdelinquentoutcomesweresignificant;intheExperience of Abusedomain1of3outcomeswassignificant;intheInvolvement with Criminal Justice Systemdomainall5outcomesweresignificant;inthe School Functioning domain5 of 7outcomeswere significant; and in theHealth and Health Risk Behavioursdomain10of13outcomesweresignificant.Theseresultsindicate,aswouldbeexpectedthatbyGrade9,thehigh delinquencygroupandtheescalatorswerealreadyexhibitingsignificantlymoreproblemsthantheyouth intheothertrajectorygroups inallareasoftheir functioning(emotionalandbehaviouralproblems,criminalinvolvement,andengaginginunhealthybehaviours).
Wethenexamineddifferencesamongour4trajectorygroupsonthese31significantoutcomes(seeTable5forsummary).Theescalatorsandhigh delinquencygroupsdifferedsignificantlyfromthedesistersandlow delinquencygroupson26ofthe31outcomemeasures.Thatis,theescalatorsandhigh delinquency groupsexhibitedmoreemotionalandbehaviouralproblems,engagedinmoredelinquentbehaviours,weremorelikelytobeinvolvedinthecriminaljusticesystem,hadpoorerschoolfunctioning,andweremorelikelytobeengagedinhealthriskbehaviourscomparedtotheothertwotrajectorygroups.Somespecificresultsmeritemphasis.Comparedtotheyouthinthelow delinquencygroup,theyouthinthehigh delinquencygroupwere25timesmorelikelytobepartofganginthepastyear,33timesmorelikelytohaveeverbeenarrested,91timesmorelikelytohaveevergonetocourt,13timesmorelikelytohavebeensuspendedfromschoolinthepast3years,37timesmorelikelytohavedoneharddrugsinthepastyear,and20timesmorelikelytohavehadunprotectedsexintheirmostrecentsexualencounter.Additionally,comparedtoyouthinthelow delinquencygroup,theyouthintheescalatorsgroupwere44timesmorelikelytobepartofgang,20timesmorelikelytohavebeenarrested,37timesmorelikelytohavegonetocourt,11timesmorelikelytohavebeensuspendedfromschool,26timesmorelikelytohavedoneharddrugs,and15timesmorelikelytohavehadunprotectedsex.Theimportanceoftheseresultsisthattheyareseparateindicatorsofinvolvementincrimethantheitemsusedtocreatethedelinquenttrajectories.Thus,usingbothselfreportandofficialdatasources,thereisconvergingevidencethatthesehighriskyouthareindeedhighriskandengaginginhighriskbehaviourswithsignificantconsequences.
2Thatisweemployedacombinationofanalysisofvariance(ANOVA)andlogisticregressiondependingonthetypeofoutcome variableinquestion(i.e.,ANOVAforcontinuousvariables,andlogisticregressionforbinaryvariables)tocomparethetrajectory groupsoneachoftheGrade9outcomevariables.OmnibusForchi-squaretestswerereportedtoindicatethesignificanceof overallrelationship,andBonferronitestswerecarriedouttoexaminepairwisecomparisons.

17
Results
Table 5. summary of siGnifiCanT Grade 9 ouTComes by TraJeCTory GrouP
escalators(1)
High delinquency
(2)
desisters(3)
low delinquency
(4)
youTH emoTional and beHavioural Problems
Parent-Rated:
Emotional-AnxietyDisorder 1>3,4b 2>3,4
PhysicalAggressionScale 1>3,4 2>3,4
Hyperactivity/InattentionScale 1>3,4 2>3,4
Oppositional-DefiantScale 1>3,4 2>3,4
Depression 2>1,3,4
Youth-Rated:
PhysicalAggressionScale 1>3,4 2>3,4
Hyperactivity/InattentionScale 1>4
StressIndex 1>3,4 2>3,4
delinquenCy Problems
YouthGettingIntoTroubleScale(Parent-Rated )
1>3,4 2>1,3,4
DelinquentFriendsScale(Youth-Rated )
1>3,4 2>3,4
GangMembership(Youth-Rated )
43.59ORc 25.46OR 5.38OR
eXPerienCe of abuse
Physicalabuse(Youth-Rated ) 7.29OR 3.40OR
involvemenT WiTH Criminal JusTiCe sysTem
Youth-Rated:
Everarrested/takentopolicestation
19.67OR 33.38OR 3.65OR
Numberofarrests 1>3,4 2>1,3,4
Friendsarrestedortakentopolicestation
1>3,4 2>3,4
CourtAppearances 36.75OR 90.76OR 7.63OR
Incarceration 14.21OR 49.24OR

18
Better Beginnings, Better Futures Study: Delinquency Trajectories of At-Risk Youth
Estimated Costs Associated with Delinquency Trajectories
Moststudiesof juveniledelinquencyoverthepasttwodecadeshavefocusedonolder,seriousandviolentjuvenileoffenders.Youngerdelinquentshavebeenignoredpartlybecausetheirnumberisrelativelysmallandtheirthreatisnotasimmediate.However,whereasthenumberofveryyoungoffendersissmallcomparedwitholderjuveniles,childdelinquentspresentuniquechallengesthatneedtobeaddressed.Interveningbeforeminoroffencesbecomemoreseriousandbeforetheoccasionaloffenderbecomesachronicoffenderisimportant.Understandingthetrajectoriesofdelinquencyatayoungageandtheriskandprotectivefactorsassociatedwiththosedevelopmentaltrajectoriescaninformthedevelopmentofearlyriskassessmentsandthedevelopmentofpreventionandinterventionprograms.
escalators(1)
High delinquency
(2)
desisters(3)
low delinquency
(4)
sCHool funCTioninG
SuspensionFromSchool 10.90OR 13.25OR 3.28OR
DroppedOutofSchool 1>3,4 2>3,4
SkippedClasses 1>3,4 2>3,4
AcademicAchievementa 4>3
ReceivedSpecialEducationServices
3.41OR 6.04OR 2.77OR
HealTH and HealTH risk beHaviours
Youth-Rated:
GeneralHealtha 4>1,2
BodyMassIndex 2>1,3,4
AlcoholConsumption 1>3,4 2>4
EverDrunk 10.91OR 7.9OR
TobaccoUse 1>3,4 2>3,4 3>4
MarijuanaUse 1>3,4 2>3,4
HardDrugUse 26.46OR 37.14OR
ConsensualSex 12.56OR 20.23OR
UnprotectedSex 14.54OR 19.58OR
a Variableisreverse-coded(i.e.,higherscoresreflectsamorepositiveoutcome).bThisindicatesthatyouthintheescalatorstrajectorygroupreceivedstatisticallysignificanthigherratingsofemotional-anxiety disorderthanyouthinthedesistersandlow delinquencytrajectorygroups.c ORreferstoOddsRatio.OddsRatiosarereportedfordichotomousvariableswherelow delinquencyisusedasthe referencecategory.Forexample,youthintheescalatorstrajectorygroupwere43timesmorelikelytobepartofagang thanyouthinthelow delinquencytrajectorygroup.
Note:onlystatisticallypairwisecomparisonsatp<.01areshown.

19
Results
Foreachofthe6trajectoriesofdelinquency,weestimatedanaveragecost/child/trajectoryforeachofthe12monetizablegovernmentresourcesdescribedinTable1.Foreachchild,weestimatedthecostsofutilizingthegovernmentresourcebymultiplyingtheunitcostavailablefromasecondarysource(e.g.,$29.44foranappointmentwithafamilyphysician)bytheoccurrenceoftheevent.Alldollarfiguresthatwereportwerediscountedatarateof3%.Thisdiscountratefallswithintherangeofratescommonlyusedandrecommendedinpublic-policyanalysis(e.g.,Karolyetal.,1998;Karolyetal.,2005;Reynoldsetal.,2002).Foracompletedescriptionofthestatisticalanalyses,pleaseseeAppendixB.
Detailedresultsforeachofthe12indicatorsofgovernmentresourceutilizationbytrajectorygroupbygendercanbefoundinAppendixE.Table6providesasummaryofthegovernmentexpendituresbygeneraldomainbytrajectorygroup.Tobrieflysummarizetheresults,governmentexpenditureswerehighestintheRemedial Education domain(64%ofcosts),followedbyHealth Care and Social Services (29%),Social Assistance(6%),andCriminal Justice System(1%).Thetwolowest delinquencytrajectories(82%ofthesample)accountedforonly19.4%oftheestimatedgovernmentcosts.Inotherwords,approximately80%oftheestimatedcoststogovernmentwerefrom18%ofthesample.Specifically,wefoundthatyouthfromthetwodesisterstrajectorygroups(13%ofthesample)accountedfor40%oftheestimatedcoststogovernment;andyouthfromthetwomostat-risktrajectories(escalatorsandhigh delinquency,5%ofthesample)accountedfor40.6%oftheestimatedcoststogovernment.Itisinterestingtonotethat80%oftheestimatedCriminal Justice costswereduetothehigh delinquencyandescalatorstrajectorygroups.
Wealsofoundthatantisocialordelinquentgirlscostsocietymoremoneythanantisocialordelinquentboysinalldomains,withtheexceptionoftheSocial Assistancedomain.Specifically,summingacrossall6trajectorygroupsfromages4to14,weestimatedthatgirlscost$244,056whileboyscost$229,236.Inaddition,weestimatedthatgirls’criminaljusticecostswerealmosttwicethoseofboys($4,835vs.$2,408).

20
Better Beginnings, Better Futures Study: Delinquency Trajectories of At-Risk Youth
Table 6. resulTs of esTimaTed GovernmenT resourCe uTilizaTion by domain by TraJeCTory GrouP
Jk – Grade 3 ($)
Grades 4 – 6 ($)
Grades 7 – 9 ($)
all Grades ($)
Hea
lthc
are
and
so
cial
ser
vice
s
2ndLowestdelinquency 2,802 2,061 4,978 9,841Escalators 2,661 3,340 10,798 16,800Highdelinquency 980 2,570 8,953 12,503Moderatedesisters 2,392 1,209 4,804 8,405Lowestdelinquency 1,758 1,398 2,616 5,772Highestdesisters 5,927 2,902 4,654 13,483Group total $16,521 $13,480 $36,802 $66,803
Rem
edia
led
ucat
ion
2ndLowestdelinquency 5,807 5,363 4,278 16,348*Escalators 7,285 7,651 8,101 25,008*Highdelinquency 8,927 8,476 10,348 30,001*Moderatedesisters 8,223 8,032 6,522 24,277*Lowestdelinquency 4,595 2,898 2,104 9,947*Highestdesisters 11,700 13,908 13,430 40,584*Group total $46,537 $46,327 $44,782 $146,165*
Crim
inal
just
ice
sy
stem
2ndLowestdelinquency 71Escalators 900Highdelinquency 1,647Moderatedesisters 211Lowestdelinquency 30Highestdesisters 334Group total $3,193
Fam
ilys
ocia
las
sist
ance
2ndLowestdelinquency 1,758Escalators 4,081Highdelinquency 2,142Moderatedesisters 2,603Lowestdelinquency 708Highestdesisters 1,856Group total $13,147
All
dom
ains
(12
Mea
sure
s)
2ndLowestdelinquency 8,609 7,424 9,255 28,018*Escalators 9,946 10,991 18,899 46,788*Highdelinquency 9,907 11,046 19,301 46,292*Moderatedesisters 10,615 9,240 11,326 35,496*Lowestdelinquency 6,352 4,296 4,720 16,457*Highestdesisters 17,628 16,810 18,084 56,257*Group total $63,058 $59,807 $81,585 $229,308*
* Includescostsofgraderepetition.Forthosechildrenwhorepeatedagrade,weassignedeachchildonetotalcostofrepeatingagrade(e.g.,numberofgradesfailedsummedfromkindergartentoGrade8);therefore,itwasnotpossibletoassignthiscosttooneofthespecificgradecategories(JK-Gr2,Gr4-6,Gr7-9).Instead,weincludedthesecostsinthe“AllGrades”total.

21
DiscussionGiventhatoverone-thirdofyouthhavebeeninvolvedinsomeformofdelinquencybytheageoffourteen,andthatchildhooddelinquencytendstopredictviolentbehavioursthroughoutthecourseofalifetime(Farrington,1989),understandingthedevelopmentalpathwaysthatleadtodelinquencyisacriticalissue.The current study was designed to identify the delinquency trajectories of boys and girls living indisadvantagedcommunitiesinOntariofromages8to14,andexaminetherisk/protectivefactors,Grade9outcomes,aswellastheestimatedeconomiccostsassociatedwitheachtrajectory.Resultsindicatedthatchildrenintheescalatorgroupandthehigh delinquencygrouphadsignificantnegativeoutcomesbyGrade9withrespecttotheirbehavioural,emotional,social,andrisk-takingbehaviour(e.g.,druguse,unprotectedsex),aswellashighinvolvementinthecriminaljusticesystem.Theseproblemsalsowerecostlytothegovernment.
Developmental Trajectories of Delinquency
Ourfirstobjectivewastoexaminethetrajectoriesofdelinquencyinboysandgirlsfromages8(Grade3)to14(Grade9).Ourresultsconfirmtheheterogeneityofthedevelopmentofdelinquencyandaregenerallyconsistentwithpreviousresearch.Wefoundsixgroupsofdelinquency.Asexpected,twogroups,lowest delinquencyandsecond lowest delinquency,representingthemajorityoftheyouth(≈82%ofthesample)reportedconsistentlylowlevelsofdelinquencyovertime.Twoothertrajectories(highest desistersandmoderate desisters)showedasimilarpatternofdelinquencyratingsdecreasingovertime,representingthedesisters(≈13%ofthesample).Anothergroup,theescalators(≈3.5%ofthesample),hadverylowlevelsofreporteddelinquencyatGrade3andincreasedovertime.Finally,thehigh delinquency groupstartedwithmoderatelevelsofreporteddelinquencyatGrade3andhadthehighestreportedlevelsofdelinquencyatGrades6and9ofanyofthetrajectorygroups.Thehigh delinquencygrouprepresentedapproximately1.5%ofthesample.Itmaybethatthelowpercentageofyouthinthehigh delinquencygroupreflectsthefactthatweonlyhavedataupuntiltheyouthareinGrade9,orapproximately14yearsold.Thus,manyyouthmayjustbebeginningtoengageindelinquentacts.Wehypothesizethatwithmorelongitudinaldatapoints,theproportionofyouthinthehigh delinquencygroupwouldincreaseandlikelymorecloselyresembleotherresearchfindings.
Thisstudysupportedthetrajectoriesofdelinquencyreportedinotherstudies,butalsoidentifiedsomekeydifferences.Similaritiesincluded:1)thatthemajorityofyouthwereinvolvedinnoorlimiteddelinquentactivities;2)femalesweremorelikelythanmalestobeuninvolvedindelinquency(i.e.,thereweremorefemalesinthelow delinquency and second lowest delinquencytrajectorygroups);3)therewasagroupofindividualswhodesistedfrominvolvementindelinquency;and4)therewasatrajectoryofconsistentlyhighengagementindelinquentbehaviour.Thekeydifferencesfrompreviousliteraturewasthenumberofgroupsthathadlowlevelsofdelinquency(i.e.,thereweretwolowandsecondlowestgroupsthatengagedinminimaldelinquentbehaviours).Second,theshapeofthehigh delinquencytrajectorygroupwassurprising,astherewasapeakindelinquencyinGrade6.Weexpectedthatthepeakwouldnotbepresent,andifwehadextendedlongitudinaldatawewouldhaveexpectedtoseeitataroundage18.Thereareseveralpossibleinterpretationstothisearlypeak.First,nootherstudyondelinquenttrajectorieshasbeenconductedstartingatsuchayoungage.Second,thecurrentstudyincludedgirlswhichnootherstudyofdelinquenttrajectorieshasdone.Third,thisstudywasbasedoncommunitysampling,thatisitwasconductedinhighrisk,lowsocioeconomicstatusneighbourhoods.Lastly,itispossiblethatthereareuniquesamplecharacteristicsintheparticipantsandtheresultsmayreflectthissampling.Nonetheless,morelongitudinalresearchisrequiredthatbeginsasearlyasthisresearchtovalidatefindings.
Third,whenweexamineddifferencesinthedistributionsofboysandgirlswithinthediversetrajectorygroups,wefoundthattheescalatorsandhigh delinquencygroupshadequalproportionalrepresentativenessofmalesandfemales.Thatis,wefoundnogenderdifferencesinthedistributionofboysandgirlsinthe

22
Better Beginnings, Better Futures Study: Delinquency Trajectories of At-Risk Youth
high delinquencygroup(2%ofmalesand1%offemales),orintheescalatorsgroup(4%ofmalesand3%offemales).Typicallyresearchreportsthatmalesaremorelikelytoengageindelinquentbehaviourthanfemales,thusweexpectedtohavemoremalesthanfemalesinthehigh delinquencygroup.Notably,thispatternisinconsistentwiththegeneraldevelopmentaltrendreportedbySilverthornandFrick(1999)whofoundthatgirlstendtoexperiencealateronsetofdelinquencythanboys,andthegeneralfindingthatboysaremorelikelytobeinvolvedinhighdelinquentbehaviourthangirls.Thediscrepancymayarisebecausewehaveusedamulti-informantapproach,andhavetakenaperson-orientedapproach(asopposedtoagrouporientedapproach),allowingustoexamineheterogeneitywithinthedevelopmentofdelinquency.Thesmallminorityofat-riskgirlsinoursampledemonstratedtheseproblemsasearlyasboys.Consistentwithotherresearch,wefoundthatgirlswereoverrepresentedinthetwolowdelinquencygroups.However,wefoundthereweresignificantlymoremalesinthetwodesisters groups.
Risk and Protective Factors Associated with Delinquency Trajectories
Trajectoriesincreaseourunderstandingofdelinquencydevelopmentandidentifybehaviouralpatternsthatemergeinindividualsonaspecifictrajectory.Oncethesetrajectoriesareidentified,specificfactorspertainingtotheindividual,peers,family,andcommunityingeneralcanbeexploredtodeterminewhichfactorsheightentheriskofdelinquency(i.e.,thechronicorincreasingtrajectories)oractasaprotectivefactoragainsttheinvolvementindelinquency(i.e.,low,non-involved,ordecliningtrajectories).
Inthisresearchweexamined31riskfactorsand17protectivefactorsattheindividual,family,peer,school,andcommunitylevelwhenthechildrenwereinGrade3(age8)thatmayinfluencethelikelihoodthatyouthwillengageincriminalbehaviourinadolescence.Childrenatriskfordelinquency(i.e.,thoseinthehigh delinquency, escalators,anddesisterstrajectorygroups)scoredsignificantlyhigheron17ofthe31individual,family,peer,andneighbourhoodriskfactors.Forexample,childrenfromthesefourtrajectorygroupsexperiencedmorehyperactive,oppositional-defiant,andphysicallyaggressivebehaviours;familyriskfactorsincludedsingleparenthood,lessparentaleducation,publichousing,andhostile-ineffectiveparenting.Themostat-riskgroupswereexperiencingproblemsinmultipledomains,notedbymultipleinformantsandassessments,yettheyreceivedlimitedinterventionsorsupporttoaddresstheseproblems.Thus,withcomprehensiveearlyassessments,earlyidentificationofat-riskchildrencanoccurearlyatschoolallowingtheprovisionofextraservicestopreventcontinuationofproblematicandcostlybehavioursthroughadolescence.
Morespecifically,youthassignedtothehigh delinquencygroupwerealreadyshowingsignsofproblemsinGrade3.Parentsandteachersratedthemashigherthanthelow delinquencygroupsonhyperactivity,oppositionalbehaviour,andphysicalaggression.Inaddition,theyweremorelikelytocomefromsingleparenthomes,liveinpublichousingandexperiencehigherlevelsofhostileineffectiveparentingandhadpoorqualitypeerandsiblingrelationshipscomparedtothetwolowdelinquencygroups.Interestinglyonlythemoderate desisterswereviewedasmoreproblematicwithrespecttotheiroppositionaldefiantbehaviourandtheirphysicalaggressionthanthehigh delinquencygroup,accordingtoteachers.Withrespecttoschoolfunctioning,therewerenodifferencesonthePPVTtestoronthelikelihoodthattheyreceivedspecialeducationalservicescomparedtotheothergroups.Infactthisgrouphadthelowest special education ratesyettheyhadthelowestPPVTscores(althoughnotsignificantlydifferentfromtheothergroups);theymaynothavebeenreceivingthespecialservicesatschoolthattheyrequired.
Thehigh delinquencygroupalsodidnotscorewellonprotectivefactors.Theyhadsignificantlylowerscoresonconflictmanagementandcooperativebehavioursthanthe low delinquency and desisters groups,accordingtoparents.Thiscompositionofriskandprotectivefactorsindicatesthatparentsidentifiedmanybehaviouralandsocialproblemsinchildreninthehigh delinquencygroup.Interestingly,teachersratedthehigh delinquencygroupasshowingmoreconflictmanagementskillsthanthehighest desistersgroup.Thisgroupwasnotviewedasthemostproblematicwithrespecttoclassroombehaviours,whichmayhaveminimizedtheextentoftheirproblematicbehavioursandlimitedthepotentialinterventionstheycouldhavereceived.

23
Discussion
Similarly,theyouthintheescalatorsgroupwereratedbytheirparentsasshowingthesecondworstproblematicbehavioursandhadmanyfamilyriskfactors,suchasmorelikelytoliveinasingleparenthome,livedinpublichousing,andhadpoorpeerrelationships.Forboththehigh delinquencyandtheescalatorsgroups,theissuesathomemayhaveplayedaroleintheirdelinquenttrajectories.Researchhasindicatedthatsingleparentsmaybelessabletomonitortheirchildrenthanchildrenlivingintwoparenthomes(Tremblay,VanAken,&Koops,2009).Similarly,theylivedinsocialhousingwheretherewasalackofmonitoringandwheretheymayhavebeenmorelikelytoassociatewithpeerswithsimilarproblems,thusprovidingapeergroupwithsimilarproblemstoreinforcetheiraggressiveanddelinquentbehaviourproblems.Teachersdidnotperceivethisescalatorsgroupasexhibitingmanyproblematicbehaviourscomparedtotheothergroups.Thislackofconcordancebetweenparentsandteachersmayhavecontributedtothemnotbeingidentifiedashavingproblems.Itmaybethatthechildrenwerehavingfewerbehaviouralproblemsatschoolthanathome,oritmaybethatthebehaviouralproblemsatschoolwerenotasextremeasthoseexperiencedathome.Furthermore,thisdiscrepantfindingbetweenparentandteacherratingsmayreflectthelackofservicesputintoplacetopromotehealthybehaviouralandschoolfunctioningforthesechildren,whichmayhaveinadvertentlycontributedtotheirongoingproblems.Inanycase,thedisagreementbetweenparentsandteachershighlightstheneedtotakeparents’viewsintoaccountindevelopingassessmentand/orscreeningtools.Furthermore,theseparentsmayneedmoreservicestohelpthemaddressproblematicbehavioursearly,athome.Thecombinationofmanyriskandfewprotectivefactors,andlittlesupportintermsofeducationalassistancemayhaveinteractedandaccumulatedtomaintainandincreasetheirriskfordelinquencyovertime.
Thetwodesistersgroups(highest desistersandmoderate desisters)areaninterestingcontrasttothehigh delinquencyandescalatorsgroups.ThedesistersgroupswereviewedthemostnegativelybytheirteachersinGrade3(i.e.,theyhadthehighestscoreonallriskfactorsandthelowestoverallprotectivescoresasviewedbytheirteachers).Furthermore,theriskfactorsincludedbothexternalizingproblemsandinternalizingproblems.Itmaybeinpartthiscombinationofdepression,victimization,andexternalizingproblemsthatcontributedtothembeingidentifiedassuchbytheirteachers.Parentsalsoidentifiedexternalizingproblemsinthesegroups.Furthermore,themoderate desistersalsohaveelevatedriskwithrespecttotheirfamilyenvironments(e.g.,morelikelyto live insingleparenthomes,haveateenagemother,andamotherwithlowereducationthanthelowgroups).Itmaybethatthesefamilieswerereceivingmoresocialassistanceduetotheirlifecircumstancesthanthehigh delinquencyandescalatorsgroups,whichmayhavealsobeenprotectiveagainstfuturedelinquencyinvolvement.Furthermore,likelyasaconsequenceofbeingidentifiedbyteachersasexperiencingmanybehaviouralproblemsandacademicproblems,theyreceivedthemostspecialeducationservices(43%)atschool.Theseservicesmayhaveactedasaneffectiveearlyinterventionforthesestudentsbypromotingpositiveschoolfunctioningthatinturnfacilitatedtheirdesistancefromdelinquencyandassociatedproblematicbehaviour.
Thereareseveral implicationstothesefindings.Forexample, itsupportsthenotionthatdevelopinganassessment/screeningtoolforriskmeasuringpsychological,emotional,andbehaviouralfunctioning,aswellasfamilyandschoolfunctioning,canprovideearlyidentificationofchildrenwhoareatdifferentlevelsofriskforfuturedelinquency.Inaddition,providinginterventionsorstrategies(suchasspecialeducationalservices)tothosewhoareidentifiedat-riskcanpreventdelinquencyinthefuture.Amongotherthings,thecurrentresearchsuggeststhatearlyinvestmentinschoolservicescanmakeameasurabledifferenceindelinquencytrajectoriesbyGrade9.Withoutinvestment,theproblematicandcostlybehavioursofat-riskyoutharelikelytocontinuethroughadolescenceandpotentiallybecomemoresignificant.

24
Better Beginnings, Better Futures Study: Delinquency Trajectories of At-Risk Youth
Grade 9 Outcomes Associated with Delinquency Trajectories
ThethirdobjectiveofthisstudywastoexaminewhetheryouthintheidentifieddelinquencytrajectoriesdiffersubstantiallyinGrade9onemotionalandbehaviouralproblems(e.g.,emotional-anxietydisorder,depression,aggression,oppositional-defiant,hyperactivity-inattention),delinquency(e.g.,associationwithdelinquentfriends,beingpartofagang),experienceofabuse(e.g.,physicalabuse,bullying,discrimination),involvementwiththecriminaljusticesystem(e.g.,arrests,courtappearances,timespentincustody),academic/schoolfunctioning(e.g.,achievement,useofspecialeducationservices,studentsuspensions,grade repetition), andhealth/health riskbehaviours (e.g., useofalcohol, tobacco,and illegaldrugs,injuries,unprotectedsexualactivity,pregnancy).We found thatearlyproblems (i.e., emotionalandbehavioural,delinquency,academic)becomeevenmoresignificantbyGrade9.Ourtwomostat-riskgroups,thehigh delinquencyandtheescalatorsgroups,hadsignificantlymoreproblemsinallareasof functioning.Theyscored thehigheston themajorityof theemotional/behavioural (e.g., anxiety,hyperactivity,physicalaggression);health(e.g.,generalhealth,useoftobacco/alcohol/drugs,sexualactivity);criminal(e.g.,arrests,courtappearance,incustody),andschoolfunctioning(e.g.,suspensions,specialeducation,droppingoutofschool)domains.
AnexaminationofsomeofthespecificoutcomesinGrade9forourtwomostat-riskgroups(thehigh delinquencyandtheescalators)highlightsthatthepathwaytodelinquencyisdevelopmentalandthatearlybehavioursareindicativeofsignificantproblemsbyGrade9.Forexample,evenbyGrade9thesehighriskgroupsweremuchmorelikelytobeinvolvedingangs,tohavebeenarrested,andtohaveacriminalrecordthantheothergroups.Furthermore,theescalatorsandhigh delinquencygroupsengagedinmoreriskyhealthbehaviours(e.g.,consumptionofharddrugsandinvolvementinunprotectedsexbehaviours).Thesebehavioursareproblematicnotonlyinthemselvesbutintheirconsequences(e.g.,earlypregnancywithpotentiallysubstanceusingparents).
Furthermore,theyouthinthehigh delinquencyandescalatorsgroupswereexperiencingsignificanttruancy,thusfurther limitingtheir longtermemploymentandeducationalopportunities. Inallofthedomainsexamined,theseat-riskyouthwereexperiencingproblemsinGrade9thatweremuchmoreseverethaninGrade3andhadmuchpotentiallysignificantlongertermoutcomes.
Estimated Economic Costs Associated with Delinquency Trajectories
Thefinalobjectiveofthepresentstudywastoestimatethecoststogovernmentassociatedwitheachdelinquencytrajectoryonutilizationofgovernmentresourcesinthecriminaljusticesystem,remedialeducation,healthcareandsocialservices,andsocialassistance.Themajorityoftheestimatedcostsassociatedwitheachofthetrajectorieswasintheeducationalsystem–64%ofthecostswereforremedialeducation.Incontrast,thepercentageoftheestimatedcostsassociatedwiththeotherdomainswas29%forhealthcareandsocialservices,6%forsocialassistance,and1%forthecriminaljusticesystem.
Asnotedearlier,itwasthedesistersgroups(highest desistersandmoderate desisters)whoreceivedthemostspecialeducationalservices,andwithrespecttolongtermoutcomes,thiswasapositiveandpreventativeinvestment.Areviewofthespecificestimatedhealthcarecostsindicatesthattheescalatorsinparticularhadthehighestcostsassociatedwithvisitingtheirdoctor,goingtotheemergencyroom,havingseriousinjuries,andvisitingwithanursepractitioner.Thesearereactionarycosts(asopposedtopreventativecosts)inthesensethatasignificanteventhashappened.Furthermore,forgirlsinthehigh delinquencygroup,somecostswereestimatedasbeingmuchhigherthanforboys(e.g.,numberofseriousinjuries,andovernightstayinhospital.At-riskgirlsmaybeparticularlyvulnerabletomedicalproblemsassociatedwithdelinquencyinvolvementcomparedtoat-riskboys.

25
Discussion
Highriskgirlswerealsomorecostlywithrespecttothecriminaljusticesystem.Comparedtoboys,thetotalestimatedcostsatage14(Grade9)forgirlswasalmosttwicethatforboys($4,835vs.$2,408).Thedatarevealedthatgirlsinthetwohighriskgroups(high delinquencyandescalators)weremuchmorelikelytohavehighercostsassociatedwitheachbeingarrestedandcourtappearances.Itappearsthatgirls,oncearrested,werealsomuchmorelikelytoenterthecriminal justicesystem.Admittedly,oursampleofgirlswassmallandmaynotberepresentative,butitdoesreflectthedevelopmentalcourseandcostsassociatedwithasmallsampleofveryhighriskdelinquentgirls.Thehighriskboygroupsalsohadthehighestestimatedcosts,butnotashighasthoseofthehighriskgirls.Insummary,ourfindingssuggestthatgirlscostthegovernmentmoremoneythanboysinalldomains(exceptsocialassistance).Specifically,summingacrossthesixtrajectorygroups,weestimatedthat,betweentheagesof4and14,girlscost$244,056whileboyscost$229,236.
Furthermore,approximately80%oftheestimatedcoststogovernmentwereduetothetwodesisterstrajectory groups (highest desisters and moderate desisters) and the youth from the two mostat-risktrajectories(escalatorsandhigh delinquency)whichrepresented18%ofthesample.Specifically,wefoundthatyouthfromthetwodesisterstrajectorygroups(13%ofthesample)accountedfor40%oftheestimatedcoststogovernment(primarilydrivenbyeducationcosts,apreventativeresponse);andyouthfromthetwomostat-risktrajectories(escalatorsandhigh delinquency;5%ofthesample)accountedfor40.6%oftheestimatedcoststogovernment.
Additionally,80%oftheestimatedcriminaljusticecostswereduetothehigh delinquencyandescalators groups.EventhoughtheestimatedCriminalJusticeSystemcoststogovernmentwererelativelylowasofGrade9(only1%oftheoverallcosts),thesetwogroupsmayjustbegettingstartedandthecostsassociatedwiththesegroupscanonlyincrease.Interestingly,thehigh delinquencyandescalatorsgroupsaccountedfor46%ofthereactivecosts(suchascriminaljusticesystem,healthcareandsocialservices)comparedto32%forthetwodesistersgroupsand22%forthetwo low delinquencygroups;forthepreventativecosts(e.g.,remedialeducation),thehigh delinquencyandescalatorgroupsaccountedfor38%ofthecostscomparedto44%forthetwodesistersgroupsand18%forthetwolow delinquency groups.Theimplicationisthatinvestingearlyinpreventioncostssuchasremedialeducationmayprovideat-riskchildrenandtheirfamiliestheopportunitytohavemorepositivedevelopmentaloutcomesanddesistfromdelinquencyinvolvement.Asaconsequence,investinginpreventioncansavethegovernmentmoneyinthelongrun.Themostat-riskgroupsdidnotreceivesufficientearlysupportandconsequentlythecostsassociatedwiththemwerereactiveandcostly.
Limitations
Therearemanystrengthstothecurrentresearch.TheBBBFresearchsamplecompriseddisadvantagedandat-riskcommunities;thecommunitieswerediverse(Francophone,Aboriginal,recentimmigrants,andmulticultural);thesamplehadbothboysandgirls;andthedataallowedforeconomicanalysestobeconducted.ThisisthefirstonaCanadiansample.Havingsaidthat,somelimitationsneedtobenoted.First,wewereunabletoexaminetheriskandoutcomefactorsbytrajectoryforbothboysandgirlsseparatelyduetothelownumberoffemalesinsomeofthetrajectorygroups.Second,someofthetrajectorieshadasmallsamplesizeandhencetheresultsmaynotbegeneralizable.Forexample,inthehigh delinquencygroup,thecostsofdelinquentbehaviouringirlswerehighrelativetoboys.Itmaybethatthisisanatypicalgroupthathadmanyarrests,orinfact,itmayberepresentativeofanextremegroupofhighriskgirlsthattodatehavebeenneglectedbyresearch.

26
ConclusionThereareearlyindicatorstothedevelopmentalpathwaysfordelinquency.Riskandprotectivefactorsassociated with more serious and escalating delinquency involvement become apparent as earlyasGrade3,whichcouldinformtheimplementationofanassessment/screeningtool.Furthermore,thecurrentresearchfindingssuggestthatdelinquencyinvolvementdoesnotjustemerge,butdevelopsovertime,andwithoutintervention,theproblemsaccumulateandareseriousandsignificantbyasearlyasGrade9.Theincreasedlikelihoodofarrests,courtappearances,andincarcerationbyGrade9forthehigh delinquency andescalatorgroups,indicatethatthedelinquentproblemsaresignificantandserious.Similarly,investmentinprevention,suchaseducationalsupport,canreducedelinquencyinvolvement.Themostat-riskgroupsfordelinquencyinvolvement(e.g.,escalatorsandhigh delinquency)accountedforthemajorityofthereactivecosts(e.g.,criminaljustice)andnotthepreventativecosts(e.g.,remedialeducation).
The present study also demonstrates that, although more research is needed to understand thedevelopmentaldelinquencytrajectoriesofgirls,theyappeartorequiremoresupportthanboys.Althoughourhighrisksampleofgirlswaslimited,therearesomepreliminaryindicationsfromthisresearchthattheyareataheightenedriskforproblems,suchasemotionalproblems,criminalactivityandcourtsysteminvolvement,andthecostsassociatedwiththeirproblemsmaybehigherthanforboysbecausetheyappearnotonlyinthecriminaljusticesystem,butalsointhehealthcaresystem.Traditionally,wehaveestimatedonlythecriminaljusticecosts.Itmaybethatthisvenuedoesnotreflectthefullrangeofcostsassociatedwithfemaledelinquency.
Insummary,differentdevelopmentalperiodsmayhavedifferentrisksandprotectivefactorsassociatedwithdelinquency.Thus,crimepreventionneedstooccurearlyindevelopmentandbeongoing.Ourstudyindicatesthatthereweremoreproblematicexternalizingbehavioursinourhigh delinquencyandescalators groupsbyGrade 3, as indicated by parents in particular and somewhat supported by teachers. Despite theproblematicbehavioursasreportedbyparents,teachersdidnotviewthemasdisplayingthemostproblematicexternalizingbehavioursintheclass;instead,teachersratedthehighest desistersgroupashavingmoreoppositional-defiantandphysicalaggressionproblemsthanthehigh delinquencyandescalatorgroups.Thislackofidentificationmaybeonereasontheydidnotreceiveextrasupportearly.Itmaybethathavingproblemsidentifiedearlybyothersoutsidethefamilyfacilitatetheidentificationandearlyinterventionforchildrenatriskforlaterseriousdelinquency.Inadditiontothebehaviouralproblems,thefamilylivesoftheescalators andhigh delinquencygroupwerealsoproblematic.Thesechildrenmayhavelackedopportunitiestointeractpositivelywithotherchildrenandadults.Theywerelivinginhomescharacterizedwithhigherlevelsofhostileandineffectiveparentingandhadpoorpeerandsiblingrelationships.Theymayhavelackedapositiveandsupportiveadultintheirlivestochampionthem,modelandreinforcepositivebehavioursandsocialrelationships.Lastly,theylikelylivedinhighriskneighbourhoodscharacterizedbysocialhousingandlowsocio-economicstatusthatmayhavecontributedtotheirdelinquenttrajectories.Furthermore,intheseneighbourhoods,theymayhavehadgreateraccesstopeersexperiencingsimilarproblems(asindicatedbytheirassociationswithfriendswhoweremorelikelytobedelinquentandbearrested).Thus,theremaybedelinquencyinfluenceoccurringwithintheirpeergroups.Therefore,crimepreventionapproachesneedtotargethighriskfamilies,livinginhighriskneighbourhoods,andprovidefamily,school,andcommunitysupport.ThissupportneedstobeongoingtoensurethatthebehaviouralproblemsdemonstratedearlyinGrade3doesnotescalateandaccumulateintoseriousdelinquencyanddrugabusebyGrade9.
Althoughwehavemadeagreatdealofprogress inunderstanding individualdifferences inantisocialbehaviourandlinkingthesetointerventions,muchworkremainstobedone.Researchthatcontinuestomonitorthedevelopmentofthesetrajectoriescouldbeinformativeasyouthtransitionintoearlyadulthood.Thementalandphysicalhealthandotherneedsofchildrenat-riskfordelinquencyinvolvementshouldnotbeignored.Anexaminationoftheyouthwhodesistfromdelinquencyprovidestrongsupportforthevalueofinvestingearlyinchildrentopreventnegativelongtermoutcomes.Evenmodestlysuccessfulpreventionandinterventioninvestments,suchasineducation,yieldedsignificantbenefits,includingdecreasingfutureexpenditureassociatedwithdelinquency,improvingwell-beingandsafetyoffamilies,children,andyouthinacommunity,andreducingcrimeanddelinquency.

27
Referencesandrews, d. a., & J. bonta. 1998.The Psychology of Criminal Conduct(2nded.).Cincinnati,OH:Anderson.
angus, d. e., J. e. Cloutier, T. albert, d. Chenard, a. shariatmadar, W. Pickett, et al.1998.The Economic Burden of Unintentional Injury in Canada.Toronto,ON:SmartRiskFoundation.
barnett, W. s, & l. n. masse.2007.“Comparativebenefit-costanalysisoftheAbecedarianprogramanditspolicyimplications”.Economics of Education Review,26:113-125.
boyd, J.W., W. s. barnett, e. bodrova, d. J. leong, d. Gomby, k. b. robin, & J. T. Hustedt. 2005.Promoting Children’s Social and Emotional Development through Preschool.NewBrunswick,NJ:NIEER.
browne, G., a. Gafni, & J. roberts. 2002.Approach to the Measurement of Costs (expenditures) when Evaluating Health and Social Programs.(WorkingPaperSeries01-03).Hamilton,Ontario:McMasterUniversity,System-LinkedResearchUnitonHealthandSocialServiceUtilization.
Cohen, m.a.1998.“Themonetaryvalueofsavingahighriskyouth”.Journal of Quantitative Criminology,14:5-33.
Cohen, m.a., & a. r. Piquero.2009.“Newevidenceonthemonetaryvalueofsavingahighriskyouth”.Journal of Quantitative Criminology,25:25-49.
farrington, d. P.1989.“Earlypredictorsofadolescentaggressionandadultviolence”.Violence & Victims,4(2):79-100.
Hepworth, P.2000.“Jack’stroubledcareer:Thecoststosocietyofayoungpersonintrouble”.Prevention Newsletter,2:10-11.Ottawa:JusticeCanada,NationalCrimePreventionCentre.
Hoeve, m., a. blokland, J. s. dubas, r. loeber, J. Gerris, & P. H. van der laan.2008.“Trajectoriesofdelinquencyandparentingstyles”.Journal of Abnormal Child Psychology,36(2):223-235.
Jones, b., d. s. nagin, & k. roeder. 2001.“ASASprocedurebasedonmixturemodelsforestimatingdevelopmentaltrajectories”.Sociological Methods and Research,29:374-393.
karoly, l., P. Greenwood, s. everingham, J. Houbé, m. kilburn, C. rydell, et al.1998.Investing in Our Children: What We Know and Don’t Know about the Costs and Benefits of Early Childhood Interventions.SantaMonica,CA:RANDCorporation.
karoly, l. a., m. r. kilburn, & J. s. Cannon.2005.Early Childhood Interventions: Proven Results, Future Promises.SantaMonica,CA:RANDCorporation.
kass, r. e., & a. e. raftery.1995.“Bayes factor”.Journal of the American Statistical Association,90:773-795.
lacourse, e., s. Côté, d. s. nagin, f. vitaro, m. brendgen, & r. e. Tremblay.2002.“Alongitudinal-experimental approach to testing theories of antisocial behaviour development”. Development and Psychopathology,14:909-924.
lacourse, e., d. nagin, r. e. Tremblay, f. vitaro, & m. Claes.2003.“Developmentaltrajectoriesofboys’delinquentgroupmembershipandfacilitationofviolentbehavioursduringadolescence”.Development and Psychopathology,15:183-197.
lerner, r. m.1996.“Relativeplasticity,integration,temporality,anddiversityinhumandevelopment:Adevelopmentalcontextualperspectiveabouttheory,process,andmethod”.Developmental Psychology,32:781-786.

28
Better Beginnings, Better Futures Study: Delinquency Trajectories of At-Risk Youth
moffitt, T.e.2001.“Childhoodpredictorsdifferentiatelife-coursepersistentandadolescence-limitedantisocialpathwaysamongmalesandfemales”.Development and Psychopathology,13:355-375.
moffitt, T.e., a. Caspi, m. rutter, & P. a. silva. 2001.Sex Differences in Antisocial Behaviour: Conduct Disorder, Delinquency, and Violence in the Dunedin Longitudinal Study.Cambridge:CambridgeUniversityPress.
mrazek, P. J., & C. H. brown.2002.“Anevidenced-based literature reviewregardingoutcomes inpsychosocialpreventionandearlypreventioninyoungchildren”. InC.C.Russell (Ed.),The State of Knowledge about Prevention/Early Intervention(pp.42-144).Toronto,ON:InvestinKidsFoundation.
nagin, d.s.1999.“Analyzingdevelopmentaltrajectories:asemi-parametric,group-basedapproach”.Psychological Methods,4:139-157.
nagin, d.s.2005.Group-Based Modeling of Development.Landon:HarvardUniversityPress.
national Council on Welfare.2004.Welfare Incomes 2003.Ottawa:NCW.
nores, m., C. r. belfield, W. s. barnett & l. schweinhart.2005.“UpdatingtheeconomicimpactsoftheHigh/ScopePerryPreschoolProgram”.Educational Evaluation and Policy Analysis,27(3):245-261.
odgers, C.l., T. e. moffitt, J. m. broadbent, n. dickson, r. J. Hancox, H. Harrington, r. Poulton, m. r. sears, W. m. Thompson, & a. Caspi.2008. “Femaleandmaleantisocial trajectories:Fromchildhoodoriginstoadultoutcomes”.Development and Psychopathology,20:673-716.
ontario ministry of Community and social services.2003.Ontario Disability Support Program.RetrievedJanuary25,2008.
Peters, r. dev., a. J. bradshaw, k. Petrunka, G. nelson, y. Herry, W. m. Craig, et al.2010.The ‘Better Beginnings, Better Futures’ Ecological, Community-Based Early Childhood Prevention Project: Findings from Grade 3 to Grade 9.Manuscriptsubmittedforpublication.
Peters, r. dev., k. Petrunka, & r. arnold. 2003. “TheBetterBeginnings,BetterFuturesProject:Auniversal,comprehensive,community-basedpreventionapproachforprimaryschoolchildrenandtheirfamilies”.Journal of Clinical Child and Adolescent Psychology, 32,215-227.
reynolds, a. J., J. a. Temple, d. l. robertson, & e. a. mann.2002.“Age21cost-benefitanalysisoftheTitleIChicagoChild-ParentCenters”.Educational Evaluation and Policy Analysis, 24(4),267-303.
rutter, m. 1986. “Child psychiatry: The interface between clinical and developmental research”.Psychological Medicine,16,151-169.
savoie, J.2006.“Youthself-reporteddelinquency”.Toronto.Juristat, 27(6).Ottawa:StatisticsCanada.
schonberg, m.a. & d. s. shaws. 2007. “Risk factors for boy’s conduct problems in poor andlower-middle-classneighborhoods”.Journal of Abnormal Child Psychology, 35,759-772.
serbin, l.a., d. m. stack, n. de Genna, n. Grunzeweig, C.e. Temcheff, a.e. schwartzman, & J. ledingham. 2004. “Whenaggressivegirlsbecomemothers:Problems inparenting, health, anddevelopmentacrosstwogenerations”.InM.Putallaz&K.Bierman(Eds.),Aggression, antisocial behavior, and violence among girls: Duke series in child development and public policy(pp.262-285).NewYork,NY:GuilfordPress.
silverthorn, P. & P. J. frick.1999.“Developmentalpathwaystoantisocialbehavior:Thedelayed-onsetpathwayingirls”.Development and Psychopathology,11,101-126

29
References
statistics Canada. 1995. National Longitudinal Survey of Children and Youth: Overview of survey instruments from 1994-95 data collection cycle I.StatisticsCanadaCatalogueno.89F0077XIE.Ottawa,ON:StatisticsCanada.RetrievedDecember4,2008
Tremblay, r. e., m. a. G. van aken, & W. koops. (eds.)2009.Development and Prevention of Behaviour Problems: From Genes to Social policy.NewYork,NY:PsychologyPress.280p.
Waddell, C., J. m. Hua, o. m. Garland, r. d. Peters, & k. mcewan.2007.“Preventingmentaldisordersinchildren:Asystematicreviewtoinformpolicy-making”.Canadian Journal of Public Health, 98,166-173.
Wiesner, m., &m. Windle.2006.“Youngadultsubstanceuseanddepressionasaconsequenceofdelinquencytrajectoriesduringmiddleadolescence”.Journal of Research on Adolescence, 16,239-64.
Wolke, d., s. Woods, l. bloomfield, & l. karstadt.2000.“Theassociationbetweendirectandrelationalbullyingbehaviourproblemsamongprimaryschoolchildren”.Journal of Child Psychology and Psychiatry,41:989-1002.

30
aPPendiX a. soCiodemoGraPHiC CHaraCTerisTiCs of THe sTudy samPle aT Grade 3
a Thelongitudinalsampleof842isbasedonachildhavingatleastonedatacollectionpointatGrade3,6,or9. AtGrade3,only789wereinterviewed.b Theterm‘parent’isusedbecause98%oftherespondentsinterviewedwereparents.c Resultsofchi-squaretest.d Resultoft-test;NS,notstatisticallysignificant.
family Characteristic
Cohort at Grade 3 (n = 789a)
P-valueGirls boys
Parentbplaceofbirth,%
Ontario 49.4 52.1 NSc
ElsewhereinCanada 11.4 10.0
OutsideCanada 39.2 37.9
Parentculturalgroup,%
Anglophone 24.8 30.1 NSc
Francophone 36.4 33.4
Indigenous/Native 2.5 2.4
Other 36.4 34.1
Singleparentfamilystatus,% 33.2 29.6 NSc
TeenageMother,% 22.8 24.7 NSc
Parentlevelofeducation,%
Highschoolincomplete 34.5 34.1 NSc
Highschoolcomplete 13.8 10.9
Post-secondary,non-university 43.4 45.0
University/professionaldegree 8.3 10.0
Motheremployed,%
Full-time 43.1 47.0 NSc
Part-time 19.3 18.5
Notemployed;seekingwork 15.7 12.8
Notemployed;notseekingwork 21.8 21.6
Fatheremployed,%
Full-time 74.9 76.8 NSc
Part-time 7.8 6.1
Notemployed;seekingwork 4.1 5.1
Notemployed;notseekingwork 13.2 12.1
Mean(SD)monthlyincome,$CAD 2,758.05 2,926.30 NSd
FamilyLivingBelowStatisticsCanadaLowIncomeCutOff,%
58.4 59.6 NSc
FamilyLivinginPublicHousing,% 18.9 19.7 NSc

31
aPPendiX b. desCriPTion of sTaTisTiCal analyses
Toidentifythetrajectoriesofdelinquencyweusedthesemi-parametricgroup-basedtrajectoryapproach(Jonesetal.,2001;Nagin,1999;Nagin,2005).Inthismodeling,thedependentvariablewasthetotalstandardizeddelinquencyscalescoreatGrades3,6,and9.Thecensorednormaldistributionwasusedtomodelthetrajectoriestoaccountforthecensoringatthelowerandupperboundsofthedelinquencyscale.Apolynomialrelationshipwasusedtolinkagetodelinquencybehaviour.WecomparedmodelswithdifferentnumbersofgroupsusingaBayesianinformationcriterion(BIC)(Kass&Raftery,1995).AlargeBICvaluecorrespondstoagoodmodelwithalargelog-likelihoodvalueandnottoomanyparameters.Wetestedcompetingmodelsof2,3,4,5,and6groupsofdelinquencytodeterminethe“best”modelbasedonBICcriterion;wefoundthattheBICvaluesfor2-,3-,4-,5-,and6-groupmodelswere,respectively,-886.8,-881.2,-894.4,-851.8,and-838.2.ApplicationofthemaximumBICformodelselectionindicatedthatthesix-groupsolutionwasthe“best”modelforthecombinedsampleofgirlsandboys.
Toexaminetrajectorygroupdifferencesontheriskandprotectivefactors,aswellastheoutcomes,weemployedacombinationofanalysisofvariance(ANOVA)andlogisticregressiondependingonthetypeofoutcomevariableinquestion(i.e.,ANOVAforcontinuousvariables,andlogisticregressionforbinaryvariables)tocomparethemeansorproportionsofvarianceofthevariable.OmnibusForchi-squaretestswerereportedtoindicatethesignificanceofoverallrelationship,andBonferronitestswerecarriedouttoexaminepairwisecomparisons.
Toestimatecostsassociatedwitheachtrajectoryofdelinquency,weestimatedanaveragecost/child/trajectoryforeachofthe12monetizablegovernmentresourcesdescribedinTable1.Foreachchild,weestimatedthecostsofutilizingthegovernmentresourcebymultiplyingtheunitcostavailablefromasecondarysource(e.g.,$29.44foranappointmentwithafamilyphysician)bytheoccurrenceoftheevent.Alldollarfiguresthatwereportwerediscountedatarateof3%.Thisdiscountratefallswithintherangeofratescommonlyusedandrecommendedinpublic-policyanalysis(e.g.,Karolyetal.,1998;Karolyetal.,2005;Reynoldsetal.,2002).Allmissingvalues,includingthevaluesofthemissinggrades(suchasGrades4,5,7and8whennodatacollectiontookplace),wereinterpolated,giventhattherewereatleast60%datapointspresent.Eachgradespecificcostfigurewasthencombinedandreclassifiedintothreemajorgroups,JKtoGrade3(ages4to8),Grade4toGrade6(ages9to11),andGrade7toGrade9(ages12to14),andpresentedbydelinquencygrouptrajectoriesandchild’sgender.Weusedthefollowingequationtoestimatetheaveragecostforeachofthe12measuresofutilizationofgovernmentresourcesforeachgrade.Thecostvaluesarebasedonthevalue(v)ofeachoutcomeasoutlinedinTable1(e.g.,$29.44foravisittoafamilyphysician),multipliedbyfrequencyofoccurrence(o)ofthatoutcomeforeachchildforthatyear.
where,VO=Averagecostforanoutcomemeasureinagrade; i=numberofchildren(1,...,n); n=samplesize; v=valueofoutcomes($); o=occurrencesoftheoutcome.
(1)∑n
i=1
vi oi / nVO=

32
aP
Pe
nd
iX C
. Gr
ad
e 3
ris
k a
nd
Pr
oT
eC
Tiv
e f
aC
To
r a
na
lys
es
γ Fu
llsa
mpl
epr
esen
tsm
eans
orp
ropo
rtio
nsa
djus
ted
fort
hee
ffect
sof
gen
dero
fchi
ld.M
ale
sam
ple
resu
lts
repr
esen
tab
ivar
iate
rela
tions
hip
ofo
utco
me
varia
ble
with
traj
ecto
ryg
roup
form
ale
child
ren
only
.Ψ
B
onfe
rron
ites
ts(α
=0
.01)
are
use
dfo
rmul
tiple
gro
upc
ompa
rison
s.ς
Indi
cate
ssi
gnifi
cant
diff
eren
ces
betw
een
mal
ean
dfe
mal
ech
ildre
nat
p<
.001
.*
p<
0.0
5**
p
<0
.01
***
p <
0.0
01
ns
a mpl
eγ
om
nibu
s f
or χ
2
Traj
ecto
ry g
roup
Gro
up
cont
rast
sΨH
igh
d
elin
quen
cy(1
)
esc
alat
ors
(2)
Hig
hest
d
esis
ters
(3)
mod
erat
e d
esis
ters
(4)
2nd
low
est
del
inqu
ency
(5)
low
est
del
inqu
ency
(6)
indi
vidu
al C
hild
ri s
k fa
ctor
s
me
an
sH
yper
activ
ity:
pare
ntr a
ted
(h
ighe
rsco
res
indi
cate
hi
gher
hyp
erac
tivity
)
736
Fullς
F=
11.
9**
*8.
406.
026.
305.
003.
712.
031>
5,6;
2>
6;
3>6;
4>
6;5
>6
397
Mal
eF
=1
1.6*
**10
.50
7.67
7.08
5.19
4.01
1.78
1>4,
5,6;
2>5
,6;
3>6;
4>
6
Hyp
erac
tivity
:t e
ache
rrat
ed
(hig
hers
core
sin
dica
te
h igh
erh
yper
activ
ity)
678
Fullς
F=
44.
8***
7.29
4.87
10.0
57.
552.
972.
111>
5,6;
2>
3;
3>5,
6;4
>5,
6
364
Mal
eF
=2
4.8*
**8.
605.
9210
.15
8.46
3.63
3.27
3>5,
6;4
>5,
6
Dep
ress
ion:
pa
rent
r ate
d
(hig
hers
core
sin
dica
te
high
erd
epre
ssio
n)
752
Full
F=
1.9
1.54
1.17
1.00
1.02
0.94
0.62
404
Mal
eF
=2
.5*
1.88
1.60
1.15
0.86
0.93
0.64
Dep
ress
ion:
t e
ache
rrat
ed
(hig
hers
core
sin
dica
te
high
erd
epre
ssio
n)
680
Fullς
F=
27.
8***
2.65
1.74
4.36
2.93
1.15
0.65
2>3;
3>
5,6;
4 >
5,6
366
Mal
eF
=1
7.7*
**3.
502.
314.
233.
421.
310.
853>
5,6;
4>
5,6
Opp
ositi
onal
de
fiant
:p a
rent
rate
d(h
ighe
rsco
res
indi
cate
hi
gher
defi
ance
)
751
Full
F=
13.
4***
10.2
97.
677.
855.
394.
703.
611>
4,5,
6;
2 >5,
6;3
>5,
6
403
Mal
eF
=1
1.8*
**10
.63
8.87
8.46
5.34
4.92
3.14
1>4,
5,6;
2 >
4,5,
6;3
>5,
6

33
Appendix C
ns
ampl
eγ
om
nibu
s f
or χ
2
Traj
ecto
ry g
roup
Gro
up
cont
rast
sΨH
igh
d
elin
quen
cy(1
)
esc
alat
ors
(2)
Hig
hest
d
esis
ters
(3)
mod
erat
e d
e sis
ters
(4)
2nd
low
est
de l
inqu
ency
(5)
low
est
de l
inqu
ency
(6)
Opp
ositi
onal
de
fiant
:t e
ache
rrat
ed
(hig
hers
core
sin
dica
te
high
erd
efian
ce)
678
Fullς
F=
10
9.0*
**1 1
.25
2.59
17.7
110
.13
2.71
1.57
1>2,
3,5,
6;
2>3,
4;3
>4,
5,6;
4>
5,6
364
Mal
eF
=7
6.3*
**13
.80
3.15
18.0
011
.14
3.02
1.85
1>2,
5,6;
2>3
,4;
3>4,
5,6;
4>
5,6
Pas
sive
vi
ctim
izat
ion:
t e
ache
rrat
ed
(hig
hers
core
sin
dica
te
h igh
erv
ictim
izat
ion)
679
Full
F=
8.1
***
2.55
1.79
2.39
1.85
1.02
0.69
3>6;
4>
5,6
365
Mal
eF
=6
.3**
*3.
202.
002.
541.
921.
050.
694>
5
Phy
sica
lag
gres
sion
:p a
rent
rate
d
(hig
hers
core
sin
dica
te
high
era
ggre
ssio
n)
719
Full
F=
16.
1***
4.01
2.14
3.91
2.06
1.24
0.38
1>5,
6;2
>6;
3 >
4,5,
6;4
>5,
6
384
Mal
eF
=1
1.7*
**4.
253.
144.
152.
331.
400.
261>
5,6;
2>
6;
3 >5,
6;4
>6
Phy
sica
lag
gres
sion
:te
ache
rrat
ed
(hig
hers
core
sin
dica
te
h igh
era
ggre
ssio
n)
676
Fullς
F=
1 1
0.2*
**4.
160.
8210
.13
5.36
1.22
0.62
1>2,
3,5,
6;
2 >3,
4;3
>4,5
,6;
4>5,
6
362
Mal
eF
=6
3.8*
**5.
601.
0810
.23
5.76
1.53
0.92
1>2,
3,5,
6;
2>3,
4;3
>4,5
,6;
4>5,
6
Pr
oP
or
Tio
ns
Ser
ious
i nju
ries
(0=
no,
1=
yes
)75
2Fu
llF
=1
.30.
100.
210.
060.
050.
090.
0740
4M
ale
χ2=
11.
7*0.
000.
270.
030.
090.
040.
08

34
Better Beginnings, Better Futures Study: Delinquency Trajectories of At-Risk Youth
ns
a mpl
eγ
om
nibu
s f
or χ
2
Traj
ecto
ry g
roup
Gro
up
cont
rast
sΨH
igh
d
elin
quen
cy(1
)
esc
alat
ors
(2)
Hig
hest
d
esis
ters
(3)
mod
erat
e d
esis
ters
(4)
2nd
low
est
del
inqu
ency
(5)
low
est
del
inqu
ency
(6)
fam
ily r
isk
fact
ors
Edu
catio
nof
re
spon
dent
(lo
wer
val
ues
indi
cate
le
sse
duca
tion)
748
Full
F=
6.5
***
11.9
212
.96
11.9
112
.41
13.4
014
.34
3>6;
4>
5,6
402
Mal
eF
=2
.4*
12.0
013
.47
12.0
012
.97
13.5
414
.11
Mob
ility
( n
umbe
rofm
oves
)(h
ighe
rval
ues
in
dica
tem
ore
mov
es)
747
Full
F=
3.7
**2.
301.
510.
561.
010.
950.
721>
6
401
Mal
eF
=2
.7*
2.38
1.20
0.62
0.88
0.90
0.68
Hos
tile-
inef
fect
ive
p are
ntin
g
(hig
herv
alue
sin
dica
te
mor
eh o
stili
ty)
598
Full
F=
7.0
***
19.9
717
.10
17.0
316
.16
14.6
113
.14
1>5,
6;4
>6
316
Mal
eF
=5
.8**
*21
.00
18.2
717
.00
16.0
214
.75
12.4
31>
6;2
.6
Low
fam
ily
func
tioni
ng( F
AD
)(lo
wer
val
ues
indi
cate
l o
wer
f unc
tioni
ng)
749
Full
F=
3.1
**22
.74
22.3
823
.21
22.8
023
.70
24.8
14>
6
402
Mal
eF
=1
.523
.50
22.0
022
.92
23.0
323
.60
24.6
8
Par
entd
epre
ssio
n(h
ighe
rval
ues
indi
cate
hi
gher
dep
ress
ion)
750
Full
F=
2.6
*20
.96
19.0
318
.29
20.2
819
.41
16.8
9
404
Mal
eF
=1
.321
.00
18.5
317
.62
19.5
419
.14
16.5
7Fa
mily
str
ess
(hig
herv
alue
sin
dica
te
h igh
ers
tres
ses)
752
Full
F=
2.8
*2.
842.
222.
031.
461.
561.
28
404
Mal
eF
=1
.82.
751.
932.
001.
371.
541.
07
Poo
r rel
atio
nshi
p
with
sib
lings
:pa
rent
rate
d
(hig
herv
alue
sin
dica
te
poor
rela
tions
hip)
663
Full
F=
9.6
***
3.44
3.23
3.26
2.21
2.29
1.88
1>6;
2>
4,5,
6;
3 >4,
5,6
354
Mal
eF
=5
.93*
**3.
003.
213.
332.
242.
321.
812>
6;3
>6

35
Appendix C
Pee
r r
isk
fact
ors
me
an
sP
oorr
elat
ions
hips
w
ithp
eers
:p a
rent
rate
d
(hig
herv
alue
sin
dica
te
p oor
r ela
tions
hip)
749
Full
F=
8.7
***
2.64
2.12
2.94
1.89
1.81
1.59
1>6;
3>
4,5,
6
403
Mal
eF
=9
.5**
*2.
632.
533.
001.
881.
811.
391>
6;2
>6;
3>
4,5,
6
ns
ampl
eγ
om
nibu
s f
or χ
2
Traj
ecto
ry g
roup
Gro
up
cont
rast
sΨH
igh
d
elin
quen
cy(1
)
esc
alat
ors
(2)
Hig
hest
d
esis
ters
(3)
mod
erat
e d
e sis
ters
(4)
2nd
low
est
de l
inqu
ency
(5)
low
est
de l
inqu
ency
(6)
Pr
oP
or
Tio
ns
Sin
gle
p are
nt
(0=
no,
1=
yes
)75
2Fu
llF
=8
.2**
*0.
820.
460.
540.
440.
280.
131>
5,6;
4>
6
404
Mal
eχ2
=2
3.4*
**0.
750.
400.
460.
390.
270.
04Lo
wi n
com
e(b
elow
LIC
O)
(0=
no,
1=
yes
)
738
Full
F=
3.7
**1.
000.
710.
770.
670.
560.
49
395
Mal
eχ2
=1
4.5*
1.00
0.73
0.85
0.65
0.54
0.52
Teen
age
mot
her
( <20
yea
rs)
(0=
no,
1=
yes
)
752
Full
F=
6.0
***
0.46
0.50
0.30
0.37
0.20
0.12
2>5,
6;4
>6
404
Mal
eχ2
=8
.40.
380.
330.
310.
310.
200.
11
Dru
gu s
e(0
=n
o,1
=y
es)
750
Full
F=
1.9
0.18
0.00
0.00
0.05
0.04
0.02
404
Mal
eχ2
=6
.00.
130.
000.
000.
070.
030.
00H
igh
r isk
d rin
king
(0
=n
o,1
=y
es)
752
Full
F=
0.8
0.00
0.13
0.00
0.07
0.07
0.04
404
Mal
eχ2
=2
.50.
000.
000.
000.
070.
060.
07

36
Better Beginnings, Better Futures Study: Delinquency Trajectories of At-Risk Youth
ns
a mpl
eγ
om
nibu
s f
or χ
2
Traj
ecto
ry g
roup
Gro
up
cont
rast
sΨH
igh
d
elin
quen
cy(1
)
esc
alat
ors
(2)
Hig
hest
d
esis
ters
(3)
mod
erat
e d
esis
ters
(4)
2nd
low
est
del
inqu
ency
(5)
low
est
del
inqu
ency
(6)
sch
ool r
isk
fact
ors
me
an
sP
oorp
erce
ptio
ns
o fs
choo
l:
p are
ntr a
ted
(h
ighe
rsco
res
mea
npo
orp
erce
ptio
n)
740
Full
F=
0.7
9.56
9.80
9.14
9.79
9.93
10.2
6
397
Mal
eF
=0
.79.
759.
408.
9210
.15
9.87
9.85
Low
Pea
body
s c
ores
(lo
wer
val
ues
in
dica
telo
wer
sco
res)
728
Full
F=
4.3
***
92.8
598
.12
96.9
596
.96
99.8
010
3.38
4>6
394
Mal
eF
=2
.4*
95.1
197
.15
98.1
297
.44
99.9
510
4.66
Low
sco
res
o n
WIS
C–
Std
.Blo
ck
Des
ign
(lo
wer
val
ues
in
dica
tel o
wer
sco
res)
710
Full
F=
2.2
10.8
011
.91
10.9
010
.82
11.6
412
.50
381
Mal
eF
=1
.211
.83
12.2
911
.77
11.0
011
.93
12.9
2
Pr
oP
or
Tio
ns
Low
EQ
AO
m
ath
scor
e
(0=
not
low
,1=
low
)
527
Full
F=
3.3
**0.
840.
730.
880.
820.
700.
504>
6
271
Mal
eχ2
=1
2.4*
0.86
0.69
0.86
0.70
0.75
0.41
Rec
eive
d sp
ecia
led
./ser
vice
s(0
=n
o,1
=y
es)
602
Full
F=
4.8
***
0.17
0.33
0.47
0.42
0.23
0.12
4>5,
6
332
Mal
eχ2
=1
1.9*
0.20
0.33
0.46
0.40
0.22
0.17
Gra
der e
petit
ion
(0=
no,
1=
yes
)65
6Fu
llF
=0
.45
0.25
0.10
0.07
0.18
0.17
0.17
354
Mal
eχ2
=1
.90.
170.
080.
080.
190.
160.
13

37
Appendix C
ns
ampl
eγ
om
nibu
s f
or χ
2
Traj
ecto
ry g
roup
Gro
up
cont
rast
sΨH
igh
d
elin
quen
cy(1
)
esc
alat
ors
(2)
Hig
hest
d
esis
ters
(3)
mod
erat
e d
e sis
ters
(4)
2nd
low
est
de l
inqu
ency
(5)
low
est
de l
inqu
ency
(6)
nei
ghbo
urho
od r
isk
fact
ors
me
an
sLo
w
neig
hbou
rhoo
d
satis
fact
ion
(low
erv
alue
sin
dica
te
low
ers
atis
fact
ion)
727
Full
F=
2.3
*16
.66
19.0
118
.39
19.3
820
.31
20.6
6
390
Mal
eF
=1
.318
.25
19.6
718
.08
19.4
220
.45
21.0
0
Pr
oP
or
Tio
ns
L ivi
ngi n
pub
lic
h ous
ing
(0
=n
o,1
=y
es)
746
Full
F=
6.7
***
0.60
0.46
0.41
0.22
0.18
0.08
1>6;
2>
6
402
Mal
eχ2
=1
5.8*
*0.
570.
400.
390.
220.
170.
11

38
Better Beginnings, Better Futures Study: Delinquency Trajectories of At-Risk Youth
ns
ampl
eγ
om
nibu
s f
or χ
2
Traj
ecto
ry g
roup
Gro
up
cont
rast
sΨH
igh
d
elin
quen
cy(1
)
esc
alat
ors
(2)
Hig
hest
d
esis
ters
(3)
mod
erat
e d
esis
ters
(4)
2nd
low
est
del
inqu
ency
(5)
low
est
del
inqu
ency
(6)
indi
vidu
al C
hild
Pro
tect
ive
fact
ors
me
an
sL o
wa
nxie
ty:
p are
ntra
ted
(lo
wer
val
ues
indi
cate
lo
wer
anx
iety
)
730
Full
F=
3.8
**4.
734.
093.
533.
032.
641.
95
392
Mal
eF
=3
.3**
4.75
4.80
3.77
2.90
2.62
1.74
Low
anx
iety
:te
ache
r rat
ed
(low
erv
alue
s
indi
cate
low
era
nxie
ty)
675
Full
F=
15.
0***
4.34
3.53
6.76
4.62
2.42
1.30
3>5,
6;4
>5,
6
362
Mal
eF
=1
1.8*
**5.
804.
926.
545.
312.
501.
563>
5,6;
4>
5,6
Con
flict
m
anag
emen
t:
p are
ntr a
ted
(h
ighe
rval
ues
indi
cate
h i
gher
man
agem
ent)
744
Full
F=
13.
8***
9.94
12.8
511
.91
13.6
215
.37
17.0
91>
5,6;
2>
6;
3>5,
6;4
>5,
6
399
Mal
eF
=1
0.4*
**9.
2511
.20
11.6
213
.83
14.9
817
.57
1>5,
6;2
>5,
6;
3 >6;
4>
6
Con
flict
m
anag
emen
t:te
ache
rrat
ed
(hig
herv
alue
sin
dica
te
h igh
erm
anag
emen
t)
679
Fullς
F=
46.
0***
7.67
9.59
3.65
6.25
9.61
9.71
1>3;
2>
3,4;
3>
4,5,
6;4
>5,6
366
Mal
eF
=3
5.5*
**6.
338.
773.
235.
549.
369.
312>
3,4;
3>
5,6;
4 >
5,6
Hel
ping
/co
oper
atio
n:
p are
ntra
ted
(h
ighe
rval
ues
indi
cate
h i
gher
coo
pera
tion)
748
Full
F=
6.5
***
5.46
7.34
8.59
8.00
8.94
9.39
1>5,
6
403
Mal
eF
=4
.2**
*5.
007.
138.
237.
978.
639.
571>
5,6
Hel
ping
/co
oper
atio
n:
teac
herr
ated
(h
ighe
rval
ues
indi
cate
hi
gher
coo
pera
tion)
679
Fullς
F=
32.
1***
9.90
11.3
65.
488.
9613
.25
14.8
02>
3;3
>5,
6;
4 >5,
6
366
Mal
eF
=1
8.4*
**8.
6710
.08
4.92
8.20
12.4
413
.31
3>5,
6;4
>5,
6
Out
goin
g/
asse
rtiv
e:
p are
ntra
ted
(h
ighe
rval
ues
indi
cate
hi
gher
ass
ertiv
enes
s)
747
Full
F=
1.3
9.16
10.5
510
.56
10.1
410
.30
10.9
3
400
Mal
eF
=1
.49.
5010
.07
10.1
510
.34
10.0
011
.29

39
Appendix C
fam
ily P
rote
ctiv
e fa
ctor
s
me
an
sC
onsi
sten
t/
effe
ctiv
e pa
rent
ing
(hig
herv
alue
sin
dica
te
mor
ec o
nsis
tent
pa
rent
ing)
596
Full
F=
2.4
*19
.27
18.7
219
.28
19.4
719
.84
20.9
1
317
Mal
eF
=2
.6*
18.6
718
.25
19.4
019
.79
20.0
521
.55
Soc
ial s
uppo
rt
(hig
herv
alue
sin
dica
te
mor
es o
cial
sup
port
)
745
Full
F=
1.1
21.3
020
.76
21.4
520
.52
20.7
921
.37
401
Mal
eF
=0
.821
.25
20.0
021
.46
20.4
120
.76
21.2
1
ns
ampl
eγ
om
nibu
s f
or χ
2
Traj
ecto
ry g
roup
Gro
up
cont
rast
sΨH
igh
d
elin
quen
cy(1
)
esc
alat
ors
(2)
Hig
hest
d
esis
ters
(3)
mod
erat
e d
e sis
ters
(4)
2nd
low
est
de l
inqu
ency
(5)
low
est
de l
inqu
ency
(6)
Out
goin
g/
asse
rtiv
e:
t eac
herr
ated
(h
ighe
rval
ues
indi
cate
hi
gher
ass
ertiv
enes
s)
679
Full
F=
6.9
***
9.87
10.4
66.
958.
6010
.29
10.8
43>
5,6;
4>
5,6
366
Mal
eF
=4
.8**
*9.
009.
926.
628.
2210
.11
10.2
74>
5
Sel
f-co
ncep
t(h
ighe
rval
ues
indi
cate
h i
gher
sel
f-co
ncep
t)
729
Full
F=
2.1
59.6
559
.01
57.1
661
.65
60.2
662
.73
392
Mal
eF
=1
.860
.43
60.7
356
.69
62.2
560
.18
63.4
6
Num
bero
fpeo
ple
i m
port
antt
och
ild
(hig
herv
alue
sin
dica
te
h igh
ern
umbe
rof
peop
le)
752
Full
F=
1.9
7.54
10.0
05.
345.
476.
626.
40
404
Mal
eF
=0
.85.
385.
405.
315.
316.
666.
36

40
Better Beginnings, Better Futures Study: Delinquency Trajectories of At-Risk Youth
ns
a mpl
eγ
om
nibu
s f
or χ
2
Traj
ecto
ry g
roup
Gro
up
cont
rast
sΨH
igh
d
elin
quen
cy(1
)
esc
alat
ors
(2)
Hig
hest
d
esis
ters
(3)
mod
erat
e d
esis
ters
(4)
2nd
low
est
del
inqu
ency
(5)
low
est
del
inqu
ency
(6)
sch
ool P
rote
ctiv
e fa
ctor
s
me
an
sR
elat
ions
hip
w
itht e
ache
rs/
invo
lvem
ent
ins
choo
l:
p are
ntra
ted
(h
ighe
rsco
res
indi
cate
m
ore
posi
tive
re
latio
nshi
p/m
ore
in
volv
emen
t)
714
Full
F=
1.6
22.0
922
.25
19.2
522
.73
22.2
323
.27
383
Mal
eF
=2
.5*
20.1
721
.43
18.0
823
.29
22.4
322
.75
Ach
enba
ch
acad
emic
fu
nctio
ning
(h
ighe
rval
ues
indi
cate
hi
gher
func
tioni
ng)
154
Full
F=
1.1
49.
969.
808.
509.
4910
.30
12.4
0
93M
ale
F=
0.6
9.33
9.83
8.67
9.71
10.6
29.
75
Ach
enba
ch
adap
tive
f u
nctio
ning
(h
ighe
rval
ues
indi
cate
h i
gher
f unc
tioni
ng)
416
Full
F=
18.
0***
10.0
410
.80
7.22
9.89
12.4
414
.86
1>6;
2>
6;
3>5,
6;4
>5,
6;
5>6
229
Mal
eF
=1
1.4*
**9.
3310
.70
6.67
9.31
12.2
013
.31
3>5,
6;4
>5,
6

41
Appendix C
ns
ampl
eγ
om
nibu
s f
or χ
2
Traj
ecto
ry g
roup
Gro
up
cont
rast
sΨH
igh
d
elin
quen
cy(1
)
esc
alat
ors
(2)
Hig
hest
d
esis
ters
(3)
mod
erat
e d
e sis
ters
(4)
2nd
low
est
de l
inqu
ency
(5)
low
est
de l
inqu
ency
(6)
nei
ghbo
urho
od P
rote
ctiv
e fa
ctor
s
me
an
sS
atis
fact
ion
w
ithd
wel
ling
(h
ighe
rsco
res
indi
cate
hi
gher
sat
isfa
ctio
n)
751
Full
F=
1.9
6.17
7.58
7.04
7.42
7.77
8.07
403
Mal
eF
=1
.86.
638.
206.
547.
417.
798.
14
Saf
ety
f rom
crim
e(lo
wer
val
ues
indi
cate
h i
gher
saf
ety)
745
Full
F=
2.5
*3.
022.
933.
263.
052.
702.
67
402
Mal
eF
=2
.12.
502.
873.
313.
022.
672.
50

42
‡ E
ach
anal
ysis
use
sge
nder
ofc
hild
and
gra
de
3eq
uiva
lent
ofg
rad
e9
outc
ome
mea
sure
(ifa
vaila
ble
)as
cont
rolv
aria
ble
s.Ψ
B
onfe
rron
ites
ts(α
=0
.01)
are
use
dfo
rm
ultip
leg
roup
mea
nco
mp
aris
ons
(for
cont
inuo
usv
aria
ble
s);o
dd
sra
tios
rep
orte
d
fo
rd
icho
tom
ous
varia
ble
sw
here
“lo
wd
elin
que
ncy”
isu
sed
as
refe
renc
eca
tego
ry.
*p
<0
.05
**
p<
0.0
1**
*p
<0
.001
aP
Pe
nd
iX d
. Gr
ad
e 9
ou
TC
om
e a
na
lys
es
Gra
de 9
mea
sure
s‡
n
Traj
ecto
ry g
roup
Gro
up
cont
rast
sΨs
ig. o
f ge
nder
om
nibu
s f
or χ
2e
scal
ator
s(1
)H
igh
de
linqu
ency
(2)
des
iste
rs(3
)lo
wde
linqu
ency
(4)
CH
ild
em
oTi
on
al
an
d b
eH
av
iou
ra
l P
ro
ble
ms
Par
ent-
rate
d:1.
E
mot
iona
ldis
orde
rsca
le
(+=
mor
e)59
3F
=1
6.5*
**4.
647.
392.
282.
641>
3,4;
2 >
3,4
*
2.
Phy
sica
lagg
ress
ion
scal
e
(+=
mor
e)58
4F
=1
9.8*
**3.
043.
410.
760.
951>
3,4;
2 >
3,4
ns
3.
Hyp
erac
tivity
-inat
tent
ion
scal
e
(+=
mor
e)59
8F
=9
.7**
*5.
116.
472.
852.
901>
3,4;
2 >
3,4
ns
4.
Opp
ositi
onal
defi
ants
cale
(+
=m
ore)
611
F=
16.
2***
8.10
9.25
4.94
4.53
1>3,
4;
2 >3,
4ns
5.
Dep
ress
ion
scal
e
(+=
mor
e)59
7F
=1
0.3*
**1.
232.
820.
890.
961>
2;2
>3,
4ns
Teac
her-
rate
d:6.
E
mot
iona
ldis
orde
rsca
le
(+=
mor
e)35
0F
=2
.62.
745.
092.
262.
03*
7.
Hyp
erac
tivity
-inat
tent
ion
scal
e
(+=
mor
e)37
0F
=2
.16.
287.
714.
764.
38ns
yout
h-ra
ted:
8.
Em
otio
nal d
isor
der s
cale
(+
=m
ore)
524
F=
2.0
4.39
5.15
3.89
3.52
***
9.
Phy
sica
lagg
ress
ion
scal
e
(+=
mor
e)52
6F
=2
7.1*
**3.
905.
391.
981.
501>
3,4;
2 >
3,4
ns
10.
Hyp
erac
tivity
-inat
tent
ion
s cal
e
(+=
mor
e)52
3F
=6
.5**
*5.
555.
894.
413.
841>
4ns

43
Appendix D
Gra
de 9
mea
sure
s‡
n
Traj
ecto
ry g
roup
Gro
up
cont
rast
sΨs
ig. o
f ge
nder
om
nibu
s f
or χ
2e
scal
ator
s(1
)H
igh
de
linqu
ency
(2)
des
iste
rs(3
)lo
wde
linqu
ency
(4)
de
lin
qu
en
Cy
11.
Yout
hra
ted:
del
inqu
entf
riend
ssc
ale
(+
=m
ore)
517
F=
54.
6***
12.7
913
.92
4.81
4.17
1>3,
4;
2 >3,
4**
12.
Yout
hr e
port
ed:p
arto
fag
ang
(0
=n
o,1
=y
es)
527
χ2=
61.
6***
43.5
9***
25.4
6***
5.38
***
1.00
Odd
s
ratio
sns
13.
Yout
hr a
ted:
you
tht r
oubl
es c
ale
(+
=m
ore)
635
F=
46.
1***
12.7
616
.46
9.58
8.60
1>2,
3,4;
2 >
3,4
ns
ab
us
e1 4
.C
hild
r epo
rted
:phy
sica
labu
se
(0=
no,
1=
yes
)52
7χ2
=2
5.9*
**7.
29**
*3.
40*
1.14
1.00
Odd
s
ratio
sns
15.
Chi
ldr a
ted:
vic
timiz
atio
ns c
ale
(+
=m
ore)
499
F=
2.1
3.20
3.03
2.39
2.17
ns
16.
Chi
ldre
port
ed:b
eing
dis
crim
inat
ed
(0=
no,
1=
yes
)52
7χ2
=5
.22.
130.
551.
671.
00O
dds
ra
tios
**
Cr
ime
1 7.
Eve
rarr
este
d/ta
ken
t op
olic
es t
atio
n
(0=
no,
1=
yes
)49
8χ2
=6
4.1*
**19
.67*
**33
.38*
**3.
65**
*1.
00O
dds
ra
tios
ns
18.
Num
ber o
f arr
ests
(+
=m
ore)
527
F=
55.
7***
1.30
2.47
0.37
0.12
1>2,
3,4;
2 >
3,4
ns
19.
Num
bero
fclo
sef r
iend
sa r
rest
ed
(+=
mor
e)52
5F
=2
6.4*
**1.
261.
380.
410.
371>
3,4;
2 >
3,4
ns
20.
Eve
rbee
nt o
cou
rt
(0=
no,
1=
yes
)52
7χ2
=4
6.8*
**36
.75*
**90
.76*
**7.
63**
1.00
Odd
s
ratio
s*
21.
Spe
ntti
me
inc
usto
dy/o
ther
pro
gram
s
(0=
no,
1=
yes
)52
7χ2
=2
9.5*
**14
.21*
**49
.24*
**2.
761.
00O
dds
ra
tios
ns

44
Better Beginnings, Better Futures Study: Delinquency Trajectories of At-Risk Youth
Gra
de 9
mea
sure
s‡
n
Traj
ecto
ry g
roup
Gro
up
cont
rast
sΨs
ig. o
f ge
nder
om
nibu
s f
or χ
2e
scal
ator
s(1
)H
igh
de
linqu
ency
(2)
des
iste
rs(3
)lo
wde
linqu
ency
(4)
sC
Ho
ol
fun
CTi
on
inG
22.
Par
entr
epor
ted:
chi
ldr e
peat
eda
gra
de
(0=
no,
1=
yes
)65
1χ2
=8
.1*
3.45
**1.
721.
261.
00O
dds
ra
tios
ns
23.
Par
ent/
teac
her:
child
sus
pend
ed
(0=
no,
1=
yes
)66
2χ2
=5
8.4*
**10
.90*
**13
.25*
**3.
28**
*1.
00O
dds
ra
tios
**
24.
Chi
ldr e
port
ed:#
oft
imes
l eft/
drop
ped
outo
fsch
ool
(+
=m
ore)
524
F=
37.
3***
1.46
1.54
0.21
0.16
1>3,
4;
2>3,
4ns
25.
Chi
ldre
port
ed:#
oft
imes
ski
pped
cla
ss
(+=
mor
e)51
7F
=3
3.7*
**3.
913.
671.
371.
081>
3,4;
2>
3,4
ns
26.
Eqa
o m
ath
(0
=n
otlo
w,1
=lo
w)
153
χ2=
1.4
1.55
1.97
0.42
0.87
Odd
s
ratio
sns
27.
Teac
herr
epor
ted:
chi
ld’s
cur
rent
acad
emic
ach
ieve
men
t
(+=
less
)
432
F=
7.4
***
3.74
3.92
3.65
2.92
3>4
*
28.
Teac
herr
epor
ted:
spe
cial
ed.
/ser
vice
s
(+=
mor
e)44
8χ2
=1
9.7*
**3.
41**
6.04
*2.
77**
1.00
Odd
s
ratio
sns
He
al T
H a
nd
He
al T
H r
isk
be
Ha
vio
ur
29.
Gen
eral
hea
lthra
ting:
par
ent r
ated
(+
=le
ss)
609
F=
2.0
2.08
1.95
1.84
1.73
ns
30.
Gen
eral
hea
lthra
ting:
chi
ldra
ted
(+
=le
ss)
522
F=
7.7
***
2.87
3.13
2.33
2.20
1>4;
2>
4**
31.
Chi
ldr e
port
ed:a
lcoh
olc
onsu
mpt
ion
(+
=m
ore)
521
F=
20.
2***
5.21
4.75
2.91
2.37
1>3,
4;2
>4
***
32.
Chi
ldr e
port
ed:s
mok
ing
e xpe
rienc
e
(+=
mor
e)52
1F
=4
7.6*
**5.
285.
382.
481.
681>
3,4;
2 >
3,4;
3>
4**
*
33.
Chi
ldre
port
ed: e
ver d
runk
(0
=n
o,1
=y
es)
527
χ2=
38.
2***
10.9
1***
7.90
**1.
711.
00O
dds
ra
tios
*
34.
Chi
ldre
port
ed: m
ariju
ana
expe
rienc
e
(+=
mor
e)52
1F
=5
4.9*
**2.
803.
480.
450.
411>
3,4;
2 >
3,4
ns
35.
Chi
ldr e
port
ed:o
ther
har
dd r
ugs
(0
=n
o,1
=y
es)
527
χ2=
68.
9***
26.4
6***
37.1
4***
1.28
1.00
Odd
s
ratio
s*

45
Appendix D
Gra
de 9
mea
sure
s‡
n
Traj
ecto
ry g
roup
Gro
up
cont
rast
sΨs
ig. o
f ge
nder
om
nibu
s f
or χ
2e
scal
ator
s(1
)H
igh
de
linqu
ency
(2)
des
iste
rs(3
)lo
wde
linqu
ency
(4)
36.
Chi
ldre
port
ed:s
tres
sin
dex
(+
=m
ore)
527
F=
10.
1***
2.81
3.46
1.74
1.74
1>3,
4;
2 >3,
4**
*
37.
Chi
ldr e
port
ed:#
oft
imes
i nju
red
(+
=m
ore)
509
F=
6.0
**1.
401.
190.
650.
591>
4ns
38.
Chi
ldb
ody
mas
sin
dex
(+
=m
ore)
264
F=
9.7
***
23.7
732
.72
23.0
822
.35
1>2;
2>
3,4
ns
39.
Had
con
sens
uals
ex
(0=
no,
1=
yes
)50
1χ2
=4
9.2*
**12
.56*
**20
.23*
**1.
341.
00O
dds
ra
tios
ns
40.
Had
unp
rote
cted
sex
(0
=n
o,1
=y
es)
501
χ2=
43.
4***
14.5
4***
19.5
8***
2.35
1.00
Odd
s
ratio
s**
41.
Eve
r pre
gnan
t
(0=
no,
1=
yes
)52
7χ2
=6
.55.
124.
340.
001.
00O
dds
ra
tios
ns

46
aP
Pe
nd
iX e
. re
su
lTs
of
es
Tim
aT
ed
uT
iliz
aT
ion
of
Go
ve
rn
me
nT
re
so
ur
Ce
s a
na
lys
es
by
Tr
aJe
CT
or
y
Jk –
Gra
de 3
($)
Gra
de 4
– G
rade
6 ($
)G
rade
7 –
Gra
de 9
($)
all
Gra
des
($)
mal
efe
mal
ea
llm
ale
fem
ale
all
mal
efe
mal
ea
llm
ale
fem
ale
all
Hea
lth C
are
and
so c
ial s
e rvi
ces
Visitstoafamilyphysician
2ndL
owes
tdel
inqu
ency
110
103
107
5854
5652
4850
220
205
212
Esc
alat
ors
125
150
134
6759
6454
4450
246
253
249
Hig
hde
linqu
ency
108
156
128
5157
5351
4549
209
259
230
Mod
erat
ed e
sist
ers
116
107
113
5654
5655
5254
227
213
222
Low
estd
elin
quen
cy11
010
710
951
4749
3239
3619
219
319
3
Hig
hest
des
iste
rs93
4582
6160
6164
4660
218
151
203
Gro
up t
otal
662
668
673
344
331
338
307
274
299
1,31
31,
273
1,31
0
Hospitalemergencyroomuse
2ndL
owes
tdel
inqu
ency
261
237
250
107
99
103
97
92
95
465
428
447
Esc
alat
ors
370
448
384
164
196
175
139
138
138
673
782
698
Hig
h de
linqu
ency
474
78
355
215
816
717
23
125
861
89
647
Mod
erat
e de
sist
ers
203
123
184
62
65
63
66
74
69
331
261
317
Low
est d
elin
quen
cy17
621
019
471
61
65
60
28
41
30
730
030
1
Hig
hest
des
iste
rs44
07 8
3 8
01 6
61 2
81 5
81 1
96 2
1 0
87 2
52 6
86 4
6
Gro
up t
otal
1,92
31 ,
174
1 ,74
87 8
55 5
77 3
26 5
33 9
75 7
63 ,
362
2 ,12
83 ,
056
Numberofseriousinjuries
2ndL
owes
tdel
inqu
ency
2,32
81,
659
2,00
92,
087
1,40
51,
759
4,89
04,
363
4,63
79,
305
7,42
78,
405
Esc
alat
ors
2,47
698
71,
904
3,59
51,
756
2,90
38,
932
11,0
55
9,71
415
,004
13
,799
14
,521
Hig
hde
linqu
ency
30
1,49
942
71,
628
4,78
32,
299
6,18
817
,343
8,
410
7,84
623
,625
11
,136
Mod
erat
ed e
sist
ers
1,13
01 ,
382
1 ,19
58 8
28 9
08 8
55 ,
092
3 ,60
94 ,
556
7 ,10
45 ,
882
6 ,63
6
L ow
estd
elin
quen
cy71
81 ,
125
8 89
7 74
1 ,29
91 ,
073
3 ,47
81 ,
468
2 ,32
64 ,
971
3 ,89
34 ,
288
Hig
hest
des
iste
rs1,
542
1 ,08
61 ,
507
1 ,90
69 6
91 ,
740
3 ,97
66 ,
327
4 ,27
17 ,
424
8 ,38
27 ,
518
Gro
up t
otal
8,22
37 ,
738
7 ,93
01 0
,873
1 1
,103
1 0
,659
3 2
,558
4 4
,167
3 3
,915
5 1
,654
6 3
,008
5 2
,504

47
Appendix E
Jk –
Gra
de 3
($)
Gra
de 4
– G
rade
6 ($
)G
rade
7 –
Gra
de 9
($)
all
Gra
des
($)
ma l
efe
mal
ea
llm
ale
fem
ale
all
mal
efe
mal
ea
llm
ale
fem
ale
all
Numberofovernightstaysinhospital
2ndL
owes
tdel
inqu
ency
348
482
414
92
172
131
144
226
184
584
881
728
Esc
alat
ors
160
234
190
245
26
163
1,06
244
883
41,
467
709
1,18
7
Hig
hde
linqu
ency
05
10
51
10
01,
480
296
01,
536
307
Mod
erat
ed e
sist
ers
1,09
82 5
58 7
42 0
61 3
41 8
81 3
46 6
1 1
01 ,
437
4 55
1 ,17
2
L ow
estd
elin
quen
cy89
32 1
05 4
73 7
86 4
2 0
64 7
58
2 08
1 ,74
62 8
39 6
2
Hig
hest
des
iste
rs4,
586
7 61
3 ,92
88 4
81 ,
046
8 92
1 43
3 05
1 77
5 ,57
72 ,
112
4 ,99
8
Gro
up t
otal
7,08
51 ,
947
5 ,95
51 ,
769
1 ,49
41 ,
590
1 ,95
72 ,
534
1 ,81
01 0
,811
5 ,
975
9 ,35
5
Visitswithanursepractitioner
2ndL
owes
tdel
inqu
ency
12
15
13
45
53
64
19
25
22
Esc
alat
ors
14
1 1
1 3
6 9
7 9
7 8
2 9
2 7
2 8
Hig
hde
linqu
ency
13
18
119
4
027
8
14
47
20
Mod
erat
ed e
sist
ers
10
4 8
3 5
3 2
5 3
1 4
1 4
1 5
L ow
estd
elin
quen
cy9
8 9
4 5
4 3
5 4
1 6
1 8
1 7
Hig
hest
des
iste
rs3
1 8
7 4
1 3
5 1 2
6
1 1
3 1
1 6
Gro
up t
otal
61
5 6
5 7
2 1
4 3
2 7
2 1
6 3
3 4
1 03
1 62
1 18
Visitedbyachildren’saidworker
2ndL
owes
tdel
inqu
ency
10
10
10
77
77
88
25
26
25
Esc
alat
ors
79 3
3 6
2 0
3 9
2 7
3 9
7 6
5 3
6 6
2 0
81 1
7
Hig
hde
linqu
ency
23
108
61
41
13
37
64
59
64
128
179
163
Mod
erat
e de
sist
ers
18
16
18
13
14
13
11
15
12
42
45
43
Low
est d
elin
quen
cy13
7
10
10
10
00
14
811
Hig
hest
des
iste
rs10
57
22
50
41
48
34
20
31
94
11
910
2
Gro
up t
otal
81
291
158
133
115
134
156
179
169
370
585
461

48
Better Beginnings, Better Futures Study: Delinquency Trajectories of At-Risk YouthJk
– G
rade
3 ($
)G
rade
4 –
Gra
de 6
($)
Gra
de 7
– G
rade
9 ($
)a
ll G
rade
s ($
)
mal
efe
mal
ea
llm
ale
fem
ale
all
mal
efe
mal
ea
llm
ale
fem
ale
all
rem
edia
l edu
catio
n
Graderepetition(Historicalrepetitiondata
fromJKtoGrade9)
2ndL
owes
tdel
inqu
ency
932
869
900
Esc
alat
ors
2,02
41,
864
1,97
1
Hig
hde
linqu
ency
1,66
03,
429
2,25
0
Mod
erat
ed e
sist
ers
1,55
91 ,
385
1 ,50
1
L ow
estd
elin
quen
cy57
81 8
53 5
1
Hig
hest
des
iste
rs1,
259
2 ,59
71 ,
546
Gro
up t
otal
8,01
21 0
,328
8 ,
519
Useofspecialeducationservices
(fromGrade1toGrade9)
2ndL
owes
tdel
inqu
ency
5,81
35,
777
5,80
75,
606
5,06
75,
363
4,49
64,
027
4,27
815
,915
14
,871
15
,447
Esc
alat
ors
8,55
75 ,
297
7 ,28
58 ,
373
6 ,29
47 ,
651
7 ,57
19 ,
184
8 ,10
12 4
,501
2 0
,775
2 3
,037
Hig
hde
linqu
ency
9,40
56,
642
8,92
78,
606
7,99
48,
476
8,18
015
,830
10
,348
26
,191
30
,466
27
,751
Mod
erat
ed e
sist
ers
8,03
78 ,
643
8 ,22
37 ,
227
9 ,38
18 ,
032
6 ,22
57 ,
006
6 ,52
22 1
,490
2 5
,031
2 2
,776
Low
estd
elin
quen
cy5,
586
3,64
74,
595
3,92
02,
092
2,89
83,
248
1,09
02,
104
12,7
54
6,83
09,
596
Hig
hest
des
iste
rs10
,701
1 4
,482
1 1
,700
1 3
,956
1 3
,673
1 3
,908
1 2
,654
1 7
,341
1 3
,430
3 7
,311
4 5
,496
3 9
,038
Gro
up t
otal
48,0
99
44,4
89
46,5
37
47,6
88
44,5
02
46,3
27
42,3
75
54,4
77
44,7
82
138,
162
143,
468
137,
646
Cri
min
al J
ustic
e s
yste
m
Numberofarrests(Grade9only)
2ndL
owes
tdel
inqu
ency
43
63
53
Esc
alat
ors
335
9 49
5 55
Hig
hde
linqu
ency
755
1,86
91,
059
Mod
erat
ed e
sist
ers
189
7 2
1 47
Low
est d
elin
quen
cy72
0
30
Hig
hest
des
iste
rs18
00
1 54
Gro
up t
otal
1,57
32,
953
1,99
7

49
Appendix E
Jk –
Gra
de 3
($)
Gra
de 4
– G
rade
6 ($
)G
rade
7 –
Gra
de 9
($)
all
Gra
des
($)
ma l
efe
mal
ea
llm
ale
fem
ale
all
mal
efe
mal
ea
llm
ale
fem
ale
all
Courtappearances(Grade9only)
2ndL
owes
tdel
inqu
ency
12
26
19
Esc
alat
ors
135
7 19
3 45
Hig
hde
linqu
ency
404
1,07
858
8
Mod
erat
ed e
sist
ers
67
6 0
6 5
Low
estd
elin
quen
cy0
00
Hig
hest
des
iste
rs21
60
1 80
Gro
up t
otal
834
1,88
31,
196
fam
ily s
ocia
l ass
ista
nce
Socialwelfare(Grade9only)
2ndL
owes
tdel
inqu
ency
1,09
31,
054
1,07
4
Esc
alat
ors
2,32
04,
210
3,03
7
Hig
hd e
linqu
ency
3,09
30
2,14
2
Mod
erat
ed e
sist
ers
1,32
62,
738
1,81
1
Low
estd
elin
quen
cy60
00
250
Hig
hest
des
iste
rs2,
320
01,
856
Gro
up t
otal
10,7
528,
001
10,1
69
Ontariodisability(Grade9only)
2ndL
owes
tdel
inqu
ency
709
660
685
Esc
alat
ors
02,
753
1,04
4
Hig
hde
linqu
ency
00
0
Mod
erat
ed e
sist
ers
904
577
792
Low
estd
elin
quen
cy67
530
245
8
Hig
hest
des
iste
rs0
00
Gro
up t
otal
2,28
84,
292
2,97
8

50
Better Beginnings, Better Futures Study: Delinquency Trajectories of At-Risk YouthJk
– G
rade
3 ($
)G
rade
4 –
Gra
de 6
($)
Gra
de 7
– G
rade
9 ($
)a
ll G
rade
s ($
)
mal
efe
mal
ea
llm
ale
fem
ale
all
mal
efe
mal
ea
llm
ale
fem
ale
all
dom
ain
Tota
l and
Gra
nd T
otal
Healthcareandsocialservices
2ndL
owes
tdel
inqu
ency
3,07
02,
505
2,80
22,
354
1,74
32,
061
5,19
44,
743
4,97
810
,618
8,
990
9,84
1
Esc
alat
ors
3,15
21 ,
923
2 ,66
14 ,
098
2 ,08
53 ,
340
1 0,2
35
1 1,7
69
1 0,7
98
1 7,4
84
1 5,7
78
1 6,8
00
Hig
hde
linqu
ency
647
1,84
698
01,
936
4,93
12,
570
6,47
618
,957
8,
953
9,05
825
,734
12
,503
Mod
erat
ed e
sist
ers
2,57
51 ,
887
2 ,39
21 ,
222
1 ,16
11 ,
209
5 ,35
93 ,
822
4 ,80
49 ,
156
6 ,87
08 ,
405
L ow
estd
elin
quen
cy1,
919
1 ,66
91 ,
758
1 ,28
01 ,
477
1 ,39
84 ,
048
1 ,54
82 ,
616
7 ,24
64 ,
694
5 ,77
2
Hig
hest
des
iste
rs6,
674
2 ,04
45 ,
927
3 ,03
52 ,
246
2 ,90
24 ,
340
6 ,77
44 ,
654
1 4,0
50
1 1,0
64
1 3,4
83
Gro
up t
otal
18,0
36
1 1,8
75
1 6,5
21
1 3,9
25
1 3,6
43
1 3,4
80
3 5,6
52
4 7,6
13
3 6,8
02
6 7,6
13
7 3,1
30
6 6,8
03
Remedialeducation
2ndL
owes
tdel
inqu
ency
5,81
35,
777
5,80
75,
606
5,06
75,
363
4,49
64,
027
4,27
816
,847
15
,739
16
,348
Esc
alat
ors
8,55
75 ,
297
7 ,28
58 ,
373
6 ,29
47 ,
651
7 ,57
19 ,
184
8 ,10
12 6
,525
2 2
,639
2 5
,008
Hig
hde
linqu
ency
9,40
56,
642
8,92
78,
606
7,99
48,
476
8,18
015
,830
10
,348
27
,851
33
,895
30
,001
Mod
erat
ed e
sist
ers
8,03
78 ,
643
8 ,22
37 ,
227
9 ,38
18 ,
032
6 ,22
57 ,
006
6 ,52
22 3
,049
2 6
,416
2 4
,277
Low
estd
elin
quen
cy5,
586
3,64
74,
595
3,92
02,
092
2,89
83,
248
1,09
02,
104
13,3
32
7,01
49,
947
Hig
hest
des
iste
rs10
,701
1 4
,482
1 1
,700
1 3
,956
1 3
,673
1 3
,908
1 2
,654
1 7
,341
1 3
,430
3 8
,571
4 8
,094
4 0
,584
Gro
up t
otal
48,0
99
44,4
89
46,5
37
47,6
88
44,5
02
46,3
27
42,3
75
54,4
77
44,7
82
146,
175
153,
797
146,
165
Criminaljusticesystem
2ndL
owes
tdel
inqu
ency
55
89
71
Esc
alat
ors
470
1 ,66
89 0
0
Hig
hd e
linqu
ency
1,15
92 ,
947
1 ,64
7
Mod
erat
ed e
sist
ers
256
1 32
2 11
Low
estd
elin
quen
cy72
0
30
Hig
hest
des
iste
rs39
50
3 34
Gro
up t
otal
2,40
84 ,
835
3 ,19
3

51
Appendix E
Jk –
Gra
de 3
($)
Gra
de 4
– G
rade
6 ($
)G
rade
7 –
Gra
de 9
($)
all
Gra
des
($)
ma l
efe
mal
ea
llm
ale
fem
ale
all
mal
efe
mal
ea
llm
ale
fem
ale
all
Familysocialassistance
2ndL
owes
tdel
inqu
ency
1,80
21,
714
1,75
8
Esc
alat
ors
2,32
06,
963
4,08
1
Hig
h de
linqu
ency
3,09
30
2,14
2
Mod
erat
ed e
sist
ers
2,23
03,
315
2,60
3
Low
estd
elin
quen
cy1,
275
302
708
Hig
hest
des
iste
rs2,
320
01,
856
Gro
up t
otal
13,0
4112
,293
13,1
47
Alldomains(12measures)
2ndL
owes
tdel
inqu
ency
8,88
28,
282
8,60
97,
960
6,80
97,
424
9,69
08,
769
9,25
529
,323
26,5
3228
,018
Esc
alat
ors
11,7
097,
220
9,94
612
,471
8,38
010
,991
17,8
0620
,953
18,8
9946
,800
47,0
4746
,788
Hig
hde
linqu
ency
10,0
538,
488
9,90
710
,542
12,9
2511
,046
14,6
5534
,786
19,3
0141
,162
62,5
7646
,292
Mod
erat
ed e
sist
ers
10,6
1210
,530
10,6
158,
449
10,5
439,
240
11,5
8510
,828
11,3
2634
,691
36,7
3335
,496
Low
estd
elin
quen
cy7,
504
5,31
66,
352
5,20
03,
569
4,29
67,
296
2,63
94,
720
21,9
2512
,010
16,4
57
Hig
hest
des
iste
rs17
,375
16,5
2717
,628
16,9
9115
,919
16,8
1016
,995
24,1
1518
,084
55,3
3659
,158
56,2
57
Gro
up t
otal
66,1
3556
,364
63,0
5861
,613
58,1
4559
,807
78,0
2710
2,09
181
,585
229,
236
244,
056
229,
308
