derek byerlee world bank land conference, april 26-27, 2010
TRANSCRIPT

The Organization of Farming: Revisiting the Debate on
Small vs Large Farms
.
Derek ByerleeWorld BankLand Conference, April 26-27, 2010

A Broad Consensus on the Vital Role of Smallholder
Agriculture in Development
Three Basic Premises

Family farms widely accepted as being most efficient (Lipton 2009, many others) Difficulty of labor supervision in spatially
dispersed production Flexibility management of land and labor
resources to fit seasons and markets (Allen, 2004)
Local knowledge advantages the owner-manager
Family farms, including smallholders, remain as main organizational model in both poor and rich countries Owner-operated employing mostly family labor
1. Consensus Around a Development Agenda Based on
Family Farms

Family Farming Combines Ownership, Management, and Most Labor
FAMILY FARMING CORPORATE MODEL
Family-management
Land
CapitalLabor
Management
Land
CapitalLabor

Mean size (ha)
% < 2 ha Gini
sub-Saharan Africa
2.4 69 0.49
South Asia 1.4 78 0.54
East Asia 1.0 79 0.50
SE Asia 1.8 57 0.60
WANA 4.9 65 0.70
Central America 10.7 63 0.75
South America 111.7 36 0.90
Europe 32.3 30 0.60
USA 178.4 4 0.78
Vast Majority of World’s Farmers are Small and Family Operated
Source: Eastwood et al., 2009

Size of Family Farm Increases During Structural Transformation
% farms
% sales
0%
10%
20%
30%
40%
50%
60%
70%
80%
90%
100%
Farm ownership USA
OtherNonfamily corpsFamily partners and corpsFamily ownership
1900 1920 1940 1960 1980 20000
20
40
60
80
100
120
140
160
180
200
0
2
4
6
8
10
12
14
Trends in USA, 1900sFarm size (ha)
Manufacturing wage ($1992/hr)
Gardiner, 2002

Strong growth and employment linkages Especially demand for local consumers
goods and services Example of green revolution
Local community development and better services in family-farm agrarian structure
Re-affirmed in World Development Report, 2008
2. Smallholder Productivity Growth Promotes Equitable Development

3. Urgent to Close a Huge Investment Gap to Get Agriculture Moving
Public investment necessary but not sufficient
Market-led approaches imply lead role of private investment• Including FDI• Investing in farming
vs the value chain19
9019
9319
9619
9920
0220
050
1,000
2,000
3,000
4,000
5,000
6,000
Flow of FDI in Agricultural Pro-duction ($US M)
Source: WIR, 2009

Indicators of significant concentration Latin America—Large regional companies
Arg: Top 30 companies total 2.4 m ha.
Brazil: 270 sugar mills with average of 12,600 ha own –managed area
Mato Grosso, Brazil. Average soybean farm size of 1300 ha, 20% foreign
RUK: Companies took over state owned farms and collectives Ukraine: Top 40 companies manage 4.5 M ha; Russia: Top 30
companies 6.7 M ha (mostly home grown companies)
SE Asia: 8 of 25 world’s largest agric production companies are in palm oil
With Growing Private Invesmtent is there a Trend Toward Large-scale?
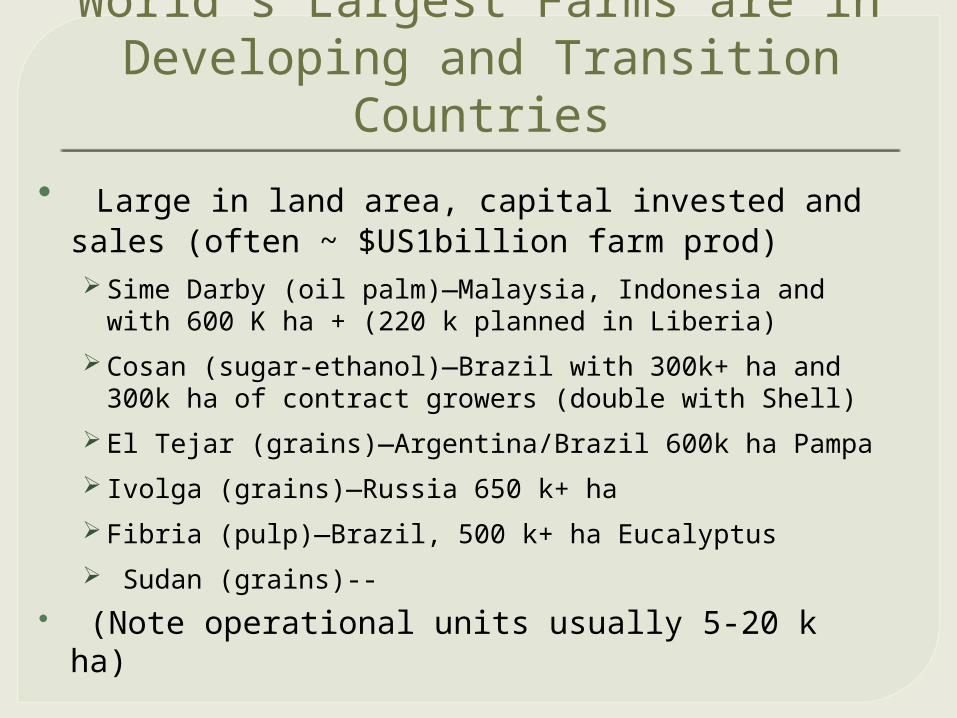
Large in land area, capital invested and sales (often ~ $US1billion farm prod) Sime Darby (oil palm)—Malaysia, Indonesia and with 600
K ha + (220 k planned in Liberia)
Cosan (sugar-ethanol)—Brazil with 300k+ ha and 300k ha of contract growers (double with Shell)
El Tejar (grains)—Argentina/Brazil 600k ha Pampa
Ivolga (grains)—Russia 650 k+ ha
Fibria (pulp)—Brazil, 500 k+ ha Eucalyptus
Sudan (grains)-- (Note operational units usually 5-20 k ha)
World’s Largest Farms are in Developing and Transition
Countries

1. Why the renewed emphasis on large-scale farm models?
2. So what? Tradeoffs?3. Are there other organizational
models to access capital and technology?
4. What research to fill major gaps in our knowledge?
Major Questions
Factors Increasing Scale: Some Hypotheses

Subsidies to capital that promote mech. e.g., Brazil until 1990s
Regulations that promote mechanization Labor laws that add transactions costs Environmental laws that prevent burning
cane Low or zero land prices that
encourage risky investments and speculation Large grain farms in Africa, Jatropha Forest extraction policies (Indonesia)
Historically, Often Stimulated by Perverse Incentives
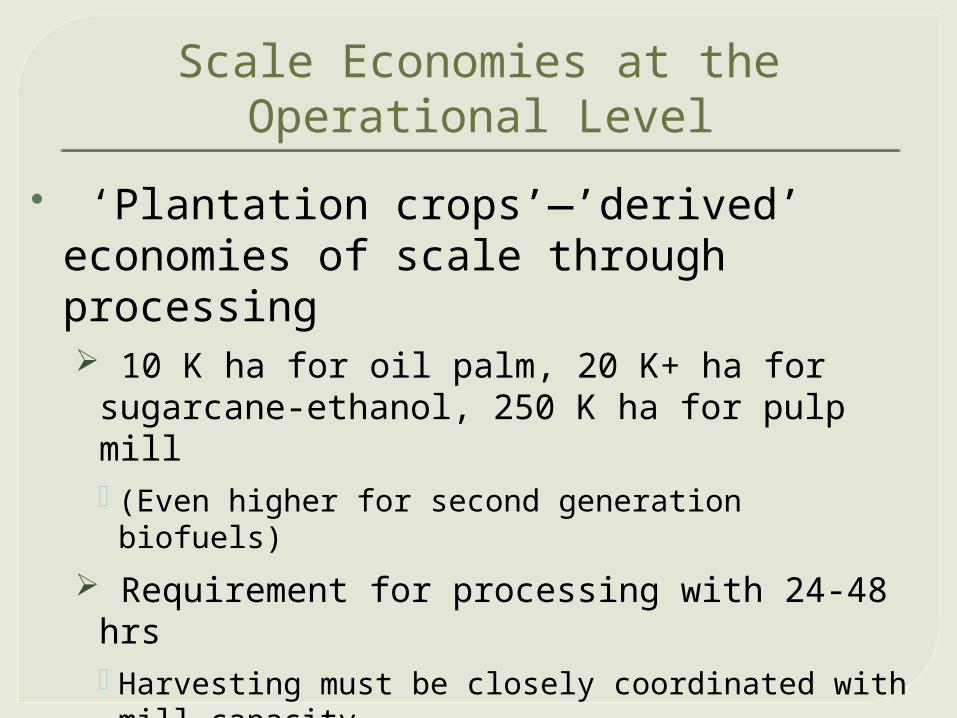
‘Plantation crops’—’derived’ economies of scale through processing 10 K ha for oil palm, 20 K+ ha for sugarcane-
ethanol, 250 K ha for pulp mill (Even higher for second generation biofuels)
Requirement for processing with 24-48 hrs Harvesting must be closely coordinated with mill
capacity
Efficiencies of spatial concentration May reduce costs by 20%; Kenyan smallholders,
transport is 35% of costs of sugarcane
Scale Economies at the Operational Level

High implicit cost of labor Migration and settlement programs
Long term and costly, potential for conflict
Labor saving via mechanization Until machinery rental market develops
Capital costs to open new land Processing, establishing perennials, soil
amendments, irrigation, roads
Technology for new crops (OP, SC, Soy)
Opening New Lands in Areas of Low Population Density

Standards and certification Now also for bulk commodities Roundtables for sustainable sugarcane,
soybean, palm oil, biofuels…
Innovations that reduce diseconomies GMOs, zero tillage IT--precision agriculture, satellite
‘supervision’ Ability to innovate, new crops, new
markts Professional technical and management
skills—the “Value of the ability to deal with disequilibria”
‘New’ Drivers of Scale at Operational Level
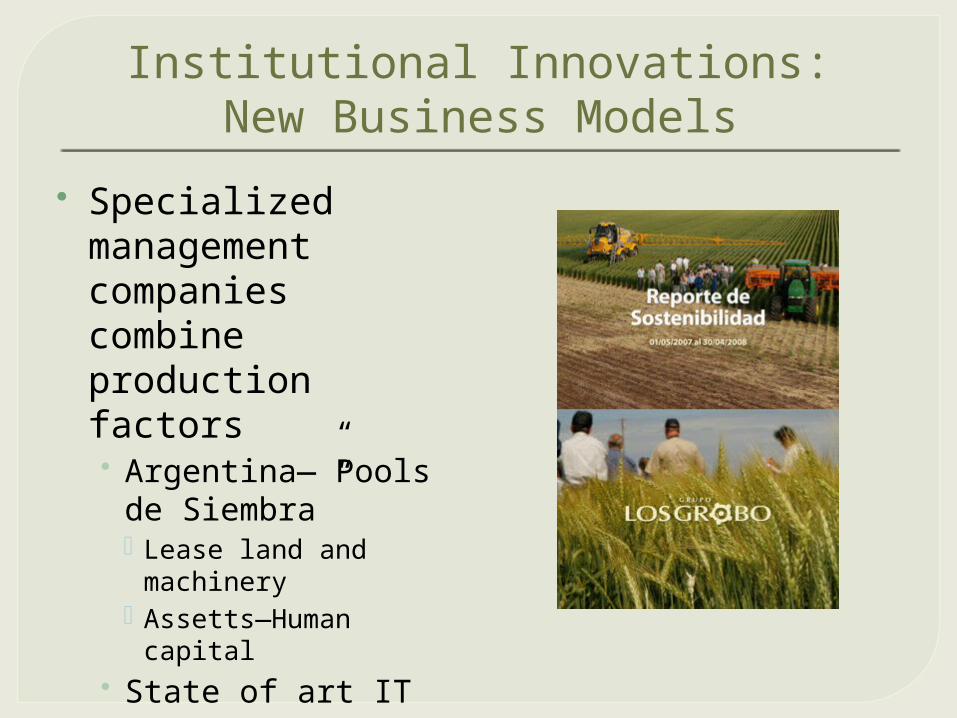
Institutional Innovations:New Business Models
Specialized management companies combine production factors• Argentina—”Pools
de Siembra” Lease land and
machinery Assetts—Human capital
• State of art IT systems to improve technical and allocative efficiencies

Diversified portfolio—spatially and by product Smooth covariance of risks
Market imperfections and transactions costs Access to finance in global markets, poorly
functioning financial markets for local farmers Bargaining power in monopsonistic markets
Argentinean companies 10-20% price discount inputs
Vertical integration to overcome poor logistics Own rails and ports (Brazil, Ukraine)
Strong private R&D capacity
Influences on Scale Economies at the Company Level

So What if it is Large Scale?

Both Large and Small-scale can be Globally Competitive
Thailand rainfed Uruguay irrigated4 ha 340 ha
0
20
40
60
80
100
120
140
160
Rice
OtherLand and waterMachineryLaborInputs
Cost
(US
$ p
er
ton
)
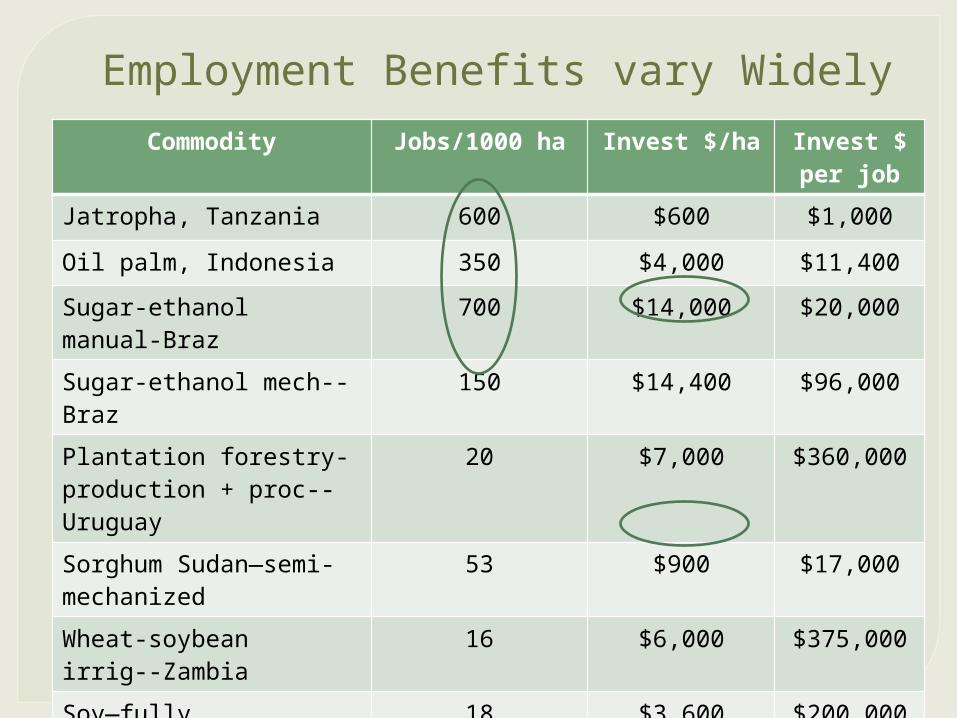
Commodity Jobs/1000 ha Invest $/ha Invest $ per job
Jatropha, Tanzania 600 $600 $1,000
Oil palm, Indonesia 350 $4,000 $11,400
Sugar-ethanol manual-Braz
700 $14,000 $20,000
Sugar-ethanol mech--Braz
150 $14,400 $96,000
Plantation forestry-production + proc--Uruguay
20 $7,000 $360,000
Sorghum Sudan—semi-mechanized
53 $900 $17,000
Wheat-soybean irrig--Zambia
16 $6,000 $375,000
Soy—fully mechanized-Brz
18 $3,600 $200,000
Grains Ukraine fully mechanized
10 $450 $45,000
Employment Benefits vary Widely

Returns to Land Can Dominate Gains from Employment
Smallholders Joint Venture Estate0
5,000
10,000
15,000
20,000
25,000
Returns to Factors in Three Models of Oil Palm Production in Sarawak, Malaysia
TaxesHired laborLocal laborInvestor dividendsSmallholder dividends
NP
V (
$U
S/h
a)
Source: Cramb and Ferraro, 2010

0
1
2
Ratio of Yields and Costs of Smallholders and Large Scale
YieldsCosts
Efficiency Tradeoffs often Less Than They Seem
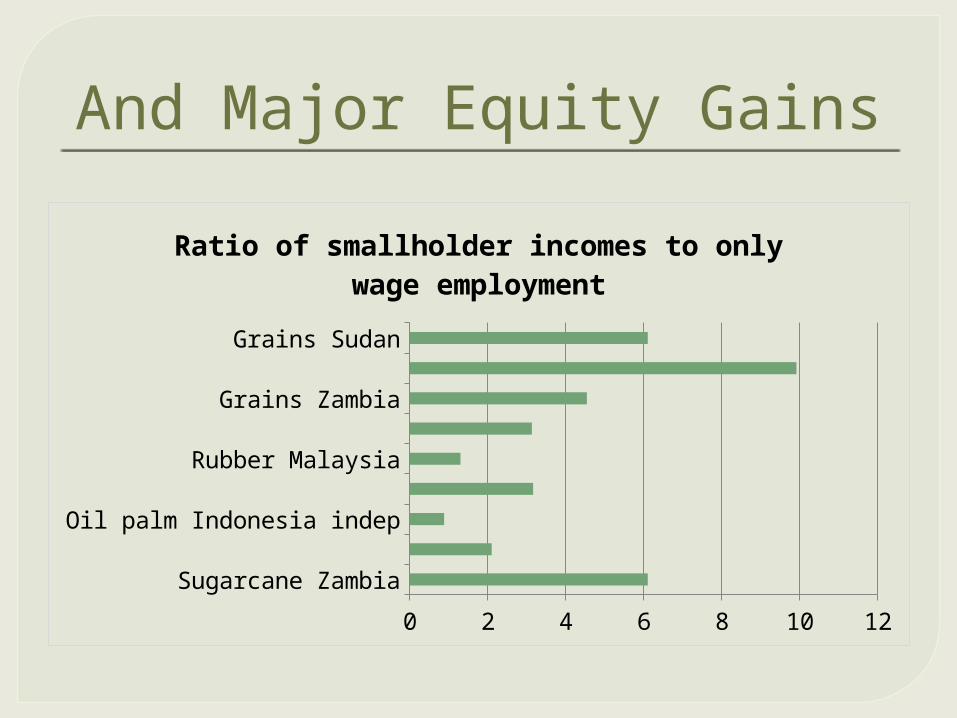
Sugarcane ZambiaOil palm Indonesia
Oil palm Indonesia indepOil palm Cameroon
Rubber MalaysiaGrains NigeriaGrains Zambia
Grains CameroonGrains Sudan
0 2 4 6 8 10 12
Ratio of smallholder incomes to only wage employment
And Major Equity Gains

Smallholders
Land
Labor
Local skills
Companies
Capital
Access to markets and technology
Specialized skills
Potentially Strong Complementarities of Assets
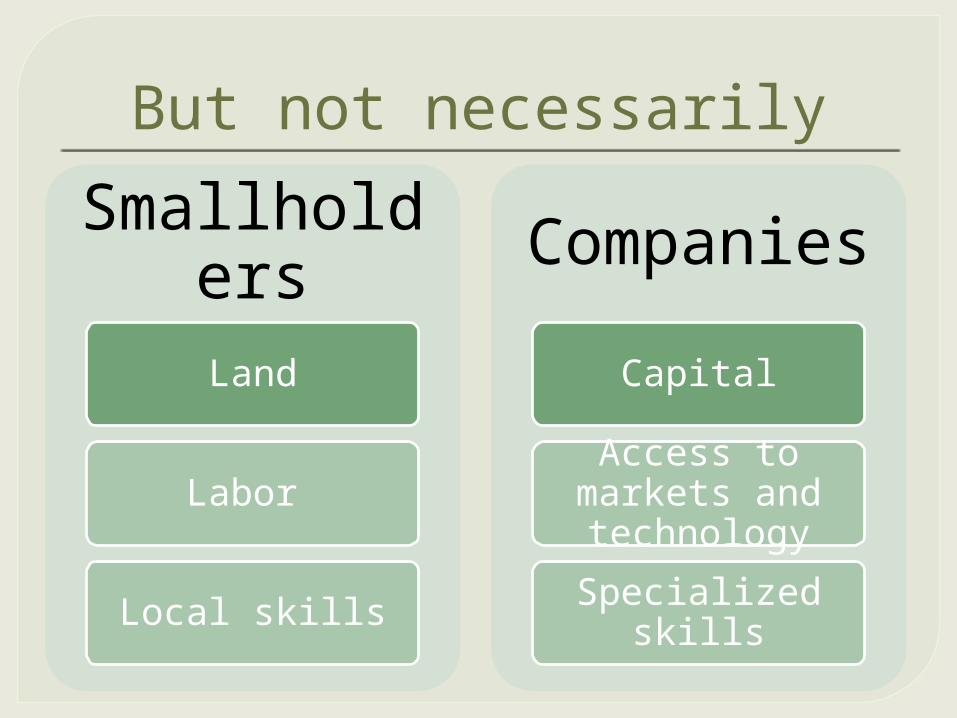
Smallholders
Land
Labor
Local skills
Companies
Capital
Access to markets and technology
Specialized skills
But not necessarily

Many Large Investors Lack Expertise in Tropical Agriculture
PRIZES FOR FAILED MEGAFARMS
UPLAND RICE INVESTOR IN LIBERIA, 2009?
1930s--Fordlandia to produce rubber in Brazil
1940s—British groundnut scheme in Tanzania• vs removing export
taxes on smallholders 1980s--Saskatoon on the
savannah—wheat in Africa
1990s--Mega rice project in Indonesia
Smallholders
Land
Labor
Local skills
Companies
Capital
Access to markets and technology
Specialized skills
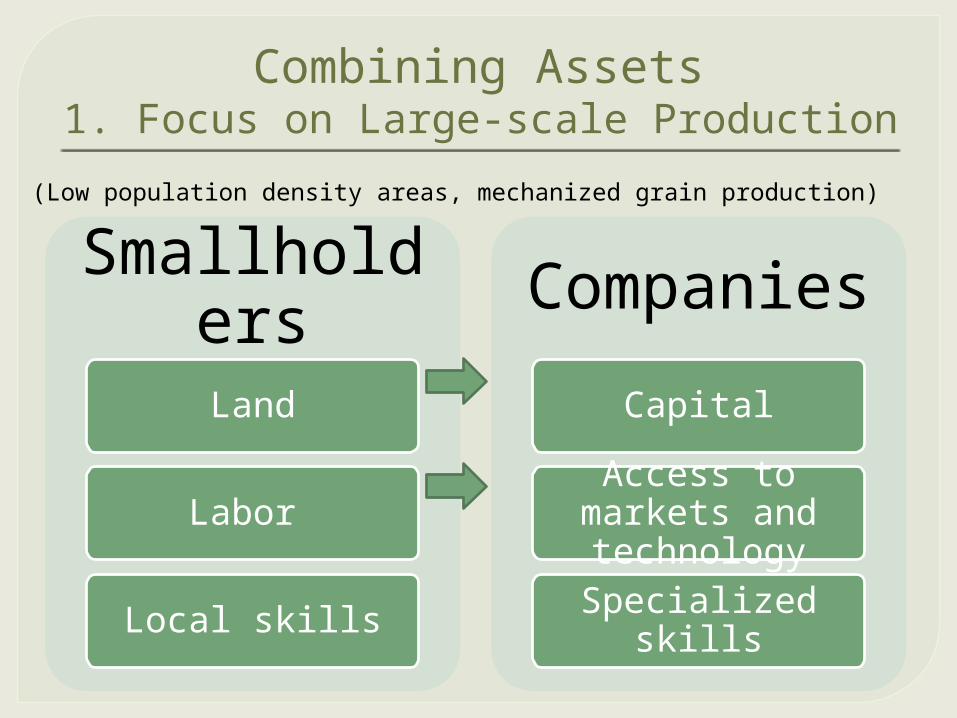
Combining Assets1. Focus on Large-scale Production
(Low population density areas, mechanized grain production)

Smallholders
Land
Labor
Local skills
Companies
Capital
Access to markets and technology
Specialized skills
Combining Assets2. Contracting of Smallholders and Their
Associations
(Settled areas, horticulture, oilseeds, sugarcane?)

Smallholders
Land
Labor
Local skills
Companies
Capital
Access to markets and technology
Specialized skills
Combining Assets3. Partnerships
(Best for perennials and irrigated areas with high upfront investments)

Business Models Specific to Context and Commodity
Outgrower schemes• Initial subsidies for
participation of smallholders
• May not involve contracts
Cooperatives and shares in companies• Malaysia, Zambia
Independent growers with public support• Rubber in SE Asia,
Jatropha 1980
1983
1986
1989
1992
1995
1998
2001
2004
2007
0
1,000,000
2,000,000
3,000,000
4,000,000
5,000,000
6,000,000
7,000,000
Indonesia--Area sown to oil palm by type of pro-
ducer (ha)
PrivateState OwnedSmall Holders

Growing land concentration but family farms still dominate
Impacts likely to be highly variable Specialized Agbiz firms with tech, knowhow vs
institutional investors R&D and technology still major issue for
sustainable and profitable investments in food crops in Africa
Level the playing field for smallholders Case for special support for start up costs and
public goods (extension)
Some Conclusions

Research to understand trends and performance of emerging corporate models Operational size, company size Role of IT, new tech, new business models
Rigorous evaluation of partnership models + Piloting of institutional innovations
Research on impacts—tradeoffs between growth, equity, social impacts and the environment
Big Agenda for Research

Extras
Best companies profitable and highly competitive (rapid growth) Grains and oilseeds (LA and RUK) Sugarcane (Brazil), Oil palm (Indonesia)
Sub-Saharan Africa History of failure of large-scale farms Some FDI associated with tech transfer
Plantation crops, biofuels, but not for food crops
Technology and Competitiveness

Economic Returns and Competitiveness Favor LA, RUK
Arg--V
ery
larg
e 1
Argen
--Ver
y la
rge
2
Arg--A
vera
ge
Braz C
err-R
ep 1
Braz C
err R
ep 2
Braz C
err--
Avera
ge
Zambi
a-Rep
Iowa
Rep
Iowa
Avera
ge0
50
100
150
200
250
300
350
400
Comparative Production Costs, Soybean, 2007-08
OtherInputsLand
Cost
(US$/t
)
Arg--V
ery
larg
e 1
Braz C
err-R
ep 1
Braz C
err R
ep 2
Thai
land
Rep
Ukrai
ne R
ep
Zambi
a LS
Iowa
Rep
Iowa
Avera
ge0
20
40
60
80
100
120
140
160
180
200
Comparative Production Costs, Maize, 2007-09
InputsOtherLand
Cost
(US$/t
)

Contrasting ModelsFAMILY FARM NON-FAMILY CORPORATION
Mostly family labor Mostly own assets (e.g.,
land) Owner-managed Focus on production Flexible
• Degree of commercialization
• Access to finance• Little use of specialized
services
Separation of management and ownership
All hired labor Variable arrangements
on:• Access to finance• Specialized services• Vertical integration

Factor Shares Also Change Over Time
Est
ate
Est
ate
Est
ate
Est
ate
Sm
allh
old
er
Sm
allh
old
er
1922 1963 1978 1995 1964 "1995"
0%
20%
40%
60%
80%
100%Rubber in Malaysia
CapitalLabor and managementLandSeries1
Source: Barlow, 1997