: development of a simulated facility for longwall shearer ... · drum using a drive shaft of...
TRANSCRIPT
1
FINAL TECHNICAL REPORT
March 1, 2013, through June 30, 2014
Project Title: DEVELOPMENT OF A SIMULATED FACILITY FOR
LONGWALL SHEARER DUST CONTROL
ICCI Project Number: 12/US-8
Principal Investigator: Dr. Y.P. Chugh, Southern Illinois University Carbondale
Other Investigators: Harrold Gurley, John Pulliam, and Kanchan Mondal,
Southern Illinois University Carbondale (SIUC)
Project Manager: Joseph Hirschi, ICCI
ABSTRACT
Coal industry professionals and government agencies agree that meeting the new
respirable coal dust standard of 1.5 mg/m3
will require additional research and
development for engineering controls in longwall mining. Performing such research on a
longwall face is not feasible for mining companies due to detrimental impact on coal
production and concern for safety of research personnel. Creating a dust control facility
that can simulate underground conditions found on the longwall face is the only practical
method to safely conduct broad-based dust control research. This approach allows
industry to participate in concepts development and gain confidence in the tested
concepts prior to their field implementation.
Recognizing this need, ICCI funded the development of a longwall dust control facility at
the Illinois Coal Development Park. This report describes the design and construction of
the facility and its capabilities. Upon construction, airflow distribution within the facility
was validated using CFD modeling. Upon this validation, the facility has been used to
perform preliminary experiments to identify some alternate concepts for shearer-clearer
and chassis spray systems design.
Based on demonstrated success with dust control technologies developed for room-and-
pillar mining over the last decade, the authors feel confident in using the facility in
cooperation with longwall industry partners to develop alternate technologies and
engineering controls to help the coal mining industry meet requirements established in
forthcoming dust regulations.

2
EXECUTIVE SUMMARY
For about eight years, the authors and support personnel (Team) have engaged in coal
mine dust control research around the continuous miner (CM) with financial support from
ICCI, NIOSH, and the coal industry in the Illinois Basin. This has led to development of
innovative spray systems for CMs that are being used commercially by several coal
companies in the Illinois Basin. The developed spray system has demonstrated potential
to reduce dust exposure of the CM operator by 30-40% and the haulage unit operator by
15-20%. The Team has now taken the first step to engage in similar research around a
longwall face with initial emphasis on the shearer drum, which accounts for about 50% of
the dust on a longwall face. This is important since longwall mining in Illinois has grown
from only two faces a few years ago to five currently. This number is expected to grow to
seven or eight over the next 2-3 years. The US Congress and MSHA have promulgated
more stringent standards for coal and quartz dust starting in August 2016. Industry
professionals and NIOSH agree that longwall mines will have the most difficult time
meeting those standards.
Therefore, it is critical that the State of Illinois engage in dust control research around
longwall faces to support its coal industry. Since an operating longwall face would be an
expensive laboratory (each longwall set-up requires a capital investment often exceeding
$100 million), it is not feasible for coal companies to allow experimentation in the field.
Creating a dust control facility that can simulate underground conditions found on the
longwall face is the only practical method to safely conduct broad-based dust control
research. Recognizing this need, the ICCI funded the development of a longwall dust
control facility (LDCF) at the Illinois Coal Development Park. The approach described in
this report will allow the industry to participate in concepts development and gain
confidence in feasible concepts prior to their field implementation. The Team is
committed to developing major engineering controls and improvements around longwall
mining areas, including alternate spray system designs, to reduce worker exposure to coal
and quartz dust.
This report describes the design and construction of the facility and its capabilities. Upon
construction, airflow distribution within the facility was validated using CFD modeling.
Upon this validation, the facility has been used to perform preliminary experiments to
identify some alternate concepts for shearer-clearer and chassis spray systems design.
Based on demonstrated success with dust control technologies developed for room-and-
pillar mining over the last decade, the Team feels confident in using the facility in
cooperation with longwall industry partners to develop alternate technologies and
engineering controls to help the coal mining industry meet requirements established in
forthcoming dust regulations.
3
OBJECTIVES
The primary longer-term goal of this project is to improve dust control around longwall
mining areas. The simulated longwall dust control facility (LDCF) will be used to
evaluate alternative engineering controls that minimize worker exposure to coal and
quartz dust prior to implementation in the field.
Specific objectives of this research project were: 1) Design, develop and test the
simulated facility, 2) Develop qualitative and semi-quantitative data on the interaction of
different sprays on the shearer under realistic field conditions, and 3) Identify and
perform engineering control studies on two concepts for improved dust control around
the shearer.
The goals of this project were accomplished through completion of the following tasks:
Task 1: Design, develop, and test the facility to simulate underground mining conditions
surrounding the longwall shearer.
Task 2: Develop qualitative and semi-quantitative data on interaction of different sprays
on the shearer-drum, shearer-clearer, and chassis under realistic field conditions.
Task 3: Engineering control studies to evaluate present spray systems and develop
improved dust control technologies.
INTRODUCTION AND BACKGROUND
Longwall coal mining in Illinois has grown rapidly during the last five years. Currently,
there are five high production longwall faces operating in Illinois. Three or four more
longwall faces are expected to go into production during the next two to three years.
Dust control on longwall faces is a serious challenge and extremely important both in
terms of production and the health and safety of miners. Up to 40 tons of coal per minute
can be produced in a high-production longwall mining operation resulting in a lot of
respirable dust being generated. With very high capital cost requirements to establish a
longwall face (often exceeding $100 million), and many operational variables,
understanding dust control mechanisms and testing of alternate dust control technologies
on an active face is not a viable option.
This facility described in this report has been designed to simulate a high production
longwall face with realistic dust production, water sprays, and airflows so that
effectiveness of alternate, innovative, and promising technologies can be tested to help
control coal and silica dust in longwall mining operations. Since the US Mine Safety and
Health Administration (MSHA) has lowered coal dust standards for respirable dust, the
need for this type of facility is critical. The LDCF will allow testing and optimization of
dust control concepts on a site-specific basis in cooperation with coal industry partners
and builds upon the Team’s previous success with CM dust control.
4
EXPERIMENTAL PROCEDURES
Design and Construction of Longwall Dust Control Facility
The design phase of the project began by reviewing several published papers regarding
dust control on longwall faces. Additionally, the Team visited two mines with operating
longwalls to collect data necessary to construct a detailed, full-scale model of a longwall
face. The first mine (Mine 1) was visited during an idle shift to collect dimensional data
for the shearer, face conveyor, and shields. The location, orientation, and number of
water sprays on the shearer cutting drum, ranging arm (RA), shearer-clearer (S-C), and
chassis were noted. The surface facilities of the second mine (Mine 2) were visited to
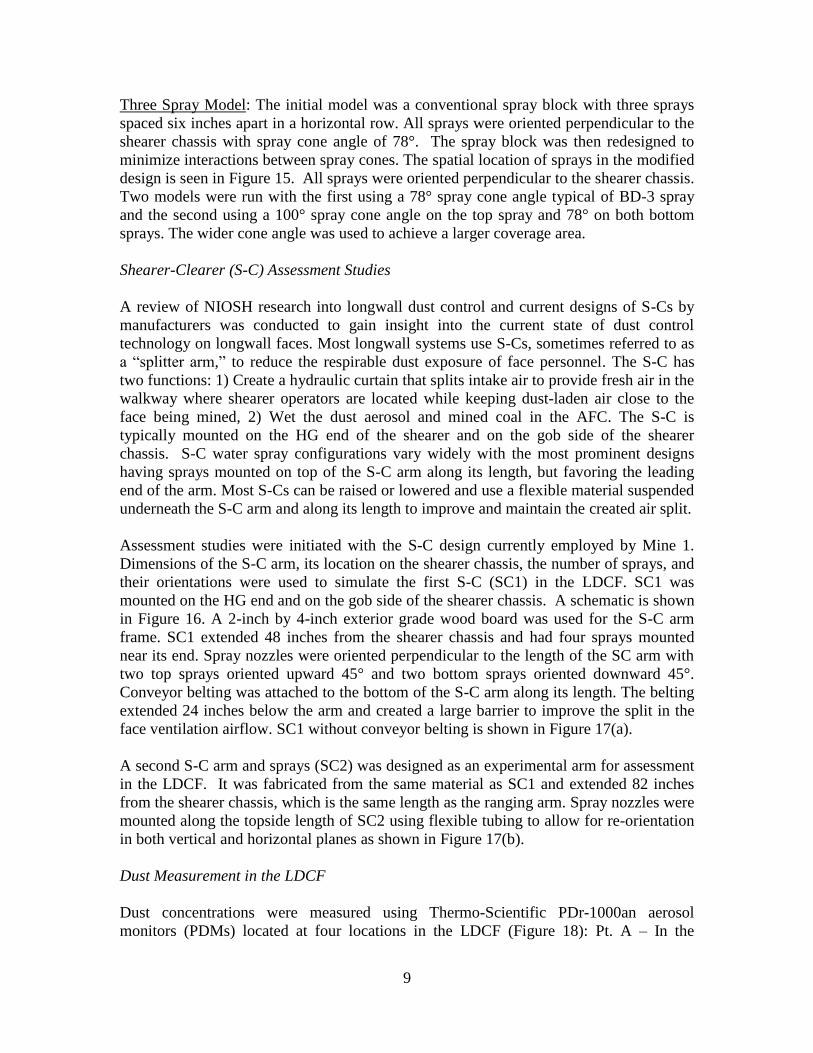
photograph and collect information for a cutting drum and shield supports (Figure 1). A
subsequent visit was made to this mine during a production shift to observe the shearer
while cutting, collect dust and ventilation data, and analyze the performance of the S-C.
Technical drawings of the shearer, face conveyor, and shield supports were also sought as
a reference. Telephone calls were also made to NIOSH professionals who operate a
longwall dust control facility in Pittsburgh, PA.
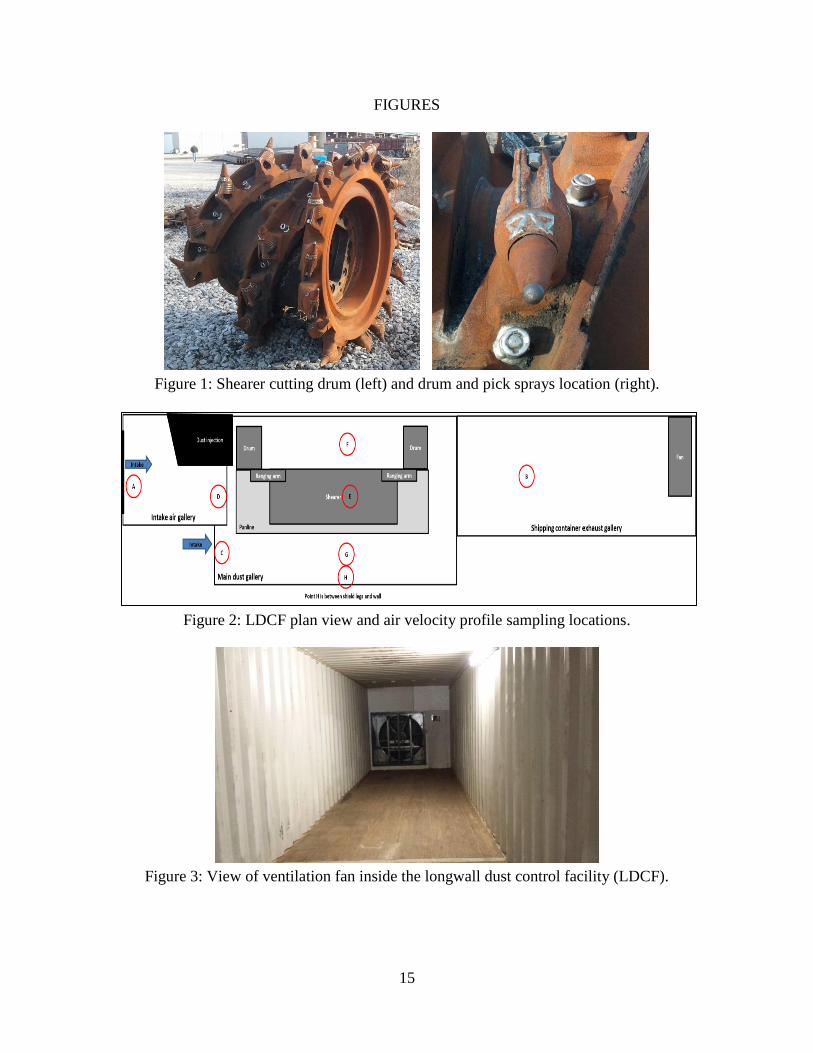
A final design for the LDCF was completed using all of the collected data. A plan view is
given in Figure 2. The gallery is located inside the SIU Dust Control Laboratory at the
Illinois Coal Development Park in Carterville, IL. To accommodate the larger longwall
gallery, renovations were necessary, particularly to the CM scrubber dust sampling room.
A 40-foot long shipping container was used for housing the ventilation fan and to extend
the gallery for homogenizing airflow to more closely simulate underground conditions
(Figure 3). Once the layout was finalized, fabrication of a full-scale model of a Joy 7LS
shearer with associated face conveyor and support shield profiles was initiated.
Main Longwall Face Components
Construction began with fabrication of the face conveyor followed by the shearer body,
cutter drums, and ranging arms as shown in Figure 4. The shearer chassis framework was
constructed from outdoor construction-grade lumber and oriented strand board (OSB). To
provide adequate waterproofing, the OSB was given several coats of paint, all joints were
sealed, and the entire chassis and ranging arms were wrapped in Tyvek house wrap. The
shearer, face conveyor, and shield leg supports are shown in Figure 5. The shearer and
face conveyor assembly is supported by heavy duty casters for mobility within the LDCF.
Two cutter-drums were constructed using 48-inch diameter concrete form “Sonotubes.”
The tubes were cut to desired width and OSB was used to enclose the drum sides as seen
in Figure 6. Each drum was painted and a waterproof epoxy coating applied to the
interior and exterior. A cutting bit holder and bit were obtained from a local coal
company and used to make a mold for fabricating lightweight cutting bits from pourable
two-part polyurethane foam. The foam had a density of eight pounds per cubic foot and it
was very suitable as a lightweight, durable material to simulate full-scale cutting bits.
Bits were glued to the drum using high-strength epoxy.

5
The initial drum was supported by a frame that would allow the drum to rotate and be
raised or lowered to simulate any cutting position. This design used four casters to create
a trunnion-type support allowing the drum to rotate. The cutting drum was rotated by an
air motor driven with compressed air. The air motor speed in revolutions per minute
(rpm) at 100psi was used to calculate the required diameter of a drive wheel to turn the
cutting drum at 60 rpm. The drive wheel had a rubber tread that contacted the cutting
drum. To provide the necessary frictional contact between the drive wheel and cutting
drum, an aggregate/epoxy mixture was applied in a 1-inch wide strip around the drum
circumference. Torque required for turning the drum and limited contact between the
drive wheel and drum resulted in an inconsistent and non-uniform rotation speed.
Consequently, the complete drum and frame assembly were redesigned. A 2.375-inch
diameter pipe was used to create a shaft (axle) to rotate the drum. Each end of the axle
was placed in a pillow-block bearing mounted on a steel post. These posts were part of a
mobile frame capable of being raised or lowered to simulate cutting the roof, floor, or
mid-face. A variable speed 0.5 HP electric motor was mounted on the face side of the
cutting drum frame and connected directly to the axle. The motor was connected to the
drum using a drive shaft of sufficient length to house the electric motor and controller in
a waterproof area adjacent to the dust gallery.
Water Spray Systems
Four high-pressure water pumps were used to supply five water spray circuits as follows:
1) Shearer drum, 2) Shearer-clearer, 3) Ranging arm, 4) Shearer chassis, and 5) Shields.
Water is gravity fed to the pumps from two 300-gallon reservoir tanks mounted on an
elevated platform above the pumps. Municipal water was used to supply the reservoir
tanks. Water pressure and volume for each circuit can be controlled individually from a
control center shown in Figure 7. Analog and digital water gages and digital flow meters
are used to monitor flow rates and water pressures. Water is supplied to the cutting drum
through a rotary connection and distributed individually to each spray nozzle.
Ventilation System
To simulate airflow in the LDCF a 48-inch diameter belt-driven fan is used. The fan is
driven by a 15 HP, 480 V, 60 Hz electric motor. Fan capacity is 50,000 cfm at 0.5 inches
water gage based on the fan curve shown in Figure 8. A TECO Westinghouse MA7200
variable frequency drive (VFD) is used to control fan speed to vary air velocity inside the
LDCF. Airflow distribution was established through a detailed cross-sectional air
velocity survey along the length of the LDCF. Vane-type anemometers were used to
collect air velocity data at locations A through G shown in Figure 2. Sampling locations
A, B, C, and D in cross-sectional areas were divided into a grid pattern. Three 1-minute
air velocity tests were run for each grid and averaged to calculate mean air velocity and
air volume for each grid section at several VFD settings. Locations E, F, and G were
single-point samples and the same approach was used to calculate mean air velocity. All
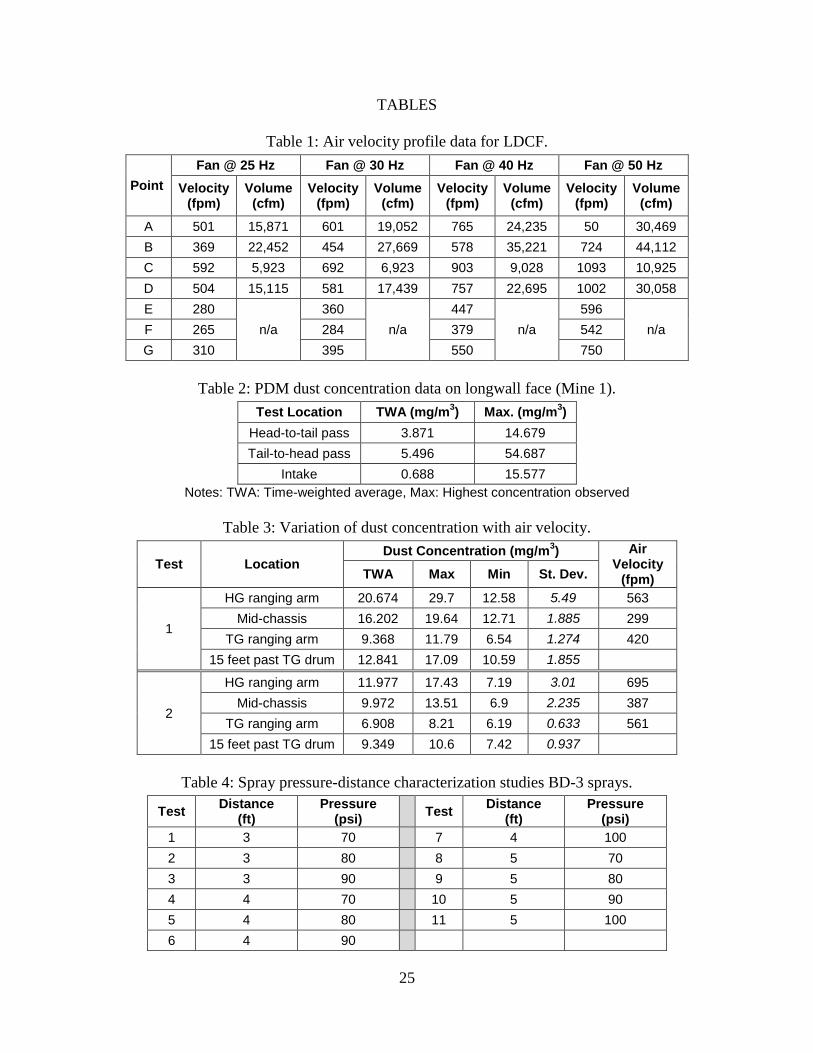
air velocity data is presented in Table 1.
6
Dust Injection System
The Team went underground at Mine 1 on May 7, 2013 to collect dust concentration data
in the walkway around the center of the shearer while it was cutting coal. This data was
used to determine the dust injection system requirements. A Team member followed near
the shearer operator during head-to-tail and tail-to-head passes collecting dust
concentration data using a Thermo-Scientific PDr-1000an aerosol monitor (PDM). A
second PDM remained at Shield 10 (about 50 feet from the belt entry) to measure dust
entering the longwall face from the stage loader and intake air sources. Air velocity was
measured about 2-3 feet above the armored face conveyor (AFC) hand rail at locations
near the headgate (HG) and tailgate (TG) and at mid-face. Dust concentration data from
PDMs is included in Figure 9. Time-weighted average and maximum recorded dust
concentrations are given in Table 2. Based on this information, the dust injection system
was designed with the capacity to: 1) Inject 1 to 10 mg/m3 dust concentrations into the
walkway area, and 2) Inject 5 to 25 mg/m3 dust concentrations into the cutting drum and
chassis area at air velocities up to 600 fpm. To achieve this, two variable-speed, auger-
type dust feeders are used to meter dust into a compressed air system through a venturi.
High-pressure air is supplied by two air compressors with combined capacity of 29.8 cfm
at 125 psi. Dust metered from the venturi is dispersed through 0.75-inch diameter PVC
pipe. The pipe dispensing system had three rows of nozzles; two rows located across the
36-inch wide simulated mine face and one row above the cutting drum. The two rows
located across the face are 24 inches and 42 inches below the simulated roof line and the
single row located above the cutting drum is 48 inches away from the face.
Coal dust used during testing in the LDCF is produced through a pulverization process.
This process requires large pieces of coal to be reduced by coarse grinding. After initial
grinding, the material is sieved using a 0.125-inch mesh sieve. Material not passing the
sieve is re-ground. The -0.125 inch coarse ground material is fed into a compressed air
driven vacuum venture, which transfers the coal into a batch pulverizer. The pulverized
material is stored in sealed barrels until used. A Microtrac particle size distribution
analysis of the coal dust shows 100% less than 300 µm and about 30% less than 10 µm as
shown in Figure 10. The dispensing rate setting on each dust feeder is calibrated to
desired dust concentrations inside the LDCF at different air velocities. PDMs located at
four locations recorded dust concentrations given in Table 3. This data was also used to
study effects of air velocity on dust dispersion and concentration within the LDCF.
Dust Control Studies
The primary goal of this task was to characterize the effective reach and coverage area
provided by water sprays typically used on longwall shearers. Since shearers operate in
an environment with high air velocities, the effect of air velocity on effective reach and
spray coverage pattern was evaluated. Sprays were analyzed individually and as a system
in conventional spray blocks used on shearers. Based on these observations, a secondary
goal was to identify improved design and spatial location of sprays on the shearer that
would improve dust control. CFD modeling was used to guide development of concepts.

7
Laboratory Testing of Spray Systems
During previous spray studies by the Team related to dust control on continuous miners
and longwall shearers, it was found that spray cone angles specified by the manufacturer
seemed inconsistent about two feet away from the spray nozzle. Beyond that distance the
spray cone gets distorted even in ambient air conditions and is affected by air movement,
particularly if airflow is perpendicular to spray direction. Therefore, it is important to
effectively model sprays in actual mining conditions to characterize the actual spray cone
area as a function of distance from the nozzle. This is necessary for variables such as
orientation of the spray in relation to the direction and velocity of airflow, spray
operating pressure, distance from the spray nozzle, etc.
The Team constructed a water collection panel (Figure 11) to determine the spatial
distribution of water from sprays and the effect of airflow on spray coverage. The panel
has 49 collection tubes located in a grid pattern that is seven columns wide and seven
rows high. One inch diameter tubes are spaced 12 inches apart to create a total collection
area seven feet wide and seven feet high. Each collection point was given an
identification number as shown in Figure 11. Water collected by the tubes drained into
sealed containers which were weighed with a resolution of 0.01 grams to determine the
volume of water collected from sprays.
Initial tests were conducted in a zero air velocity environment using one Spraying
Systems BD-3 hollow cone spray. The BD-3 spray has a 77° cone angle and a flow rate
of 0.85 gpm at 80 psi. The single spray was oriented perpendicular to and centered with
regard to the collection panel. Tests were conducted at three distances from the collection
panel: 3, 4, and 5 feet; and four spray pressures: 70, 80, 90, and 100 psi (Table 4).
An additional 21 tests were conducted using Spraying Systems BD-3-2W sprays with a
cone angle of 90° and a flow rate of 0.62 gpm at 80 psi. These tests sought to determine
spray characteristics when installed in a conventional spray block on continuous miners
and longwall shearers (Figure 12). The spray block has three spray ports with sprays
oriented 30° to the right, 30° to the left, and perpendicular to the collection panel. All
ports have zero degree inclination with the vertical plane. Tests were conducted using
sprays in all ports and each port individually at zero air velocity. Observations from these
tests and results of CFD modeling suggested tests with alternate, improved spatial
separation of sprays. Subsequent tests with increased horizontal spacing between sprays
and sprays in a triangular pattern are seen in Figure 12. The triangular pattern was tested
in 0, 143, and 144 fpm air velocities. Test parameters for the 21 tests are given in Table 5.
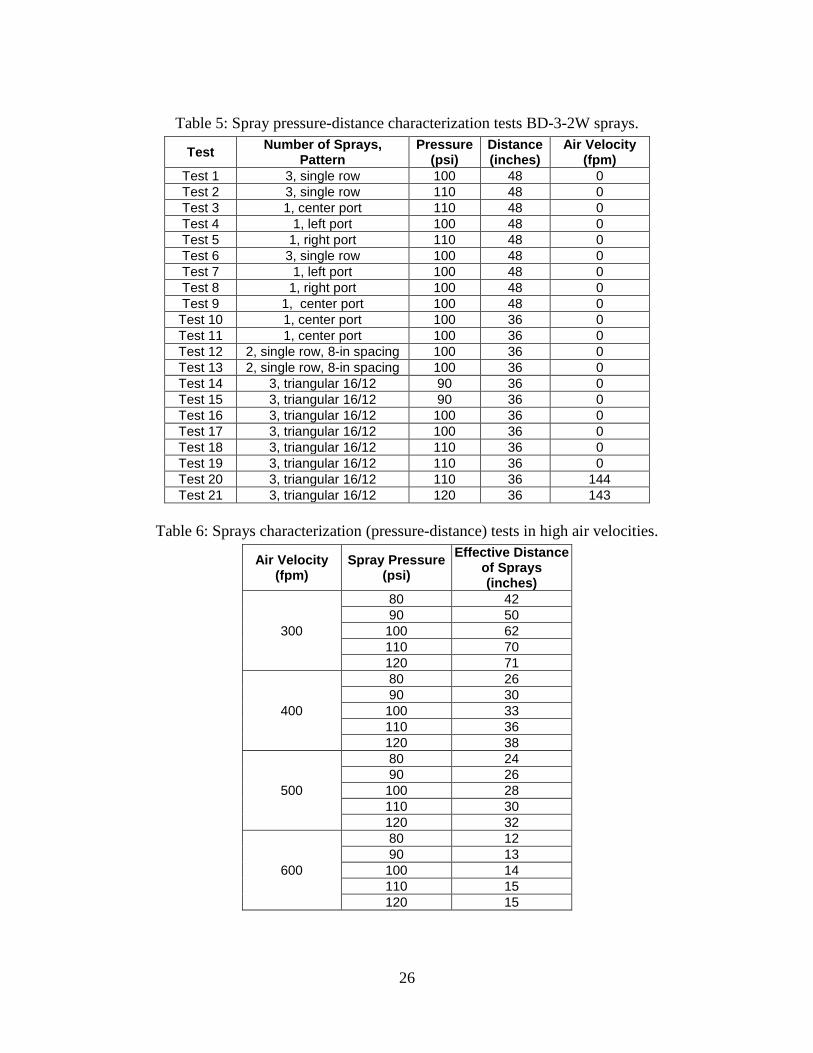
Twenty tests were conducted to characterize the effective reach of a typical BD-3 spray
for different spray pressures: from 80 to 120 psi in 10 psi increments; and at four air
velocities: 300, 400, 500, and 600 fpm (Table 6). A single spray was oriented
perpendicular to airflow and located 48 inches above the floor. The effective reach was
determined by measuring the distance from the center of the panel to the point where
only trace amounts of water could be collected in a 2-inch diameter container.

8
CFD Modeling of Spray Systems
CFD modeling of individual and multiple water sprays was conducted to compare
observed data with physical results for model validation. Studies progressed from a
model with a single spray to a model with additional sprays in a horizontal row and
finally to models with multiple sprays in multiple orientations. To correlate laboratory
testing with longwall shearer applications, CFD model boundaries were set to represent
the area between the shearer and the mining face with a modeled area 20 feet long, 3 feet
wide, and 6 feet high as shown in Figure 13. Workbench was used to construct and mesh
the model. Sprays were modeled as mounted on the top, face side of the shearer chassis
and directed towards the face.
The discrete phase model (DPM) feature in FLUENT software was used for simulation.
Interaction with continuous phase was turned on although the model did not have any air
entering or leaving the system. DPM sources were updated every 25 iterations. Unsteady
particle tracking was used to track spray particles with the particle time step size of
0.0001 seconds and “Number of time steps” set at 100. The maximum number of steps
was set at 50,000 and “Step length factor” at 5. Dynamic drag was used as the drag law.
Two-way turbulence coupling, stochastic collision, and breakup were enabled.
Trapezoidal high-order tracking and implicit low-order tracking schemes were selected.
General set injection properties for Spraying Systems BD-3 spray were used and are
given below:
Injection Type: Pressure-swirl-atomizer
Number of Particle Streams: 15
Particle Type: Inert
Flow Rate: 0.0273kg/s
Start Time: 0 sec
Stop Time: 1 sec
Injector Inner Diameter: 0.0019304 m
Spray Half Angle: 39°
Upstream Pressure: 620528 Pascal (90 psi)
Azimuthal Start Angle: 0°
Azimuthal Stop Angle: 360°
Sheet Constant: 12
Ligament Constant: 0.5
Atomizer Dispersion Angle: 6°
All models did not converge because the mass of the system continued to increase due to
injection of water droplets from sprays. Sprays were modeled with multiple spatial
geometries to analyze which geometry provided the best coverage. Different model
geometries are described below.
Single Spray Model: One spray was placed at the center of a conventional spray block as
shown in Figure 14. An outlet was created at the floor of the modeled area for the spray
water to exit the system. The stop time was kept high (10,000 seconds) so that a steady
state condition was reached with the mass of water being injected into the system
equaling the mass of water draining out through the floor outlet. Then the model was run
without an outlet and the stop time was kept at one second to compare shapes and spray
coverage impact area. Particle residence times are not considered accurate since
simulations were stopped before calculations could be completed.
9
Three Spray Model: The initial model was a conventional spray block with three sprays
spaced six inches apart in a horizontal row. All sprays were oriented perpendicular to the
shearer chassis with spray cone angle of 78°. The spray block was then redesigned to
minimize interactions between spray cones. The spatial location of sprays in the modified
design is seen in Figure 15. All sprays were oriented perpendicular to the shearer chassis.
Two models were run with the first using a 78° spray cone angle typical of BD-3 spray
and the second using a 100° spray cone angle on the top spray and 78° on both bottom
sprays. The wider cone angle was used to achieve a larger coverage area.
Shearer-Clearer (S-C) Assessment Studies
A review of NIOSH research into longwall dust control and current designs of S-Cs by
manufacturers was conducted to gain insight into the current state of dust control
technology on longwall faces. Most longwall systems use S-Cs, sometimes referred to as
a “splitter arm,” to reduce the respirable dust exposure of face personnel. The S-C has
two functions: 1) Create a hydraulic curtain that splits intake air to provide fresh air in the
walkway where shearer operators are located while keeping dust-laden air close to the
face being mined, 2) Wet the dust aerosol and mined coal in the AFC. The S-C is
typically mounted on the HG end of the shearer and on the gob side of the shearer
chassis. S-C water spray configurations vary widely with the most prominent designs
having sprays mounted on top of the S-C arm along its length, but favoring the leading
end of the arm. Most S-Cs can be raised or lowered and use a flexible material suspended
underneath the S-C arm and along its length to improve and maintain the created air split.
Assessment studies were initiated with the S-C design currently employed by Mine 1.
Dimensions of the S-C arm, its location on the shearer chassis, the number of sprays, and
their orientations were used to simulate the first S-C (SC1) in the LDCF. SC1 was
mounted on the HG end and on the gob side of the shearer chassis. A schematic is shown
in Figure 16. A 2-inch by 4-inch exterior grade wood board was used for the S-C arm
frame. SC1 extended 48 inches from the shearer chassis and had four sprays mounted
near its end. Spray nozzles were oriented perpendicular to the length of the SC arm with
two top sprays oriented upward 45° and two bottom sprays oriented downward 45°.
Conveyor belting was attached to the bottom of the S-C arm along its length. The belting
extended 24 inches below the arm and created a large barrier to improve the split in the
face ventilation airflow. SC1 without conveyor belting is shown in Figure 17(a).
A second S-C arm and sprays (SC2) was designed as an experimental arm for assessment
in the LDCF. It was fabricated from the same material as SC1 and extended 82 inches
from the shearer chassis, which is the same length as the ranging arm. Spray nozzles were
mounted along the topside length of SC2 using flexible tubing to allow for re-orientation
in both vertical and horizontal planes as shown in Figure 17(b).
Dust Measurement in the LDCF
Dust concentrations were measured using Thermo-Scientific PDr-1000an aerosol
monitors (PDMs) located at four locations in the LDCF (Figure 18): Pt. A – In the

10
walkway near mid-length of shearer chassis, Pt. B – In the walkway 15 feet downwind
from Pt. A, Pt. C – Immediately downwind of the shearer, and Pt. D – Between the
shearer and the coal face in front of the TG drum. A plastic shield was used in front of the
PDM at Pt. D to protect it from spray water.
CFD Modeling of the LDCF
CFD model geometry to simulate the LDCF was constructed using the Workbench
software program and is shown in Figure 19. The model geometry includes overall 3-D
layout of the LDCF, Joy Model 7LS shearer, ranging arms, chassis, shearer-clearer,
shields, and walkway. Design parameters used in Workbench to create the LDCF
meshing is given in Table 7.
The airflow distribution simulation through the LDCF was solved using the Realizable K-
epsilon method. There were two inlets for the mass flow: mass-flow-inlet (IN-1) and
mass-flow-inlet (IN-2). Based on airflow measurements for CFD modeling work, the
amount of air entering through Opening D (IN-1) in Figure 2 was 21.85 kg/s or
approximately 37,700 cfm. The amount of air entering through Opening C (IN-2) in
Figure 2 was 8.61 kg/s or approximately 14,900 cfm. The mass flow outlet is represented
by the fan in Figure 2. Two solution methods as shown in Table 8 were applied
sequentially to achieve solution convergence with an accuracy of 10-3
.
Airflow patterns observed in the CFD model are shown in Figure 20. Different colors
represent velocity vectors in feet per minute (fpm). These results were then compared
with manually collected air velocity measurements collected with a vane-type
anemometer at four different heights: 1, 3, 5, and 7 feet above the floor with the fan
operating at 50-55 Hz depending on wind and weather conditions outside the LDCF.
Zero values indicate no measurement at that particular point.
RESULTS AND DISCUSSION
Sprays Characterization Studies
Laboratory Testing
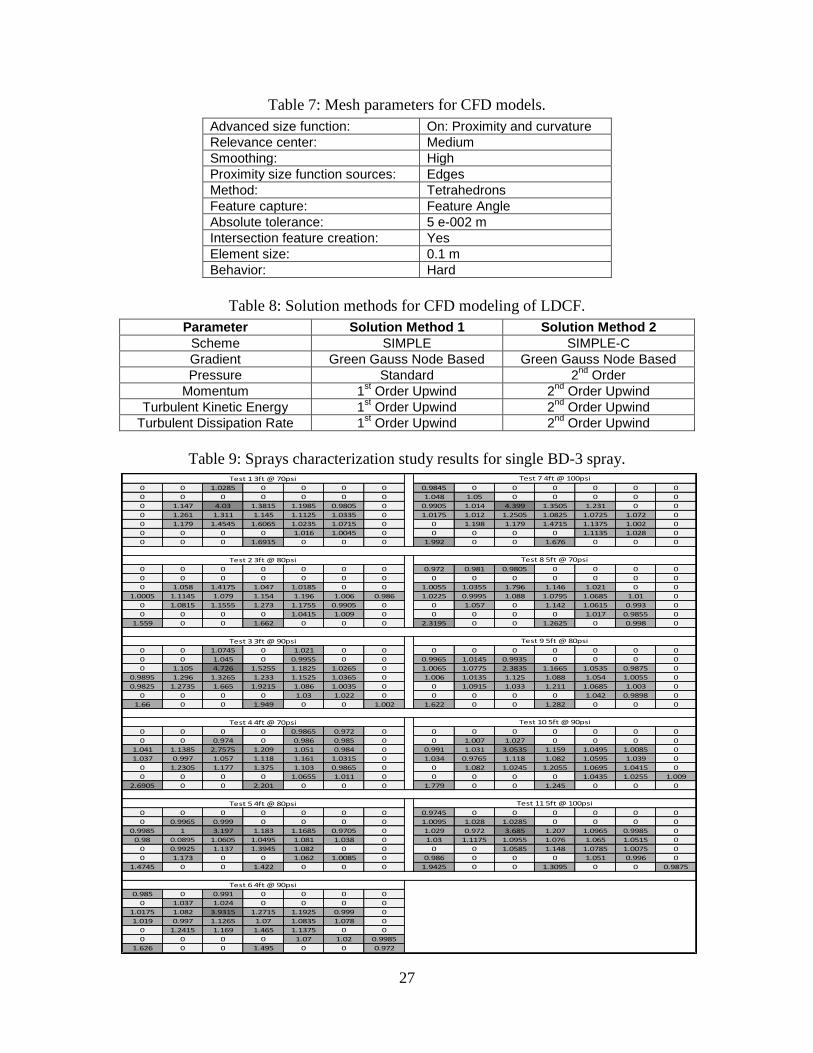
Results in ounces of water collected per port for a single BD-3 spray are given in Table 9.
Cell color is darkened with volume to aide in visualization of spray coverage density.
Spray coverage density changes only slightly with change in pressure and distance, but
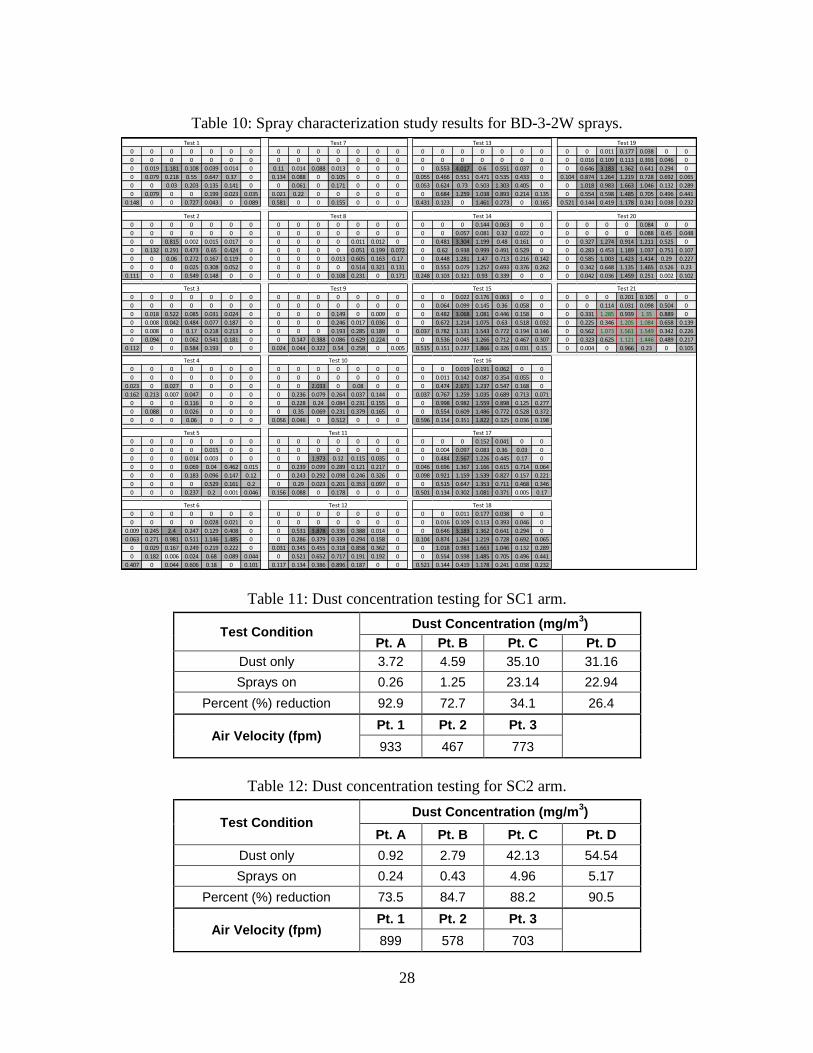
increases with higher pressures. Results for an additional 21 tests using Spraying Systems
BD-3-2W sprays with a larger cone angle of 90° at 80 psi are shown in Table 10. Tests 1
and 2 represent three sprays in a conventional block at 100 and 110 psi pressures. The
coverage area decreases with increase in pressure in Test 2. This was also noted in CFD
modeling. There is only a small decrease in coverage area for a single spray (Test3) in the
center of the block. Tests 4 and 5 used the outboard left and right ports only. Tests 6-9
repeated the previous tests using a different BD-3-2W spray nozzle. Tests 10 and 11 used
a single spray in the center of the block but located 36 inches away from the collection

11
panel. Coverage was slightly larger than in Tests 3 and 9 where sprays were 48 inches
from the collection panel. Droplets from the wider cone angle BD-3-2W spray, with less
volume capacity than the BD-3 spray (0.62 gpm to 0.85 gpm), tend to lose velocity and
drop out sooner. Tests 12 and 13, with sprays eight inches apart, show additional width of
coverage. Tests 14-21 used three sprays in a triangular pattern. Results show that the
coverage area provided by this pattern increases significantly. Tests 20 and 21 were
conducted with air velocity of about 144 fpm perpendicular to the spray cone and the
spray coverage deflected to the right as expected.
Additional tests were conducted to study the effect of air velocity on the effective reach
of a BD-3 spray operating at different spray pressures. Results are given in Table 6 and
Figure 21. It is observed that increasing pressure only minimally increases effective reach
when spraying perpendicularly into an air current. At 600 fpm air velocity only a 4-inch
increase in effective reach is seen when increasing spray pressure from 80 to 120 psi.
Small increases in effective reach of about eight inches are seen at velocities of 400 and
500 fpm over this same pressure range. At the lowest air velocity of 300 fpm the effective
reach increases 29 inches from 42 to 71 inches.
CFD Modeling of Water Sprays
For a single spray, width of the spray impact on the face is approximately 6.5 feet at the
center of the block height and reaches approximately 5.5 feet high from the floor as
shown in Figure 14. For three sprays in a conventional block, width of the face covered
at the center with respect to height is approximately 5.9 feet which is 0.6 feet less than
the single spray system while the height covered is the same as the single spray system as
shown in Figure 15. Since there are three sprays 0.5 feet apart and width of coverage has
decreased, interaction between sprays keeping them more confined is indicated or the
non-converging solution is causing this behavior. The Team believes this is due to
interaction between sprays.
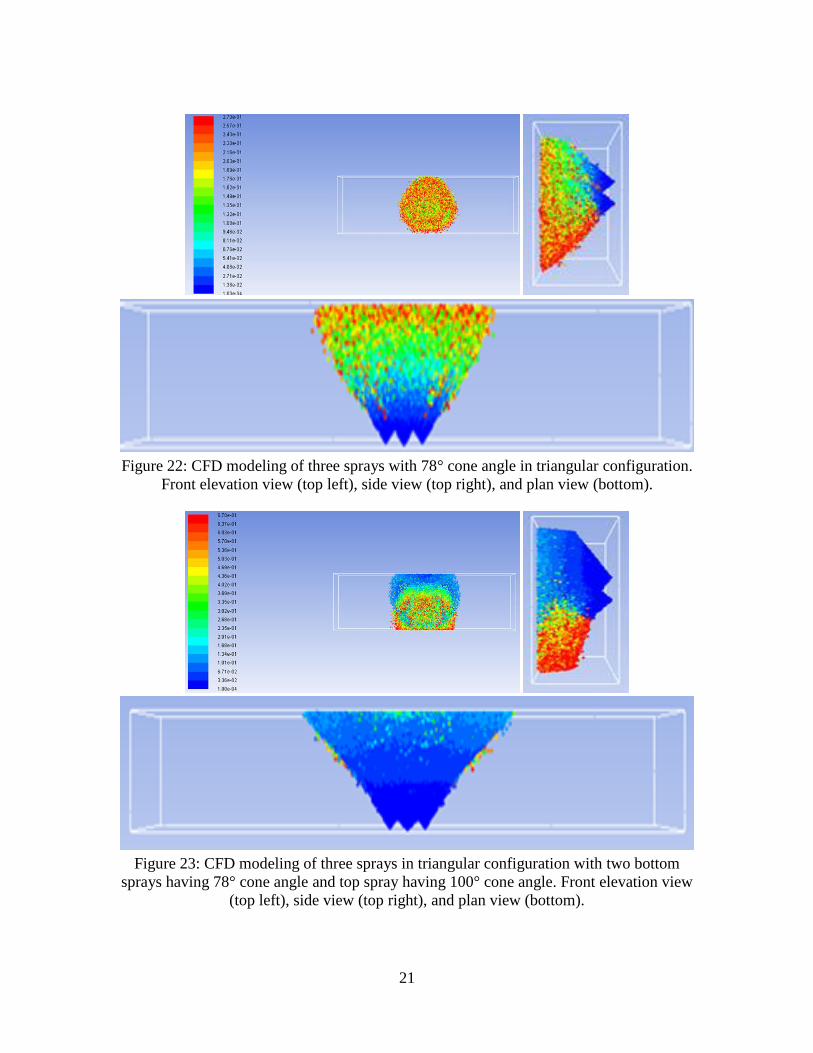
Coverage from the modified triangular pattern designed by the Team is seen in Figure 22.
The model used 78° spray cone angle for all sprays. Results for the second model using
the modified triangular design with 100° spray cone angle for the top spray of the
triangular pattern are shown in Figure 23. Coverage for Model 2 was 8.0 feet wide and
8.0 feet high. For Model 1, similar data were 6.2 and 6.0 feet, respectively. The triangular
configuration of sprays provides much better coverage than sprays located in a straight
line. With a top spray cone angle of 100°, coverage is improved, but droplet density in
the additional coverage area is smaller. The shape of the covered area for Model 2 is
rectangular covering all areas equally as compared to Model 1 where some areas at the
top were not covered well.
Dust Control Assessment of Different Spray Configurations
The LDCF was initially set up to test ranging arm (RA) sprays along with the SC1 spray
system used at Mine 1. Subsequent tests were conducted to evaluate the SC2 design and
the effect of moving the S-C closer to the cutting drum on dust concentration. The RA at

12
Mine 1 used seven BD-3 sprays. RA sprays were mounted around the HG end of the RA
in a semi-circular pattern and oriented towards the cutting drum bits. RA sprays operated
at 75 psi and S-C sprays operated at 100 psi for each test. Results of four tests are
included in Tables 11 and 12. With SC1, the dust reduction was 92.9% at Point A while
it was only 73.5% with SC2. Dust reductions using SC2 at Points B, C, and D were
significantly higher than for SC1 indicating SC2 may be displacing more dust into the
walkway at Point A.
These observations indicated that adding additional sprays to the S-C could improve dust
reductions even further and possibly protect the walkway at Point A. It was also noted
that moving the S-C closer to the cutting drum by mounting the S-C on the RA could also
improve dust reduction and minimize dust reaching the walkway. To test the above
hypotheses, one spray was added at the TG end of the SC2 design and it was oriented
towards the TG drum at 30°. Five tests were conducted to compare performance of SC1
and SC2 at varying distances from the cutting drum. Sprays were operated at 100 psi and
the fan at 25 Hz for all tests. Tests 1, 2, and 3 used the SC2 design mounted on the top
face side of the RA, top gob side of the RA, and the conventional location, respectively.
For Tests 4 and 5, the SC1 was mounted at the conventional location and top gob side of
the RA, respectively. Results are seen in Table 13 and indicate that as both SC1 or SC2
are moved closer to the cutting drum, dust concentrations are reduced at Points C and D.
Results indicate the S-C blows dust into the walkway at Points A and B, but follows the
same trend as the other points when moving the S-C closer to the cutting drum.
The effect on walkway points of operating the S-C and RA sprays separately and together
at higher pressures was evaluated using two tests with sprays operating at 85 and 100 psi.
All other test parameters were held constant. Results are presented in Table 14, which
indicates that at 100 psi, dust in the walkway increased significantly at Points A and B.
Furthermore, S-C sprays when operating alone or in conjunction with RA sprays seem to
increase walkway dust concentrations. At Point D, the effect of higher spray pressure is
to reduce dust reduction while at Point C results are mixed.
Three tests were run to evaluate effects on dust control performance of S-C and RA
sprays in incrementally increased air velocities. Three fan settings of 30, 40, and 50 Hz
were used giving velocities of 581, 757, and 1,002 fpm, respectively, at Sampling Point 1
(Figure 18). Results presented in Table 15 indicate that as air velocity increases, dust
concentrations increase significantly at walkway Points A and B, but are reduced at
Points C and D. At the lowest velocity of 581 fpm, when both SC and RA sprays were
operating, dust reduction at Points A and D was highest as was the overall mean.
Effect of Air Velocity on Dust Concentration in the LCDF
Two initial tests were conducted to determine dust concentrations at different locations as
a function of air velocity in the LCDF (Table 3). At the mid-chassis location, a 29.4%
increase in air velocity from 299 fpm to 387 fpm resulted in a decrease in dust
concentration of 38.5% from 16.2 to 9.97 mg/m3. The variability in dust concentration at
the mid-chassis location increases with air velocity as indicated by standard deviation

13
data. This is most likely caused by turbulence from the cutting drum and the shape of the
shearer chassis. Concentrations at the TG end and downwind of the shearer are more
consistent as airflow is more homogeneous.
CFD Modeling of Airflow around Shearer
Validation between the CFD and experimental data was done by comparing air velocity
contours at different heights above the floor. For the area depicted in Figure 24(a), the
maximum velocity for z = 1 foot above the floor is observed at points behind the HG
drum where air enters into the widened area where coal has just been cut. The maximum
CFD velocity is about 1,400 fpm while the measured value is about 1,050 fpm. This
discrepancy is most likely due to turbulence. In the walkway near the shields, where
airflow is relatively homogeneous, velocities vary 200-500 fpm based on the CFD model
and 200-400 fpm based on measurements. However, near the center of the distance
between shearer and shields, CFD velocities are much higher as compared to
experimental data. Velocities near the face based on both data sets are 200-500 fpm.
Velocities in this range were also encountered when air emerged from under the cutting
drum causing some turbulence. For z = 3 feet, the average velocity at the entrance shown
in Figure 24(b) is 1,000-1,200 fpm based on both data sets. In the walkway near the
shields and at the face, the range of velocities is the same as for z = 1 foot. Different
velocities depicted by the two data sets still persist at the walkway center. For z = 5 feet,
few obstacles exist in the path of the air and data sets around this height are similar
(Figure 24(c)). Differences observed in the walkway at lower heights are also decreased.
Velocities in the range of 400-800 fpm are measured experimentally and in the CFD
model. Air velocities near the face are similar at all heights; however, at the center of the
HG portion of the shearer and the face, higher velocities ranging from 700 to 900 fpm
were encountered. For z = 7 feet, (Figure 24(d)), air velocities are very low over the HG
cutting drum due to the fact that airflow becomes linear and fills the area near the face
after a short distance. Measured velocities over the TG drum are higher compared to data
at z = 5 feet due to few obstacles and more uniform airflow. Near the shields, velocities
are similar to those for lower z values; and in the walkway, results are more uniform.
Analysis of Air Recirculation Patterns from Shearer Drum towards the Walkway
Airflow patterns at several other z values beyond those indicated above near the HG
drum were also reviewed (Figure 25). At z = 4.26 feet and 4.6 feet, an air recirculation
pattern was observed that could carry dust-laden air from the shearer drum toward the
operators as shown in Figures 25(b) and (c). This was attributed to the square-faced end
of the shearer chassis, which created a vacuum at those heights pulling dust-laden air
from the cutting drum area toward the walkway. To overcome this problem, a more
aerodynamic shearer was modelled by creating a 12-inch radius of curvature on the top of
the HG end of the shearer as seen in Figure 26. The airflow patterns for z = 3.94, 4.26,
4.6, and 4.9 feet for the modified shearer chassis were compared with those of the
currently designed (conventional) shearer (Figure 27). The recirculation of air is
significantly reduced. This simple design modification should help a lot.

14
CONCLUSIONS AND RECOMMENDATIONS
Spray Characterization
Limited analysis on the effective reach and coverage area of two typical hollow-cone
sprays was performed. It was concluded that if two or more sprays are mounted close
together, they interact with each other to decrease the overall coverage area. If the
spacing between sprays is too large, spray droplet density increases, but gaps in coverage
emerge that allow dust to escape. This is an important design variable that has not been
considered in designing sprays for mining applications. Furthermore, at air velocities
above 300 fpm that are perpendicular or close to perpendicular to nozzle orientation, the
distance spray droplets can travel is significantly reduced. This is a very important design
consideration for longwall faces where the air velocity is typically higher than 300 fpm.
Dust Control Assessment of Different Spray System Configurations
Limited testing conducted during this project has identified some areas for improvements
for protecting longwall face personnel. First, the proximity of the shearer-clearer to the
cutting drum has a significant impact on dust concentrations downwind of the shearer. It
is a very important design variable that must be optimized. Second, one significant
approach to controlling dust from the cutting drum is to create a complete envelop around
the drum and freshly cut face area and direct the airflow along the freshly cut face where
it can be wetted down by the chassis sprays system. Finally, controlling dust in the
walkway behind the shearer drum and along the length of the shearer can be difficult due
to high air velocities. Spray orientations and operating pressures and wettability of dust
are very important considerations that cannot be ignored.
CFD Modeling
Airflow patterns and air velocity distributions for the LDCF were analyzed using CFD
modeling and compared with air velocity distribution measurements collected in the
LDCF. Qualitatively, experimental and CFD data results were similar. Quantitatively,
results matched well (within 5%) in areas where there are no obstructions to airflow.
Large differences in certain areas can be attributed to factors such as: 1) The geometry of
modeled equipment may not exactly replicate the physical size and shape of equipment
within the facility, 2) The volume of air input and its spatial velocity distribution in the
physical facility may be slightly different than in the simulation model, and 3) The
outside weather and wind velocity may affect air velocity measurements within the
facility. Overall, the CFD simulation and measured velocities are in general agreement in
most areas. Therefore, CFD modeling can be effectively used to assess the effects of
varying different parameters within the facility.
15
FIGURES
Figure 1: Shearer cutting drum (left) and drum and pick sprays location (right).
Figure 2: LDCF plan view and air velocity profile sampling locations.
Figure 3: View of ventilation fan inside the longwall dust control facility (LDCF).

16
Figure 4: Framework for shearer chassis and face conveyor.
Figure 5: Completed shearer chassis and face conveyor.
Figure 6: Cutting drum during fabrication stage (left) and with cutting bits (right).
Figure 7: Water spray control center. Figure 8: Fan performance curve.

17
Figure 9: PDM dust concentration for head-to-tail pass (top left), tail-to-head pass (top
right), and Shield 10 location showing intake dust (bottom center).
Figure 10: Microtrac particle size analysis for pulverized coal dust for testing.
1 8 15 22 29 36 43
2 9 16 23 30 37 44
3 10 17 24 31 38 45
4 11 18 25 32 39 46
5 12 19 26 33 40 47
6 13 20 27 34 41 48
7 14 21 28 35 42 49
Figure 11: Water spray characterization panel.

18
Figure 12: Spray block specifications and nozzle orientation for characterization studies.
Figure 13: CFD modeled area for sprays characterization.
Figure 14: Single spray particle residence time in seconds. Front elevation view (top left),
side view (top right), and plan view (bottom).

19
Figure 15: Particle residence for three sprays spaced six inches apart horizontally. Front
elevation view (top left), side view (top right), and plan view (bottom).
Figure 16: Typical location of S-C arm.
(a) (b)
Figure 17: (a) SC1 and (b) SC2 shearer-clearer arms.

20
Figure 18: Dust and air velocity sampling locations during dust testing.
(a) (b)
Figure 19: CFD Model of LDCF: (a) Elevation view and (b) Plan view.
Figure 20: Airflow patterns in the LDCF based on CFD modeling.
Figure 21: Effective reach of sprays in high air velocity.
21
Figure 22: CFD modeling of three sprays with 78° cone angle in triangular configuration.
Front elevation view (top left), side view (top right), and plan view (bottom).
Figure 23: CFD modeling of three sprays in triangular configuration with two bottom
sprays having 78° cone angle and top spray having 100° cone angle. Front elevation view
(top left), side view (top right), and plan view (bottom).

22
(a)
(b)
(c)
(a) (b)
Figure 24: Air velocity contours in LDCF based on experimental measurements (left) and
CFD modeling (right) for: (a) z = 1 foot, (b) z = 3 feet, (c) z = 5 feet, and (d) z = 7 feet.

23
(a) (b)
(a) (b)
(a) (b)
(a) (b)
Figure 25: CFD velocity contours at: (a) z = 3.94 feet, (b) z = 4.26 feet, (c) z = 4.6 feet,
(d) z = 4.9 feet, (e) z = 5.25 feet, (f) z = 5.9 feet, (g) z = 6.56 feet, and (h) z = 7.22 feet.

24
Figure 26: CFD modeling of aerodynamic shearer end chassis with 12 inch radius.
(a) (b)
(c) (d)
Figure 27: Airflow pattern for aerodynamic shearer chassis ends at: (a) z = 3.94 feet,
(b) z = 4.26 feet, (c) z = 4.6 feet, and (d) z = 4.9 feet.
25
TABLES
Table 1: Air velocity profile data for LDCF.
Point
Fan @ 25 Hz Fan @ 30 Hz Fan @ 40 Hz Fan @ 50 Hz
Velocity (fpm)
Volume (cfm)
Velocity (fpm)
Volume (cfm)
Velocity (fpm)
Volume (cfm)
Velocity (fpm)
Volume (cfm)
A 501 15,871 601 19,052 765 24,235 50 30,469
B 369 22,452 454 27,669 578 35,221 724 44,112
C 592 5,923 692 6,923 903 9,028 1093 10,925
D 504 15,115 581 17,439 757 22,695 1002 30,058
E 280
n/a
360
n/a
447
n/a
596
n/a F 265 284 379 542
G 310 395 550 750
Table 2: PDM dust concentration data on longwall face (Mine 1).
Test Location TWA (mg/m3) Max. (mg/m
3)
Head-to-tail pass 3.871 14.679
Tail-to-head pass 5.496 54.687
Intake 0.688 15.577
Notes: TWA: Time-weighted average, Max: Highest concentration observed
Table 3: Variation of dust concentration with air velocity.
Test Location Dust Concentration (mg/m
3) Air
Velocity (fpm) TWA Max Min St. Dev.
1
HG ranging arm 20.674 29.7 12.58 5.49 563
Mid-chassis 16.202 19.64 12.71 1.885 299
TG ranging arm 9.368 11.79 6.54 1.274 420
15 feet past TG drum 12.841 17.09 10.59 1.855
2
HG ranging arm 11.977 17.43 7.19 3.01 695
Mid-chassis 9.972 13.51 6.9 2.235 387
TG ranging arm 6.908 8.21 6.19 0.633 561
15 feet past TG drum 9.349 10.6 7.42 0.937
Table 4: Spray pressure-distance characterization studies BD-3 sprays.
Test Distance
(ft) Pressure
(psi) Test
Distance (ft)
Pressure (psi)
1 3 70 7 4 100
2 3 80 8 5 70
3 3 90 9 5 80
4 4 70 10 5 90
5 4 80 11 5 100
6 4 90
26
Table 5: Spray pressure-distance characterization tests BD-3-2W sprays.
Test Number of Sprays,
Pattern Pressure
(psi) Distance (inches)
Air Velocity (fpm)
Test 1 3, single row 100 48 0
Test 2 3, single row 110 48 0
Test 3 1, center port 110 48 0
Test 4 1, left port 100 48 0
Test 5 1, right port 110 48 0
Test 6 3, single row 100 48 0
Test 7 1, left port 100 48 0
Test 8 1, right port 100 48 0
Test 9 1, center port 100 48 0
Test 10 1, center port 100 36 0
Test 11 1, center port 100 36 0
Test 12 2, single row, 8-in spacing 100 36 0
Test 13 2, single row, 8-in spacing 100 36 0
Test 14 3, triangular 16/12 90 36 0
Test 15 3, triangular 16/12 90 36 0
Test 16 3, triangular 16/12 100 36 0
Test 17 3, triangular 16/12 100 36 0
Test 18 3, triangular 16/12 110 36 0
Test 19 3, triangular 16/12 110 36 0
Test 20 3, triangular 16/12 110 36 144
Test 21 3, triangular 16/12 120 36 143
Table 6: Sprays characterization (pressure-distance) tests in high air velocities.
Air Velocity (fpm)
Spray Pressure (psi)
Effective Distance of Sprays (inches)
300
80 42
90 50
100 62
110 70
120 71
400
80 26
90 30
100 33
110 36
120 38
500
80 24
90 26
100 28
110 30
120 32
600
80 12
90 13
100 14
110 15
120 15
27
Table 7: Mesh parameters for CFD models.
Advanced size function: On: Proximity and curvature
Relevance center: Medium
Smoothing: High
Proximity size function sources: Edges
Method: Tetrahedrons
Feature capture: Feature Angle
Absolute tolerance: 5 e-002 m
Intersection feature creation: Yes
Element size: 0.1 m
Behavior: Hard
Table 8: Solution methods for CFD modeling of LDCF.
Parameter Solution Method 1 Solution Method 2
Scheme SIMPLE SIMPLE-C
Gradient Green Gauss Node Based Green Gauss Node Based
Pressure Standard 2nd
Order
Momentum 1st Order Upwind 2
nd Order Upwind
Turbulent Kinetic Energy 1st Order Upwind 2
nd Order Upwind
Turbulent Dissipation Rate 1st Order Upwind 2
nd Order Upwind
Table 9: Sprays characterization study results for single BD-3 spray.
0 0 1.0285 0 0 0 0 0.9845 0 0 0 0 0 0
0 0 0 0 0 0 0 1.048 1.05 0 0 0 0 0
0 1.147 4.03 1.3815 1.1985 0.9805 0 0.9905 1.014 4.399 1.3505 1.231 0 0
0 1.261 1.311 1.145 1.1125 1.0335 0 1.0175 1.012 1.2505 1.0825 1.0725 1.072 0
0 1.179 1.4545 1.6065 1.0235 1.0715 0 0 1.198 1.179 1.4715 1.1375 1.002 0
0 0 0 0 1.016 1.0045 0 0 0 0 0 1.1135 1.028 0
0 0 0 1.6915 0 0 0 1.992 0 0 1.676 0 0 0
0 0 0 0 0 0 0 0.972 0.981 0.9805 0 0 0 0
0 0 0 0 0 0 0 0 0 0 0 0 0 0
0 1.058 1.4175 1.047 1.0185 0 0 1.0055 1.0355 1.796 1.146 1.021 0 0
1.0005 1.1145 1.079 1.154 1.196 1.006 0.986 1.0225 0.9995 1.088 1.0795 1.0685 1.01 0
0 1.0815 1.1555 1.273 1.1755 0.9905 0 0 1.057 0 1.142 1.0615 0.993 0
0 0 0 0 1.0415 1.009 0 0 0 0 0 1.017 0.9855 0
1.559 0 0 1.662 0 0 0 2.3195 0 0 1.2625 0 0.998 0
0 0 1.0745 0 1.021 0 0 0 0 0 0 0 0 0
0 0 1.045 0 0.9955 0 0 0.9965 1.0145 0.9935 0 0 0 0
0 1.105 4.726 1.5255 1.1825 1.0265 0 1.0065 1.0775 2.3835 1.1665 1.0535 0.9875 0
0.9895 1.296 1.3265 1.233 1.1525 1.0365 0 1.006 1.0135 1.125 1.088 1.054 1.0055 0
0.9825 1.2735 1.665 1.9215 1.086 1.0035 0 0 1.0915 1.033 1.211 1.0685 1.003 0
0 0 0 0 1.03 1.022 0 0 0 0 0 1.042 0.9898 0
1.66 0 0 1.949 0 0 1.002 1.622 0 0 1.282 0 0 0
0 0 0 0 0.9865 0.972 0 0 0 0 0 0 0 0
0 0 0.974 0 0.986 0.985 0 0 1.007 1.027 0 0 0 0
1.041 1.1385 2.7575 1.209 1.051 0.984 0 0.991 1.031 3.0535 1.159 1.0495 1.0085 0
1.037 0.997 1.057 1.118 1.161 1.0315 0 1.034 0.9765 1.118 1.082 1.0595 1.039 0
0 1.2305 1.177 1.375 1.103 0.9865 0 0 1.082 1.0245 1.2055 1.0695 1.0415 0
0 0 0 0 1.0655 1.011 0 0 0 0 0 1.0435 1.0255 1.009
2.6905 0 0 2.201 0 0 0 1.779 0 0 1.245 0 0 0
0 0 0 0 0 0 0 0.9745 0 0 0 0 0 0
0 0.9965 0.999 0 0 0 0 1.0095 1.028 1.0285 0 0 0 0
0.9985 1 3.197 1.183 1.1685 0.9705 0 1.029 0.972 3.685 1.207 1.0965 0.9985 0
0.98 0.0895 1.0605 1.0495 1.081 1.038 0 1.03 1.1175 1.0955 1.076 1.065 1.0515 0
0 0.9925 1.137 1.3945 1.082 0 0 0 0 1.0585 1.148 1.0785 1.0075 0
0 1.173 0 0 1.062 1.0085 0 0.986 0 0 0 1.051 0.996 0
1.4745 0 0 1.422 0 0 0 1.9425 0 0 1.3095 0 0 0.9875
0.985 0 0.991 0 0 0 0
0 1.037 1.024 0 0 0 0
1.0175 1.082 3.9315 1.2715 1.1925 0.999 0
1.019 0.997 1.1265 1.07 1.0835 1.078 0
0 1.2415 1.169 1.465 1.1375 0 0
0 0 0 0 1.07 1.02 0.9985
1.626 0 0 1.495 0 0 0.972
Test 8 5ft @ 70psi
Test 7 4ft @ 100psi
Test 6 4ft @ 90psi
Test 11 5ft @ 100psi
Test 10 5ft @ 90psi
Test 9 5ft @ 80psi
Test 1 3ft @ 70psi
Test 2 3ft @ 80psi
Test 3 3ft @ 90psi
Test 4 4ft @ 70psi
Test 5 4ft @ 80psi
28
Table 10: Spray characterization study results for BD-3-2W sprays.
Table 11: Dust concentration testing for SC1 arm.
Test Condition Dust Concentration (mg/m
3)
Pt. A Pt. B Pt. C Pt. D
Dust only 3.72 4.59 35.10 31.16
Sprays on 0.26 1.25 23.14 22.94
Percent (%) reduction 92.9 72.7 34.1 26.4
Air Velocity (fpm) Pt. 1 Pt. 2 Pt. 3
933 467 773
Table 12: Dust concentration testing for SC2 arm.
Test Condition Dust Concentration (mg/m
3)
Pt. A Pt. B Pt. C Pt. D
Dust only 0.92 2.79 42.13 54.54
Sprays on 0.24 0.43 4.96 5.17
Percent (%) reduction 73.5 84.7 88.2 90.5
Air Velocity (fpm) Pt. 1 Pt. 2 Pt. 3
899 578 703
0 0 0 0 0 0 0 0 0 0 0 0 0 0 0 0 0 0 0 0 0 0 0 0.011 0.177 0.038 0 0
0 0 0 0 0 0 0 0 0 0 0 0 0 0 0 0 0 0 0 0 0 0 0.016 0.109 0.113 0.393 0.046 0
0 0.019 1.181 0.108 0.039 0.014 0 0.11 0.014 0.088 0.013 0 0 0 0 0.553 4.017 0.6 0.551 0.037 0 0 0.646 3.183 1.362 0.641 0.294 0
0 0.079 0.218 0.55 0.647 0.37 0 0.134 0.088 0 0.105 0 0 0 0.055 0.466 0.551 0.471 0.535 0.433 0 0.104 0.874 1.264 1.219 0.728 0.692 0.065
0 0 0.03 0.203 0.135 0.141 0 0 0.061 0 0.171 0 0 0 0.053 0.624 0.73 0.503 1.303 0.405 0 0 1.018 0.983 1.663 1.046 0.132 0.289
0 0.079 0 0 0.199 0.023 0.035 0.021 0.22 0 0 0 0 0 0 0.684 1.259 1.038 0.893 0.214 0.135 0 0.554 0.598 1.485 0.705 0.496 0.441
0.148 0 0 0.727 0.043 0 0.089 0.581 0 0 0.155 0 0 0 0.431 0.123 0 1.461 0.273 0 0.165 0.521 0.144 0.419 1.178 0.241 0.038 0.232
0 0 0 0 0 0 0 0 0 0 0 0 0 0 0 0 0 0.144 0.063 0 0 0 0 0 0 0.084 0 0
0 0 0 0 0 0 0 0 0 0 0 0 0 0 0 0 0.057 0.081 0.32 0.022 0 0 0 0 0 0.088 0.45 0.048
0 0 0.815 0.002 0.015 0.017 0 0 0 0 0 0.011 0.012 0 0 0.481 3.304 1.199 0.48 0.161 0 0 0.327 1.274 0.914 1.211 0.525 0
0 0.132 0.291 0.473 0.65 0.424 0 0 0 0 0 0.051 0.199 0.072 0 0.62 0.938 0.999 0.491 0.529 0 0 0.283 0.453 1.189 1.037 0.751 0.107
0 0 0.06 0.272 0.167 0.119 0 0 0 0 0.013 0.605 0.163 0.17 0 0.448 1.281 1.47 0.713 0.216 0.142 0 0.585 1.003 1.423 1.414 0.29 0.227
0 0 0 0.025 0.308 0.052 0 0 0 0 0 0.514 0.321 0.131 0 0.553 0.079 1.257 0.693 0.376 0.262 0 0.342 0.648 1.135 1.465 0.526 0.23
0.111 0 0 0.549 0.148 0 0 0 0 0 0.108 0.231 0 0.171 0.248 0.103 0.321 0.93 0.339 0 0 0 0.042 0.036 1.459 0.251 0.002 0.102
0 0 0 0 0 0 0 0 0 0 0 0 0 0 0 0 0.022 0.176 0.063 0 0 0 0 0 0.201 0.105 0 0
0 0 0 0 0 0 0 0 0 0 0 0 0 0 0 0.064 0.099 0.145 0.36 0.058 0 0 0 0.114 0.031 0.098 0.504 0
0 0.018 0.522 0.085 0.031 0.024 0 0 0 0 0.149 0 0.009 0 0 0.482 3.068 1.081 0.446 0.158 0 0 0.331 1.285 0.939 1.35 0.889 0
0 0.008 0.042 0.484 0.077 0.187 0 0 0 0 0.246 0.017 0.036 0 0 0.672 1.214 1.075 0.63 0.518 0.032 0 0.225 0.346 1.205 1.084 0.658 0.139
0 0.008 0 0.17 0.218 0.213 0 0 0 0 0.193 0.285 0.189 0 0.037 0.782 1.131 1.543 0.772 0.194 0.146 0 0.562 1.073 1.561 1.549 0.342 0.226
0 0.094 0 0.062 0.541 0.181 0 0 0.147 0.388 0.086 0.629 0.224 0 0 0.536 0.045 1.266 0.712 0.467 0.307 0 0.323 0.625 1.121 1.446 0.489 0.217
0.112 0 0 0.584 0.193 0 0 0.024 0.044 0.322 0.54 0.258 0 0.005 0.515 0.151 0.237 1.866 0.326 0.031 0.15 0 0.004 0 0.966 0.23 0 0.105
0 0 0 0 0 0 0 0 0 0 0 0 0 0 0 0 0.019 0.191 0.062 0 0
0 0 0 0 0 0 0 0 0 0 0 0 0 0 0 0.011 0.142 0.087 0.354 0.055 0
0.023 0 0.027 0 0 0 0 0 0 2.033 0 0.08 0 0 0 0.474 2.671 1.237 0.547 0.168 0
0.162 0.213 0.007 0.047 0 0 0 0 0.236 0.079 0.264 0.037 0.144 0 0.037 0.767 1.259 1.035 0.689 0.713 0.071
0 0 0 0.116 0 0 0 0 0.228 0.24 0.084 0.231 0.155 0 0 0.998 0.982 1.559 0.898 0.125 0.277
0 0.088 0 0.026 0 0 0 0 0.35 0.069 0.231 0.379 0.165 0 0 0.554 0.609 1.486 0.772 0.528 0.372
0 0 0 0.06 0 0 0 0.056 0.046 0 0.512 0 0 0 0.596 0.154 0.351 1.822 0.325 0.036 0.198
0 0 0 0 0 0 0 0 0 0 0 0 0 0 0 0 0 0.152 0.041 0 0
0 0 0 0 0.015 0 0 0 0 0 0 0 0 0 0 0.004 0.097 0.083 0.36 0.03 0
0 0 0 0.014 0.003 0 0 0 0 1.973 0.12 0.115 0.035 0 0 0.484 2.567 1.226 0.445 0.17 0
0 0 0 0.069 0.04 0.462 0.015 0 0.239 0.099 0.289 0.121 0.217 0 0.046 0.696 1.367 1.166 0.615 0.714 0.064
0 0 0 0.183 0.096 0.147 0.12 0 0.243 0.292 0.098 0.246 0.326 0 0.098 0.921 1.159 1.539 0.827 0.157 0.221
0 0 0 0 0.529 0.161 0.2 0 0.29 0.023 0.201 0.353 0.097 0 0 0.515 0.647 1.353 0.711 0.468 0.346
0 0 0 0.237 0.2 0.001 0.046 0.156 0.088 0 0.178 0 0 0 0.501 0.134 0.302 1.081 0.371 0.005 0.17
0 0 0 0 0 0 0 0 0 0 0 0 0 0 0 0 0.011 0.177 0.038 0 0
0 0 0 0 0.028 0.021 0 0 0 0 0 0 0 0 0 0.016 0.109 0.113 0.393 0.046 0
0.009 0.245 2.4 0.247 0.129 0.408 0 0 0.531 3.878 0.336 0.388 0.014 0 0 0.646 3.183 1.362 0.641 0.294 0
0.063 0.271 0.981 0.511 1.146 1.485 0 0 0.286 0.379 0.339 0.294 0.158 0 0.104 0.874 1.264 1.219 0.728 0.692 0.065
0 0.029 0.167 0.249 0.219 0.222 0 0.031 0.345 0.455 0.318 0.858 0.362 0 0 1.018 0.983 1.663 1.046 0.132 0.289
0 0.182 0.006 0.024 0.68 0.089 0.044 0 0.521 0.652 0.717 0.191 0.192 0 0 0.554 0.598 1.485 0.705 0.496 0.441
0.407 0 0.044 0.606 0.18 0 0.101 0.117 0.134 0.386 0.896 0.187 0 0 0.521 0.144 0.419 1.178 0.241 0.038 0.232
Test 17
Test 18
Test 19
Test 20
Test 21
Test 13
Test 11
Test 12Test 6
Test 7
Test 8
Test 9
Test 2
Test 3
Test 4
Test 5
Test 1
Test 10
Test 14
Test 15
Test 16

29
Table 13: Performance comparison of SC1 and SC2 for different locations.
Test
# Air Velocity
(fpm) Test Condition Dust
Conc. (mg/m
3)
Reduction All Points
(%)
Dust Reduction at Each Sampling Point
(%)
Pt 1 Pt 2 Pt 3 Pt A Pt B Pt C Pt D
1 449 333 436
PDMs ON 0.09
38.3 -75.8 -183.6 39.0 51.4
Air ON 1.27
Dust ON 9.21
Water ON, Dust ON 5.69
Water OFF, Dust ON 10.71
Dust OFF, Air ON 1.45
PDMs ON 0.12
2 491 278 463
PDMs ON 0.09
22.1 -122.5 -101.4 28.8 40.5
Air ON 1.13
Dust ON 9.85
Water ON, Dust ON 7.67
Water OFF, Dust ON 9.62
Dust OFF, Air ON 0.39
PDMs ON 0.10
3 438 257 450
PDMs ON 0.09
4.5 -89.5 -59.7 11.3 26.2
Air ON 2.15
Dust ON 11.14
Water ON, Dust ON 10.64
Water OFF, Dust ON 12.04
Dust OFF, Air ON 1.24
PDMs ON 0.19
4 425 276 467
PDMs ON 0.11
14.6 -134.3 -186.4 45.4 18.0
Air ON 1.56
Dust ON 10.91
Water ON, Dust ON 9.31
Water OFF, Dust ON 8.61
Dust OFF, Air ON 0.57
PDMs ON 0.13
5 463 307 464
PDMs ON 0.11
2.6 -810.9 -426.9 -13.0 41.0
Air ON 0.56
Dust ON 7.66
Water ON, Dust ON 7.46
Water OFF, Dust ON 9.77
Dust OFF, Air ON 0.60
PDMs ON 0.19

30
Table 14: Effect of water pressure on dust concentration (% reduction).
Test Test Condition Mean All Pts. Pt. A Pt. B Pt. C Pt. D
1 85psi
SC sprays ON 45.5 -100.4 -267.1 64.7 52.2
SC and RA sprays ON 55.9 -195.7 -190.9 72.6 60.8
RA sprays ON 39.7 -29.4 30.9 44.1 31.9
2 100psi
SC sprays ON 19.2 -935.9 -877.3 67.4 30.9
SC and RA sprays ON 31.6 -451.4 -682.2 66.2 45.6
RA sprays ON 39.0 -73.2 -65.0 50.0 26.6
Table 15: Effect of air velocity on dust concentration (% reduction).
Test Test condition
Air Velocity
(fpm) Mean
All Pts. Pt. A Pt. B Pt. C Pt. D
Pt. 1 Pt. 3
1 30 Hz
SC sprays ON
581 456
59.0 71.8 -23.6 69.4 58.8
SC and RA sprays ON 74.7 62.2 5.5 44.6 75.7
RA sprays ON 61.9 27.4 40.2 56.5 63.7
2 40 Hz
SC sprays ON
757 568
43.2 6.2 62.5 42.4
n/a SC and RA sprays ON 30.7 -69.1 -1.5 36.2
RA sprays ON -16.0 -3.4 16.2 -19.3
3 50 Hz
SC sprays ON
1002 750
46.9 -38.6 -39.0 15.2 50.0
SC and RA sprays ON 57.3 -124.2 -143.3 15.4 61.8
RA sprays ON 47.9 -31.4 -196.5 12.1 51.8
31
REFERENCES
Ren, T. and Wang, Z., 2013. “Computational Fluid Dynamics Modeling of Respirable
Dust and Gas Behavior on a Longwall Face.” Proceedings – The Australian Mine
Ventilation Conference, pp. 191-200 (The Australasian Institute of Mining and
Metallurgy: Melbourne).
Rider, J.P. and Colinet, J.F., 2011. “Benchmarking Longwall Dust Control Technology
and Practices.” National Institute for Occupational Safety and Health (NIOSH),
NIOSHTIC2 Number 20039782, Min. Eng., Sept.
Colinet, J.F., Rider, J.P., Listak, J.M., Organiscak, J.A., and Wolfe, A.L., 2010. “Best
Practices for Dust Control in Coal Mining”. U.S. Department of Health and
Human Services, Public Health Service, Centers for Disease Control and
Prevention, National Institute for Occupational Safety and Health, DHHS
(NIOSH) Publication No. 2010-110, Information Circular 9517.
Rider, J.P., and Colinet, J.F., 2007. “Current Dust Control Practices on U.S. Longwalls.”
Proceedings – Longwall USA, Pittsburgh, PA, June 5 – 7, National Institute for
Occupational Safety and Health (NIOSH), NIOSHTIC2 Number: 20033035.
Kissel, F.N., Colinet, J.F., and Organiscak, J.A., 2003. “Handbook for Dust Control in
Mining.” U.S. Department of Health and Human Services, Public Health Service,
Centers for Disease Control and Prevention, National Institute for Occupational
Safety and Health, DHHS (NIOSH), Chapter 3, pp. 39-51.
Organiscak, J.A., 1999. “Investigation of Longwall Face Ventilation Air-Splitting
Methods for Improved Dust Control.” SME Annual Meeting, SME Preprint 99B5,
Littleton, CO, pp. 1-14.
Colinet, J.F., Spencer, E.R., and Jankowski, R.A., 1997. “Status of Dust Control
Technology on U.S. Longwalls.” Proceedings – 6th International Mine
Ventilation Congress, Ramani, R.V., ed., Chapter 55, Society for Mining,
Metallurgy, and Exploration, Inc., Littleton, CO, pp. 345-351.
Jayaraman, N.I., Jankowski, R.A., and Kissell, F.N., 1985. “Improved Shearer-clearer
System for Double Drum Shearers on Longwall Faces.” Pittsburgh, PA: U.S.
Department of the Interior, Bureau of Mines, RI 8963, NTIS No. PB86-107844.

32
DISCLAIMER STATEMENT
This report was prepared by Y.P. Chugh of Southern Illinois University Carbondale, with
support, in part, by grants made possible by the Illinois Department of Commerce and
Economic Opportunity through the Office of Coal Development and the Illinois Clean
Coal Institute. Neither Y.P. Chugh and Southern Illinois University Carbondale, nor any
of its subcontractors, nor the Illinois Department of Commerce and Economic
Opportunity, Office of Coal Development, the Illinois Clean Coal Institute, nor any
person acting on behalf of either:
(A) Makes any warranty of representation, express or implied, with respect to the
accuracy, completeness, or usefulness of the information contained in this report, or that
the use of any information, apparatus, method, or process disclosed in this report may not
infringe privately-owned rights; or
(B) Assumes any liabilities with respect to the use of, or for damages resulting from
the use of, any information, apparatus, method or process disclosed in this report.
Reference herein to any specific commercial product, process, or service by trade name,
trademark, manufacturer, or otherwise, does not necessarily constitute or imply its
endorsement, recommendation, or favoring; nor do the views and opinions of authors
expressed herein necessarily state or reflect those of the Illinois Department of
Commerce and Economic Opportunity, Office of Coal Development, or the Illinois Clean
Coal Institute.
Notice to Journalists and Publishers: If you borrow information from any part of this
report, you must include a statement about the state of Illinois’ support of the project.