evolution of strategic alliance: relevance in the
TRANSCRIPT

Problemas del Desarrollo. Revista
Latinoamericana de Economía
ISSN: 0301-7036
Universidad Nacional Autónoma de México
México
Taddei Stradi, Julia
The Evolution of Strategic Alliance: Relevance in the Cognitive Capitalism
Problemas del Desarrollo. Revista Latinoamericana de Economía, vol. 35, núm. 137, 2004, pp. 185-
198
Universidad Nacional Autónoma de México
Distrito Federal, México
Available in: http://www.redalyc.org/articulo.oa?id=11825947010
How to cite
Complete issue
More information about this article
Journal's homepage in redalyc.org
Scientific Information System
Network of Scientific Journals from Latin America, the Caribbean, Spain and Portugal
Non-profit academic project, developed under the open access initiative

THE EVOLUTION OF STRATEGIC ALLIANCES
185 Vol. 35, núm. 137, abril-junio 2004
OM
EN
TAR
IOS Y D
EB
AT
ES
THE EVOLUTION OF STRATEGIC ALLIANCES:
RELEVANCE IN THE COGNITIVE CAPITALISM
JJJJJulia ulia ulia ulia ulia TTTTTaddei Straddei Straddei Straddei Straddei Stradi*adi*adi*adi*adi*
Fecha de recepción: 31 de marzo de 2004. Fecha de aceptación: 15 de junio de 2004.
Introduction
In our new phase of capitalism, knowledge is central. The industrial economics literature
has shown the importance of the increasing rhythm of innovation; value-creation is
becoming more and more linked to the firm’s informational ability. In this context, it
appeared logical that the increase in alliances was an efficient and flexible way to exchange
information, to share research costs, etc. The definition of alliances given by the Thomson
Financial Alliance database is that they exist where the sharing of property rights, risks
and benefit are defined, where operational tasks are affected, and where independence and
autonomy are preserved. A strategic alliance is created when two or more organisations
cooperate without creating a new entity. Hence, strategic alliances do not include joint
ventures. A joint venture appears when a new industrial entity is created and the participants
preserve their autonomy. The new entity can result from the merger of two former
subdivisions of each company or from the creation of a completely new entity. The
participants are the parents of the new entity. Nor are mergers and acquisitions alliances.
In contrast, strategic alliances appear when no new entity is created, even if the alliances
are formal. The industrial economics literature has shown how important strategic alliances
were. So the results we got from our database were surprising, as we would have expected
more alliances to have been created. But since 1995, the number of alliances created falls
dramatically. Our aim here is to propose some explanations for this evolution of alliances
and to try to extrapolate some possible future trends from these explanations. As transaction-
costs theory explains why one form of governance may be more efficient than another, we
* Julia Taddei Stradi (research assistant) under the supervision of Professor B. Paulré, MATISSE ISYS CNRS,Université Paris 1, Panthéon Sorbonne. E-mail: [email protected]

JULIA TADDEI STRADI
186 Vol. 35, núm. 137, abril-junio 2004
find its use relevant here. But this theory is very static as it supposes that the institutional
explanatory factors (asset specificity, uncertainty, frequency) are exogenous. Thus, it is
very difficult to understand the change. Our hypothesis here is that these factors are
endogenous. The evolution of alliances is also very closely related to the knowledge
cycle, characterised by paradigm waves, and thus to evolutionary economics. Alliances
can also be seen as institutional innovations, the appearance of which could be explained
by the evolutionism, diffusion and aims of a particular innovation related to the grapes of
innovation. However, evolutionary economics does not explain the choice of one innovation
rather than another. Hence, the use of both evolutionary and transaction-cost theory, as
two complementary theories, may be efficient here in explaining the change in alliances.
Why do firms not invest more in alliances?
• Introduction to the database
We are working with the Thomson financial database, which is updated in real time. In
obtaining the available results, we decided to stop updating of the data on June 30th. It
starts in 1962, but there are only very few alliances before 1985 hence, we are including
only the data since 1985. The database describes for each alliance: the participants,
their number, sector, year of creation, year of dissolution, type of contract, raison
d’être, and the sector in which it occurred.
• Introduction to the evolution of the number of alliances created
The evolution of the number of alliances created between 1985 and 2003 may be
described as an inverse U-curve where the maximum occurs in 1995. Because the
decline is sudden and violent between 1995 and 1996, we thought at first that there
may have been an error in the database. But there is no reason for a sudden loss of
accuracy in the Thomson database. Even if this is what happened, it may have been
compensated for as it is updated in real time.
This was unexpected because the literature generally assumed that the number of alliances
would go on increasing, apart from the MERIT database where a maximum is observable in
1995, although this is not so dramatic (see next page).
Three particular aspects of the evolution need explaining here:
1. The peak in 1995, followed by a dramatic decrease in the number of alliances in 1996
(-46% for effectives alliances; -43% for announced alliances).
2. The peak in 2000, although not as impressive as the previous one (-33,5% for effective
and announced alliances between 2000 and 2001).
3. The increasing gap between announced and realised alliances between 1994 and 2003
(the proportion of effective alliances in total announced alliances rises from 91,1% to
48% in 9 years).

THE EVOLUTION OF STRATEGIC ALLIANCES
187 Vol. 35, núm. 137, abril-junio 2004
We shall try here to give some elements of an explanation for these phenomena by
studying internal factors in the first part, and external or, rather, environmental factors in
the second part.
Internal factors
a) Alliance saturation
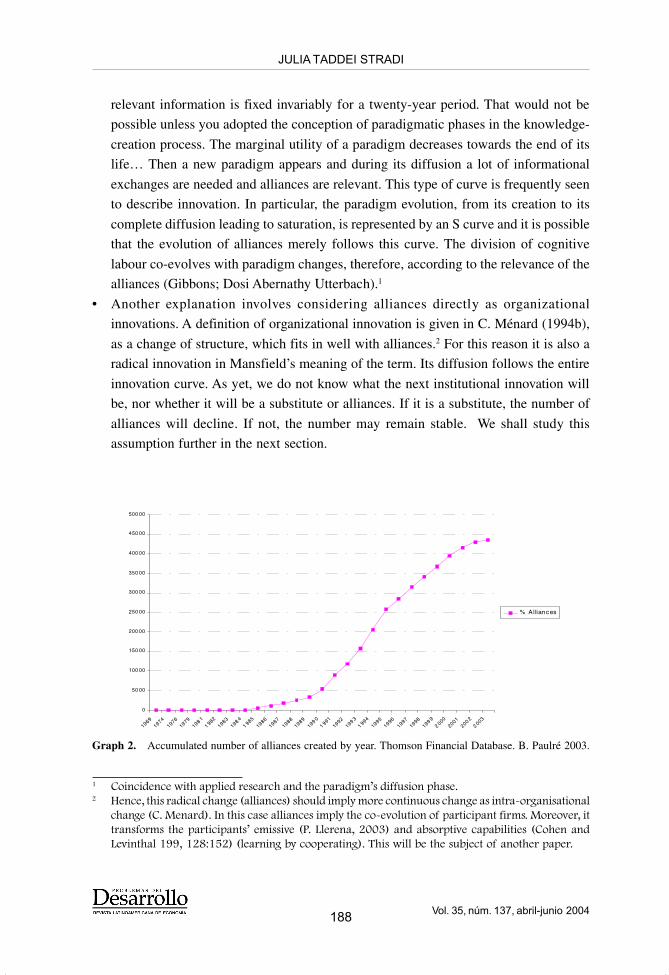
If we accumulate the number of alliances created, we find a logistic curve (an S-Curve).
This is represented below by a three-degree polynomial trend-curve (with a correlation-
coefficient of 0.9985), i.e. a logistic curve. It refers to a saturation phenomenon in the
population of firms. For a given and almost constant number of firms, the number of
alliances cannot increase infinitely because this would mean that a significant number of
alliances would be between the same partners. Many complementary explanations can be
made here:
• Even if the number of transactions needed were to increase infinitely you would need
many alliances between the same partners to economize on transaction costs to integrate
all these transactions into a single firm. This was explained by Coase in 1937, and is
why, with a constant population of firms, we would not expect an increase in alliances
above the level of 1995.
• If transactions-needs decline, the number of alliances will also fall, especially if the
need for relevant information-transfer is limited during a given period. All informational
exchanges are made during a certain period, and the marginal utility of this given stock
of information decreases with the number of informational transfers, as they start to
become redundant (redundancy is not efficient). Therefore, in the future we would
expect a cyclical evolution because alliances will increase again with the creation of a
new stock of relevant information to transfer. This assumes implicitly that the stock of
Graph 1. Number of alliances created in the CATI database, J. Hagedoorn.
0
100
200
300
400
500
600
700
800
900
Year
19 8119 83
19851987
19891991
199319 95
19 9719 99
Total num ber of
a ll iances in C A TIdatabase
JULIA TADDEI STRADI
188 Vol. 35, núm. 137, abril-junio 2004
relevant information is fixed invariably for a twenty-year period. That would not be
possible unless you adopted the conception of paradigmatic phases in the knowledge-
creation process. The marginal utility of a paradigm decreases towards the end of its
life… Then a new paradigm appears and during its diffusion a lot of informational
exchanges are needed and alliances are relevant. This type of curve is frequently seen
to describe innovation. In particular, the paradigm evolution, from its creation to its
complete diffusion leading to saturation, is represented by an S curve and it is possible
that the evolution of alliances merely follows this curve. The division of cognitive
labour co-evolves with paradigm changes, therefore, according to the relevance of the
alliances (Gibbons; Dosi Abernathy Utterbach).1
• Another explanation involves considering alliances directly as organizational
innovations. A definition of organizational innovation is given in C. Ménard (1994b),
as a change of structure, which fits in well with alliances.2 For this reason it is also a
radical innovation in Mansfield’s meaning of the term. Its diffusion follows the entire
innovation curve. As yet, we do not know what the next institutional innovation will
be, nor whether it will be a substitute or alliances. If it is a substitute, the number of
alliances will decline. If not, the number may remain stable. We shall study this
assumption further in the next section.
Graph 2. Accumulated number of alliances created by year. Thomson Financial Database. B. Paulré 2003.
0
50 00
100 00
150 00
200 00
250 00
300 00
350 00
400 00
450 00
500 00
19691974
19761979
198 11 982
1983198 4
1 9851986
19871988
1989199 0
1 9911992
199 31 994
19951996
19971998
199 92 000
2001200 2
2 003
% A l liances
1 Coincidence with applied research and the paradigm’s diffusion phase.2 Hence, this radical change (alliances) should imply more continuous change as intra-organisational
change (C. Menard). In this case alliances imply the co-evolution of participant firms. Moreover, ittransforms the participants’ emissive (P. Llerena, 2003) and absorptive capabilities (Cohen andLevinthal 199, 128:152) (learning by cooperating). This will be the subject of another paper.
THE EVOLUTION OF STRATEGIC ALLIANCES
189 Vol. 35, núm. 137, abril-junio 2004
b) Alliance diffusion
Another possible explanation for the alliance-dynamic lies in the relevance of alliances
compared with other types of organisations, where complementarities or inter-firm
exchanges are assumed to be constant. This leads to three types of question:
i) Why did the alliances take place?
The local stability of the organisation and of the technology related to irreversibilities
conceals a certain inability to adapt itself to environmental changes, giving rise to transitional
inefficiency within the organisation (J. Taddei Stradi, 2003; Chandler, 1977; and Teece
and Armour, 1978) explained by the emergence of the M-Form as an organisational
innovation due to the increasing complexity of management, and linked to an increasing
number of products. But this previous innovation did not favour sufficient cognitive
adaptability or reduce the cognitive frontiers traced by the increasing specificities within
the firm. These frontiers appear to be particularly inconvenient when a new paradigm has
just emerged. Then an incentive to the creation of new organisational forms may appear,
explaining the rise of a new diversity corresponding to an ex-ante uncertainty which will
be reduced by artificial selection through the institution. We certainly think that the rise
and spectacular growth of alliances are related to this development (J. Taddei Stradi 2003).
Alliances favour cognitive transfer and then reduce human asset-specificity and also physical
specificity. They increase the participants’ adaptability by favouring co-evolution.
ii) Why are alliances now considered inefficient or useless?
Three variables have an impact on alliance-efficiency as a mode of governance:
– Asset specificity decreases over time because exchanges of complementarities imply
the elaboration of certain compatibilities, certain cognitive standards, such as a common
language, but also technical compatibilities. Moreover, knowledge is specific before
being exchanged, and not afterwards. This is analytically obvious. Transactions become
less specific and afterwards the market becomes more efficient for these transactions.
This also fits well with the saturation described above. It is endogenous that the mar-
ginal utility of a new alliance-creation falls over time, according to the number of
alliances created in the past.
Another observation one can make is that as specificity decreases, profits linked to the
innovation also fall (see Langlois, 1991: “an asset is specific when it has a higher value
in a context of a transaction but not in another”) because property rights are no longer
protected by specificity. Thus the incentive to adopt or absorb this organisational
innovation decreases with profit, as described in Schumpeter (see Menard, 1994).

JULIA TADDEI STRADI
190 Vol. 35, núm. 137, abril-junio 2004
Thus alliance-diffusion contains its own dissolution within itself.
– The Frequency of informational transactions should decline in the third phase of the
paradigm, as explained above, because the marginal utility of new information decreases.
By the way, this has no influence in a context of non-specific transactions.
– Uncertainty should fall because opportunist and cooperative agents have been detected in
the past. This is one of the things agents can learn by cooperating. It also argues in favour
of an increase in market relevance against alliances. This is for endogenous uncertainty;
for exogenous uncertainty we must compare it with the volatility of demand in all sectors.
This could explain why the alliance-diffusion process ends in 1995. If our assumptions
above are correct, then, alliances are a transitory adaptation (to a new paradigm) or mutation
(or innovation). But, as transitional needs (new paradigms) appear cyclically, alliances
may need to be revived, unless a new organisational innovation appears, substituting alliances.
iii) What institutional form is considered to be mostpertinent or most efficient?
– 1st case: Agents prefer the market now.
– 2nd case: A new organisational innovation will appear.
c) The sector-based evolution of alliances
Up to now, we have explained a general evolution, but certainly there is no sector-based
effect, and we must now study the sector-based evolution of alliances.
Because of the immense number of activities in the database (60,563 major activities,
as we have to total up the activities of each participant within each alliance), we classified
them into a smaller number of categories. This is why we distinguished high-tech from
medium-tech sectors. Alliances are counted twice, once for each participant.
All the sectors, except two (logic products and software), evolve in the same way as
the global curve described, with a maximum in 1993-1994-1995. The previous explanations
seem to work for these sectors.
For the two exceptions, their maximum being in 2000, the previous explanation works
too, because they are general and do not depend on a particular year for the maximum.
But, we have to explain why these sectors rather than others differ in their evolution. One
assumption could be that logic products is the youngest of the high-tech sectors and the
need for important alliances for logic products is greater and lasts longer than other sectors
because the knowledge-cycle described earlier is more important. It is exactly the same
with software and other medium-tech sectors. Nevertheless, as in all sectors, there is a
significant fall in 1996. Why in that year?

THE EVOLUTION OF STRATEGIC ALLIANCES
191 Vol. 35, núm. 137, abril-junio 2004
Graph 3. Number of alliances created by sector and by year in the high-tech and medium-tech sectors. Thomson Financial Database, B. Paulré.3
3 Logic products are software programs for professional use, related to Business-to-Business (B-to-B).
h ightech sec tors
0
200
400
600
800
1000
1200
year
198619 88
19 9019 92
19 9419 96
19 9820 00
y e a rs
nu
mb
er
of
all
ian
ce
s c
rea
ted
p ro gic ie l
telec o m m unica tion
e quipm en t
o th er e lec t ro nic
c om pon ents
h ardware
s em ic ond uc tors
d ru gs
b iotec hno logy
medium h ightech sec tors
0
500
1000
1500
2000
2500
year
19 8619 88
19 9019 92
19941996
19982000
ye a r
nu
mb
er
of
all
ian
ce
s c
rea
ted software &s ervice s
petroleum &
chem is try
photo s
m otor vehic ule
elec t ric m a chinery
H
medium-tech sectors
-
JULIA TADDEI STRADI
192 Vol. 35, núm. 137, abril-junio 2004
Transition: Alliances appear to be less and less relevant in absolute and relative terms
(i.e., to another institutional form). Nevertheless, we still have to explain the sudden and
violent aspect of the change. In a single year (1995-96), the number of alliances created
falls by almost 50%. Can we explain the sudden change by a sudden dawning of
consciousness? And why in that year, rather than another?
External factors
Perhaps, if internal causes cannot explain why it was 1994 rather than another year, we
can find some explanation for this from the environment. We searched for some common
features with the evolution of characteristic-proxies for the financial environment, because
it is often explained that sharing costs and risks are important in the decision about whether
or not to form an alliance. But what we found was a little different. Environmental changes
may cause behavioural change such as becoming more cooperative or more opportunist.
This, therefore, has an impact on the number of alliances created. The first part is devoted
to the evolution of share valuations and their link with announced alliances, the second
part deals with the movement of interest rates and the cooperative ability of participant
tests using Gibbons model, while the third part focuses on dollar valuations and the incentive
for more competitive or more cooperative behaviour.
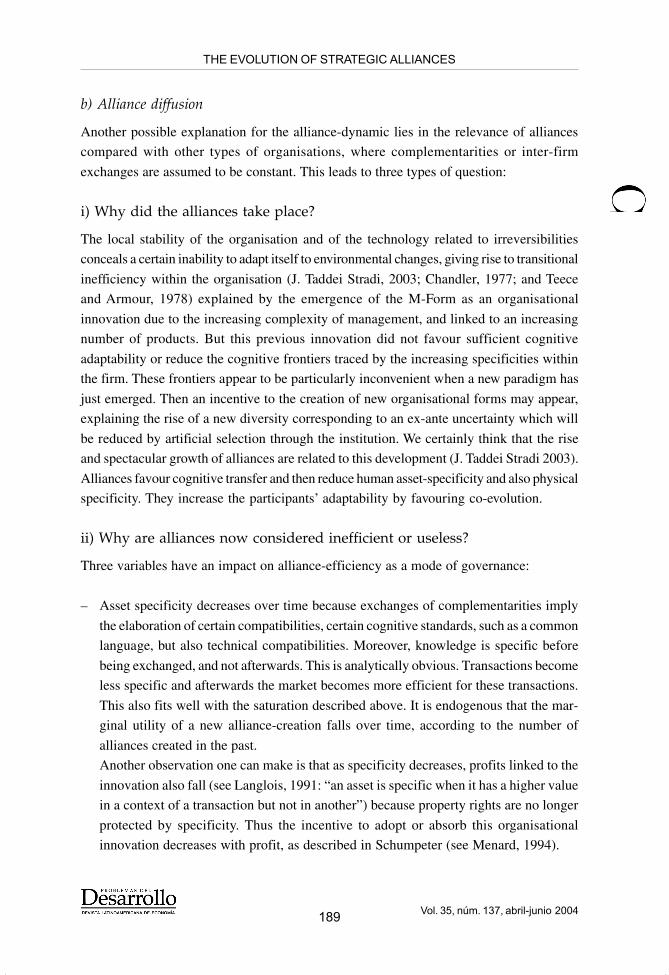
a) The Evolution of announced alliances and share valuations
In the preceding graphs, we were studying the alliances realised in the database. But, we
now consider the dynamic changes for announced alliances. If the number of alliances
still drops, the decline starts only in 2000, while in 1995 there is only a relative peak.
But the lag between announcement and realisation is less than one year for all the
alliances in the database that contains this information. Thus a change in this lag that
Graph 4. Number of alliances announced each year.Source: B. Paulré, Thomson Financial database
9 59 5,5
9 69 6,5
9 79 7,5
9 89 8,5
9 99 9,510 0
e ffec tiv
e year
1987
1990
19931996
1999
pe rc entag e of
al lian ces
real ised am o nd
al lian cesan nou nced
% of alliances
realized among
alliances announced

THE EVOLUTION OF STRATEGIC ALLIANCES
193 Vol. 35, núm. 137, abril-junio 2004
cannot explain the gap between the two curves. There is no reason either for the Thomson
database to lose its capacity to obtain the information for this period, as NTIC and economic
and financial information become more diffused in this period.
Why do firms announce projects that will not be realised? Perhaps their realisation was
never really desired, i.e. alliances are announced but not sought. Those that are realised
are no longer related to those that are merely announced. The announcements could be
aimed at artificially boosting falling stock prices. A more frequent use of this procedure
could be due to a learning process among agents. Firms would have observed the positive
effect that announcements had on stock prices in the past and try to reproduce it by
announcing alliances without any real economic justification for such "virtual" alliances.
If it does not cost anything to announce something false (even in terms of credibility
commitments, because it is not observable by the public which later forgets) and so this lie
may be profitable. It is actually surprising that it is not used more often. But maybe
announcements lose credibility and so does alliance-efficiency, so alliance-announcements
do not imply any necessary effect. Lies lose their efficiency. This is coherent with
evolutionism (learning) and with TCT (opportunism). Here, firms learn how to become
more opportunist (phase 1), and the market learns how to react to this new form of
opportunism (phase 2). The incentive to lie thus increases (phase 1) and then decreases
(phase 2). This is why the gap itself between announced and realised alliances follows a U-
curve. This crazy assumption seems to fit in with the previous one and the graphs below:
Effective year Alliances realised as a % of alliances announced
1985 98.81986 99.31987 98.81988 98.71989 97.91990 98.81991 97.91992 96.61993 96.81994 97.51995 98.11996 98.91997 99.21998 98.31999 98.92000 97.72001 97.12002 96.8
Total 97.9
Graph 5. Alliance realised as a % of alliances announced.
JULIA TADDEI STRADI
194 Vol. 35, núm. 137, abril-junio 2004
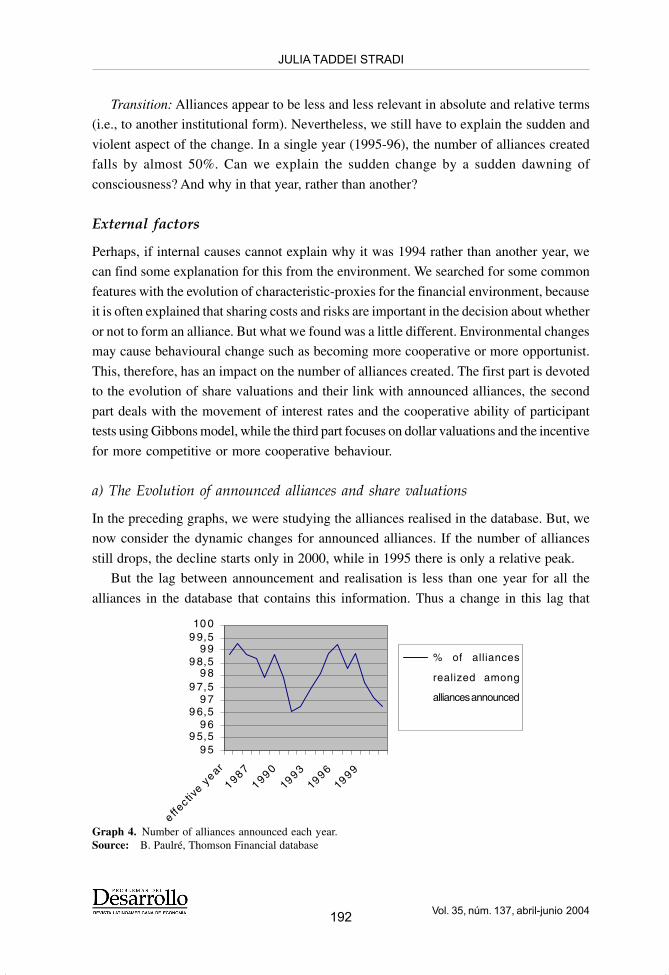
Phase 1:
1995-1996: a drastic fall in stock prices and announced and realised alliances.
1996-2000: announced alliances increase and realised alliances continue to decline.
Phase 2:
2000: a drastic fall in stock prices, but announced alliances converge with realised alliances.
2001-2003: stabilisation or increase in options, alliances and lag in announced and realised
alliances.
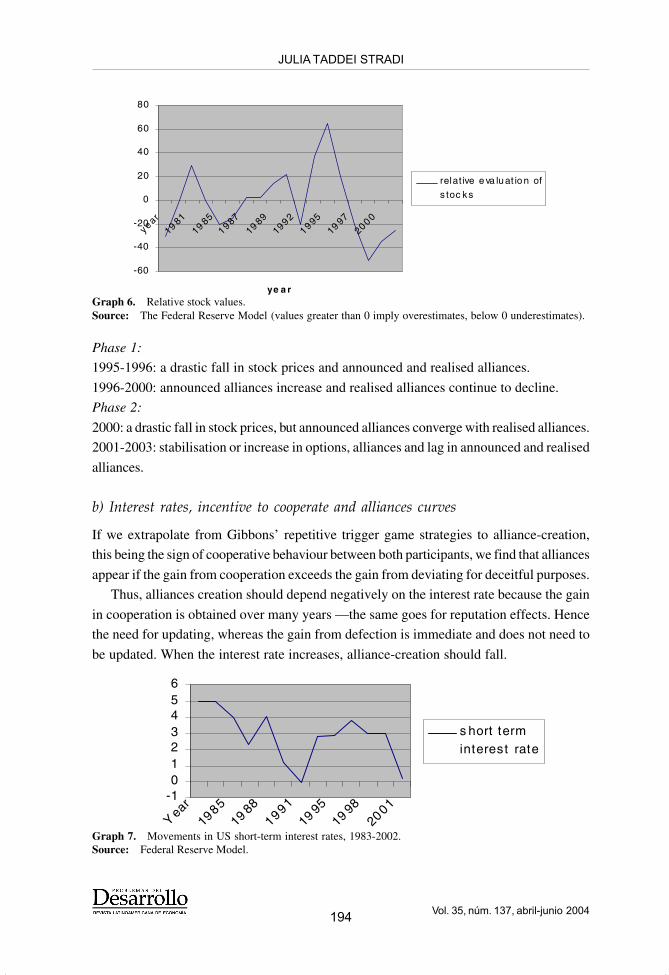
b) Interest rates, incentive to cooperate and alliances curves
If we extrapolate from Gibbons’ repetitive trigger game strategies to alliance-creation,
this being the sign of cooperative behaviour between both participants, we find that alliances
appear if the gain from cooperation exceeds the gain from deviating for deceitful purposes.
Thus, alliances creation should depend negatively on the interest rate because the gain
in cooperation is obtained over many years —the same goes for reputation effects. Hence
the need for updating, whereas the gain from defection is immediate and does not need to
be updated. When the interest rate increases, alliance-creation should fall.
-60
-40
-20
0
20
40
60
80
year
19 8119 85
198719 89
19921995
19 972000
ye a r
relat ive e va lu at io n of
s toc ks
Graph 6. Relative stock values.Source: The Federal Reserve Model (values greater than 0 imply overestimates, below 0 underestimates).
Graph 7. Movements in US short-term interest rates, 1983-2002.Source: Federal Reserve Model.
-10123456
Year
198519 88
1991
19 9519 98
2001
s hort terminterest rate
THE EVOLUTION OF STRATEGIC ALLIANCES
195 Vol. 35, núm. 137, abril-junio 2004
U.S. interest rates are an inverse function of inter-firm cooperation and, in particular,
of the number of alliances.
• 1985-1993: interest rates fall, alliances increase.
• 1994-2000: interest rates increase, alliances decline.
• Since 2001, the evolution has not been clear.
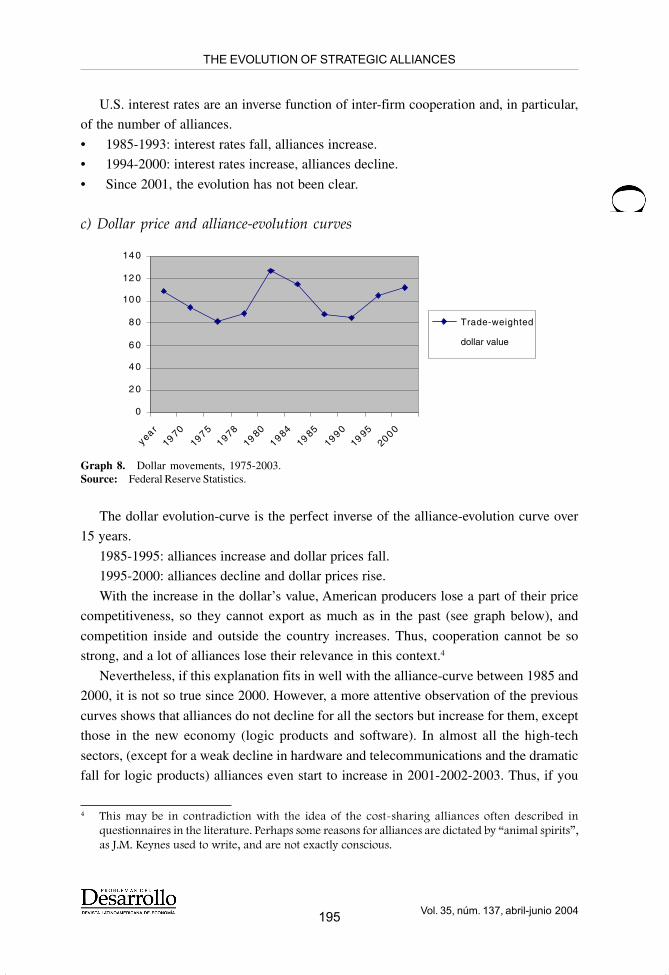
c) Dollar price and alliance-evolution curves
Graph 8. Dollar movements, 1975-2003.Source: Federal Reserve Statistics.
0
2 0
4 0
6 0
8 0
10 0
12 0
14 0
yea r
19 701975
197819 80
198419 85
199019 95
2000
D olla r value
p onde ra te d by
c om m erce
The dollar evolution-curve is the perfect inverse of the alliance-evolution curve over
15 years.
1985-1995: alliances increase and dollar prices fall.
1995-2000: alliances decline and dollar prices rise.
With the increase in the dollar’s value, American producers lose a part of their price
competitiveness, so they cannot export as much as in the past (see graph below), and
competition inside and outside the country increases. Thus, cooperation cannot be so
strong, and a lot of alliances lose their relevance in this context.4
Nevertheless, if this explanation fits in well with the alliance-curve between 1985 and
2000, it is not so true since 2000. However, a more attentive observation of the previous
curves shows that alliances do not decline for all the sectors but increase for them, except
those in the new economy (logic products and software). In almost all the high-tech
sectors, (except for a weak decline in hardware and telecommunications and the dramatic
fall for logic products) alliances even start to increase in 2001-2002-2003. Thus, if you
4 This may be in contradiction with the idea of the cost-sharing alliances often described inquestionnaires in the literature. Perhaps some reasons for alliances are dictated by “animal spirits”,as J.M. Keynes used to write, and are not exactly conscious.
Trade-weighted
dollar value

JULIA TADDEI STRADI
196 Vol. 35, núm. 137, abril-junio 2004
exclude all the sectors involved in the new economy, you will obtain the same relationship
between the dollar and alliances after 2000 as before.
It is obvious that the declines for new economy items in 2000 have offset the effect of
the dollar decline for the sectors concerned.
Alliances may be partly determined by their financial environment. Certain types of
environment (higher interest rates, declining share prices, high exchange rate) favour
more opportunistic behaviour (lies and alliances decline, competition increases), thus
handicapping the creation of alliances. It is strange to see how alliance curves are close to
the macroeconomic financial curves.
Conclusion
Alliances may be seen as transitory adaptive mutations, transitory because their creation
decreases after 1995, adaptive because they answered a need for a specific knowledge-
transfer that is not so important, nor so specific, at the moment —but also because their
evolution seems to be related to the evolution of their financial environment— mutations
because they did not really exist before 1962, and so they appear as an organisational
innovation following an S-curve.
It has been suggested that these ideas are not in conflict as they do not exclude each
other, but may instead be complementary. Environmental financial causes may explain the
violent and sudden aspect of the change in 1995, or in 2000, while endogenous causes
may explain the evolution of alliance-relevance. But depending on the assumptions made,
forecasts of alliance-relevance change: If it is environmental it may be a stop-go movement;
if it is endogenous, it is more periodic (if alliances follow paradigmatic waves) or historical
(if they are considered as an organisational innovation that will be replaced by something
else). May be, if we put these explanations together, alliances would follow a declining
trend linked to the emergence of new organisational innovations with periodic increases
and decreases following paradigmatic waves, and some volatility within this trend linked
to environmental factors.
Bibliography
Abernathy, W.J. and Utterback, J. M., “Patterns ofIndustrial Innovation”, in Michael L. Tushmanet William L. Moore, editors, Readings in theManagement of Innovation, New York,HarperBusiness, 1988, p. 25-36.
Aoki, M., “L’Economie Japonaise, Information,Motivations et Marchandage”, translated by H.Bernard, Economica, 1991.
Arena, R., Charbit, C., “Frontières de la firme,frontière des firmes: un point de vuenéomarshallien”, in P. Garrouste (sld), LesFrontières de la Firme, Economica, 2002.
Armoor, H., Teece, D., “Organisational StructureAnd Economic Performance: A Test OfMultidivisional Hypothesis”, Bell Journal ofEconomics, 1978.

THE EVOLUTION OF STRATEGIC ALLIANCES
197 Vol. 35, núm. 137, abril-junio 2004
Arthur, B.W., “Competing Technologies, IncreasingReturns and Lock-in by Historical Events”,Economic Journal, vol. 99, 1989, 116-131.
Bazzoli, L., Kirat, T., “La relation entre le droit etl’économie dans les traditions institutionnalisteet post-coasienne: enjeux pour l’analyse del’évolution”, Economies et Sociétés, Hors série,no. 34, no. 1, 1999, pp.67-88.
Brousseau, E., “La Coopération Industrielle”, inBellon, Voisin, Plunket, Economica, Paris, 2000.
Brousseau, É., “Néo-institutionnalisme et Évolu-tionnisme: Quelles Convergences”, Versionremaniée 9/11/97 Université de Nancy II & ATOM
(Université de Paris 1) Economies et Sociétés,HS 35, no. 1, 01/1999.
Chandler, A.D, Strategy And Structure, Chapters InThe History of American Industrial Enterprise,Cambridge, MIT Press, 1962.
———, The Visible Hand: The ManagerialRevolution in American Business, Cambridge,Harvard University Press, 1977.
Coase, R. H., “The Marginal Cost Controversy”,Economica, n.s, no. 13, 1946a.
———, “The Problem of Social Costs”, Journal ofLaw and Economics, 1960b.
Cohen, W. M., Levinthal, D. A., “New perspectiveon learning and innovation”, AdministrativeScience Quarterly, 1990, 35:128-152.
Colin, P., “Regard Sur L'institutionnalismeAméricain”, Cahier Des Sciences Humaines,1990
Commons, J.R., “Institutional Economics”,American Economic Review, vol. 21, 1931a, pp.648-657.
———, Institutional Economics: Its place in politicaleconomy, 1934b.
Coriat B., Weinstein, O., Les Nouvelles ThéoriesDe L’entreprise, Le Livre de Poche, Paris, 1995.
Defeuilley, M., Vahabi, “Transaction Cost TheoryAnd Evolutionary Economics, The QuestionableSynthesis”, Colloquium, Sorbonne, Paris,September 19-20, 1996.
Dockes, P., “Le recours à l’histoire et l’évolutionnisme”,presentation at the Colloquium, Evolutionnismeet Institutionnalisme, at the University of Lyon,December, 2002.
Dosi, G., “The Nature of the Innovative Process" inDosi, G. et al., Technological Change andEconomic Theory, London, Pinter Publishers,1988, pp. 221-238.
Gibbons, R., “Incentives In Organization”, JournalOf Economic Perspectives, vol. 12, number 4,Fall 1998, pp. 115-132.
Hagedoorn J., Available on the National ScienceFoundation website.
Hagedoorn, J., “Understanding the rationale ofstrategic technology partnering: inter-
organizational modes of cooperation and sectoraldifferences”, Strategic Management Journal,1993, 14:371-385.
Hagedoorn, J.; E. Carayannis and J. Alexander,“Strange bedfellows in the personal computerindustry: technology alliances between IBM andApple”, Research Policy, 2001, 30:837-849.
———, “Inter-firm R&D partnerships: an overviewof major trends and patterns since 1960”,Research Policy, 2002, 31:477-492.
——— and R.N. Osborn, “The Institutionalisation andEvolutionary Dynamics Of Inter-organizationalAlliances And Networks”, Academy Of Manag-ement Journal, vol. 40, no. 2, 1997, pp. 261-276.
Hodgson, G. 2002), http://www.sussex.ac.uk/spru/publications/imprint/sewps/sewp83/sewp83.pdf
Langlois, R.N., “Internal Organization in a DynamicContext: Some Theoretical Considerations”, inM. Jussawalah and H. Hebenfield, eds,Communication and information economics: newperspectives, Amsterdam, North Holland, 1984.
———, “Production Costs, Transaction Costs AndThe Passage Of Time”, in Steven G. Medema,ed., Coasean Economics: Law and Economicsand the New Institutional Economics, Dordrecht,Kluwer Academic Publishers, 1997, p. 1-21.
Llerena, P., “Emissive Capability”, paper presentedat ETIC (Economy of Technological andInstitutional Change), October 2003, inMaastricht, Netherlands.
Menard, C., L’économie Des Organisations, repères,La découverte, 1990a.
———, “La Nature De L’innovation Organisa-tionnelle, Elements De Reflexion”, RevueD’Economie Industrielle, summer, 1994, SpecialIssue, “Economie Industrielle, DéveloppementsRécents”.
Nelson R. and S. Winter, “An Evolutionary Theoryof Economic Change”, Cambridge, HarvardUniversity Press, 1982.
North, D., “Institutions, Institutional Change, andEconomic Performance”, New York, CambridgeUniversity Press, 1990.
Pavitt, K., “Knowledge About Knowledge”,Electronic Working Paper Series, June 2002,Paper no. 83, 2002.
Penrose, E., The Theory Of The Growth Of TheFirm, Oxford, Basil Blackwell, 1959.
Schumpeter, J.A., The Theory of EconomicDevelopment, New York, Oxford UniversityPress, [1926] 1961.
Silver, M., “Enterprise and the Scope of the Firm”,London, Martin Robertson, 1984.
Simon, H.A., “Theories of Bounded Rationality”, inC.B. MacGuire and R. Radner, eds., Decisionand Organisation, New York, 1972.
JULIA TADDEI STRADI
198 Vol. 35, núm. 137, abril-junio 2004
Taddei Stradi, J., “Evolutionnisme et néo-institutionnalisme vers une plus grandecompréhension de la dynamique institutionnelleet technologique”, Journées de la Maison desSciences Economiques, University of Paris 1panthéon Sorbonne, Avril 2003.
Teece, D. J., “Profiting from technologicalinnovation: Implication for integration,collaboration, licensing, and public policy”,Research Policy, 1986, 15 (6), 285-305.
Williamson, O. E., The Economic Institutions ofCapitalism, New York, The Free Press, 1985.
Williamson, O. E., “Transaction Cost Economicsand Organization Theory”, in N.J. Smelser andR. Swedberg (eds.), The Handbook of EconomicSociology, Princeton, N.J., Russell SageFoundation, 1994, pp. 59-77.
Williamson, O.E., “Economic Institutions andDevelopment: A View from the Bottom”, inOlson, M. and Kähkönen, S. (eds.), A Not-so-dismal Science, Oxford, Oxford UniversityPress, 2000, pp. 92-118.