· expenses excluding losses operating expenses employee related 3 1,031,266 1,034,354 994,381 ......
TRANSCRIPT


PAR
ENT
CO
NSO
LID
ATI
ON
Act
ual
Bud
get
Act
ual
Not
esA
ctua
lB
udge
tA
ctua
l20
1020
1020
0920
1020
1020
09$0
00$0
00$0
00$0
00$0
00$0
00
Expe
nses
exc
ludi
ng lo
sses
Ope
ratin
g E
xpen
ses
Em
ploy
ee R
elat
ed3
1,03
1,26
61,
034,
354
994,
381
1,03
1,26
61,
034,
354
994,
381
Per
sonn
el S
ervi
ces
4-
-
-
72
,876
68,5
3168
,681
Vis
iting
Med
ical
Offi
cers
72,8
7668
,531
68,6
8153
0,65
452
5,57
843
9,82
2 O
ther
Ope
ratin
g E
xpen
ses
553
0,65
452
5,57
843
9,82
261
,098
61,3
9256
,378
Dep
reci
atio
n an
d A
mor
tisat
ion
2(i),
661
,098
61,3
9256
,378
9,23
59,
252
9,88
2G
rant
s an
d S
ubsi
dies
79,
235
9,25
29,
882
19,1
9119
,195
12,0
35Fi
nanc
e C
osts
819
,191
19,1
9512
,035
96,1
0396
,115
135,
241
Pay
men
ts to
Affi
liate
d H
ealth
Org
anis
atio
ns9
96,1
0396
,115
135,
241
1,82
0,42
31,
814,
417
1,71
6,42
0To
tal E
xpen
ses
excl
udin
g lo
sses
1,82
0,42
31,
814,
417
1,71
6,42
0
Rev
enue
332,
977
315,
168
261,
839
Sal
e of
Goo
ds a
nd S
ervi
ces
1033
2,97
731
5,16
826
1,83
912
,695
12,7
826,
486
Inve
stm
ent R
even
ue11
12,6
9512
,782
6,48
653
,464
50,1
0952
,089
Gra
nts
and
Con
tribu
tions
1233
,615
29,3
4432
,422
6,61
27,
655
5,66
1O
ther
Rev
enue
136,
612
7,65
55,
661
405,
748
385,
714
326,
075
Tota
l R
even
ue38
5,89
936
4,94
930
6,40
8
(1,5
72)
(869
)(2
80)
Gai
n/(L
oss)
on
Dis
posa
l14
(1,5
72)
(869
)(2
80)
(2,6
40)
(1,6
82)
47O
ther
Gai
ns/(L
osse
s)15
(2,6
40)
(1,6
82)
47
1,41
8,88
71,
431,
254
1,39
0,57
8N
et C
ost o
f Ser
vice
s32
1,43
8,73
61,
452,
019
1,41
0,24
5
Gov
ernm
ent C
ontr
ibut
ions
NS
W D
epar
tmen
t of H
ealth
1,
362,
755
1,36
2,75
51,
291,
014
Rec
urre
nt A
lloca
tions
2(d)
1,36
2,75
51,
362,
755
1,29
1,01
4N
SW
Dep
artm
ent o
f Hea
lth
38,7
1539
,382
47,6
06 C
apita
l Allo
catio
ns2(
d)38
,715
39,3
8247
,606
(Ass
et S
ale
Pro
ceed
s Tr
ansf
erre
d to
the
NS
W D
epar
tmen
t of H
ealth
) A
ccep
tanc
e by
the
Cro
wn
Ent
ity o
f-
-
-
Em
ploy
ee B
enef
its2(
a)(ii
)19
,849
20,7
6519
,667
1,40
1,47
01,
402,
137
1,33
8,62
0To
tal G
over
nmen
t Con
trib
utio
ns1,
421,
319
1,42
2,90
21,
358,
287
(17,
417)
(29,
117)
(51,
958)
RES
ULT
FO
R T
HE
YEA
R
(17,
417)
(29,
117)
(51,
958)
Oth
er C
ompr
ehen
sive
Inco
me
83,8
45-
0
Pro
perty
Pla
nt &
Equ
ipm
ent V
alua
tion
Gai
ns/(L
osse
s)83
,845
-
083
,845
-
0O
ther
Com
preh
ensi
ve In
com
e83
,845
-
0 fo
r the
yea
rTO
TAL
CO
MPR
EHEN
SIVE
INC
OM
E66
,428
(29,
117)
(51,
958)
FO
R T
HE
YEA
R66
,428
(29,
117)
(51,
958)
The
acco
mpa
nyin
g no
tes
form
par
t of t
hese
fina
ncia
l sta
tem
ents
.
Hun
ter N
ew E
ngla
nd A
rea
Hea
lth S
ervi
ce S
tate
men
t of C
ompr
ehen
sive
Inco
me
for t
he y
ear e
nded
30
June
201
0

Hunter New England Area Health ServiceStatement of Financial Position as at 30 June 2010
PARENT CONSOLIDATION
Actual Budget Actual Notes Actual Budget Actual2010 2010 2009 2010 2010 2009$000 $000 $000 $000 $000 $000
ASSETS
Current Assets117,861 111,453 108,153 Cash and Cash Equivalents 18 117,861 111,453 108,153
44,000 40,406 43,677 Receivables 19 44,000 40,406 43,6776,639 6,014 7,203 Inventories 20 6,639 6,014 7,2032,139 4,431 2,070 Other Financial Assets 21 2,139 4,431 2,0702,234 2,527 2,527 Non-Current Assets Held for Sale 23 2,234 2,527 2,527
172,873 164,831 163,630 Total Current Assets 172,873 164,831 163,630
Non-Current Assets259 217 217 Receivables 19 259 217 217
11,245 13,384 13,384 Other Financial Assets 21 11,245 13,384 13,384Property, Plant and Equipment
1,024,133 950,093 958,504 - Land and Buildings 22 1,024,133 950,093 958,50499,437 93,459 84,393 - Plant and Equipment 22 99,437 93,459 84,39376,498 69,021 71,260 - Infrastructure Systems 22 76,498 69,021 71,260
1,200,068 1,112,573 1,114,157 Total Property, Plant and Equipment 1,200,068 1,112,573 1,114,157
1,211,572 1,126,174 1,127,758 Total Non-Current Assets 1,211,572 1,126,174 1,127,758
1,384,445 1,291,005 1,291,388 Total Assets 1,384,445 1,291,005 1,291,388
LIABILITIES
Current Liabilities94,605 109,036 102,173 Payables 25 94,605 109,036 102,17311,828 2,893 3,079 Borrowings 26 11,828 2,893 3,079
342,171 327,288 319,424 Provisions 27 342,171 327,288 319,4242,985 1,713 1,713 Other 28 2,985 1,713 1,713
451,589 440,930 426,389 Total Current Liabilities 451,589 440,930 426,389
Non-Current Liabilities156,847 165,464 156,169 Borrowings 26 156,847 165,464 156,169
7,490 11,607 6,990 Provisions 27 7,490 11,607 6,990375 405 405 Other 28 375 405 405
164,712 177,476 163,564 Total Non-Current Liabilities 164,712 177,476 163,564
616,301 618,406 589,953 Total Liabilities 616,301 618,406 589,953
768,144 672,599 701,435 Net Assets 768,144 672,599 701,435
EQUITY306,469 222,645 222,645 Reserves 306,469 222,645 222,645461,140 449,491 478,327 Accumulated Funds 461,140 449,491 478,327767,609 672,136 700,972 767,609 672,136 700,972
Amounts Recognised in Equity Relating to Assets535 463 463 Held for Sale 23 535 463 463
768,144 672,599 701,435 Total Equity 768,144 672,599 701,435
The accompanying notes form part of these financial statements.

Acc
umul
ated
A
sset
Rev
alua
tion
Ass
ets
Hel
dTo
tal
Fund
sSu
rplu
sfo
r Sal
eN
otes
$000
$000
$000
$000
Bal
ance
at 1
Jul
y 20
0947
8,32
722
2,64
546
370
1,43
5
Res
ult F
or T
he Y
ear
(17,
417)
-
-
(1
7,41
7)O
ther
Com
preh
ensi
ve In
com
e: N
et In
crea
se/(D
ecre
ase)
in P
rope
rty, P
lant
& E
quip
men
t-
-
-
-
Ava
ilabl
e fo
r Sal
e Fi
nanc
ial A
sset
s: -V
alua
tion
Gai
ns/(L
osse
s)-
83
,845
-
83,8
45 -T
rans
fers
on
Dis
posa
l(5
1)(2
1)72
-
Tota
l Oth
er C
ompr
ehen
sive
Inco
me
(51)
83,8
2472
83,8
45
Tota
l Com
preh
ensi
ve In
com
e Fo
r The
Yea
r(1
7,46
8)83
,824
7266
,428
Tran
sact
ions
With
Ow
ners
In T
heir
Cap
acity
As
Ow
ners
Incr
ease
/(Dec
reas
e) in
Net
Ass
ets
From
Equ
ity T
rans
fers
3728
1-
-
281
Bal
ance
at 3
0 Ju
ne 2
010
461,
140
306,
469
535
768,
144
Bal
ance
at 1
Jul
y 20
0851
5,48
622
3,04
842
573
8,95
9
Res
ult F
or T
he Y
ear
(51,
958)
-
-
(5
1,95
8)O
ther
Com
preh
ensi
ve In
com
e: N
et In
crea
se/(D
ecre
ase)
in P
rope
rty, P
lant
& E
quip
men
t-
-
-
-
Ava
ilabl
e fo
r Sal
e Fi
nanc
ial A
sset
s: -V
alua
tion
Gai
ns/(L
osse
s)-
-
-
-
-Tra
nsfe
rs o
n D
ispo
sal
365
(403
)38
-
Tota
l Oth
er C
ompr
ehen
sive
Inco
me
365
(403
)38
0
Tota
l Com
preh
ensi
ve In
com
e Fo
r The
Yea
r(5
1,59
3)(4
03)
38(5
1,95
8)
Tran
sact
ions
With
Ow
ners
In T
heir
Cap
acity
As
Ow
ners
Incr
ease
/(Dec
reas
e) in
Net
Ass
ets
From
Equ
ity T
rans
fers
14,4
34-
-
14,4
34B
alan
ce a
t 30
June
200
947
8,32
722
2,64
546
370
1,43
5
The
acco
mpa
nyin
g no
tes
form
par
t of t
hese
fina
ncia
l sta
tem
ents
.
Hun
ter N
ew E
ngla
nd A
rea
Hea
lth S
ervi
ceSt
atem
ent o
f Cha
nges
in E
quity
for t
he y
ear e
nded
30
June
201
0

Hunter New England Area Health ServiceStatement of Cash Flows for the year ended 30 June 2010
PARENT CONSOLIDATION
Actual Budget Actual Actual Budget Actual2010 2010 2009 Notes 2010 2010 2009$000 $000 $000 $000 $000 $000
CASH FLOWS FROM OPERATING ACTIVITIESPayments Employee Related (982,933) (977,055) (921,066)
(117,214) (117,221) (120,964) Grants and Subsidies (117,214) (117,221) (120,964)(17,931) (17,936) (9,760) Finance Costs (17,931) (17,936) (9,760)
(1,632,061) (1,623,616) (1,461,602) Other (649,128) (646,561) (540,536)
(1,767,206) (1,758,773) (1,592,326) Total Payments (1,767,206) (1,758,773) (1,592,326)
Receipts352,373 331,845 274,028 Sale of Goods and Services 352,373 331,845 274,028
4,634 5,091 5,185 Interest Received 4,634 5,091 5,18583,680 85,289 80,393 Other 83,680 85,289 80,393
440,687 422,225 359,606 Total Receipts 440,687 422,225 359,606
Cash Flows From Government1,362,755 1,362,755 1,291,014 NSW Department of Health Recurrent Allocations 1,362,755 1,362,755 1,291,014
38,715 39,382 47,606 NSW Department of Health Capital Allocations 38,715 39,382 47,606Asset Sale Proceeds Transferred to the
- - - NSW Department of Health - - - - - - Cash Reimbursements from the Crown Entity - - -
1,401,470 1,402,137 1,338,620 Net Cash Flows From Government 1,401,470 1,402,137 1,338,620
NET CASH FLOWS FROM OPERATING 74,951 65,589 105,900 ACTIVITIES 32 74,951 65,589 105,900
CASH FLOWS FROM INVESTING ACTIVITIESProceeds from Sale of Land and Buildings, Plant and Equipment
2,855 1,612 2,308 and Infrastructure Systems 2,855 1,612 2,308- - - Proceeds from Sale of Investments - - -
Purchases of Land and Buildings, Plant and Equipment(67,836) (63,639) (106,298) and Infrastructure Systems (67,836) (63,639) (106,298)
- - - Purchases of Investments - - -
(64,981) (62,027) (103,990) NET CASH FLOWS FROM INVESTING ACTIVITIES (64,981) (62,027) (103,990)
CASH FLOWS FROM FINANCING ACTIVITIES2,502 2,502 34,125 Proceeds from Borrowings and Advances 2,502 2,502 34,125
(2,764) (2,764) (4,230) Repayment of Borrowings and Advances (2,764) (2,764) (4,230)
(262) (262) 29,895 NET CASH FLOWS FROM FINANCING ACTIVITIES (262) (262) 29,895
9,708 3,300 31,805 NET INCREASE / (DECREASE) IN CASH 9,708 3,300 31,805
108,153 108,153 66,156 Opening Cash and Cash Equivalents 108,153 108,153 66,156Cash Transferred In/(Out) as a Result of
- - 10,192 Administrative Restructuring - - 10,192
117,861 111,453 108,153 CLOSING CASH AND CASH EQUIVALENTS 18 117,861 111,453 108,153
The accompanying notes form part of these financial statements.
SER
VIC
E'S
EXPE
NSE
S A
ND
INC
OM
E
2010
2009
2010
2009
2010
2009
2010
2009
2010
2009
2010
2009
2010
2009
2010
2009
2010
2009
2010
2009
2010
2009
2010
2009
$000
$000
$000
$000
$000
$000
$000
$000
$000
$000
$000
$000
$000
$000
$000
$000
$000
$000
$000
$000
$000
$000
$000
$000
Expe
nses
exc
ludi
ng lo
sses
Ope
ratin
g E
xpen
ses
E
mpl
oyee
Rel
ated
99,7
5398
,773
6,
806
6,74
4
93
,260
92,4
00
75
,987
75,2
87
430,
133
399,
149
33,6
3033
,322
12
0,88
311
9,77
1
114,
197
113,
076
18,9
4818
,755
37
,669
37,1
04
-
-
1,03
1,26
699
4,38
1
Vis
iting
Med
ical
Offi
cers
1,34
41,
265
1817
6,
059
5,70
1
8,63
68,
126
42,5
1940
,117
6,20
65,
839
2,57
12,
419
4,
771
4,48
9
419
395
33
331
3
-
-
72,8
7668
,681
O
ther
Ope
ratin
g E
xpen
ses
27,3
4822
,407
2,
053
1,68
2
43
,978
36,7
01
40
,476
34,2
03
303,
462
248,
961
35,1
1330
,636
23
,802
19,7
69
43
,244
35,9
54
5,
131
4,29
1
6,
047
5,21
8
-
-
53
0,65
443
9,82
2D
epre
ciat
ion
and
Am
ortis
atio
n4,
085
3,79
2
24
923
1
6,72
56,
243
6,
365
5,90
8
27
,606
25,2
90
3,
602
3,34
3
5,
519
5,12
3
6,55
06,
080
30
228
0
9588
-
-
61
,098
56,3
78G
rant
s an
d S
ubsi
dies
4,94
45,
326
309
333
32
35
4
5
35
48
22
3,07
13,
306
30
625
4
53
157
2
11
-
-
9,23
59,
882
Fina
nce
Cos
ts1,
667
886
11
863
2,
021
1,07
4
1,72
291
5
8,28
66,
240
91
548
6
1,96
41,
043
2,
127
1,13
1
237
126
13
471
-
-
19
,191
12,0
35P
aym
ents
to A
ffilia
ted
Hea
lth O
rgan
isat
ions
1,92
62,
711
-
-
24,8
9135
,028
7,45
810
,495
48
,070
67,6
46
3,
160
4,44
6
-
-
6,53
79,
201
27
238
2
3,78
95,
332
-
-
96,1
0313
5,24
1O
ther
Exp
ense
s-
-
-
-
-
-
-
-
-
-
-
-
-
-
-
-
-
-
-
-
-
-
-
-
To
tal E
xpen
ses
excl
udin
g lo
sses
141,
067
135,
160
9,55
39,
070
176,
966
177,
182
140,
648
134,
939
860,
111
787,
451
82,6
2878
,074
157,
810
151,
431
177,
732
170,
185
25,8
4024
,801
48,0
6848
,127
-
-
1,82
0,42
31,
716,
420
Rev
enue
Sal
e of
Goo
ds a
nd S
ervi
ces
9,97
38,
728
195
171
21
,328
18,6
93
20
,833
17,3
91
206,
798
152,
020
13,2
3311
,902
6,
781
5,95
0
43,1
9338
,190
2,10
01,
804
8,54
36,
990
-
-
332,
977
261,
839
Inve
stm
ent R
even
ue2,
425
1,20
1
84
84
990
472
399
188
2,
355
911
214
99
181
77
2,
213
1,13
2
2,41
086
6
1,42
41,
456
-
-
12,6
956,
486
Gra
nts
and
Con
tribu
tions
6,38
66,
119
356
364
2,
548
2,43
2
1,02
297
4
4,93
54,
706
54
251
5
436
411
5,94
25,
712
5,
302
4,90
8
6,
146
6,28
1
-
-
33
,615
32,4
22O
ther
Rev
enue
1,30
21,
080
4839
53
044
0
21
417
7
1,03
31,
032
11
495
96
80
1,
190
988
1,27
41,
057
811
673
-
-
6,
612
5,66
1To
tal R
even
ue20
,086
17,1
2868
365
825
,396
22,0
3722
,468
18,7
3021
5,12
115
8,66
914
,103
12,6
117,
494
6,51
852
,538
46,0
2211
,086
8,63
516
,924
15,4
00-
-
38
5,89
930
6,40
8
Gai
n / (
Loss
) on
Dis
posa
l -
(1
9)-
(1)
-
(3
1)-
(30)
(1,5
72)
(125
)-
(17)
-
(2
6)-
(30)
-
(1
)-
-
-
-
(1
,572
)(2
80)
Oth
er G
ains
/ (L
osse
s)-
3
-
-
-
6
-
5
(2
,640
)21
-
3
-
3
-
5
-
1
-
-
-
-
(2
,640
)47
Net
Cos
t of S
ervi
ces
120,
981
118,
048
8,87
08,
413
151,
570
155,
170
118,
180
116,
234
649,
202
628,
886
68,5
2565
,477
150,
316
144,
936
125,
194
124,
188
14,7
5416
,166
31,1
4432
,727
-
-
1,43
8,73
61,
410,
245
Gov
ernm
ent C
ontri
butio
ns
-
-
1,42
1,31
91,
358,
287
RES
ULT
FO
R T
HE
YEA
R
17,4
1751
,958
Oth
er C
ompr
ehen
sive
Inco
me
Incr
ease
/(Dec
reas
e) in
Ass
et R
eval
uatio
n R
eser
ve83
,845
----
-
Oth
erTo
tal O
ther
Com
preh
ensi
ve In
com
e-
-
-
-
-
-
-
-
-
-
-
-
-
-
-
-
-
-
-
-
-
-
(6
6,42
8)51
,958
TOTA
L C
OM
PREH
ENSI
VE IN
CO
ME
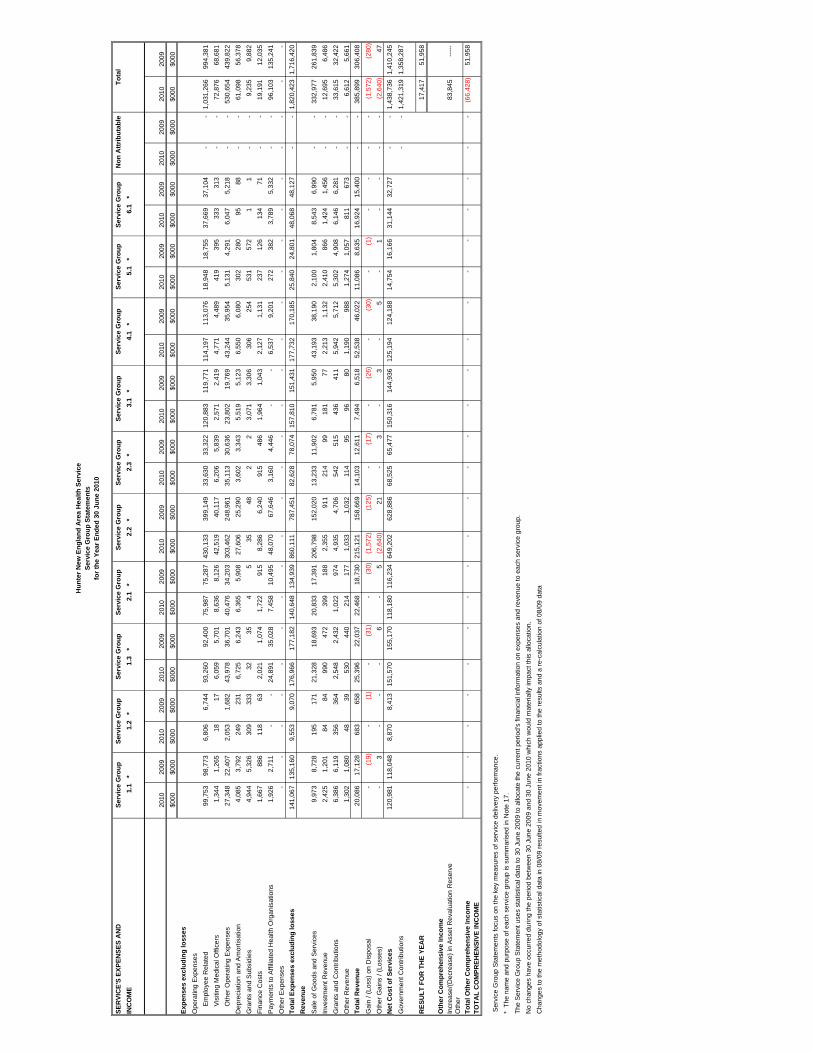
Ser
vice
Gro
up S
tate
men
ts fo
cus
on th
e ke
y m
easu
res
of s
ervi
ce d
eliv
ery
perfo
rman
ce.
* T
he n
ame
and
purp
ose
of e
ach
serv
ice
grou
p is
sum
mar
ised
in N
ote
17.
The
Ser
vice
Gro
up S
tate
men
t use
s st
atis
tical
dat
a to
30
June
200
9 to
allo
cate
the
curr
ent p
erio
d's
finan
cial
info
rmat
ion
on e
xpen
ses
and
reve
nue
to e
ach
serv
ice
grou
p.N
o ch
ange
s ha
ve o
ccur
red
durin
g th
e pe
riod
betw
een
30 J
une
2009
and
30
June
201
0 w
hich
wou
ld m
ater
ially
impa
ct th
is a
lloca
tion.
Cha
nges
to th
e m
etho
dolo
gy o
f sta
tistic
al d
ata
in 0
8/09
resu
lted
in m
ovem
ent i
n fra
ctio
ns a
pplie
d to
the
resu
lts a
nd a
re-c
alcu
latio
n of
08/
09 d
ata
1.1
*
1.3
*2.
3 *
Serv
ice
Gro
upSe
rvic
e G
roup
Serv
ice
Gro
upSe
rvic
e G
roup
Hun
ter N
ew E
ngla
nd A
rea
Hea
lth S
ervi
ceSe
rvic
e G
roup
Sta
tem
ents
for t
he Y
ear E
nded
30
June
201
0
Non
Attr
ibut
able
Serv
ice
Gro
upTo
tal
Serv
ice
Gro
upSe
rvic
e G
roup
Serv
ice
Gro
upSe
rvic
e G
roup
Serv
ice
Gro
up1.
2 *
2.1
*6.
1 *
3.1
*5.
1 *
2.2
*4.
1 *

SER
VIC
E'S
ASS
ETS
AN
DLI
AB
ILIT
IES
2010
2009
2010
2009
2010
2009
2010
2009
2010
2009
2010
2009
2010
2009
2010
2009
2010
2009
2010
2009
2010
2009
2010
2009
$000
$000
$000
$000
$000
$000
$000
$000
$000
$000
$000
$000
$000
$000
$000
$000
$000
$000
$000
$000
$000
$000
$000
$000
ASS
ETS
Cur
rent
Ass
ets
Cas
h an
d C
ash
Equ
ival
ents
9,13
38,
517
618
572
11,4
5711
,164
9,10
68,
503
55,6
8749
,618
5,35
04,
920
10,2
179,
542
11,5
0710
,723
1,67
31,
563
3,11
23,
033
-
-
117,
861
108,
153
Rec
eiva
bles
2,29
02,
442
7894
2,89
63,
141
2,56
22,
670
24,5
2822
,618
1,60
81,
798
854
929
5,99
06,
560
1,26
41,
231
1,93
02,
195
-
-
44,0
0043
,677
Inve
ntor
ies
342
367
2628
550
601
506
560
3,79
74,
077
439
502
298
324
541
589
6470
7685
-
-
6,63
97,
203
Oth
er F
inan
cial
Ass
ets
166
163
1111
208
214
165
163
1,01
195
097
9418
518
320
920
530
3056
58-
-
2,
139
2,07
0N
on-C
urre
nt A
sset
s H
eld
for S
ale
149
170
910
246
280
233
265
1,00
91,
134
132
150
202
230
239
273
1113
34
-
-
2,23
42,
527
Tota
l Cur
rent
Ass
ets
12,0
8111
,658
742
714
15,3
5715
,400
12,5
7212
,160
86,0
3178
,396
7,62
67,
463
11,7
5711
,207
18,4
8718
,350
3,04
32,
906
5,17
75,
375
-
-
172,
873
163,
630
Non
-Cur
rent
Ass
ets
Rec
eiva
bles
1312
00
1716
1513
144
112
99
55
3533
76
1111
-
-
259
217
Oth
er F
inan
cial
Ass
ets
871
1,05
459
711,
093
1,38
286
91,
052
5,31
36,
140
510
609
975
1,18
11,
098
1,32
716
019
329
737
5-
-
11
,245
13,3
84P
rope
rty, P
lant
and
Equ
ipm
ent
- L
and
and
Bui
ldin
gs68
,473
64,4
694,
174
3,92
711
2,72
510
6,14
010
6,69
110
0,44
446
2,73
642
9,96
560
,377
56,8
3692
,510
87,0
9810
9,79
210
3,36
85,
062
4,76
01,
592
1,49
6-
-
1,
024,
133
958,
504
- P
lant
and
Equ
ipm
ent
6,64
85,
676
405
346
10,9
459,
345
10,3
598,
844
44,9
2937
,857
5,86
25,
004
8,98
27,
669
10,6
609,
101
492
419
155
132
-
-
99,4
3784
,393
- In
frast
ruct
ure
Sys
tem
s5,
115
4,79
331
229
28,
420
7,89
17,
969
7,46
834
,564
31,9
664,
510
4,22
56,
910
6,47
58,
201
7,68
537
835
411
911
1-
-
76
,498
71,2
60To
tal N
on-C
urre
nt A
sset
s81
,121
76,0
054,
950
4,63
613
3,20
112
4,77
312
5,90
311
7,82
154
7,68
650
6,04
071
,269
66,6
8310
9,38
210
2,42
812
9,78
612
1,51
46,
099
5,73
32,
174
2,12
5-
-
1,
211,
572
1,12
7,75
8TO
TAL
ASS
ETS
93,2
0287
,663
5,69
35,
350
148,
558
140,
173
138,
475
129,
981
633,
717
584,
436
78,8
9574
,146
121,
139
113,
634
148,
273
139,
865
9,14
18,
639
7,35
27,
500
-
-
1,38
4,44
51,
291,
388
LIA
BIL
ITIE
SC
urre
nt L
iabi
litie
sP
ayab
les
4,87
65,
205
366
391
7,84
08,
526
7,21
67,
946
54,1
0157
,835
6,26
07,
117
4,24
34,
592
7,71
08,
352
915
997
1,07
81,
212
-
-
94,6
0510
2,17
3B
orro
win
gs91
724
262
161,
150
318
914
242
5,58
81,
413
537
140
1,02
527
21,
155
305
168
4431
286
-
-
11,8
283,
079
Pro
visi
ons
33,0
9831
,729
2,25
82,
166
30,9
4329
,682
25,2
1224
,184
142,
717
128,
218
11,1
5810
,704
40,1
0938
,474
37,8
9036
,323
6,28
76,
025
12,4
9811
,919
-
-
342,
171
319,
424
Oth
er
231
135
169
290
177
231
135
1,41
078
613
578
259
151
291
170
4225
7948
-
-
2,98
51,
713
Tota
l Cur
rent
Lia
bilit
ies
39,1
2137
,311
2,70
22,
582
40,2
2438
,702
33,5
7332
,507
203,
817
188,
252
18,0
9118
,039
45,6
3643
,489
47,0
4645
,151
7,41
27,
091
13,9
6813
,265
-
-
451,
589
426,
389
Non
-Cur
rent
Lia
bilit
ies
Bor
row
ings
12,1
5412
,298
823
825
15,2
4716
,121
12,1
1812
,277
74,1
0771
,646
7,11
97,
104
13,5
9713
,778
15,3
1315
,484
2,22
62,
257
4,14
24,
379
-
-
156,
847
156,
169
Pro
visi
ons
724
694
4947
677
650
552
529
3,12
42,
806
244
234
878
842
829
795
138
132
274
261
-
-
7,49
06,
990
Oth
er29
322
236
4229
3217
718
617
1833
3637
405
610
11-
-
37
540
5To
tal N
on-C
urre
nt L
iabi
litie
s12
,908
13,0
2487
487
515
,961
16,8
1212
,699
12,8
3977
,408
74,6
387,
380
7,35
614
,507
14,6
5616
,179
16,3
192,
369
2,39
44,
425
4,65
1-
-
16
4,71
216
3,56
4TO
TAL
LIA
BIL
ITIE
S52
,029
50,3
353,
576
3,45
756
,185
55,5
1446
,272
45,3
4528
1,22
526
2,89
025
,471
25,3
9560
,143
58,1
4563
,225
61,4
709,
781
9,48
518
,393
17,9
16-
-
61
6,30
158
9,95
3N
ET A
SSET
S41
,173
37,3
272,
116
1,89
392
,373
84,6
5992
,204
84,6
3635
2,49
232
1,54
653
,424
48,7
5160
,996
55,4
9085
,048
78,3
94(6
40)
(846
)(1
1,04
1)(1
0,41
6)-
-
76
8,14
470
1,43
5
The
nam
e an
d pu
rpos
e of
eac
h se
rvic
e gr
oup
is s
umm
aris
ed in
Not
e 17Se
rvic
e G
roup
2.3
*3.
1 *
5.1
*Se
rvic
e G
roup
Ass
ets
and
liabi
litie
s th
at a
re s
peci
fic to
ser
vice
gro
ups
are
allo
cate
d ac
cord
ingl
y, e
.g. N
on-C
urre
nt A
sset
s H
eld
for S
ale.
Rem
aini
ng a
sset
s an
d lia
bilit
ies
are
appo
rtion
ed to
ser
vice
gro
ups
in a
ccor
danc
e w
ith th
e m
etho
dolo
gy a
dvis
ed in
Not
e 2(
ae),
ther
eby
ensu
ring
that
the
bene
fit o
f eac
h as
set a
nd th
e lia
bilit
ies
incu
rred
in th
e pr
ovis
ion
of s
ervi
ces
are
duly
reco
gnis
ed in
eac
h se
rvic
e gr
oup.
1.1
*
2.1
*2.
2 *
6.1
*1.
3 *
4.1
*1.
2 *
Serv
ice
Gro
upSe
rvic
e G
roup
Hun
ter N
ew E
ngla
nd A
rea
Hea
lth S
ervi
ce
Serv
ice
Gro
up N
on A
ttrib
utab
le
Serv
ice
Gro
up S
tate
men
ts (C
ontin
ued)
Serv
ice
Gro
upTo
tal
Serv
ice
Gro
upSe
rvic
e G
roup
Serv
ice
Gro
up
for t
he Y
ear E
nded
30
June
201
0
Serv
ice
Gro
up

Hunter New England Area Health ServiceNotes to and forming part of the Financial Statements
for the Year Ended 30 June 2010
1 The Health Service Reporting Entity
2
All amounts are rounded to the nearest one thousand dollars and are expressed in Australian currency.
The Hunter New England Area Health Service was established under the provisions of the Health ServicesAct with effect from 1 January 2005.
The Health Service, as a reporting entity, comprises all the operating activities of the Hospital facilities andthe Community Health Centres under its control. It also encompasses the Special Purposes and TrustFunds which, while containing assets which are restricted for specified uses by the grantor or the donor,are nevertheless controlled by the Health Service. The Health Service is a not-for-profit entity (as profit isnot its principal objective).
As a consequence the values in the annual financial statements presented herein consist of the HealthService (as the parent entity), the financial statements of the special purpose entity division and theconsolidated financial statements of the economic entity. Notes capture both the parent and consolidatedvalues with notes 3, 4, 12, 25, 27 and 32 being especially relevant.
In the process of preparing the consolidated financial statements for the economic entity consisting of thecontrolling and controlled entities, all inter-entity transactions and balances have been eliminated.
The Hunter New England Area Health Service Special Purpose Service Entity was established as aDivision of the Government Service on 17 March 2006 in accordance with the Public Sector Employmentand Management Act 2002 and the Health Services Act 1997. These Divisions provide personnel servicesto enable a Health Service to exercise its functions.
Summary of Significant Accounting Policies
The reporting entity is consolidated as part of the financial statements prepared for both the NSWDepartment of Health and the NSW Total State Sector Accounts.
The accounts are presented in $000 and as such rounding errors may occur.
These consolidated financial statements for the year ended 30 June 2010 have been authorised for issueby the Chief Executive on 20th September 2010.
Judgments, key assumptions and estimations made by management are disclosed in the relevant notes tothe financial statements.
Except when an Australian Accounting Standard permits or requires otherwise, comparative information isdisclosed in respect of the previous period for all amounts reported in the financial statements.
The Health Service's financial statements are general purpose financial statements which have been prepared in accordance with applicable Australian Accounting Standards (which include AustralianAccounting Interpretations), the requirements of the Health Services Act 1997 and its regulations includingobservation of the Accounts and Audit Determination for Area Health Services and Public Hospitals.
Property, plant and equipment, investment property, assets (or disposal groups) held for sale and financialassets at "fair value through profit and loss" and available for sale are measured at fair value. Otherfinancial statement items are prepared in accordance with the historical cost convention.
The consolidated entity has a deficiency of working capital of $278.7M (2009 $262.8M). Notwithstandingthis deficiency the financial statements have been prepared on a going concern basis because the entityhas the support of the New South Wales Department of Health.

Hunter New England Area Health ServiceNotes to and forming part of the Financial Statements
for the Year Ended 30 June 2010
AASB 2009-8, Amendments to Australian Accounting Standards – Group Cash-settled Share-basedPayment Transactions, has application from 1 July 2010 and makes amendments which clarify the scopeof AASB 2 by requiring an entity that receives goods or services in a share-based payment arrangement toaccount for those goods or services no matter which entity in the group settles the transaction, and nomatter whether the transaction is settled in shares or cash. This standard has been assessed as having noimpact on the Health Service.
AASB 2009-9, Amendments to Australian Accounting Standards- Additional Exemptions for First-timeAdopters, has application from 1 July 2010 and makes amendments to ensure that entities applyingAustralian Accounting Standards for the first time will not face undue cost or effort in the transition processin particular situations. This standard has been assessed as having no impact on the Health Service.
AASB 2009-10, Amendments to Australian Accounting Standards- Classification of Rights Issues, hasapplication from 1 July 2010 and provides clarification concerning equity instruments. This standard hasbeen assessed as having no material impact on the Health Service.
AASB 124, Related Party Disclosures and AASB 2009-12, Amendments to Australian AccountingStandards, have application from 1 July 2011 and simplify the definition of a related party. They have beenassessed as having no impact on the Health Service.
AASB 2009-5, Further Amendments to Australian Accounting Standards arising from the AnnualImprovements Project, has application from 1 July 2010 and comprises accounting changes forpresentation, recognition or measurement purposes. This standard has been assessed as having nomaterial impact on the Health Service.
No new or revised accounting standards or interpretations are adopted earlier than their prescribed date ofapplication. Set out below are changes to be effected, their date of application and the possible impact onthe financial statements of the Hunter New England Area Health Service.
Accounting Standard/Interpretation
AASB 9, Financial Instruments and AASB 2009-11, Amendments to Australian Accounting Standardsarising from AASB 9, have application from 1 July 2013 and focus on simplifying the classifications offinancial assets into those carried at amortised cost and those carried at fair value. They also simplify therequirements for embedded derivatives and remove the tainting rules associated with held-to-maturityassets. They have been assessed as having no material impact on the Health Service.
AASB 1053, Application of tiers of Australian Accounting Standards, has application from 1 July 2013 andestablishes a differential reporting framework consisting of two tiers of reporting requirements. Tier 1entities will continue to apply existing Australian Accounting Standards. Tier 2 entities will apply the samerecognition, measurement and presentation requirements but reduced disclosure requirements. Tier 2entities include the majority of public sector entities. This standard has been assessed as having nomaterial impact on the Health Service.

Hunter New England Area Health ServiceNotes to and forming part of the Financial Statements
for the Year Ended 30 June 2010
a) Employee Benefits and Other Provisions
i) Salaries & Wages, Annual Leave, Sick Leave and On-Costs
AASB 2010-2, Amendments to Australian Accounting Standards arising from Reduced DisclosureRequirements, has application from 1 July 2013 and determines disclosures in Australian AccountingStandards from which Tier 2 entities are exempt. This standard has been assessed as having no materialimpact on the Health Service.
Unused non-vesting sick leave does not give rise to a liability as it is not considered probablethat sick leave taken in the future will be greater than the benefits accrued in the future.
AASB 2010-1, Amendments to Australian Accounting Standards- Limited Exemption from ComparativeAASB 7 Disclosures for First-time Adopters, has application from 1 July 2010 and provides additionalexemption on IFRS transition in relation to AASB 7 Financial Instruments: Disclosures, to avoid thepotential use of hindsight and to ensure that first-time adopters are not disadvantaged as compared withcurrent IFRS-compliant preparers. This standard has been assessed as having no impact on the HealthService.
The outstanding amounts of workers' compensation insurance premiums and fringe benefitstax, which are consequential to employment, are recognised as liabilities and expenseswhere the employee benefits to which they relate have been recognised.
At the consolidated level of reporting, liabilities for salaries and wages (including non-monetary benefits), annual leave and paid sick leave that are due to be settled within 12months after the end of the period in which the employees render the service are recognisedand measured in respect of employees' services up to the reporting date at undiscountedamounts based on the amounts expected to be paid when the liabilities are settled.
All Annual Leave employee benefits are reported as "Current" as there is an unconditionalright to payment. Current liabilities are then further classified as "Short Term" or "Long Term"based on past trends and known resignations and retirements. Anticipated payments to bemade in the next twelve months are reported as "Short Term". On-costs of 17% are appliedto the value of leave payable at 30 June 2010, such on-costs being consistent with actuarialassessment (Comparable on-costs for 30 June 2009 were also 17%).
Interpretation 19, Extinguishing Financial Liabilities with Equity Instruments and AASB 2009-13,Amendments to Australian Accounting Standards arising from Interpretation 19, have application from 1July 2010 and addresses the accounting by an entity when the terms of a financial liability are renegotiatedand result in the entity issuing equity instruments to a creditor to extinguish all or part of the financialliability. They have been assessed as having no impact on the Health Service.
AASB 2010-3 and AASB 2010-4, Amendments to Australian Accounting Standards arising from the AnnualImprovements Project, have application from 1 January 2011 and amend a number of different AustralianAccounting Standards. These standards have been assessed as having no material impact on the HealthService.
AASB 2009-14, Amendments to Australian Interpretation- Prepayments of a Minimum FundingRequirement, has application from 1 July 2011 and makes limited-application amendments toInterpretation 14 AASB 119 - The Limit on a Defined Benefit Asset, Minimum Funding Requirements andtheir Interaction. This standard has been assessed as having no impact on the Health Service.
Other significant accounting policies used in the preparation of these financial statements are as follows:

Hunter New England Area Health ServiceNotes to and forming part of the Financial Statements
for the Year Ended 30 June 2010
ii) Long Service Leave and Superannuation
iii)
b) Insurance
c) Finance Costs
d) Income Recognition
Sale of Goods
Other Provisions
Long service leave provisions are measured on a short hand basis at an escalated rate of18.3% (9.8% at 30 June 2009) for all employees with five or more years of service. Theescalation applied is consistent with actuarial assessment and is affected in the main by thefall in the Commonwealth Government 10 year bond yield which is used as the discount rate.
Revenue from the sale of goods is recognised as revenue when the agency transfers the significantrisks and rewards of ownership of the assets.
Income is measured at the fair value of the consideration or contribution received or receivable.Additional comments regarding the accounting policies for the recognition of revenue are discussedbelow.
The Health Service's insurance activities are conducted through the NSW Treasury Managed Fund Scheme of self insurance for Government Agencies. The expense (premium) is determined by the Fund Manager based on past claim experience.
The superannuation expense for the financial year is determined by using the formulaespecified by the NSW Department of Health. The expense for certain superannuationschemes (ie Basic Benefit and First State Super) is calculated as a percentage of theemployees' salary. For other superannuation schemes (ie State Superannuation Schemeand State Authorities Superannuation Scheme), the expense is calculated as a multiple ofthe employees' superannuation contributions.
Finance costs are recognised as expenses in the period in which they are incurred, in accordance with the Department's mandate to not-for-profit general government sector agencies.
The Health Service's liability for the closed superannuation pool schemes (State AuthoritiesSuperannuation Scheme and State Superannuation Scheme) is assumed by the CrownEntity. The Health Service accounts for the liability as having been extinguished resulting inthe amount assumed being shown as part of the non-monetary revenue item described as"Acceptance by the Crown Entity of Employee Benefits". Any liability attached toSuperannuation Guarantee Charge cover is reported in Note 25, "Payables".
At the consolidated level of reporting, long service leave entitlements are dissected as"Current" if there is an unconditional right to payment and "Non-Current" if the entitlementsare conditional. Current entitlements are further dissected between "Short Term" and "LongTerm" on the basis of anticipated payments for the next twelve months. This in turn is basedon past trends and known resignations and retirements.
Other provisions exist when: the Health Service has a present legal or constructive obligation as a result of a past event; it is probable that an outflow of resources will be required to settle the obligation; and a reliable estimate can be made of the amount of the obligation.

Hunter New England Area Health ServiceNotes to and forming part of the Financial Statements
for the Year Ended 30 June 2010
Rendering of Services
Patient Fees
Investment Revenue
Debt Forgiveness
Use of Hospital Facilities
**
Grants and Contributions
Grants and Contributions are generally recognised as revenues when the Health Service obtainscontrol over the assets comprising the contributions. Control over contributions is normally obtainedupon the receipt of cash.
Use of Outside Facilities
The Health Service uses a number of facilities owned and maintained by the local authorities in thearea to deliver community health services for which no charges are raised by the authorities. Thecost method of accounting is used for the initial recording of all such services. Cost is determinedas the fair value of the services given and is then recognised as revenue with a matchingexpense
Revenue is recognised when the service is provided or by reference to the stage of completion (based on labour hours incurred to date).
Debts are accounted for as extinguished when and only when settlement occurs through repaymentor replacement by another liability.
Specialist doctors with rights of private practice are subject to an infrastructure charge for the use ofhospital facilities at rates determined by the NSW Department of Health. Charges consist of twocomponents:
Royalty revenue is recognised in accordance with AASB118 on an accrual basis in accordance withthe substance of the relevant agreement.
Patient Fees are derived from chargeable inpatients and non-inpatients on the basis of ratesspecified by the NSW Department of Health from time to time.
a monthly charge raised by the Health Service based on a percentage of receipts generatedthe residue of the Private Practice Trust Fund at the end of each financial year, such sumbeing credited for Health Service use in the advancement of the Health Service or individualswithin it.
Interest revenue is recognised using the effective interest method as set out in AASB139, FinancialInstruments: Recognition and M easurement. Rental revenue is recognised in accordance withAASB117 Leases on a straight line basis over the lease term. Dividend revenue is recognised inaccordance with AASB118 Revenue when the Health Service's right to receive payment isestablished.
Hunter New England Area Health ServiceNotes to and forming part of the Financial Statements
for the Year Ended 30 June 2010
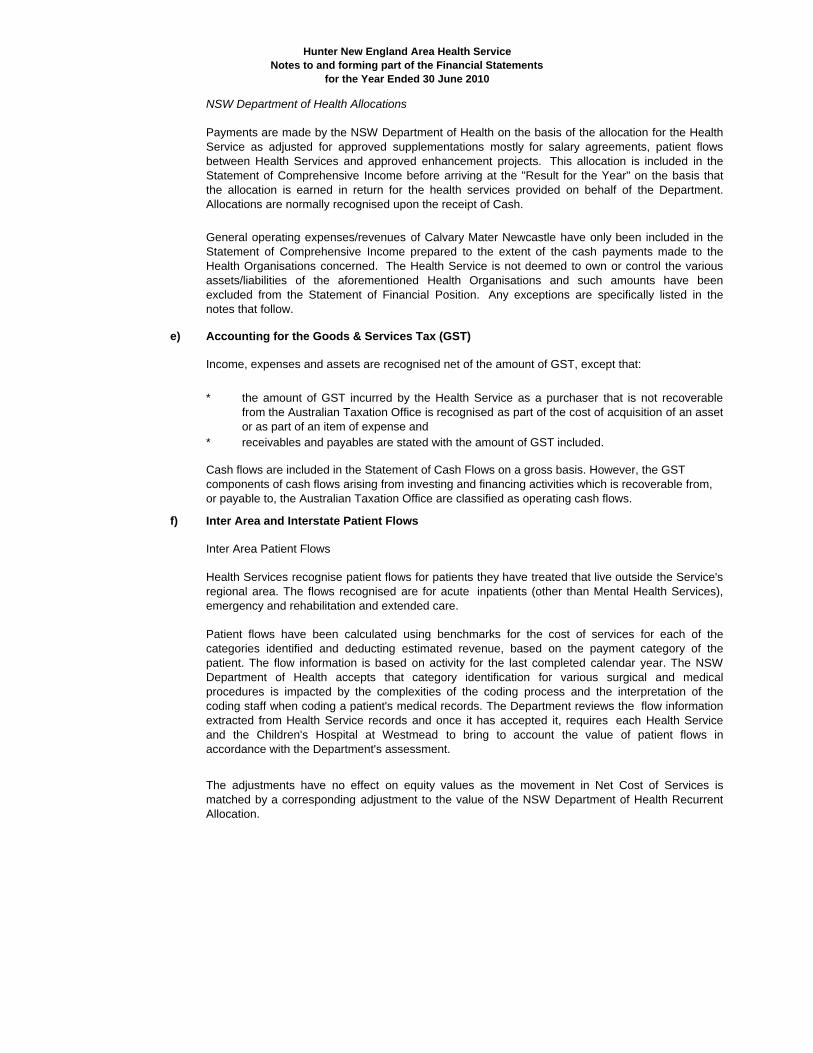
e) Accounting for the Goods & Services Tax (GST)
*
*
f) Inter Area and Interstate Patient Flows
Inter Area Patient Flows
Cash flows are included in the Statement of Cash Flows on a gross basis. However, the GST components of cash flows arising from investing and financing activities which is recoverable from, or payable to, the Australian Taxation Office are classified as operating cash flows.
NSW Department of Health Allocations
Health Services recognise patient flows for patients they have treated that live outside the Service'sregional area. The flows recognised are for acute inpatients (other than Mental Health Services),emergency and rehabilitation and extended care.
Patient flows have been calculated using benchmarks for the cost of services for each of thecategories identified and deducting estimated revenue, based on the payment category of thepatient. The flow information is based on activity for the last completed calendar year. The NSWDepartment of Health accepts that category identification for various surgical and medicalprocedures is impacted by the complexities of the coding process and the interpretation of thecoding staff when coding a patient's medical records. The Department reviews the flow informationextracted from Health Service records and once it has accepted it, requires each Health Serviceand the Children's Hospital at Westmead to bring to account the value of patient flows inaccordance with the Department's assessment.
General operating expenses/revenues of Calvary Mater Newcastle have only been included in theStatement of Comprehensive Income prepared to the extent of the cash payments made to theHealth Organisations concerned. The Health Service is not deemed to own or control the variousassets/liabilities of the aforementioned Health Organisations and such amounts have beenexcluded from the Statement of Financial Position. Any exceptions are specifically listed in thenotes that follow.
Income, expenses and assets are recognised net of the amount of GST, except that:
Payments are made by the NSW Department of Health on the basis of the allocation for the HealthService as adjusted for approved supplementations mostly for salary agreements, patient flowsbetween Health Services and approved enhancement projects. This allocation is included in theStatement of Comprehensive Income before arriving at the "Result for the Year" on the basis thatthe allocation is earned in return for the health services provided on behalf of the Department.Allocations are normally recognised upon the receipt of Cash.
receivables and payables are stated with the amount of GST included.
the amount of GST incurred by the Health Service as a purchaser that is not recoverablefrom the Australian Taxation Office is recognised as part of the cost of acquisition of an assetor as part of an item of expense and
The adjustments have no effect on equity values as the movement in Net Cost of Services ismatched by a corresponding adjustment to the value of the NSW Department of Health RecurrentAllocation.

Hunter New England Area Health ServiceNotes to and forming part of the Financial Statements
for the Year Ended 30 June 2010
g) Acquisition of Assets
h) Capitalisation Thresholds
Fair value is the amount for which an asset could be exchanged between knowledgeable, willingparties in an arm's length transaction.
Land and Buildings which are owned by the Health Administration Corporation or the State andadministered by the Health Service are deemed to be controlled by the Health Service and arereflected as such in the financial statements.
The reporting adopted for both inter area and interstate patient flows aims to provide a greateraccuracy of the cost of service provision to the Area's resident population and disclose the extent towhich service is provided to non-residents.
Health Services recognise the outflow of acute inpatients that are treated by other States andTerritories within Australia who normally reside in the Service's residential area. The HealthServices also recognise the value of inflows for acute inpatient treatment provided to residents fromother States and territories. The expense and revenue values reported within the financialstatements have been based on 2008/09 activity data using standard cost weighted separationvalues to reflect estimated costs in 2009/10 for acute weighted inpatient separations. Wheretreatment is obtained outside the home health service, the State/Territory providing the service isreimbursed by the benefiting Area.
The composition of patient flow expense/revenue is disclosed in Notes 5 and 10.
The cost method of accounting is used for the initial recording of all acquisitions of assets controlledby the Health Service. Cost is the amount of cash or cash equivalents paid or the fair value of theother consideration given to acquire the asset at the time of its acquisition or construction or, whereapplicable, the amount attributed to that asset when initially recognised in accordance with thespecific requirements of other Australian Accounting Standards.
Assets acquired at no cost, or for nominal consideration, are initially recognised as assets andrevenues at their fair value at the date of acquisition (See also assets transferred as a result of anequity transfer Note 2(z)).
Where payment for an asset is deferred beyond normal credit terms, its cost is the cash priceequivalent, ie the deferred payment amount is effectively discounted at an asset-specific rate.
Individual items of property, plant & equipment are capitalised where their cost is $10,000 or above.
Inter State Patient Flows

Hunter New England Area Health ServiceNotes to and forming part of the Financial Statements
for the Year Ended 30 June 2010
i) Depreciation of Property, Plant and Equipment
Details of depreciation rates initially applied for major asset categories are as follows:
Buildings 2.5%Electro Medical Equipment - Costing less than $200,000 10.0% - Costing more than or equal to $200,000 12.5%Computer Equipment 20.0%Infrastructure Systems 2.5%Motor Vehicle Sedans 12.5%Motor Vehicles, Trucks & Vans 20.0%Office Equipment 10.0%Plant and Machinery 10.0%Linen 25.0%Furniture, Fittings and Furnishings 5.0%
j) Revaluation of Non-Current Assets
Non-specialised assets with short useful lives are measured at depreciated historical cost, as asurrogate for fair value.
Property, plant and equipment is measured on an existing use basis, where there are no feasiblealternative uses in the existing natural, legal, financial and socio-political environment. However, inthe limited circumstances where there are feasible alternative uses, assets are valued at theirhighest and best use.
The Health Service revalues its Land and Buildings and Infrastructure at minimum every three yearsby independent valuation. The last revaluation for assets assumed by the Area as at 1st July 2007was completed on 30 June 2008 and was based on an independent assessment.To ensure that thecarrying amount for each asset does not differ materially from its fair value at reporting date, indicesprovided in expert advice from the Department of Lands are applied. The indices reflect anassessment of movements made in the period between revaluations.
Physical non-current assets are valued in accordance with the NSW Department of Health's"Valuation of Physical Non-Current Assets at Fair Value" policy. This policy adopts fair value inaccordance with AASB116, Property, Plant and Equipment and AASB140, Investment Property . Investment property is separately discussed at Note 2(o).
Depreciation is provided for on a straight-line basis for all depreciable assets so as to write off thedepreciable amount of each asset as it is consumed over its useful life to the Health Service. Landis not a depreciable asset. All material separately identifiable components of assets are depreciatedover their shorter useful lives.
Depreciation rates are subsequently varied where changes occur in the assessment of the
“Infrastructure Systems” means assets that comprise public facilities and which provide essentialservices and enhance the productive capacity of the economy including roads, bridges, waterinfrastructure and distribution works, sewerage treatment plants, seawalls and water reticulationsystems.
remaining useful life of the assets reported.
When revaluing non-current assets by reference to current prices for assets newer than those beingrevalued (adjusted to reflect the present condition of the assets), the gross amount and the relatedaccumulated depreciation are separately restated.

Hunter New England Area Health ServiceNotes to and forming part of the Financial Statements
for the Year Ended 30 June 2010
k)
l)
m)
n)
o)
Restoration Costs
The Health Service has certain non-current assets (or disposal groups) classified as held for sale,where their carrying amount will be recovered principally through a sale transaction, not throughcontinuing use. Non-current assets (or disposal groups) held for sale are recognised at the lower ofcarrying amount and fair value less costs to sell. These assets are not depreciated while they areclassified as held for sale.
Revaluation decrements are recognised immediately as expenses in the Result for the Year, exceptthat, to the extent that a credit balance exists in the asset revaluation reserve in respect of the sameclass of assets, they are debited directly to the asset revaluation reserve.
As a not-for-profit entity, revaluation increments and decrements are offset against one anotherwithin a class of non-current assets, but not otherwise.
Investment property is held to earn rentals or for capital appreciation, or both. However, for not-for-profit entities, property held to meet service delivery objectives rather than to earn rental or forcapital appreciation does not meet the definition of investment property and is accounted for underAASB 116 Property, Plant and Equipment . The Health Service does not have any property thatmeets the definition of Investment Property.
As a not-for-profit entity with no cash generating units, the Health Service is effectively exempt fromAASB 136 Impairment of Assets and impairment testing. This is because AASB136 modifies therecoverable amount test to the higher of fair value less costs to sell and depreciated replacementcost. This means that, for an asset already measured at fair value, impairment can only arise ifselling costs are regarded as material. Selling costs are regarded as immaterial.
The Health Service may at times hold certain assets that are not recognised in the Balance Sheetbecause the Health Service is unable to measure reliably the value for the assets. An example ofan asset that may not be capable of reliable measurement is land under roads.
Revaluation increments are credited directly to the asset revaluation reserve, except that, to theextent that an increment reverses a revaluation decrement in respect of that class of assetpreviously recognised as an expense in the Result for the Year, the increment is recognisedimmediately as revenue in the Result for the Year.
Impairment of Property, Plant and Equipment
The estimated cost of dismantling and removing an asset and restoring the site is included in thecost of an asset, to the extent it is recognised as a liability.
Assets Not Able to be Reliably Measured
Where an asset that has previously been revalued is disposed of, any balance remaining in theasset revaluation reserve in respect of that asset is transferred to accumulated funds.
Non-Current Assets (or disposal groups) Held for Sale
For other assets, any balances of accumulated depreciation existing at the revaluation date inrespect of those assets are credited to the asset accounts to which they relate. The net assetaccounts are then increased or decreased by the revaluation increments or decrements.
Investment Properties
Hunter New England Area Health ServiceNotes to and forming part of the Financial Statements
for the Year Ended 30 June 2010
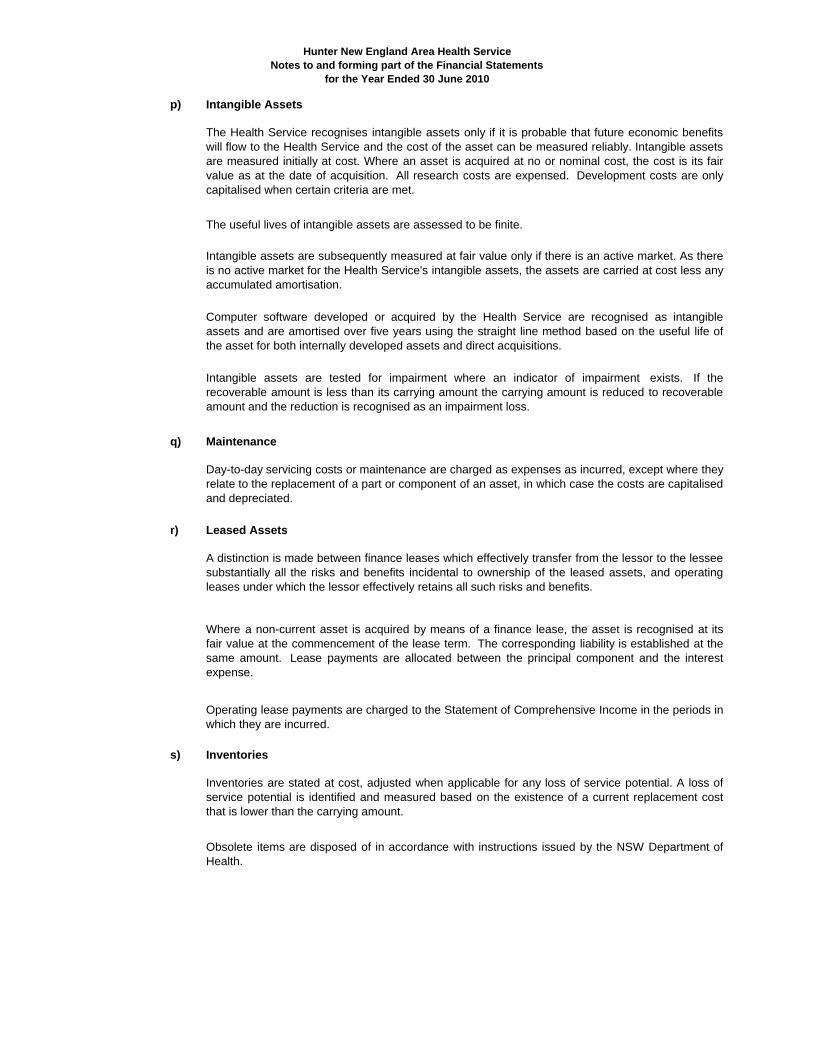
p)
q)
r)
s)
The useful lives of intangible assets are assessed to be finite.
Intangible assets are tested for impairment where an indicator of impairment exists. If therecoverable amount is less than its carrying amount the carrying amount is reduced to recoverableamount and the reduction is recognised as an impairment loss.
Day-to-day servicing costs or maintenance are charged as expenses as incurred, except where theyrelate to the replacement of a part or component of an asset, in which case the costs are capitalisedand depreciated.
Inventories are stated at cost, adjusted when applicable for any loss of service potential. A loss ofservice potential is identified and measured based on the existence of a current replacement costthat is lower than the carrying amount.
Inventories
Obsolete items are disposed of in accordance with instructions issued by the NSW Department ofHealth.
Intangible Assets
The Health Service recognises intangible assets only if it is probable that future economic benefitswill flow to the Health Service and the cost of the asset can be measured reliably. Intangible assetsare measured initially at cost. Where an asset is acquired at no or nominal cost, the cost is its fairvalue as at the date of acquisition. All research costs are expensed. Development costs are onlycapitalised when certain criteria are met.
Where a non-current asset is acquired by means of a finance lease, the asset is recognised at itsfair value at the commencement of the lease term. The corresponding liability is established at thesame amount. Lease payments are allocated between the principal component and the interestexpense.
A distinction is made between finance leases which effectively transfer from the lessor to the lesseesubstantially all the risks and benefits incidental to ownership of the leased assets, and operatingleases under which the lessor effectively retains all such risks and benefits.
Maintenance
Leased Assets
Intangible assets are subsequently measured at fair value only if there is an active market. As thereis no active market for the Health Service's intangible assets, the assets are carried at cost less anyaccumulated amortisation.
Operating lease payments are charged to the Statement of Comprehensive Income in the periods inwhich they are incurred.
Computer software developed or acquired by the Health Service are recognised as intangibleassets and are amortised over five years using the straight line method based on the useful life ofthe asset for both internally developed assets and direct acquisitions.

Hunter New England Area Health ServiceNotes to and forming part of the Financial Statements
for the Year Ended 30 June 2010
t)
u) Investments
*
*
* Available-for-sale investments - Any residual investments that do not fall into any other category areaccounted for as available-for-sale investments and measured at fair value in other comprehensiveincome until disposed or impaired, at which time the cumulative gain or loss previously recognised inother comprehensive income is recognised in the Result for the Year. However, interest calculatedusing the effective interest method and dividends are recognised in the Result for the Year.
The risk management strategy of the Health Service has been developed consistent with theinvestment powers granted under the provision of the Public Authorities (Financial Arrangements)Act. T Corp investments are made in an effort to improve interest returns on cash balances otherwiseavailable whilst also providing secure investments guaranteed by the State market exposures.
The fair value of investments that are traded at fair value in an active market is determined byreference to quoted current bid prices at the close of business on the Statement of FinancialPosition date.
Purchases or sales of investments under contract that require delivery of the asset within thetimeframe established by convention or regulation are recognised on the trade date; i.e. the date theHealth Service commits to purchase or sell the asset.
Investments are initially recognised at fair value plus, in the case of investments not at fair valuethrough profit or loss, transaction costs. The Hunter New England Area Health Service determinesthe classification of its financial assets after initial recognition and, when allowed and appropriate, re-evaluates this at each financial year end.
Loans and Receivables
Fair value through profit or loss - The Hunter New England Area Health Service subsequentlymeasures investments classified as “held for trading” or designated upon initial recognition “at fairvalue through profit or loss” at fair value. Financial assets are classified as “held for trading” if they are acquired for the purpose of selling in the near term. Derivatives are also classified as held for trading.Gains or losses on these assets are recognised in the Result for the Year.
Held-to-maturity investments – Non-derivative financial assets with fixed or determinable paymentsand fixed maturity that the Hunter New England Area Health Service has the positive intention andability to hold to maturity are classified as “held-to-maturity”. These investments are measured atamortised cost using the effective interest method. Changes are recognised in the Result for the Yearwhen impaired, derecognised or through the amortisation process.
Loans and receivables are non-derivative financial assets with fixed or determinable payments thatare not quoted in an active market. These financial assets are recognised initially at fair value,usually based on the transaction cost or face value. Subsequent measurement is at amortised costusing the effective interest method, less an allowance for any impairment of receivables. Anychanges are recognised in the Result for the Year when impaired, derecognised or through theamortisation process.
The Hour-Glass Investment facilities are designated at fair value through profit or loss using thesecond leg of the fair value option i.e. these financial assets are managed and their performance isevaluated on a fair value basis, in accordance with a documented risk management strategy, andinformation about these assets is provided internally on that basis to the agency’s key managementpersonnel.
Short-term receivables with no stated interest rate are measured at the original invoice amountwhere the effect of discounting is immaterial.
The movement in the fair value of the Hour-Glass Investment facilities incorporates distributionsreceived as well as unrealised movements in fair value and is reported in the line item ‘investmentre en e’

Hunter New England Area Health ServiceNotes to and forming part of the Financial Statements
for the Year Ended 30 June 2010
v) Impairment of financial assets
w) De-recognition of financial assets and financial liabilities
x) Payables
y) Borrowings
Where the Health Service has neither transferred nor retained substantially all the risks and rewardsor transferred control, the asset is recognised to the extent of the Health Service's continuinginvolvement in the asset.
Payables are recognised for amounts to be paid in the future for goods and services received,whether or not billed to the Health Service.
These amounts represent liabilities for goods and services provided to the Health Service and otheramounts. Payables are recognised initially at fair value, usually based on the transaction cost orface value. Subsequent measurement is at amortised cost using the effective interest method. Short-term payables with no stated interest rate are measured at the original invoice amount where theeffect of discounting is immaterial.
Loans are not held for trading or designated at fair value through profit or loss and are recognised atamortised cost using the effective interest rate method. Gains or losses are recognised in theResult for the Year on derecognition.
A financial liability is derecognised when the obligation specified in the contract is discharged orcancelled or expires.
The finance lease liability is determined in accordance with AASB 117, Leases.
All financial assets, except those measured at fair value through profit and loss, are subject to anannual review for impairment. An allowance for impairment is established when there is objectiveevidence that the entity will not be able to collect all amounts due.
A financial asset is derecognised when the contractual rights to the cash flows from the financialassets expire; or if the Health Service transfers the financial asset:
* where substantially all the risks and rewards have been transferred; or* where the Health Service has not transferred substantially all the risks and rewards, if the entity has not retained control.
For financial assets carried at amortised cost, the amount of the allowance is the differencebetween the asset’s carrying amount and the present value of estimated future cash flows,discounted at the effective interest rate. The amount of the impairment loss is recognised in theResult for the Year
Any reversals of impairment losses are reversed through the Result for the Year, where there isobjective evidence, except reversals of impairment losses on an investment in an equity instrumentclassified as “available for sale” must be made through the reserve. Reversals of impairment lossesof financial assets carried at amortised cost cannot result in a carrying amount that exceeds whatthe carrying amount would have been had there not been an impairment loss.
When an available for sale financial asset is impaired, the amount of the cumulative loss is removedfrom equity and recognised in the Result for the Year, based on the difference between theacquisition cost (net of any principal repayment and amortisation) and current fair value, less anyimpairment loss previously recognised in the Result for the Year.

Hunter New England Area Health ServiceNotes to and forming part of the Financial Statements
for the Year Ended 30 June 2010
z)
aa)
(i)
(ii)
(iii)
ab) Trust Funds
ac) Budgeted Amounts
ad) Emerging Asset
The asset revaluation reserve is used to record increments and decrements on therevaluation of non-current assets. This accords with the Health Service's policy on therevaluation of property, plant and equipment as discussed in Note 2(j).
Asset Revaluation Reserve
Accumulated Funds
Separate Reserves
The Health Service's emerging interest in the Mater Public Private Partnership Funding has beenvalued in accordance with the Department of Health's policy for Accounting for Privately FinancedProjects . This policy required the Health Service to initially determine the estimated written downreplacement cost by reference to the project's historical cost escalated by a construction index andthe system's estimated working life. The estimated written down replacement cost was thenallocated on a systematic basis over the concession period of 25 years using the annuity methodand the Government Bond rate of 5.63% at commencement of the concession period.
The Health Service receives monies in a trustee capacity for various trusts as set out in Note 30. As the Health Service performs only a custodial role in respect of these monies, and because the monies cannot be used for the achievement of the Health Service's own objectives, they are not brought to account in the financial statements.
Separate reserve accounts are recognised in the financial statements only if such accountsare required by specific legislation or Australian Accounting Standards.
The budgeted amounts are drawn from the budgets agreed with the NSW Health Department at thebeginning of the financial reporting period and with any adjustments for the effects of additionalsupplementation provided.
The category "accumulated funds" includes all current and prior period retained funds.
The transfer of net assets between agencies as a result of an administrative restructure, transfers ofprograms/functions and parts thereof between NSW public sector agencies is designated orrequired by Accounting Standards to be treated as contributions by owners and is recognised as anadjustment to "Accumulated Funds". This treatment is consistent with AASB1004, Contributions and Australian Interpretation 1038 Contributions by Owners Made to Wholly-Owned Public SectorEntities .
Equity Transfers
Equity and Reserves
All other equity transfers are recognised at fair value, except for intangibles. Where an intangiblehas been recognised at (amortised) cost by the transferor because there is no active market, theagency recognises the asset at the transferor's carrying amount. Where the transferor is prohibitedfrom recognising internally generated intangibles, the agency does not recognise that asset.
Transfers arising from an administrative restructure involving not-for-profit entities and for-profitgovernment departments are recognised at the amount at which the asset was recognised by thetransferor immediately prior to the restructure. Subject to below, in most instances this willapproximate fair value.

Hunter New England Area Health ServiceNotes to and forming part of the Financial Statements
for the Year Ended 30 June 2010
ae) Service Group Statements Allocation Methodology
In respect of assets and liabilities the Department requires that all Health Services take action toidentify those components that can be specifically identified and reported by service groups.Remaining values are attributed to service groups in accordance with values advised by the NSWDepartment of Health, e.g. depreciation/amortisation charges form the basis of apportioning thevalues for Intangibles and Property, Plant & Equipment.
Expenses and revenues are assigned to service groups in accordance with statistical data for thetwelve months ended 30 June 2009 which is then applied to the current period's financialinformation. The same methodology is applied to attribute assets and liabilities to each servicegroup.

Hunter New England Area Health ServiceNotes to and forming part of the Financial Statements
for the Year Ended 30 June 2010
PARENT CONSOLIDATION
2010 2009 2010 2009$000 $000 $000 $000
3. Employee Related
Employee related expenses comprise the following:
- - Salaries and Wages 731,438 718,272- - Awards 38,849 30,966- - Superannuation - Defined Benefit Plans 19,849 19,668- - Superannuation - Defined Contribution Plans 65,320 61,864- - Long Service Leave 47,076 33,132- - Annual Leave 84,019 84,922- - Sick Leave and Other Leave 31,719 28,549- - Redundancies 98 633- - Workers' Compensation Insurance 12,638 16,105- - Fringe Benefits Tax 260 270
- - 1,031,266 994,381
The following additional information is provided:
- - Employee Related Expenses Capitalised - Land and Buildings - 24 - - Employee Related Expenses Capitalised - Plant and Equipment - -
4. Personnel Services
Personnel Services comprise the purchase of the following:
731,438 718,272 Salaries and Wages - - 38,849 30,966 Awards - - 19,849 19,668 Superannuation - Defined Benefit Plans - - 65,320 61,864 Superannuation - Defined Contribution Plans - - 47,076 33,132 Long Service Leave - - 84,019 84,922 Annual Leave - - 31,719 28,549 Sick Leave and Other Leave - -
98 633 Redundancies - - 12,638 16,105 Workers' Compensation Insurance - -
260 270 Fringe Benefits Tax - -
1,031,266 994,381 - -
The following additional information is provided:
- 24 Personnel Services Expenses Capitalised - Land and Buildings - - - - Personnel Services Expenses Capitalised - Plant and Equipment - -
5. Other Operating Expenses
90,765 88,478 Allocations towards Inter Area Patient Outflows, NSW (see (d) below) 90,765 88,4786,038 5,963 Blood and Blood Products 6,038 5,963
21,362 22,863 Domestic Supplies and Services 21,362 22,86346,115 43,967 Drug Supplies 46,115 43,96761,267 13,366 Food Supplies 61,267 13,36612,692 10,757 Fuel, Light and Power 12,692 10,75728,588 26,767 General Expenses (See (b) below) 28,588 26,76716,205 17,362 Hospital Ambulance Transport Costs 16,205 17,36211,165 9,906 Information Management Expenses 11,165 9,9063,146 1,444 Insurance 3,146 1,444
11,870 8,786 Interstate Patient Outflows (see (e) below) 11,870 8,786Maintenance (See (c) below)
15,433 11,608 Maintenance Contracts 15,433 11,60818,817 13,488 New/Replacement Equipment under $10,000 18,817 13,48810,369 10,402 Repairs 10,369 10,402
Maintenance/Non Contract62,225 58,938 Medical and Surgical Supplies 62,225 58,9386,008 5,937 Postal and Telephone Costs 6,008 5,9374,590 4,074 Printing and Stationery 4,590 4,0742,137 1,934 Rates and Charges 2,137 1,9347,559 7,356 Rental 7,559 7,356
65,752 52,775 Special Service Departments 65,752 52,7757,624 8,333 Staff Related Costs 7,624 8,3337,239 6,714 Health Support Services- Financial Services 7,239 6,7142,501 1,985 Sundry Operating Expenses (See (a) below) 2,501 1,985
11,187 6,619 Travel Related Costs 11,187 6,619
530,654 439,822 530,654 439,822

Hun
ter N
ew E
ngla
nd A
rea
Hea
lth S
ervi
ceN
otes
to a
nd fo
rmin
g pa
rt o
f the
Fin
anci
al S
tate
men
tsfo
r the
Yea
r End
ed 3
0 Ju
ne 2
010
PAR
ENT
CO
NSO
LID
ATI
ON
2010
2009
2010
2009
$000
$000
$000
$000
(a)
Sun
dry
Ope
ratin
g E
xpen
ses
com
pris
e:2,
501
1,98
5Is
olat
ed P
atie
nt T
rave
l and
Acc
omm
odat
ion
Ass
ista
nce
Sch
eme
2,50
11,
985
2,50
11,
985
2,50
11,
985
(b
) G
ener
al E
xpen
ses
incl
ude:
-84
51,
152
Adv
ertis
ing
845
1,15
269
467
4B
ooks
, Mag
azin
es a
nd J
ourn
als
694
674
Con
sulta
ncie
s2,
237
2,08
2 -
Ope
ratin
g A
ctiv
ities
2,23
72,
082
3741
- C
apita
l Wor
ks
3741
2,59
82,
047
Cou
rier a
nd F
reig
ht2,
598
2,04
716
215
0A
udito
r's R
emun
erat
ion
- Aud
it of
Fin
anci
al S
tate
men
ts16
215
037
12A
udito
r's R
emun
erat
ion
- Oth
er S
ervi
ces
3712
5230
Dat
a R
ecor
ding
and
Sto
rage
5230
543
887
Lega
l Ser
vice
s54
388
796
41,
179
Mem
bers
hip/
Pro
fess
iona
l Fee
s96
41,
179
6,12
46,
823
Mot
or V
ehic
le O
pera
ting
Leas
e E
xpen
se -
Min
imum
Lea
se P
aym
ents
6,12
46,
823
1,92
11,
965
Oth
er O
pera
ting
Leas
e E
xpen
se -
Min
imum
Lea
se P
aym
ents
1,
921
1,96
54,
561
4,60
7O
ther
Mot
or v
ehic
le E
xpen
ses
4,56
14,
607
-
-
Pay
roll
Ser
vice
s-
-
94
964
0Q
ualit
y A
ssur
ance
/Acc
redi
tatio
n94
964
078
985
5S
ecur
ity S
ervi
ces
789
855
2434
Tran
slat
or S
ervi
ces
2434
(c)
Rec
onci
liatio
n To
tal M
aint
enan
ceM
aint
enan
ce E
xpen
se -
Con
tract
ed L
abou
r and
Oth
er (N
on-E
mpl
oyee
44,6
1935
,498
Rel
ated
), in
clud
ed in
Not
e 5
44,6
1935
,498
11,1
2910
,793
Em
ploy
ee R
elat
ed/P
erso
nnel
Ser
vice
s M
aint
enan
ce E
xpen
se in
clud
ed in
Not
es 3
and
411
,129
10,7
93
55,7
4846
,291
Tota
l Mai
nten
ance
Exp
ense
s in
clud
ed in
Not
es 3
, 4 a
nd 5
55,7
4846
,291
8,75
3
10
,777
Chi
ldre
n's
Hos
pita
l Wes
tmea
d8,
753
10,7
77
41
8
528
Gre
ater
Sou
ther
n41
8
528
1,
547
1,40
4G
reat
er W
este
rn1,
547
1,40
4
9,
540
7,86
4N
orth
Coa
st9,
540
7,86
4
27
,139
26,8
56N
orth
ern
Syd
ney
Cen
tral C
oast
27,1
39
26
,856
22,4
25
21
,597
Sou
th E
ast I
llaw
arra
22,4
25
21
,597
12,4
84
11
,911
Syd
ney
Sou
th W
est
12,4
84
11
,911
8,45
9
7,
541
Syd
ney
Wes
t8,
459
7,54
1
90,7
65
88,4
7890
,765
88
,478
(e) E
xpen
ses
for I
nter
stat
e P
atie
nt F
low
s ar
e as
follo
ws:
-37
0
622
Aus
tralia
n C
apita
l Ter
ritor
y37
0
622
-
21
8N
orth
ern
Terr
itory
-
218
9,
370
5,51
2Q
ueen
slan
d9,
370
5,51
2
43
9
56S
outh
Aus
tralia
439
56
302
-
Ta
sman
ia30
2
-
1,15
3
1,
228
Vic
toria
1,15
3
1,
228
236
1,
150
Wes
tern
Aus
tralia
236
1,15
0
11,8
708,
786
11,8
708,
786
(d)D
etai
lsof
the
allo
catio
nsap
plie
dto
Inte
rAre
aP
atie
ntO
utFl
ows,
NS
Won
anA
rea
basi
sas
acce
pted
byth
eN
SW
Dep
artm
ent o
f Hea
lth a
re a
s fo
llow
s:-

Hunter New England Area Health ServiceNotes to and forming part of the Financial Statements
for the Year Ended 30 June 2010PARENT CONSOLIDATION
2010 2009 2010 2009$000 $000 $000 $000
6. Depreciation and Amortisation
37,801 35,082 Depreciation - Buildings 37,801 35,082243 115 Amortisation - Leased Buildings 243 115
20,116 18,257 Depreciation - Plant and Equipment 20,116 18,2572,938 2,924 Depreciation - Infrastructure Systems 2,938 2,924
61,098 56,378 61,098 56,378
7. Grants and Subsidies
8,449 9,013 Non-Government Voluntary Organisations 8,449 9,01345 62 Grants to Community Aged Care Packages 45 62
434 389 Research grants 434 389307 418 Other 307 418
9,235 9,882 9,235 9,882
8. Finance Costs
1,260 2,275 Interest on Intra Health loans 1,260 2,27517,931 9,760 Other Interest Charges 17,931 9,760
19,191 12,035 Total Finance Costs 19,191 12,035
9. Payments to Affiliated Health Organisations
(a) Recurrent Sourced92,982 91,835 Calvary Mater Newcastle 92,982 91,835
92,982 91,835 92,982 91,835(b) Capital Sourced
3,121 7,928 Calvary Mater Newcastle 3,121 7,928
3,121 7,928 3,121 7,928(c) Non Recurrent
- 35,478 Calvary Mater Newcastle - 35,478
- 35,478 - 35,478
96,103 135,241 Total Payments to Affiliated Health Organisations 96,103 135,241

Hunter New England Area Health ServiceNotes to and forming part of the Financial Statements
for the Year Ended 30 June 2010
PARENT CONSOLIDATION
2010 2009 2010 2009$000 $000 $000 $000
10. Sale of Goods and Services
(a) Sale of Goods comprise the following:-
5,045 4,592 Sale of Prosthesis 5,045 4,592825 542 Pharmacy Sales 825 542
(b) Rendering of Services comprise the following:-
101,172 98,651 Patient Fees [see note 2(d)] 101,172 98,651661 1,173 Staff-Meals and Accommodation 661 1,173
59,121 44,987 Infrastructure Fees - Monthly Facility Charge [see note 2(d)] 59,121 44,9878,274 7,193 - Annual Charge 8,274 7,193
33,890 34,675 Allocation from Inter Area Patient Inflows, NSW [see note (c) below] 33,890 34,675575 1,141 Cafeteria/Kiosk 575 1,141
4,194 3,783 Car Parking 4,194 3,783807 775 Child Care Fees 807 775
8,496 4,612 Clinical Services (excluding Clinical Drug Trials) 8,496 4,61272,968 40,189 Commercial Activities 72,968 40,189
232 214 Fees for Medical Records 232 2146 7 Information Retrieval 6 7- 3 Linen Service Revenues - Non Health Services - 3
270 780 Meals on Wheels 270 780194 280 PADP Patient Copayments 194 280
3,176 2,850 Patient Inflows from Interstate [see note (d) below]] 3,176 2,8505,070 4,824 Services Provided to Non NSW Health Organisations 5,070 4,824
15,890 - Highly Specialised Drugs* 15,890 - 12,111 10,568 Other 12,111 10,568
332,977 261,839 332,977 261,839
460 458 Greater Southern 460 4584,497 4,691 Greater Western 4,497 4,691
11,348 12,446 North Coast 11,348 12,44612,817 12,959 Northern Sydney Central Coast 12,817 12,959
1,563 1,084 South East Illawarra 1,563 1,0841,322 1,513 Sydney South West 1,322 1,5131,883 1,524 Sydney West 1,883 1,524
33,890 34,675 33,890 34,675
(d) Revenues from Patient Inflows from Interstate are as follows:-
89 - Australian Capital Territory 89 - 461 3 Northern Territory 461 3
1,761 1,517 Queensland 1,761 1,517149 110 South Australia 149 110
28 219 Tasmania 28 219531 866 Victoria 531 866157 135 Western Australia 157 135
3,176 2,850 3,176 2,850
11. Investment Revenue
4,635 5,143 Interest 4,635 5,1436,549 92 Interest Intra Health loans 6,549 921,510 1,251 Lease and Rental Income 1,510 1,251
1 - Royalties 1 -
12,695 6,486 12,695 6,486
*The Commonwealth Highly Specialised Drug program was varied from 1 July 2009. The State now claims on a recovery basis the cost of highly specialised drugs through Medicare (Commonwealth).
In previous years these funds were received within annual Government Allocation from the NSW Department of Health.
(c) Details of the Allocations received for Inter Area Patient Flows, NSW on an Area basis as accepted by the NSW Department of Health are as follows:

Hunter New England Area Health ServiceNotes to and forming part of the Financial Statements
for the Year Ended 30 June 2010PARENT CONSOLIDATION
2010 2009 2010 2009$000 $000 $000 $000
12. Grants and Contributions
610 505 Clinical Drug Trials 610 5058,190 9,746 Commonwealth Government Grants 8,190 9,746
157 144 Commonwealth Teaching Hospital Grants 157 1445,963 3,614 Industry Contributions/Donations 5,963 3,6148,127 7,421 Cancer Institute Grants 8,127 7,4218,154 6,903 NSW Government Grants 8,154 6,903
19,849 19,667 Personnel Services - Superannuation Defined Benefit Plans - - 1,676 1,345 Research Grants 1,676 1,345
738 2,744 Other Grants 738 2,744
53,464 52,089 33,615 32,422
13. Other Revenue
Other Revenue comprises the following:-
- 2 Bad Debts Recovered - 2269 196 Commissions 269 196
1,012 906 Conference and Training Fees 1,012 90646 31 Sale of Merchandise, Old Wares and Books 46 3117 120 Sponsorship Income 17 120
1,436 1,275 Treasury Managed Fund Hindsight Adjustment 1,436 1,2753,832 3,131 Other 3,832 3,131
6,612 5,661 6,612 5,661
14. Gain/(Loss) on Disposal
16,015 25,533 Property, Plant and Equipment 16,015 25,53311,858 23,162 Less Accumulated Depreciation 11,858 23,162
4,157 2,371 Written Down Value 4,157 2,3712,455 2,075 Less Proceeds from Disposal 2,455 2,075
Gain/(Loss) on Disposal of(1,702) (296) Property, Plant and Equipment (1,702) (296)
270 217 Assets Held for Sale 270 217 400 233 Less Proceeds from Disposal 400 233
Gain/(Loss) on Disposal of Assets130 16 Held for Sale 130 16
(1,572) (280) Total Gain/(Loss) on Disposal (1,572) (280)
15. Other Gains/(Losses)
(2,640) 47 Impairment of Receivables (2,640) 47
(2,640) 47 (2,640) 47

Hun
ter N
ew E
ngla
nd A
rea
Hea
lth S
ervi
ceN
otes
to a
nd fo
rmin
g pa
rt o
f the
Fin
anci
al S
tate
men
tsfo
r the
Yea
r End
ed 3
0 Ju
ne 2
010
PAR
ENT
AN
D C
ON
SOLI
DA
TIO
N
16.C
ondi
tions
on
Con
trib
utio
ns
Purc
hase
of
Hea
lth P
rom
otio
n,O
ther
Tota
lA
sset
sEd
ucat
ion
and
Res
earc
h
$000
$000
$000
$000
Con
tribu
tions
reco
gnis
ed a
s re
venu
es d
urin
g th
e cu
rren
tre
porti
ng p
erio
d fo
r whi
ch e
xpen
ditu
re in
the
man
ner
spec
ified
had
not
occ
urre
d as
at b
alan
ce d
ate
3,45
914
,947
3,33
521
,741
Con
tribu
tions
reco
gnis
ed in
am
alga
mat
ed b
alan
ce a
s at
30
Jun
e 20
09 w
hich
wer
e no
t exp
ende
d in
the
curr
ent
repo
rting
per
iod
4,77
739
,252
7,70
551
,734
Tota
l am
ount
of u
nexp
ende
d co
ntrib
utio
nsas
at b
alan
ce d
ate
8,23
654
,199
11,0
4073
,475
Com
men
t on
rest
ricte
d as
sets
app
ears
in N
ote
24

Hunter New England Area Health ServiceNotes to and forming part of the Financial Statements
for the Year Ended 30 June 2010
17 Service Groups of the Health Service
Service Group 1.1 - Primary and Community Based Services
Service Description: This service group covers the provision of health services to persons attending communityhealth centres or in the home, including health promotion activities, community based women'shealth, dental, drug and alcohol and HIV/AIDS services. It also covers the provision of grants tonon-Government organisations for community health purposes.
Objective: This service group contributes to making prevention everybody's business and strengtheningprimary health and continuing care in the community by working towards a range ofintermediate results that include the following:• improved access to early intervention, assessment, therapy and treatment services for claimsin a home or community setting• reduced rate of avoidable hospital admissions for conditions identified in the State Plan thatcan be appropriately treated in the community and• reduced rate of hospitalisation from fall-related injury for people aged 65 years and over.
Service Group 1.2 - Aboriginal Health Services
Service Description: This service group covers the provision of supplementary health services to Aboriginal people,particularly in the areas of health promotion, health education and disease prevention. (Note:This Service Group excludes most services for Aboriginal people provided directly by AreaHealth Services and other general health services which are used by all members of thecommunity).
Objective: This service group contributes to ensuring a fair and sustainable health system by workingtowards a range of intermediate results that include the following:• the building of regional partnerships for the provision of health services• raising the health status of Aboriginal people and• promoting a healthy lifestyle.
Service Group 1.3 - Outpatient Services
Service Description: This service group covers the provision of services provided in outpatient clinics including lowlevel emergency care, diagnostic and pharmacy services and radiotherapy treatment.
Objective: This service group contributes to creating better experiences for people using health servicesand ensuring a fair and sustainable health system by working towards a range of intermediateresults including improving, maintaining or restoring the health of ambulant patients in a hospitalsetting through diagnosis, therapy, education and treatment services.
Service Group 2.1 - Emergency Services
Service Description: This service group covers the provision of emergency ambulance services and treatment ofpatients in designated emergency departments of public hospitals.
Objective: This service group contributes to creating better experiences for people using the health systemby working towards a range of intermediate results including reduced risk of premature death ordisability by providing timely emergency diagnostic treatment and transport services.
Service Group 2.2 - Overnight Acute Inpatient Services
Service Description: This service group covers the provision of health care to patients admitted to public hospitalswith the intention that their stay will be overnight, including elective surgery and maternityservices.
Objective: This service group contributes to creating better experiences for people using the health systemby working towards a range of intermediate results that include the following:• timely treatment of booked surgical patients, resulting in improved clinical outcomes, quality oflife and patient satisfaction and• reduced rate of unplanned and unexpected hospital readmissions.
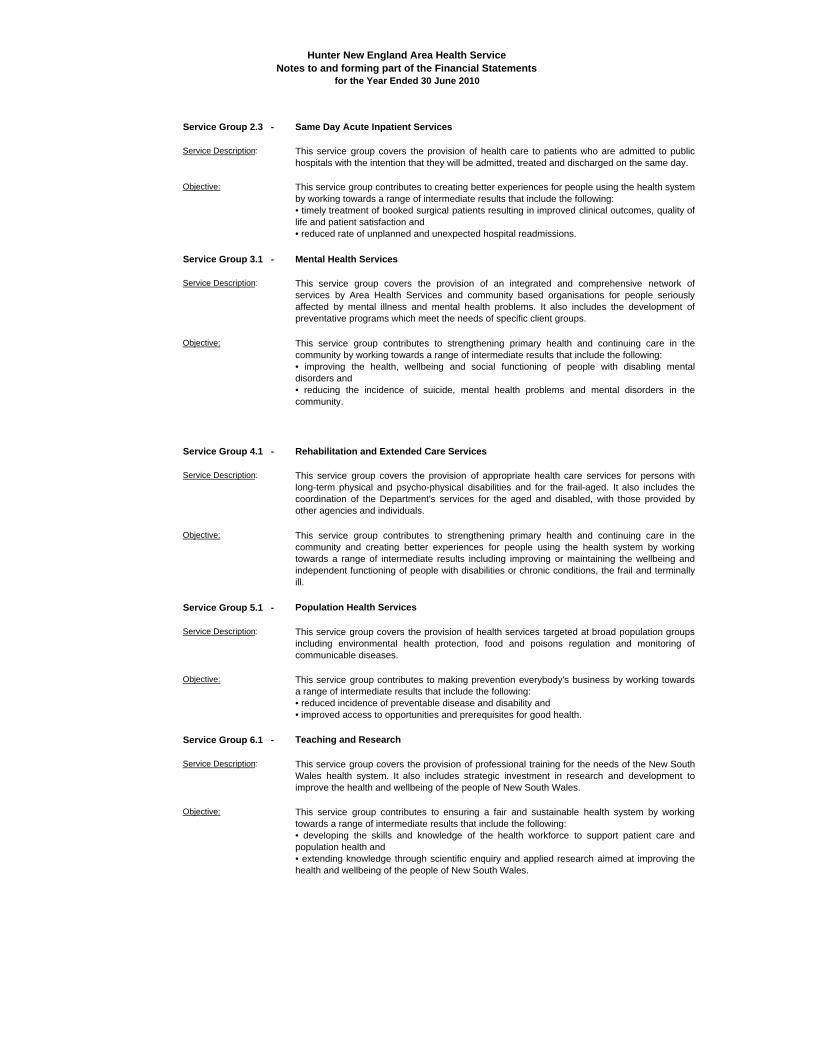
Hunter New England Area Health ServiceNotes to and forming part of the Financial Statements
for the Year Ended 30 June 2010
Service Group 2.3 - Same Day Acute Inpatient Services
Service Description: This service group covers the provision of health care to patients who are admitted to publichospitals with the intention that they will be admitted, treated and discharged on the same day.
Objective: This service group contributes to creating better experiences for people using the health systemby working towards a range of intermediate results that include the following:• timely treatment of booked surgical patients resulting in improved clinical outcomes, quality oflife and patient satisfaction and• reduced rate of unplanned and unexpected hospital readmissions.
Service Group 3.1 - Mental Health Services
Service Description: This service group covers the provision of an integrated and comprehensive network ofservices by Area Health Services and community based organisations for people seriouslyaffected by mental illness and mental health problems. It also includes the development ofpreventative programs which meet the needs of specific client groups.
Objective: This service group contributes to strengthening primary health and continuing care in thecommunity by working towards a range of intermediate results that include the following:• improving the health, wellbeing and social functioning of people with disabling mentaldisorders and• reducing the incidence of suicide, mental health problems and mental disorders in thecommunity.
Service Group 4.1 - Rehabilitation and Extended Care Services
Service Description: This service group covers the provision of appropriate health care services for persons withlong-term physical and psycho-physical disabilities and for the frail-aged. It also includes thecoordination of the Department's services for the aged and disabled, with those provided byother agencies and individuals.
Objective: This service group contributes to strengthening primary health and continuing care in thecommunity and creating better experiences for people using the health system by workingtowards a range of intermediate results including improving or maintaining the wellbeing andindependent functioning of people with disabilities or chronic conditions, the frail and terminallyill.
Service Group 5.1 - Population Health Services
Service Description: This service group covers the provision of health services targeted at broad population groupsincluding environmental health protection, food and poisons regulation and monitoring ofcommunicable diseases.
Objective: This service group contributes to making prevention everybody's business by working towardsa range of intermediate results that include the following:• reduced incidence of preventable disease and disability and• improved access to opportunities and prerequisites for good health.
Service Group 6.1 - Teaching and Research
Service Description: This service group covers the provision of professional training for the needs of the New SouthWales health system. It also includes strategic investment in research and development toimprove the health and wellbeing of the people of New South Wales.
Objective: This service group contributes to ensuring a fair and sustainable health system by workingtowards a range of intermediate results that include the following:• developing the skills and knowledge of the health workforce to support patient care andpopulation health and• extending knowledge through scientific enquiry and applied research aimed at improving thehealth and wellbeing of the people of New South Wales.

Hun
ter N
ew E
ngla
nd A
rea
Hea
lth S
ervi
ceN
otes
to a
nd fo
rmin
g pa
rt o
f the
Fin
anci
al S
tate
men
tsfo
r the
Yea
r End
ed 3
0 Ju
ne 2
010
PAR
ENT
2010
2009
2010
2009
$000
$000
$000
$000
18.
C
ash
and
Cas
h Eq
uiva
lent
s
48,2
6156
,151
Cas
h at
Ban
k an
d O
n H
and
48,2
6156
,151
69,6
0052
,002
Sho
rt Te
rm D
epos
its69
,600
52,0
02
117,
861
108,
153
117,
861
108,
153
Cas
h &
cas
h eq
uiva
lent
ass
ets
reco
gnis
ed in
the
Sta
tem
ent o
f Fin
anci
al P
ositi
on a
re re
conc
iled
at th
e en
d of
the
finan
cial
yea
r to
the
Sta
tem
ent o
f Cas
h Fl
ows
as fo
llow
s:
117,
861
108,
153
Cas
h an
d C
ash
Equ
ival
ents
(per
Sta
tem
ent o
f Fin
anci
al P
ositi
on)
117,
861
108,
153
117,
861
108,
153
Clo
sing
Cas
h an
d C
ash
Equ
ival
ents
(per
Sta
tem
ent o
f Cas
h Fl
ows)
117,
861
108,
153
Ref
er to
Not
e 38
for d
etai
ls re
gard
ing
cred
it ris
k, li
quid
ity ri
sk a
nd m
arke
t ris
k ar
isin
g fr
om fi
nanc
ial i
nstr
umen
ts.
CO
NSO
LID
ATI
ON

Hunter New England Area Health ServiceNotes to and forming part of the Financial Statements
for the Year Ended 30 June 2010
PARENT CONSOLIDATION
2010 2009 2010 2009$000 $000 $000 $000
19. Receivables
Current17,308 18,681 (a) Sale of Goods and Services 17,308 18,681
159 312 Leave Mobility 159 312636 791 NSW Health Department 636 791
10,885 9,900 Goods and Services Tax 10,885 9,9003,372 2,929 Expense/Payments 3,372 2,929
12,638 9,710 Other Debtors 12,638 9,710
44,998 42,323 Sub Total 44,998 42,323
(2,737) (574) Less Allowance for Impairment (2,737) (574)
42,261 41,749 Sub Total 42,261 41,7491,739 1,928 Prepayments 1,739 1,928
44,000 43,677 44,000 43,677
(b) Movement in the Allowance for Impairment Sale of Goods and Services
(485) (357) Balance at 1 July (485) (357)97 151 Amounts written off during the year 97 151
762 128 Amounts recovered during the year 762 128859 279 Increase/(decrease) in Allowance Recognised in 859 279
- - Result for the Year(1,247) (485) Balance at 30 June (1,247) (485)
(c) Movement in the Allowance for Impairment Other Debtors
(89) (473) Balance at 1 July (89) (473)343 58 Amounts written off during the year 343 58
1,401 (384) Amounts recovered during the year 1,401 (384)1,744 (326) Increase/(decrease) in Allowance Recognised in 1,744 (326)
- - Result for the Year(1,490) (89) Balance at 30 June (1,490) (89)
(2,737) (574) (2,737) (574)
Non-Current(a) Sale of Goods and Services
226 263 Other Debtors 226 263115 - 115
341 263 Sub Total 341 263
(82) (46) Less Allowance for Impairment (82) (46)
259 217 Sub Total 259 217Prepayments
259 217 259 217
(b) Movement in the Allowance for Impairment Sale of Goods and Services
(46) (90) Balance at 1 July (46) (90)- 44 Amounts written off during the year - 44
36 - Amounts recovered during the year 36 - 36 - Increase/(decrease) in Allowance Recognised in 36 -
Result for the Year(82) (46) Balance at 30 June (82) (46)
(d) Sale of Goods and Services Receivables (Current and Non-Current) include:
1,313 1,533 Patient Fees - Compensable 1,313 1,533967 518 Patient Fees - Ineligible 967 518
9,445 9,832 Patient Fees - Other 9,445 9,832
11,725 11,883 11,725 11,883
Details regarding credit risk, liquidity risk and market risk, including financial assets that are either past due or impairedare disclosed in Note 38.

Hun
ter N
ew E
ngla
nd A
rea
Hea
lth S
ervi
ceN
otes
to a
nd fo
rmin
g pa
rt o
f the
Fin
anci
al S
tate
men
tsfo
r the
Yea
r End
ed 3
0 Ju
ne 2
010
PAR
ENT
CO
NSO
LID
ATI
ON
2010
2009
2010
2009
$000
$000
$000
$000
20.
In
vent
orie
s
Cur
rent
- H
eld
for D
istr
ibut
ion
2,56
42,
448
Dru
gs2,
564
2,44
84,
075
4,50
0M
edic
al a
nd S
urgi
cal S
uppl
ies
4,07
54,
500
-
22
5Fo
od a
nd H
otel
Sup
plie
s-
225
-
30
Eng
inee
ring
Sup
plie
s-
30-
-
O
ther
Incl
udin
g G
oods
in T
rans
it -
-
6,63
97,
203
6,63
97,
203

Hun
ter N
ew E
ngla
nd A
rea
Hea
lth S
ervi
ceN
otes
to a
nd fo
rmin
g pa
rt o
f the
Fin
anci
al S
tate
men
tsfo
r the
Yea
r End
ed 3
0 Ju
ne 2
010
PAR
ENT
CO
NSO
LID
ATI
ON
2010
2009
2010
2009
$000
$000
$000
$000
21.
O
ther
Fin
anci
al A
sset
s
Cur
rent
2,13
92,
070
Loan
s (O
ther
Are
a H
ealth
Ser
vice
s)2,
139
2,07
0
2,13
92,
070
2,13
92,
070
Non
-Cur
rent
11,2
4513
,384
Loan
s (O
ther
Are
a H
ealth
Ser
vice
s)11
,245
13,3
84
11,2
4 513
,384
11,2
4513
,384
Loan
s re
pres
ent m
onie
s ou
tsta
ndin
g fro
m o
ther
Are
a H
ealth
Ser
vice
s, tr
ansf
er o
f le
ave
liabi
lity.
Deb
t to
be e
xtin
guis
hed
in 2
015/
16.
Ref
erto
Not
e38
forf
urth
erin
form
atio
nre
gard
ing
cred
itris
k,liq
uidi
tyris
kan
dm
arke
tris
k ar
isin
g fro
m fi
nanc
ial i
nstru
men
ts.

Hunter New England Area Health ServiceNotes to and forming part of the Financial Statements
for the Year Ended 30 June 2010
PARENT CONSOLIDATION
2010 2009 2010 2009$000 $000 $000 $000
22. Property, Plant and Equipment
Land and Buildings - Fair Value1,829,552 1,656,134 Gross Carrying Amount 1,829,552 1,656,134
Less Accumulated Depreciation805,419 697,630 and Impairment 805,419 697,630
1,024,133 958,504 Net Carrying Amount 1,024,133 958,504
Plant and Equipment - Fair Value234,479 212,709 Gross Carrying Amount 234,479 212,709
Less Accumulated Depreciation135,042 128,316 and Impairment 135,042 128,316
99,437 84,393 Net Carrying Amount 99,437 84,393
Infrastructure Systems - Fair Value130,235 117,508 Gross Carrying Amount 130,235 117,508
Less Accumulated Depreciation53,737 46,248 and Impairment 53,737 46,248
76,498 71,260 Net Carrying Amount 76,498 71,260
Total Property, Plant and Equipment1,200,068 1,114,157 At Net Carrying Amount 1,200,068 1,114,157

Hunter New England Area Health ServiceNotes to and forming part of the Financial Statements
for the Year Ended 30 June 2010
PARENT AND CONSOLIDATED
22. Property, Plant and Equipment - Reconciliation
Land Buildings Work in Leased Plant and Infrastructure TotalProgress Buildings Equipment Systems
$000 $000 $000 $000 $000 $000 $000
2010Net Carrying Amount at Start of Year 109,503 802,474 42,377 4,150 84,393 71,260 1,114,157Additions - 154 40,331 156 27,106 89 67,836Reclassifications to Intangibles - - - - - - - Recognition of Assets Held for Sale 2 20 - - - - 22Disposals - - - - (4,157) - (4,157)Administrative Restructures - TransfersIn/(Out) - - - - (537) - (537)Net Revaluation Increment Less Revaluation Decrements Recognised in Reserves (6,097) 82,508 - - - 7,434 83,845Impairment Losses (Recognised in "OtherGains/Losses) - - - - - - - Depreciation Expense (37,801) - (243) (20,116) (2,938) (61,098)Reclassifications 1,301 22,526 (37,269) 41 12,748 653 - Net Carrying Amount at End of Year 104,709 869,881 45,439 4,104 99,437 76,498 1,200,068
Land Buildings Work in Leased Plant and Infrastructure TotalProgress Buildings Equipment Systems
$000 $000 $000 $000 $000 $000 $000
2009Net Carrying Amount at Start of Year 110,208 761,016 35,174 - 81,844 73,895 1,062,137Additions - 50,436 39,807 - 16,055 - 106,298Reclassifications to Intangibles - - - - - - 0Recognition of Assets Held for Sale (480) (22) - - - - (502)Disposals (225) (146) - - (2,000) - (2,371)Administrative Restructures - Transfers In/(Out) - - - - 4,973 - 4,973Net Revaluation Increment Less Revaluation Decrements Recognised in Reserves - - - - - - - Impairment Losses (Recognised in "OtherGains/Losses) - - - - - - - Depreciation Expense - (35,082) - (115) (18,257) (2,924) (56,378)Reclassifications - 26,272 (32,604) 4,265 1,778 289 - Net Carrying Amount at End of Year 109,503 802,474 42,377 4,150 84,393 71,260 1,114,157Above categories and transaction type should be deleted if not applicable.
(i) Land and Buildings include land owned by the Health Administration Corporation andadministered by the Health Service [see note 2(g)].
(ii) Land and Buildings were valued by Global Valuation Services Pty Ltd (FRICS. FVLEVal & Econ Registered Number 27) on 1 July 2007 [see note 2(j)]. Global Valuations is not an employee of the Health Service.
(iii) In acccordance with the fair value requirements of AASB 116 the land, buildings andinfrastructure assets have had a factor applied in relation to the movement in the market andvariation in the building and infrastructure costs. The adjustment has been performed on agross basis in accordance with note 2 (j). This factor gives consideration to the valuation ofPhysical Non-Current Assets at Fair Value. Indice applied to Non Current Assets aredetermined by the Department of Lands.

Hun
ter N
ew E
ngla
nd A
rea
Hea
lth S
ervi
ceN
otes
to a
nd fo
rmin
g pa
rt o
f the
Fin
anci
al S
tate
men
tsfo
r the
Yea
r End
ed 3
0 Ju
ne 2
010
PAR
ENT
CO
NSO
LID
ATI
ON
2010
2009
2010
2009
$000
$000
$000
$000
23.
Non
-Cur
rent
Ass
ets
(or D
ispo
sal G
roup
s) H
eld
for S
ale
Ass
ets
Hel
d fo
r Sal
e2,
107
2,40
0
La
nd a
nd B
uild
ings
2,10
7
2,
400
127
12
7
Infra
stru
ctur
e S
yste
ms
127
12
7
2,23
4
2,
527
2,23
4
2,52
7
Am
ount
s R
ecog
nise
d in
Equ
ity R
elat
ing
to A
sset
s H
eld
for S
ale
535
46
3
Pro
perty
, Pla
nt a
nd E
quip
men
t Ass
et R
eval
uatio
n In
crem
ents
/Dec
rem
en53
5
463
535
46
3
535
463
Land
, Lot
1 K
anag
ra D
rive
Tare
e
Land
, Bui
ldin
gs A
nd In
frast
ruct
ure
held
for S
ale
are:
Land
&B
uild
ing
82G
eorg
eS
treet
Mun
gind
ino
long
eran
impe
ndin
gsa
le, w
ithdr
awn
from
mar
ket,
asse
t cur
rent
ly le
ased
.
Land
& B
uild
ing
13 W
illia
m S
t New
Lam
bton
sol
d Ju
ne 2
010
Thes
eA
sset
sar
esu
rplu
sto
heal
thse
rvic
esre
quire
men
tsan
dit
isex
pect
edth
atth
esa
lew
illoc
cur
with
inth
ene
xt12
mon
ths.
The
sale
has
man
agem
ent
and
Dep
artm
ent
ofH
ealth
appr
oval
and
asse
tsar
eav
aila
ble
for i
mm
edia
te s
ale.
Land
, Bui
ldin
g an
d In
frast
ruct
ure
Wal
cha
Hos
pita
l
Cha
nges
to a
sset
hel
d fo
r sal
e fro
m p
rior y
ear:
Land
, Gib
bon
& C
amer
on S
ts-C
ampu
s N
arra
bri

Hun
ter N
ew E
ngla
nd A
rea
Hea
lth S
ervi
ceN
otes
to a
nd fo
rmin
g pa
rt o
f the
Fin
anci
al S
tate
men
tsfo
r the
Yea
r End
ed 3
0 Ju
ne 2
010
PAR
ENT
CO
NSO
LID
ATI
ON
2010
2009
2010
2009
$000
$000
$000
$000
24.
Res
tric
ted
Ass
ets
Cat
egor
yB
rief D
etai
ls o
f Ext
erna
lly Im
pose
dC
ondi
tions
incl
udin
g A
sset
Cat
egor
y af
fect
ed
8,23
78,
657
Spe
cific
Pur
pose
sC
ondi
tion
Impo
sed
by D
onor
8,23
78,
657
1515
Per
petu
ally
Inve
sted
Fun
dsO
rigin
al P
rinci
pal n
ot to
be
spen
t15
15
19,5
3918
,185
Res
earc
h G
rant
sC
ondi
tion
impo
sed
by g
rant
ing
body
19,5
3918
,185
34,6
4431
,209
Priv
ate
Pra
ctic
e Fu
nds
Trus
t Dee
ds34
,644
31,2
09
11,0
4012
,239
Oth
er
Con
ditio
n Im
pose
d by
Don
or11
,040
12,2
39
73,4
7570
,305
73,4
7570
,305
The
Hea
lthS
ervi
ce's
finan
cial
stat
emen
tsin
clud
eth
efo
llow
ing
asse
tsw
hich
are
rest
ricte
dby
exte
rnal
lyim
pose
dco
nditi
ons,
eg.
dono
rre
quire
men
ts.
The
asse
tsar
eon
lyav
aila
ble
for
appl
icat
ion
inac
cord
ance
with
the
term
s of
the
dono
r res
trict
ions
.

Hun
ter N
ew E
ngla
nd A
rea
Hea
lth S
ervi
ceN
otes
to a
nd fo
rmin
g pa
rt o
f the
Fin
anci
al S
tate
men
tsfo
r the
Yea
r End
ed 3
0 Ju
ne 2
010
PAR
ENT
CO
NSO
LID
ATI
ON
25.
Pay
able
s20
1020
0920
1020
09$0
00$0
00$0
00$0
00C
urre
nt-
-
A
ccru
ed S
alar
ies,
Wag
es a
nd O
n-C
osts
18,8
4026
,587
-
-
Taxa
tion
and
Pay
roll
Ded
uctio
ns
1,30
65,
771
20,1
4632
,358
Acc
rued
Lia
bilit
y - P
urch
ase
of P
erso
nnel
Ser
vice
s-
-
30
,937
33,7
39C
redi
tors
- Tra
de C
redi
tors
Onl
y30
,937
33,7
392,
453
2,81
8Ta
xatio
n P
ayab
les
- Goo
ds &
Ser
vice
s Ta
x2,
453
2,81
8O
ther
Cre
dito
rs
889
4,16
6 -
Cap
ital W
orks
889
4,16
610
,335
3,43
0 -
Intra
Hea
lth L
iabi
lity
10
,335
3,43
029
,845
25,6
62 -
Oth
er29
,845
25,6
62
94,6
0510
2,17
394
,605
102,
173
Det
ails
rega
rdin
g cr
edit
risk,
liqu
idity
risk
and
mar
ket r
isk,
incl
udin
g a
mat
urity
ana
lysi
s of
the
abov
e pa
yabl
es a
re d
iscl
osed
in N
ote
38.
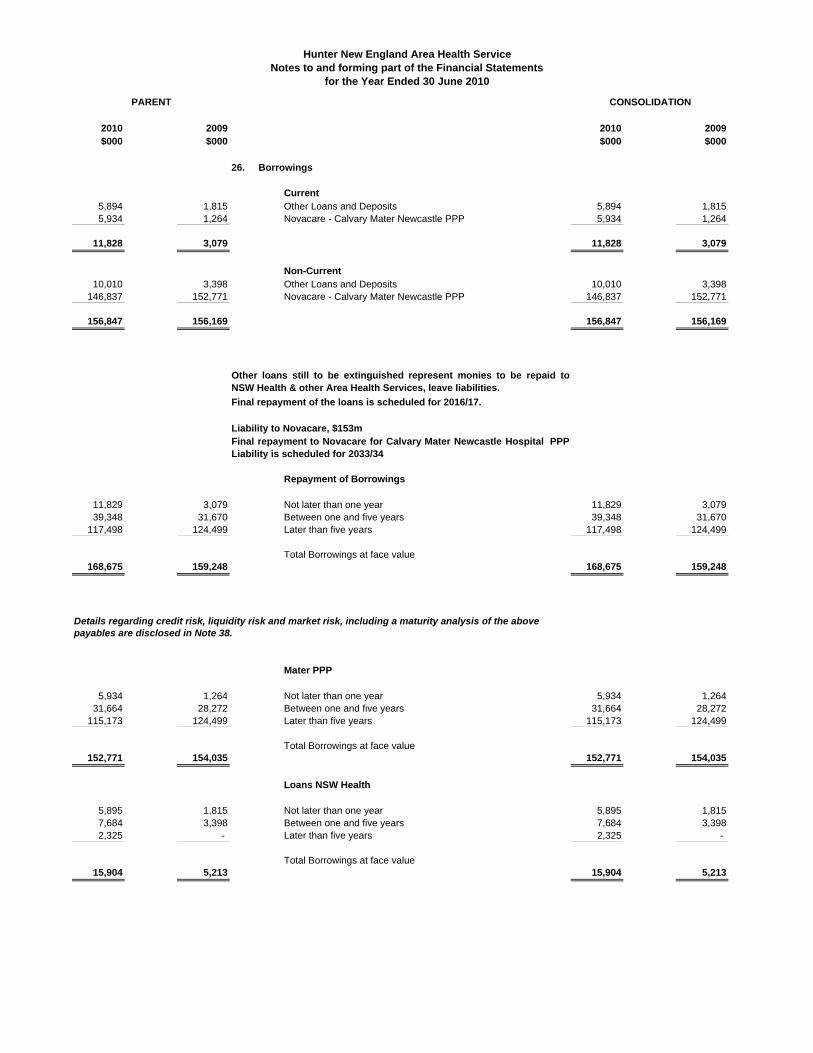
Hunter New England Area Health ServiceNotes to and forming part of the Financial Statements
for the Year Ended 30 June 2010
PARENT CONSOLIDATION
2010 2009 2010 2009$000 $000 $000 $000
26. Borrowings
Current5,894 1,815 Other Loans and Deposits 5,894 1,8155,934 1,264 Novacare - Calvary Mater Newcastle PPP 5,934 1,264
11,828 3,079 11,828 3,079
Non-Current10,010 3,398 Other Loans and Deposits 10,010 3,398
146,837 152,771 Novacare - Calvary Mater Newcastle PPP 146,837 152,771
156,847 156,169 156,847 156,169
Repayment of Borrowings
11,829 3,079 Not later than one year 11,829 3,07939,348 31,670 Between one and five years 39,348 31,670
117,498 124,499 Later than five years 117,498 124,499
Total Borrowings at face value168,675 159,248 168,675 159,248
Mater PPP
5,934 1,264 Not later than one year 5,934 1,26431,664 28,272 Between one and five years 31,664 28,272
115,173 124,499 Later than five years 115,173 124,499
Total Borrowings at face value152,771 154,035 152,771 154,035
Loans NSW Health
5,895 1,815 Not later than one year 5,895 1,8157,684 3,398 Between one and five years 7,684 3,3982,325 - Later than five years 2,325 -
Total Borrowings at face value15,904 5,213 15,904 5,213
Details regarding credit risk, liquidity risk and market risk, including a maturity analysis of the above payables are disclosed in Note 38.
Other loans still to be extinguished represent monies to be repaid toNSW Health & other Area Health Services, leave liabilities. Final repayment of the loans is scheduled for 2016/17.
Liability to Novacare, $153mFinal repayment to Novacare for Calvary Mater Newcastle Hospital PPPLiability is scheduled for 2033/34

Hun
ter N
ew E
ngla
nd A
rea
Hea
lth S
ervi
ceN
otes
to a
nd fo
rmin
g pa
rt o
f the
Fin
anci
al S
tate
men
tsfo
r the
Yea
r End
ed 3
0 Ju
ne 2
010
PAR
ENT
CO
NSO
LID
ATI
ON
2010
2009
2010
2009
$000
$000
$000
$000
27.
Prov
isio
ns
Cur
rent
Em
ploy
ee B
enef
its a
nd R
elat
ed O
n-C
osts
-
-
Ann
ual L
eave
- S
hort
Term
Ben
efit
73,1
4069
,951
-
-
Ann
ual L
eave
- Lo
ng T
erm
Ben
efit
59,3
2358
,734
-
-
Long
Ser
vice
Lea
ve -
Sho
rt Te
rm B
enef
it15
,651
15,7
45-
-
Lo
ng S
ervi
ce L
eave
- Lo
ng T
erm
Ben
efit
194,
057
174,
994
-
-
Sic
k Le
ave
-
-
-
-
Oth
er-
-
34
2,17
1
319,
424
P
rovi
sion
for P
erso
nnel
Ser
vice
s Li
abili
ty-
-
342,
171
319,
424
Tota
l Cur
rent
Pro
visi
ons
342,
171
319,
424
Non
-Cur
rent
Em
ploy
ee B
enef
its a
nd R
elat
ed O
n-C
osts
-
-
Long
Ser
vice
Lea
ve -
Con
ditio
nal
7,49
0
6,99
0-
-
S
ick
Leav
e -
-
-
-
O
ther
-
-
7,49
06,
990
Pro
visi
on fo
r Per
sonn
el S
ervi
ces
Liab
ility
-
-
7,49
06,
990
Tota
l Non
-Cur
rent
Pro
visi
ons
7,49
06,
990
Agg
rega
te E
mpl
oyee
Ben
efits
and
Rel
ated
On-
Cos
ts34
2,17
131
9,42
4P
rovi
sion
s - C
urre
nt34
2,17
131
9,42
47,
490
6,99
0P
rovi
sion
s - N
on-C
urre
nt7,
490
6,99
0-
-
A
ccru
ed S
alar
ies,
Wag
es a
nd O
n-C
osts
(Not
e 25
)20
,146
32,3
5820
,146
32,3
58
A
ccru
ed L
iabi
lity
- Pur
chas
e of
Per
sonn
el S
ervi
ces
(Not
e 25
)-
-
369,
807
358,
772
369,
807
358,
772

Hun
ter N
ew E
ngla
nd A
rea
Hea
lth S
ervi
ceN
otes
to a
nd fo
rmin
g pa
rt o
f the
Fin
anci
al S
tate
men
tsfo
r the
Yea
r End
ed 3
0 Ju
ne 2
010
PAR
ENT
CO
NSO
LID
ATI
ON
2010
2009
2010
2009
$000
$000
$000
$000
28.
Oth
er L
iabi
litie
s
Cur
rent
2,98
51,
713
Inco
me
in A
dvan
ce2,
985
1,71
3
2,98
51,
713
2,98
51,
713
Non
-Cur
rent
375
405
Inco
me
in A
dvan
ce37
540
5
375
405
375
405
The
maj
orco
mpo
nent
sof
Inco
me
inad
vanc
eas
atth
e30
thJu
ne20
10re
late
sto
rent
inad
vanc
ere
ceiv
edfro
mA
rmid
ale
Priv
ate
Hos
pita
l$0.
4mill
ion,
depo
sito
nth
esa
leof
Dav
idM
addi
son
build
ing
$0.6
mill
ion,
Mat
erP
PP
-Fun
ding
Vol
ume
Adj
ustm
ent
$0.6
mill
ion,
Can
cer
inst
itute
fund
ing
$0.3
mill
ion,
Com
pack
s-
HA
H$0
.3m
illio
n,S
HIP
rese
arch
proj
ect
$0.3
mill
ion,
Abo
rigin
alE
mpl
oym
ent
Out
com
es$0
.2m
illio
n,R
ural
Hea
lthS
ervi
ce P
rogr
am G
rant
$0.
1mill
ion,
Oth
ers
$0.5
mill
ion.

Hun
ter N
ew E
ngla
nd A
rea
Hea
lth S
ervi
ceN
otes
to a
nd fo
rmin
g pa
rt o
f the
Fin
anci
al S
tate
men
tsfo
r the
Yea
r End
ed 3
0 Ju
ne 2
010
PAR
ENT
CO
NSO
LID
ATI
ON
2010
2009
29.
Com
mitm
ents
for E
xpen
ditu
re20
1020
09$0
00$0
00$0
00$0
00(a
) Cap
ital C
omm
itmen
ts
39,8
4415
,613
Not
late
r tha
n on
e ye
ar39
,844
15,6
133,
064
1,69
9La
ter t
han
one
year
and
not
late
r tha
n fiv
e ye
ars
3,06
41,
699
Late
r tha
n fiv
e ye
ars
42,9
0817
,312
Tota
l Cap
ital E
xpen
ditu
re C
omm
itmen
ts (i
nclu
ding
GST
) 42
,908
17,3
12
(b)
Ope
ratin
g Le
ase
Com
mitm
ents
Com
mitm
ents
in re
latio
n to
non
-can
cella
ble
oper
atin
g le
ases
are
pay
able
as
follo
ws:
9,04
09,
192
Not
late
r tha
n on
e ye
ar9,
040
9,19
213
,450
14,1
28La
ter t
han
one
year
and
not
late
r tha
n fiv
e ye
ars
13,4
5014
,128
32,1
3334
,223
Late
r tha
n fiv
e ye
ars
32,1
3334
,223
54,6
2257
,543
Tota
l Ope
ratin
g Le
ase
Com
mitm
ents
(inc
ludi
ng G
ST)
54
,622
57,5
43
The
oper
atin
g le
ase
com
mitm
ents
abo
ve a
re fo
r mot
or v
ehic
les,
info
rmat
ion
tech
nolo
gy, e
quip
men
tin
clud
ing
pers
onal
com
pute
rs, m
edic
al e
quip
men
t and
oth
er e
quip
men
t
(c) C
ontin
gent
Ass
et re
late
d to
Com
mitm
ents
for E
xpen
ditu
re
Agg
rega
teca
pita
lex
pend
iture
for
the
acqu
isiti
onof
land
and
build
ings
,pl
ant
and
equi
pmen
t,in
frast
ruct
ure
and
inta
ngib
leas
sets
,co
ntra
cted
for
atba
lanc
eda
tean
dno
tpr
ovid
ed fo
r:
Of
the
com
mitm
ents
repo
rted
at30
June
2010
itis
expe
cted
that
NIL
will
bem
etfro
mlo
cally
gen
erat
ed m
oney
s.
The
tota
lof"
Com
mitm
ents
for
Exp
endi
ture
"abo
ve,i
.e.$
97.5
mm
illio
nas
at30
June
2010
incl
udes
inpu
ttax
cred
itsof
$8.9
mth
atar
eex
pect
edto
bere
cove
rabl
efro
mth
eA
ustra
lian
Taxa
tion
Offi
ce.

Hun
ter N
ew E
ngla
nd A
rea
Hea
lth S
ervi
ceN
otes
to a
nd fo
rmin
g pa
rt o
f the
Fin
anci
al S
tate
men
tsfo
r the
Yea
r End
ed 3
0 Ju
ne 2
010
(d) C
alva
ry M
ater
New
cast
le H
ospi
tal P
ublic
, Priv
ate
Part
ners
hip
(PPP
)
2010
2009
2010
2009
$000
$000
$000
$000
6,52
7
1,
390
Not
late
r tha
n on
e ye
ar6,
527
1,39
0
34
,831
31,0
99
La
ter t
han
one
year
and
not
late
r tha
n fiv
e ye
ars
34,8
31
31
,099
126,
690
13
6,94
9
Late
r tha
n fiv
e ye
ars
126,
690
13
6,94
9
168,
048
16
9,43
8
Tota
l Cap
ital E
xpen
ditu
re C
omm
itmen
ts (i
nclu
ding
GST
) 16
8,04
8
16
9,43
8
An
estim
ate
of th
e co
mm
itmen
ts is
as
follo
ws:
(e) (
i) C
omm
itmen
ts –
Rep
aym
ent o
f PPP
Lia
bilit
y (B
orro
win
gs )
Whe
nS
tage
1co
nstru
ctio
nw
asco
mpl
eted
inJa
nuar
y20
08,
the
Hun
ter
New
Eng
land
Are
aH
ealth
Ser
vice
(HN
EA
HS
)tra
nsfe
rred
the
Mat
erho
spita
lto
Cal
vary
Mat
erN
ewca
stle
and
reco
gnis
edth
etra
nsfe
ras
agr
ante
xpen
seof
$71.
33M
.The
reco
gniti
onis
base
don
the
fact
that
serv
ices
are
deliv
ered
byLi
ttle
Com
pany
ofM
ary
Hea
lthC
are
bein
ga
Third
Sch
edul
eH
ospi
talh
ealth
care
prov
ider
whi
chis
outs
ide
the
acco
untin
gco
ntro
lofe
ither
HN
EA
HS
orth
eD
epar
tmen
t.U
pon
com
plet
ion
ofth
eP
roje
ct,H
NE
AH
Stra
nsfe
rred
the
othe
rpa
rtsof
the
new
Hos
pita
land
reco
gnis
edth
etra
nsfe
rof
agr
ante
xpen
seof
$35.
48M
in J
une
2009
.
HN
EA
HS
reco
gnis
edth
ene
wm
enta
lhea
lthfa
cilit
yas
anas
seto
f$39
.29M
.Th
ere
furb
ishe
dC
onve
ntan
dM
cAul
eybu
ildin
gsat
the
Mat
erho
spita
lsite
asoc
cupi
edby
HN
EA
HS
,was
also
reco
gnis
edas
anas
seta
ndof
fset
ting
liabi
lity
of$1
1.08
M.
The
basi
sfo
rthe
acco
untin
gtre
atm
enti
sth
atse
rvic
esw
illbe
deliv
ered
byH
NE
AH
Son
the
site
ofM
ater
Hos
pita
lfor
the
dura
tion
of th
e H
ead
Leas
e of
the
thes
e fa
cilit
ies
until
Nov
embe
r 203
3.
Inad
ditio
n,th
eH
unte
rN
ewE
ngla
ndA
rea
Hea
lthS
ervi
cere
cogn
ised
the
liabi
lity
toN
ovac
are,
paya
ble
over
the
perio
dto
2033
, for
the
cons
truct
ion
of b
oth
hosp
itals
.
In20
05-0
6,th
eH
ealth
Adm
inis
tratio
nC
orpo
ratio
nen
tere
din
toa
cont
ract
with
apr
ivat
ese
ctor
prov
ider
,N
ovac
are
Pro
ject
Par
tner
ship
for
finan
cing
,de
sign
,co
nstru
ctio
nan
dco
mm
issi
onin
gof
ane
wM
ater
Hos
pita
l,a
men
talh
ealth
faci
lity
and
refu
rbis
hmen
tofe
xist
ing
build
ings
,and
faci
litie
sm
anag
emen
tand
deliv
ery
ofan
cilla
ryno
n-cl
inic
alse
rvic
eson
the
site
until
Nov
embe
r203
3.Th
ere
deve
lopm
enth
asbe
enco
mpl
eted
inth
ree
stag
es.
Sta
ge1
was
com
plet
edin
Janu
ary
2008
follo
wed
by S
tage
2 in
Feb
ruar
y 20
09.
Con
stru
ctio
n of
Sta
ge 3
was
com
plet
ed o
n 16
Jun
e 20
09.

Hun
ter N
ew E
ngla
nd A
rea
Hea
lth S
ervi
ceN
otes
to a
nd fo
rmin
g pa
rt o
f the
Fin
anci
al S
tate
men
tsfo
r the
Yea
r End
ed 3
0 Ju
ne 2
010
2010
2009
2010
2009
$000
$000
$000
$000
4,63
7
6,
847
Not
late
r tha
n on
e ye
ar4,
637
6,84
7
18
,788
19,7
56
La
ter t
han
one
year
and
not
late
r tha
n fiv
e ye
ars
18,7
88
19
,756
33,9
21
38
,209
Late
r tha
n fiv
e ye
ars
33,9
21
38
,209
57,3
46
64
,812
Tota
l Cap
ital E
xpen
ditu
re C
omm
itmen
ts (i
nclu
ding
GST
) 57
,346
64
,812
26,4
14
29
,341
Not
late
r tha
n on
e ye
ar26
,414
29,3
41
10
7,05
9
106,
895
La
ter t
han
one
year
and
not
late
r tha
n fiv
e ye
ars
107,
059
10
6,89
5
565,
643
59
2,22
0
Late
r tha
n fiv
e ye
ars
565,
643
59
2,22
0
699,
115
72
8,45
6
Tota
l Oth
er E
xpen
ditu
re C
omm
itmen
ts (i
nclu
ding
GST
) 69
9,11
5
72
8,45
6
Tota
l Oth
er C
omm
itmen
ts
Agg
rega
te o
ther
exp
endi
ture
Cal
vary
Mat
er N
ewca
stle
Hos
pita
l Pub
lic, P
rivat
e P
artn
ersh
ip (P
PP
)
37,5
7837
,578
Not
late
r tha
n on
e ye
ar37
,578
37,5
7816
0,67
815
7,75
0La
ter t
han
one
year
and
not
late
r tha
n fiv
e ye
ars
160,
678
157,
750
726,
254
767,
378
Late
r tha
n fiv
e ye
ars
726,
254
767,
378
924,
509
962,
706
Tota
l Oth
er C
omm
itmen
ts (i
nclu
ding
GST
) 92
4,50
996
2,70
6
The
liabi
lity
topa
yN
ovac
are
fort
here
deve
lopm
ento
fthe
Mat
erH
ospi
tali
sba
sed
ona
finan
cing
arra
ngem
enti
nvol
ving
CP
I-lin
ked
finan
cean
dfix
edfin
ance
.A
nin
tere
stra
tead
just
men
tw
illbe
mad
eas
appr
opria
tefo
rth
eC
PI-l
inke
din
tere
stco
mpo
nent
over
the
proj
ectt
erm
.Th
ees
timat
edva
lue
ofth
eco
ntin
gent
liabi
lity
isun
able
tobe
fully
dete
rmin
edbe
caus
eof
unce
rtain
futu
re e
vent
s.
(ii) C
apita
l Com
mitm
ents
– N
ew M
enta
l Hea
lth B
uild
ing
and
Ref
urbi
shed
Bui
ldin
gs
(iii)
Oth
erEx
pend
iture
Com
mitm
ents
–R
edev
elop
men
tofM
ater
Hos
pita
l(w
hich
will
bere
cogn
ised
asa
gran
tafte
rcom
plet
ion
ofco
nstr
uctio
n)an
dpr
ovis
ion
offa
cilit
ies
man
agem
ent a
nd o
ther
non
-clin
ical
ser
vice
s to
bot
h ho
spita
ls.
The
expe
nditu
re c
omm
itmen
ts in
clud
e G
oods
and
Ser
vice
s Ta
x. R
elat
ed in
put t
ax c
redi
ts o
f $84
M (2
009:
$87
M) a
re

Hun
ter N
ew E
ngla
nd A
rea
Hea
lth S
ervi
ceN
otes
to a
nd fo
rmin
g pa
rt o
f the
Fin
anci
al S
tate
men
tsfo
r the
Yea
r End
ed 3
0 Ju
ne 2
010
PAR
ENT
AN
D C
ON
SOLI
DA
TED
30Tr
ust F
unds
Patie
nt T
rust
Ref
unda
ble
Priv
ate
Prac
tice
Tota
lD
epos
itsTr
ust F
unds
2010
2009
2010
2009
2010
2009
2010
2009
$000
$000
$000
$000
$000
$000
$000
$000
Cas
h B
alan
ce a
t the
beg
inni
ngof
the
finan
cial
repo
rting
per
iod
1,31
61,
430
685
442
962
719
2,96
32,
591
Rec
eipt
s37
040
839
81,
131
85,2
0565
,135
85,9
7366
,674
Exp
endi
ture
(529
)(5
22)
(755
)(8
88)
(85,
141)
(64,
892)
(86,
425)
(66,
302)
Cas
h B
alan
ce a
t the
end
of th
e fin
anci
al re
porti
ng p
erio
d1,
157
1,31
632
868
51,
026
962
2,51
12,
963
The
Hea
lthS
ervi
ceho
lds
trust
fund
mon
eys
of$2
.5m
illio
nw
hich
are
used
for
the
safe
keep
ing
ofpa
tient
s'm
onie
s,de
posi
tson
hire
dite
ms
ofeq
uipm
enta
ndP
rivat
eP
ract
ice
Trus
ts.
Thes
em
onie
sar
eex
clud
edfro
mth
efin
anci
alst
atem
ents
asth
eH
ealth
Ser
vice
cann
otus
eth
emfo
rthe
achi
evem
ento
fits
obje
ctiv
es.
The
follo
win
gis
asu
mm
ary
ofth
etra
nsac
tions
in th
e tru
st a
ccou
nt:

Hunter New England Area Health ServiceNotes to and forming part of the Financial Statements
for the Year Ended 30 June 2010
31 Contingent Liabilities
a) Claims on Managed Fund
Since 1 July 1989, the Health Service has been a member of the NSW Treasury ManagedFund. The Fund will pay to or on behalf of the Health Service all sums which it shall becomelegally liable to pay by way of compensation or legal liability if sued except for employmentrelated, discrimination and harassment claims that do not have statewide implications. Thecosts relating to such exceptions are to be absorbed by the Health Service. Open publicliability claims against the Health Service at 30 June 2010 numbered 113 with an estimatevalue of $68m (84 claims with an estimate value of $73m at 30 June 2009). As such, since 1July 1989, apart from the exceptions noted above no contingent liabilities exist in respect ofliability claims against the Health Service. A Solvency Fund (now called Pre-Managed FundReserve ) was established to deal with the insurance matters incurred before 1 July 1989 thatwere above the limit of insurance held or for matters that were incurred prior to 1 July 1989that would have become verdicts against the State. That Solvency Fund will likewise respondto all claims against the Health Service.
b) Workers Compensation Hindsight Adjustment
Treasury Managed Fund normally calculates hindsight premiums each year. However, inregard to workers compensation the final hindsight adjustment for the 2003/04 fund year andan interim adjustment for the 2005/06 fund year were not calculated until 2009/10. As a result,the 2004/05 final and 2006/07 interim hindsight calculations will be paid in 2010/11.
It is not possible for the Health Service to reliably quantify the benefit to be received.
c) Affiliated Health Organisations
Based on the definition of control in Australian Accounting Standard AASB127, Consolidated and Separate Financial Statements , Affiliated Health Organisations listed in Schedule 3 of theHealth Services Act, 1997 are only recognised in the Health Service's consolidated financialstatements to the extent of cash payments made.
However, it is accepted that a contingent liability exists which may be realised in the event ofcessation of health service activities by any Affiliated Health Organisation. In this event thedetermination of assets and liabilities would be dependent on any contractual relationshipwhich may exist or be formulated between the administering bodies of the organisation, theHealth Service and the NSW Department of Health.
d) Contingent Liabilities include Bank Guarantee - Fisher & Paykel Australia for sublease ofBelford Place Cardiff, $126k.
PARENT AND CONSOLIDATED

Hun
ter N
ew E
ngla
nd A
rea
Hea
lth S
ervi
ceN
otes
to a
nd fo
rmin
g pa
rt o
f the
Fin
anci
al S
tate
men
tsfo
r the
Yea
r End
ed 3
0 Ju
ne 2
010
PAR
ENT
CO
NSO
LID
ATI
ON
2010
2009
2010
2009
$000
$000
$000
$000
32.
Rec
onci
liatio
n of
Net
Cas
h Fl
ows
from
Ope
ratin
g A
ctiv
ities
to N
et C
ost o
f Ser
vice
s
74,9
5110
5,90
0N
et C
ash
Flow
s fro
m O
pera
ting
Act
iviti
es
74,9
5110
5,90
0(6
1,09
8)(5
6,37
8)D
epre
ciat
ion
(6
1,09
8)(5
6,37
8)(2
,199
)30
0A
llow
ance
for I
mpa
irmen
t(2
,199
)30
0-
-
A
ccep
tanc
e by
the
Cro
wn
Ent
ity o
f Em
ploy
ee S
uper
annu
atio
n B
enef
its(1
9,84
9)(1
9,66
7)(4
2,30
5)(4
7,93
5)D
ecre
ase/
(Incr
ease
) in
Pro
visi
ons
(42,
305)
(47,
935)
9,73
9(5
,507
)In
crea
se /
(Dec
reas
e) in
Pre
paym
ents
and
Oth
er A
sset
s9,
739
(5,5
07)
5,06
7(4
8,05
8)(In
crea
se)/
Dec
reas
e in
Cre
dito
rs
5,06
7(4
8,05
8)(1
,572
)(2
80)
Net
Gai
n/ (L
oss)
on
Sal
e of
Pro
perty
, Pla
nt a
nd E
quip
men
t(1
,572
)(2
80)
(1,3
62,7
55)
(1,2
91,0
14)
NS
W H
ealth
Dep
artm
ent R
ecur
rent
Allo
catio
ns(1
,362
,755
)(1
,291
,014
)(3
8,71
5)(4
7,60
6)N
SW
Hea
lth D
epar
tmen
t Cap
ital A
lloca
tions
(38,
715)
(47,
606)
Ass
et S
ale
Pro
ceed
s Tr
ansf
erre
d to
the
NS
W-
-
D
epar
tmen
t of H
ealth
-
-
-
-
C
ash
Rei
mbu
rsem
ents
from
the
Gov
ernm
ent
-
-
(1,4
18,8
87)
(1,3
90,5
78)
Net
Cos
t of S
ervi
ces
(1,4
38,7
36)
(1,4
10,2
45)
33.
Non
-Cas
h Fi
nanc
ing
and
Inve
stin
g A
ctiv
ities
5,41
43,
404
Ass
ets
Rec
eive
d by
Don
atio
n5,
414
3,40
4
5,41
43,
404
5,41
43,
404
34.
2009
/10
Volu
ntar
y Se
rvic
es
P
ract
ical
Sup
port
to P
atie
nts
and
Rel
ativ
eC
ouns
ellin
g, H
ealth
Edu
catio
n, T
rans
port,
H
ome
Hel
p &
Pat
ient
Act
iviti
es
. P
atie
nt S
uppo
rt G
roup
s -
. C
omm
unity
Org
anis
atio
ns -
It is
con
side
red
impr
actic
able
to q
uant
ify th
e m
onet
ary
valu
e of
vol
unta
ry s
ervi
ces
prov
ided
to th
e H
ealth
Ser
vice
. S
ervi
ces
prov
ided
incl
ude:
. C
hapl
ainc
ies
and
Pas
tora
l Car
e -
.
Pin
k La
dies
/Hos
pita
l Aux
iliar
ies
-
Pat
ient
& F
amily
Sup
port
Pat
ient
Ser
vice
s, F
und
Rai
sing

Hunter New England Area Health ServiceNotes to and forming part of the Financial Statements
for the Year Ended 30 June 2010
PARENT AND CONSOLIDATED
35 Unclaimed Moneys
36 Budget Review - Parent and Consolidated
Net Cost of Services
Result for the Year
Assets and Liabilities
Cash FlowsCash flow was favourable to budget by $6.4m due to higher than anticipated receipts offset by additionalcapital expenditure.
Movements in the level of the NSW Department of Health Recurrent Allocation that have occurred since thetime of the initial allocation on 1st July 2009 are as follows:
Unclaimed salaries and wages are paid to the credit of the NSW Treasury in accordance with the provisions ofthe Industrial Relations Act,1996.
All money and personal effects of patients which are left in the custody of Health Services by any patient whois discharged or dies in the hospital and which are not claimed by the person lawfully entitled thereto within aperiod of twelve months are recognised as the property of health services.
All such money and the proceeds of the realisation of any personal effects are lodged to the credit of theSamaritan Fund which is used specifically for the benefit of necessitous patients or necessitous outgoingpatients.
The actual Net Cost of Services was favourable to budget by $(13.28)M. This was primarily due to higher thanbudgeted income from infrastructure fees and User Charge income for Pathology North, lower than budgetedGoods and Services and Employee Related costs, partially offset by unfavourability in VMO and RMR costs.
Current Assets were higher than budget by $(8.04)m due to higher than budgeted Cash at Bank balance(including cash investments)
Non Current Assets were higher than budget by $(85.40)m due to asset revaluations.
Current Liabilities were higher than budget by $(10.66)m due to higher than budgeted salaries and wagesaccrual.
Non Current Liabilities are favourable to budget by $(12.76)m due to repayment of loans.
The actual result for the year was $(11.70)m favourable. The result for the year was due to favourable NetCost of Services of $(13.28)m as detailed above, and unfavourable Government Contributions of $(1.58)m.

Hunter New England Area Health ServiceNotes to and forming part of the Financial Statements
for the Year Ended 30 June 2010
PARENT AND CONSOLIDATED '$000
Initial Allocation 1,189,247
Award Increases (Including Special Project Award Increases) 39,582
Special Projects: -Aboriginal Health 1,331Drug and Alcohol 2,453IDNS 333Other 446 4,563
Other: -Interstate Area Patient Flows 56,875Mater PPP 24,205Mental Health 6,940Planned Surgery 4,837Keep Them Safe 3,309TMF 2,814Calvary Mater Newcastle PET / Linear Accelerator 2,799Nurse Midwife Strategy 2,690Caring Together Initiatives 2,504VMO 2,353Pathology North - Capital 1,842COAG National Partnerships Sub Acute Reform 1,700Severe Chronic Disease-Connected Care 1,406Building Strong Foundations 1,382MAA 1,000Renal Services 950Internventional Cardiology Services 900SASS/SSS Superannuation Adjustment 817Regional Medical Retrieval Services 810Organ & Tissue Donation 661Emergency Department Equipment 6352009_10 Compacks Funding 579Sustained Home Health Visiting Pilot 434Child Health Networks 353Obesity funding 345NSW GP Procedural Training 329Other 5,894 129,363
Balance as per Statement of Comprehensive Income 1,362,755

Hun
ter N
ew E
ngla
nd A
rea
Hea
lth S
ervi
ceN
otes
to a
nd fo
rmin
g pa
rt of
the
Fina
ncia
l Sta
tem
ents
for t
he Y
ear E
nded
30
June
201
0
37In
crea
se/(D
ecre
ase)
in N
et A
sset
s fr
om E
quity
Tra
nsfe
rs
$000
Ass
ets
Inve
ntor
ies
(1,1
89)
Pla
nt &
Equ
ipm
ent
(537
)
Liab
ilitie
sE
mpl
oyee
Lea
ve P
rovi
sion
s U
plift
Fac
tor
2,00
7
Incr
ease
/(Dec
reas
e) in
Net
Ass
ets
From
Equ
ity T
rans
fers
281
Net
asse
tsof
$0.5
Mill
ion
wer
etra
nsfe
rred
from
Hun
ter
New
Eng
land
Are
aH
ealth
Ser
vice
with
effe
ctfro
m1s
tN
ov20
09fro
mw
hich
time
Hea
lthS
uppo
rtS
ervi
ces
assu
med
resp
onsi
bilit
yfo
rth
epr
ovis
ion
ofP
atie
ntS
uppo
rtS
ervi
ces.
Ass
ets
and
liabi
litie
stra
nsfe
rred
are
asfo
llow
s:

Hunter New England Area Health ServiceNotes to and forming part of the Financial Statements
for the Year Ended 30 June 2010
Note 38 Financial Instruments
(a) Financial Instrument Categories
PARENT AND CONSOLIDATED
Carrying CarryingClass: Amount Amount
2010 2009$000 $000
Financial Assets
Cash and Cash Equivalents (note 18) 117,861 108,153
Receivables (note 19)1 Loans and receivables 31,635 32,066 (at amortised cost)
Other Financial Assets (note 21) Loans and receivables 13,384 15,454 (at amortised cost)
Total Financial Assets 162,880 155,673
Financial Liabilities
Borrowings (note 26) 168,675 159,248 Payables (note 25)2 92,152 99,355
Total Financial Liabilities 260,827 258,603
Notes12 Excludes statutory payables and unearned revenue (ie not within scope of AASB 7)
The Health Service's principal financial instruments are outlined below. These financial instruments arisedirectly from the Health Service's operations or are required to finance its operations. The Health Service doesnot enter into or trade financial instruments, including derivative financial instruments, for speculativepurposes.
The Health Service's main risks arising from financial instruments are outlined below, together with the HealthService's objectives, policies and processes for measuring and managing risk. Further quantitative andqualitative disclosures are included throughout these financial statements.
The Chief Executive has overall responsibility for the establishment and oversight of risk management andreviews and agrees policies for managing each of these risks. Risk management policies are established toidentify and analyse the risk faced by the Health Service, to set risk limits and controls and monitor risks.Compliance with policies is reviewed by the Audit Committee/internal auditors on a continuous basis.
Excludes statutory receivables and prepayments (ie not within scope of AASB 7)
Category
N/A
Financial liabilities measured at amortised cost
Hunter New England Area Health ServiceNotes to and forming part of the Financial Statements
for the Year Ended 30 June 2010
(b) Credit Risk
Cash
Receivables - trade debtors
All trade debtors are recognised as amounts receivable at balance date. Collectability of trade debtors isreviewed on an ongoing basis. Procedures as established in the NSW Department of Health. AccountingManual and Fee Procedures Manual are followed to recover outstanding amounts, including letters ofdemand. Debts which are known to be uncollectable are written off. An allowance for impairment is raisedwhen there is objective evidence that the Health Service will not be able to collect all amounts due. Thisevidence includes past experience and current and expected changes in economic conditions and debtorcredit ratings. No interest is earned on trade debtors.
Cash comprises cash on hand and bank balances deposited in accordance with Public Authorities (FinancialArrangements) Act approvals. Interest is earned on daily bank balances at rates of approximately 3.9% in2009/10 compared to 4.84% in the previous year.
Credit risk arises when there is the possibility of the Health Service's debtors defaulting on their contractualobligations, resulting in a financial loss to the Health Service. The maximum exposure to credit risk isgenerally represented by the carrying amount of the financial assets (net of any allowance for impairment).
Credit risk arises from financial assets of the Health Service, including cash, receivables and authoritydeposits. No collateral is held by the Health Service. The Health Service has not granted any financialguarantees.
Credit risk associated with the Health Services's financial assets, other than receivables, is managed throughthe selection of counterparties and establishment of minimum credit rating standards. Authority deposits heldwith NSW TCorp are guaranteed by the State.
The Health Service is not materially exposed to concentrations of credit risk to a single trade debtor or groupof debtors. Of the total trade debtors balance at year-end, $25.875M ($2009: $24.825M) related to debtorsthat were not past due and not considered impaired and debtors of $5.760M (2009: $7.235M) were past duebut not considered impaired. Together these represent 91.8% (2009: 98.1%) of total trade debtors. Increase inprovision from $0.620M in 0809 to $2.819M in 0910 was due to several one off items of both contractualobligations and patient fees. The Receivables include Patient Fees Compensables which are frequently notsettled within 6 months of the date of the service provision due to the length of time it takes to settle legalclaims. Most of the Health Services' debtors are Health Insurance Companies or Compensation Insurerssettling claims in respect of inpatient treatments. There are no debtors which are currently not past due orimpaired whose terms have been renegotiated.
Financial assets that are past due or impaired could be either 'sales of goods and services' or ‘other debtors’in the ‘receivables’ category of the Statement of Financial Position. Patient Fees Ineligibles may represent themajority of financial assets that are past due or impaired.

Hunter New England Area Health ServiceNotes to and forming part of the Financial Statements
for the Year Ended 30 June 2010
$0002010 Total 1,2
<3 months overdue 4479 2832 16473 months - 6 months overdue 762 621 141> 6 months overdue 3338 2307 10312009<3 months overdue 4116 3938 1783 months - 6 months overdue 1014 969 45> 6 months overdue 2725 2328 397Notes
(c) Liquidity Risk
The liabilities are recognised for amounts due to be paid in the future for goods or services received, whetheror not invoiced. Amounts owing to suppliers (which are unsecured) are settled in accordance with the policyset by the NSW Department of Health. If trade terms are not specified, payment is made no later than the endof the month following the month in which an invoice or a statement is received.
In those instances where settlement cannot be effected in accordance with the above, eg due to short termliquidity constraints, terms of payment are negotiated with creditors.
Past due but not impaired 1,2 Considered impaired 1,2
The table below summarises the maturity profile of the Health Service's financial liabilities together with theinterest rate exposure.
1 Each column in the table reports "gross receivables".
Liquidity risk is the risk that the Health Service will be unable to meet its payment obligations when they falldue. The Health Service continuously manages risk through monitoring future cash flows and maturitiesplanning to ensure adequate holding of high quality liquid assets. The objective is to maintain a balancebetween continuity of funding and flexibility through effective management of cash, investments and liquidassets and liabilities.
The Health Service has negotiated no loan outside of arrangements with the NSW Department of Health orthe Sustainable Energy Development Authority.
During the current and prior years, there were no defaults or breaches on any loans payable. No assets havebeen pledged as collateral. The Health Service's exposure to liquidity risk is considered significant. However,the risk is minimised as the NSW Department of Health has indicated its ongoing financial support for theHunter New England Area Health Service (refer Note 2).
2 The ageing analysis excludes statutory receivables, as these are not within the scope of AASB 7 andexcludes receivables that are not past due and not impaired. Therefore, the "total" will not reconcile to thereceivables total recognised in the statement of financial position.

Hun
ter N
ew E
ngla
nd A
rea
Hea
lth S
ervi
ceN
otes
to a
nd fo
rmin
g pa
rt of
the
Fina
ncia
l Sta
tem
ents
for t
he Y
ear E
nded
30
June
201
0
Mat
urity
Ana
lysi
s an
d in
tere
st r
ate
expo
sure
of f
inan
cial
liab
ilitie
s
$'00
0
Wei
ghte
d A
vera
ge
Effe
ctiv
e In
t. R
ate
Nom
inal
A
mou
nt 1
Fixe
d In
tere
st
Rat
e
Varia
ble
Inte
rest
R
ate
Non
- In
tere
st
Bea
ring
< 1
Yr1-
5 Yr
> 5Y
r
%$0
00$0
00$0
00$0
00$0
00$0
00$0
0020
10P
ayab
les:
Acc
rued
Sal
arie
s
Wag
es, O
n-C
osts
and
Pay
roll
Ded
uctio
ns20
,146
20
,146
20,1
46
C
redi
tors
72,0
06
72,0
06
72
,006
Bor
row
ings
:N
on In
tere
st L
oans
Intra
Hea
lth15
,904
15
,904
5,89
5
7,68
4
2,32
5
Oth
er L
oans
and
dep
osits
8%15
2,77
115
2,77
1
5,93
4
31,6
64
11
5,17
3
260,
827
-
152,
771
10
8,05
6
103,
981
39,3
48
11
7,49
8
2009
Pay
able
s:A
ccru
ed S
alar
ies
W
ages
, On-
Cos
ts a
nd P
ayro
ll D
educ
tions
32,3
58
32,3
58
32
,358
Cre
dito
rs66
,997
66
,997
66,9
97
B
orro
win
gs:
Non
-Inte
rest
Loa
ns5,
213
5,21
3
1,
815
3,
398
O
ther
Loa
ns a
nd d
epos
its8%
154,
035
154,
035
1,
264
28
,272
124,
499
25
8,60
3-
15
4,03
5
104,
568
10
2,43
4
31
,670
124,
499
N
otes
:
2.O
fthe
$152
.8M
disc
lose
din
the
2010
'oth
erlo
ans
and
depo
sits
'tim
eba
nd1-
5yr
s,th
eH
ealth
Ser
vice
has
noin
tent
toef
fect
paym
ents
inad
vanc
eof
mat
urity
date
son
orpr
ior t
o 30
Sep
tem
ber 2
010.
Hea
lth S
ervi
ce c
an b
e re
quire
d to
pay
. The
tabl
es in
clud
e bo
th in
tere
st a
nd p
rinci
pal c
ash
flow
s an
d th
eref
ore
will
not
reco
ncile
to th
e S
tate
men
t Of F
inan
cial
Pos
ition
.
Inte
rest
Rat
e Ex
posu
re
Mat
urity
Dat
es
1 Th
e am
ount
s di
sclo
sed
are
the
cont
ract
ual u
ndis
coun
ted
cash
flow
s of
eac
h cl
ass
of fi
nanc
ial l
iabi
litie
s ba
sed
on th
e ea
rlies
t dat
e on
whi
ch th
e

Hunter New England Area Health ServiceNotes to and forming part of the Financial Statements
for the Year Ended 30 June 2010d) Market Risk
Interest rate risk
$'000
Profit Equity Profit Equity2010Financial Assets
Cash and Cash Equivalents 117,861 (1,179) (1,179) 1,179 1,179
Other Financial Assets 13,384 - - - -
Financial Liabilities
Borrowings;Non Interest Loans Intra Health 15,904 - - - - Other Loans and deposits 152,771 (1,528) (1,528) 1,528 1,528
2009Financial Assets
Cash and Cash Equivalents 108,153 (1,082) (1,082) 1,082 1,082
Other Financial Assets 15,454 - - - -
Financial Liabilities
Borrowings;Non Interest Loans Intra Health 5,213 - - - - Other Loans and deposits 154,035 (1,540) (1,540) 1,540 1,540
+1%-1%Carrying Amount
Market risk is the risk that the fair value of future cash flows of a financial instrument will fluctuatebecause of changes in market prices. The Health Service's exposures to market risk are primarilythrough interest rate risk on the Health Service's borrowings and other price risks associated with themovement in the unit price of the Hour-Glass Investment facilities. The Health Service has no exposureto foreign currency risk and does not enter into commodity contracts.
The effect on profit and equity due to a reasonably possible change in risk variable is outlined in theinformation below, for interest rate risk and other price risk. A reasonably possible change in riskvariable has been determined after taking into account the economic environment in which the HealthService operates and the time frame for the assessment (i.e. until the end of the next annual reportingperiod). The sensitivity analysis is based on risk exposures in existence at the Statement of FinancialPosition date. The analysis is performed on the same basis for 2009. The analysis assumes that allother variables remain constant.
Exposure to interest rate risk arises primarily through the Health Service's interest bearing liabilities.
However, Health Services are not permitted to borrow external to the NSW Department of Health (Loanswhich are negotiated through Treasury excepted). Both NSW Treasury and NSW Department of Healthloans are set at fixed rates and therefore are generally not affected by fluctuations in market rates. TheHealth Service does not account for any fixed rate financial instruments at fair value through profit orloss or as available-for-sale. Therefore, for these financial instruments, a change of interest rates wouldnot affect profit or loss or equity. A reasonably possible change of +/-1% is used consistent with currenttrends in interest rates. The basis will be reviewed annually and amended where there is a structuralchange in the level of interest rate volatility. The Health Service's exposure to interest rate risk is set outbelow.

Hunter New England Area Health ServiceNotes to and forming part of the Financial Statements
for the Year Ended 30 June 2010
Note 39 Post Balance Date Events
END OF AUDITED FINANCIAL STATEMENTS
On 20 April 2010 the State of NSW and the Commonwealth agreed on national health reforms toestablish Local Health Networks in NSW and to introduce national standards for timely access toemergency care and elective surgery.
Under the Agreement, NSW will remain responsible for system-wide planning, performance andpurchasing of public hospital services and supporting the transition process for the Commonwealth toassume full funding and policy responsibility for general practice, primary health care and the nationalaged care system.
This agreement will result in structural and corporate changes including the establishment of these LocalHealth Networks in 2010-11. A professional Governing Council will be constituted for each Local HealthNetwork. It is expected that these reforms will significantly change this reporting entity.