© hawkins. projected temperature changes virtually all climate simulations project warming, but...
TRANSCRIPT

© Hawkins

PROJECTED TEMPERATURE CHANGES
Virtually all climate simulations project warming, but with a wide envelope of temperature change Virtually all climate simulations project warming, but with a wide envelope of temperature change
5th IPCC GCMs project +4-6°F warming by 2060, under mid and high emissions
31 GCMs X 2 RCP Emissions Scenarios IPCC 5th Assessment (CMIP5) models
Which emissions pathway will we take?Which emissions pathway will we take?
Stewart et al., 2005
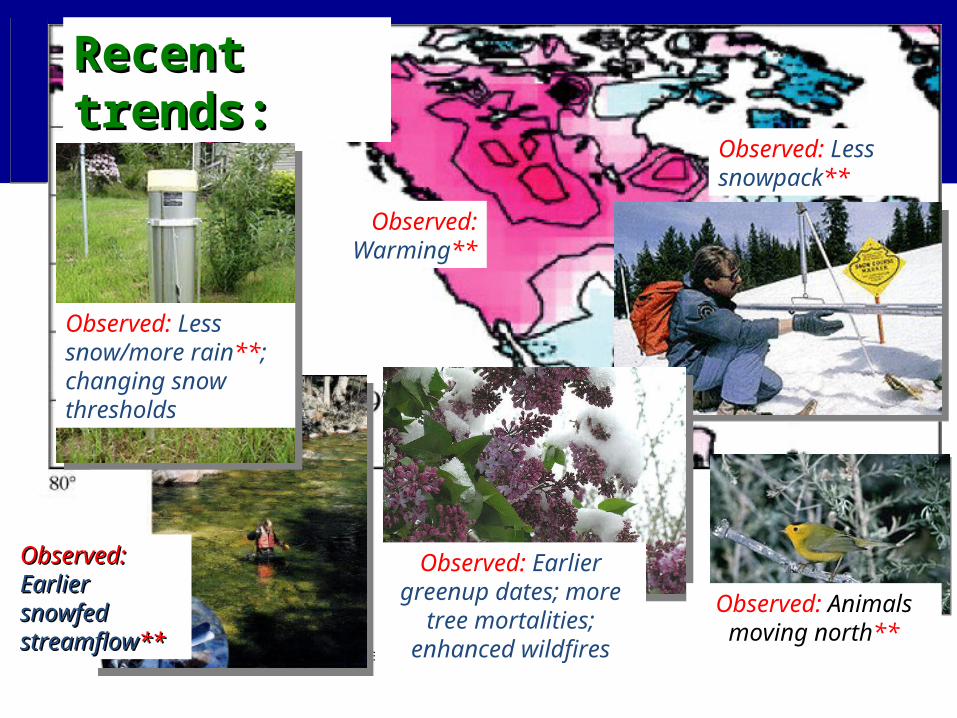
Recent Recent trends:trends:
Observed: Warming**
Observed: Less snowpack**
Observed: Less snow/more rain**; changing snow thresholds
Observed: Earliergreenup dates; more
tree mortalities; enhanced wildfires
Observed: Animals moving north**
Observed:Observed: Earlier Earlier snowfed snowfed streamflowstreamflow****
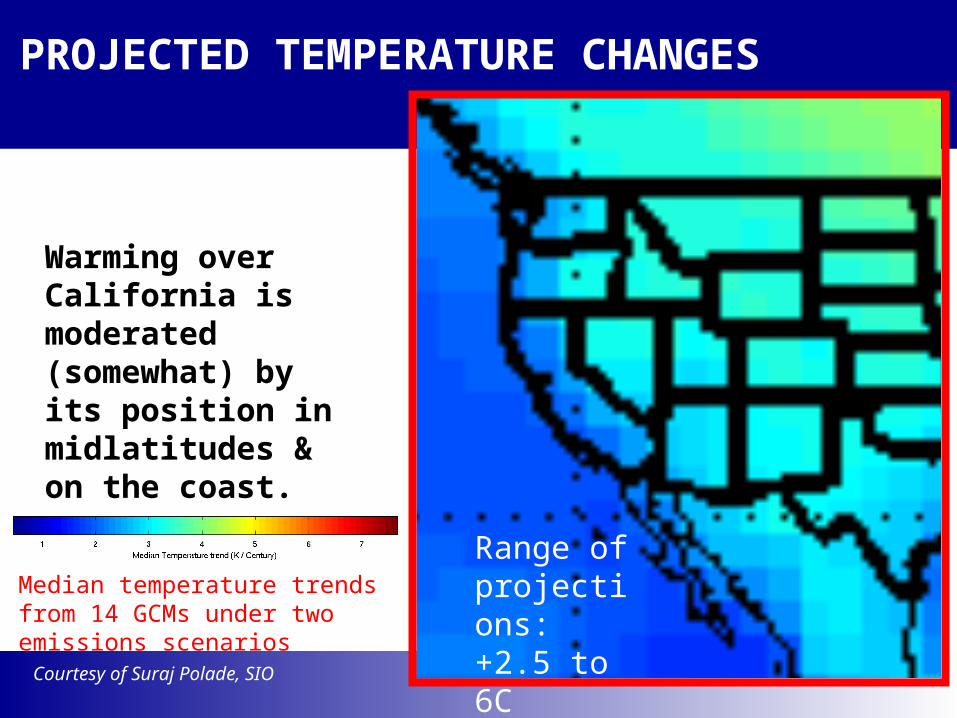
PROJECTED TEMPERATURE CHANGES
Median temperature trends from 14 GCMs under two emissions scenarios
Warming over California is moderated (somewhat) by its position in midlatitudes & on the coast.
Courtesy of Suraj Polade, SIO
Range of projections: +2.5 to 6C

PROJECTED PRECIPITATION CHANGES
Climate projections disagree as to wetter vs drier overall; projected changes stay within natural range of variability
Climate projections disagree as to wetter vs drier overall; projected changes stay within natural range of variability
5th IPCC GCMs project large precipitation volatility but modest avg change (maybe drier)
31 GCMs X 2 RCP Emissions Scenarios IPCC 5th Assessment (CMIP5) models
Are there other changes lurking below weak annual-avg trends?
Are there other changes lurking below weak annual-avg trends?

All Drier All Wetter
Among 12 projections with high-CO2 emissions, how many models yield increasing (decreasing) precipitation?
PROJECTED PRECIPITATION CHANGES
Northern California still on the edge between more-or-less precipitation.
Percentage Change from Historical Normals

Knowles and Cayan, 2002, Geophysical Research Letters.
Under recent scenarios, Sierra Nevada loses half of its spring (April 1) snow pack due to climate warming. This is an amount similar to the total free-board space set aside each winter for flood control in the Sierra Nevada.
Under recent scenarios, Sierra Nevada loses half of its spring (April 1) snow pack due to climate warming. This is an amount similar to the total free-board space set aside each winter for flood control in the Sierra Nevada.
LOSS OF SPRINGTIME SNOWPACK

How well do you even remember what a cool year is like?
Its been more than 35 yrs since the State of California experienced a year in its historical coolest quartile!
How well do you even remember what a cool year is like?
Its been more than 35 yrs since the State of California experienced a year in its historical coolest quartile!
OBSERVED LOSS OF COOL YEARS

….and, chances of historical 10th percentile or less SWE increase greatly
40%
PROJECTED SNOW-WATER CHANGES
During 21st Century, a marked decline of chances of reaching or exceeding historical median SWE
in Sierra Nevada is projected
10%

Drier Summer Landscapes
increased warming and diminished snow
causes successively greater soil drying during 21st Century
(this picture could change somewhat under more recent IPCC5 simulations)
Drier Summer Landscapes
increased warming and diminished snow
causes successively greater soil drying during 21st Century
(this picture could change somewhat under more recent IPCC5 simulations)
early 21st
middle 21st
late 21st
Cayan et al. 2013, Ch 6 Southwest Climate Assessment
PROJECTED SOIL MOISTURE (JUNE)

National Climate Assessment, 2013, Ch. 2
Projected changes in 99-percentile daily precipitation
Daily Extremes
PROJECTED CHANGES IN HEAVY PRECIPITATION

Dettinger and Cayan 2014, San Francisco Estuary and Watershed Science; Dettinger, in review, WRR
Historically, a few large storms (or their absence) account for most of Ca’s yr-to-yr precipitation variation.Historically, a few large storms (or their absence) account for most of Ca’s yr-to-yr precipitation variation.
5yr smoother
LARGE STORM CONTRIBUTIONLARGE STORM CONTRIBUTION
Light-to-mid storms
OBSERVED & PROJECTED ROLES OF LARGEST STORMS IN CALIFORNIA WET-DRY TRENDS
In some models, big storms get much bigger and total precipitation increases.
In all models, contributions from small-to-normal storms get smaller.
In models where big storms don’t change as much, precip stays the same or declines.

Cayan et al., Southwest Climate Assessment, 2013
16 models, A2 emissions
Northern Sierra Nevada
Median of A2 emissionsMedian of B1 emissions
Center of sliding 50-yr window
Per
cen
tag
e o
f hi
stor
ical
50-
yr f
lood
Das et al., ClimChg, 2012; JH, 2013
PROJECTED STREAMFLOW CHANGES
Distributions of 50-yr flood changes

Projected Changes in Colorado River Precip & Soil Moisture
Cayan et al., PNAS, 2010
Historical
Future

PROJECTED CHANGES IN DROUGHT RISKS
DROUGHTS > 11 yr
DROUGHTS > 35 yr
Ault et al., 2014, J. Climate
Increasing greenhouse gases
Based on projections from 27 CMIP5 GCMs

•Expect climate change; expect warming.
•Most of California may get more OR less precipitation overall (but expect southern California to get drier).
•Expect more dry days and more extreme large storms.
•Expect heat and precipitation change to produce wilder dry (and wet) spells in terms of runoff and recharge.
KEY POINTS
