discovery.dundee.ac.uk€¦ · iii certificate this is to certify that ms maziah mohammad has done...
TRANSCRIPT
University of Dundee
DOCTOR OF PHILOSOPHY
Development of foamed concrete
enabling and supporting design
Mohammad, Maziah
Award date:2011
Awarding institution:University of Dundee
Link to publication
General rightsCopyright and moral rights for the publications made accessible in the public portal are retained by the authors and/or other copyright ownersand it is a condition of accessing publications that users recognise and abide by the legal requirements associated with these rights.
• Users may download and print one copy of any publication from the public portal for the purpose of private study or research. • You may not further distribute the material or use it for any profit-making activity or commercial gain • You may freely distribute the URL identifying the publication in the public portal
Take down policyIf you believe that this document breaches copyright please contact us providing details, and we will remove access to the work immediatelyand investigate your claim.
Download date: 16. Sep. 2018
DOCTOR OF PHILOSOPHY
Development of foamed concreteenabling and supporting design
Maziah Mohammad
2011
University of Dundee
Conditions for Use and DuplicationCopyright of this work belongs to the author unless otherwise identified in the body of the thesis. It is permittedto use and duplicate this work only for personal and non-commercial research, study or criticism/review. Youmust obtain prior written consent from the author for any other use. Any quotation from this thesis must beacknowledged using the normal academic conventions. It is not permitted to supply the whole or part of thisthesis to any other person or to post the same on any website or other online location without the prior writtenconsent of the author. Contact the Discovery team ([email protected]) with any queries about the useor acknowledgement of this work.
i
DEVELOPMENT OF FOAMED CONCRETE:
ENABLING AND SUPPORTING DESIGN
Maziah Mohammad, MSc
A thesis presented in application for the Degree of Doctor of Philosophy
Division of Civil Engineering
University of Dundee
December 2011

ii
DECLARATION
I hereby declare that I am the author of this thesis, that the work recorded has been
composed by me, all references cited have been consulted, and that it was not been
previously used for a higher degree.
Ms. Maziah Mohammad
iii
CERTIFICATE
This is to certify that Ms Maziah Mohammad has done her research under my
supervision, and that she has fulfilled the conditions of Ordinance 14 of the University of
Dundee, so that she is qualified to submit the following Thesis in application for the
degree of Doctor of Philosophy.
Prof. M R Jones CEng, MICE
Dean
School of Engineering,
Physics and Mathematics
University of Dundee
Dundee DD1 4HN

iv
ACKNOWLEDGEMENTS
First of all, I thank God for giving me strength and ability to complete this study.
I would give particular mention to some people who had helped and supported me
throughout and made it possible to write this doctoral thesis.
My utmost appreciation goes to my supervisor, Prof. Rod Jones for making it possible to
write this thesis. His continuous supervision, advice, encouragement and constant
support during all stages of my research had made it possible to complete this research
study.
I am also indebted to the technical support from the staff of the Division of Civil
Engineering who had helped me with my research in the laboratory. It is a pleasure to
mention the Technical Manager, Mr Ernie Kuperus, and all other members – Doug, Chris,
Charlie, Dave, John, Alex and others who made laboratory work so enjoyable.
This thesis would not have been possible without the help, never-ending support and
great patience of Dr. Kathleen McMillan, Dr. Keith McMillan and Mr. Derek McMillan
who contributed their time in proof-reading and supporting the completion of this Thesis.
I am extremely grateful and can never thank enough.
The informal support and encouragement of many friends has been indispensable, and I
would like particularly to acknowledge the contribution of Dr. Amarnath Yerramala,
Dr. David Dunne, Kirsty Buss and other fellow concrete researchers from all levels and
different countries; and my Malaysian and Indonesian friends who were my families in
Dundee, particularly, Azline and Zahiruddin who share the ups and down of doing
research in concrete.
My thanks and appreciation to the Public Service Department, Malaysia who provided
my scholarship and the Public Works Department, Malaysia who gave me the
opportunities to pursue this degree. Thanks to Universiti Kebangsaan Malaysia for
facilitating me in the early part of my research.
Above all, I would like to thank my families, especially my mother, Maimunah, and my
three lovely boys, Bakri Hafiz, Fikri and Muhamad Irfan, who have given me their
unequivocal love and support throughout. It was my late father, Mohammad, who
instilled in me self-confidence that brought me to where I am today.
This thesis is dedicated to the memory of my elder sister, Mastura, who listened to my
cries and never failed to advise and encourage me to complete this Thesis and who sadly
died before the work was completed. I miss her dearly.
v
ABSTRACT
Foamed concrete has considerable potential as a material for use in the construction industry.
However, although some researches have been conducted on the characteristics of foamed
concrete, thus far, knowledge on the behaviour of foamed concrete has been limited. Hence,
predictions of the stability of foamed concrete under different conditions and mix constituents
have been uncertain. The aim of the presented study is to investigate causes of instability of
foamed concrete by examining its rheological properties and microstructure. This study
explores the complex causes of instability in foamed concrete by examining the rheological
parameters, the yield stress and the plastic viscosity, since the rheological properties affect the
hardened state. Using flowability as a guide, the relationships are examined between yield
stress and viscosity, specifically with reference to their effect on density and w/c ratio. Other
factors affecting the rheological properties related to the proportions and fineness of the mix
constituents are also considered.
Thereafter, the microstructure of foamed concrete is examined to establish links with the
rheological values and the relationship with stability. The microstructure, best described by
the bubble sizes, has been found to be a function of yield stress, plastic viscosity, material
fineness and surfactant types. The bubble diameters have been shown to range between 0.1 to
0.5 mm. Bubbles less than 0.35 mm in diameter correspond to stable mix with a drop in level
of less than 5% in height in densities of 1000 kg/m3 and higher. The big bubbles link to
unstable mixes and have been found to be a source of instability. Other chemical additions
were shown to result in disintegration of bubbles.
As this study unfolds, a relationship is established between bubbles and the yield stress
values. Bubble sizes reduced when the yield stress increased. For flowability out of Marsh
cone test taken between 1 to 2 minutes, the corresponding yield stress was between 6.0 N/m2
to 8.5 N/m2. For this range, the empirical bubble sizes were found to be between 0.33 to 0.35
mm in diameter.
In examining the possible causes of instability, it was found that stability improved markedly
with increase in density and lesser effect by other factors such as w/c ratio, constituent
materials and specimen height. However, the rate of hardening was a dominant factor in
stability as evidenced by the use of Calcium Sulfoaluminate cement, CSA and CEM I 52.5R
cement which increased the setting times. Stability was drastically achieved even at lower
density 300 kg/m3. Blends of CSA with CEM I 52.5R and fine fly ash, FAf, demonstrated
similar results.
This research has implications for the development of foamed concrete as a material that could
be more widely used in certain construction contexts where stability in lightweight density
foamed concrete is crucial. It has contributed to better understanding of the rheological
properties and the effect on the microstructure, even though the results are based on empirical
values. Hence, it is anticipated that the prediction of stability can be made through a selection
of materials and proportions to suit different contexts and their requirements.
vi
CONTENTS
DECLARATION................................................................................................................ii
CERTIFICATE...................................................................................................................iii
ACKNOWLEDGEMENTS..............................................................................................iv
ABSTRACT.........................................................................................................................v
LIST OF TABLES...............................................................................................................x
LIST OF FIGURES............................................................................................................xi
CHAPTER 1: INTRODUCTION ..................................................................................... 1
1.1 BACKGROUND ............................................................................................................................. 1
1.2 OVERALL AIMS AND OBJECTIVES ......................................................................................... 6
1.3 SCOPE OF RESEARCH................................................................................................................. 6
1.3 OUTLINE OF THE THESIS .......................................................................................................... 7
CHAPTER 2: LITERATURE REVIEW ........................................................................... 9
2.1 INTRODUCTION .......................................................................................................................... 9
2.2 DEFINITION ................................................................................................................................ 10
2.3 SPECIFICATIONS ....................................................................................................................... 13
2.4 CONSTITUENT MATERIALS ................................................................................................... 14
2.4.1 Cement .............................................................................................................................. 14
2.4.2 Water ................................................................................................................................. 17
2.4.3 Fillers ................................................................................................................................. 18
2.4.4 Foam .................................................................................................................................. 19
2.5 MIX PROPORTIONS ................................................................................................................... 25
2.6 MIXING PROCESS ...................................................................................................................... 26
2.7 CURING ........................................................................................................................................ 27
2.8 DENSITY ....................................................................................................................................... 28
2.9 PROPERTIES OF FOAMED CONCRETE ................................................................................ 30
2.9.1 Fresh State Properties ..................................................................................................... 30
2.9.2 Hardened State Properties ............................................................................................. 38
2.10 SUMMARY OF THE LITERATURE .......................................................................................... 54

vii
CHAPTER 3: EXPERIMENTAL PROGRAMME: MATERIALS AND TEST
METHODS ............................................................................................... 55
3.1 INTRODUCTION ........................................................................................................................ 55
3.2 EXPERIMENTAL PROGRAMME ............................................................................................. 56
3.3 Constituent Materials...................................................................................................... 59
3.3.1 Cements ............................................................................................................................ 59
3.3.2 Fillers ................................................................................................................................. 64
3.3.3 Surfactants ........................................................................................................................ 64
3.3.4 Water ................................................................................................................................. 65
3.3.5 Other materials ............................................................................................................... 66
3.4 MIX DESIGN ................................................................................................................................ 69
3.5 FOAM GENERATOR .................................................................................................................. 73
3.6 SPECIMEN PREPARATION ...................................................................................................... 76
3.7 STANDARD PROCEDURE ........................................................................................................ 79
3.7.1 Plastic density .................................................................................................................. 79
3.7.2 Curing ............................................................................................................................... 80
3.7.3 Consistence ....................................................................................................................... 83
3.5 CUBE STRENGTH ....................................................................................................................... 86
CHAPTER 4: PERFORMANCE OF MODEL STRUCTURAL ELEMENT ............ 88
4.1 INTRODUCTION ........................................................................................................................ 88
4.2 MATERIALS, EXPERIMENTAL PROGRAMMES AND METHODOLOGY ...................... 90
4.2.1 Introduction ..................................................................................................................... 90
4.2.2 Constituent Materials...................................................................................................... 92
4.2.3 Formwork preparation ................................................................................................... 92
4.2.4 Beam mix design ............................................................................................................. 96
4.2.5 Preparation for post-tensioned ...................................................................................... 99
4.3 RESULTS ..................................................................................................................................... 105
4.3.1 Compressive strength ................................................................................................... 105
4.3.2 Effect of added tension ................................................................................................. 105
4.3.3 Two point load test........................................................................................................ 105
viii
4.4 SUMMARY OF RESULTS......................................................................................................... 108
CHAPTER 5: RHEOLOGY ........................................................................................... 109
5.1. INTRODUCTION ...................................................................................................................... 109
5.2 MATERIALS, EXPERIMENTAL PROGRAMMES AND METHODOLOGY .................... 110
5.2.1 Introduction .................................................................................................................. 110
5.2.2 Constituent Materials................................................................................................... 112
5.2.3 Mix design ...................................................................................................................... 113
5.2.4 Brookfield Viscometer .................................................................................................. 113
5.3 RESULTS ..................................................................................................................................... 121
5.3.1 Viscometer readings ..................................................................................................... 121
5.3.2 Set 1 ................................................................................................................................ 125
5.3.4 Set 2 ................................................................................................................................ 130
5.3.5 Consistence .................................................................................................................... 139
5.4 SUMMARY OF RESULTS......................................................................................................... 144
CHAPTER 6: BUBBLE MICROSTRUCTURE / AIR VOID SYSTEM ................. 145
6.1 INTRODUCTION ...................................................................................................................... 145
6.2 MATERIALS, EXPERIMENTAL PROGRAMMES AND METHODOLOGY .................... 146
6.2.1 Introduction ................................................................................................................... 146
6.2.2 Constituent Materials................................................................................................... 147
6.2.3 Experimental Programme ............................................................................................ 148
6.2.4 Methodology ................................................................................................................. 150
6.3 RESULTS ..................................................................................................................................... 161
6.3.1 Set 1 ................................................................................................................................ 162
6.3.2 Set 2 ................................................................................................................................. 174
6.3.3 Set 3 ................................................................................................................................. 176
6.4 SUMMARY OF RESULTS......................................................................................................... 180
CHAPTER 7: CAUSES OF INSTABILITY IN FOAMED CONCRETE ............... 182
7.1 INTRODUCTION ...................................................................................................................... 182
7.2 MATERIALS, EXPERIMENTAL PROGRAMMES AND METHODOLOGY .................... 188
7.2.1. Introduction .................................................................................................................. 188
ix
7.2.2. Constituent Materials.................................................................................................... 191
7.2.3. Experimental Programme ............................................................................................ 193
7.2.4. Methodology for instability ......................................................................................... 193
7.3 RESULTS ..................................................................................................................................... 197
7.3.1. Dropout tests .................................................................................................................. 197
7.3.2. Set 1 ................................................................................................................................. 200
7.3.3. Set 2 ................................................................................................................................. 209
7.3.4. Set 3 ................................................................................................................................. 210
7.4 SUMMARY OF RESULTS......................................................................................................... 215
CHAPTER 8: ANALYSIS AND DISCUSSION ....................................................... 218
8.1 INTRODUCTION ...................................................................................................................... 218
8.2 HYPOTHESES ............................................................................................................................ 219
8.2.1 ‘Cannibalistic’ theory (H1) ........................................................................................... 219
8.2.2 ‘Confinement’ theory (H2) ........................................................................................... 219
8.2.3 ‘Cement fineness’ theory (H3) ..................................................................................... 221
8.2.4 ‘Hardening’ theory (H4) ............................................................................................... 221
8.3 SUMMARY OF FOAMED CONCRETE PROPERTIES ........................................................ 223
8.3.1 Rheology ......................................................................................................................... 223
8.3.2 Microstructure ............................................................................................................... 224
8.3.3 Instability ........................................................................................................................ 226
8.4 RELATIONSHIP BETWEEN RHEOLOGICAL PROPERTIES AND MICROSTRUCTURE
227
8.5 RELATIONSHIP BETWEEN INSTABILITY AND MICROSTRUCTURE ......................... 228
8.6 CONCEPTUAL DEVELOPMENT TIMELINE ...................................................................... 231
CHAPTER 9: CONCLUSION ...................................................................................... 233
9.1 OVERALL CONCLUSION ....................................................................................................... 233
9.2 PRACTICAL IMPLICATIONS ................................................................................................. 233
9. 3 FUTURE RESEARCH ................................................................................................................ 234
REFERENCES ............................................................................................................................................. 235

x
LIST OF TABLES
Table 1.1: Researches at Concrete Technology Unit, University of Dundee ................................ 4
Table 2.1: Different types of concrete containing air ..................................................................... 12
Table 2.2: Typical rheology of sand and fine fly ash, FAf aggregate mixes, from Dhir et al.
(1999) .................................................................................................................................. 34
Table 2.3: Summary of properties of hardened foamed concrete (BCA, 1994). ......................... 41
Table 2.4: Splitting tensile strength of sand and FA foamed concrete in compared with
normal weight and lightweight aggregate concrete (Jones, 2000). ............................ 45
Table 2.5: Effect of polypropylene fibres on compressive strength, splitting strength and
modulus of elasticity of foamed concrete beams (Mellin, 1999) ................................ 46
Table 2.6: Classification of pore sizes according to the general classification by the IUPAC
and to the concrete science terminology (Kalliopi, 2006) ............................................ 51
Table 3.1: Experimental Programme ............................................................................................... 58
Table 3.2: Characterisation of the cementitious materials ............................................................ 60
Table 3.3: Chemical composition of cements and fillers, % by mass .......................................... 63
Table 3.4: Mix proportions of foamed concrete ............................................................................. 71
Table 3.5: Classification of foamed concrete flow ((Jones et al., 2003) ........................................ 85
Table 4.1: Glass fibre reinforced plastics, GFRP............................................................................. 93
Table 4.2: Compressive strength for 5 mixes ................................................................................ 104
Table 4.3: Displacement readings with added tension (mm) ..................................................... 106
Table 4.4: Displacement readings when tension added at top and bottom ............................. 107
Table 5.1 Rotational speed against viscometer reading ............................................................. 122
Table 5.2: Values of yield stress and plastic viscosity ................................................................. 127
Table 5.3: Yield stress and plastic viscosity ................................................................................. 131
Table 5.4: Marsh cone time ............................................................................................................ 141
Table 6.1: Measurements saved in Excel file ................................................................................ 160
Table 6.2: Bubble details for all densities and w/c ratio for measured area ............................. 164
Table 7.1: Different conditions in dropout tests ........................................................................... 192
Table 7.2: Amount of dropout for different conditions .............................................................. 199
Table 7.3: Total drop in level for protein surfactant (500 mm cylinder height) ....................... 201
Table 7.4: Total drop in level for synthetic; TFAL-3 and Regular -3% surfactants ................. 201
Table 7.5: Stability results in blends of CSA and FAf .................................................................. 214

xi
Table 8.1: Relationship between bubble sizes and rheological properties ............................... 229

xii
LIST OF FIGURES
Figure 1.1: Number of published articles ........................................................................................... 3
Figure 1.2: Cross section of new tunnel to be constructed at Gerrards Cross ............................... 5
Figure 1.3: Collapsed foamed concrete in Gerrards Cross project .................................................. 5
Figure 2.1: Critical micelle concentration of different surfactant types (Dhir et al. 1999).......... 23
Figure 2.2: Schematic effect of dynamic equilibrium state (Gibbs – Marangoni effect) of foams
(Myers, 1992) ..................................................................................................................... 23
Figure 2.3: Schematic diagram of the production of foam for foamed concrete ........................ 29
Figure 2.4: Variation of density ratio with water–solids ratio for different filler type (Nambiar
and Ramamurthy, 2006b) ................................................................................................ 29
Figure 2.5: Bingham model ............................................................................................ 34
Figure 2.6: Comparison of stiffening times of various foamed concrete (Jones, 2001) ............... 35
Figure 2.7: Effect of air content on compressive strength (Dhir et al. 1999) ................................ 41
Figure 2.8: Strength density variation for mixes with sand of different fineness ....................... 42
Figure 2.9: Comparison of early and longer term development of FA and sand mixes as
percentage of 28-day compressive strength (Jones, 2000) ........................................... 42
Figure 2.10: Effect of curing on compressive strength (Kearsley, 1996) ......................................... 43
Figure 2.11: Relationship between cylinder splitting strength and 28 day cube compressive
strength (Jones 2000) ........................................................................................................ 45
Figure 2.12: Comparison of the relationship of E value and 28-day cube strength of all mixes
(McCarthy, 2004) .............................................................................................................. 48
Figure 2.13: Typical binary images (Nambiar and Ramamurthy, 2007) ........................................ 52
Figure 2.14: Density vs. air-void distribution (Nambiar and Ramamurthy, 2007) ....................... 53
Figure 2.15: Strength vs. air-void diameter (Nambiar and Ramamurthy, 2007) ........................... 53
Figure 3.1: Protein and synthetic surfactants ................................................................................... 67
Figure 3.2: Foam ................................................................................................................................... 67
Figure 3.3: Magnified foam bubbles .................................................................................................. 68
Figure 3.4: Proportions of constituent materials ............................................................................. 72
Figure 3.5: Percentages of constituent materials for different w/c ratios ..................................... 72
Figure 3.6: Foam generator ................................................................................................................. 74
Figure 3.7: The interior of foam generator........................................................................................ 74
Figure 3.8: Foam discharged from the lance .................................................................................... 75
xiii
Figure 3.9: Foam in a jar for density check ....................................................................................... 75
Figure 3.10: Mixing sequence in rotary drum mixer ......................................................................... 77
Figure 3.11: Mixing sequence in Hobart mixer which moves in planetary action ........................ 78
Figure 3.12: Density check for foamed concrete ................................................................................ 81
Figure 3.13: Foamed concrete freshly poured into cylinder ............................................................ 81
Figure 3.14: After 24 hours, foamed concrete demoulded and wrapped in 'cling film' ............... 82
Figure 3.15: Cubes covered with 'cling film' and placed at room temperature 20 ± 20C before
demoulding ....................................................................................................................... 82
Figure 3.16: Modified Marsh cone ....................................................................................................... 84
Figure 3.17: Dimensions of modified Marsh cone ............................................................................. 85
Figure 3.18: Compressive strength test on foamed concrete cube .................................................. 87
Figure 4.1: Hypothetical improvement to serviceability limit of foamed concrete beam. ......... 91
Figure 4.2: Dimensions of beam 1 ...................................................................................................... 94
Figure 4.3: Dimensions of beam 2 ...................................................................................................... 94
Figure 4.4: Position of inverted U-bars ............................................................................................. 95
Figure 4.5: Foamed concrete mixed in a standard inclined rotating mixer ................................. 95
Figure 4.6: Base mix in rotary mixer.................................................................................................. 97
Figure 4.7: Foam added to base mix .................................................................................................. 97
Figure 4.8: Beam covered in plastic sheet after cast ........................................................................ 98
Figure 4.9: Beam wrapped in ‘cling’ film after formwork removal .............................................. 98
Figure 4.10: Beam 1 and beam 2 coated with white paint .............................................................. 100
Figure 4.11: Demec studs glued in positions ................................................................................... 100
Figure 4.12: Three dial gauges positioned at ‘critical’ points......................................................... 101
Figure 4.13: Close-up detail of fixed end .......................................................................................... 101
Figure 4.14: Close-up detail of tensioned end .................................................................................. 102
Figure 4.15: Beam prepared to be tested .......................................................................................... 102
Figure 4.16: Cracks propagated ......................................................................................................... 103
Figure 4.17: Tested Beam - front view ............................................................................................... 103
Figure 4.18: The reinforcement creep and did not sustain the added tension in the beam ....... 104
Figure 5.1: Experimental Programme ............................................................................................. 115
Figure 5.2: Brookfield Viscometer set ............................................................................................. 116
xiv
Figure 5.3: Brookfield Viscometer dial reading display ............................................................... 117
Figure 5.4: A set of spindles ............................................................................................................. 117
Figure 5.5: Relationship between torque, T and Speed, N for Bingham material (Tattersall,
1991) ................................................................................................................................. 119
Figure 5.6: An example of rotational speed against viscometer reading ................................... 119
Figure 5.7: Rotational speed vs. viscometer reading for density 600 kg/m3 (combined) ......... 123
Figure 5.8: Rotational speed vs. viscometer reading for density 600 kg/m3 in mode 1 ............ 123
Figure 5.9: Rotational speed vs. viscometer reading for density 600 kg/m3 in mode 2 ............ 124
Figure 5.10: Mode 1 and Mode 2 boundary wall ............................................................................. 124
Figure 5.11: Yield stress values for different densities and w/c ratio in mode 1 (low rotational
speed). .............................................................................................................................. 128
Figure 5.12: Yield stress for different densities and w/c ratio in mode 2 (high rotational speed).
........................................................................................................................................... 128
Figure 5.13: Plastic viscosity for different densities and w/c ratios in mode 1 (low rotational
speed). .............................................................................................................................. 129
Figure 5.14: Plastic viscosity for different densities and w/c ratios in mode 2 (high rotational
speed). .............................................................................................................................. 129
Figure 5.15: Yield stress values for mix 1, mix 2, mix 3, mix 4 and mix 5 for density 600 kg/m3
........................................................................................................................................... 132
Figure 5.16: Yield stress values mix 1, mix 2 and mix 3 for density 1000 kg/m3 ......................... 132
Figure 5.17: Plastic viscosity values for mix 1, mix 2, mix 3, mix 4 and mix 5 for density 600
kg/m3 ................................................................................................................................ 133
Figure 5.18: Plastic viscosity for density for mix 1, mix 2 and mix 3 for density 1000 kg/m3 .... 133
Figure 5.19: Yield stress values for density 600 kg/m3 and 1000 kg/m3 ........................................ 135
Figure 5.20: Plastic viscosity for density 600 kg/m3 and 1000 kg/m3............................................. 135
Figure 5.21: Effect of cement fineness on yield stress for density 600 kg/m3 ............................... 137
Figure 5.22: Effect of filler fineness on yield stress for density 600 kg/m3 ................................... 137
Figure 5.23: Effect of cement fineness on plastic viscosity for mixes 1, 2 and 3 at density 600
kg/m3 ................................................................................................................................ 138
Figure 5.24: Effect of filler fineness on plastic viscosity for mixes 1, 4 and 5 at density 600 kg/m3
........................................................................................................................................... 138
Figure 5.25: Marsh cone time for density 600 kg/m3 ....................................................................... 142
Figure 5.26: Marsh cone time for density 1000 kg/m3 ..................................................................... 142
Figure 5.27: Yield stress values for flowable foamed concrete at density 600 kg/m3 ................. 143

xv
Figure 6.1: Experimental Programme ............................................................................................. 149
Figure 6.2: Foamed concrete specimen wrapped in 'cling' film .................................................. 152
Figure 6.3: Cylinder specimen split in half longitudinally........................................................... 152
Figure 6.4: Splitting machine ............................................................................................................ 153
Figure 6.5: High magnification SLR camera mounted on tripod ................................................ 153
Figure 6.6: Image of a foamed concrete sample ............................................................................. 158
Figure 6.7: Selected area to measure in 64 bit colour .................................................................... 158
Figure 6.8: Image converted to grayscale ....................................................................................... 159
Figure 6.9: Image after brightness and threshold adjusted .......................................................... 159
Figure 6.10: Processed image with outlines ..................................................................................... 160
Figure 6.11: Description used in microstructure in a foamed concrete specimen ...................... 163
Figure 6.12: Bubbles count for different densities ........................................................................... 165
Figure 6.13: Diameter of bubbles for different densities ................................................................ 165
Figure 6.14: Foamed concrete bubbles of different densities and w/c ratio ................................. 167
Figure 6.15: Comparing bubbles count for top and bottom specimen ......................................... 168
Figure 6.16: Comparing bubble sizes for top and bottom specimen ............................................ 168
Figure 6.17: Density 600 kg/m3 at 0.50 w/c ratio using protein surfactant ................................... 170
Figure 6.18: Density 600 kg/m3 at 0.50 w/c ratio using synthetic surfactant ................................ 170
Figure 6.19: Small specimen of density 300 kg/m3 at w/c ratio 0.50 using synthetic surfactant 171
Figure 6.20: Density 300 kg/m3, w/c ratio 0.50 using synthetic surfactant ................................... 171
Figure 6.21: Density 600 kg/m3 at w/c ratio 0.50 without wetting agent ...................................... 172
Figure 6.22: Density 600 kg/m3 at w/c ratio 0.50 with 1% wetting agent ..................................... 172
Figure 6.23: Density 600 kg/m3 at w/c ratio 0.50 with 2% wetting agent ..................................... 172
Figure 6.24: Density 300 kg/m3 at w/c ratio 0.50 without wetting agent ...................................... 173
Figure 6.25: Density 300 kg/m3 at w/c ratio 0.50 with 1% wetting agent ..................................... 173
Figure 6.26: Bubble diameters of density 600 kg/m3 specimens with varying cement fineness 175
Figure 6.27: Bubble diameters of density 600 kg/m3 with varying filler fineness ....................... 175
Figure 6.28: Bubble diameters for density 1000 kg/m3 of varying cement fineness .................... 177
Figure 6.29: 100 CEM I 52.5R (w/c ratio 0.50) .................................................................................... 178
Figure 6.30: CEM I 52.5R : CSA / 80: 20 ............................................................................................. 178
xvi
Figure 6.31: CEM I 52.5R : CSA / 60: 40 ............................................................................................. 178
Figure 6.32: CEM I 52.5R CSA / 50: 50 .............................................................................................. 178
Figure 6.33: CSA:FA 60:40 (w/c ratio 0.50) ........................................................................................ 179
Figure 6.34: CSA:FA 50:50 (w/c ratio 0.50) ........................................................................................ 179
Figure 6.35: CSA FA/ 40:60 (w/c ratio 0.50) ....................................................................................... 179
Figure 6.36: CSA FA / 30:70 (w/c ratio 0.50) ...................................................................................... 179
Figure 7.1: Widening and strengthening of Kingston Bridge, West London ............................ 184
Figure 7.2: Combe Down mine stabilization project ..................................................................... 185
Figure 7.3: Stable foamed concrete in Gerrards Cross project ..................................................... 186
Figure 7.4: Collapsed foamed concrete in Gerrards Cross project .............................................. 187
Figure 7.5: Progressive collapse in preformed foam at 0, 16, 27, 45, 57, 90 seconds ................. 189
Figure 7.6: Parameters considered in the study of instability...................................................... 190
Figure 7.7: Experimental programme ............................................................................................. 195
Figure 7.8: Dropout under different conditions for protein PP40 surfactant and synthetic
surfactant ......................................................................................................................... 199
Figure 7.9: Drop in level for foamed concrete mixes using protein surfactant in 500 mm
cylinder ............................................................................................................................ 202
Figure 7.10: Drop in level for foamed concrete mixes using synthetic surfactant in 500 mm
cylinder ............................................................................................................................ 202
Figure 7.11: Drop in level for different mix methods in 500 mm height cylinder ...................... 205
Figure 7.12: Drop in level with calcium chloride, CaCl2, addition, % by weight of cement in
500 mm cylinder height ................................................................................................. 205
Figure 7.13: Comparing foamed concrete specimens, density 600 kg/m3 with and without
wetting agents ................................................................................................................. 206
Figure 7.14: Drop in level with addition of wetting agents in 500 mm height cylinder ............ 206
Figure 7.15: Foamed concrete 600 kg/m3 density with 1% wetting agent and without wetting
agent ................................................................................................................................. 207
Figure 7.16: Foamed concrete 600 kg/m3 density with 1% wetting agent .................................... 207
Figure 7.17: Drop in level using different cement types and with the addition of wetting agents
for 500 mm height cylinder ........................................................................................... 208
Figure 7.18: Percentage drop in level with varying cement fineness ........................................... 212
Figure 7.19: Percentage drop in level with varying filler fineness ................................................ 212
Figure 7.20: Percentage drop for various cylinder heights ............................................................ 213
xvii
Figure 7.21: Percentage maintained in level for CEM I 52.5R/CSA blend ................................... 213
Figure 8.1: Schematic diagram for ‘Cannibalistic’ theory ............................................................ 220
Figure 8.2: Schematic diagram of ‘Confinement’ theory .............................................................. 220
Figure 8.3: Schematic of ‘Cement fineness’ theory ........................................................................ 222
Figure 8.4 : Schematic diagram of ‘Hardening’ theory ................................................................. 222
Figure 8.5: Bubble sizes against yield stress ................................................................................... 229
Figure 8.6: Schematic bubble sizes for varying yield stress and plastic viscosity ..................... 230
Figure 8.7: Relationship between instability and bubble sizes .................................................... 230
Figure 8.8: Conceptual development timeline ............................................................................... 232
1
CHAPTER 1: INTRODUCTION
1.1 BACKGROUND
Foamed concrete has evolved tremendously from being confined to void fillings only to a
variety of construction applications. This development started about 15 years ago, when there
was a renewed interest in foamed concrete (Dransfield, 2000). These factors included
improved surfactants with better qualities; stronger and more stable without objectionable
smell and mould growth problem, improved pre-foaming equipment which allows on-site
application to be produced in the back of a ready-mixed truck. The development of this
equipment allowed the rapid supply of large volumes and easy supply of moderate quantities
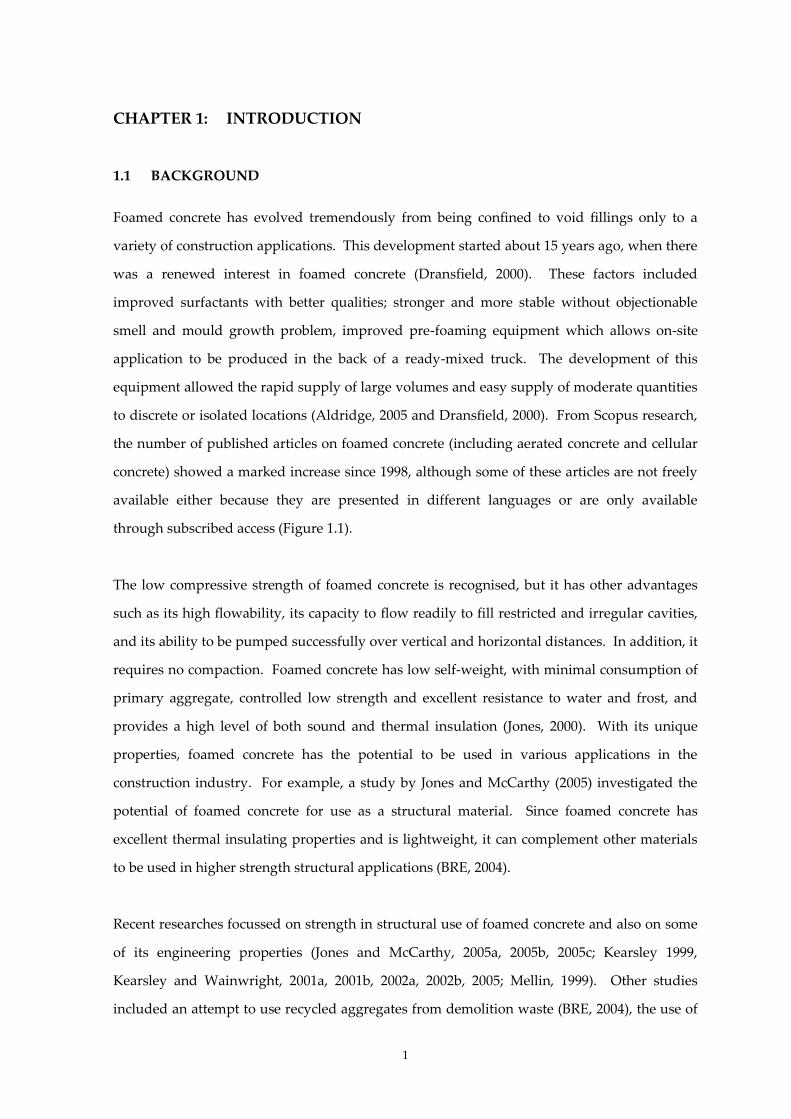
to discrete or isolated locations (Aldridge, 2005 and Dransfield, 2000). From Scopus research,
the number of published articles on foamed concrete (including aerated concrete and cellular
concrete) showed a marked increase since 1998, although some of these articles are not freely
available either because they are presented in different languages or are only available
through subscribed access (Figure 1.1).
The low compressive strength of foamed concrete is recognised, but it has other advantages
such as its high flowability, its capacity to flow readily to fill restricted and irregular cavities,
and its ability to be pumped successfully over vertical and horizontal distances. In addition, it
requires no compaction. Foamed concrete has low self-weight, with minimal consumption of
primary aggregate, controlled low strength and excellent resistance to water and frost, and
provides a high level of both sound and thermal insulation (Jones, 2000). With its unique
properties, foamed concrete has the potential to be used in various applications in the
construction industry. For example, a study by Jones and McCarthy (2005) investigated the
potential of foamed concrete for use as a structural material. Since foamed concrete has
excellent thermal insulating properties and is lightweight, it can complement other materials
to be used in higher strength structural applications (BRE, 2004).
Recent researches focussed on strength in structural use of foamed concrete and also on some
of its engineering properties (Jones and McCarthy, 2005a, 2005b, 2005c; Kearsley 1999,
Kearsley and Wainwright, 2001a, 2001b, 2002a, 2002b, 2005; Mellin, 1999). Other studies
included an attempt to use recycled aggregates from demolition waste (BRE, 2004), the use of
2
foamed concrete as foundations and ground slab (McCarthy, 2004) and other characteristics of
foamed concrete (Narayanan and Ramamurthy 2000; Kunhanandan and Ramamurthy, 2006,
2007a, 2007b and 2008). These studies demonstrate that foamed concrete is a versatile material
with diverse uses.
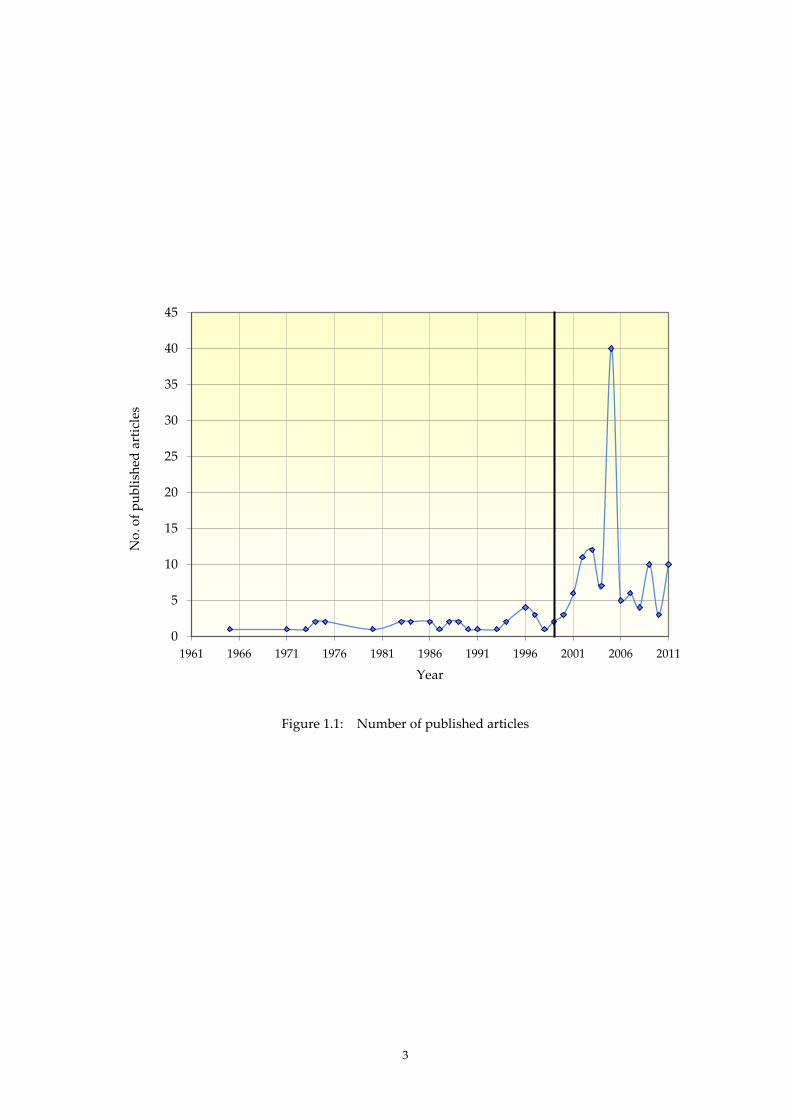
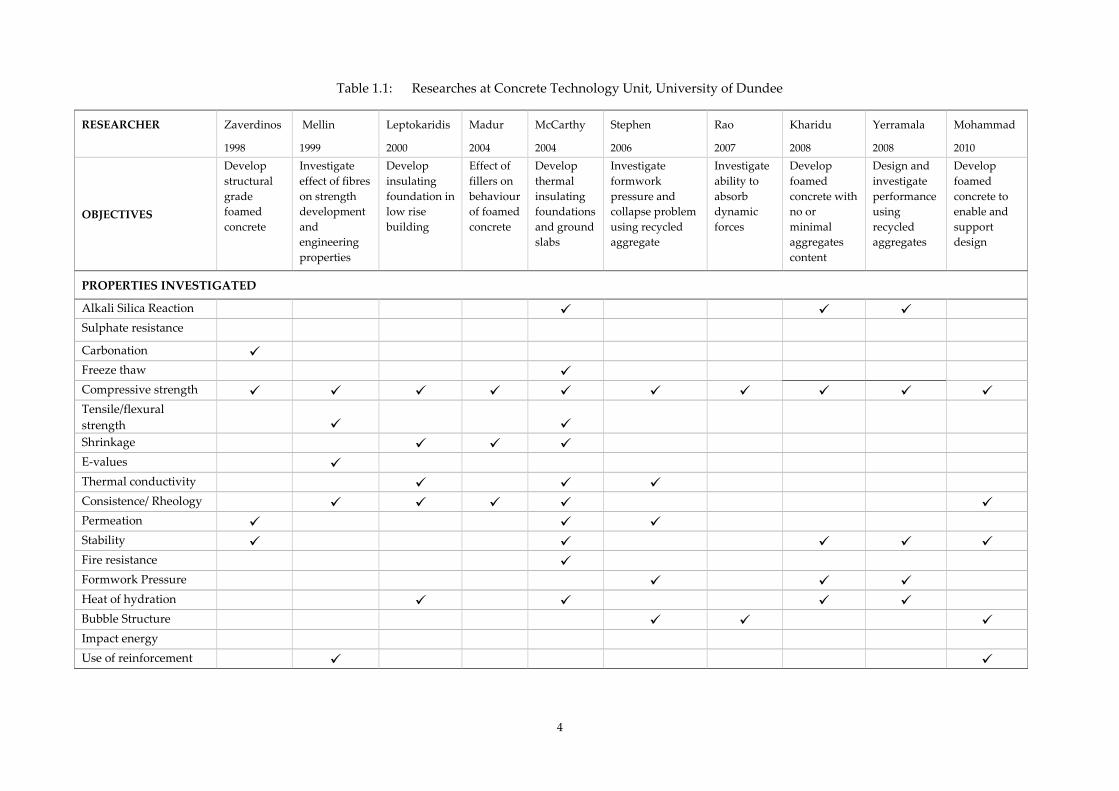
This versatility has been recognised by the University of Dundee, where there has been
continuous research on foamed concrete covering a wide range of aspects since 1998 as shown
in Table 1.1. This figure shows the different aspects of foamed concrete, characteristics that
have been considered concurrently and the various approaches to examining the properties
Areas that have been identified that need in-depth study are rheology and bubble structures,
including factors affecting their behaviours. Thus, this research will seek a better
understanding of characteristics, methods of testing, specification and also engineering
properties that will enable and support the design of foamed concrete.
Another area of interest is the causes of instability in foamed concrete. There is a little direct
evidence as to why this happens but data from site has proven that instability occurred
unexpectedly on-site despite controlled site conditions. In a project in Gerrards Cross tunnel
in East London, foamed concrete was selected to top up above incinerated bottom ash
aggregate (IBAA) to reduce the self-weight of the total materials above the tunnel (Figure 1.2).
This was to facilitate the construction of a Tesco supermarket above the tunnel. There were
incidences where foamed concrete collapsed and ‘failed’ about 20 minutes after pouring
(Figure 1.3). This unanticipated incidence suggests that foamed concrete has a stability
problem which must be resolved, especially at lower densities.
3
Figure 1.1: Number of published articles
0
5
10
15
20
25
30
35
40
45
1961 1966 1971 1976 1981 1986 1991 1996 2001 2006 2011
No
. of
pu
bli
shed
art
icle
s
Year
4
Table 1.1: Researches at Concrete Technology Unit, University of Dundee
RESEARCHER Zaverdinos Mellin Leptokaridis Madur McCarthy Stephen Rao Kharidu Yerramala Mohammad
1998 1999 2000 2004 2004 2006 2007 2008 2008 2010
OBJECTIVES
Develop
structural
grade
foamed
concrete
Investigate
effect of fibres
on strength
development
and
engineering
properties
Develop
insulating
foundation in
low rise
building
Effect of
fillers on
behaviour
of foamed
concrete
Develop
thermal
insulating
foundations
and ground
slabs
Investigate
formwork
pressure and
collapse problem
using recycled
aggregate
Investigate
ability to
absorb
dynamic
forces
Develop
foamed
concrete with
no or
minimal
aggregates
content
Design and
investigate
performance
using
recycled
aggregates
Develop
foamed
concrete to
enable and
support
design
PROPERTIES INVESTIGATED
Alkali Silica Reaction Sulphate resistance Carbonation Freeze thaw Compressive strength
Tensile/flexural
strength Shrinkage E-values Thermal conductivity Consistence/ Rheology
Permeation Stability
Fire resistance Formwork Pressure Heat of hydration Bubble Structure
Impact energy Use of reinforcement

5
Figure 1.2: Cross section of new tunnel to be constructed at Gerrards Cross
(http://www.nce.co.uk/news/geotechnical/cross-purpose/1995578.article, May 2011)
Figure 1.3: Collapsed foamed concrete in Gerrards Cross project
(Courtesy of Propump Engineering, Ltd 2010)

6
1.2 OVERALL AIMS AND OBJECTIVES
The overall aim of this research is to study the effect of constituents and mix proportions on
the rheological properties and on the microstructural features, affecting the formation of the
bubble structures of foamed concrete, particularly in relation to instability. To achieve this,
the mix proportions of the constituent materials are examined and corresponding rheological
behaviour and the bubble structures are investigated. The method adopted will seek to
establish the relationship between the mix proportions of materials to the rheological
behaviour and the internal matrix.
The specific objectives of the study are:
i. to find the effect of mix proportion of constituent materials on rheological properties,
bubble structures,
ii. to characterise the bubble structures by identifying few parameters and examine the
influence of these parameters on the characteristics , and
iii. to study the causes of instability in foamed concrete.
1.3 SCOPE OF RESEARCH
Following the two phases of study, different sets of range were selected. The first phase
focussed on the use foamed concrete in structural applications. In this study, foamed concrete
was to be produced on a large scale using free falling drum mixer. Since the objective
criterion was strength, the target plastic density was 1400 kg/m3 with 600 kg/m3 cement
content and 0.35 w/c ratio. This density was chosen because it was found that 1400 kg/m3 is
the minimum density at which foamed concrete with coarse fly ash (FAc) filler could be used
in structural elements. FAc was used in total replacement of sand as filler since the use of FAc
was found to have increased the compressive strength of foamed concrete. Superplasticiser
was included to allow the mix to be placed in the beam formwork with ease. In this phase, the
scope was confined to a specific design mix and beam dimensions which were a repeat from
previous research done in the Concrete Technology Unit, University of Dundee.
The studies in the second phase were inter-related. Basically, the rheological values were
measured from fresh foamed concrete mix. The measured rheological values were yield
7
stress, plastic viscosity and flowability, even though the main measurements centred at the
first two parameters. The measurement of yield stress and plastic viscosity was done using
two-point tests, thus, Brookfield Viscometer and the flowability test was done on Dundee
modified Marsh cone. The rheological measurements were confined to typical laboratory
conditions. Subsequently, 24 hours after placing the sample materials in selected moulds, the
stability was observed from the drop in level. After hardening, the microstructure of the
specimens was examined. In order to disregard inconsistencies in making assumptions and
generalisations, the examination of the microstructure was performed by an examiner.
Basically the same set of mixed was studied throughout. The main range of densities was
from 600 kg/m3 to 1400 kg/m3 and w/c ratios from 0.4 to 0.6 even though for each study, there
were slight variations in densities and w/c ratios. The main cement used was CEM I 42.5N
and other variations included Rapid Hardening Cement (RHPC), Calcium Sulphoaluminate
(CSA) and CEM I 52.5R for the study of instability. These cements were included to
investigate the effect of hardening time. Additionally, other cementitious materials were
included as part cement replacement to observe the effect of fineness on the properties. These
included metakaolin and fine fly ash (FAf). The common filler used was sand (fine aggregate)
with brief inclusion of coarse fly ash (FAc) as sand replacement. Two types of commercially
available surfactants were used in the study: protein and synthetic surfactants although the
more commonly used were the protein surfactants.
The selection of materials was based on the choice of parameters studied. It is anticipated that
these will assist future researchers to design foamed concrete mixes to suit their own
conditions.
1.3 OUTLINE OF THE THESIS
Chapter 2 provides a review of the literature, summarising the properties of commonly used
materials in the production of foamed concrete, the fresh and the hardened properties.
Chapter 3 describes the materials used in the study, the mix proportioning and the standard
procedures which were common to the different studies. Different test procedures for each
study were described in its own chapter.
8
The study of foamed concrete beam is described in Chapter 4. This chapter illustrates the
behaviour of reinforced foamed concrete beam in an effort to develop structurally viable
foamed concrete as a structural material. It explains how a full scale foamed concrete beam
was casted and post-tensioned using glass-fibre reinforced polymer rod, GFRP and how GFRP
was used for assessment in a more practical way.
Chapter 5 describes the study of rheological properties of foamed concrete. This chapter
illustrated the methods employed to achieve the rheological measurements: yield stress,
plastic viscosity and flowability.
The technique employed to study the microstructure of foamed concrete is illustrated in
Chapter 6. In this chapter, the effects of variations in materials and proportions the
characteristics of the microstructure are examined. The diameters of the bubbles are tabulated,
where possible. The main range of densities and w/c ratios are similar to those explained in
Chapter 5, although brief illustration of the characteristics of lower density is included.
Chapter 7 describes the causes of instability of foamed concrete mixes. It is in this study that
another cement type, CSA is included and blends with CEM I 52.5R and FAf are observed.
The results of each study are explained at the end of each chapter; Chapters 5, 6 and 7.
However, the analysis of the results is discussed in Chapter 8. This chapter combines the
results and the hypotheses used to describe the phenomena.
Chapter 9 draws the conclusions of the overall study and provides suggestions for future
work in this area
9
CHAPTER 2: LITERATURE REVIEW
2.1 INTRODUCTION
Foamed concrete is a new generation of lightweight concrete that is versatile with some
attractive characteristics such as its flowability, self-compacting and self-levelling nature, low
dimensional change and ultra-low density. In addition, the material can be designed to have
controlled low strength, excellent thermal insulation properties, good load-bearing capacity
and can be easily re-excavated, if necessary. Foamed concrete was generally used for
application for ground works such as high volume void fills, reinstatement of utility trenches,
road sub-bases, soil stabilisation and grouting tunnel walls. With the advent of improved
techniques and foaming agents, the use of foamed concrete has grown more rapidly than any
other “special“ concrete products, such that the current estimated UK market is thought to be
close to 1 million m3 annually (Aldridge, 2005). This development in the use of foamed
concrete has attracted many researchers throughout the world to explore new ideas and
opportunities in its application.
Although the research in foamed concrete has been sporadic, there has been some recent
interest in the compressive strength and the use of recycled materials. Nevertheless, even
after some years of such research, there is still a lack of study of certain characteristics and
behaviour of foamed concrete. The main areas in this research are centred on its
microstructure and rheological properties which, although they may appear as separate
studies, are interdependent and linked to instability. The stability of foamed concrete is of
paramount importance as the versatility of this material lies in the ability to control the low
densities which is the most fundamental characteristic.
This literature review examines the current knowledge on foamed concrete, including
parameters which contribute to the characteristics and behaviour of foamed concrete.

10
2.2 DEFINITION
Foamed concrete can be defined in two groups of concretes. The first of these is the class of
lightweight concretes, while the second is the class of concretes containing air.
In the case of lightweight concretes, the defining criterion is the dry density. This density
range is from 300 kg/m3 to 2000 kg/m3 with corresponding cube strengths from 1 to over
60 kN/m3. Included in lightweight concretes are no-fines concrete, aerated concrete, foamed
concrete and lightweight aggregate concrete (Newman and Owens, 2003). This definition is
limited to concretes containing intentionally entrained voids in the hardened cement paste or
mortar. These concretes are referred to as air-entrained, aerated, aircrete, cellular, gas, foamed
or foam concretes. Aerated concrete is produced by introducing gas bubbles into the cement
paste by adding aluminium powder which reacts and forms gas bubbles which expand in the
concrete. Hence, it is also known as gas concrete.
Another type of lightweight concrete which is designed for factory production is the concrete
that is cured in steam at atmospheric pressure or in steam at 1800C under high pressure in an
autoclave. This concrete is autoclaved aerated concrete (AAC) which is also known as
aircrete. AAC has higher strength, volume and stability compared to non-autoclaved
concrete; it is highly reactive but limited to specified mould and to factory production.
Foamed concrete is also classified as lightweight concretes. Also known as cellular concrete,
foamed concrete is produced either by the pre-foaming method or the mixed foaming method.
The pre-foaming method comprises producing base mix and stable preformed aqueous foam
separately and then thoroughly blending the foam into the base mix. In mixed foaming, the
surface active agent is mixed along with the base mix ingredients. During the process of
mixing, foam is produced resulting in a cellular structure in the concrete. In both methods,
the foam must be stable during mixing, transporting and placing. Based on this criteria,
foamed concrete is defined as “concretes weighing from 200 to 1600 kg/m3 (dry densities),
having homogeneous void or cell structures” (Valore, 1954).
The second category of foamed concrete is that group of concretes containing air in the
hardened cement paste or mortar. In this category are structural air-entrained concrete, highly
11
entrained concrete or mortar (also known as ‘controlled low strength material’), autoclaved
aerated concrete and foamed concrete (Dransfield, 2000). The variations in this category are
shown in Table 2.1. Thus, foamed concrete can be further defined as “highly aerated mortar
with air content greater than 20% by volume of mechanically entrained foam in the plastic
mortar” (Van Dijk, 1991). This definition is also used by The Concrete Society (2009). This
differentiates from air-entrained concrete which has much lower volume of entrained air
(Highways agency and TRL, 2001). Dhir et al. (1999) defined foamed concrete as “a
cementitious material, where air is entrained by the mechanical incorporation of a preformed
foam or admixture into a mortar”. For consistency, the term ‘foamed concrete’ is used instead
of foam concrete which refers to the same material.

12
Table 2.1: Different types of concrete containing air
DENSITY
kg/m3
TYPICAL
COMPRESSIVE
STRENGTH
BASE
MATERIALS ADDITIONS CURING
TYPICAL
AIR
CONTENT
AIR
INCLUSION TYPICAL USES
1.
Structural Air
Entrained
Concrete
2200 to
2300 30 to 40 MPa
Cement,
sand, coarse
aggregate
Air
entrained
admixtures
Normal
water
curing
5.5%
Direct addition
of air entrained
to mixture
Freeze thaw
resistance,
reduced bleeding
2.
Highly Air
Entrained
Concrete/Mortar
(controlled low
strength
material )
1850 to
2000 3 to 8 MPa
Cement,
sand (coarse
aggregate,
fly ash,
Limestone)
Air
entrained
admixtures
Normal
water
curing
20 to 25%
Direct addition
of air entrained
to mixture
Trench and void
fill
3.
Autoclaved
Aerated
Concrete
400 to 700 2.5 to 8.0 MPa Cement,
sand
Aluminium
powder
Autoclaved
at high
temperature
70 to 85%
Addition of
aluminium
powder
admixture that
reacts to form
hydrogen
bubbles.
Light weight
precast elements
including thermal
insulating blocks
4. Foamed
Concrete
800 to
1600 <1 to 8 MPa
Cement,
sand
Foam from
surfactants
Sealed
curing 35 to 65%
i. Preformed
foam
ii. Mix
foaming
Trench and void
fill
13
2.3 SPECIFICATIONS
In the UK, the first specification which included foamed concrete was initiated by the British
Cement Association in 1991 (BCA, 1991). Other publications by BCA published between 1991
and 1994 stated the properties, advantages, recommendation for applications, guidelines on
strength, minimum thickness where applicable. As foamed concrete was earlier known for
void fillings and underground works, these publications were aimed at specifying the use of
foamed concrete for trench reinstatement. However, a major step was followed the Horne
Report which resulted in a new Act being passed in Parliament which required all utilities
making openings in highways to reinstate to a given standard depending on the excavation
and method of reinstatement. Following this, the Highway Authorities and Utilities
Committee (HAUC) drew a specification for the Reinstatement of Openings in Highways in
1992 which was later approved as a Code of Practice which included an Appendix entitled
‘Foamed Concrete for Reinstatement’. This took effect from January 1st 1993 (Chandler, 2000).
In 2001, assisted by the Concrete Technology Unit (CTU) in the University of Dundee, the
Highways Agency and Transport Research Laboratory published an application guide AG39:
Specification for foamed concrete. In the more detailed specification, the guideline covers the
properties, quality control and acceptance criteria (Highways agency and TRL, 2001).
Additionally, the CTU, together with industry partners, had also studied foamed concrete and
developed fundamental understanding of the material (Jones et al., 2005).
Other specifications in the UK include a specification on the use of foamed concrete as
reinstatement material by the UK Water Industry in 1995 (UKWIR, 1995) and the use of
foamed concrete for insulating foundations for buildings (Jones, 2004).
These developments have not been confined to the UK. An industrial standard has been
identified in Japan: Japanese Industrial Standard (JIS A 1162:1973) entitled Testing Methods
for Volume Change of Cellular Concrete. However, the actual standard is not available to
date, although it has been mentioned in a literature (IKRAM, 2004).
14
2.4 CONSTITUENT MATERIALS
Foamed concrete is actually foamed mortar, where the mortar is made from cement and water
or cement, sand (fillers) and water. It does not contain coarse aggregates and it is
manufactured by adding preformed foam to mortar mass. The amount of preformed foam
controls the density of the final concrete.
2.4.1 Cement
2.4.1.1 Portland Cement
In foamed concrete, ordinary Portland Cement (PC, conforming to BS EN 197: Part 1: 2000) is
the main cementitious component of foamed concrete (BCA, 1993). The total cement content
usually lies within the range of 300 and 400 kg/m3. Cement content up to 500 kg/m3 has been
used to attain higher strengths, above which, the gain in strength obtained was found to be
minimal (Jones, 2000). However, other types of cements have also been used by several
researchers (Kearsley, 1999; Highway Agency and TRL, 2001; Aldridge, 2000; Jones, 2005). For
example, rapid hardening Portland cement (conforming to BS 915:1983) has also been used in
foamed concrete to improve strength development rates at early hydration stages and
ultimate strength values (BCA, 1994).
2.4.1.2 Fly ash
Fly ash (FA) has been used as an alternative component of foamed concrete. For example, it
can be added to foamed concrete mixes as partial cement replacement (fine FA) and as fillers
(coarse FA), replacing fine aggregate. Jones (2001) reported that when fine fly ash (FAf) was
added at levels up to 80% by mass cement, it was found that it reduced cost, enhanced the
consistency and mix stability and contributed to long-term strength. The additional beneficial
effect of using fine FA was that it reduced the heat of hydration, which is important as foamed
concrete has high thermal insulation characteristics (Jones, 2005). In a more detailed study,
Jones (2006) noted that, with the addition of fine FA, the behaviour of foamed concrete
followed the patterns of normal weight concrete and, furthermore, there was retardation and
reduction in peak temperatures. Hence, measures should be taken to account for the reduced
early strength gain with slower reacting material, when concreting at low temperatures
15
(McGovern, 2000). This is attributed to the dilution of PC with fine FA which established
slower reactions and prolonged the dormant period and which ultimately retarded the
hydration. On the other hand, when FA was used, there is instability in the foam, causing it to
collapse (Jones and McCarthy, 2006).
2.4.1.3 Ground granulated blastfurnace slag
Ground granulated blastfurnace slag (GGBS, conforming to BS 6699:1992) has also been used
in foamed concrete (Aldridge, 2000a). Similar to fine FA, the strength development was
higher in the longer-term (Wimpenny, 1996). However, the mix was observed to be unstable
where the bubbles coalesced and consequently the foam collapsed. Segregations have
frequently been observed with a number of surfactant types using this material and
Jones (2000) attributed the probable cause to chemical interaction between GGBS and foam.
2.4.1.4 Silica Fume
Silica fume were found to have little effect on shrinkage of foamed concrete (Narayanan and
Ramamurthy, 2000). The addition of condensed silica fume (SF) up to 10 per cent by weight of
cement significantly increased the strength of foamed concrete, where the foam content is less
than about 30 per cent (Kearsley, 1996; De Rose and Morris (1999). However, for higher foam
contents, the improvement in strength was minimal. Silica fume liberated much heat of
hydration (Larrard and Malier, 1999), which is not favourable to foamed concrete as it can lead
to significant core temperature rises and can have adverse effect (Jones and McCarthy, 2006).
2.4.1.5 Metakaolin
Metakaolin (MK) is a pozzolanic material which is highly active and effective pozzolan for the
partial replacement of cement in concrete. It is an ultra-fine material, with specific surface
area of metakaolin, in the range of 4000m2/kg to 12000m2/kg (Neville, 1996). MK is obtained
by the calcinations of kaolinitic clay at a temperature ranging between 500°C and 800°C. On
reaction with Ca (OH) 2, MK produces CSH gel at ambient temperature and reacts with CH to
produce alumina containing phases (Siddique and Klaus, 2009). The inclusion of metakaolin
in concrete improved several mechanical properties of concrete such as increased compressive
and flexural strengths, reduced permeability, increased resistance to chemical attack,

16
increased durability, reduced effects of alkali-silica reactivity (ASR), reduced shrinkage,
enhanced workability and finishing of concrete (Siddique and Klaus, 2009). Even though
metakaolin has the potential to improve the performance and enhance the durability of
concrete, its use in tests and applications are limited because of its high cost (Bai and Wild,
2002). The incorporation of metakaolin, up to 25% in blended cements, has shown pore
refinement to 63% of the original pore size (Frı´as, 2006). No literature has been published on
the use of metakaolin in foamed concrete, although it has been noted that the use of
metakaolin was possible to increase the strength of foamed concrete (Jones, 2000). In the
study of rheology, microstructure and instability in foamed concrete, metakaolin was used as
replacement of cement to a level of 20%.
2.4.1.6 Calcium sulphoaluminate cements
Calcium sulphoaluminate cements (CSA), known as the ‘third cement series’ are rapid-
hardening, high strength, expansive, or self-stressing cements. They were intended to
manufacture self-stress concrete pipes because it has swelling properties (Pe´ra and Ambroise,
2003). They originated from China and have been used as binder for concrete in bridges,
leakage and seepage prevention projects, concrete pipes, precast and prestressed concrete
elements, waterproof layers, glass fiber reinforced cement products, low temperature
construction and shotcrete. The alkalinity of CSA cements is about 1 pH unit lower than for
Portland Cement, which decreases protection from corrosion of steel reinforcement and alkali
aggregate reaction (Juenger et al., 2010). The durability of building materials made from CSA
cements was found to be comparable to conventional Portland cement-based materials,
although more studies are required for the long-term behaviour (Juenger et al., 2010).
Carbonation was found to be more rapid in CSA cements compared to Portland Cement
concretes, leading to the decomposition of ettringite which led to moderate strength loss. CSA
cements are significantly greener compared to Portland Cement. It releases less than half of
the CO2 per g of cementing phase compared to Portland Cement. The firing temperature used
to produce CSA clinker is about 200°C lower than that used for Portland cement clinker
(Juenger et al., 2010).
Cement alone is not the only factor governing the efficacy of foamed concrete. Whilst strength
is a vital factor in normal concrete, this is not the case in foamed concrete. With its own
17
unique set of characteristics and behaviour, foamed concrete should be regarded as a
materials group in its own right (Jones and McCarthy, 2005b). It is noted that different cement
content and cement combinations had affected the temperature profiles, foam and mix
stability (Jones and McCarthy, 2006).
2.4.2 Water
The role of water in concrete is well-documented. A brief review of this role is helpful in
understanding the importance of water in foamed concrete. In the production of concrete,
water is essential to precipitate chemical reaction with the cement, to wet the aggregate and to
lubricate the mixture for easy workability (Nawy, 2001). The chemical reaction between
cement and water produces the character of the colloidal gel or cement, hence, the proportion
of water to the cement is of more concern and not the proportion of water relative to the whole
mixture of dry materials.
The quantity of water in a mix is usually expressed either as litres/cubic metre or as a water-
cement (w/c) ratio by weight. The ‘free’ water is the amount after allowance has been made
for actual or potential absorption by the aggregate of which only a part is required for reaction
with the cement, while the rest is present simply to make the mix sufficiently workable for the
intended use (Tattersall, 1991).
Mixing water should conform to BS EN 1008 Mixing water for concrete. This standard
includes potable water and establishes the suitability of water that is recovered or reclaimed
from processes in the concrete industry or where water from non-mains sources, such as
boreholes, is in use. Highways Agency and TRL (2001) noted that in foamed concrete it is
crucial to use potable water when using a protein-based foaming agent because organic
contamination can have an adverse effect on the quality of the foam, and hence the concrete
produced.
Several studies have shown the effect of water on some properties of foamed concrete is not
similar to the effects in normal concrete. Dransfield (2000) found that strength increased with
increasing w/c ratio and with increased workability. He suggested that w/c ratio plays a
smaller part in the strength of foamed concrete. In contrast, other researchers found that the
18
w/c ratio is a significant factor in foamed concrete; too little water potentially leads to
disintegration, too much water leads to segregation. Kearsley (1999), Highways Agency and
TRL, (2001) and Nambiar and Ramamurthy (2006b) are in agreement that when there is too
little water, water is withdrawn from the foam and the foam degenerates rapidly. Since
density of foamed concrete is a function of the percentage foam added to the mixture, this will
cause a variation in the density. Conversely, these authors also noted that, when there is too
much water, segregation will take place.
In addition, in this context of high w/c ratio, Highways Agency and TRL, (2001) suggested
that water-cement ratio of the base mix required to achieve adequate workability is dependent
upon the type of binder(s), the required strength of the concrete and whether or not a water-
reducing or plasticizing agent has been used.
2.4.3 Fillers
2.4.3.1 Fine aggregates
Only fine aggregate or sands with particle size of up to 5.0 mm in excess of 50% passing
600 m sieve are used (BCA, 1991) since coarser aggregates may settle in the lightweight
grout and cause collapse of the foam during mixing (BCA, 1991). However, fine sand is
practically restricted to mixes with densities above 1200 kg/m3, below which the fillers must be
partially or totally replaced with other fillers such as coarse fly ash (Dransfield, 2000).
2.4.3.2 Coarse fly ash
Coarse fly ash (conforming to BS 3892: part 2:1997 or BS EN 450: 1995) can be used as a partial
or total replacement for sand to produce foamed concrete with a dry density below 1400 kg/m3
(Highways Agency and TRL, 2001). Foamed concrete mixes using coarse fly ash exhibited
enhanced consistency and rheology compared to sand concretes and improved longer-term
compressive strength (Jones and McCarthy, 2005b). However, the fly ash mixes required up
to three times more foam than the calculated quantity to achieve target plastic density, which
was probably due to foam instability. They suggested that the instability was possibly due to
the highly fluid consistency of the base mix and the adverse effects of the highly residual

19
carbon in the ash. In his study, Nambiar and Ramamurthy (2006b) found similar results using
coarse fly ash.
2.4.3.3 Other aggregates
Replacement of sand/fine aggregate by demolition fines or conditioned fly ash has a beneficial
effect on a wide range of foamed concrete properties, which is a major breakthrough in
potentially saving aggregate materials for construction purposes (BRE, 2004, Yerramala, 2008
and Rao, 2008).
Highways Agency and TRL (2001) stated that limestone fines up to 10 per cent by weight of
cement were added in conjunction with fly ash to accelerate the setting rate of foamed
concrete. Other aggregates include lightweight aggregates up to 16mm in size, such as
expanded polystyrene granules and Leca expanded. Any such aggregates should be about the
same density as foamed concrete and have minimal capacity for absorbing water.
Other fillers such as chalk, crushed concrete (Aldridge, 2005), crushed dust, expanded
polystyrene granules, Lytag fines (Dijk, 1991), polystyrene beads (Cox, 2005) and granite dust
(BCA, 1991) had been found to be used as fillers in foamed concrete. For the purpose of the
current study, the main fillers used are fine aggregates (sand) and coarse fly ash, as these are
the common fillers used in construction. Demolition fines were also briefly included in the
study of stability as comparison to main fillers.
2.4.4 Foam
A significant characteristic of foamed concrete is the ability to control its density over a wide
range, and this is achievable by adding a calculated amount of foam to the base mix (Wee et
al., 2006). There are two methods of introducing foams in foamed concrete production; by
adding preformed foam or by mixing the mortar with foaming agent such as detergents, resin
soap, glue resins, saponin, and hydrolysed proteins. The most common type is the use of
preformed foam as it is reported to be the most economical and controllable pore-forming
process and there are no chemical reactions involved (Nambiar and Ramamurthy, 2000b; Wee
et al., 2006). Preformed foam comprises an aqueous foaming agent and air. The foaming
20
agent is important as it gives the foamed concrete its final properties. If the foaming agent
collapses, the mix may collapse leaving a very dense base mix.
The properties and quality of foam added to produce foamed concrete are critical, particularly
when the foam comprises more than 50% of the foam and base material blend, which occurs at
densities at or below 1100 kg/m3 (Aldridge, 2005). The quality of the foam is affected by its
density, the dilution factor of the agent, the foam-making process and the adding and
blending process with the mortar. The foam must be capable of remaining stable and not
collapsing during pumping, placement and curing (Dijk, 1991).
Preformed foam is divided into two categories; wet foam and dry foam. Wet foam is
produced by spraying a solution of foaming agent and water over a fine mesh while dry foam
is produced by forcing a similar solution of foaming agent and water through a series of high-
density restrictions, combined with forced compressed air into a mixing chamber. The wet
foam is slightly larger in size, loose and of size range of 2-5 mm in diameter. The dry foam is
more stable, smaller at less than 1mm in diameter, thick, tight and similar to appearance of
shaving foam. The choice of foam depends on the application of foamed concrete (Aldridge,
2005).
2.4.4.1 Foaming agents (Surfactants)
Surfactants are wetting agents that lower the interfacial tension between two liquids and also
lower the surface tension of liquid, allowing easier spreading. They contain both hydrophilic
(water loving) and hydrophobic (water fearing) components at the molecular level. This
promotes emulsion formation and enables the surfactant to reduce interfacial tension between
two liquids by adsorbing at their interface. The term ‘interface’ indicates a boundary between
any two immiscible phases; the term ‘surface’ denotes an interface where one phase is a gas,
usually air (Rosen, 2004).
Synthetic or protein-based surfactants can be used to produce foam (BCA, 1994) and are
formulated to produce air bubbles that are stable and able to resist the physical and chemical
forces imposed in the process of making foamed concrete. The surfactant solution consists of
one part surfactant and between 5 to 20 parts water (BCA, 1994). The concentration should be
21
chosen with regard to its critical micelle concentration (CMC). CMC is a value where the
surface tension stays constant after more surfactant is added, as shown in Figure 2.1.
Protein-based surfactants were the original surfactants. They were relatively crude materials
derived from hydrolysed animal carcass residues which were subjected to biodegradation.
However, the protein-based surfactants have been developed to be highly refined and
stabilised. The foam produced is strong, closed cell, stable and has a strong firm texture
which blends easily into mortar with little breakdown. Other properties include lower
expansion ratio to solution volume to foam volume, sensitive to the alkalinity of the mix and
blends easily into the mortar with little breakdown (Dransfield, 2000). Protein-based
surfactants produce foamed concrete with strength/density ratio of about 50% to 100% higher
compared to synthetic surfactants (McGovern, 2000). Additionally, it was noted that these
add water repellent properties to the foamed concrete (Dijk, 1991).
A synthetic surfactant can be classified by the presence of charged groups in its head. The
head of an ionic surfactant carries a net charge. Anionic is the group in which the charge is
negative. This characterises about 70 percent of the surfactants used to produce foamed
concrete. Cationic is the group of which the charge is positive. Cationic makes up less than 5
per cent of the surfactants used to produce foamed concrete. A non-ionic surfactant has no
charge groups in its head and makes up 25 per cent of surfactants used to produce foamed
concrete. The lack of electric charge may give a greater stability to the foamed concrete mix.
The group of surfactant with heads of two oppositely-charged groups are termed amphoteric
or zwitterionic. Their molecules can sustain either a positive or negative charge, or both
charges, depending on the pH of the solution. They are rarely used to produce foamed
concrete (Myers, 1992).
Dransfield (2000) stated that synthetic surfactants are stable, easy to formulate and consistent
in performance. However, the bubble size is larger and the cells are more open due to higher
expansion. These results in foamed concrete of lower strengths compared to foamed concrete
produced using protein-based surfactants.

22
As noted by the Highway Agency and TRL (2001), at present, the effect of the nature of the
surfactant on the properties of the foamed concrete is largely unknown. Selections of
surfactants are based on an empirical basis as the performance of the various types of
surfactant varies with the type of binder. In this study, commercially available synthetic and
protein surfactants are investigated.
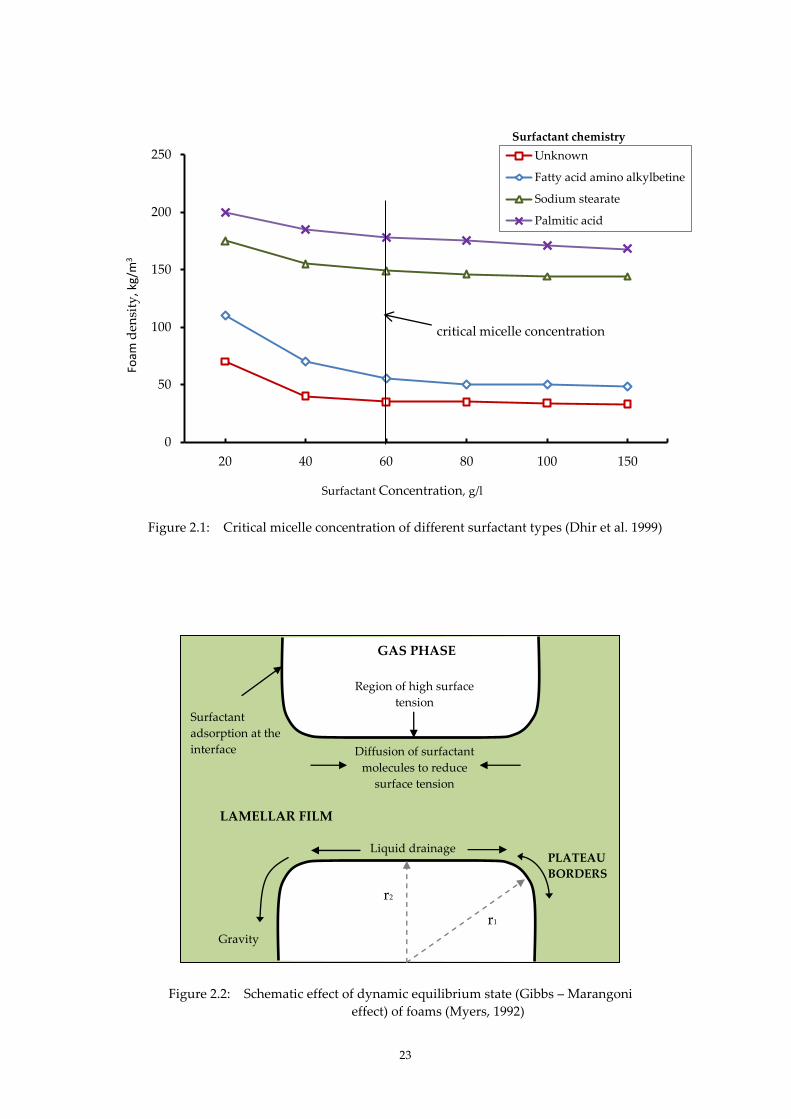
23
Figure 2.1: Critical micelle concentration of different surfactant types (Dhir et al. 1999)
0
50
100
150
200
250
20 40 60 80 100 150
Unknown
Fatty acid amino alkylbetine
Sodium stearate
Palmitic acid
Foam
den
sity
, kg/
m3
critical micelle concentration
Surfactant chemistry
Surfactant Concentration, g/l
Figure 2.2: Schematic effect of dynamic equilibrium state (Gibbs – Marangoni
effect) of foams (Myers, 1992)
Region of high surface
tension
Diffusion of surfactant
molecules to reduce
surface tension
Surfactant
adsorption at the
interface
Liquid drainage PLATEAU
BORDERS
Gravity
GAS PHASE
LAMELLAR FILM
r1
r2

24
2.4.4.2 Foam Stability
When bubbles form, pressure and surface tension differentials occur at two distinct areas of
the bubbles. At the Plateau border, there is lower surface tension compared to that at the
lamellar film, where there is a higher surface tension, as shown in schematically in Figure 2.2.
At the gas-liquid interface, the pressure difference (P) and the surface tension (acting upon
an element of the surface is expressed according to Laplace law:
P= (1/r1 + 1/r2 ) Equation 2.1
where,
P = pressure difference across a curved interface due to the surface tension of the
solution.
= surface tension of the solution
r1, r2 = principal radii of curvature of the surface (Plateau borders and less curved regions in
the lamella)
The differences in curvature (r1, r2) cause fluid drainage from the lamellar regions to the
Plateau borders to restore the imbalance in liquid pressure. Additionally, liquid drainage
from the lamellae also occurs because of gravitational forces. Liquid drainage by gravity is
important in thick lamella, when the foam is first formed, while drainage by surface tension
occurs when the lamellae are thin. These factors resulted in the thinning of the film. Two
theories which explained this effect are known as the Gibbs effect and the Marangoni effect
(Rosen, 2004). The Gibbs effect is based on the theory that the change in surface tension
corresponds to the change in concentration of the surface active solutions. Alternatively, the
Marangoni effect is based on the theory that the diffusion of surfactant molecules from the
Plateau border to the lamellar film occurs to oppose film thinning. Both theories postulate
that these occurrences continue until a critical film thickness is achieved at 50 – 100Å where
the film ruptures spontaneously, when it is unable to withstand the exerted pressure.

25
2.5 MIX PROPORTIONS
There is no standard method for designing foamed concrete mix (Highway Agency and TRL,
2001). Furthermore, the method used for designing normal concrete mix compositions cannot
be used for designing foamed concrete mix compositions. For normal concrete, the
compressive strength determines the water/cement ratio in order to calculate the volume of
water required. By contrast, in foamed concrete, the target density and water/cement ratio are
the determining factors (Kearsley and Mostert, 2005a). The mass of the cement and the
volume of foam can be calculated using these target values and can take into account the
densities of the constituent materials. Basically, for a target plastic density (D, kg/m3) and
water/cement ratio (w/c), the cement content (c, kg/m3), the total mix water (W, kg/m3) and
fine aggregate content (f, kg/m3) are calculated from equations as follows:
Target plastic density, D = c + W + f Equation 2.2
where c = cement content, f = fine aggregate and free water content, W= (w/c) x c
Additionally, the air-void characteristics plus the curing regime determines the strength of
foamed concrete. The air-void characteristic is determined by the type of foam used, and is
governed by the type of foaming agent (Aldridge, 2005). As noted, both synthetic and protein
surfactants produced different qualities of foam, resulting in different characteristics of
foamed concrete. Since there is a wide range of surfactants available, the selection of suitable
surfactants depends on the particular application (Highway Agency and TRL, 2001).
Synthetic surfactants give a higher expansion, produce foamed concrete of lower strengths
compared to protein surfactants and generally work at lower concentrations (Dransfield,
2000). In contrast, the smaller size and more stable bubbles from protein-based surfactants
produce foamed concrete of relatively high density and high strength (Highway Agency and
TRL, 2001).
Dransfield (2000) stated that the role of w/c ratio in foamed concrete is relatively minor and
that strength may actually increase with increasing w/c ratio and with increased workability.
However, the Highway Agency and TRL (2001) reported that reduced water/cement ratio
caused an increase in strength of the foamed concrete but at the expense of reduced

26
workability. As a result of low workability, there is an increased foam breakdown during
mixing (Dransfield, 2000) and the collapse of the foam will alter the final w/c ratio rather than
the calculated mix proportion (Highway Agency and TRL, 2001).
The calculation of the mix design is further complicated when using other materials such as
fine fly ash, FAf (replacing part of cement) and/or coarse fly ash FAc(replacing part of sand) as
this alters the amount of water required (Kearsley and Mostert, 2005a; Jones and McCarthy,
2005a).
2.6 MIXING PROCESS
The mixing process has a significant influence on foamed concrete. Within this process a
single factor or a combination of factors can affect the quality of foamed concrete, such as the
type of mixer, the speed of rotation and the mixing time. The mixer type is responsible for
uniform distribution of preformed foam (McCarthy, 2005). The most successful type has a
folding action where paddles rotate on a horizontal shaft or a screw action in a trough
(Dransfield, 2000 and Jones, 2000). By contrast, pan mixers cause the preformed foam to sit on
the mortar surface instead of being folded in; rotating mixers have no folding action and rely
on free-falling action (Dransfield, 2000). Additionally, the rotating mixers do not provide
enough shear to produce sufficient base-mix workability (Jones, 2000). The speed of rotation,
such as in a ready-mixed truck, affects the foam dosage required (Highway Agency and TRL,
2001). Short mixing times were said to produce inhomogeneous foamed concrete, while
prolonged mixing at high speeds leads to disintegration of the foam (Kearsley, 1999).
However, Beningfield et al. (2005) asserted that there is no evidence to prove that prolonged
mixing produces excessive air or causes air loss.
The process of blending foam with the base mix can be carried out in ready-mixed trucks,
either at the plant or on site (Aldridge, 2005). There are two basic methods of producing
foamed concrete; the preformed foam method and the inline method. With the preformed
foam method, the base materials are delivered to the site in a ready-mixed truck and
preformed foam is injected directly into the back of the ready-mixed truck whilst the drum is
on fast spin. The volume and quality of the foamed concrete is determined by the capacity of
the ready-mixed delivery truck.
27
The other method of site mixing is the inline system which has two types: the wet method
inline system and the dry method inline system. In the wet method, the dry base materials
and the foam are fed through a series of static inline mixers where the two components are
mixed together. As illustrated schematically in Figure 2.3, the foam can be added through
foam injection into the truck mixer, a special blender or into a flexible hose (Dijk, 1991). These
mixers have the effect of blending the foam and the base materials together into a completely
homogenized mix ensuring a completely repeatable process. For control purposes, the density
is constantly checked via the continual on-board density monitor. The output volume is not
governed by the size of the truck, which makes this process an effective method of working on
site (Aldridge, 2005).
The dry method inline system operates on a similar principle except that the dry materials are
loaded in silos which can be weighed and batched on site (Aldridge, 2005; Cox and Dijk, 2002).
Once blended, the base mix is then pumped to a mixing chamber where foam is added. This
system is ideal in areas where base materials are difficult to obtain. However, the
disadvantage is that it requires a large amount of water on site to create the mix, which is
undesirable for congested city centres or project sites where water cannot be supplied easily
(Aldridge, 2005).
2.7 CURING
The need for curing concrete has been recognized since the inception of concrete. Although
methods of curing for conventional concretes have been established, the curing regimes for
foamed concrete are still being explored. Kearsley (1996 and 1999) studied conventional water
curing, sealed curing and air curing at different temperatures, moist curing, steam curing at
atmospheric pressure and high pressure steam curing (also called autoclaving). She
concluded that water-cured foamed concrete exhibited lower apparent strengths and the
highest strengths were obtained on specimens cured at 500C and on specimens sealed in
plastic bags and held at a constant temperature of 220C. Increased temperature curing
produced higher compressive strengths but is not regarded as cost-effective (Kearsley, 1999).
After reviewing these varieties of curing, it was decided to adopt sealed curing in which the
sample is wrapped in cling film and stored in plastic bags at constant temperature of 220C.
This curing regime one of the most common regimes adopted by other researchers (Jones and

28
McCarthy, 2004, 2005a, 2005b, Kearsley and Wainwright, 2000a, 2000b, 2001a, 2001b, Wee et
al., 2006)
2.8 DENSITY
The importance of the density of foamed concrete is well documented (Jones et al., 2003; Jones
and McCarthy, 2006; Nambiar and Ramamurthy, 2006b). The ability to control its density is
one of the main advantages of foamed concrete. The designed densities which are within the
range of 300 to 1600 kg/m3 have a strong influence on the properties of the foamed concrete.
Although there is no standard method for proportioning foamed concrete, the general rules
regarding w/c ratio, free water content and maintaining a unit volume is for a specified target
plastic density that becomes a prime design criterion (Jones and McCarthy, 2006).
It is difficult to design for a specific dry density, as foamed concrete will desorp between 50
and 200 kg/m3 of the total mix water, depending on the concrete plastic. A tolerance on plastic
density is usually acceptable to ± 50 kg/m3 of the target value, which is typical of industry
practice for foamed concrete production (Jones and McCarthy, 2006).
Instability in foamed concrete causes the densities to vary and this may cause segregation,
unpredictability, collapse and eventually unfitness for purpose. Increased density after
solidification may occur due to the collapse of bubbles. However, foamed concrete made with
protein surfactants is said to have same the densities both when freshly mixed and after 24
hours (Yerramala, 2008).
A variation in design density ratio (measured fresh density divided by design density) with
water-solids ratio for mixes with different filler type for 1000 kg/m3 is shown in Figure 2.4
(Nambiar and Ramamurthy, 2006b). The density ratio shown is higher than unity at lower
consistence. Nambiar and Ramamurthy (2006b) suggested that the mix was too stiff to mix
properly thus causing the bubbles to break during mixing and this resulted in increased
measured density. Conversely, in the same study, at higher water-solids ratio, higher water
content made the slurry too thin to hold the bubbles. This caused segregation of the foam
from the mix, hence segregation of the mix itself, which resulted in an increase in measured
density.

29
Figure 2.3: Schematic diagram of the production of foam for foamed concrete
Figure 2.4: Variation of density ratio with water–solids ratio for different filler type (Nambiar and
Ramamurthy, 2006b)
0.9
1.0
1.1
1.2
1.3
1.4
1.5
1.6
0.15 0.20 0.25 0.30 0.35 0.40 0.45 0.50 0.55 0.60
Den
sity
rat
io
Water solids ratio
Design density 1000 kg/m3
Cement:coarse sand 1:1
Cement:fine sand 1: 1
Cement:fly ash:fine sand
1:0.5:0.5
Cement:fly ash 1:1
Foam
Foaming lance
Water Foaming agent
Pre-foaming
solution
Air compressor
Foam
generator
30
2.9 PROPERTIES OF FOAMED CONCRETE
The properties of foamed concrete are diverse, ranging from fresh state properties, early age
properties to hardened state properties. For the purpose of the current study and this
literature review in particular, discussion will be confined to three significant properties,
namely, workability in the fresh state, rate of hardening and instability in the early age stage.
Of the range of properties in the hardened state, discussion will be confined to compressive
strength, modulus of elasticity and microstructure. In addition, other related properties will
also be cited in this review.
2.9.1 Fresh State Properties
The fresh state of all cement–based materials may be only transient, but it is of major
importance to the ultimate performance in the hardened properties (Banfill, 2003, Hanehara
and Yamada, 2008). However, in most reported research, the fresh state of cement-based
materials is usually described by its characteristics.
Generally, the properties of foamed concrete are described as free-flowing, self-levelling and
self- compacting (Dransfield, 2000; Jones et al., 2003; Jones and McCarthy, 2005a, 2005b, 2005c,
2006). In basic terms, the workability of foamed concrete containing relatively large amounts
of air pores is generally excellent; it has nearly fluid consistency, is easily pourable,
homogeneous and small possibility of bleeding and segregation. Additionally, foamed
concrete is readily placed without need of further consolidation (Basiurski, 2000).
The term ‘workability’, as commonly described in normal concrete, is limited in definition and
methods of measurement; however, the principles of rheology are more for describing the
behaviour of fresh concrete (Domone, 2003).
For this reason, the fresh state of foamed concrete is clarified in terms of workability (as
universally described in all cement–based materials) and of the use of rheological properties
as described by researchers such Jones et al., (2003), Jones and McCarthy (2005a; 2005b) and
Highways agency and TRL (2001). Whilst many studies have been conducted on rheology of

31
cement-based materials (Tattersall, 1991; Domone, 2003; Banfill, 2003; Lachemi et al., 2007;
Roussel, 2007), to date, the literature on the rheology of foamed concrete is very limited.
2.9.1.1 Rheology
Rheology, the science of the deformation and flow of matter, is concerned with the
relationships between stress, strain, rate of strain and time. As the rheology of cementitious
material is closely related with developing performance of concrete, the rheology is
considered one of the most important factors for all cement–based materials (Banfill, 2003).
Rheology is important in understanding how cement paste, grout, mortar and concrete
perform in practical applications and the scope it offers for characterising their properties
(Banfill, 2003).
Paste, mortar and concrete are considered as non-Newtonian fluid, of which, the viscosity
changes with the applied strain rate. The most commonly used model for the prediction of
these cementitious material is the Bingham model, which requires two important parameters,
namely, yield stress and plastic viscosity Bingham fluid follows the equation:
Equation 2.3
where is the shear stress (N/m2) at the shear strain rate (rev/sec). is the yield stress
(N/m2) and is the plastic viscosity (Ns/m2). The yield stress is the stress above which the
material becomes fluid and starts to flow and is associated with filling capacity and ability to
flow under applied stress, as shown in Figure 2.5. Plastic viscosity, is the measure of how
easily the material flows, once the yield stress is overcome. Plastic viscosity is associated with
the velocity at which a given concrete will flow, once flow is initiated (Roussel, 2007). Lower
yield stress gives less resistance to start the flow of concrete. Higher viscosity prevents
segregation, but provides high resistance to the flow of concrete.
Foamed concrete behaves like a non-Newtonian which follows the Bingham model. In basic
terms, the workability of foamed concrete containing relatively large amounts of air pores is
generally excellent - easily pourable, nearly fluid consistency, homogeneous and without
possibility of bleeding and segregation and readily placed without need of further

32
consolidation (Basiurski, 2000). Foamed concrete has the tendency to manifest reduced self-
levelling in the very low density range, because of the reduced dead weight and the increased
cohesion of the concrete arising from the high volume of air (Nambiar and Ramamurthy,
2006b). This statement confirms an earlier study by Jones and McCarthy (2005a) who found
that lower density foamed concrete exhibited highest apparent yield stress which they claimed
could be attributed to the reduced self-weight, higher air content and lower water content.
They also found that, within the range of densities studied (1000-1400 kg/m3), the plastic
viscosities of the foamed concrete were small. However, foamed concretes with sand
exhibited higher yield values than foamed concretes with fly ash at higher densities (1400-
1800 kg/m3). This was attributed to much larger and more angular shaped sand particles with
smaller surface area.
Jones and McCarthy (2005a) stated that yield values of foamed concrete are typically less than
2 Nm, which is indicative of self-flowing behaviour. Replacing sand with coarse fly ash
reduced the yield value, as shown in Table 2.2 (McCarthy, 2004). With increased plastic
density, this effect is increased. However, in plastic viscosity, the decrease is smaller with
increased plastic density. The yield values were obtained by plotting speed, (rev/sec) against
torque (Tattersall, 1991)
Therefore, reducing the filler mean size particle greatly reduces the yield stress necessary to
get the mix flowing and produces a more fluid concrete due to rounded particle morphology
(McCarthy, 2004). This permits effective particle packing, reducing water demand without
decreasing fluidity of the mix (Nonat and Mutin, 1991). Additionally, they noted that fly ash
particles are less reactive than cement; hence the retardation effect of fly ash results in
decreased viscosity and yield stress of fly ash cement.
All these basic knowledge of rheological behaviour of foamed concrete will be further
investigated in this study that will include the effect of different types of surfactants to the
rheological properties.
33
2.9.1.2 Rate of hardening
There is no standard method for determining the initial and final setting times of foamed
concrete, although the methods given in BS 4550:1978 and ASTM C266-89 for cements
provided the basis of suitable methods for the preparation of foamed concrete (Highways and
TRL Agency, 2001).
In previous studies, stiffening for all foamed concrete mixes did not appear to take place until
5 hours after casting at 200C (Dhir et al., 1999). As shown in Figure 2.6, all foamed concrete
mixes achieved the set limits given in BS 4550: 1978 up to 9 to 10 hours. The 'setting' time of
foamed concrete is usually between 12 and 24 hours. The amount of foam incorporated into
the mix has an effect on the stiffening time of foamed concrete since foaming agents have
chemical similarities to retarding admixtures. Consequently, the stiffening time is inversely
proportional to foamed concrete density (Jones, 2000).
The average setting time of foamed concrete with a 1-day strength of 1.0 N/mm2 was between
12 and 24 hours, although this could be improved with rapid hardening cement types,
insulating formwork, raising the ambient temperature or using accelerators (Dijk, 1991).
Accelerators can be used to increase the slow rate of stiffening and strength development of
foamed concrete. Since the mechanism for accelerated curing is not fully understood, its use
can be recommended only on empirical basis. Calcium chloride is regarded as the most
effective accelerator which can be used in most conditions in foamed concrete because carbon
steel reinforcement is rarely used with foamed concrete, unlike typical reinforced concrete
(Dransfield, 2000).

34
Slope = Plastic Viscosity
Shear
Stress
Yield
Stress
Shear Rate
Table 2.2: Typical rheology of sand and fine fly ash, FAf aggregate mixes, from Dhir et al. (1999)
Plastic density Yield Value, Nm* Plastic Viscosity, Ns/m2
kg/m3 Sand FA Decrease,% Sand FA Decrease, %
1400 0.82 0.44 46 0.034 0.025 26
1600 1.13 0.52 54 0.040 0.032 20
1800 1.80 0.69 62 0.051 0.045 12
1. Assessed using Brookfield RVT Viscometer
2. Nm* is the yield value obtained from plotting graph speed (rev/sec) against torque
(N/m)
Figure 2.5: Bingham model
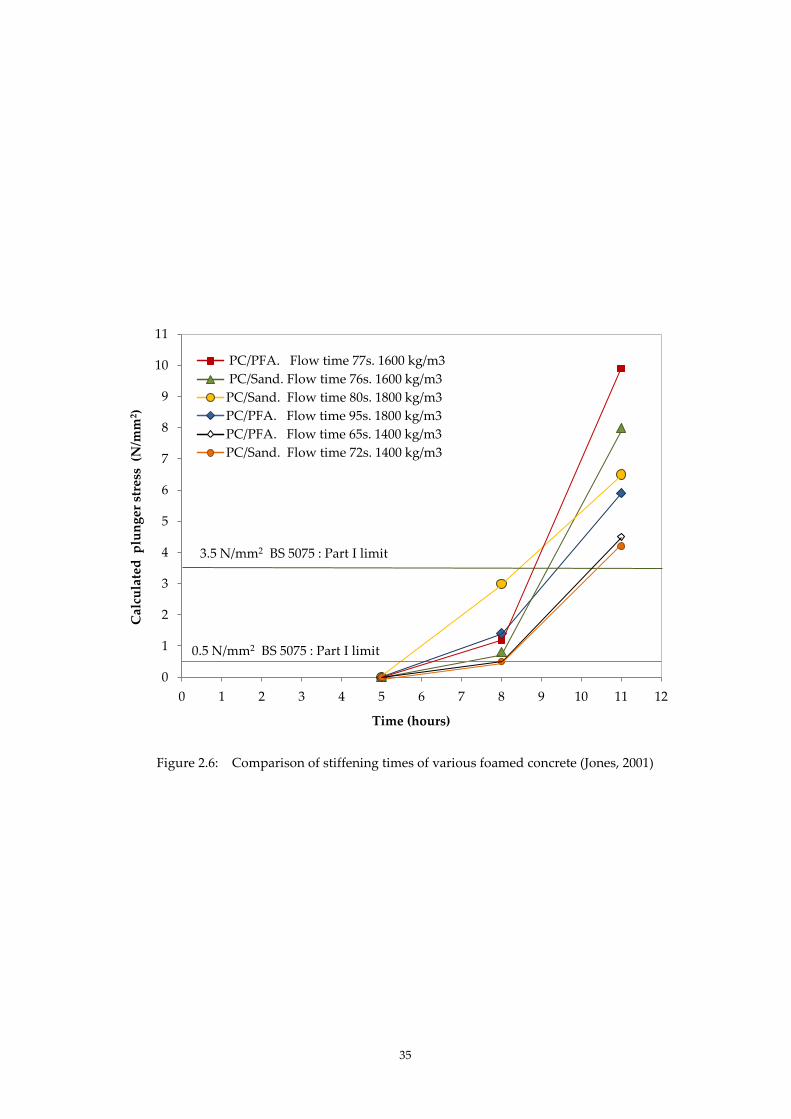
35
Figure 2.6: Comparison of stiffening times of various foamed concrete (Jones, 2001)
0
1
2
3
4
5
6
7
8
9
10
11
0 1 2 3 4 5 6 7 8 9 10 11 12
PC/PFA. Flow time 77s. 1600 kg/m3
PC/Sand. Flow time 76s. 1600 kg/m3
PC/Sand. Flow time 80s. 1800 kg/m3
PC/PFA. Flow time 95s. 1800 kg/m3
PC/PFA. Flow time 65s. 1400 kg/m3
PC/Sand. Flow time 72s. 1400 kg/m3
Time (hours)
Cal
cula
ted
plu
ng
er s
tres
s (
N/m
m2 )
3.5 N/mm2 BS 5075 : Part I limit
0.5 N/mm2 BS 5075 : Part I limit
36
2.9.1.3 Stability
In order to understand the importance of stability in relation to other properties of foamed
concrete, it is imperative to define stability. Stability is one of the variables of the definitions
of workability and consistency in normal concrete. Stability is cited as the ability to resist
segregation, a condition which refers to the cohesion of the mix and rarely used as an objective
and quantifiable description of a concrete mix (Neville, 1996). In self-consolidating concrete,
which is highly flowable and contains relatively low content of cementitious materials,
stability is essential to ensure an adequate air void system (Khayat and Assaad, 2002). The air
void system has to remain stable during agitation, placement and setting.
Stability in foamed concrete had been described for fresh state conditions of two materials;
preformed foam and foamed concrete (Aldridge, 2001, 2005; McGovern, 2001; McCarthy, 2004;
Jones and McCarthy, 2006; Nambiar and Ramamurthy, 2007a, 2007b, 2008). The inclusion of
foam in foamed concrete raises the expectation that the stability of the foam will have a strong
influence on the latter, particularly when the volume of foam to base mix becomes greater
than 50% (Aldridge, 2005). Larger bubble size and more open cells which are characteristics of
foams produced by synthetic surfactants, are said to be less stable compared to foams
produced from protein-based surfactants (McCarthy, 2004). Additionally, the stability of the
foam was found to be affected by surface charges, ‘free’ water content, fly ash and chemical
admixtures (Jones and McCarthy, 2006).
Jones and McCarthy (2006) conducted a study that suggested that the stability of foamed
concrete can be assessed by comparing the calculated and actual quantities of foam required
to achieve a plastic density and by visual observation. In their study incorporating fly ash in
foamed concrete mixes, the foam stability was found to be affected by the high fly ash content
which had caused the foam to collapse. This resulted in additional ‘free water’ which, in turn,
required higher foam volume to achieve the target plastic density. By contrast, Nambiar and
Ramamurthy (2007b) initially defined stability of foamed concrete mix as the state of condition
at which measured density is equal to or nearly equal to design density. In a later study,
Nambiar and Ramamurthy (2008) defined stability of foamed concrete as ‘the state of the mix
at which the density ratio is closer to unity’. They affirmed that the stability of foamed
37
concrete depends on three factors: the foam volume, consistency of the base mix and filler
type.
Whilst appreciating the variety of definitions of stability in foamed concrete, earlier definitions
had been descriptive of the fresh state properties of both, preformed foam and foamed
concrete. However, in this current study, stability is identified as a characteristic of early age
properties of foamed concrete. This feature may be akin to the stability found in normal
concrete explained by Neville (1995) as cohesion of the mix, that is, resistance to segregation
that has meaning only under a given set of circumstances (Neville, 1995).
The ideal mix design of any fluid concrete is located somewhere between being fluid enough
to flow and fill to having acceptable stability to resist segregation and deformations (Roussel,
2007). This is comparable to foamed concrete, where, in most applications it is expected to
flow and self level. Investigations into the properties of foamed concrete have been based on
assumptions in primary studies when its stability has not been called into question. The
literature reflects an assumption that foamed concrete stability is beyond doubt. For example,
it had been stated that foamed concrete is said to exhibit stable consistency with low plastic
shrinkage (Technology Bulletin, University of Dundee: Issue 13, 2007) and one of the
advantages of using foamed concrete is that foamed concrete does not collapse after
placement as it sets (Basiurski, 2001). However, only passing references to stability have been
made, little attention has been paid to exploring the validity of assumptions about stability.
Research has been incomplete in this respect.
In preliminary work, concerns have been expressed about instability in foamed concrete.
Bennett (2002) suggested the water: cement (w/c) ratio of the base mix should be kept fairly
high to avoid water being extracted from the foam thus causing it to collapse. Jones et.al
(2005c) noted foam collapse during mixing and transporting although the degree of collapse is
unpredictable and varies with mix constituents. Segregation is often checked as measure of
instability (Dransfield, 2000; Jones and McCarthy, 2006).
The paucity of literature in this area reinforces the lack of concern about stability in the past.
In one recent study, Nambiar and Ramamurthy (2008) found that stability of foamed concrete

38
is affected by the water content in the base mix, the amount of foam added and other solid
ingredients in the mix. Although this single piece of research has examined the constituent
materials, in order to expand our understanding of the behaviour of foamed concrete, it is
necessary to consider other possible factors that affect the stability.
The purpose of the present study is to examine the nature, structure and production of
foamed concrete in an attempt to identify causal factors that give rise to potential instability in
foamed concrete. Additionally, this study examines the relationship of stability with other
properties namely, rheology and microstructure.
2.9.2 Hardened State Properties
2.9.2.1 Compressive Strength
In the past, strength was not the main issue when using foamed concrete (Dransfield, 2000;
Beningfield, 2005) as it was typically used in void filling, highway reinstatement and other
underground works. The typical strength value for foamed concrete of densities between 800
– 1000 kg/m3 is between 1 – 8 N/mm2 (BCA, 1994; Dransfield, 2000) which was sufficient for its
purpose in underground works. With a minimum strength of 25 N/mm2, foamed concrete has
the potential to be used as a structural material (Jones and McCarthy, 2005b). Based on this
objective, several research projects were undertaken to study the possibility of increasing
compressive strengths (Kearsley, 1999; Jones and McCarthy, 2005b; Nambiar and
Ramamurthy, 2006b). The summary of properties of foamed concrete indicating the typical
compressive strength as defined by BCA (1994) is shown in Table 2.3.
The compressive strength of foamed concrete is affected by the density, cement type and
content, water/cement ratio, surfactant type and curing regime (Jones and McCarthy, 2005c).
Density has been shown to be directly related to compressive strength, where increases in
density resulted in increases in compressive strength (Kearsley, 1999; Jones, 2000; Nambiar
and Ramamurthy, 2006b). As illustrated in Figure 2.7, this is explained by the greater air
content in lower density which makes the foamed concrete weaker (Dhir et al. 1999).
However, density is not directly reliable as an indicator of strength or quality, when
constituents of the foamed concrete vary (Highway Agency and TRL, 2001).
39
Typically, as reported by Neville (1996) higher cement content resulted in increased strength
of normal concrete. Similarly, in foamed concrete, Jones (2000) found that an increase in
cement content increased the strength for a range of values although the strength increase was
found to be minimal above cement content 500kg/m3. Thus, owing to this minimal strength
gain, adhering to an acceptable minimum cement content is both economical and practicable
(Kearsley and Mostert, 2005a).
For a given density, different combinations of other cements and different cementitious fillers
(coarse fly ash, conditioned fly ash, incinerator bottom ash, demolition fines, china clay,
quarry fines and others) influenced the compressive strengths (Jones and McCarthy, 2005c).
Keeping other factors constant, finer sand showed an increase in strength compared to coarser
sand (Nambiar and Ramamurthy, 2006b), Figure 2.8. In Figure 2.9, Jones (2000) noted that
when coarse fly ash was used as filler, the strength showed significant increase between 28 to
56 days compared to the strength achieved when sand was used in which case only a marginal
increase in strength occurred after 28 days. In that particular study, it was observed that at
any given density, the 28-day compressive strengths of fly ash foamed concretes were higher
than sand foamed concretes. The difference was further increased after 56-days. Other
researchers found similar trends when using fly ash as cement replacement and/or coarse fly
ash as fillers (Jones and McCarthy, 2005a; Kearsley and Mostert, 2005a; Nambiar and
Ramamurthy, 2006b). The effect of other cements such as ground granulated blast furnace
and silica fume also influenced the compressive strengths and other properties of foamed
concrete, for example, the consistency and stability (Highway Agency and TRL, 2001).
It is well established that in normal concrete decreases in w/c ratio cause significant increase in
strength. However, this trend is not confirmed in foamed concrete in the current literature.
Dransfield (2000) observed that w/c ratio was not only less significant, but that, the strength
increased with increases in the w/c ratio. On the other hand, De Rose and Morris (1999) found
that strength decreased with increasing w/c ratio up to 0.45, and noted that above this reading,
the trend is reversed, that is, where the strength increased with an increase in the
water/cement ratio.
40
The surfactant used is also important as it gives the foamed concrete its final properties
(Aldridge, 2000). Protein-based surfactants produced more stable, smaller and stronger
bubble structure, hence higher strength foamed concrete compared to synthetic surfactants
which produces bigger bubbles (BCA, 1991; Aldridge, 2000; McGovern, 2000). This higher
performance by protein surfactants can be attributed to the ability to take on water and hold it
within the protein structure. This makes it somewhat absorbent which allows hydration
process; hence cement particles are well-bonded around air bubbles. As a result, the
mechanical strength of the air matrix is stronger (McGovern, 2000).
The curing regime has a significant effect on the strength of foamed concrete. In her study,
Kearsley (1999) noted that highest strengths were obtained on specimens cured at 500C, then
sealed in plastic bags, and kept at constant temperature of 220C. By contrast, she further
showed that specimens that were water-cured gave low strengths which were probably due to
build-up of pore water pressure in the saturated microstructure of the foamed concrete.
Because of the variations, a curing regime must be established to maintain quality control. By
the same note, the strength of foamed concrete cannot be equated with autoclaved aerated
concrete. Although the latter results in higher strength, these results are controlled by the
requirements of factory autoclaving (Jones and McCarthy, 2005). Furthermore, steam curing is
used in the precast industry to obtain the highest possible strength at lowest density in the
shortest time (Kearsley and Mostert, 2005). A summary of the effects of these parameters on
the compressive strength are shown in Figure 2.10.
Although strength is not an issue in many applications of foamed concrete (Dransfield, 2000;
Beningfield et al., 2005), it is a main characteristic which relates to other properties, hence the
reason for the study of compressive strength in almost all research on foamed concrete.
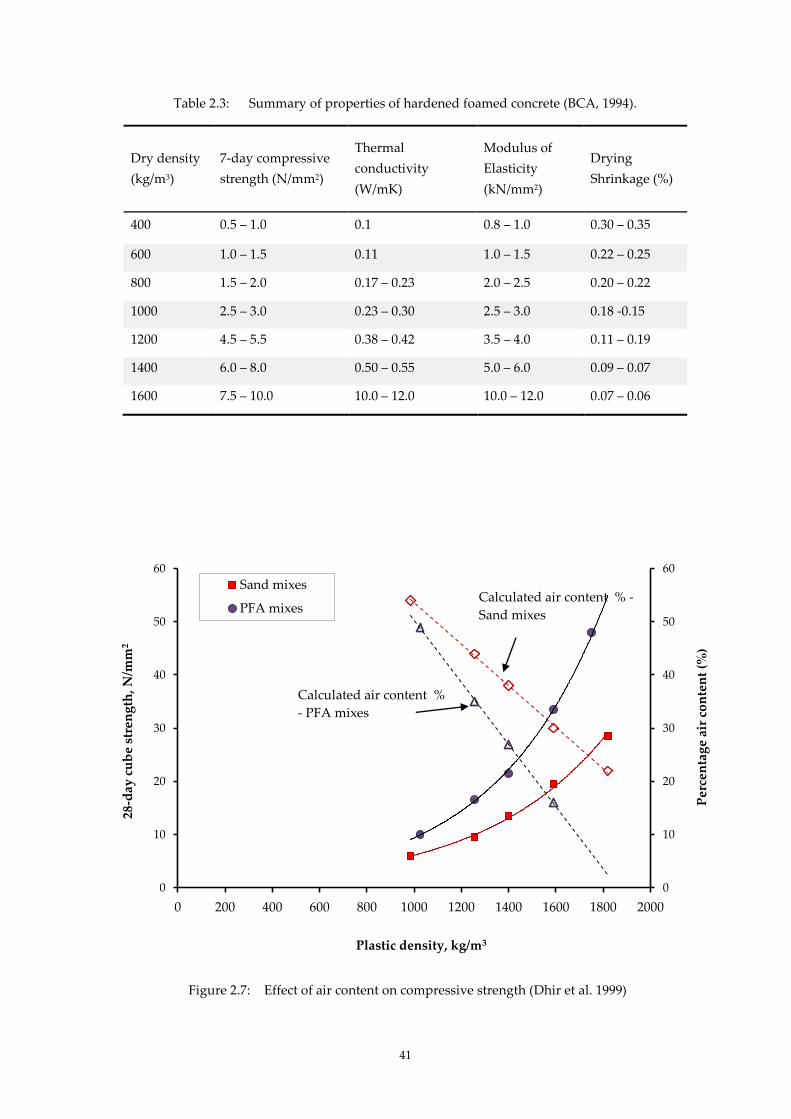
41
Table 2.3: Summary of properties of hardened foamed concrete (BCA, 1994).
Dry density
(kg/m3)
7-day compressive
strength (N/mm2)
Thermal
conductivity
(W/mK)
Modulus of
Elasticity
(kN/mm2)
Drying
Shrinkage (%)
400 0.5 – 1.0 0.1 0.8 – 1.0 0.30 – 0.35
600 1.0 – 1.5 0.11 1.0 – 1.5 0.22 – 0.25
800 1.5 – 2.0 0.17 – 0.23 2.0 – 2.5 0.20 – 0.22
1000 2.5 – 3.0 0.23 – 0.30 2.5 – 3.0 0.18 -0.15
1200 4.5 – 5.5 0.38 – 0.42 3.5 – 4.0 0.11 – 0.19
1400 6.0 – 8.0 0.50 – 0.55 5.0 – 6.0 0.09 – 0.07
1600 7.5 – 10.0 10.0 – 12.0 10.0 – 12.0 0.07 – 0.06
Figure 2.7: Effect of air content on compressive strength (Dhir et al. 1999)
0
10
20
30
40
50
60
0
10
20
30
40
50
60
0 200 400 600 800 1000 1200 1400 1600 1800 2000
Per
cen
tag
e ai
r co
nte
nt
(%)
Sand mixes
PFA mixes
Calculated air content %
- PFA mixes
Plastic density, kg/m3
28-d
ay c
ub
e st
ren
gth
, N/m
m2
Calculated air content % -
Sand mixes
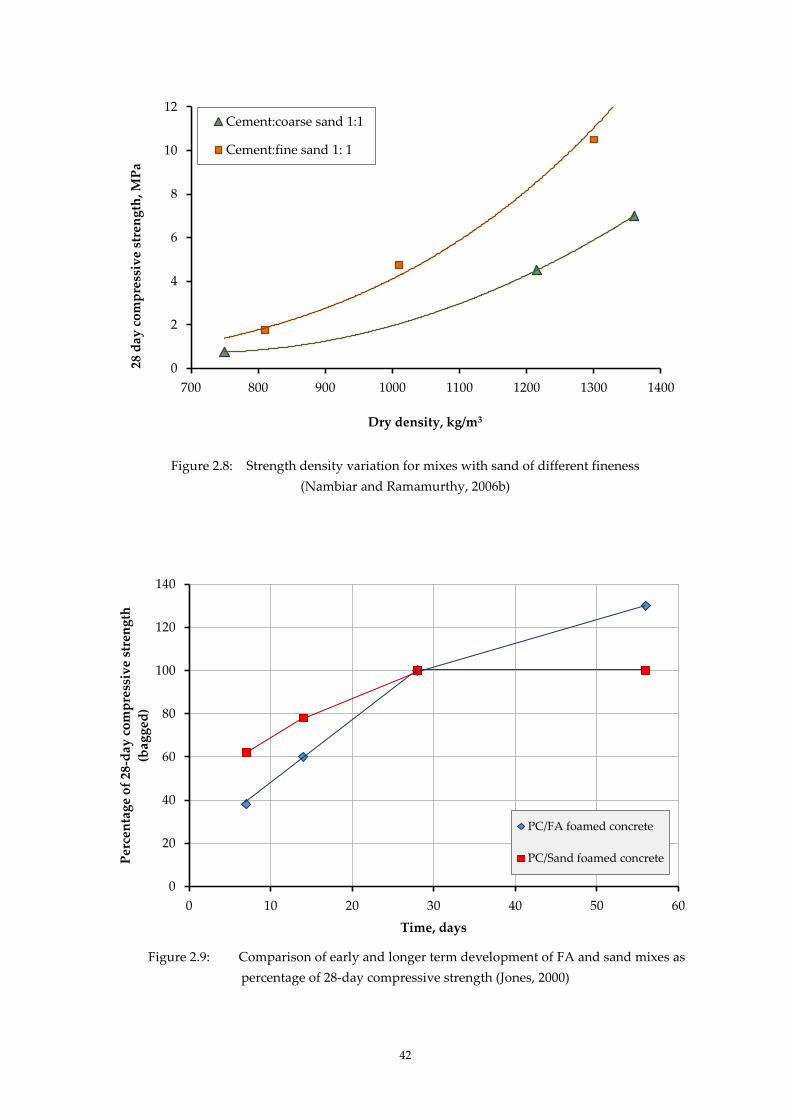
42
Figure 2.8: Strength density variation for mixes with sand of different fineness
(Nambiar and Ramamurthy, 2006b)
Figure 2.9: Comparison of early and longer term development of FA and sand mixes as
percentage of 28-day compressive strength (Jones, 2000)
0
2
4
6
8
10
12
700 800 900 1000 1100 1200 1300 1400
28 d
ay c
om
pre
ssiv
e st
ren
gth
, MP
a
Dry density, kg/m3
Cement:coarse sand 1:1
Cement:fine sand 1: 1
0
20
40
60
80
100
120
140
0 10 20 30 40 50 60
Per
cen
tag
e o
f 28
-day
co
mp
ress
ive
stre
ng
th
(bag
ged
)
Time, days
PC/FA foamed concrete
PC/Sand foamed concrete
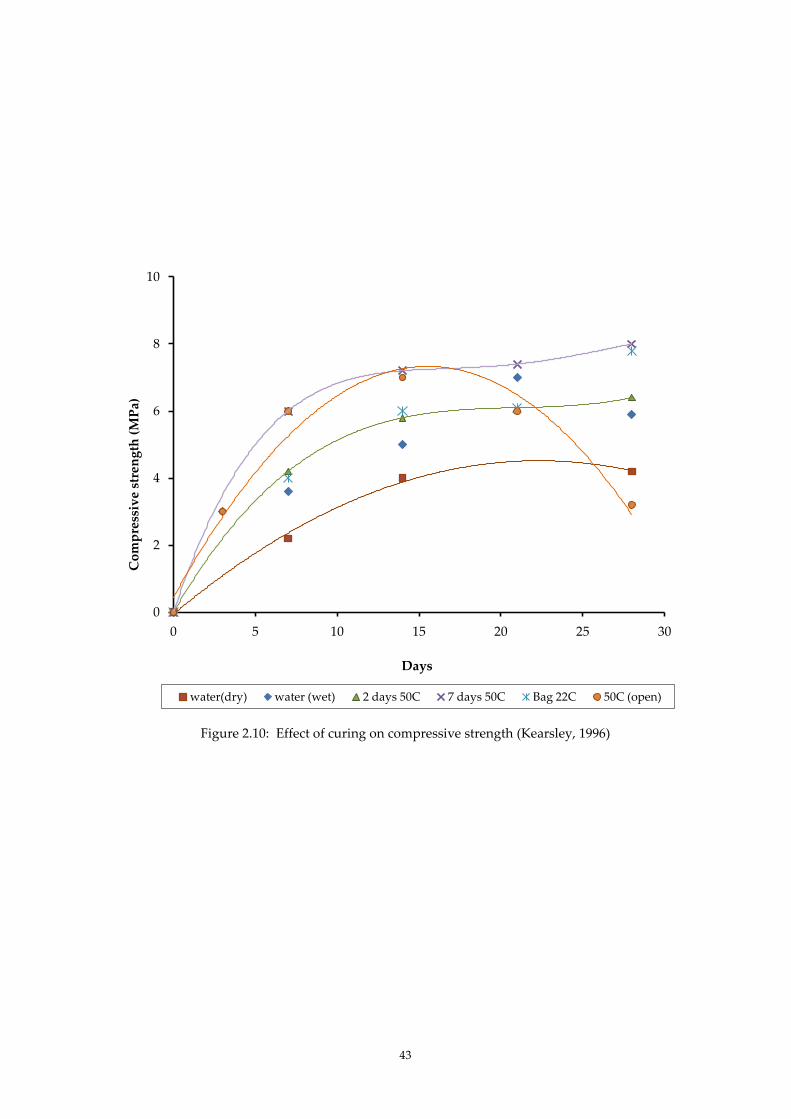
43
Figure 2.10: Effect of curing on compressive strength (Kearsley, 1996)
0
2
4
6
8
10
0 5 10 15 20 25 30
Co
mp
ress
ive
stre
ng
th (
MP
a)
Days
water(dry) water (wet) 2 days 50C 7 days 50C Bag 22C 50C (open)
44
2.9.2.2 Tensile and flexural strength
The tensile strength of foamed concrete (subject to bending) is increased with increase in
density of the mix. Van Dijk (1991) reported (56-day) tensile strengths of 0.06, 0.17, 0.32 and
0.51 for mixes having plastic densities of 600, 900, 1200 and 1500 kg/m3 respectively. The
tensile splitting strength of ‘structural grade’ foamed concrete was found to be slightly lower
than the estimated lightweight concrete, as shown in Table 2.4 (Jones, 2000). PC/sand mixes
had higher splitting tensile strengths compared to the PC/FA mixes. The relationship of the
two is significantly different, as shown in Figure 2.11. This difference is possibly due to the
strength contributed by interlocking aggregates.
The flexural strength of low density foamed concrete is reduced with increasing w/c ratio (De
Rose and Morris, 1999). The addition of 12mm long polypropylene fibres was found to have
increased the tensile strengths of foamed concrete (Kearsley and Visagie, 1999). Similarly, the
addition of a low percentage of 19mm polypropylene fibres had also shown a substantial
increase in flexural strengths, as shown in Table 2.5 (Mellin, 1999). However, the inclusion of
fibres caused a loss in workability of foamed concrete (Jones and McCarthy, 2005b) as well as
increase in cost (Highways Agency and TRL, 2001).
2.9.2.3 Freeze thaw resistance
Foamed concrete does not suffer significantly when exposed to a freeze-thaw cycle (BCA, 1994
and Basiurski, 2000). Even after numerous severe freeze/thaw cycles of -18 to 200C, foamed
concrete with dry densities between 800 and 1400 kg/m3 has been proven to exhibit very good
freeze/thaw resistance, (Basiurski, 2000). In a study of dry density 1400 kg/m3, both PC/FA
and PC/sand mixes showed good freeze/thaw resistance (Jones, 2000). This is due to the
cellular structure in the foamed concrete where the hollow voids provide the additional space
and the volume required for the expansive forces during freezing in the concrete. However, in
the same study, it was found that the performance of a denser mix (1800 kg/m3) was much
poorer which was attributed to the lower void content.
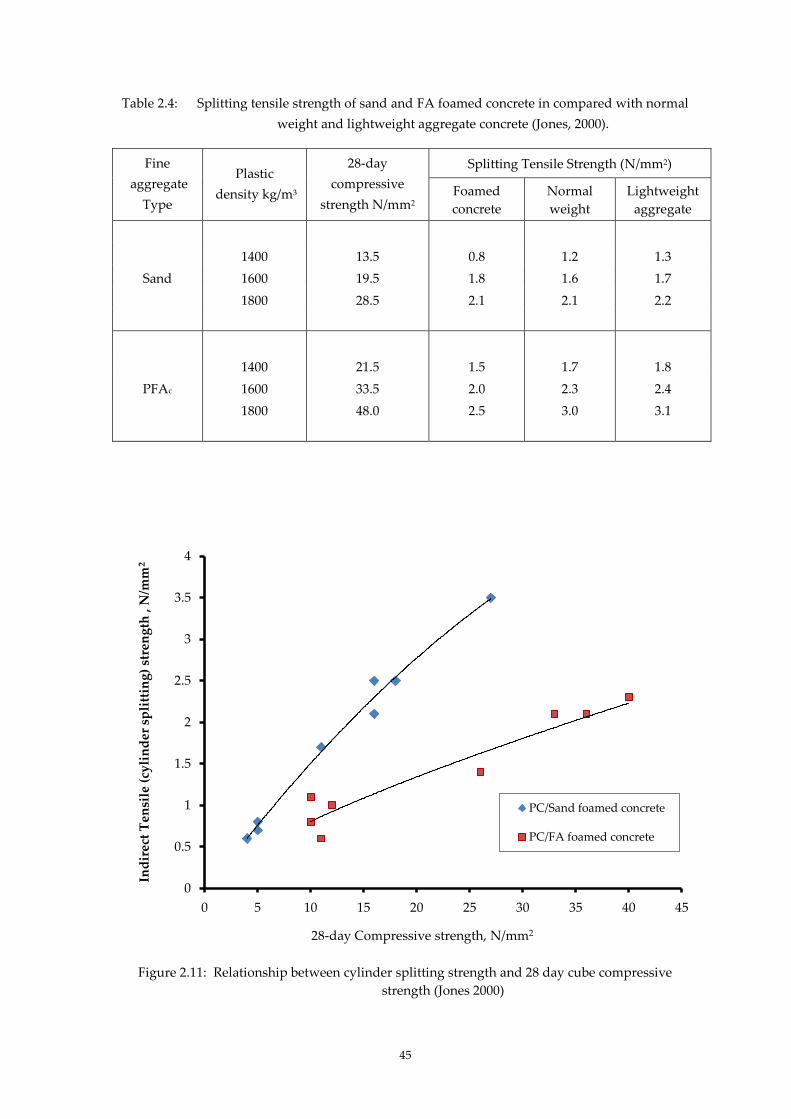
45
Table 2.4: Splitting tensile strength of sand and FA foamed concrete in compared with normal
weight and lightweight aggregate concrete (Jones, 2000).
Fine
aggregate
Type
Plastic
density kg/m3
28-day
compressive
strength N/mm2
Splitting Tensile Strength (N/mm2)
Foamed
concrete
Normal
weight
Lightweight
aggregate
1400 13.5 0.8 1.2 1.3
Sand 1600 19.5 1.8 1.6 1.7
1800 28.5 2.1 2.1 2.2
1400 21.5 1.5 1.7 1.8
PFAc 1600 33.5 2.0 2.3 2.4
1800 48.0 2.5 3.0 3.1
Figure 2.11: Relationship between cylinder splitting strength and 28 day cube compressive
strength (Jones 2000)
0
0.5
1
1.5
2
2.5
3
3.5
4
0 5 10 15 20 25 30 35 40 45
Ind
irec
t T
ensi
le (
cyli
nd
er s
pli
ttin
g)
stre
ng
th ,
N/m
m2
PC/Sand foamed concrete
PC/FA foamed concrete
28-day Compressive strength, N/mm2
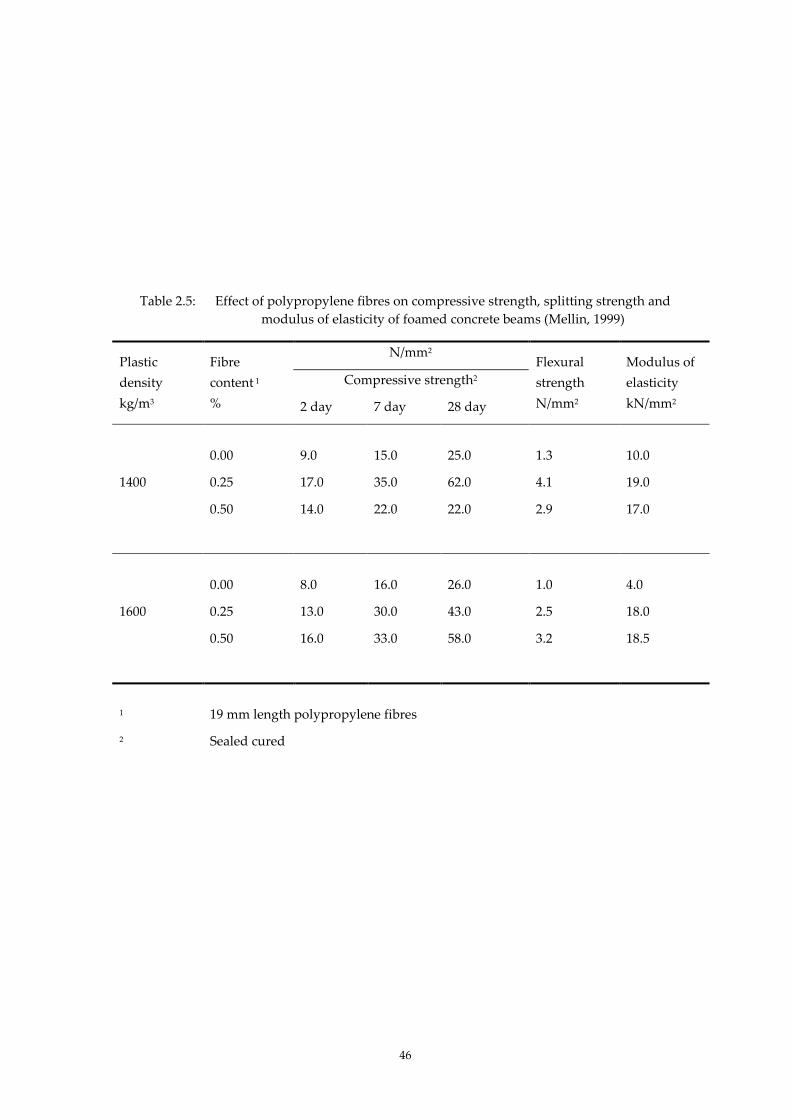
46
Table 2.5: Effect of polypropylene fibres on compressive strength, splitting strength and
modulus of elasticity of foamed concrete beams (Mellin, 1999)
Plastic
density
kg/m3
Fibre
content 1
%
N/mm2 Flexural
strength
N/mm2
Modulus of
elasticity
kN/mm2
Compressive strength2
2 day 7 day 28 day
0.00 9.0 15.0 25.0 1.3 10.0
1400 0.25 17.0 35.0 62.0 4.1 19.0
0.50 14.0 22.0 22.0 2.9 17.0
0.00 8.0 16.0 26.0 1.0 4.0
1600 0.25 13.0 30.0 43.0 2.5 18.0
0.50 16.0 33.0 58.0 3.2 18.5
1 19 mm length polypropylene fibres
2 Sealed cured
47
2.9.2.4 Static Modulus of elasticity (E-value)
The stress strain relationship in any material is of vital interest in any structural design to
establish the behaviour, deformation types, elasticity and the elastic limit, which represents
the maximum allowable stress before the material undergoes permanent deformation.
Modulus of elasticity is the ratio between stress and strain, which, in concrete, depends on the
stiffness of the constituents and their relative proportions in the mix. The modulus of
elasticity of concrete varies from 14 kN/mm2 to 40 kN/mm2 (Neville, 1995; Mehta et al., 2006).
The modulus of elasticity in foamed concrete is significantly lower than in normal concrete.
The values for density range between 400 kg/m3 to 1600 kg/m3 were found to be within
0.8 kN/mm2 to 12 kN/mm2 (BCA, 1994) as shown in Table 2.3. Similar E-values were found to
be between 1.0 kN/mm2 to 8.0 kN/mm2 for foamed concrete of dry densities between
500 kg/m3 and 1500 kg/m3 (Dransfield, 2000). For the same strength, the sand mixes showed
higher values compared to fly ash mixes as shown in Figure 2.12 (McCarthy, 2004). This is
understandable as the modulus of sand is higher than fly ash, thus there are higher E-values
of sand mix foamed concrete. The addition of 0.50% polypropylene fibres by volume showed
significant increases in the moduli of elasticity of foamed concrete (Mellin, 1999) as shown in
Table 2.5. However, the values are still lower than in normal concrete which explains for the
high deflection and brittle failure observed in the study of full-scale foamed concrete beam
(Jones and McCarthy, 2005a).
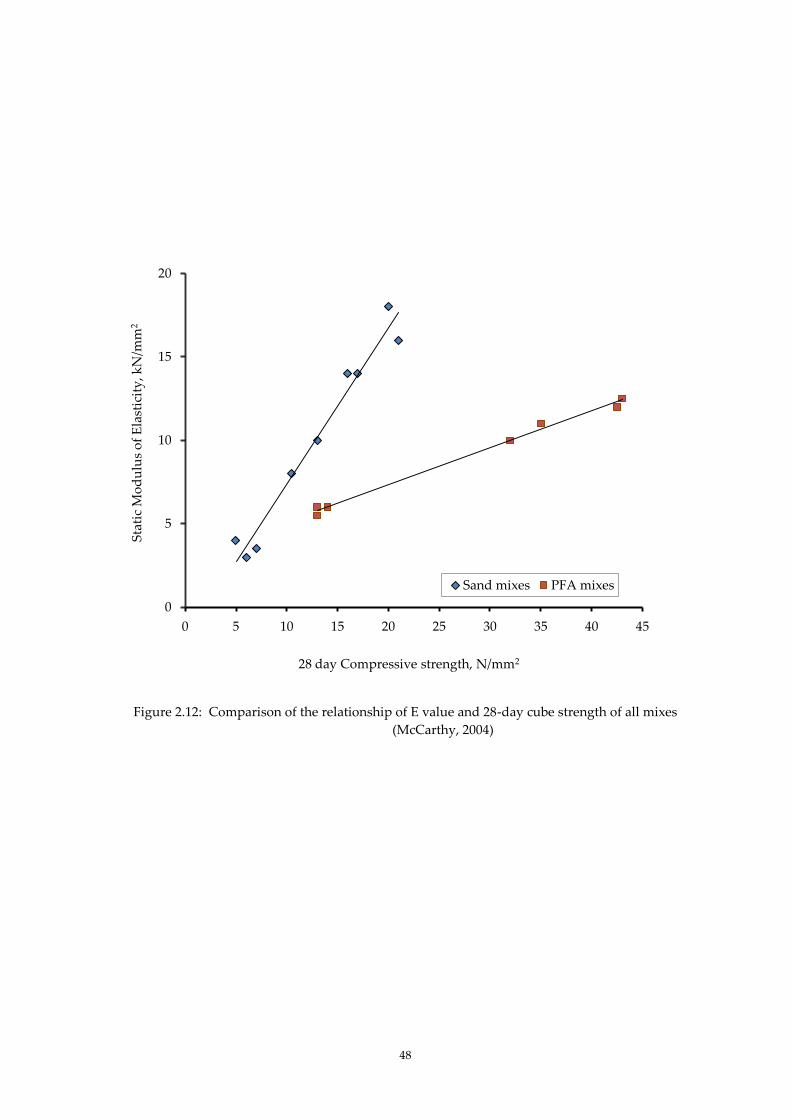
48
Figure 2.12: Comparison of the relationship of E value and 28-day cube strength of all mixes
(McCarthy, 2004)
0
5
10
15
20
0 5 10 15 20 25 30 35 40 45
Sand mixes PFA mixes
28 day Compressive strength, N/mm2
Sta
tic
Mo
du
lus
of
Ela
stic
ity
, kN
/mm
2

49
2.9.2.5 Bubbles Microstructure
Pore structure is a very important microstructural characteristic in a porous solid. The
distribution of the pores of various sizes influences their physical and mechanical behaviours
and controls the durability of the material (Kalliopi, 2006). Changes in the microstructure of a
material can change its properties significantly (Kumar, 2005). These pores are mainly
classified according to their size and types as illustrated in Table 2.6 (Kalliopi, 2006). Voids
are identified as having the biggest size in the range, between 50m to 200m. The shapes of
the voids are spherical and not interconnected (Mehta et al. 2006; Kalliopi, 2006). However,
voids in normal concrete are either entrapped inadvertently during mixing and placing of
concrete or intentionally entrained using air-entraining chemicals (Neville, 1995; Kalliopi,
2006).
In foamed concrete, the addition of preformed foam produces air voids which are uniformly
distributed in matrices of fillers and cements (Tiong et al., 2006). Most researchers are in
accord on the paramount importance of adequate void system for the production of foamed
concrete (Kearsley 1999; Narayanan and Ramamurthy, 2000a; Aldridge, 2005; Hamidah et al.,
2005; Nambiar and Ramamurthy, 2007a). The parameters of the air voids which include
shape, spacing factor and size distribution confer the important properties of foamed concrete
(Nambiar and Ramamurthy, 2007a). The skin of the air voids must be tough and persistent
since the air voids are separated and coated with cement paste during mixing and placing
(Wee et al., 2006). All these properties are responsible for the tenfold change in compressive
strength, rather than common w/c ratio and aggregate-cement ratio as in conventional
concretes (Beningfield et al., 2005). The range of sizes of air voids in foamed concrete varies
from 0.1 mm to 2 mm (Aldridge, 2005; Highways agency and TRL, 2001; Cox, 2005; Nambiar
and Ramamurthy 2007a). Parameters affecting the difference in sizes and distribution of the
air voids are densities, w/c ratio, constituent materials and additives (Nambiar and
Ramamurthy, 2007a; Wee et al., 2006).
Nambiar and Ramamurthy (2007a) reported several findings, which included the facts that:
1. the number of larger voids increased with increased in foam volume;
50
2. at low dosage of foam volume, the air‐void distribution is more uniform than at high
foam volume content;
3. when the density was increased, the voids were more distinct and spherical in shape,
as illustrated in Figure 2.13. The median void diameters and values of D50 and D90
(10% oversized voids) became smaller and more uniform in size (Figure 2.14).
4. a reduction in strength corresponded to an increase in diameter, even though this
change is not significant at higher densities (Figure 2.15);
5. the values of D90 showed better correlation with strength compared to D50; this
suggested that bigger pores influenced the strength more compared to smaller pores;
and
6. cement-fly ash mixes produced voids of a more uniform distribution and smaller
diameter size in all densities. This characteristic suggested that fineness of the filler
had a considerable effect on the voids by providing a more uniform coating of the
paste on the bubbles, thus preventing them to merge and overlap. Similar
observations were made through a study on fineness of sand on compressive strength
of foam concrete (Nambiar and Ramamurthy, 2006b).
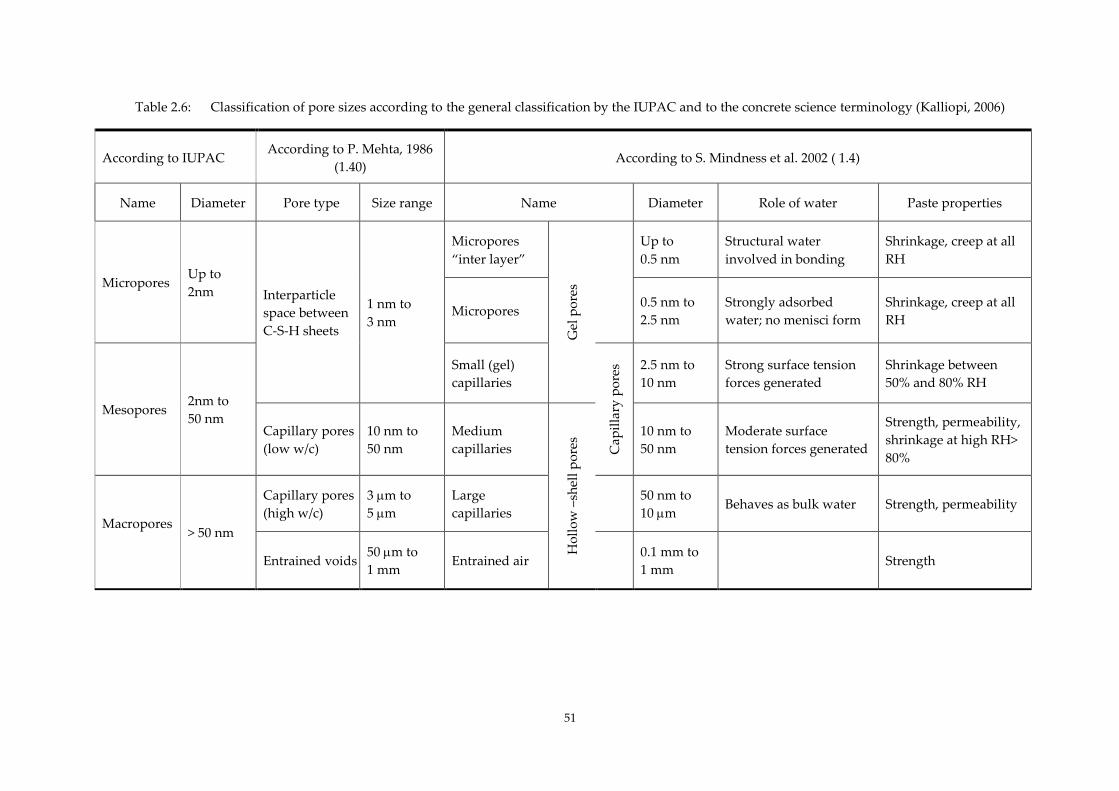
51
Table 2.6: Classification of pore sizes according to the general classification by the IUPAC and to the concrete science terminology (Kalliopi, 2006)
According to IUPAC According to P. Mehta, 1986
(1.40) According to S. Mindness et al. 2002 ( 1.4)
Name Diameter Pore type Size range Name Diameter Role of water Paste properties
Micropores Up to
2nm Interparticle
space between
C-S-H sheets
1 nm to
3 nm
Micropores
“inter layer”
Gel
po
res
Up to
0.5 nm
Structural water
involved in bonding
Shrinkage, creep at all
RH
Micropores
0.5 nm to
2.5 nm
Strongly adsorbed
water; no menisci form
Shrinkage, creep at all
RH
Mesopores 2nm to
50 nm
Small (gel)
capillaries
Cap
illa
ry p
ore
s 2.5 nm to
10 nm
Strong surface tension
forces generated
Shrinkage between
50% and 80% RH
Capillary pores
(low w/c)
10 nm to
50 nm
Medium
capillaries
Ho
llo
w –
shel
l p
ore
s
10 nm to
50 nm
Moderate surface
tension forces generated
Strength, permeability,
shrinkage at high RH>
80%
Macropores
> 50 nm
Capillary pores
(high w/c)
3 m to
5 m
Large
capillaries
50 nm to
10 m Behaves as bulk water Strength, permeability
Entrained voids 50 m to
1 mm Entrained air
0.1 mm to
1 mm Strength

52
Figure 2.13: Typical binary images (Nambiar and Ramamurthy, 2007)
a. Cement-sand mixes
b. Cement-fly ash mixes

53
Figure 2.14: Density vs. air-void distribution (Nambiar and Ramamurthy, 2007)
a. Cement-sand mix
b. Cement-fly ash mix
Figure 2.15: Strength vs. air-void diameter (Nambiar and Ramamurthy, 2007)
a. Cement-sand mix
b. Cement-fly ash mix
54
2.10 SUMMARY OF THE LITERATURE
In the literature review, the potential of foamed concrete has been acknowledged as
construction material with vast advantages whilst accepting its limitations. Regardless of
limited specifications and tests that are available for the use of foamed concrete, the amount of
usage is increasing every year.
It is well agreed in the literature review that constituent materials and mix proportions affect
the properties and behaviour of foamed concrete. The possible effect of different constituent
materials on the properties had been recognized from literatures and through past researches.
Previous researchers at the Concrete Technology Unit in the University of Dundee
investigated on the strength and thermal properties. Other researches included the use of
recycled aggregates and minimal aggregates for sustainability. Published data by other
researchers had shown that different aspects of properties of foamed concrete had also been
studied. However, rheology is one of the important aspects, which has not been well
investigated in foamed concrete. The importance of the rheological properties of all
cementitious materials has been acknowledged and has been accepted as having direct
relation to the behaviour. Further research has to be been done to investigate the effect of
constituent materials and the mix proportion on the rheological properties of foamed concrete.
This knowledge will be useful to predict the overall behaviour and for practical applications.
Another important area that requires more research is the understanding of bubble structures
which is known to vary with different mix proportions and constituent materials.
The importance of foam stability had been mentioned in the literature. Instability in foam
caused collapse in foamed concrete which lead to segregation and variation in density. Hence,
the factors leading to instability will be investigated.
An attempt will be made to formulate all findings to conclude the effect of constituent
materials and mix proportion on these major areas of research on foamed concrete.

55
CHAPTER 3: EXPERIMENTAL PROGRAMME: MATERIALS AND TEST
METHODS
3.1 INTRODUCTION
Foamed concrete has been identified as a versatile construction material with excellent
properties that include being light, durable, simple to use, environmentally sustainable and
versatile without being restricted by factory requirements (Jones and McCarthy, 2005). The
use of foamed concrete is recognised as suitable for lower strength applications (BRE, 2004;
Highways Agency and TRL, 2001). However, the potential of foamed concrete to be used as
structural element has been inhibited by perceived difficulty in achieving high strength and
unfamiliarity of its characteristics (Jones and McCarthy, 2005).
This study fell into two chronological phases which cover year 2005 and 2007-2009. The
experiments conducted in 2005 were preliminary and were intended to investigate the
possibility of foamed concrete being used as a structural element. The second phase of
experiments complemented the pilot study.
In phase one (2005), following the study of carbon steel used in reinforced foamed concrete
investigated by Jones and McCarthy (2005b), a full-scale pilot study of post-tensioned foamed
concrete beam was conducted using glass-fibre reinforced plastic. The outcome from this
work demonstrated that the beam experiment was unsatisfactory.
Therefore, in phase 2 of the current study, (2007-2009), further examination of foamed concrete
was conducted. These two phases encompassed four studies. Study 1 was on post-tensioned
foamed concrete beam which, as noted, gave unsatisfactory outcomes. Studies 2, 3 and 4
followed a different approach. For each study, a different methodology was adopted. Each
will be discussed in subsequent chapters.
56
3.2 EXPERIMENTAL PROGRAMME
As shown in Table 3.1, the experimental programme started with performing a literature
review followed by experimental works. These experiments were divided into two
chronological phases, the first phase was done in 2005 and the second phase was completed in
2007-2009 as noted above.
Preliminary studies were done in phase one and were intended to investigate the possibility of
foamed concrete being used as structural element. In this phase, the behaviour of full-scale
post-tensioned foamed concrete beam was studied. The density of the foamed concrete beam
was 1400 kg/m3 following a previous study by Mellin in 1999. However, the tensioned-end
slipped during the test and could not validate the viability of foamed concrete being used as a
structural element.
Following unsatisfactory results from phase one, a different approach was adopted in phase
two where the characteristics and behaviour of foamed concrete were studied. The three main
characteristics of foamed concrete examined were the rheological properties, microstructure,
and instability. Subsequently, the relationship between each characteristic was also studied.
The importance of the rheological behaviour of other cement-based materials can be attested
in the literature (Banfill, 2003; Roussel, 2007; Hanehara and Yamada, 2008). However, the
study of rheology in foamed concrete is very limited. Foamed concrete was noted as having
self-flowing and self-compacting rheology (Jones et al., 2003) who further noted that the mix
using coarse fly ash, FAc exhibited enhanced consistency and rheology in foamed concrete
(Jones and McCarthy, 2005a). In this current study, the rheological properties were studied in
depth. The empirical values of yield stress and plastic viscosity of different mixes of foamed
concrete were obtained using a Brookfield Viscometer. For the study of rheological
properties, the Marsh cone test was employed in addition to the Brookfield viscometer, as
described in Chapter 5.
As foamed concrete has typical air content of 40 to 80 per cent of the total volume and bubbles
varying from 0.1 mm to 1.5 mm in diameter (Highways Agency and TRL, 2001), the
microstructure of foamed concrete is intriguing. The aim of this part of study was to examine

57
the bubble characteristics in relation to materials constituents, densities, water/cement (w/c)
ratio and the effect of additions to the mixes. In this experiment, the digital images of a
selected range of foamed concrete were analysed. For the study of the microstructure, the
hardened specimens were split open and investigated. The details of the method and the
findings are discussed in Chapter 6.
The study of instability in foamed concrete was the third part of these investigations. In the
study of instability, the drop after 24 hours in the surface level of the specimen was recorded
for each mix. The details of these tests and results are presented in Chapter 7. This phase of
study formed the concluding part which combined the results of the previous two studies:
microstructural characteristics and the study of rheological properties.
Throughout the study in phase 2, the main selected densities were 600, 1000 and 1400 kg/m3
which are expected to show a good range. Other densities were also experimented for
comparison purposes. These densities also relate to the literature obtained and reflect
comparable previous researches done in the University of Dundee (Yerramala, 2008; Rao,
2008). A cement content of 300 kg/m3 was maintained throughout phase 2 experiments
following research conducted by Jones (2000) which reported that an increase in content above
500 kg/m3 did not show significant gain in strength. The w/c ratio was mainly kept at 0.40 to
0.80 in most specimens, although other ratios were included briefly.

58
PHASE 1
2005
PHASE 2
2007 - 2009
Table 3.1: Experimental Programme
DEVELOPMENT OF FOAMED CONCRETE : ENABLING AND SUPPORTING DESIGN
LITERATURE REVIEW
TEST PROGRAMMES EXPECTED FINDINGS
PERFORMANCE OF MODEL
STRUCTURAL ELEMENT
Viability of using foamed concrete
as structural member
Full scale post-tensioned beams
Materials
Cement – CEM I 42.5N
Coarse fly ash, FAc 100%
Synthetic surfactant
Superplasticiser
Effect of post-tensioning on foamed concrete beam
To confirm the status of foamed concrete as a structural
material
RHEOLOGY
Study of rheological properties
i. Brookfield Viscometer
ii. Marsh cone test
Materials
CEM I 42.5N, Metakaolin, FAf
Sand, FAc
Protein surfactant
Empirical values
Yield stress
Plastic viscosity
Flowability
MICROSTRUCTURE
Microstructural characteristics
Image analysis
Materials
CEM I 42.5N, CSA
Surfactants -Protein ,synthetic
Wetting agent
Microstructural analysis
Bubble diameter
Bubbles count
Characteristics
CAUSES OF INSTABILITY
Study of parameters affecting
instability
i. Dropout test
ii. Drop in level
Materials
CEM I (42.5N, 52.5R), CSA, Metakaolin,
FAf
Sand, FAc
Protein and synthetic surfactants
Factors leading to
instability
Microstructure
Rheology Instability

59
3.3 Constituent Materials
3.3.1 Cements
1. Portland Cement
Portland cement (CEM I 42.5N conforming to BS EN 197: Part 1: 2000) is usually used as the
main binder for foamed concrete.
In most experiments in these studies, the total cementitious material was kept at 300 kg/m3.
Typically, cementitious content lies between 300kg/m3 and 400 kg/m3 although up to
500 kg/m3 has been used to attain higher strength concrete. The gain in strength obtained by
increasing the content above 500 kg/m3 is small (Jones, 2000), as mentioned previously.
However, in the study of structural performance of foamed concrete (discussed in Chapter 4),
the cement content used was 600 kg/m3. This was selected because the aim of the experiment
was to study the potential of foamed concrete as a structural material; hence, the highest
strength possible was very important.
Other combinations of cements were also used in the studies of microstructure, rheological
properties and instability in foamed concrete.
The properties of these cements are given in Table 3.2. All cements are stored properly in
plastic bags to prevent moisture penetration and subsequent deterioration.
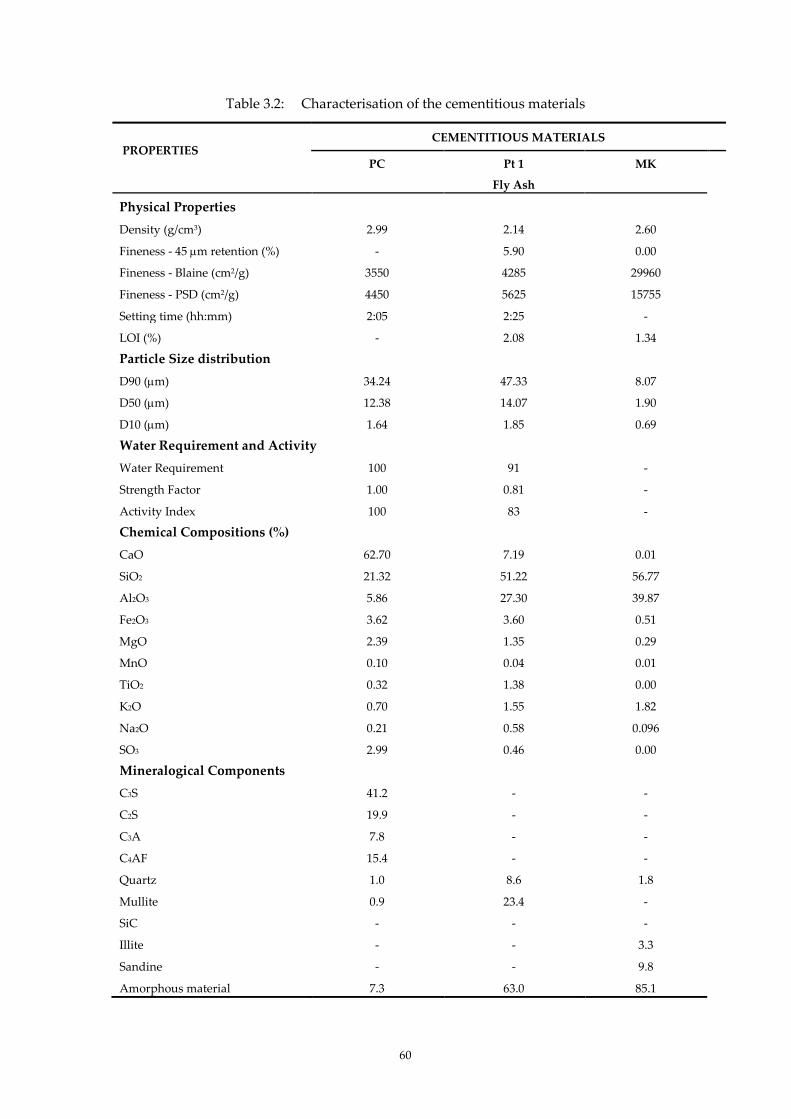
60
Table 3.2: Characterisation of the cementitious materials
PROPERTIES
CEMENTITIOUS MATERIALS
PC Pt 1 MK
Fly Ash
Physical Properties
Density (g/cm3) 2.99 2.14 2.60
Fineness - 45 m retention (%) - 5.90 0.00
Fineness - Blaine (cm2/g) 3550 4285 29960
Fineness - PSD (cm2/g) 4450 5625 15755
Setting time (hh:mm) 2:05 2:25 -
LOI (%) - 2.08 1.34
Particle Size distribution
D90 (m) 34.24 47.33 8.07
D50 (m) 12.38 14.07 1.90
D10 (m) 1.64 1.85 0.69
Water Requirement and Activity
Water Requirement 100 91 -
Strength Factor 1.00 0.81 -
Activity Index 100 83 -
Chemical Compositions (%)
CaO 62.70 7.19 0.01
SiO2 21.32 51.22 56.77
Al2O3 5.86 27.30 39.87
Fe2O3 3.62 3.60 0.51
MgO 2.39 1.35 0.29
MnO 0.10 0.04 0.01
TiO2 0.32 1.38 0.00
K2O 0.70 1.55 1.82
Na2O 0.21 0.58 0.096
SO3 2.99 0.46 0.00
Mineralogical Components
C3S 41.2 - -
C2S 19.9 - -
C3A 7.8 - -
C4AF 15.4 - -
Quartz 1.0 8.6 1.8
Mullite 0.9 23.4 -
SiC - - -
Illite - - 3.3
Sandine - - 9.8
Amorphous material 7.3 63.0 85.1

61
2. Fly Ash
‘Fine’ fly ash (FAf) with a 45 m sieve retention of 7.5%, loss on ignition (LOI) of 5.0% and
conforming to BS EN 450.5 was used to replace CEM I 42.5N at 30% by mass fraction.
The literature shows that the use of FAf cement has been proven to effect a significant change
in strength and other fresh and hardened properties of foamed concrete (Jones and McCarthy,
2005b; Jones and McCarthy, 2006; Nambiar and Ramamurthy, 2008). For that reason, this
cement type is included in these characteristic investigations.
3. Metakaolin
Metakaolin (MK) is a pozzolanic material which is highly active and effective pozzolan for the
partial replacement of cement in concrete. It is an ultra-fine material, obtained by the
calcination of kaolinitic clay at a temperature ranging between 500°C and 800°C. The raw
material input in the manufacture of metakaolin (Al2Si2O7) is kaolin. Metakaolin on reaction
with Ca(OH)2, produces CSH gel at ambient temperature and reacts with CH to produce
alumina containing phases (Siddique and Klaus, 2009). The specific surface area of
metakaolin is very high, in the range of 4000m2/kg to 12000m2/kg (Neville, 1996), hence the
water requirement is high. Even though metakaolin has the potential to improve the
performance and enhance the durability of concrete, its use in tests and applications are
limited because of its high cost (Bai and Wild, 2002). The inclusion of metakaolin in concrete
improved several mechanical properties of concrete such as increased compressive and
flexural strengths, reduced permeability, increased resistance to chemical attack, increased
durability, reduced effects of alkali-silica reactivity (ASR), reduced shrinkage, enhanced
workability and finishing of concrete (Siddique and Klaus, 2009). The incorporation of
metakaolin, up to 25% in blended cements, has shown pore refinement to 63% of the original
pore size (Frı´as, 2006).
No literature has been published on the use of metakaolin in foamed concrete. However, it
has been noted that the use of metakaolin was possible to increase the strength of foamed
concrete (Jones, 2000). In the study of rheology, microstructure and instability in foamed
concrete, metakaolin was used as replacement of cement to a level of 20%.

62
4. Calcium sulphoaluminate (CSA)
Calcium sulphoaluminate (CSA) cements have been produced, used and standardized in
China for about 30 years and not widely used in Europe and the U.S. They are known as the
“third cement series” (Juenger et al., 2010). It was designed by the China Building Materials
Academy (CBMA) and was intended to manufacture self-stress concrete pipes because it has
swelling properties (Pe´ra and Ambroise, 2003). CSA cements contain ye'elimite (C4A3S) as a
major constituent (30-70%). CSA cements are rapid-hardening, high strength, expansive, or
self-stressing cements. They have been used in China as a binder for concrete in bridges,
leakage and seepage prevention projects, concrete pipes, precast concrete (e.g. beams and
columns), prestressed concrete elements, waterproof layers, glass fiber reinforced cement
products, low temperature construction and shotcrete. Due to their low pH, low porosity and
the ability of ettringite and AFm phases to bind heavy metals, CSA cements and their blends
with Portland cement are of interest in the field of hazardous waste encapsulation (Juenger et
al., 2010).
CSA cements provide a low CO2 alternative to Portland cement. It releases less than half CO2
per g of cementing phase compared to Portland Cement. The firing temperature used to
produce CSA clinker is about 200 °C lower than that used for Portland cement clinker.
The setting times of CSA cements depends on their ye'elimite content, the kind and content of
minor phases, and the amount and reactivity of the added calcium sulfate. Typical values are
between 30 min and 4 hours. Compared to Portland cement, CSA cements reach higher early
and late strengths. The durability of building materials made from CSA cements was found to
be comparable to conventional Portland cement-based materials, although more studies are
required for the long-term behaviour. Carbonation was found to be more rapid in CSA
cements compared to Portland cement concretes, leading to the decomposition of ettringite
which led to moderate strength loss. The alkalinity of CSA cements is about 1 pH unit lower
than for Portland cement, which decreases protection from corrosion of steel reinforcement
and alkali aggregate reaction (Juenger et al., 2010). The CSA used in this research project was
labelled QuickCem which was provided by Castle cement. The chemical compositions of the
cements and fillers are shown in Table 3.3.

63
Table 3.3: Chemical composition of cements and fillers, % by mass
Compound
CEMENTS AGGREGATE/FILLER
CEM I
(42.5N) CSA FAf SAND FAc
CaO 62.70 42.25 7.19 1.50 3.40
SiO2 21.32 10.96 51.22 78.50 50.90
Al2O3 5.86 29.93 27.30 10.50 28.00
Fe2O3 3.62 3.01 3.60 3.00 4.20
MgO 2.39 1.45 1.35 0.90 1.20
MnO 0.10 - 0.04 - 0.05
TiO2 0.32 - 1.38 0.50 1.40
K2O 0.70 1.02 1.55 1.60 1.50
Na2O 0.20 0.23 0.58 2.00 0.50
P2O5 0.05 - 1.4 - 0.70
Cl 0.07 0.01 0.05 <0.01 0.02
SO3 2.99 8.82 1.30 0.10 2.70
64
3.3.2 Fillers
1. Fine aggregates /sand
The main type of fine aggregate to be used throughout this study is sand of medium grade
conforming to BS EN 12620: 2002. The sand was air-dried in the laboratory to a surface dry
condition and sieved through a 2.36 mm sieve. Only finer aggregates were used, because
coarser aggregate may settle in the lightweight mix and cause collapse of the foam during
mixing (Sach and Seifert, 1999 cited in Jones, 2000). However, in the study of rheology, a finer
size, sieved through a 1 mm sieve was used to accommodate the apparatus used.
2. Coarse Fly Ash (FAc)
Coarse fly ash, FAc with a 45 m sieve retention conforming to BS 3892: Part 2: 1997 or BS EN
450: 1995 was used.
The advantageous influences of FAc on the consistency of foamed concrete have been reported
(Jones et al., 2003; Jones and McCarthy, 2005a). For the same w/c ratio, the actual water
content of the corresponding FAc/fine aggregate concretes was higher which increased
flowability. This enhanced consistence of the FAc concretes is attributed to the ‘ball-bearing
effect’ of FA particles due to their spherical morphology improved packing of the solid phase
and adsorption of mix water on to the FAc particles reducing inter-particle friction (Jones and
McCarthy, 2005a). In addition, a more uniform distribution of air voids was developed in the
foamed concrete with FAc blend compared to foamed concrete using sand only mix (Nambiar
and Kunhanandan, 2007a).
3.3.3 Surfactants
There are several types of surfactants available in the market. The main surfactants used in
this study were the ones which were commercially available as these have been proven to be
effective in producing foamed concrete. A synthetic-based surfactant and two types of
protein-based surfactants, Protein 26 and Protein 40 were used widely throughout the study
(Figure 3.2). Foamed concrete produced with a protein surfactant was found to have a
strength/density ratio of about 50% to 100% higher compared to those employing synthetic

65
surfactants (McGovern, 2000). Besides the surfactants mentioned, two other commercially
available synthetic-based surfactants (TFAL-3 and Regular-3%) were briefly included for
comparison in the study of instability.
The concentration of the surfactant solution used for the production of foam is typically 60 g
per litre of water, which is used throughout most of the study to produce foam of 50 ± 5 kg/m3
density. The preformed foam was prepared from a 6% aqueous surfactant solution in a dry
system generator. The typical density was found to be between 40 and 50 kg/m3.
3.3.4 Water
Water used in this study was usually normal tap water of pH within the range 6.8 to 7.0,
which was conformed to BS EN 1008 Mixing water for concrete. However, in the study of
instability, distilled water and water of different pH values and temperatures were included.
The ‘free’ water is the amount after allowance has been made for actual or potential
absorption by the aggregate of which only a part is required for reaction with the cement,
while the rest is present simply to make the mix sufficiently workable for the intended use
(Tattersall, 1991).
Water/cement ratio (w/c ratio) is a significant factor in foamed concrete; too little water
potentially leads to disintegration, too much water leads to segregation (Kearsley, 1999,
Highways Agency and TRL, 2001 and Nambiar and Ramamurthy, 2006b). In addition, w/c
ratio of the base mix required to achieve adequate workability is dependent upon the type of
binder(s), the required strength of the concrete and whether or not a water-reducing or
plasticizing agent has been used (Jones, 2001).

66
3.3.5 Other materials
1. Wetting agent
A commercially available wetting agent, where appropriate, was used in some studies.
2. Superplasticisers
Superplasticiser conforming to BS EN 934-2.8 was used. This superplasticiser was used
because at 0.35 w/c ratio, the mix was less workable to fill up the formwork.
Superplasticisers have been used to further enhance the consistence of foamed concrete in low
w/c ratios, although they are not universally added due to its high intrinsic workability and
modest strength requirements (Highways Agency and TRL, 2001). The addition of
superplasticisers had no adverse effects except for segregation which is noticeable when
mixed with protein-based surfactants (Highways Agency and TRL, 2001). Dransfield (2000)
has questioned the use of such additives, and Bartos (1992) claimed that they might reduce the
stability of the foam. The dosage of superplasticisers to foamed concrete was suggested not to
exceed 0.2 per cent by weight of cement and tests should be carried out to confirm
compatibility of the foam and superplasticiser (Highways Agency and TRL, 2001).

67
Figure 3.1: Protein and synthetic surfactants
Figure 3.2: Foam

68
Figure 3.3: Magnified foam bubbles
1 mm

69
3.4 MIX DESIGN
As there is no standard specification for the method of proportioning, all studies in the
University of Dundee use the method that was developed by the Concrete Technology Unit,
University of Dundee, as described below. In this method, the ratio of cement and water is
pre-determined. The fine aggregate (sand and /or fly ash) content is calculated by equating
the sum of solids and water content to the target plastic density value.
D= C + W + F Equation 3.1
where
D = target plastic, kg/m3
C = cement (PC and / or other cements) content, kg/m3
W = water content, kg/m3
F = filler (fine aggregate and/or others) kg/m3
Adjustments to the above equation were made to include water absorption and laboratory air
dry condition. The level of water contained in foam is assumed to be minimal and, therefore,
is not considered in the calculations, although it is recognised that foam collapse occurs
during mixing (Dhir et al., 1999). As a result of the collapse, the w/c ratio of the mix is actually
slightly higher than the batched quantity. However, the degree of collapse varies with mix
constituents and is unpredictable; hence this phenomenon is ignored in mix proportioning
(McCarthy, 2004).
Theoretically, the amount of foam required to achieve the target plastic density is identified by
calculating the volume of air in a unit volume, as shown below:
Vcem + Vwater + Vfiller + Vfoam = 1m³ that is C/C + W/w + F/F + Mfoam/foam Equation 3.2
where
V = quantity of each material, m³
C = density of cement, kg/m3
F = particle density of filler, kg/m3
w = density of water, kg/m3 (taken as 1000 kg/m3)
Mfoam = quantity of foam, kg
foam = density of foam, kg/m³
70
The range of densities of foamed concrete is not markedly defined, ranging from 300 to
1600 kg/m3 (BCA, 1991), 400 to 1600 kg/m3 (BCA, 1994) from 800 to 1600 kg/m3 (Dransfield,
2000). The majority of densities of the mixes studied were 600, 1000 and 1400 kg/m3. These
densities demonstrate a good range of foamed concretes commonly used in the industry
(Jones and McCarthy, 2006) and are anticipated to show significant difference in behaviour.
The most common w/c ratio was 0.50 because it provided sufficient consistency for the
majority of mixes within the range of densities and constituent materials (WRAP, 2004).
However, w/c ratios 0.40 to 0.80 were chosen to study the effect and observe the behavioural
pattern. An illustration of the proportions of constituent materials for each density at w/c
ratio 0.50 is shown in Figure 3.4 and Figure 3.5 shows the percentages for a range of w/c ratios
for density 600 kg/m3.
The cement content of the foamed concrete for the majority of studies was kept constant at
300 kg/m3, which is comparable to other studies (Jones and McCarthy, 2006; Jones et al., 2003;
McCarthy, 2004) while in the study of performance of model structural element, the cement
used was 600 kg/m3. In the study of structural performance, the cement content was increased
as it was found that the minimum cement content to achieve the required strength for
structural grade foamed concretes was 500 kg/m3 (Jones, 2000). The typical mix proportions
for the foamed concrete are shown in Table 3.4.
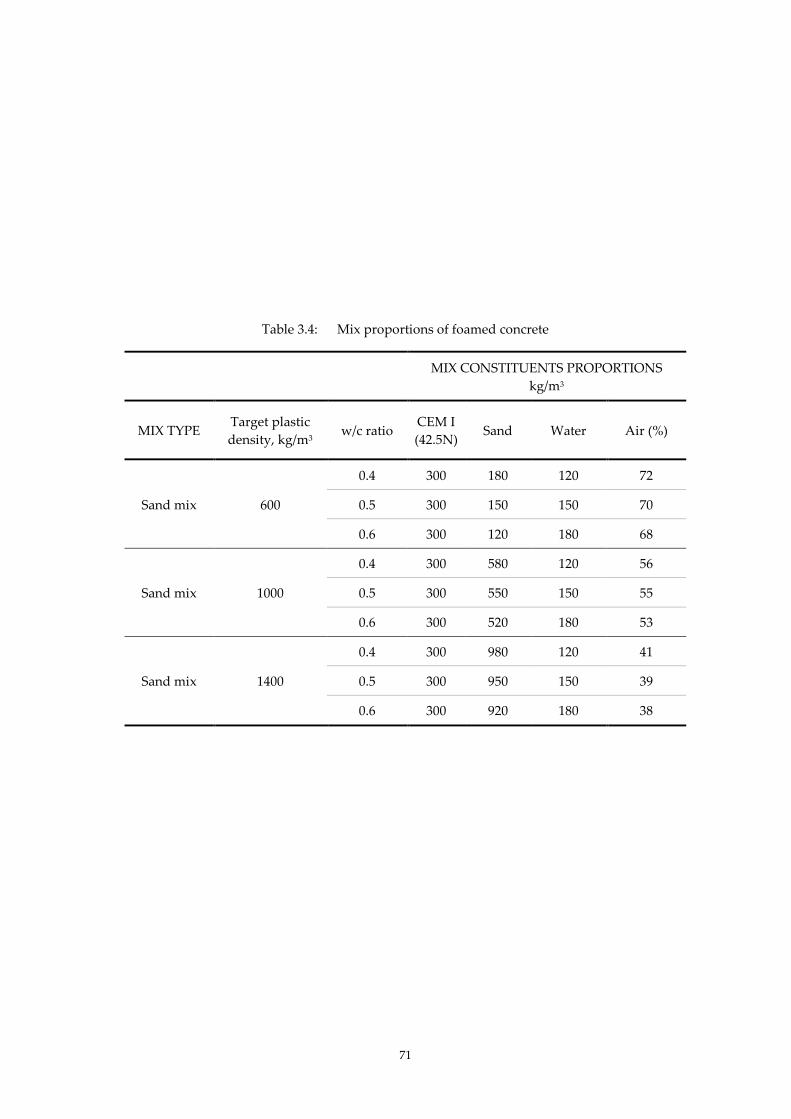
71
Table 3.4: Mix proportions of foamed concrete
MIX CONSTITUENTS PROPORTIONS
kg/m3
MIX TYPE Target plastic
density, kg/m3 w/c ratio
CEM I
(42.5N) Sand Water Air (%)
Sand mix 600
0.4 300 180 120 72
0.5 300 150 150 70
0.6 300 120 180 68
Sand mix 1000
0.4 300 580 120 56
0.5 300 550 150 55
0.6 300 520 180 53
Sand mix 1400
0.4 300 980 120 41
0.5 300 950 150 39
0.6 300 920 180 38
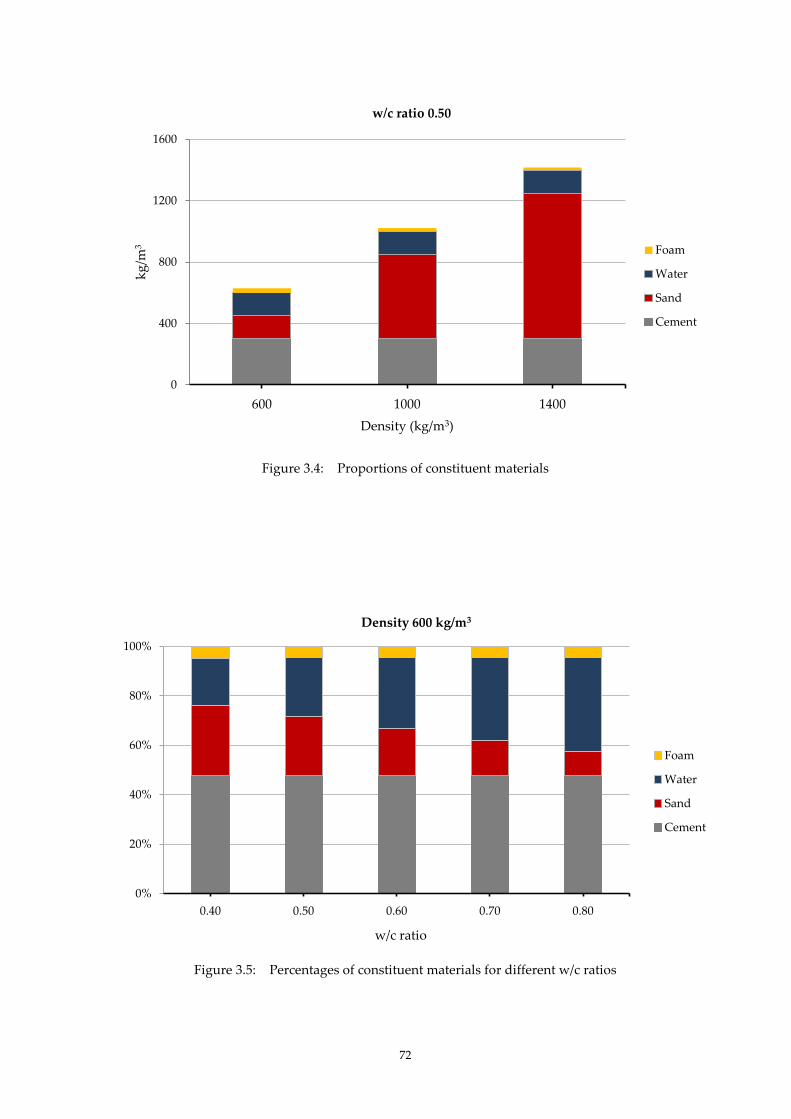
72
Figure 3.4: Proportions of constituent materials
Figure 3.5: Percentages of constituent materials for different w/c ratios
0
400
800
1200
1600
600 1000 1400
kg
/m3
Density (kg/m3)
w/c ratio 0.50
Foam
Water
Sand
Cement
0%
20%
40%
60%
80%
100%
0.40 0.50 0.60 0.70 0.80
w/c ratio
Density 600 kg/m3
Foam
Water
Sand
Cement

73
3.5 FOAM GENERATOR
The foam generator used in the study is shown in Figures 3.6 and 3.7. It consists of two main
chambers: the air chamber and the fluid chamber, a pump, and a diaphragm/membrane which
separates them. When compressed air is directed to the pump air chamber with the main air
valve, the surfactant solution is also drawn into the fluid chamber. The pressure of the
diaphragm on the fluid forces it out of the pump discharge. Foam is produced to the required
density by combining the solution with the compressed air and forcing it through restrictions
(for example, scouring pads) in the foam lance (Figures 3.8 and 3.9).
The density of the foam is dependent on the pressure applied to the foaming solution.
Throughout this current study, the pressure gauge of the foam generator was adjusted and
preset to 50 psi, which reduces to 40 psi during operation. As noted by Jones (2001), above
this level the decrease in foam density is not significant. The amount of air and solution
entering the foam lance is adjustable to obtain foam density of 50 ± 5 kg/m3 as this has
exhibited the greatest stability (Jones et al., 2003).
The density is established before adding to the base mix by measuring the weight of a foam
sample (to the nearest 0.1g) in a container of a known volume (to the nearest 1.0 ml).

74
Figure 3.6: Foam generator
Figure 3.7: The interior of foam generator
Compressed
air supply
Foam lance
Surfactant
Pump
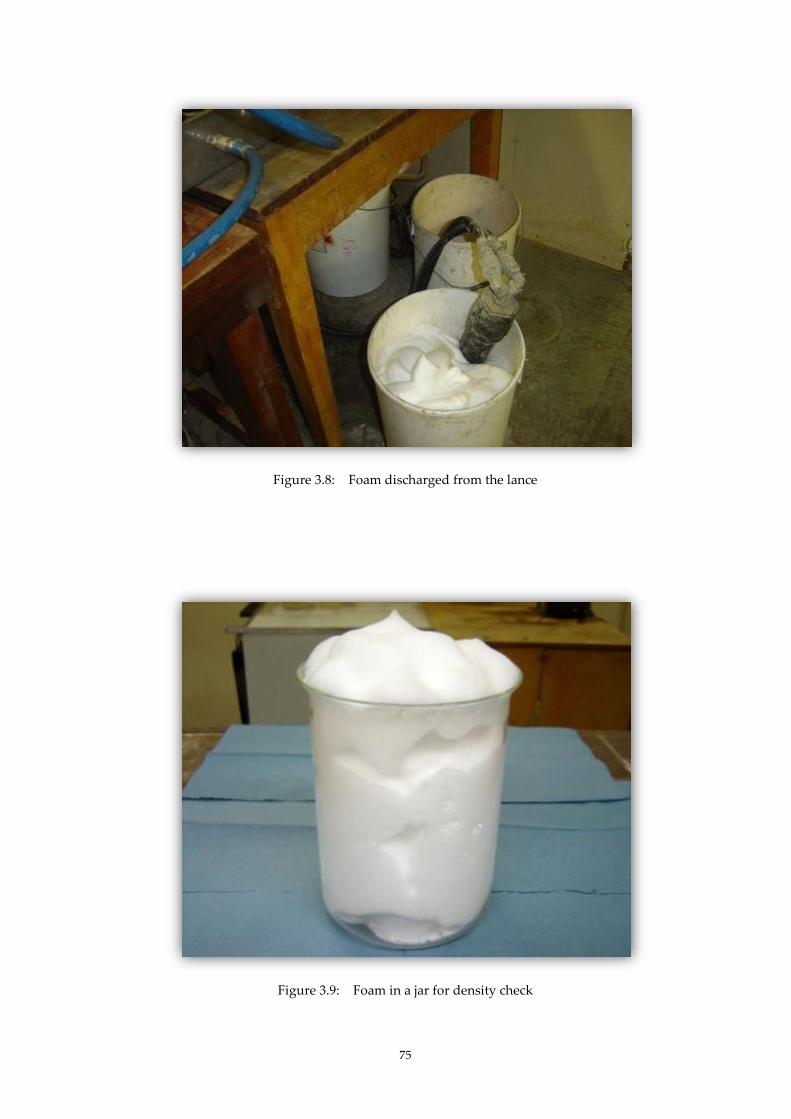
75
Figure 3.8: Foam discharged from the lance
Figure 3.9: Foam in a jar for density check
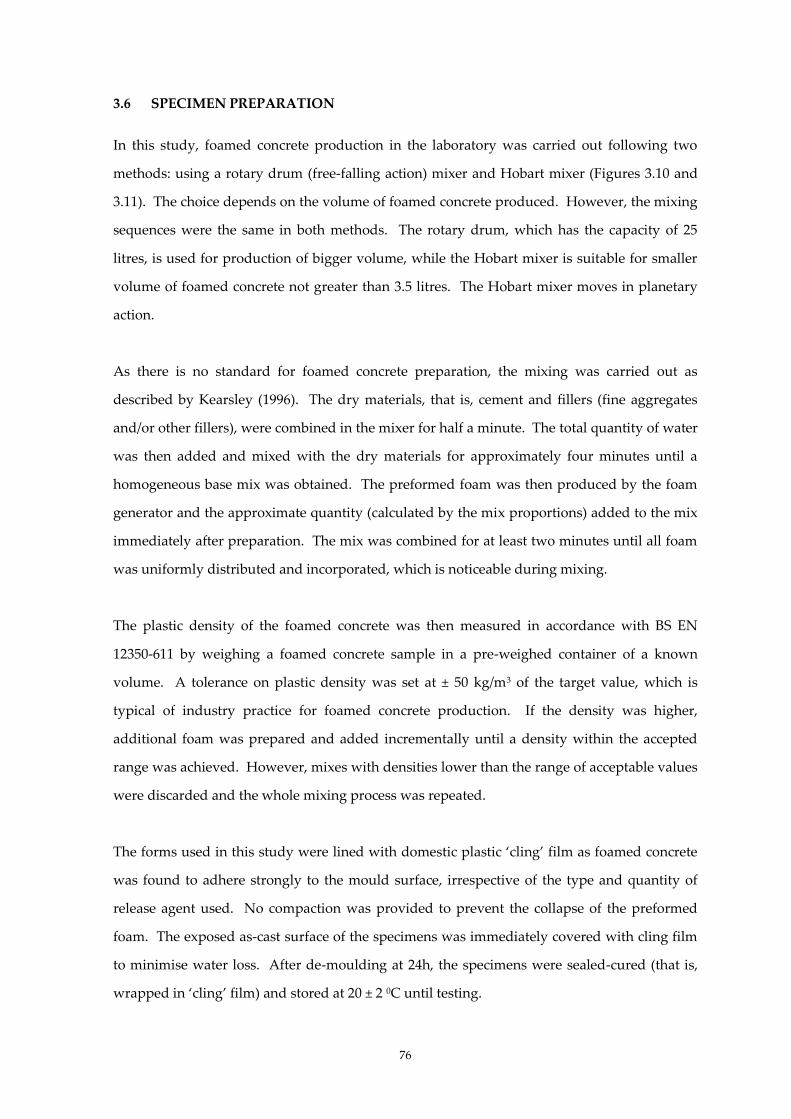
76
3.6 SPECIMEN PREPARATION
In this study, foamed concrete production in the laboratory was carried out following two
methods: using a rotary drum (free-falling action) mixer and Hobart mixer (Figures 3.10 and
3.11). The choice depends on the volume of foamed concrete produced. However, the mixing
sequences were the same in both methods. The rotary drum, which has the capacity of 25
litres, is used for production of bigger volume, while the Hobart mixer is suitable for smaller
volume of foamed concrete not greater than 3.5 litres. The Hobart mixer moves in planetary
action.
As there is no standard for foamed concrete preparation, the mixing was carried out as
described by Kearsley (1996). The dry materials, that is, cement and fillers (fine aggregates
and/or other fillers), were combined in the mixer for half a minute. The total quantity of water
was then added and mixed with the dry materials for approximately four minutes until a
homogeneous base mix was obtained. The preformed foam was then produced by the foam
generator and the approximate quantity (calculated by the mix proportions) added to the mix
immediately after preparation. The mix was combined for at least two minutes until all foam
was uniformly distributed and incorporated, which is noticeable during mixing.
The plastic density of the foamed concrete was then measured in accordance with BS EN
12350-611 by weighing a foamed concrete sample in a pre-weighed container of a known
volume. A tolerance on plastic density was set at ± 50 kg/m3 of the target value, which is
typical of industry practice for foamed concrete production. If the density was higher,
additional foam was prepared and added incrementally until a density within the accepted
range was achieved. However, mixes with densities lower than the range of acceptable values
were discarded and the whole mixing process was repeated.
The forms used in this study were lined with domestic plastic ‘cling’ film as foamed concrete
was found to adhere strongly to the mould surface, irrespective of the type and quantity of
release agent used. No compaction was provided to prevent the collapse of the preformed
foam. The exposed as-cast surface of the specimens was immediately covered with cling film
to minimise water loss. After de-moulding at 24h, the specimens were sealed-cured (that is,
wrapped in ‘cling’ film) and stored at 20 ± 2 0C until testing.

77
Figure 3.10: Mixing sequence in rotary drum mixer
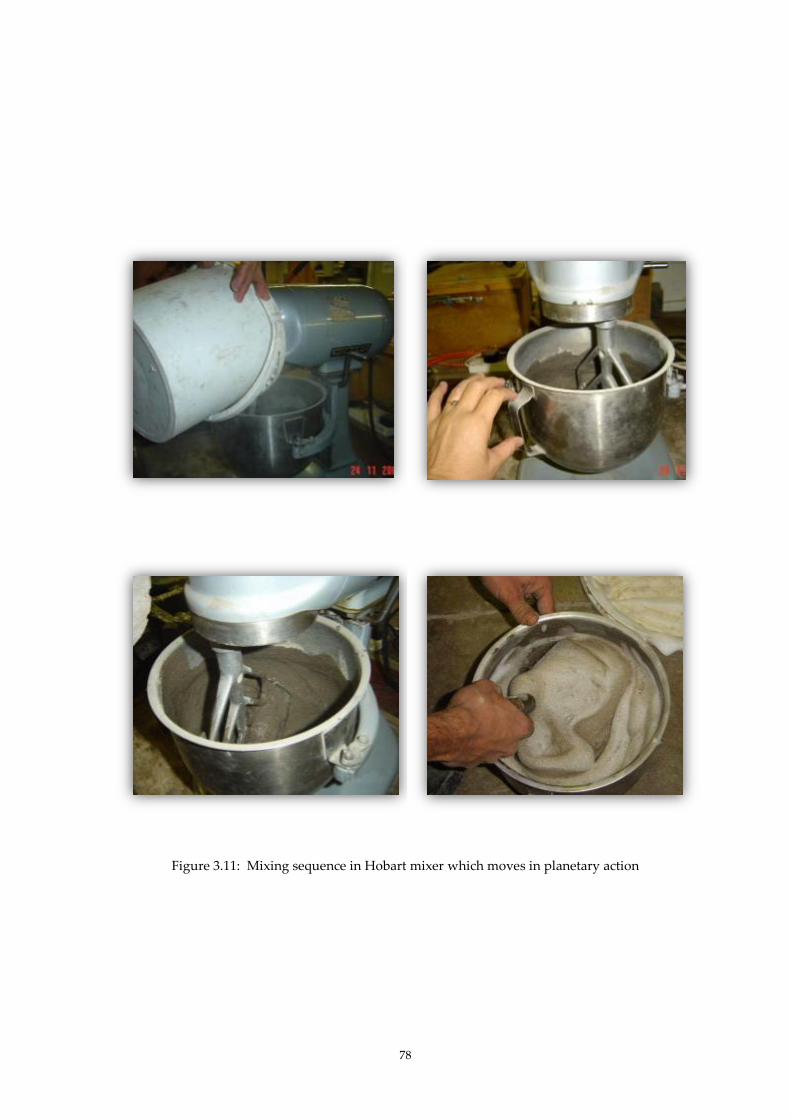
78
Figure 3.11: Mixing sequence in Hobart mixer which moves in planetary action

79
3.7 STANDARD PROCEDURE
There are standard procedures which are common to all studies. These are tests for plastic
density, curing, consistency and compressive strength. However, procedures which are
specific to each study are described in each study.
3.7.1 Plastic density
Plastic density of foamed concrete is measured in accordance to BS EN 12350 – 6 and values
within ± 50 kg/m3 of the target density is accepted; foamed concrete outside these values were
discarded and repeated. This was done by filling a container of known mass and volume with
foamed concrete (Figure 3.12). The excess amount at the top of the container was removed
and levelled of using a trowel or float without compaction. The container was weighed to
obtain the plastic density using the following equation:
m = M2 – M1 Equation 3.3
V
Where:
m = target plastic density, kg/m3
M2 = combined mass of container and sample, kg
M1 = mass of empty container, kg
V = volume of container, m3
The stability of foam can be observed visually. However, to examine volume stability, foamed
concrete is poured into Perspex cylinders of 300 mm and 500 mm tall with 75 mm diameter
without compaction (Figure 3.13). Any collapse or segregation can be observed visually and
by measuring the height of the specimens when the specimens are demoulded after 24 hours.
The specimens are then wrapped in ‘cling’ film and left to cure at room temperature
(Figure 3.14). They are split open and the bubble structures are examined for any possible
segregation.

80
3.7.2 Curing
A typical definition of curing (BS 8110, 1997) is ‘the process of preventing the loss of moisture
from the concrete whilst maintaining a satisfactory temperature regime’. The need for curing
concrete has been recognized since the inception of concrete. Although methods of curing for
conventional concretes have been established, the curing regime for foamed concrete is still
being explored. Following extensive research by Kearsley (1996 and 1999), the highest
strengths were obtained on specimens cured at 50 0C and on specimens sealed in plastic bags
and held at a constant temperature of 22 0C. Hence, the curing regime adopted in this study is
sealed curing that is wrapped in cling film and stored in plastic bags at constant temperature
of 22 0C as this is the most common curing regime adopted by other researchers (Jones and
McCarthy, 2004, 2005a, 2005b, Kearsley and Wainwright, 2000a, 2000b, 2001a, 2001b, Wee et
al., 2006).
Curing was done by wrapping all specimens which had been de-moulded after 24 hours.
Wrapping was done using ‘cling film’ (Figure 3.15). The specimens were then placed in a
controlled dry room where the temperature was maintained at 20 ± 2ºC until testing.
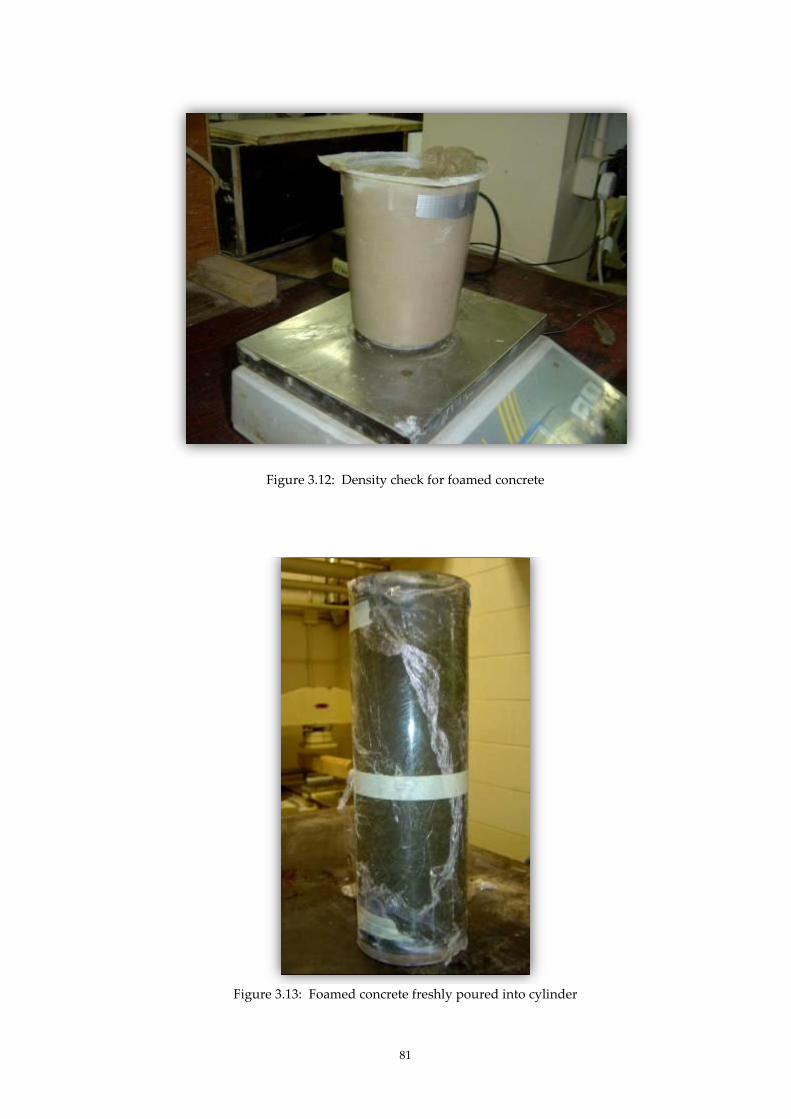
81
Figure 3.12: Density check for foamed concrete
Figure 3.13: Foamed concrete freshly poured into cylinder

82
Figure 3.14: After 24 hours, foamed concrete demoulded and wrapped in 'cling film'
Figure 3.15: Cubes covered with 'cling film' and placed at room temperature 20 ± 20C before
demoulding
500 mm
75 mm
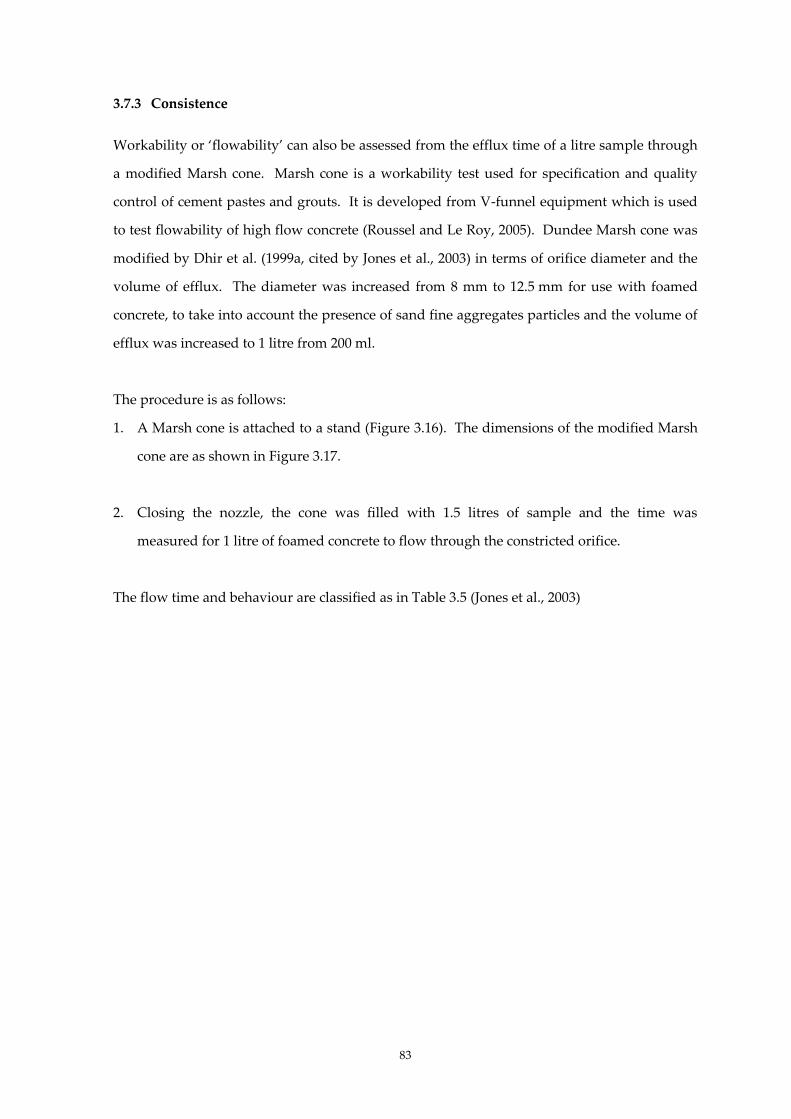
83
3.7.3 Consistence
Workability or ‘flowability’ can also be assessed from the efflux time of a litre sample through
a modified Marsh cone. Marsh cone is a workability test used for specification and quality
control of cement pastes and grouts. It is developed from V-funnel equipment which is used
to test flowability of high flow concrete (Roussel and Le Roy, 2005). Dundee Marsh cone was
modified by Dhir et al. (1999a, cited by Jones et al., 2003) in terms of orifice diameter and the
volume of efflux. The diameter was increased from 8 mm to 12.5 mm for use with foamed
concrete, to take into account the presence of sand fine aggregates particles and the volume of
efflux was increased to 1 litre from 200 ml.
The procedure is as follows:
1. A Marsh cone is attached to a stand (Figure 3.16). The dimensions of the modified Marsh
cone are as shown in Figure 3.17.
2. Closing the nozzle, the cone was filled with 1.5 litres of sample and the time was
measured for 1 litre of foamed concrete to flow through the constricted orifice.
The flow time and behaviour are classified as in Table 3.5 (Jones et al., 2003)
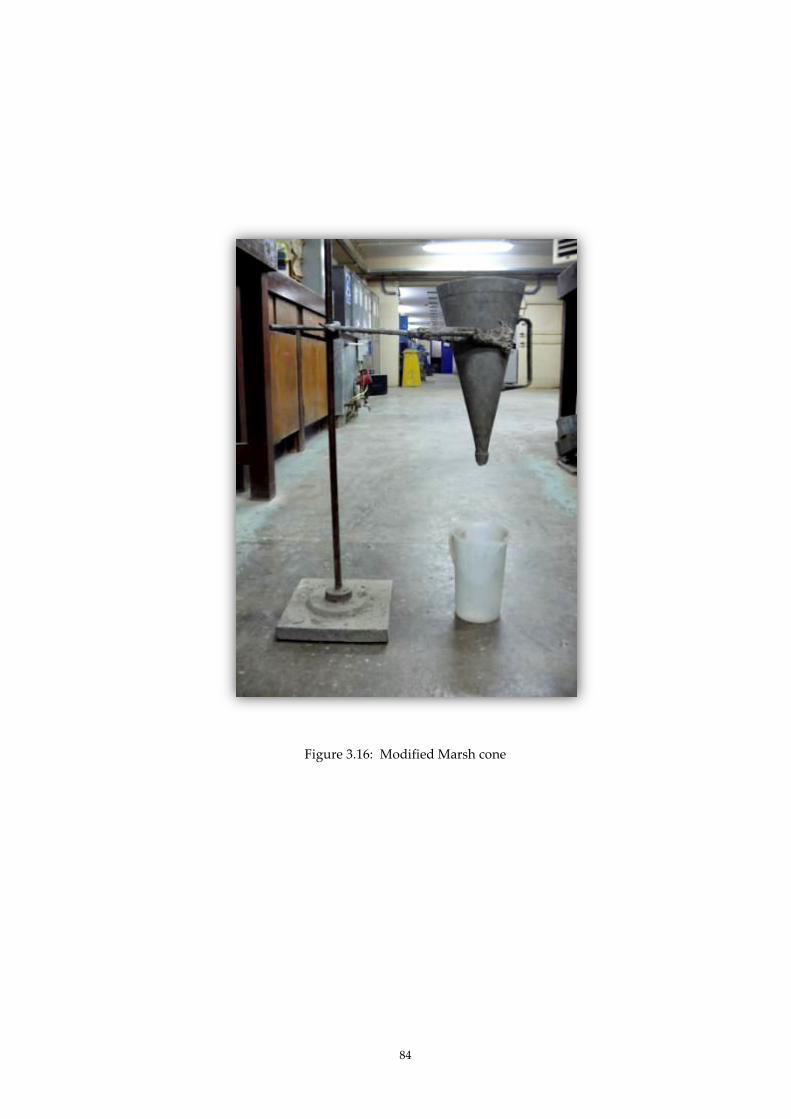
84
Figure 3.16: Modified Marsh cone
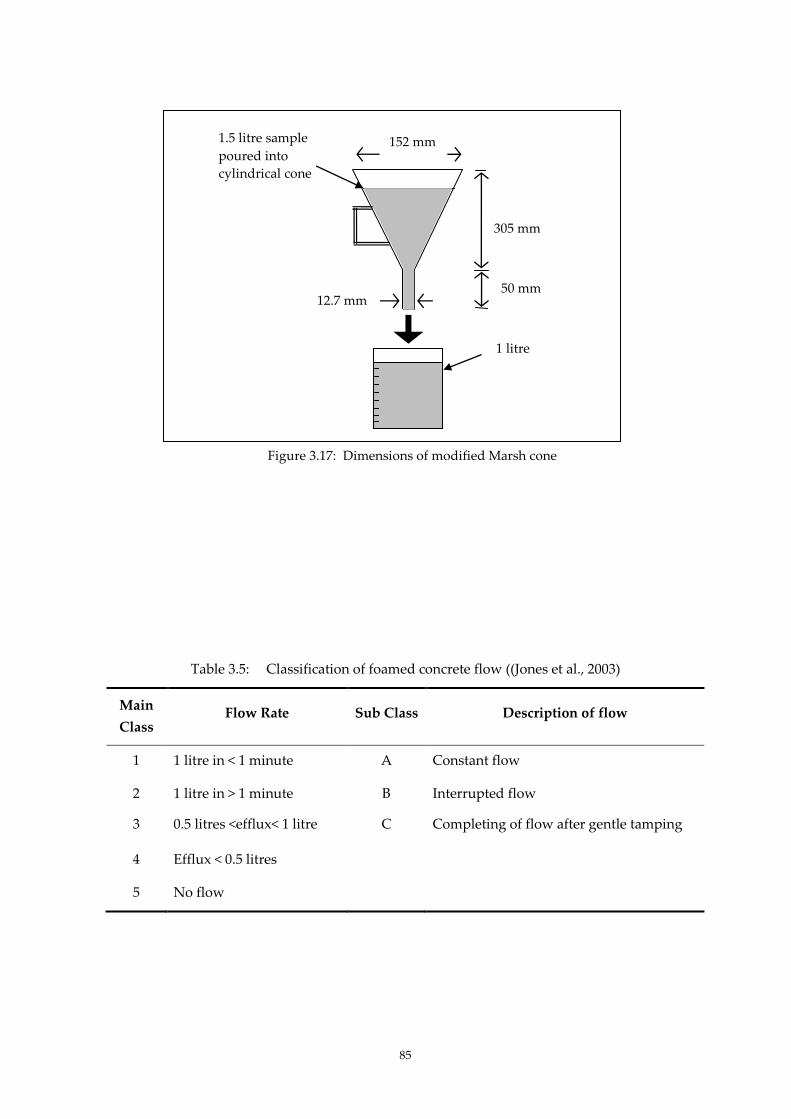
85
Table 3.5: Classification of foamed concrete flow ((Jones et al., 2003)
Main
Class Flow Rate Sub Class Description of flow
1 1 litre in < 1 minute A Constant flow
2 1 litre in > 1 minute B Interrupted flow
3 0.5 litres <efflux< 1 litre C Completing of flow after gentle tamping
4 Efflux < 0.5 litres
5 No flow
152 mm
305 mm
50 mm 12.7 mm
1 litre
1.5 litre sample
poured into
cylindrical cone
Figure 3.17: Dimensions of modified Marsh cone
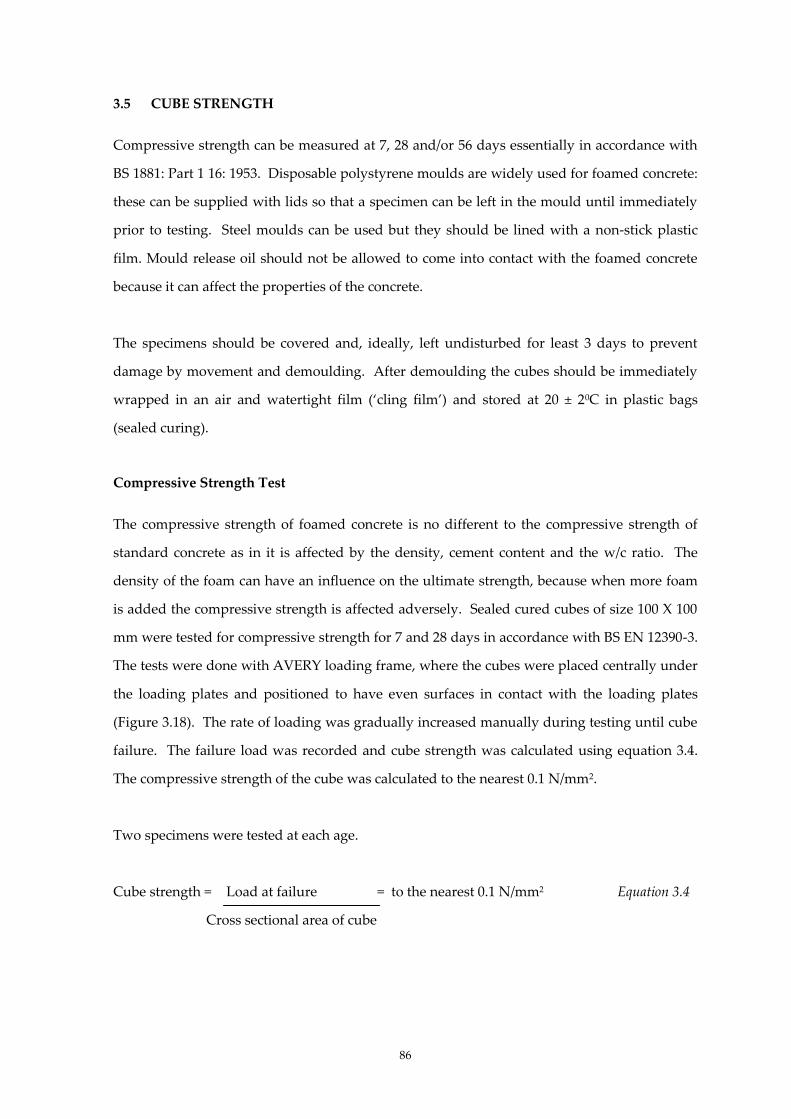
86
3.5 CUBE STRENGTH
Compressive strength can be measured at 7, 28 and/or 56 days essentially in accordance with
BS 1881: Part 1 16: 1953. Disposable polystyrene moulds are widely used for foamed concrete:
these can be supplied with lids so that a specimen can be left in the mould until immediately
prior to testing. Steel moulds can be used but they should be lined with a non-stick plastic
film. Mould release oil should not be allowed to come into contact with the foamed concrete
because it can affect the properties of the concrete.
The specimens should be covered and, ideally, left undisturbed for least 3 days to prevent
damage by movement and demoulding. After demoulding the cubes should be immediately
wrapped in an air and watertight film (‘cling film’) and stored at 20 ± 20C in plastic bags
(sealed curing).
Compressive Strength Test
The compressive strength of foamed concrete is no different to the compressive strength of
standard concrete as in it is affected by the density, cement content and the w/c ratio. The
density of the foam can have an influence on the ultimate strength, because when more foam
is added the compressive strength is affected adversely. Sealed cured cubes of size 100 X 100
mm were tested for compressive strength for 7 and 28 days in accordance with BS EN 12390-3.
The tests were done with AVERY loading frame, where the cubes were placed centrally under
the loading plates and positioned to have even surfaces in contact with the loading plates
(Figure 3.18). The rate of loading was gradually increased manually during testing until cube
failure. The failure load was recorded and cube strength was calculated using equation 3.4.
The compressive strength of the cube was calculated to the nearest 0.1 N/mm2.
Two specimens were tested at each age.
Cube strength = Load at failure = to the nearest 0.1 N/mm2 Equation 3.4
Cross sectional area of cube
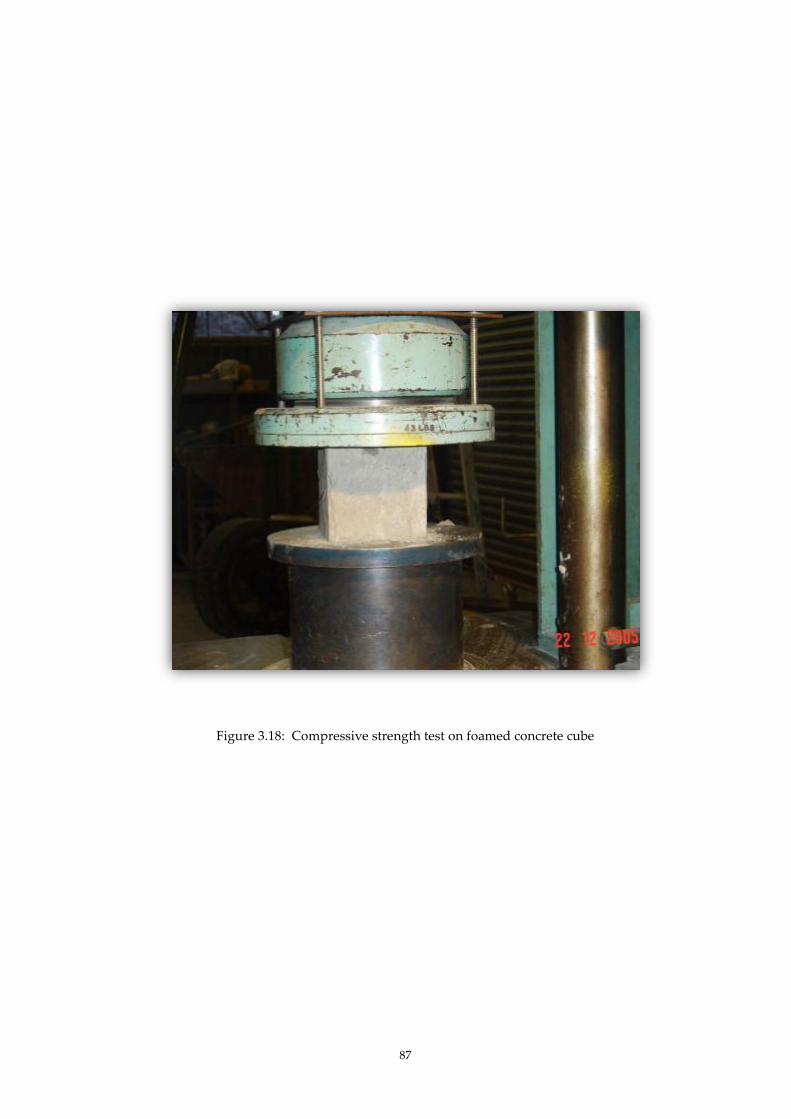
87
Figure 3.18: Compressive strength test on foamed concrete cube

88
CHAPTER 4: PERFORMANCE OF MODEL STRUCTURAL ELEMENT
4.1 INTRODUCTION
The use of foamed concrete has been established for underground applications such as trench
reinstatement and void fillings. While it is acknowledged that foamed concrete has low self-
weight and a rheology that is flowing, self-levelling and self-compacting, it is also recognized
as having excellent fire and thermal resistance. Given its advantages of being economic,
simple to use and environmentally sustainable, the use of foamed concrete should not be
confined to underground use. However, the strength of foamed concrete with densities
between 400 to 1600 kg/m3 was recorded to be between 1 to 10 kN/m3 (Dijk, 1991; BCA, 1994,
Jones and McCarthy, 2005b). This low strength had caused foamed concrete to be disregarded
as structural material. Researches over the past decade have sought to increase the strength of
foamed concrete. Several developments had been made, for example using different
surfactants, cement types, design mixes, methods and addition of fibres (Kearsley and Visagie,
1999; Jones and McCarthy, 2005b; Nambiar and Ramamurthy, 2006b).
The possibility of using foamed concrete in structural applications has been widely discussed
and studied (Jones and McCarthy, 2005, BRE report IP 12/04, Jumaat et al., 2009). Jones and
McCarthy (2005b) concluded that foamed concrete has properties that suggest that it is
practicable for use as a structural material. In their experiments using different design mixes
incorporating coarse fly ash, the strength of foamed concrete at 28 days was 25kN/m2 for
foamed concrete of 1600 kg/m3 density. Higher density and longer curing period (at 56 days)
produced comparably higher strength. Additionally, full-scale pilot tests using steel
reinforcement and polypropylene fibres in the foamed concrete beams indicated satisfactory
behaviour in their short-term experiments. However, it transpired that the addition of fibres
had caused some rheological difficulties in the foamed concrete. Consequently, it was
suggested that a more innovative approach should be taken to application and reinforcement
materials and methods (Jones and McCarthy, 2005b). One such approach undertaken by
Jumaat et al. (2009) experimented with the use of oil palm shells in foamed concrete of
1600 kg/m3 density and recorded compressive strength of 25kN/m2. Full-scale oil palm shell
foamed concrete beams using steel reinforcement were also tested.
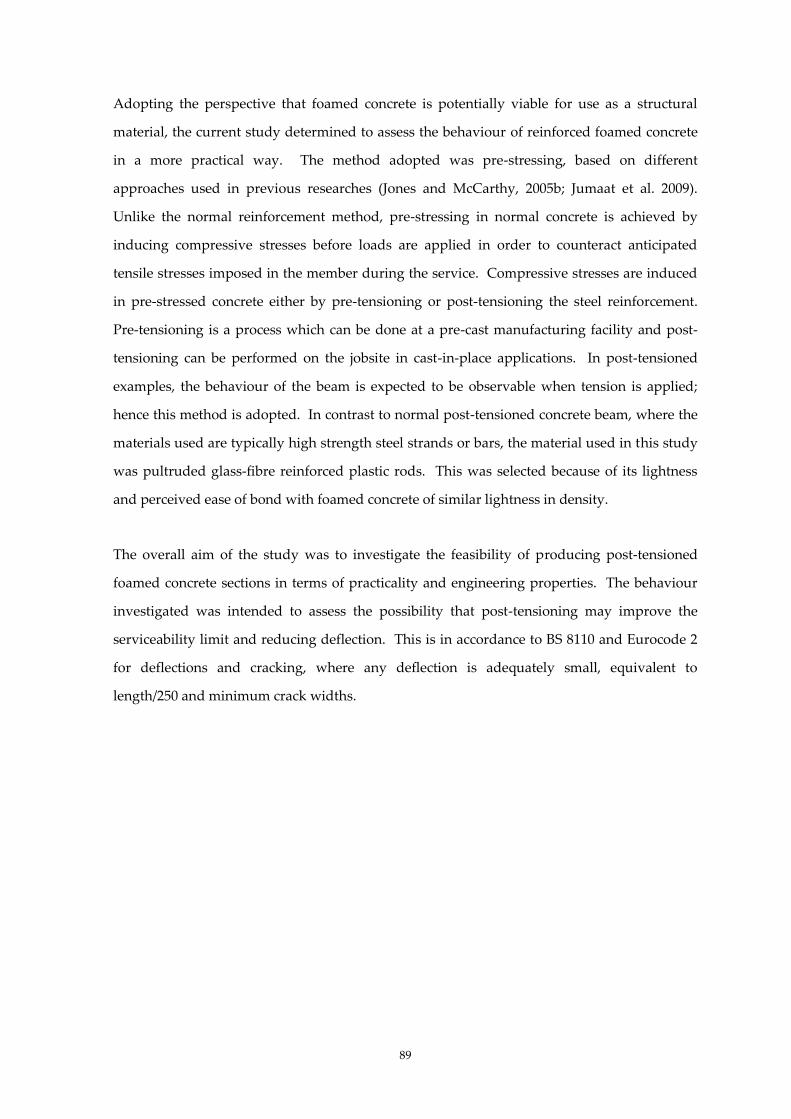
89
Adopting the perspective that foamed concrete is potentially viable for use as a structural
material, the current study determined to assess the behaviour of reinforced foamed concrete
in a more practical way. The method adopted was pre-stressing, based on different
approaches used in previous researches (Jones and McCarthy, 2005b; Jumaat et al. 2009).
Unlike the normal reinforcement method, pre-stressing in normal concrete is achieved by
inducing compressive stresses before loads are applied in order to counteract anticipated
tensile stresses imposed in the member during the service. Compressive stresses are induced
in pre-stressed concrete either by pre-tensioning or post-tensioning the steel reinforcement.
Pre-tensioning is a process which can be done at a pre-cast manufacturing facility and post-
tensioning can be performed on the jobsite in cast-in-place applications. In post-tensioned
examples, the behaviour of the beam is expected to be observable when tension is applied;
hence this method is adopted. In contrast to normal post-tensioned concrete beam, where the
materials used are typically high strength steel strands or bars, the material used in this study
was pultruded glass-fibre reinforced plastic rods. This was selected because of its lightness
and perceived ease of bond with foamed concrete of similar lightness in density.
The overall aim of the study was to investigate the feasibility of producing post-tensioned
foamed concrete sections in terms of practicality and engineering properties. The behaviour
investigated was intended to assess the possibility that post-tensioning may improve the
serviceability limit and reducing deflection. This is in accordance to BS 8110 and Eurocode 2
for deflections and cracking, where any deflection is adequately small, equivalent to
length/250 and minimum crack widths.

90
4.2 MATERIALS, EXPERIMENTAL PROGRAMMES AND METHODOLOGY
4.2.1 Introduction
The overall aim of this study was to improve the serviceability limit of foamed concrete beams
by method of post-tensioning as shown in the conceptual graph in Figure 4.1. In this graph,
the current typical behaviour of foamed concrete beam is illustrated by line P1, where, at small
load, the deflection is high. Improvement in serviceability for deflection by post-tensioning
was intended to decrease deflection from point A to point B, and ideally to point C, in line P3.
In another view, higher loads will be possible without exceeding the serviceability limit.
Full-scale foamed concrete beams reinforced with polypropylene fibres showed an
improvement in deflection (Jones and McCarthy, 2005b). Adopting similar mix design and
beam dimensions, this experiment used a different method of reinforcement. In this study,
two beams were post-tensioned using a glass-fibre reinforced polymer (GFRP) rod.
Compared to carbon steel, this material was more suitable because foamed concrete has
relatively poor carbonation resistance (Jones and McCarthy, 2005b). The density of GFRP was
near to the density of foamed concrete. Beam 1 was tensioned at the bottom and beam 2 was
tensioned at both the top and bottom.
The target plastic density was 1400 kg/m3 with 600 kg/m3 cement content and 0.35 w/c ratio.
This density was chosen because it was found that 1400 kg/m3 is the minimum density at
which foamed concrete with coarse fly ash (FAc) filler could be used in structural elements
(Jones and McCarthy, 2005b).

91
Figure 4.1: Hypothetical improvement to serviceability limit of foamed concrete beam.
Def
lect
ion
Load
Small deflection at
high loads
Improved deflection
High deflection at small loads P1
P2
P3
+
Reduced deflection for
same load
Assumed serviceability limit
for deflection
A
+ B
+ C

92
4.2.2 Constituent Materials
1. Portland cement (CEM I 42.5N conforming to BS EN 197-1: 2000) was the cement
employed.
2. The filler was 100 per cent coarse fly ash (FAc) with a 45m sieve retention of 36.0%
and conforming to BS 3892-2/ BS EN 450 and ASTM C 618-94a Class F.
3. The surfactant was a synthetic type foaming agent which was commercially available.
The dilution was 6% aqueous solution which produced foamed to a density of
50 kg/m3.
4. Superplasticiser conforming to BS EN 934-2.8. This superplasticiser was used because
at 0.35 w/c ratio, the mix was less workable to fill up the formwork.
5. Pultruded glass-fibre reinforced polymer (GFRP) rod the size of which was 12 mm in
diameter. The length was longer than beam length (2 m) which allowed for post-
tensioning. The properties of the glass-fibre reinforced polymer are described in
Table 4.1.
4.2.3 Formwork preparation
The dimensions of the beams were 200 mm by 300 mm (height) and 2000 mm length, as
shown in Figure 4.2. These were carefully constructed for easy reassembling. After beam 1
was demoulded, the same formwork was used for beam 2, as shown in Figure 4.3.
A single GFRP rod was positioned in the centre at 20 mm from the bottom of beam 1 and
beam 2. These were held in place using polystyrene spacers. An additional rod for beam 2
was placed at 20 mm from the top level of the beam.
For both beams, two inverted-U steel bars were cast in the beam for ease of transportation
around the laboratory areas. The positions of the bars were 414 mm from both ends
(Figure 4.4). These were points of zero bending moment (point of contraflexure).

93
Table 4.1: Glass fibre reinforced plastics, GFRP
Properties Value
1. Flexural strength 275-700 MN/m2
2. Flexural modulus 14-34 GN/m2
3. Tensile strength 200-550 MN/m2
4. Tensile modulus 14 - 31 GN/m2
5. Compressive strength 96-206 MN/m2
6. Izod impact strength 50 -100 ft. lb.
7. Fire retardancy Surface spread of flame (BS 476) to
Class 1 or Class 2 can be attained.
8. Density 1700 - 1900 kg/m3
9. Water absorption 0.5 - 2%
10. Barcol hardness 40 - 70
11. Specific heat 940 J/kg K
12. Thermal conductivity 0.35 W/m K
13. Co-efficient of thermal expansion 7.2 X 10 -6 / K
14. Heat Distortion Temperature 100 - 2000C
94
Figure 4.2: Dimensions of beam 1
Figure 4.3: Dimensions of beam 2
H = 300 mm
B = 200 mm
H = 300
mm
20 mm
B = 200 mm
20 mm
20 mm
BEAM 2
BEAM 1
GFRP rod
H = 300
mm
Length = 2000 mm
H = 300 mm
B = 200 mm

95
Figure 4.4: Position of inverted U-bars
Figure 4.5: Foamed concrete mixed in a standard inclined rotating mixer
414 mm from
both ends
Inverted-U bars for
transportation
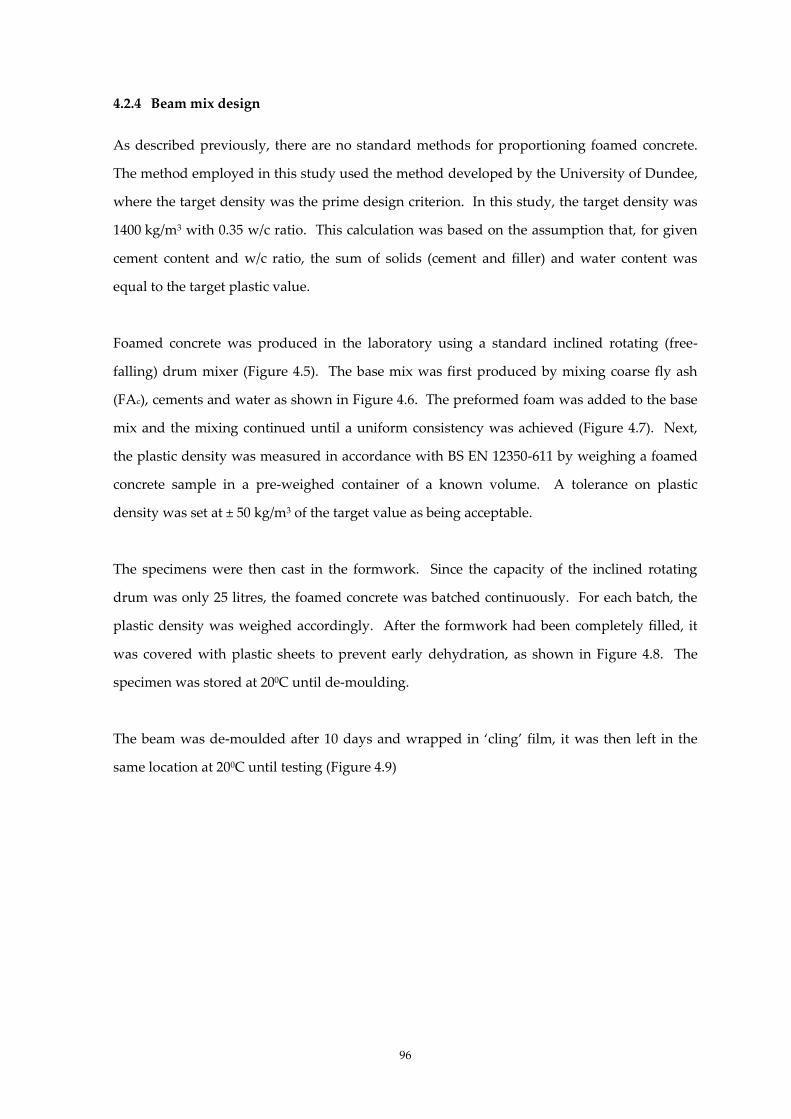
96
4.2.4 Beam mix design
As described previously, there are no standard methods for proportioning foamed concrete.
The method employed in this study used the method developed by the University of Dundee,
where the target density was the prime design criterion. In this study, the target density was
1400 kg/m3 with 0.35 w/c ratio. This calculation was based on the assumption that, for given
cement content and w/c ratio, the sum of solids (cement and filler) and water content was
equal to the target plastic value.
Foamed concrete was produced in the laboratory using a standard inclined rotating (free-
falling) drum mixer (Figure 4.5). The base mix was first produced by mixing coarse fly ash
(FAc), cements and water as shown in Figure 4.6. The preformed foam was added to the base
mix and the mixing continued until a uniform consistency was achieved (Figure 4.7). Next,
the plastic density was measured in accordance with BS EN 12350-611 by weighing a foamed
concrete sample in a pre-weighed container of a known volume. A tolerance on plastic
density was set at ± 50 kg/m3 of the target value as being acceptable.
The specimens were then cast in the formwork. Since the capacity of the inclined rotating
drum was only 25 litres, the foamed concrete was batched continuously. For each batch, the
plastic density was weighed accordingly. After the formwork had been completely filled, it
was covered with plastic sheets to prevent early dehydration, as shown in Figure 4.8. The
specimen was stored at 200C until de-moulding.
The beam was de-moulded after 10 days and wrapped in ‘cling’ film, it was then left in the
same location at 200C until testing (Figure 4.9)
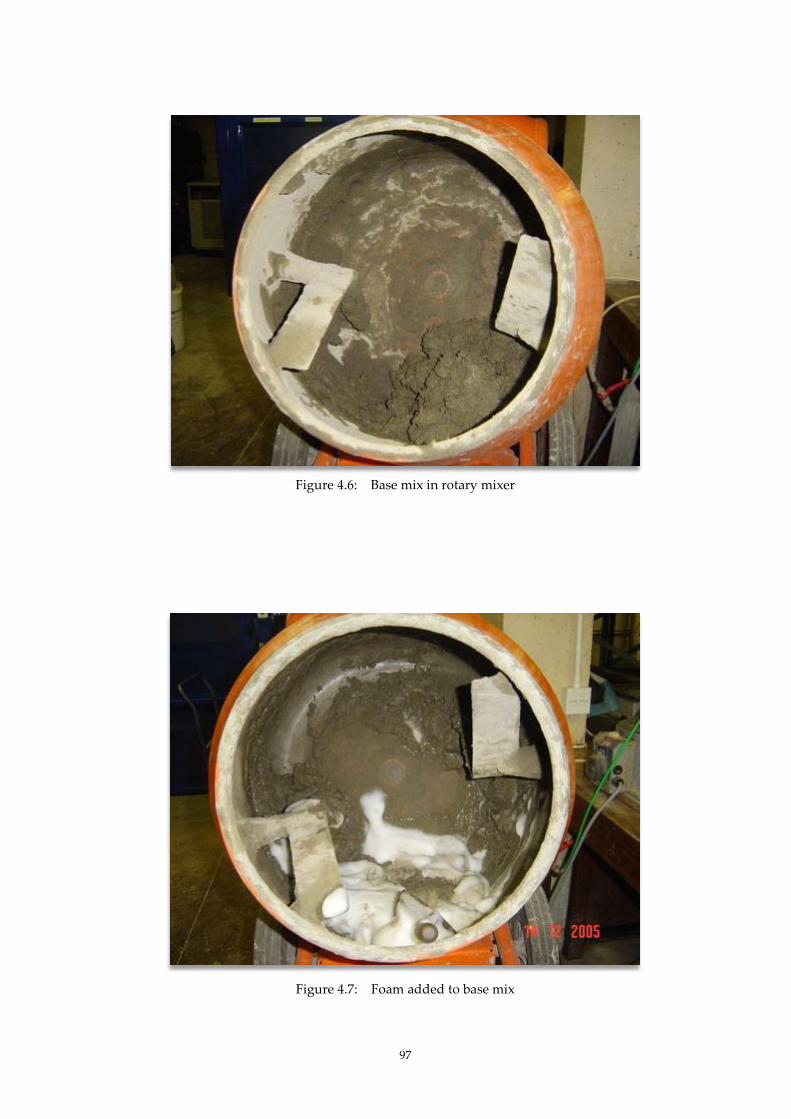
97
Figure 4.6: Base mix in rotary mixer
Figure 4.7: Foam added to base mix
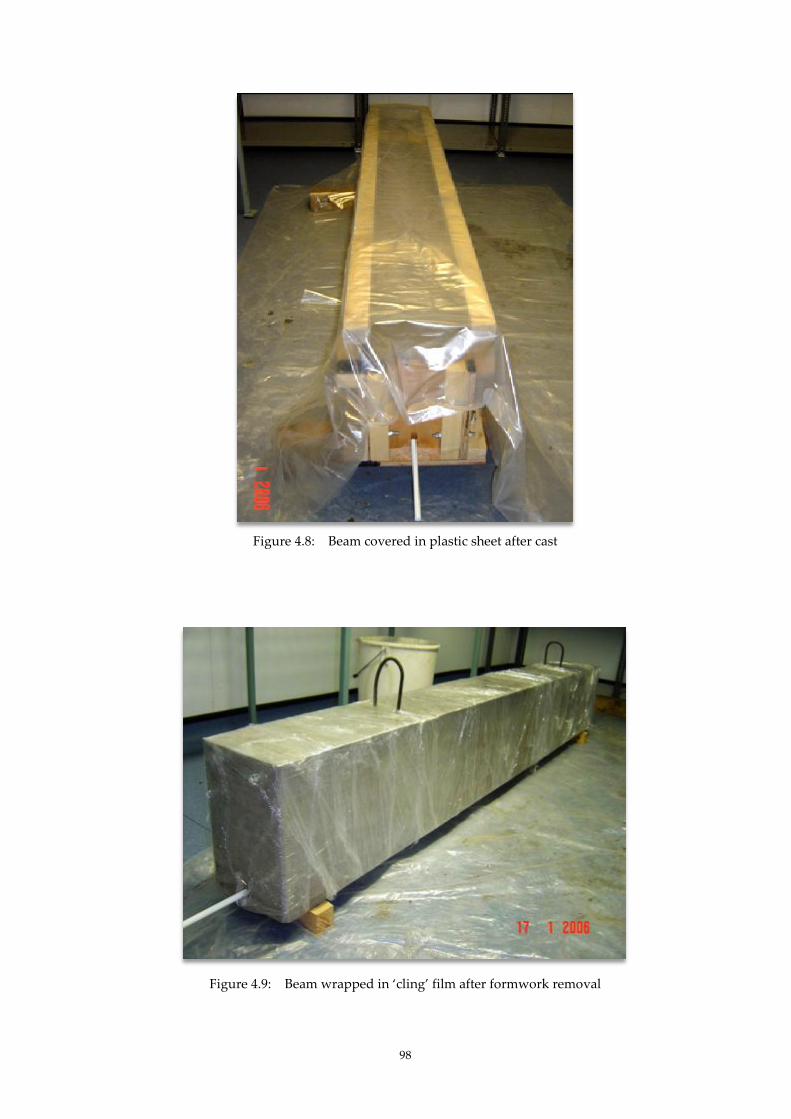
98
Figure 4.8: Beam covered in plastic sheet after cast
Figure 4.9: Beam wrapped in ‘cling’ film after formwork removal
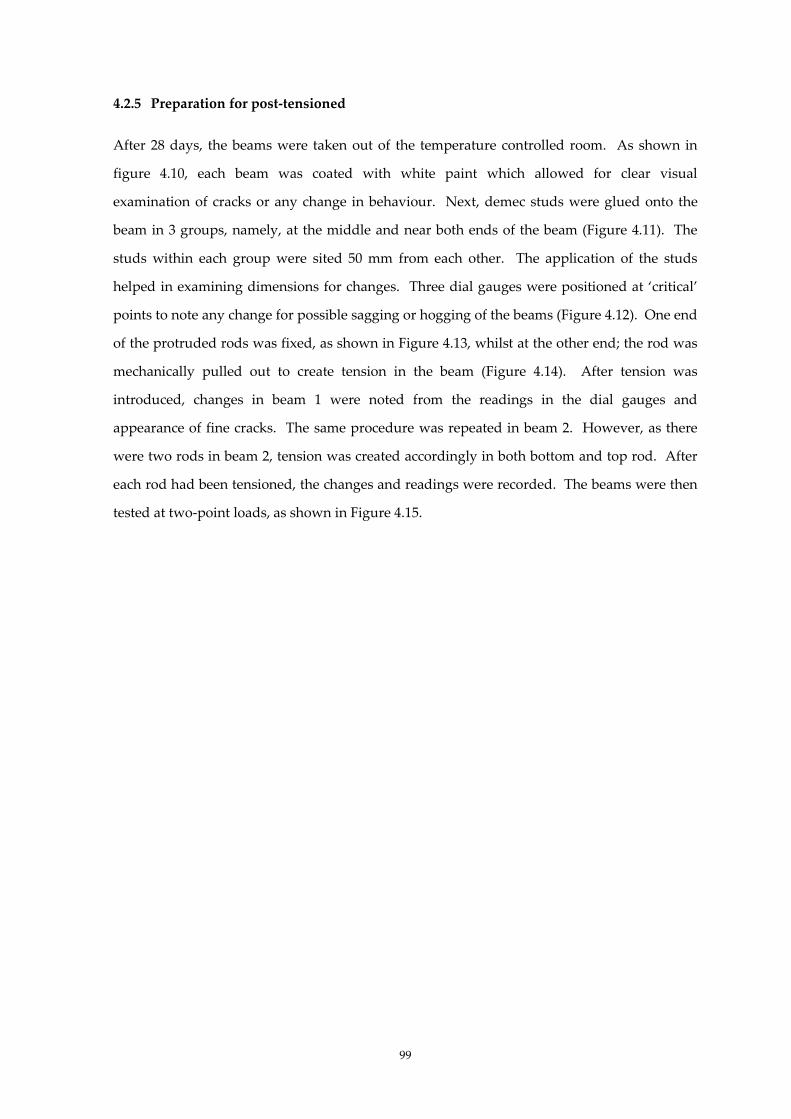
99
4.2.5 Preparation for post-tensioned
After 28 days, the beams were taken out of the temperature controlled room. As shown in
figure 4.10, each beam was coated with white paint which allowed for clear visual
examination of cracks or any change in behaviour. Next, demec studs were glued onto the
beam in 3 groups, namely, at the middle and near both ends of the beam (Figure 4.11). The
studs within each group were sited 50 mm from each other. The application of the studs
helped in examining dimensions for changes. Three dial gauges were positioned at ‘critical’
points to note any change for possible sagging or hogging of the beams (Figure 4.12). One end
of the protruded rods was fixed, as shown in Figure 4.13, whilst at the other end; the rod was
mechanically pulled out to create tension in the beam (Figure 4.14). After tension was
introduced, changes in beam 1 were noted from the readings in the dial gauges and
appearance of fine cracks. The same procedure was repeated in beam 2. However, as there
were two rods in beam 2, tension was created accordingly in both bottom and top rod. After
each rod had been tensioned, the changes and readings were recorded. The beams were then
tested at two-point loads, as shown in Figure 4.15.

100
Figure 4.10: Beam 1 and beam 2 coated with white paint
Figure 4.11: Demec studs glued in positions
BEAM 2
BEAM 1

101
Figure 4.12: Three dial gauges positioned at ‘critical’ points
Figure 4.13: Close-up detail of fixed end
Dial gauges
Tension end

102
Figure 4.14: Close-up detail of tensioned end
Figure 4.15: Beam prepared to be tested

103
Figure 4.16: Cracks propagated
Figure 4.17: Tested Beam - front view
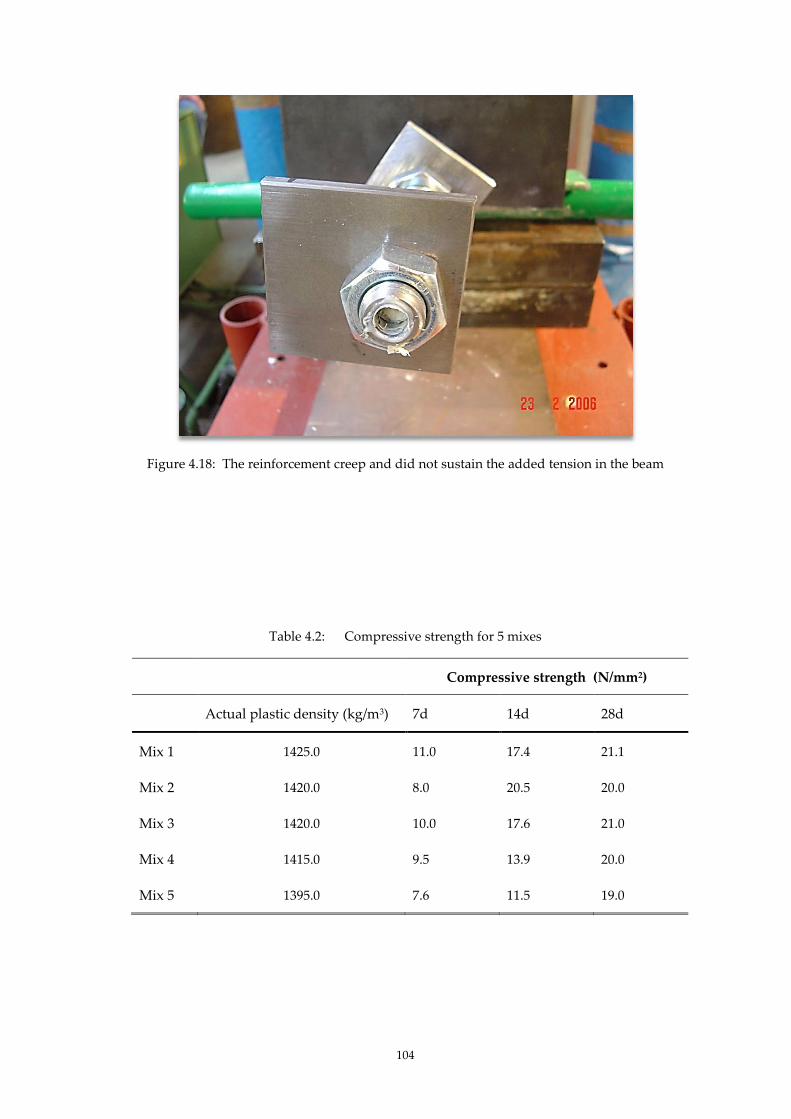
104
Figure 4.18: The reinforcement creep and did not sustain the added tension in the beam
Table 4.2: Compressive strength for 5 mixes
Compressive strength (N/mm2)
Actual plastic density (kg/m3) 7d 14d 28d
Mix 1 1425.0 11.0 17.4 21.1
Mix 2 1420.0 8.0 20.5 20.0
Mix 3 1420.0 10.0 17.6 21.0
Mix 4 1415.0 9.5 13.9 20.0
Mix 5 1395.0 7.6 11.5 19.0

105
4.3 RESULTS
4.3.1 Compressive strength
Five mixes were batched which made up the beam. For each mix, the density was weighed
and compressive strength tests were on each mix. The acceptable mixes are shown in
Table 4.2. From this table, there was a small variation within the target density of 1400 kg/m3.
The average compressive strength for 28 days was 20.2 N/mm2.
4.3.2 Effect of added tension
After tension was introduced, changes in the beam were noted from the readings in the dial
gauges and appearance of fine cracks. After each rod had been tensioned, the changes and
readings were recorded. It is shown in Table 4.3 that when stress was added, there were
displacements in the beam. The two ends showed negative displacements; -0.36 mm and
- 0.18 mm, which indicated the ends displaced downwards and the centre beam displaced
upwards, as indicated by the positive displacement, 0.19 mm.
Table 4.4 showed the displacement readings when tension was added consecutively by
mechanically pulling out the bottom rod and the top rod. When tension was added in the
bottom rod, in reading Set 1, the displacements were negative in point A and C which
indicated the beam hogged. In reading Set 2 when the top tension was added, there was a
negative displacement in point B, which implied that the beam sagged. Consecutive readings
in Set 3 (bottom) and 4 (top) suggested that the beam behaved in expected manner; hogging
and sagging accordingly.
4.3.3 Two point load test
1. There was high deflection on 1st crack.
2. The foamed concrete beam did not sustain the added tension because of the reinforcement
creep (Figure 4.18).
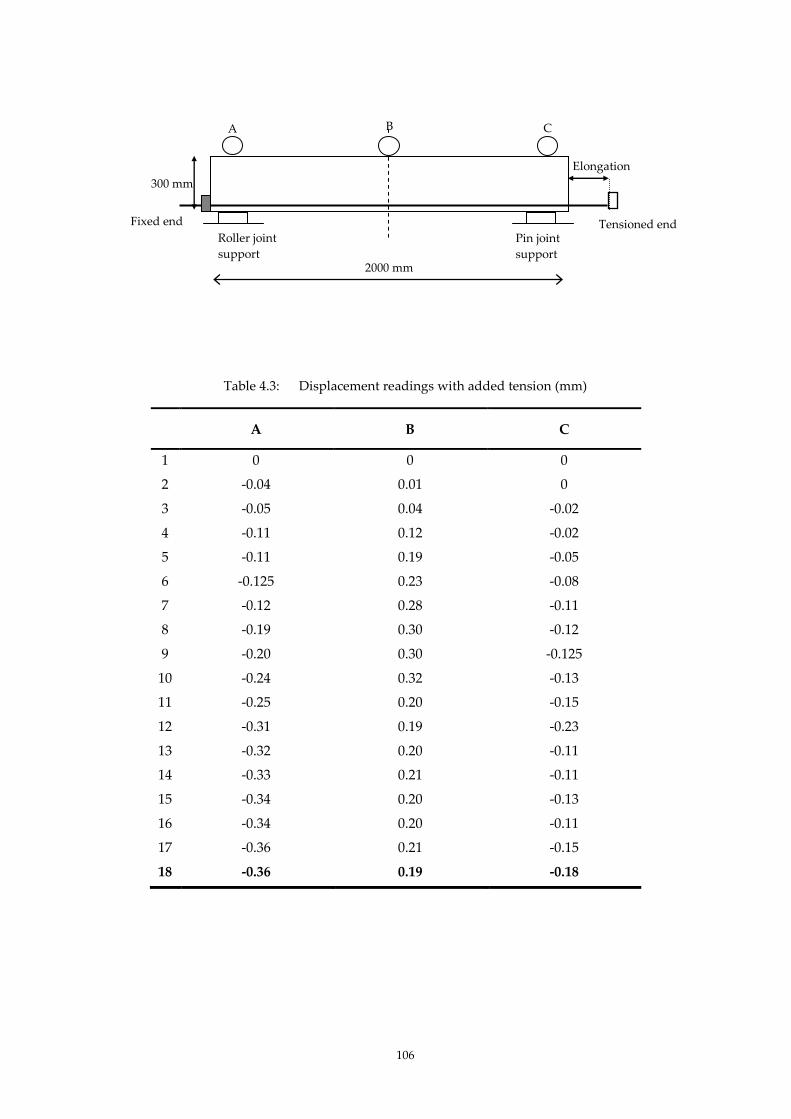
106
Table 4.3: Displacement readings with added tension (mm)
A B C
1 0 0 0
2 -0.04 0.01 0
3 -0.05 0.04 -0.02
4 -0.11 0.12 -0.02
5 -0.11 0.19 -0.05
6 -0.125 0.23 -0.08
7 -0.12 0.28 -0.11
8 -0.19 0.30 -0.12
9 -0.20 0.30 -0.125
10 -0.24 0.32 -0.13
11 -0.25 0.20 -0.15
12 -0.31 0.19 -0.23
13 -0.32 0.20 -0.11
14 -0.33 0.21 -0.11
15 -0.34 0.20 -0.13
16 -0.34 0.20 -0.11
17 -0.36 0.21 -0.15
18 -0.36 0.19 -0.18
2000 mm
Fixed end
Elongation
C A B
Roller joint
support
Pin joint
support
300 mm
Tensioned end
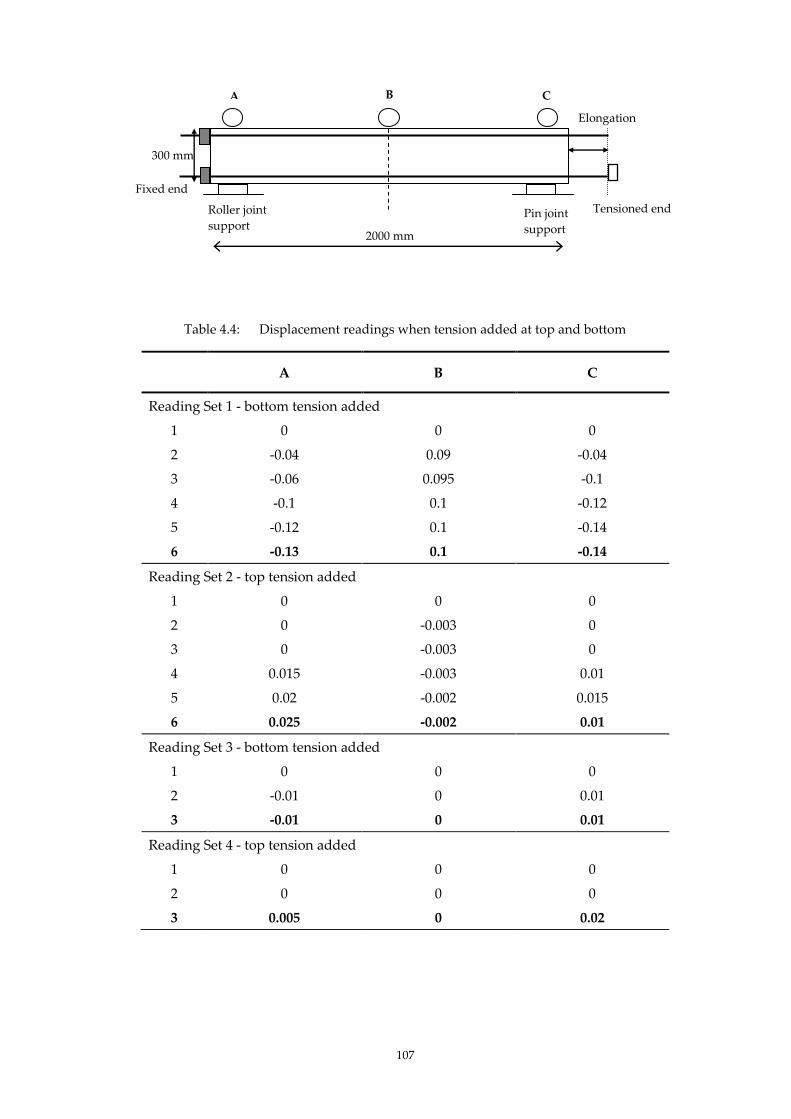
107
Table 4.4: Displacement readings when tension added at top and bottom
A B C
Reading Set 1 - bottom tension added
1 0 0 0
2 -0.04 0.09 -0.04
3 -0.06 0.095 -0.1
4 -0.1 0.1 -0.12
5 -0.12 0.1 -0.14
6 -0.13 0.1 -0.14
Reading Set 2 - top tension added
1 0 0 0
2 0 -0.003 0
3 0 -0.003 0
4 0.015 -0.003 0.01
5 0.02 -0.002 0.015
6 0.025 -0.002 0.01
Reading Set 3 - bottom tension added
1 0 0 0
2 -0.01 0 0.01
3 -0.01 0 0.01
Reading Set 4 - top tension added
1 0 0 0
2 0 0 0
3 0.005 0 0.02
2000 mm
Fixed end
Elongation
Roller joint
support Pin joint
support
300 mm
Tensioned end
A B C
108
4.4 SUMMARY OF RESULTS
1. The average compressive strength of foamed concrete was 20.2 N/mm2 at 28 days. With
the use of 100 % FAc as filler, the compressive strength of foamed concrete cubes was
expected to gain more than 25 N/mm2 at longer curing days.
2. Manufactured post-tensioned was selected because of the ability to control the amount
of stress and to prevent preload fracture. The approach was able to control sagging and
hogging in the beam.
3. The foamed concrete beam responded to the tension added, thus shown in the
displacement readings, where the hogging and sagging corresponded to the tension
added.
4. There was high deflection on the first crack due to the creep by the GFRP rod. This
unsatisfactory outcome was related to reinforcement problem.

109
CHAPTER 5: RHEOLOGY
5.1. INTRODUCTION
Foamed concrete is known to have low density 400 - 1600 kg/m3. It does not behave like
conventional concrete due to its individual properties, in particular, the ability to self-
compact. Dhir et al. (1999) found that the yield values of foamed concrete were all less than
2 Nm, which indicates self-flowing behaviour. As a result, foamed concrete acts more like a
fluid. In addition to its self-compacting ability, foamed concrete has the further advantages of
being self-levelling, of transferring load and being easy to re-excavate. All cement–based
materials depend on rheology which implies pumping, spreading, moulding and compaction.
Many examples exist of foamed concrete being pumped over considerable distances and of
foamed concrete being used as reinstatement material (Aldridge, 2000; Basiurski, 2000).
(http://www.foamedconcrete.co.uk/news1.php, accessed 20th January 2011)
The Highways Agency and Transport Research Laboratory (2001) stated that the workability
of foamed concrete increased with additional increases in the water:cement (w/c) ratio and by
increasing the dosage of superplasticiser. This literature also noted that concrete formed from
a protein-based surfactant has a much shorter flow time, indicative of a much lower plastic
viscosity, and was prone to segregation. Jones and McCarthy (2005) found that foamed
concrete using low-lime coal fly ash mixes was less viscous than sand mixes. Although
Nambiar and Ramamurthy (2006) have reported that the flow of foamed concrete mixes was
reduced with an increase in foam volume, and that the flow reduced steeply with reduction in
design density, these findings have yet to be verified by other studies.
Foamed concrete has been widely used for underground works such as backfilling, soil
stabilising and trench reinstatements. These can involve pumping concrete over long
distances, filling in gaps and deep orifices, moulding, spreading and self-levelling areas. For
these applications, the consistency in rheological properties is crucial in predicting the
behaviour of foamed concrete to avoid segregation, premature setting, and the inability to
achieve self-levelling. Rheological properties in the fresh state of foamed concrete play a
critical role in the development of foamed concrete in the hardened state.

110
These rheological properties, namely, yield stress and plastic viscosity, are also influenced by
the mix design – densities, w/c ratio and the constituent materials - cement type, fillers and
surfactants that produce the foam. Yield stress is the minimum stress required to initiate flow
and plastic viscosity is the measure of the internal resistance for fluid to flow. The rheological
properties can also be related to the microstructure and the instability. Three significant
themes that emerged in the study of foamed concrete and rheology are:
1. the empirical values of yield stress and plastic viscosity of the mixes;
2. the different behaviour influenced by design mixes and materials; and
3. the relationship between rheological properties, microstructure and instability.
These three themes formed the basis for investigation of the characteristics of foamed concrete
in this study. It was noted that the empirical results were not straightforward to obtain. This
made it very difficult to relate results to similar tests (Ferraris, 1999).
5.2 MATERIALS, EXPERIMENTAL PROGRAMMES AND METHODOLOGY
5.2.1 Introduction
Foamed concrete is far more Bingham in nature than Newtonian or thixotropic due to the
build-up of structure within the materials (McCarthy, 2005). The air content changes as the
w/c ratio and the density change; an increase in w/c ratio decreases the air content. In the
same way, the air content decreases with increase in density. Significant changes to the
rheological behaviour were found when using different constituent materials (Jones and
McCarthy, 2005b).
The overall aim of the current study was to investigate the rheological properties of foamed
concrete in relation to varying the air content, varying the different constituents and varying
the different proportions of the constituents. The effect of varying air content was
investigated as it was found that, in cement-based materials, an increase in the air content (by
increasing the amount of air-entraining agent) had resulted in changes to the plastic viscosity
and the yield stress (Chia and Zhang, 2004; Seabra et al., 2007).

111
In the current study, there were two groups of tests. In the first group, one set of constituent
materials was used in different densities and w/c ratios. The foamed concrete densities were
600 kg/m3, 1000 kg/m3 and 1400 kg/m3 at w/c ratio 0.4, 0.5 and 0.6. In the second group, five
mixes of different proportions of the constituent materials at density 600 kg/m3 with w/c ratio
0.40 to 0.80 and three mixes of density 1000 kg/m3 at 0.40 to 0.80 w/c ratio.
Most of the tests employed to measure rheological properties are capable of testing a single
parameter: the yield stress or plastic viscosity (Ferraris, 1999). The slump test is an example of
single point test method which is commonly used as an indication of concrete workability.
The slump value is related to yield stress and not comparable with any other rheological
measures (Chia and Zhang, 2007; Roussel, 2007). The Marsh cone test is another single point
test which relates measured flow time out of the cone to fluidity (Roussel, 2005). The Marsh
cone test measures the plastic viscosity of the material.
Since foamed concrete behaves more Bingham-like in nature, the study of its rheological
properties required two rheological parameters: yield stress and plastic viscosity. The method
used in this current study was based on the widely known two-point test which was first
introduced by Tattersall (1991) and further developed by Domone et al. (1999). The test
equipment employed was the Brookfield viscometer, which was capable of measuring the
viscosity of fluid (Figure 5.1). This technique used a rotating element inserted into the
specimen and rotated at a constant velocity. The principle of measurement by the rotating
viscometer utilised the rule that the rotating torque (the force to cause steady rotation) is
proportional to the viscosity.
In addition to the Brookfield viscometer, the Dundee Marsh cone test was also briefly
included in order to study the flowability of the second group of foamed concrete mixes. The
method statement of the Dundee Marsh cone test was described in Chapter 3.
112
5.2.2 Constituent Materials
1. Ordinary Portland cement (CEM I 42.5N conforming to BS EN 197-1) was the cement
employed in the Set 1. In Set 2, combinations of cementitious materials were selected.
The total cementitious material was kept at 300 kg/m3.
2. ‘Fine’ fly ash (FAf) with a 45 m sieve retention of 7.5%, loss on ignition (LOI) of 5.0%
and conforming to BS EN 450.5 was used to replace CEM I 42.5N at 30% by mass
fraction.
3. Metakaolin used as replacement for cement to a level of 20%. The high specific surface
area of metakaolin was in the range of 4000m2/kg to 12000m2/kg.
4. The main filler was natural sand, fine aggregate (conforming to BS EN 12620:2002 with
particles greater than 2.36 mm removed by sieving), although there was a variation in
Set 2.
5. Coarse fly ash, FAc with a 45m sieve retention of 36.0% and conforming to BS 3892-2/
BS EN 450 and ASTM C 618-94a Class F was used as 50% and 100% replacement for
sand.
6. The surfactants used in this study were protein-based which were commercially
available. The dilution was 6% aqueous solution which produced foamed to a density
of 50 kg/m3.
7. The mixing water used conformed to BS EN 1008 Mixing water for concrete. In this
study, the w/c ratio was varied from 0.40 to 0.60 in Set 1 and 0.40 to 0.6 in Set 2.

113
5.2.3 Experimental Programme
There were two main sets of experiments: Set 1 and Set 2 (Figure 5.1). In Set 1, a set of
consistent constituent materials were used and combinations of cement and filler types were
studied in Set 2. There were variations in densities and w/c ratios. The densities were
600 kg/m3, 1000 kg/m3 and 1400 kg/m3 and the w/c ratios were 0.40, 0.50 and 0.60. For Set 2,
only 2 densities were studied and wider range of w/c ratios.
5.2.3 Mix design
Foamed concrete was produced in a Hobart mixer. The Hobart mixer was the most suitable of
the mixers tested because its mixing action generated the greatest mass transfer (interaction)
between the base-mix and foam phases and also sufficient shearing action to generate suitable
base-mix workability (Jones, 2000). Jones also stated that the use of mixers with greater
vertical actions, such as helical or screw type may produce foamed concrete of higher
strengths.
The base mix was first prepared by adding the sand or coarse fly ash with the cement and
water until a homogeneous mix was achieved. Then preformed foam was added to the base
mix and combined until fully incorporated and uniformly distributed. The plastic density of
the foamed concrete was then measured in accordance with BS EN 12350-6. If the density was
found to be higher than expected, additional foam was added incrementally. This was
repeated until a density within the accepted range was achieved, which was within ±50 kg/m3
of the target density. However, mixes with densities lower than the range of acceptable values
were discarded and the whole mixing process repeated.
5.2.4 Brookfield Viscometer
As shown in Figure 5.2, the Brookfield viscometer was used in conjunction with a Helipath
stand and a T-bar spindle. This eight-speed model has a square speed control knob with two
numbers on each face. By moving the knob through two complete turns, this viscometer gave
eight readings at increasing increments and then decreasing increments.
114
This type of Brookfield viscometer was a dial-reading type which notes the position of a
pointer in relation to the rotating dial. The dial reading type (Figure 5.3) was suitable for most
applications where samples are tested over a short period of time and a permanent detailed
record of rheological behaviour was not required. Readings may be made intermittently
when the pointer passes under the glass window or when reading is held and viscometer
stopped. The Helipath stand was a motorised stand which slowly raises and lowers the
viscometer (at a rate of 22 mm per minute) while a T-bar spindle rotates in the sample
material. T-bar spindles were suitable for the measurement of non-flowing or slow-flowing
materials such as pastes, gels and creams (Figure 5.4). The crossbar of the spindle thus
continuously cuts into fresh material, describing a helical path through the sample as it
rotates, thus eliminating the ‘channelling’ effect. By changing the rotational speed of the
spindle, a range of readings was obtained. The values of yield stress and plastic viscosity
were measured from the equation of the trendline obtained from the graphs of rotational
speed (rpm) and the viscometer readings.
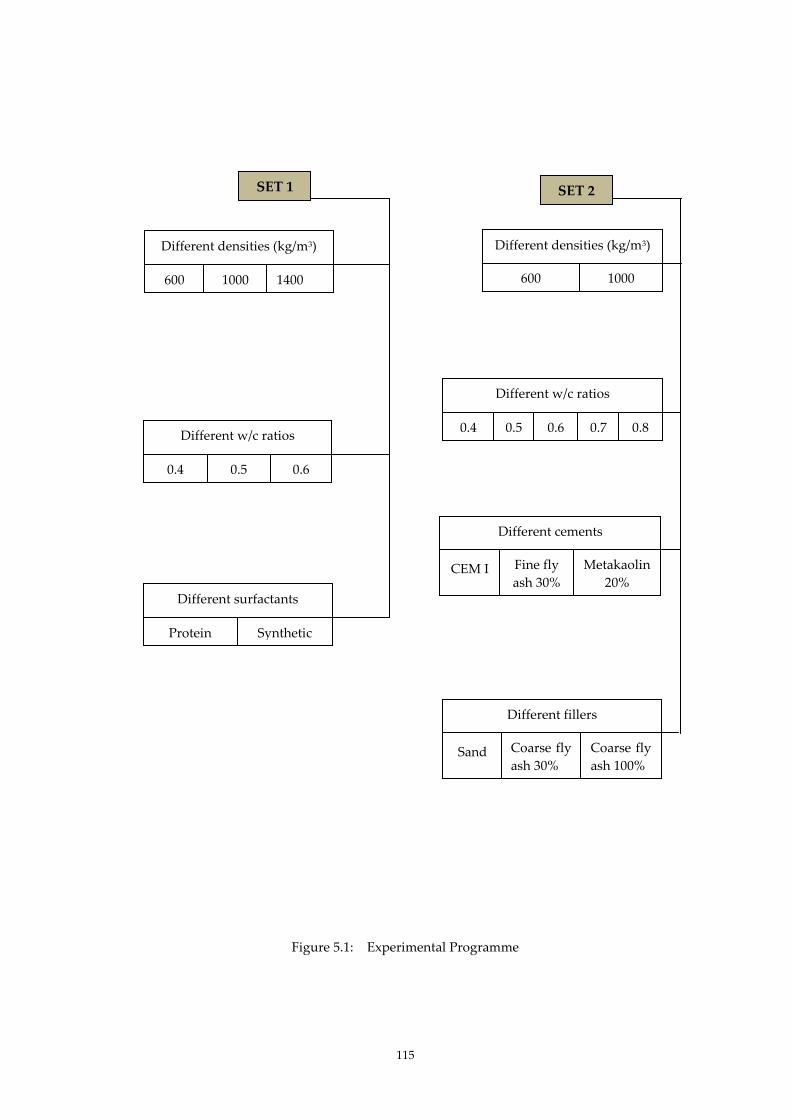
115
Figure 5.1: Experimental Programme
SET 1
Different densities (kg/m3)
600 1000 1400
Different w/c ratios
0.4 0.5 0.6
Different surfactants
Protein Synthetic
Different densities (kg/m3)
600 1000
Different fillers
Coarse fly
ash 100%
SET 2
Different cements
CEM I Fine fly
ash 30%
Metakaolin
20%
Coarse fly
ash 30% Sand
Different w/c ratios
0.4 0.5 0.6 0.7 0.8
Coarse fly
ash 100%

116
Helipath stand
Brookfield Viscometer
Specimen
T-spindle
Figure 5.2: Brookfield Viscometer set

117
Figure 5.3: Brookfield Viscometer dial reading display
Figure 5.4: A set of spindles

118
Method Statement for using the Brookfield Viscometer
1. Set up the Brookfield viscometer as shown in Figure 5.2.
2. Pour the freshly mixed foamed concrete into a 100 ml plastic beaker to half fill the
container.
3. Place the beaker under the Brookfield viscometer with the spindle positioned at the
centre of the beaker.
4. Position the spindle in the centre to prevent the spindle from leaving the concrete or
reaching the base of the beaker. This was done by adjusting the stopper prior to
starting.
5. The spindle rotated in an upward and downward movement. Readings were taken
every 30 seconds and repeated 3 times for each speed.
6. The spindle speed was increased at the preset increment; the range was from 0.5 to 100
revolutions per minute. Step 5 was repeated for each speed.
7. The readings were tabulated and plotted in a line graph. The axes for the graph were
shear stress values (torque) for the x-axis and rate of shear values (rotational speed) for
the y-axis (Figure 5.5). Using the best fit line drawn through all the corresponding shear
stress values (torque) against rate of shear values, values of plastic viscosity (slope
angle) and yield stress (intercept x-axis) can be obtained (Tattersall, 1991).
An example of the calculation of yield stress and plastic viscosity for density 600 kg/m3
at w/c 0.5 is shown in Figure 5.6. When the results are plotted a best fit line is drawn
through all corresponding shear stress values (torque) against rate of shear values
(rotational speed) as shown. The equation of this line was then manipulated to obtain
the values for plastic viscosity (slope angle) and yield stress (intercept x-axis) as
illustrated.

119
Figure 5.5: Relationship between torque, T and Speed, N for Bingham material (Tattersall, 1991)
Figure 5.6: An example of rotational speed against viscometer reading
y = 2.32x - 6.71
0
1
2
3
4
5
6
0 1 2 3 4 5 6
Ro
tati
on
al S
pee
d (
rpm
)
Viscometer Reading (torque)
Density 600 kg/m3 at w/c ratio 0.5
Sp
eed
, N
Torque, T
C’
Slope = C”
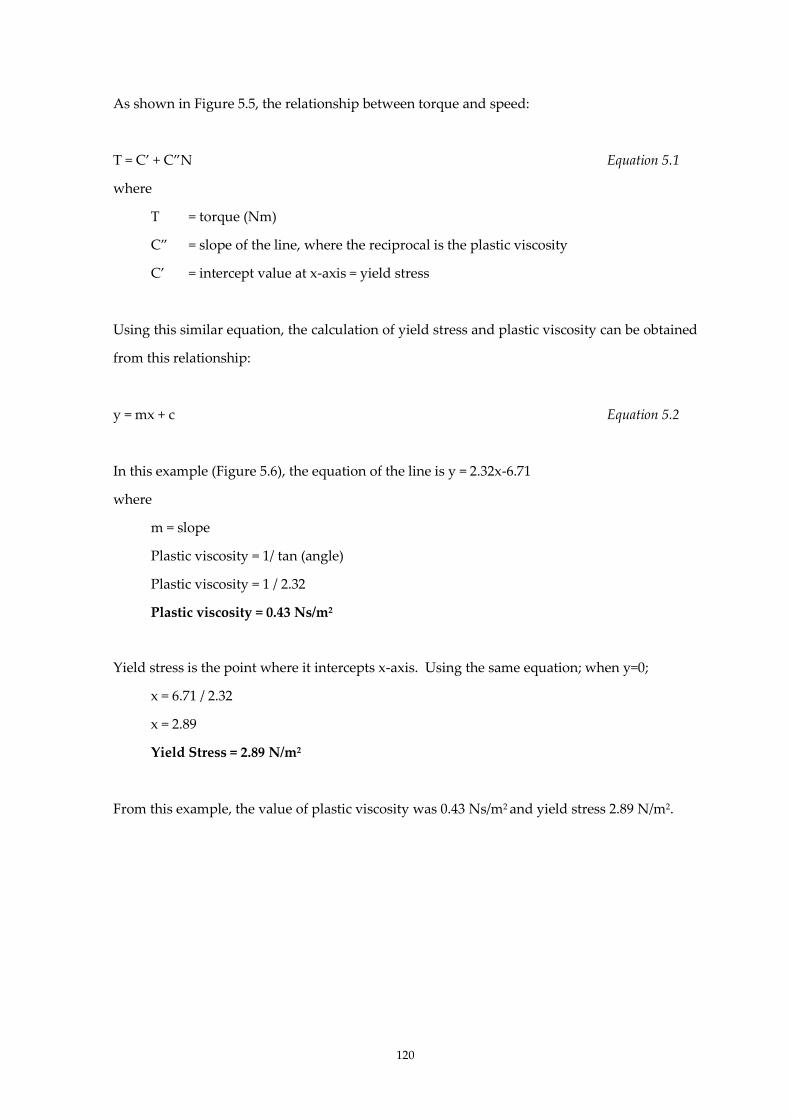
120
As shown in Figure 5.5, the relationship between torque and speed:
T = C’ + C”N Equation 5.1
where
T = torque (Nm)
C” = slope of the line, where the reciprocal is the plastic viscosity
C’ = intercept value at x-axis = yield stress
Using this similar equation, the calculation of yield stress and plastic viscosity can be obtained
from this relationship:
y = mx + c Equation 5.2
In this example (Figure 5.6), the equation of the line is y = 2.32x-6.71
where
m = slope
Plastic viscosity = 1/ tan (angle)
Plastic viscosity = 1 / 2.32
Plastic viscosity = 0.43 Ns/m2
Yield stress is the point where it intercepts x-axis. Using the same equation; when y=0;
x = 6.71 / 2.32
x = 2.89
Yield Stress = 2.89 N/m2
From this example, the value of plastic viscosity was 0.43 Ns/m2 and yield stress 2.89 N/m2.
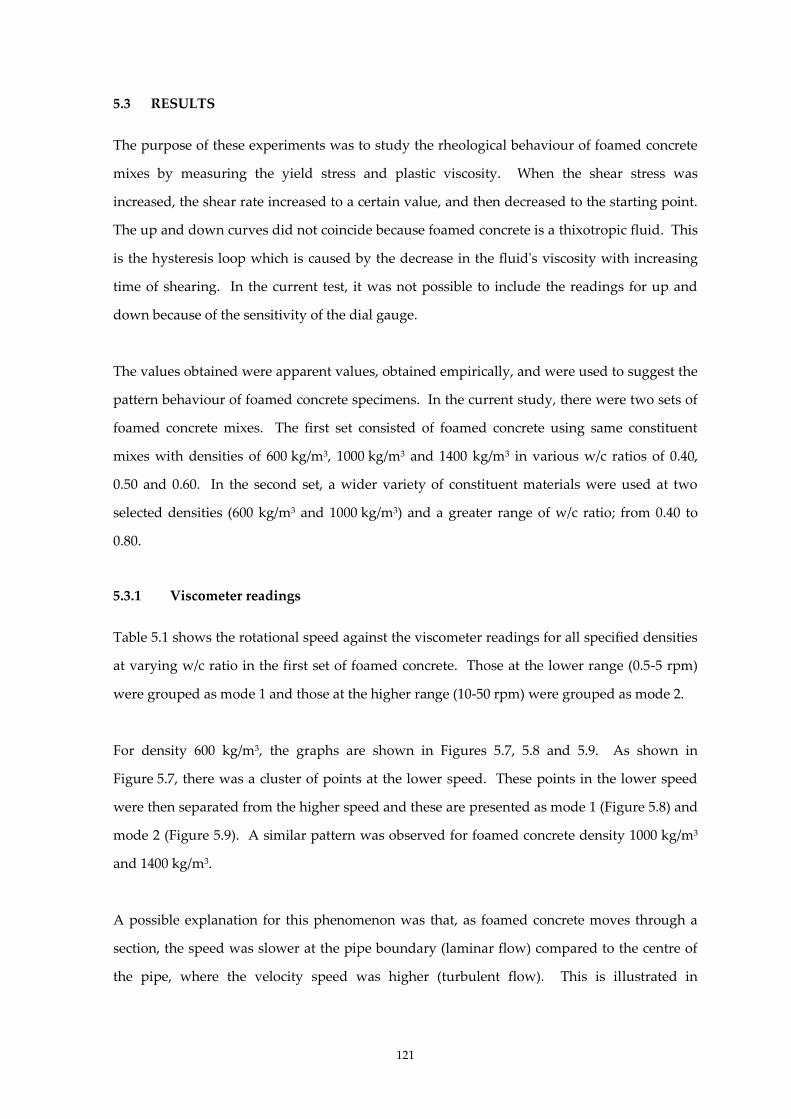
121
5.3 RESULTS
The purpose of these experiments was to study the rheological behaviour of foamed concrete
mixes by measuring the yield stress and plastic viscosity. When the shear stress was
increased, the shear rate increased to a certain value, and then decreased to the starting point.
The up and down curves did not coincide because foamed concrete is a thixotropic fluid. This
is the hysteresis loop which is caused by the decrease in the fluid's viscosity with increasing
time of shearing. In the current test, it was not possible to include the readings for up and
down because of the sensitivity of the dial gauge.
The values obtained were apparent values, obtained empirically, and were used to suggest the
pattern behaviour of foamed concrete specimens. In the current study, there were two sets of
foamed concrete mixes. The first set consisted of foamed concrete using same constituent
mixes with densities of 600 kg/m3, 1000 kg/m3 and 1400 kg/m3 in various w/c ratios of 0.40,
0.50 and 0.60. In the second set, a wider variety of constituent materials were used at two
selected densities (600 kg/m3 and 1000 kg/m3) and a greater range of w/c ratio; from 0.40 to
0.80.
5.3.1 Viscometer readings
Table 5.1 shows the rotational speed against the viscometer readings for all specified densities
at varying w/c ratio in the first set of foamed concrete. Those at the lower range (0.5-5 rpm)
were grouped as mode 1 and those at the higher range (10-50 rpm) were grouped as mode 2.
For density 600 kg/m3, the graphs are shown in Figures 5.7, 5.8 and 5.9. As shown in
Figure 5.7, there was a cluster of points at the lower speed. These points in the lower speed
were then separated from the higher speed and these are presented as mode 1 (Figure 5.8) and
mode 2 (Figure 5.9). A similar pattern was observed for foamed concrete density 1000 kg/m3
and 1400 kg/m3.
A possible explanation for this phenomenon was that, as foamed concrete moves through a
section, the speed was slower at the pipe boundary (laminar flow) compared to the centre of
the pipe, where the velocity speed was higher (turbulent flow). This is illustrated in
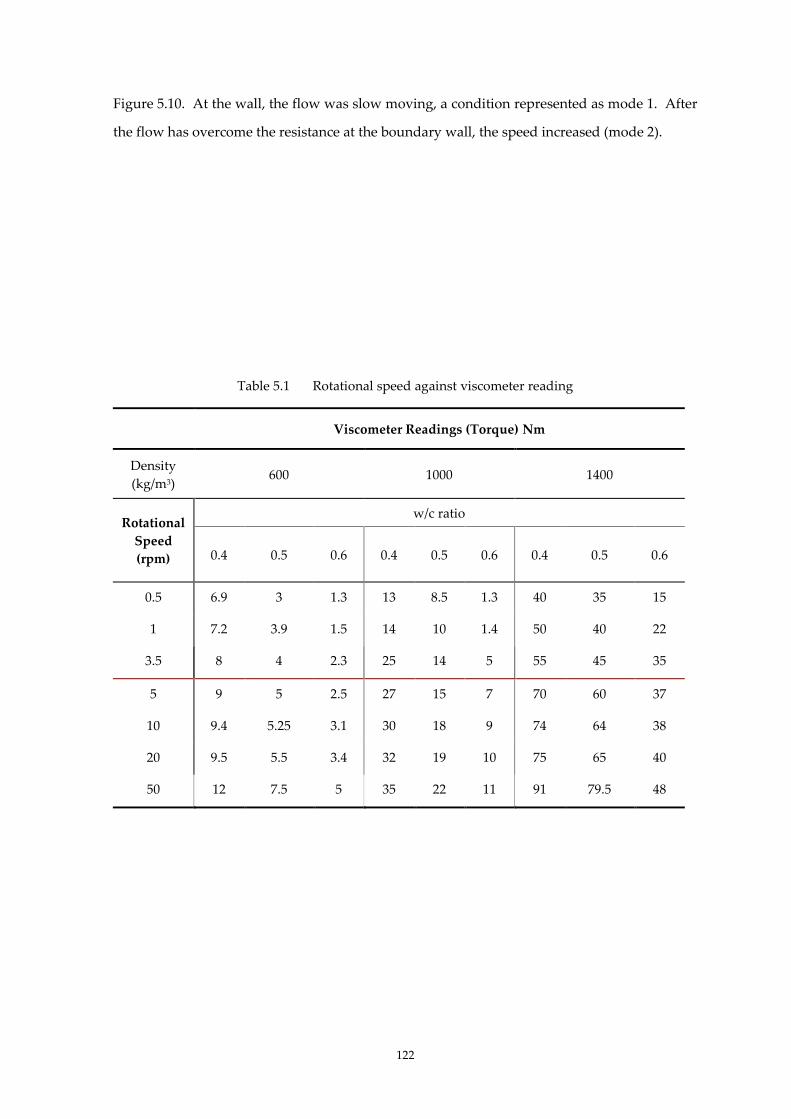
122
Figure 5.10. At the wall, the flow was slow moving, a condition represented as mode 1. After
the flow has overcome the resistance at the boundary wall, the speed increased (mode 2).
Table 5.1 Rotational speed against viscometer reading
Viscometer Readings (Torque) Nm
Density
(kg/m3) 600 1000 1400
Rotational
Speed
(rpm)
w/c ratio
0.4 0.5 0.6 0.4 0.5 0.6 0.4 0.5 0.6
0.5 6.9 3 1.3 13 8.5 1.3 40 35 15
1 7.2 3.9 1.5 14 10 1.4 50 40 22
3.5 8 4 2.3 25 14 5 55 45 35
5 9 5 2.5 27 15 7 70 60 37
10 9.4 5.25 3.1 30 18 9 74 64 38
20 9.5 5.5 3.4 32 19 10 75 65 40
50 12 7.5 5 35 22 11 91 79.5 48
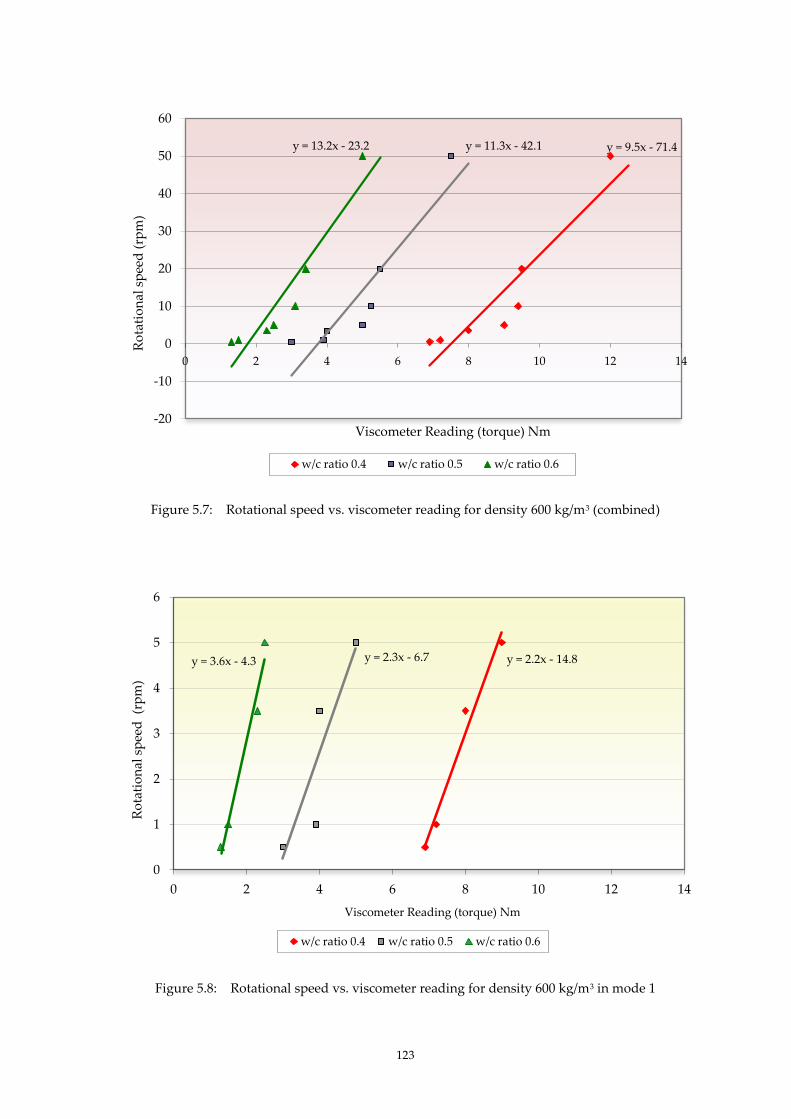
123
Figure 5.7: Rotational speed vs. viscometer reading for density 600 kg/m3 (combined)
Figure 5.8: Rotational speed vs. viscometer reading for density 600 kg/m3 in mode 1
y = 9.5x - 71.4 y = 11.3x - 42.1 y = 13.2x - 23.2
-20
-10
0
10
20
30
40
50
60
0 2 4 6 8 10 12 14
Ro
tati
on
al s
pee
d (
rpm
)
Viscometer Reading (torque) Nm
w/c ratio 0.4 w/c ratio 0.5 w/c ratio 0.6
y = 2.2x - 14.8 y = 2.3x - 6.7 y = 3.6x - 4.3
0
1
2
3
4
5
6
0 2 4 6 8 10 12 14
Ro
tati
on
al s
pee
d (
rpm
)
Viscometer Reading (torque) Nm
w/c ratio 0.4 w/c ratio 0.5 w/c ratio 0.6
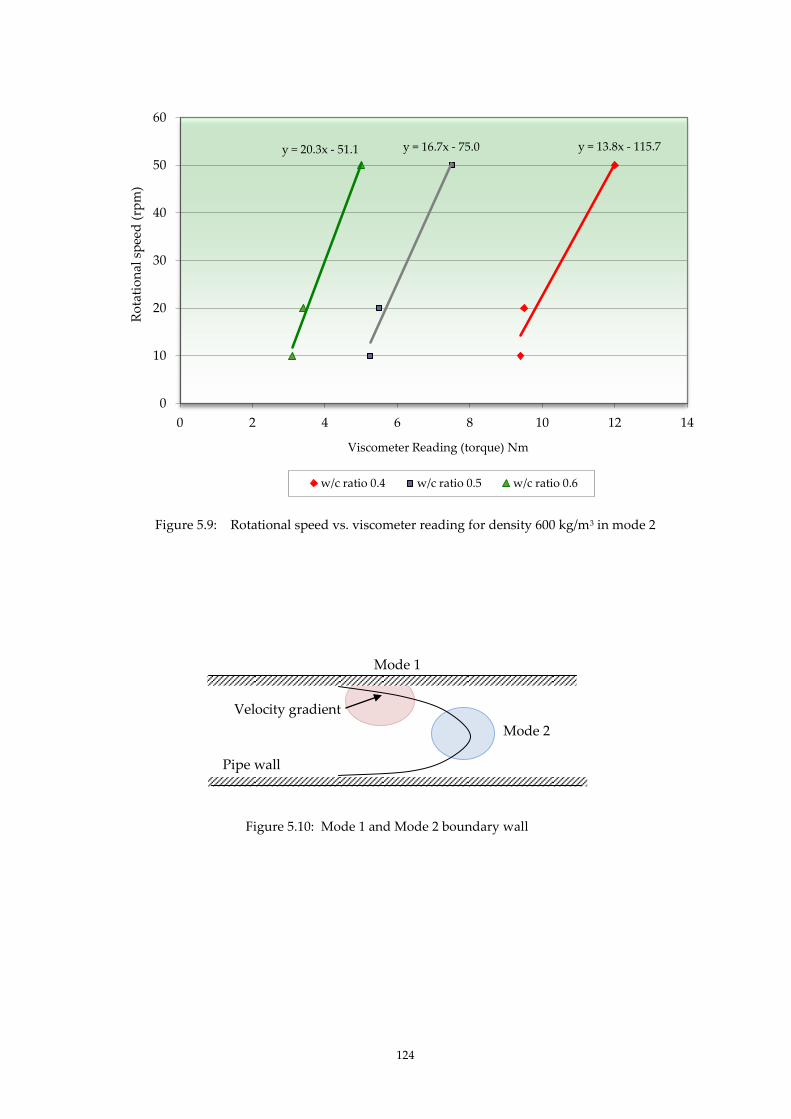
124
Figure 5.9: Rotational speed vs. viscometer reading for density 600 kg/m3 in mode 2
y = 13.8x - 115.7 y = 16.7x - 75.0 y = 20.3x - 51.1
0
10
20
30
40
50
60
0 2 4 6 8 10 12 14
Ro
tati
on
al s
pee
d (
rpm
)
Viscometer Reading (torque) Nm
w/c ratio 0.4 w/c ratio 0.5 w/c ratio 0.6
Figure 5.10: Mode 1 and Mode 2 boundary wall
Pipe wall
Velocity gradient
Mode 1
Mode 2
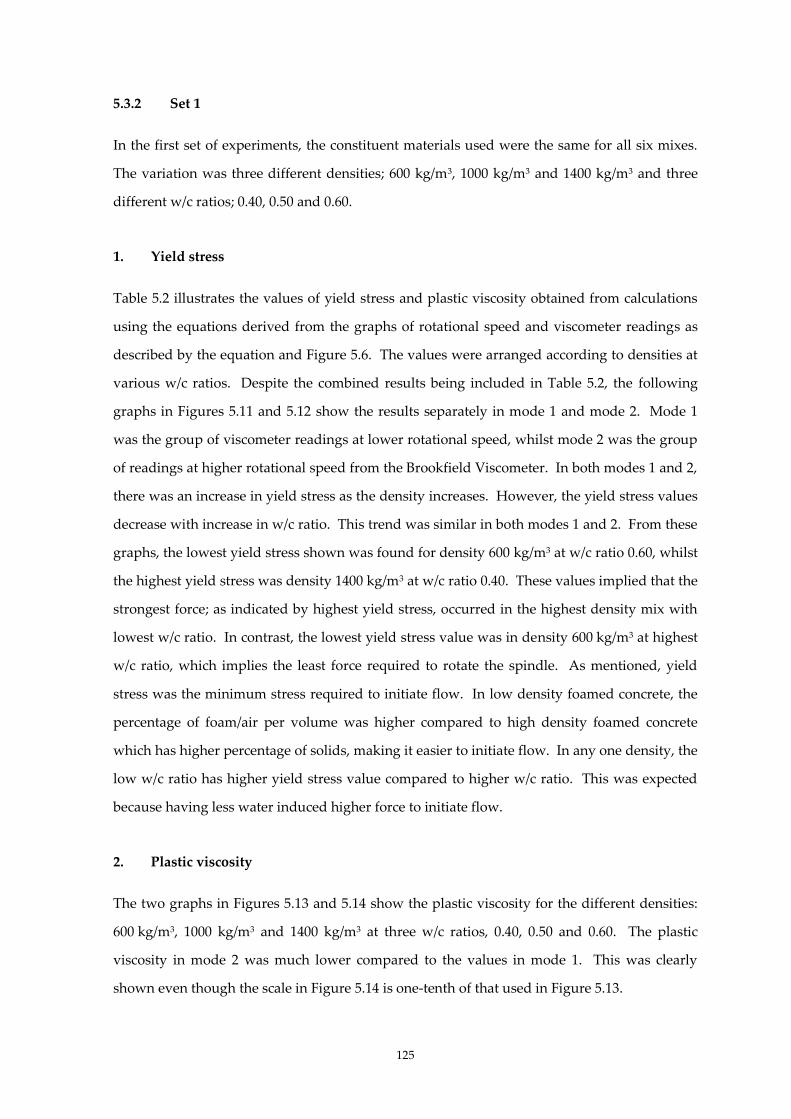
125
5.3.2 Set 1
In the first set of experiments, the constituent materials used were the same for all six mixes.
The variation was three different densities; 600 kg/m3, 1000 kg/m3 and 1400 kg/m3 and three
different w/c ratios; 0.40, 0.50 and 0.60.
1. Yield stress
Table 5.2 illustrates the values of yield stress and plastic viscosity obtained from calculations
using the equations derived from the graphs of rotational speed and viscometer readings as
described by the equation and Figure 5.6. The values were arranged according to densities at
various w/c ratios. Despite the combined results being included in Table 5.2, the following
graphs in Figures 5.11 and 5.12 show the results separately in mode 1 and mode 2. Mode 1
was the group of viscometer readings at lower rotational speed, whilst mode 2 was the group
of readings at higher rotational speed from the Brookfield Viscometer. In both modes 1 and 2,
there was an increase in yield stress as the density increases. However, the yield stress values
decrease with increase in w/c ratio. This trend was similar in both modes 1 and 2. From these
graphs, the lowest yield stress shown was found for density 600 kg/m3 at w/c ratio 0.60, whilst
the highest yield stress was density 1400 kg/m3 at w/c ratio 0.40. These values implied that the
strongest force; as indicated by highest yield stress, occurred in the highest density mix with
lowest w/c ratio. In contrast, the lowest yield stress value was in density 600 kg/m3 at highest
w/c ratio, which implies the least force required to rotate the spindle. As mentioned, yield
stress was the minimum stress required to initiate flow. In low density foamed concrete, the
percentage of foam/air per volume was higher compared to high density foamed concrete
which has higher percentage of solids, making it easier to initiate flow. In any one density, the
low w/c ratio has higher yield stress value compared to higher w/c ratio. This was expected
because having less water induced higher force to initiate flow.
2. Plastic viscosity
The two graphs in Figures 5.13 and 5.14 show the plastic viscosity for the different densities:
600 kg/m3, 1000 kg/m3 and 1400 kg/m3 at three w/c ratios, 0.40, 0.50 and 0.60. The plastic
viscosity in mode 2 was much lower compared to the values in mode 1. This was clearly
shown even though the scale in Figure 5.14 is one-tenth of that used in Figure 5.13.
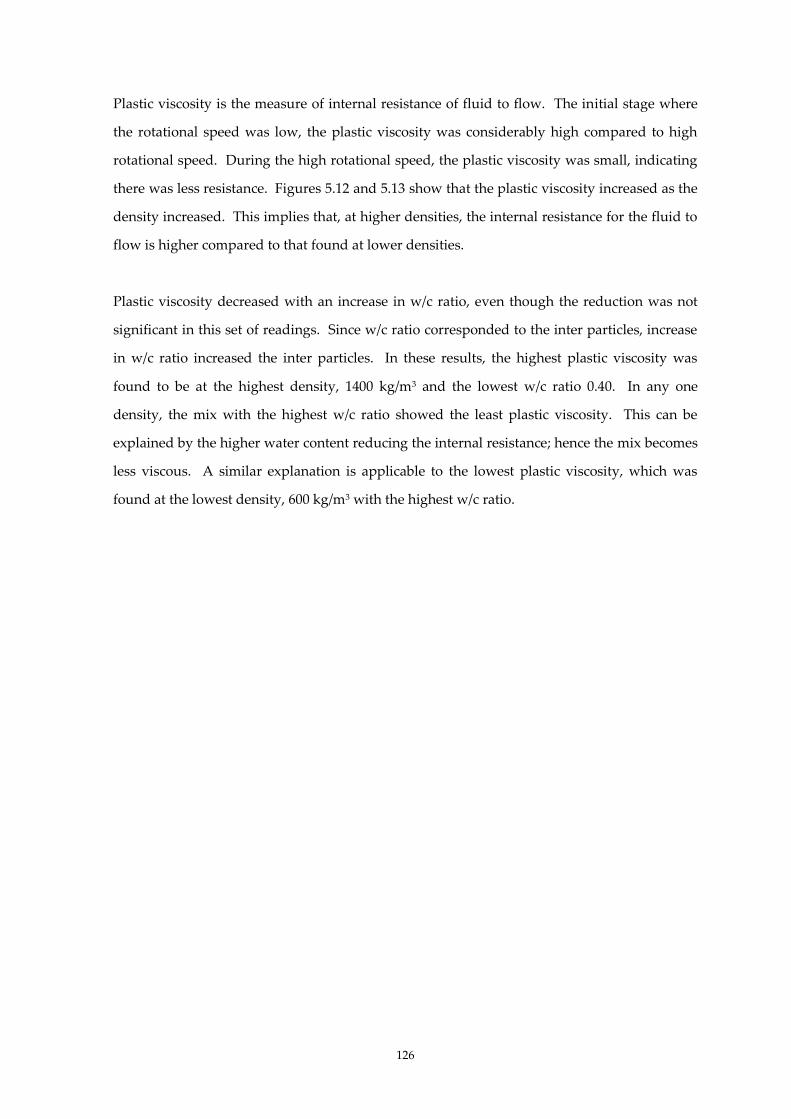
126
Plastic viscosity is the measure of internal resistance of fluid to flow. The initial stage where
the rotational speed was low, the plastic viscosity was considerably high compared to high
rotational speed. During the high rotational speed, the plastic viscosity was small, indicating
there was less resistance. Figures 5.12 and 5.13 show that the plastic viscosity increased as the
density increased. This implies that, at higher densities, the internal resistance for the fluid to
flow is higher compared to that found at lower densities.
Plastic viscosity decreased with an increase in w/c ratio, even though the reduction was not
significant in this set of readings. Since w/c ratio corresponded to the inter particles, increase
in w/c ratio increased the inter particles. In these results, the highest plastic viscosity was
found to be at the highest density, 1400 kg/m3 and the lowest w/c ratio 0.40. In any one
density, the mix with the highest w/c ratio showed the least plastic viscosity. This can be
explained by the higher water content reducing the internal resistance; hence the mix becomes
less viscous. A similar explanation is applicable to the lowest plastic viscosity, which was
found at the lowest density, 600 kg/m3 with the highest w/c ratio.

127
Table 5.2: Values of yield stress and plastic viscosity
Density (kg/m3) 600 1000 1400
w/c ratio 0.40 0.50 0.60 0.40 0.50 0.60 0.40 0.50 0.60
Yield stress (N/m2)
Mode 1 6.73 2.91 1.19 10.67 7.71 0.38 30.00 29.50 14.00
Mode 2 8.38 4.49 2.52 28.90 17.00 8.67 68.90 57.20 35.50
Combined 7.52 3.73 1.76 16.8 11.03 2.59 52.8 43.6 21.83
Plastic viscosity
(Ns/m2)
Mode 1 0.45 0.43 0.28 3.49 1.49 1.32 6.25 5.38 5.16
Mode 2 0.07 0.06 0.05 0.12 0.1 0.05 0.47 0.42 0.25
Combined 0.11 0.09 0.08 0.66 0.33 0.29 1.19 1.07 0.85

128
Figure 5.11: Yield stress values for different densities and w/c ratio in mode 1 (low rotational
speed).
Figure 5.12: Yield stress for different densities and w/c ratio in mode 2 (high rotational speed).
0
10
20
30
40
0.40 0.50 0.60
Yie
lds
Str
ess
(N/m
2 )
w/c ratio
600
1000
1400
Density (kg/m3)
MODE 1
0
10
20
30
40
50
60
70
80
0.4 0.5 0.6
Yie
ld s
tres
s (N
/m2 )
600
1000
1400
Density (kg/m3)
MODE 2
129
Figure 5.13: Plastic viscosity for different densities and w/c ratios in mode 1 (low rotational speed).
Figure 5.14: Plastic viscosity for different densities and w/c ratios in mode 2 (high rotational
speed).
0
2
4
6
8
10
0.40 0.50 0.60
600
1000
1400
Pla
stic
vis
cosi
ty (
Ns/
m2 )
MODE 1
Density (kg/m3)
w/c ratio
0.0
0.2
0.4
0.6
0.8
1.0
0.40 0.50 0.60
600
1000
1400
MODE 2
Pla
stic
vis
cosi
ty (
Ns/
m2 )
Density (kg/m3)
w/c ratio
130
5.3.4 Set 2
In the second set of experiments, there were five mixes that used different constituent
materials at various proportions which were mixed at density 600 kg/m3 with w/c ratios from
0.40 to 0.80. For density 1000 kg/m3, only three mixes were examined. The mix constituents
and proportions for mix 1, mix 2 and mix 3 for density 600 kg/m3 were identical to those of
mix 1, mix 2 and mix 3 for density 1000 kg/m3. Similar to the studies done in Set 1, the results
in this set of experiments are also threefold: the study of rheological properties, instability and
microstructure. The study of microstructure was illustrated in Chapter 6 and the results of
instability were discussed in Chapter 7.
1. Yield stress
Table 5.3 presents the values of yield stress and plastic viscosity for all the mixes. Using these
results, yield stress values of the mixes were plotted as shown in Figures 5.15 and 5.16. For
density 600 kg/m3, as shown in Figure 5.15, all five mixes show that yield stress decreased
with increase in w/c ratio increase, even though the difference was minimal for mix 2. The
highest yield stress value was for mix 3 at w/c ratio 0.40. This pattern was similar to that
observed in mixes with density 1000 kg/m3, as shown in Figure 5.16. However, at this density,
for mix 3 at lower w/c ratios 0.40 and 0.50, the readings were not available as the mixes were
too viscous such that the spindle did not rotate. Both graphs in Figure 5.15 and 5.16 show
that, in all mixes, the highest w/c ratio produced the lowest yield stress. This implies that
water content affects the behaviour of the foamed concrete mixes.
2. Plastic viscosity
Figures 5.17 and 5.18 show the plastic viscosity of the two different densities; 600 kg/m3 and
1000 kg/m3 respectively. The mix at w/c ratio 0.40 showed the highest plastic viscosity for all
mixes which suggests that low w/c ratio creates the highest internal resistance to flow, hence
high plastic viscosity values. Correspondingly, increase in w/c ratio increased the inter
particles, as shown in both graphs, where plastic viscosity decreased with increase in w/c
ratio.

131
Table 5.3: Yield stress and plastic viscosity
Density (kg/m3) 600 1000 600 1000
Mix w/c ratio Yield stress (N/m2) Plastic viscosity (Ns/m2)
MIX 1 : CEM I 42.5N + sand
1 0.40 14.6 42.6 0.58 0.34
2 0.50 9.70 39.5 0.36 0.21
3 0.60 6.80 23.4 0.23 0.25
4 0.70 3.30 6.80 0.18 0.14
5 0.80 3.30 4.20 0.15 0.08
MIX 2: CEM I 42.5N (70%) + FAf (30%) + sand
1 0.40 8.40 31.3 0.58 0.33
2 0.50 7.30 19.30 0.23 0.24
3 0.60 4.60 11.90 0.35 0.13
4 0.70 5.20 4.30 0.15 0.12
5 0.80 3.80 4.50 0.23 0.08
MIX 3 : CEM I 42.5N (80%) + Metakaolin (20%) + sand
1 0.40 50.5 N/A 3.03 N/A
2 0.50 15.30 N/A 0.60 N/A
3 0.60 10.0 19.40 0.45 0.28
4 0.70 7.10 14.70 0.46 0.18
5 0.80 4.70 3.40 0.29 0.09
MIX 4: CEM I 42.5N + sand (50%) + Coarse fly ash (50%)
1 0.40 38.1 N/A 1.33 N/A
2 0.50 9.70 N/A 0.34 N/A
3 0.60 5.90 N/A 0.83 N/A
4 0.70 4.60 N/A 0.35 N/A
5 0.80 4.20 N/A 0.15 N/A
MIX 5: CEM I 42.5N + Coarse fly ash
1 0.40 38.80 N/A 0.73 N/A
2 0.50 24.20 N/A 0.63 N/A
3 0.60 8.90 N/A 0.14 N/A
4 0.70 5.40 N/A 0.43 N/A
5 0.80 3.30 N/A 0.34 N/A
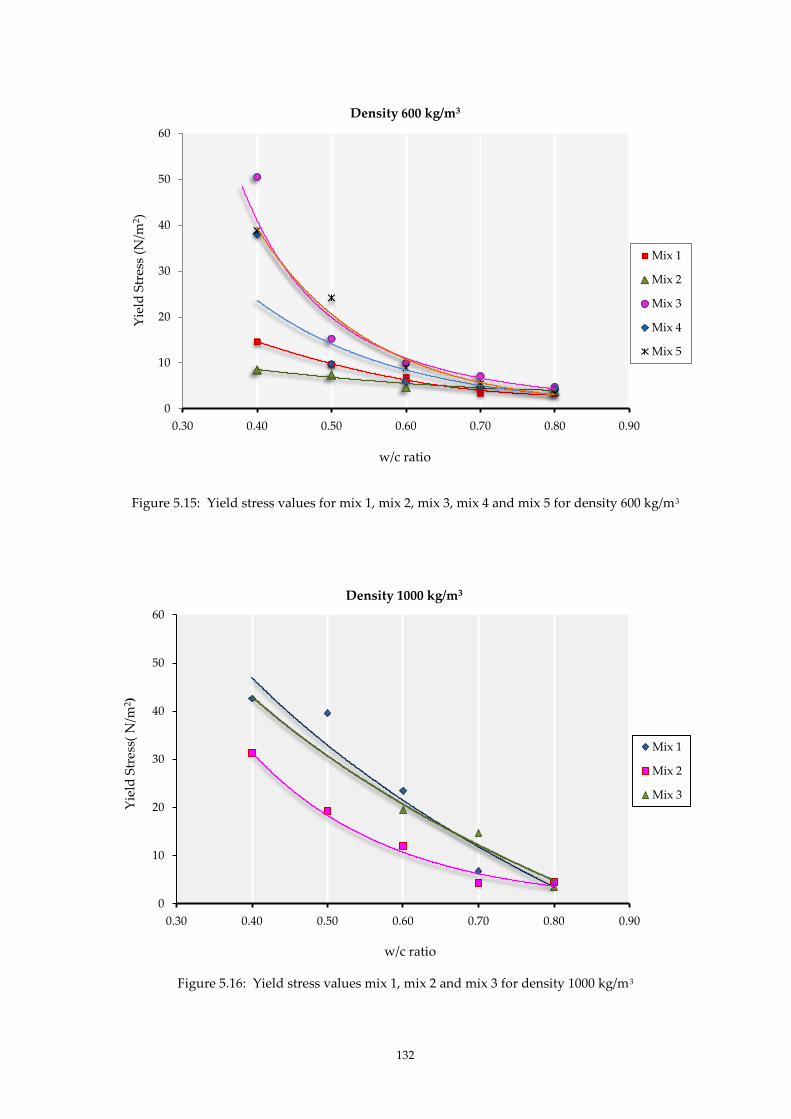
132
Figure 5.15: Yield stress values for mix 1, mix 2, mix 3, mix 4 and mix 5 for density 600 kg/m3
Figure 5.16: Yield stress values mix 1, mix 2 and mix 3 for density 1000 kg/m3
0
10
20
30
40
50
60
0.30 0.40 0.50 0.60 0.70 0.80 0.90
Density 600 kg/m3
Mix 1
Mix 2
Mix 3
Mix 4
Mix 5
Yie
ld S
tres
s (N
/m2 )
w/c ratio
0
10
20
30
40
50
60
0.30 0.40 0.50 0.60 0.70 0.80 0.90
Yie
ld S
tres
s( N
/m2 )
Mix 1
Mix 2
Mix 3
Density 1000 kg/m3
w/c ratio
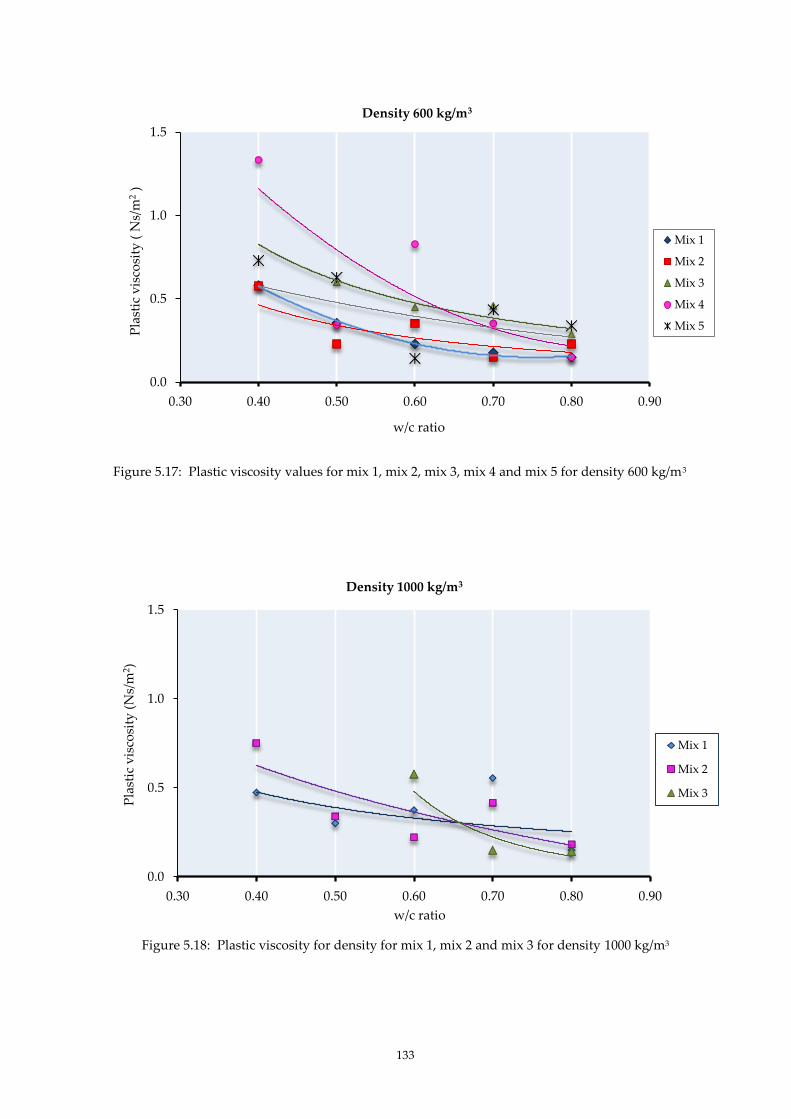
133
Figure 5.17: Plastic viscosity values for mix 1, mix 2, mix 3, mix 4 and mix 5 for density 600 kg/m3
Figure 5.18: Plastic viscosity for density for mix 1, mix 2 and mix 3 for density 1000 kg/m3
0.0
0.5
1.0
1.5
0.30 0.40 0.50 0.60 0.70 0.80 0.90
Density 600 kg/m3
Mix 1
Mix 2
Mix 3
Mix 4
Mix 5 Pla
stic
vis
cosi
ty (
Ns/
m2
)
w/c ratio
0.0
0.5
1.0
1.5
0.30 0.40 0.50 0.60 0.70 0.80 0.90
Pla
stic
vis
cosi
ty (
Ns/
m2 )
Density 1000 kg/m3
Mix 1
Mix 2
Mix 3
w/c ratio
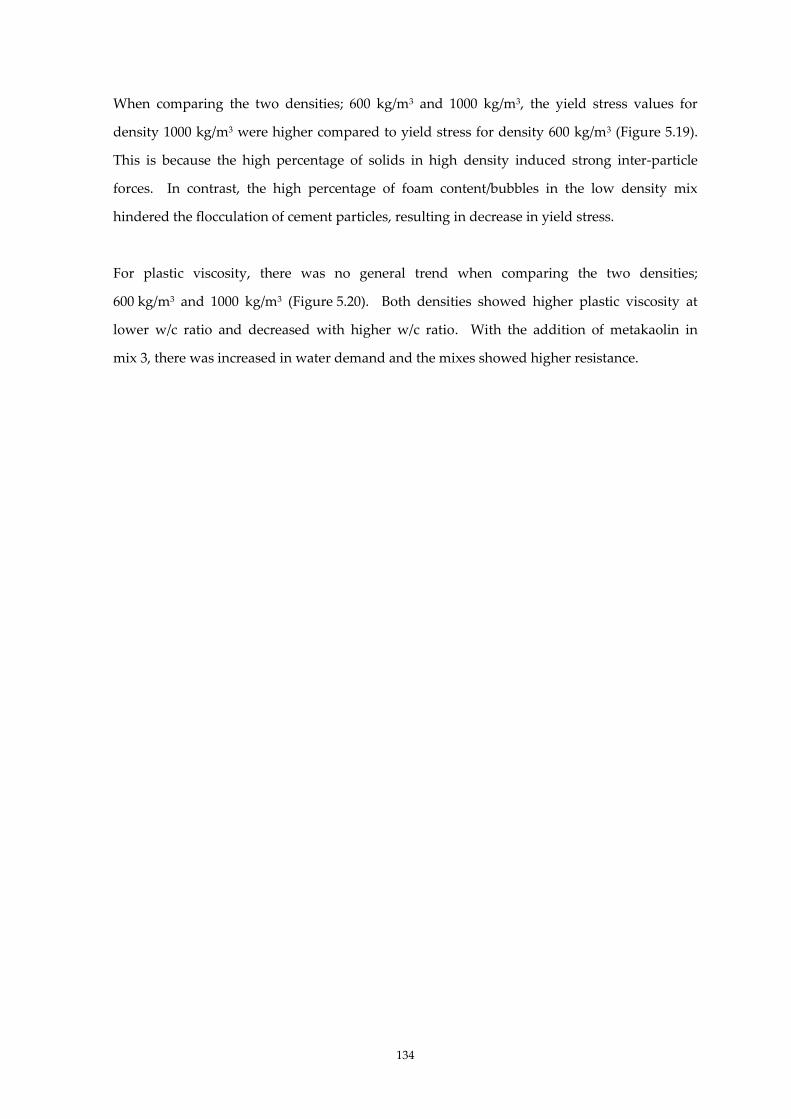
134
When comparing the two densities; 600 kg/m3 and 1000 kg/m3, the yield stress values for
density 1000 kg/m3 were higher compared to yield stress for density 600 kg/m3 (Figure 5.19).
This is because the high percentage of solids in high density induced strong inter-particle
forces. In contrast, the high percentage of foam content/bubbles in the low density mix
hindered the flocculation of cement particles, resulting in decrease in yield stress.
For plastic viscosity, there was no general trend when comparing the two densities;
600 kg/m3 and 1000 kg/m3 (Figure 5.20). Both densities showed higher plastic viscosity at
lower w/c ratio and decreased with higher w/c ratio. With the addition of metakaolin in
mix 3, there was increased in water demand and the mixes showed higher resistance.

135
Figure 5.19: Yield stress values for density 600 kg/m3 and 1000 kg/m3
Figure 5.20: Plastic viscosity for density 600 kg/m3 and 1000 kg/m3
0.0
10.0
20.0
30.0
40.0
50.0
0.30 0.40 0.50 0.60 0.70 0.80 0.90
Yie
ld s
tres
s (N
/m2 )
Mix 1 - 600
Mix 2 - 600
Mix 3 - 600
Mix 1 - 1000
Mix 2 - 1000
Mix 3 - 1000
w/c ratio
0.0
0.1
0.2
0.3
0.4
0.5
0.6
0.7
0.8
0.30 0.40 0.50 0.60 0.70 0.80 0.90
Pla
stic
vis
cosi
ty (
Ns/
m2 )
Mix 1 - 600
Mix 2 - 600
Mix 3 - 600
Mix 1 - 1000
Mix 2 - 1000
Mix 3 - 1000
w/c ratio

136
3. Fineness
In order to study the effect of fineness of cement and fillers, the values from Table 5.3 were
arranged to show the different degrees of cement fineness. Figure 5.21 shows the yield stress
values for mixes 1, 2 and 3 at density 600 kg/m3. When metakaolin replaced CEM I 42.5N at 20
per cent, the yield stress increased markedly. This pattern was not repeated at lower w/c ratio
for mix 2, where 30 per cent CEM I 42.5N was replaced with fine fly ash. Finer cements like
metakaolin and fine fly ash required more water. At fixed w/c ratio, water was absorbed by
the finer cements leaving less water for flow. This induced higher yield stress in the mixes.
At high w/c ratio, the difference in yield stress values between the mixes were small. The
variations indicate that although cement fineness has some effect, it was not a major factor
affecting the yield stress.
In the same manner, when coarse fly ash replaced sand, the overall yield stress increased,
albeit not significant. Figure 5.22 shows the yield stress values for mixes 1, 4 and 5 at density
600 kg/m3. This graph shows the different filler combinations: mix 4 and mix 5 show slightly
higher yield stress values compared to mix 1. Mix 4 has 50 per cent sand replaced with coarse
fly ash and mix 5 has 100 per cent coarse fly ash. Coarse fly ash is finer than sand. These
results suggest that finer fillers produced a higher yield stress although this may possibly be a
secondary effect.
The plastic viscosity values for mixes of differing cement fineness are illustrated in Figure 5.23.
Mix 3, where 20 per cent sand replaced with metakaolin shows the overall highest plastic
viscosity. All the mixes show high plastic viscosity at lower w/c ratio. At high w/c ratios, the
increase in plastic viscosity was not obvious, indicating that with sufficient water, the cement
fineness may be less significant.
Figure 5.24 shows plastic viscosity values for mixes with differing filler fineness. There is no
significant trend on the effect of filler fineness on plastic viscosity, although mix 5, having the
highest fineness, shows the highest plastic viscosity. The filler fineness and the shape of filler
particles possibly have some effect on the plastic viscosity but it is not a straight forward
comparison.

137
Figure 5.21: Effect of cement fineness on yield stress for density 600 kg/m3
Figure 5.22: Effect of filler fineness on yield stress for density 600 kg/m3
0.0
10.0
20.0
30.0
40.0
50.0
60.0
0.30 0.40 0.50 0.60 0.70 0.80 0.90
Yie
ld S
tres
s (N
/m2 )
Mix 1: CEM I (100%)
+ sand
Mix 2 : CEM I (70%) +
Faf (30%) + sand
Mix 3 : CEM I (80%) +
MK (20%) + sand
w/c ratio
Density 600 kg/m3
0.0
10.0
20.0
30.0
40.0
50.0
60.0
0.30 0.40 0.50 0.60 0.70 0.80 0.90
Yie
ld S
tres
s (N
/m2 )
Mix 1: CEM I + Sand
(100%)
Mix 4 : CEM I + sand
(50%) + FAc (50%)
Mix 5 : CEM I + FAc
(100%)
w/c ratio
Density 600 kg/m3
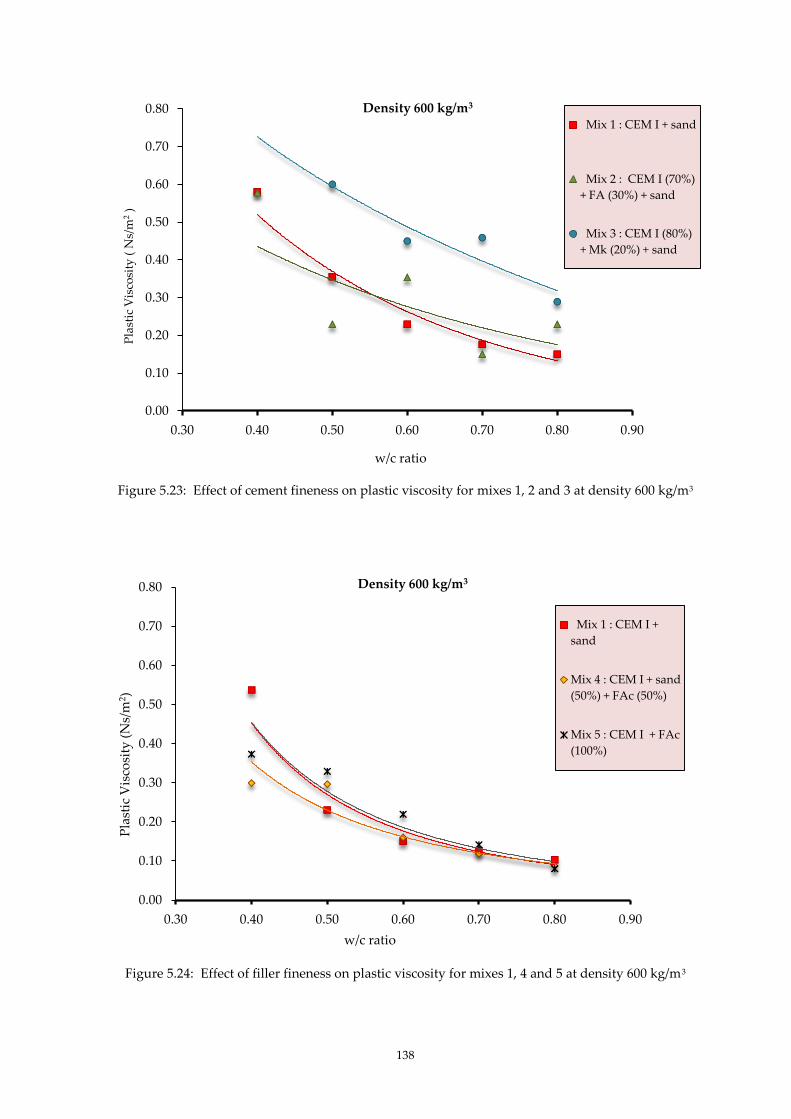
138
Figure 5.23: Effect of cement fineness on plastic viscosity for mixes 1, 2 and 3 at density 600 kg/m3
Figure 5.24: Effect of filler fineness on plastic viscosity for mixes 1, 4 and 5 at density 600 kg/m3
0.00
0.10
0.20
0.30
0.40
0.50
0.60
0.70
0.80
0.30 0.40 0.50 0.60 0.70 0.80 0.90
Pla
stic
Vis
cosi
ty (
Ns/
m2
) Mix 1 : CEM I + sand
Mix 2 : CEM I (70%)
+ FA (30%) + sand
Mix 3 : CEM I (80%)
+ Mk (20%) + sand
w/c ratio
Density 600 kg/m3
0.00
0.10
0.20
0.30
0.40
0.50
0.60
0.70
0.80
0.30 0.40 0.50 0.60 0.70 0.80 0.90
Pla
stic
Vis
cosi
ty (
Ns/
m2 )
Mix 1 : CEM I +
sand
Mix 4 : CEM I + sand
(50%) + FAc (50%)
Mix 5 : CEM I + FAc
(100%)
w/c ratio
Density 600 kg/m3
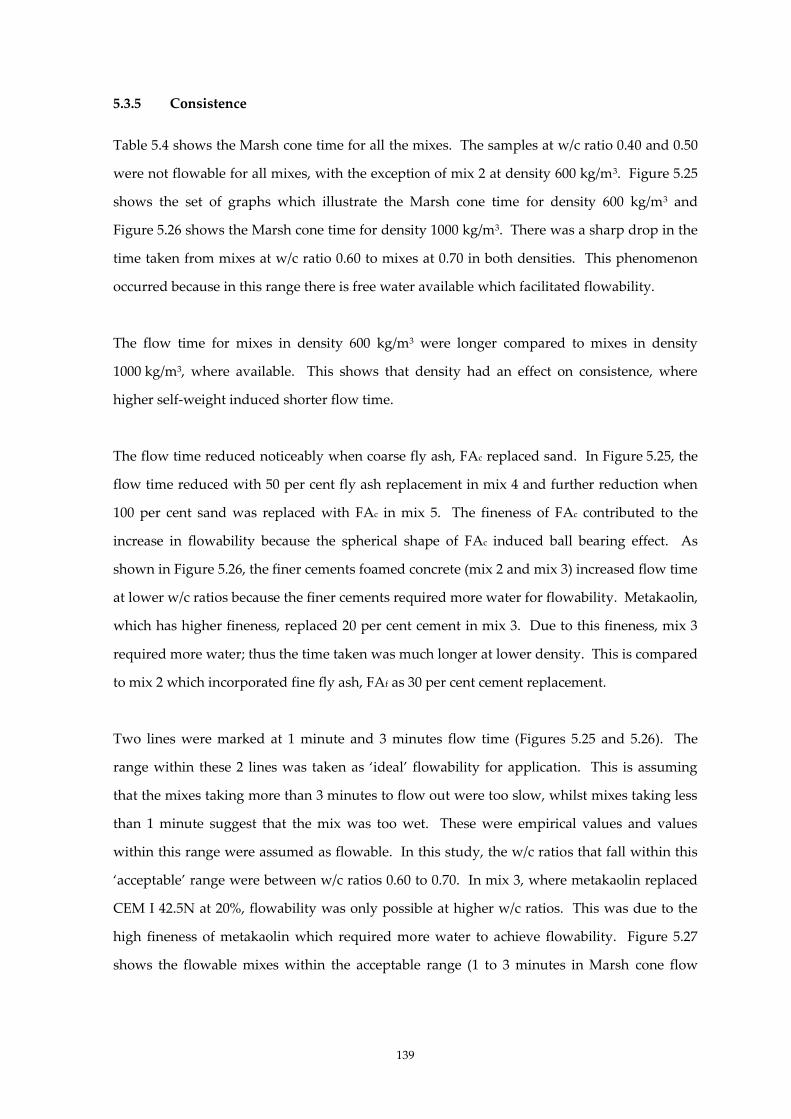
139
5.3.5 Consistence
Table 5.4 shows the Marsh cone time for all the mixes. The samples at w/c ratio 0.40 and 0.50
were not flowable for all mixes, with the exception of mix 2 at density 600 kg/m3. Figure 5.25
shows the set of graphs which illustrate the Marsh cone time for density 600 kg/m3 and
Figure 5.26 shows the Marsh cone time for density 1000 kg/m3. There was a sharp drop in the
time taken from mixes at w/c ratio 0.60 to mixes at 0.70 in both densities. This phenomenon
occurred because in this range there is free water available which facilitated flowability.
The flow time for mixes in density 600 kg/m3 were longer compared to mixes in density
1000 kg/m3, where available. This shows that density had an effect on consistence, where
higher self-weight induced shorter flow time.
The flow time reduced noticeably when coarse fly ash, FAc replaced sand. In Figure 5.25, the
flow time reduced with 50 per cent fly ash replacement in mix 4 and further reduction when
100 per cent sand was replaced with FAc in mix 5. The fineness of FAc contributed to the
increase in flowability because the spherical shape of FAc induced ball bearing effect. As
shown in Figure 5.26, the finer cements foamed concrete (mix 2 and mix 3) increased flow time
at lower w/c ratios because the finer cements required more water for flowability. Metakaolin,
which has higher fineness, replaced 20 per cent cement in mix 3. Due to this fineness, mix 3
required more water; thus the time taken was much longer at lower density. This is compared
to mix 2 which incorporated fine fly ash, FAf as 30 per cent cement replacement.
Two lines were marked at 1 minute and 3 minutes flow time (Figures 5.25 and 5.26). The
range within these 2 lines was taken as ‘ideal’ flowability for application. This is assuming
that the mixes taking more than 3 minutes to flow out were too slow, whilst mixes taking less
than 1 minute suggest that the mix was too wet. These were empirical values and values
within this range were assumed as flowable. In this study, the w/c ratios that fall within this
‘acceptable’ range were between w/c ratios 0.60 to 0.70. In mix 3, where metakaolin replaced
CEM I 42.5N at 20%, flowability was only possible at higher w/c ratios. This was due to the
high fineness of metakaolin which required more water to achieve flowability. Figure 5.27
shows the flowable mixes within the acceptable range (1 to 3 minutes in Marsh cone flow
140
time). The mixes were mostly at w/c ratio 0.65 and corresponding yield stress values for these
mixes between 6.0 to 8.5 N/m2.
For higher density 1000 kg/m3, only mixes 1, 2 and 3 were available for comparison. At lower
w/c ratios 0.40 and 0.50, all three mixes were not flowable. The only point that fitted in the
range of between 1 to 3 minutes was mix 3 at w/c ratio 0.7. This is in accord with hypothesis
for density 600 kg/m3, where w/c ratios between 0.60 to 0.70 present a good range for
flowability.
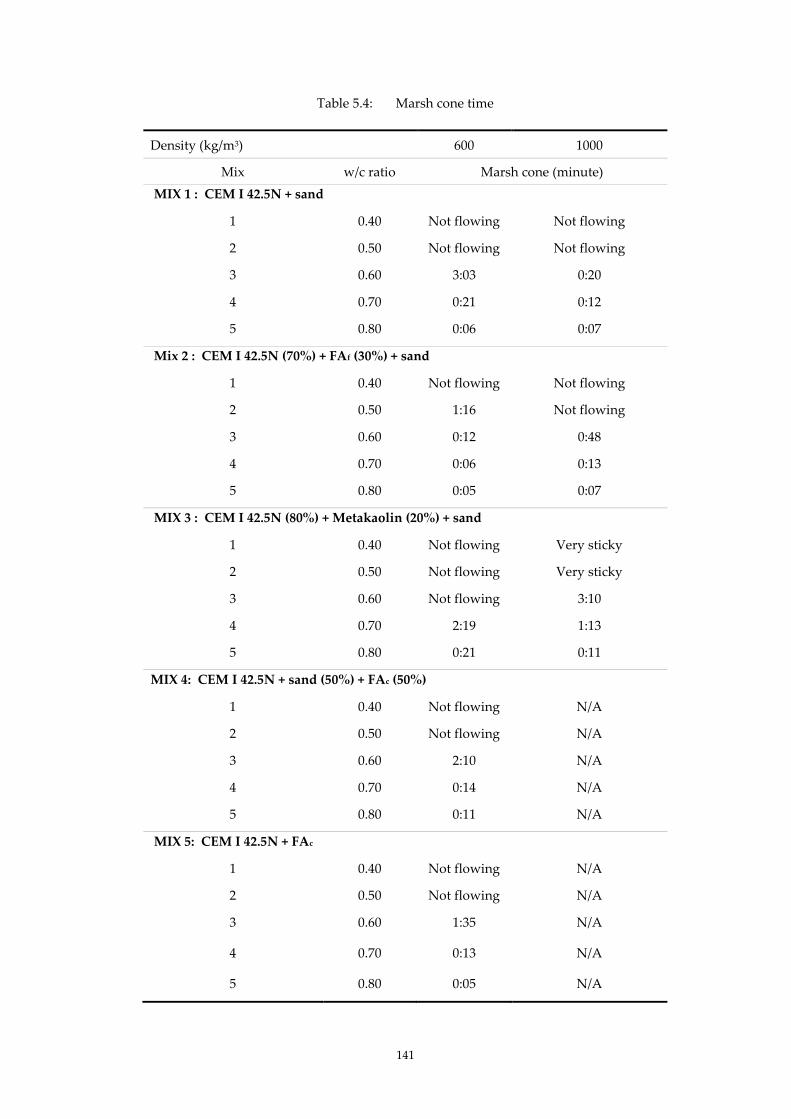
141
Table 5.4: Marsh cone time
Density (kg/m3) 600 1000
Mix w/c ratio Marsh cone (minute)
MIX 1 : CEM I 42.5N + sand
1 0.40 Not flowing Not flowing
2 0.50 Not flowing Not flowing
3 0.60 3:03 0:20
4 0.70 0:21 0:12
5 0.80 0:06 0:07
Mix 2 : CEM I 42.5N (70%) + FAf (30%) + sand
1 0.40 Not flowing Not flowing
2 0.50 1:16 Not flowing
3 0.60 0:12 0:48
4 0.70 0:06 0:13
5 0.80 0:05 0:07
MIX 3 : CEM I 42.5N (80%) + Metakaolin (20%) + sand
1 0.40 Not flowing Very sticky
2 0.50 Not flowing Very sticky
3 0.60 Not flowing 3:10
4 0.70 2:19 1:13
5 0.80 0:21 0:11
MIX 4: CEM I 42.5N + sand (50%) + FAc (50%)
1 0.40 Not flowing N/A
2 0.50 Not flowing N/A
3 0.60 2:10 N/A
4 0.70 0:14 N/A
5 0.80 0:11 N/A
MIX 5: CEM I 42.5N + FAc
1 0.40 Not flowing N/A
2 0.50 Not flowing N/A
3 0.60 1:35 N/A
4 0.70 0:13 N/A
5 0.80 0:05 N/A
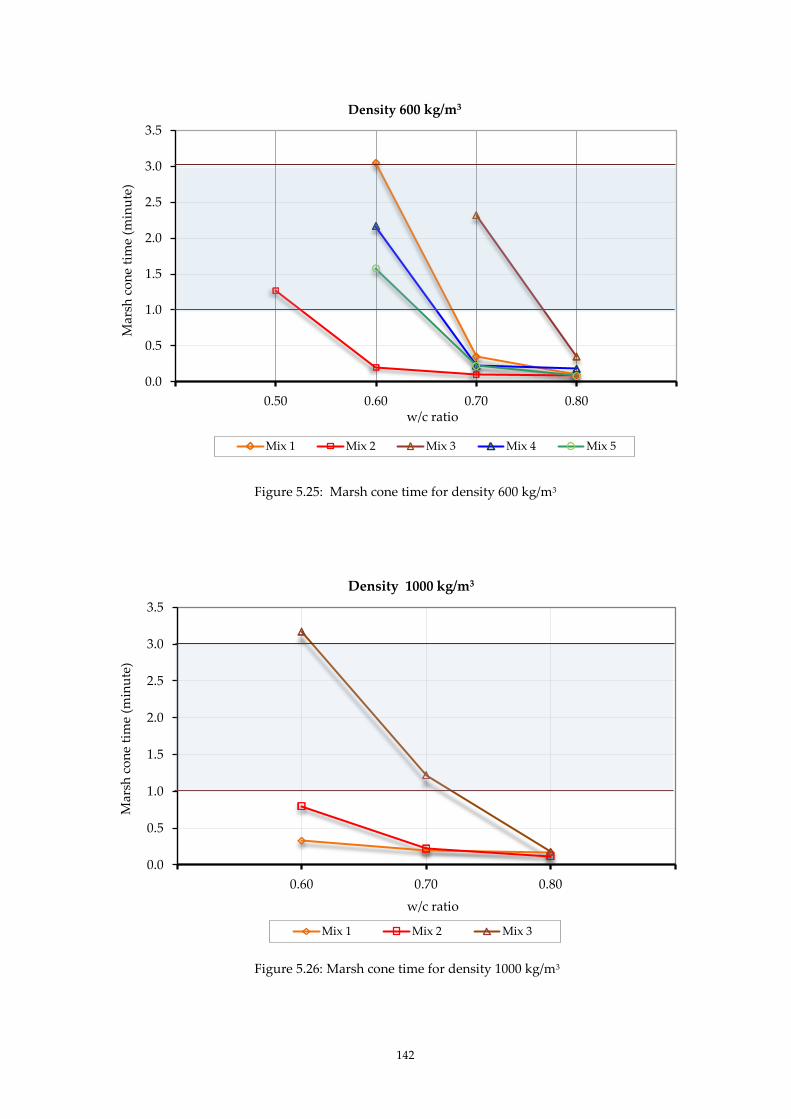
142
Figure 5.25: Marsh cone time for density 600 kg/m3
Figure 5.26: Marsh cone time for density 1000 kg/m3
0.0
0.5
1.0
1.5
2.0
2.5
3.0
3.5
0.50 0.60 0.70 0.80
Mar
sh c
on
e ti
me
(min
ute
)
w/c ratio
Density 600 kg/m3
Mix 1 Mix 2 Mix 3 Mix 4 Mix 5
0.0
0.5
1.0
1.5
2.0
2.5
3.0
3.5
0.60 0.70 0.80
Mar
sh c
on
e ti
me
(min
ute
)
w/c ratio
Density 1000 kg/m3
Mix 1 Mix 2 Mix 3

143
Figure 5.27: Yield stress values for flowable foamed concrete at density 600 kg/m3
0.0
1.0
2.0
3.0
4.0
5.0
6.0
7.0
8.0
9.0
10.0
Mix 1 Mix 2 Mix 3 Mix 4 Mix 5
Yie
ld S
tres
s (N
/m2 )
w/c 0.5
w/c 0.6
w/c 0.7
w/c 0.8
144
5.4 SUMMARY OF RESULTS
This chapter reports observations on the rheological properties of foamed concrete that were
found by establishing the values of yield stress, plastic viscosity and flow time of different
mixes. These values, obtained empirically, were used to study the effect of constituent
materials and their proportions. Density was the dominating factor in yield stress, plastic
viscosity and consistence of foamed concrete. The second controlling factor was w/c ratio.
Fineness and proportion of constituent materials affected the rheology of foamed concrete
although the effect was not as significant.
Significant outcomes arose from this phase of the study.
1. Yield stress increased with increase in density, a pattern observed in all mixes of
varying constituent materials.
2. Yield stress, by contrast, decreased with increase in w/c ratio.
3. Plastic viscosity increased when density increased and decreased with increase in w/c
ratio. However, this was not significant within a small range of variation; w/c 0.40 to
w/c 0.60. The decrease was significant in a larger variation; w/c 0.40 to w/c 0.80.
4. Yield stress values increased when the cementitious fineness was increased. This is
markedly evident at the higher w/c ratios. However plastic viscosity did not increase
for all mixes when the cement fineness was increased. Increase in filler fineness
increased the yield stress and plastic viscosity in general, although there were a few
mixes which did not observe this trend. Fineness in cements and fillers did not have
significant effect on rheological properties.
5. Density and w/c ratio affected the consistence of foamed concrete. Higher density
reduced the flow time. For a given density, a higher w/c ratio reduced the flow time.
6. Coarse fly ash increased flowability when replaced sand as filler.
7. Mixes within flowable time corresponded to mixes at w/c ratio in the range of 0.60 to
0.70. In this range, the yield stress values were between 6.0 N/m2 to 8.5 N/m2.
145
CHAPTER 6: BUBBLE MICROSTRUCTURE / AIR VOID SYSTEM
6.1 INTRODUCTION
Microstructure refers to the microscopic description of the individual constituents of a
material. The type, amount, size, shape and distribution phases present in the material
constitute its microstructure in a solid. Pore structure is a very important microstructural
characteristic in a porous solid because it influences the physical and mechanical behaviours
of porous material (Kalliopi, 2006). The physical structure of the products of hydration of
cement and their relative volumetric proportions affect the durability of hardened cement
paste to a greater extent than the chemical composition (Mehta, 2000).
Foamed concretes consist of air voids of approximately 0.1 to 1 mm in size, uniformly
distributed in a matrix of fillers and cements (Wee et al., 2006). Several researchers are in
accord on the paramount importance of adequate void system for the production of foamed
concrete (Kearsley 1999; Nambiar and Ramamurthy, 2000a; Aldridge, 2005; Hamidah et al.,
2005; and Nambiar and Ramamurthy, 2007a). Given that the air voids are separated and
coated with cement paste during mixing and placing, the skin of the air voids must be tough
and persistent in order to withstand these activities (Wee et al., 2006). On a microscopic scale,
the most important properties of foamed concrete are the air void shape, spacing factor and
size distribution (Nambiar and Ramamurthy, 2007). These properties are important, as they
are responsible for a tenfold change in compressive strength, rather than common w/c ratio
and aggregate-cement ratio found in conventional concretes (Beningfield, 2005).
In higher density foamed concretes, the spherical air voids are more distinct with even
distribution throughout the matrix and are more uniform in size compared to the lower
compressive strength foamed concretes (Nambiar and Ramamurthy, 2007). By contrast, in
foamed concrete at lower densities, where the foam volume is high, the bubbles merge and
produce larger voids. These larger voids have uneven openings and irregular air void
perimeters (Kearsley and Visagie, 1999).
The factors that govern this phenomenon in the lower density concretes are the subject of this
investigation because the stability of the foams is of paramount importance in foamed
concrete (Dransfield, 2000; Aldridge, 2000; Jones and McCarthy, 2006). Given that there are
146
many factors which influence the stability of the foam, this study also investigated other
parameters which affect the size, shapes and distribution of the air-voids. For the purpose of
this thesis, the terms 'voids' and 'bubbles' have been used interchangeably.
6.2 MATERIALS, EXPERIMENTAL PROGRAMMES AND METHODOLOGY
6.2.1 Introduction
The overall aim of this study was to investigate the microstructure of foamed concrete in
relation to varying densities, water/cement ratios (w/c ratio) and different combinations of
material constituents. The microstructure of all concrete is highly complex and
heterogeneous, which makes it difficult to characterise the pore structure (Kalliopi, 2006 and
Mehta, 2006). To date, there has been no standard method for the study of the microstructure
of foamed concrete. Several indirect methods have been used by other researchers including
Kalliopi (2006) based on the ASTM C457–Standard Test Method for the Microscopical
Determination of Parameters of the Air-Void System in Hardened Concrete. Kalliopi (2006)
used section analysis, which is a method used in stereology. This method requires rigorous
surface preparation which involves the specimens being ground and polished. High air
content concrete such as foamed concrete contains air voids which tend to coalesce and the
fragile thin walls between the voids can be damaged easily during grinding; this can impair
the accuracy of the measurements.
Kearsley and Visagie (1999) and Nambiar and Kunhanandan (2007a) adopted a method using
a high resolution camera and image analysis software. Taking cognisance of their work, the
current study adopted a similar approach to investigate the microstructure of foamed
concrete. The image analysis software employed was ‘ImageJ’.

147
6.2.2 Constituent Materials
1. Portland cement PC, CEM I 42.5N conforming to BS EN 197-1 was the main cement
employed in the study. In Set 3 study, CEM I 52.5R was employed.
2. ‘Fine’ fly ash (FAf) with a 45 m sieve retention of 7.5%, loss on ignition (LOI) of 5.0%
and conforming to BS EN 450.5 was used to replace CEM I 42.5N at 30% by mass
fraction.
3. Metakaolin used as replacement for cement to a level of 20% in the second study
(Set 2).
4. Calcium sulphoaluminate (CSA) was employed in the Set 3 study. CSA is a quick
setting and early strength cement, which is finer and lighter in colour compared to
CEM I 42.5N.
5. The main filler was natural sand, fine aggregate (conforming to BS EN 12620: 2002
with particles greater than 2.36 mm removed by sieving).
6. Coarse fly ash, FAc with a 45m sieve retention of 36.0% and conforming to BS 3892-2/
BS EN 450 and ASTM C 618-94a Class F was used as 50% and 100% replacement for
sand.
7. The surfactants used in this study were synthetic and protein-based surfactants which
were commercially available. For both surfactants, the dilution was 6% aqueous
solution which produced foamed to a density range of 40 - 50 kg/m3.
8. The mixing water used conformed to BS EN 1008 Mixing water for concrete. In this
study, the w/c ratio was varied from 0.40 to 0.80.
9. Wetting agent at 1% and 2% of cement weight was incorporated.
148
6.2.3 Experimental Programme
There were two main sets of experiments: Set 1 and Set 2 (Figure 6.1). In Set 1, a set of
consistent constituent materials were used - cement and filler types and two types of
surfactants. The variations were in their densities, w/c ratios and with addition of wetting
agents. The densities were 600 kg/m3, 1000 kg/m3 and 1400 kg/m3 and the w/c ratios were 0.40,
0.50 and 0.60. For Set 2, besides the range in the densities and w/c ratios, the variations
included the cement and filler types. Set 3 used different cement combinations. Contrary to
Set 1 and Set 2, where the main cement was CEM I 42.5N, the main cement in Set 3 was CSA.
In this set, the density was fixed at 300 kg/m3 and the variations were in the cement
combinations and varying w/c ratios. No fillers were included in this set, owing to the low
density.

149
Figure 6.1: Experimental Programme
SET 1
Different densities (kg/m3)
600 1000 1400
Different w/c ratios
0.40 0.50 0.60
Different surfactants
Protein Synthetic
Different densities (kg/m3)
600 1000
Different fillers
SET 2
Wetting agent
0.5% 1.0%
Different cements
CEM I
42.5N
Fine fly
ash 30%
Metakaolin
20%
Coarse fly
ash 30% Sand
Different w/c ratios
0.40 0.50 0.60 0.70 0.80
Coarse fly
ash 100% Vertical variation
Top
Bottom
SET 3
Different w/c ratios
0.450 0.50 0.60 0.65
Different cement combinations
FA: CSA CEM I 52.5R: CSA
40:60
50:50
60:40
50:50
60:40
70:30
80:20
90:10

150
6.2.4 Methodology
Based on the experimental programme, there were three parts to the study. Each set had its
own constants and variations of the constituent materials and their proportions. The study of
microstructure of foamed concrete was based on data obtained mainly from image processing
and image description, where appropriate.
6.2.4.1 Preparations of specimens
The foamed concrete was produced in the laboratory using a Hobart mixer. This mixer allows
small mixes to be produced and offers better control in speed at the convenience of managing
the mixing time. The base mix was first produced by mixing sand (or FAc), cements and water
until a uniform consistency was achieved. Then the preformed foam was added to the base
mix and the mixing continued until all the foams were uniformly incorporated and
distributed. Next, the plastic density was measured in accordance with BS EN 12350-611 by
weighing a foamed concrete sample in a pre-weighed container of a known volume. A
tolerance on plastic density was set at ± 50 kg/m3 of the target value as being acceptable.
The specimens were then cast in cylinder moulds lined with domestic plastic ‘cling’ film to
avoid the foamed concrete from adhering strongly to the mould surface. The cylinder heights
varied from 300 mm to 500 mm. The heights were randomly selected to observe the
distribution of bubbles throughout the differing heights and to study the amount of drop in
level which is used as indicator for instability. These readings were used in the study of
instability which is covered in Chapter 7.
After 24 hours, the foamed concrete was de-moulded and the specimens were sealed-cured by
wrapping in ‘cling’ film to avoid direct exposure to wind and, hence, decrease evaporation
(Figure 6.2). They were stored at 200C until testing.
151
6.2.4.2 Surface Preparations
The preparations of the specimens depended upon the densities. They were spilt
longitudinally, which produced two long specimens (Figure 6.3). The specimens from lower
densities of foamed concrete were cut off using a metal saw, whilst the higher densities were
split by employing a splitting machine (Figure 6.4). From the longitudinal specimens, the
length of the cylinder was ‘divided’ into four sections which enabled the study of
microstructure in relation to their position the top and bottom section, as shown in Figure 6.3.
The specimens were of varying depths, but the most important aspect was that the surface
was level. The specimens were cleaned with compressed air to remove loose deposits from
the effects of splitting. The conventional surface preparation method of filling pores with a
synthetic resin and smoothing by grinding was not suitable for foamed concrete. This process
may disrupt accuracy by disturbing the thin walls and induces cracks during the grinding and
polishing operations. Only foam concrete specimens with an excellent quality surface are
subjected to image analysis measurement.

152
Figure 6.2: Foamed concrete specimen wrapped in 'cling' film
Figure 6.3: Cylinder specimen split in half longitudinally
Total height /
length of cylinder Top
Bottom

153
Figure 6.4: Splitting machine
Figure 6.5: High magnification SLR camera mounted on tripod
Specimens
Adjustable
lights
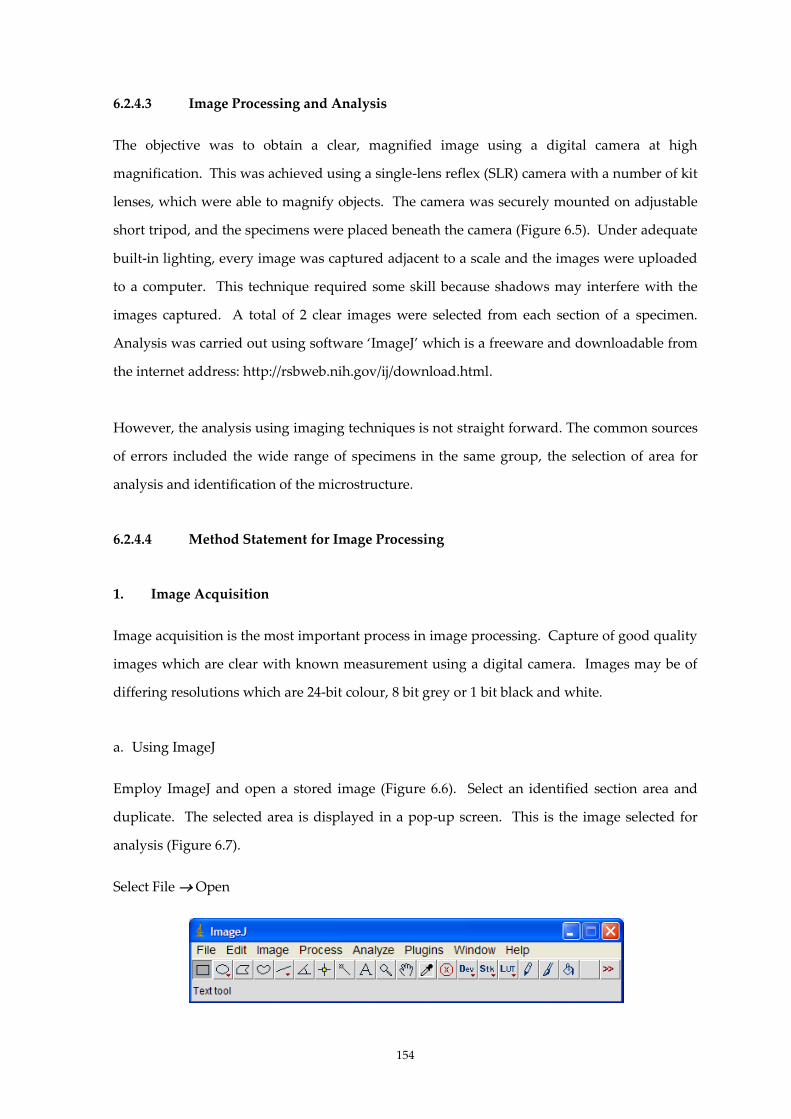
154
6.2.4.3 Image Processing and Analysis
The objective was to obtain a clear, magnified image using a digital camera at high
magnification. This was achieved using a single-lens reflex (SLR) camera with a number of kit
lenses, which were able to magnify objects. The camera was securely mounted on adjustable
short tripod, and the specimens were placed beneath the camera (Figure 6.5). Under adequate
built-in lighting, every image was captured adjacent to a scale and the images were uploaded
to a computer. This technique required some skill because shadows may interfere with the
images captured. A total of 2 clear images were selected from each section of a specimen.
Analysis was carried out using software ‘ImageJ’ which is a freeware and downloadable from
the internet address: http://rsbweb.nih.gov/ij/download.html.
However, the analysis using imaging techniques is not straight forward. The common sources
of errors included the wide range of specimens in the same group, the selection of area for
analysis and identification of the microstructure.
6.2.4.4 Method Statement for Image Processing
1. Image Acquisition
Image acquisition is the most important process in image processing. Capture of good quality
images which are clear with known measurement using a digital camera. Images may be of
differing resolutions which are 24-bit colour, 8 bit grey or 1 bit black and white.
a. Using ImageJ
Employ ImageJ and open a stored image (Figure 6.6). Select an identified section area and
duplicate. The selected area is displayed in a pop-up screen. This is the image selected for
analysis (Figure 6.7).
Select File Open

155
b. Calibration and validation
Draw a line over the scale bar and select Analyse Set Scale
Select Analyse Set Scale
i. In the Set Scale window enter the 'Known Distance' box.
ii. Set the 'Unit of Measurement'
2. Image Processing
These are adjustments made to the image prior to analysis. This step involves adjustments
which alter the brightness and contrast or remove dust and scratches from the image.
a. Convert the image to grayscale (Figure 6.8)
Image Type 8-bit
b. Adjust the brightness
Image Adjust Brightness and Contrast
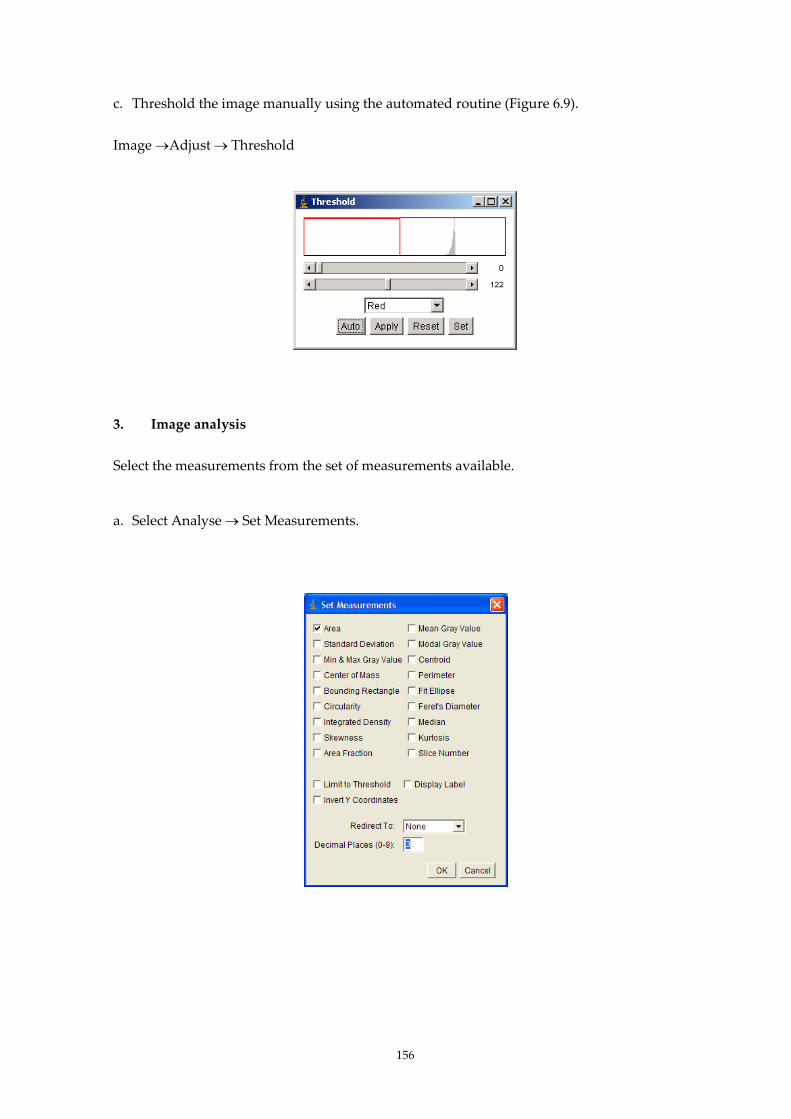
156
c. Threshold the image manually using the automated routine (Figure 6.9).
Image Adjust Threshold
3. Image analysis
Select the measurements from the set of measurements available.
a. Select Analyse Set Measurements.
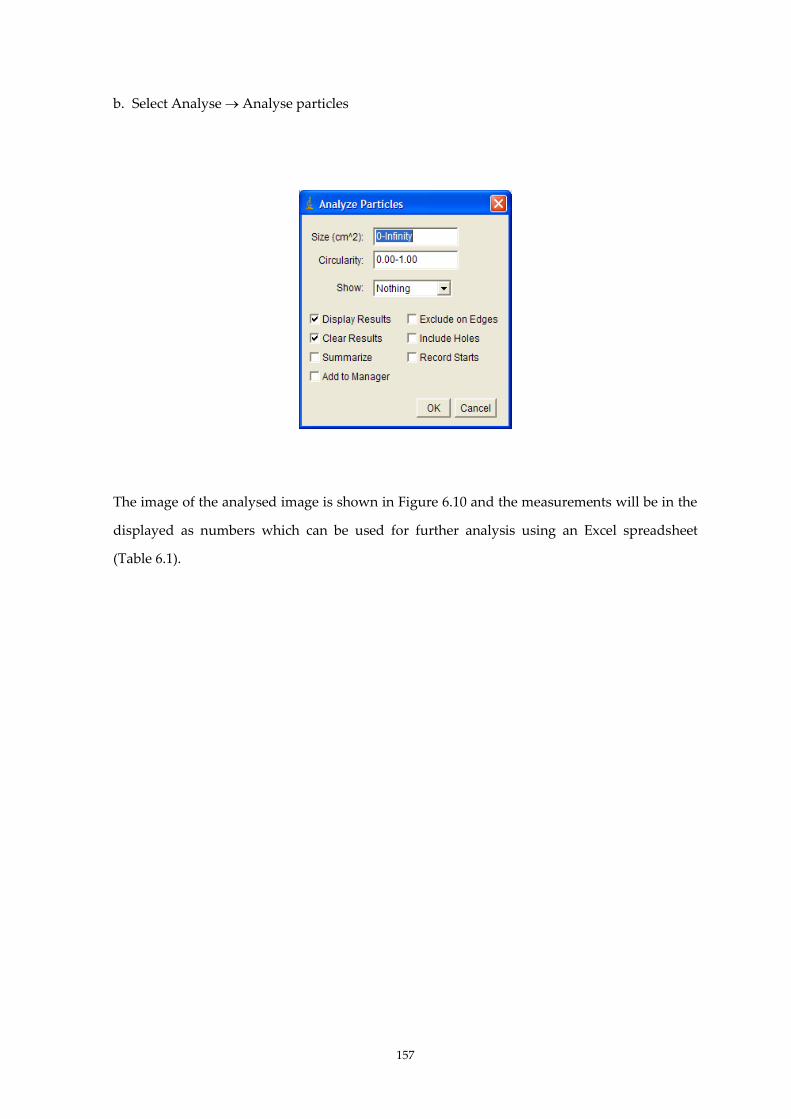
157
b. Select Analyse Analyse particles
The image of the analysed image is shown in Figure 6.10 and the measurements will be in the
displayed as numbers which can be used for further analysis using an Excel spreadsheet
(Table 6.1).

158
Figure 6.6: Image of a foamed concrete sample
Figure 6.7: Selected area to measure in 64 bit colour

159
Figure 6.8: Image converted to grayscale
Figure 6.9: Image after brightness and threshold adjusted

160
Figure 6.10: Processed image with outlines
Table 6.1: Measurements saved in Excel file
Area
(mm2)
X
(mm)
Y
(mm)
Perimeter
(mm)
1 0.498 0.417 0.385 3.957
2 0.076 1.035 0.088 1.297
3 0.01 1.87 0.05 0.457
4 5.48E-04 2.02 0.007 0.092
5 0.026 2.365 0.057 0.689
6 0.003 4.193 0.03 0.196
7 0.402 4.966 0.497 5.167
8 0.217 6.502 0.164 2.283
9 9.13E-04 4.42 0.058 0.103
10 1.312 6.077 0.797 5.289
11 3.65E-04 1.527 0.142 0.065
12 0.001 2.503 0.204 0.134
0 5 mm
X
Y
6.7 mm

161
6.3 RESULTS
The purpose of the current study was to investigate the microstructure of the foamed concrete
mixes of varying densities, w/c ratios, different materials constituents and combinations. The
empirical values which illustrate these findings were linked to other properties for an in-depth
study to achieve a better understanding of the behaviour of foamed concrete. There are
possible errors in this imaging technique; the largest source of error may come from selecting
the small sample which represents the characteristics of the specimen.
As previously mentioned, the terms 'voids' and 'bubbles' have been used interchangeably.
Air-voids depict large, undefined and generally the inclusions in the concrete matrix not
deliberate. The term bubbles are used more frequent in foamed concrete which described the
features which are small and spherical; and produced from preformed foam which was
intentionally included.
There were three sets of experiments. In the first set of experiments, the mixes studied
employed the same constituent materials at three different densities: 600 kg/m3, 1000 kg/m3
and 1400 kg/m3. Three different w/c ratios were investigated at each density, 0.40, 0.50 and
0.60. The characteristic of bubbles using synthetic surfactant was also investigated, along with
the addition of wetting agent, a chemical additive. In the second set of experiments, different
constituents were used at two different densities, 600 kg/m3 and 1000 kg/m3 at varying w/c
ratios. The third experiment studied foamed concrete mixes at low density 300 kg/m3. This
set employed different cement combinations; the main cement was calcium sulphoaluminate,
CSA. The results obtained were computed as analysed by the software ImageJ. All the
measured area from the specimen was approximately 5 mm x 6.7 mm. The descriptions of the
results are shown in Figure 6.11. The diameter in the results corresponds to the average
diameter, unless otherwise stated. However, there were some samples where analyses by
ImageJ were not possible due to its nature of fineness and some inconsistencies. For these
mixes, descriptive explanation was clearer.

162
6.3.1 Set 1
Table 2 shows the results of specimens from Set 1. These results were used in Figures 6.12 and
6.13 which showed the bubble counts and bubble diameter for the selected densities at
varying w/c ratios respectively. From Figure 6.12, it can be noted that there was an increase in
bubble count with increase in density. However, the bubble count decreased with increase in
w/c ratio. In Figure 6.13, the (mean) diameter decreased with increase in density. For each
density, the diameter reduced with decreased in w/c ratio. However, in any density, the
variation in bubble diameter is not clearly defined, which accounts for the small variation in
Figure 6.13. Increase in density is related to increase in solids for the same volume. The
higher volume of solids reduced the spaces which allowed the bubbles to increase in size and
amalgamate to the bigger sizes, hence small bubble diameter was observed.

163
Figure 6.11: Description used in microstructure in a foamed concrete specimen
Bubble diameter mm)
Measured area
5 mm x 6.7 mm
1 mm
1 2
Bubble
counts
Bubble
walls

164
Table 6.2: Bubble details for all densities and w/c ratio for measured area
Bubble
Counts
Average
Area (mm2)
Average
Diameter
(mm)
Density 600 kg/m3
0.40 196 0.14 0.41
w/c ratio 0.50 177 0.14 0.43
0.60 146 0.17 0.47
Density 1000 kg/m3
0.40 517 0.04 0.23
w/c ratio 0.50 339 0.06 0.28
0.60 276 0.09 0.33
Density 1400 kg/m3
0.40 820 0.02 0.16
w/c ratio 0.50 663 0.03 0.18
0.60 523 0.04 0.21

165
Figure 6.12: Bubbles count for different densities
Figure 6.13: Diameter of bubbles for different densities
0
200
400
600
800
1000
600 1000 1400
Bu
bb
les
co
un
t
Density (kg/m3)
0.4
0.5
0.6
w/c ratio
0.0
0.1
0.2
0.3
0.4
0.5
600 1000 1400
Bu
bb
le d
iam
eter
(m
m)
Density (kg/m3)
0.4
0.5
0.6
w/c ratio
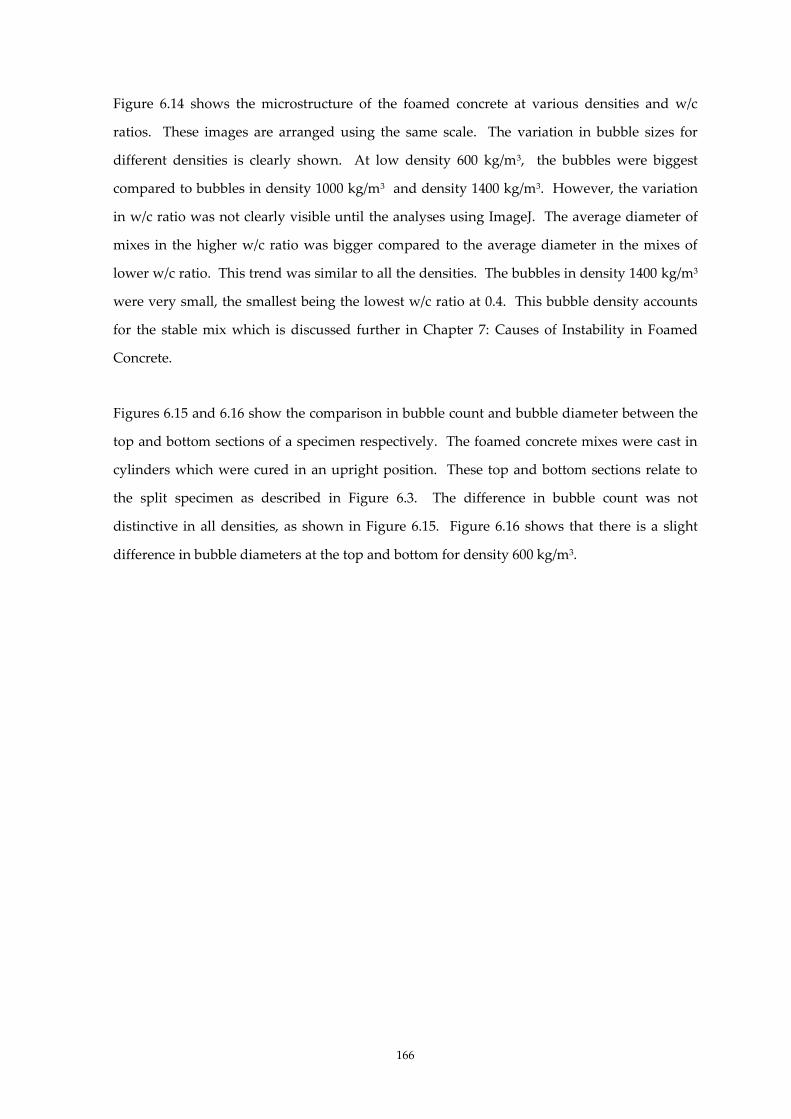
166
Figure 6.14 shows the microstructure of the foamed concrete at various densities and w/c
ratios. These images are arranged using the same scale. The variation in bubble sizes for
different densities is clearly shown. At low density 600 kg/m3, the bubbles were biggest
compared to bubbles in density 1000 kg/m3 and density 1400 kg/m3. However, the variation
in w/c ratio was not clearly visible until the analyses using ImageJ. The average diameter of
mixes in the higher w/c ratio was bigger compared to the average diameter in the mixes of
lower w/c ratio. This trend was similar to all the densities. The bubbles in density 1400 kg/m3
were very small, the smallest being the lowest w/c ratio at 0.4. This bubble density accounts
for the stable mix which is discussed further in Chapter 7: Causes of Instability in Foamed
Concrete.
Figures 6.15 and 6.16 show the comparison in bubble count and bubble diameter between the
top and bottom sections of a specimen respectively. The foamed concrete mixes were cast in
cylinders which were cured in an upright position. These top and bottom sections relate to
the split specimen as described in Figure 6.3. The difference in bubble count was not
distinctive in all densities, as shown in Figure 6.15. Figure 6.16 shows that there is a slight
difference in bubble diameters at the top and bottom for density 600 kg/m3.

167
Scale: each unit = 1 mm
Figure 6.14: Foamed concrete bubbles of different densities and w/c ratio
w/c 0.40
w/c 0.40
w/c 0.50
w/c 0.50
w/c 0.50
w/c 0.60
w/c 0.60
w/c 0.60
Density 600 kg/m3
Density 1000 kg/m3
Density 1400 kg/m3
w/c 0.40
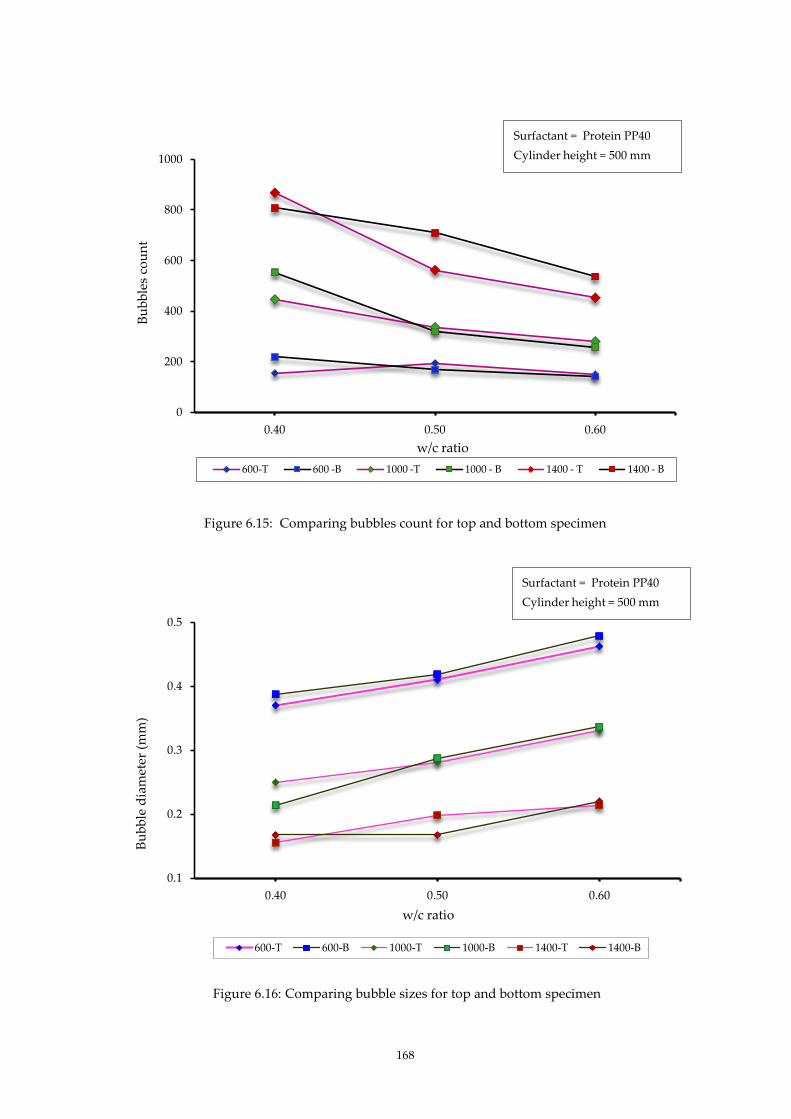
168
Figure 6.15: Comparing bubbles count for top and bottom specimen
Figure 6.16: Comparing bubble sizes for top and bottom specimen
0
200
400
600
800
1000
0.40 0.50 0.60
600-T 600 -B 1000 -T 1000 - B 1400 - T 1400 - B
Bu
bb
les
cou
nt
w/c ratio
Surfactant = Protein PP40
Cylinder height = 500 mm
0.1
0.2
0.3
0.4
0.5
0.40 0.50 0.60
Bu
bb
le d
iam
eter
(m
m)
w/c ratio
600-T 600-B 1000-T 1000-B 1400-T 1400-B
Surfactant = Protein PP40
Cylinder height = 500 mm

169
Two types of surfactants which are commonly used in the production of foamed concrete are
protein-based and synthetic-based surfactants. Protein surfactant produced closed cell, stable
and stronger textured bubbles which resulted in foamed concrete of higher strength
(Dransfield, 2000; McGovern, 2000). In contrast, the synthetic surfactant produced larger size
bubbles which have cells that are more open and this resulted in foamed concrete of lower
strengths compared to protein-based surfactants (Dransfield, 2000; Highways Agency and
TRL, 2001). Based on these statements, experiments were made for comparison between
protein and synthetic surfactants.
Figures 6.17 and 6.18 show foamed concrete of the same density 600 kg/m3 at w/c ratio 0.50
using different surfactants. From Figure 6.17 it can be seen that the bubbles from protein
surfactants are closed and defined with connecting bubble walls. Figure 6.18 shows foamed
concrete using synthetic surfactant where the bubbles are open and the bubble walls appear
broken. The bubbles appear to have ‘holes’ or ‘bubbles inside the bubbles’. This explains the
‘weaker’ bubbles in synthetic surfactants. Additional images of the microstructure of foamed
concrete using synthetic surfactant were shown in Figures 6.19 and 6.20. These two images
show foamed concrete of density 300 kg/m3 at w/c ratio 0.50. The purpose of casting at low
density was to observe the characters of the bubbles without having too many solids in the
mixture. It was not possible to analyse using ImageJ since the samples appeared to have
‘holes’ inside the bubbles.
Wetting agent was included for a study on instability in foamed concrete as described in
Chapter 7. The microstructures of the foamed concrete of density 600 kg/m3 with inclusion of
wetting agent were shown in Figures 6.21 to 6.23. The bubbles of the foamed concrete with
wetting agents appeared disintegrated. The degree of disintegration appeared to have
increased with the increased percentage of wetting agent. This pattern was repeated in
density 300 kg/m3 as shown in Figures 6.24 and 6.25. The disintegration of the bubbles
resulted in more brittle and less sustainable foamed concrete specimens, although the surface
level did not drop catastrophically. This effect will be discussed in greater detail in Chapter 7:
Causes of Instability in Foamed Concrete.
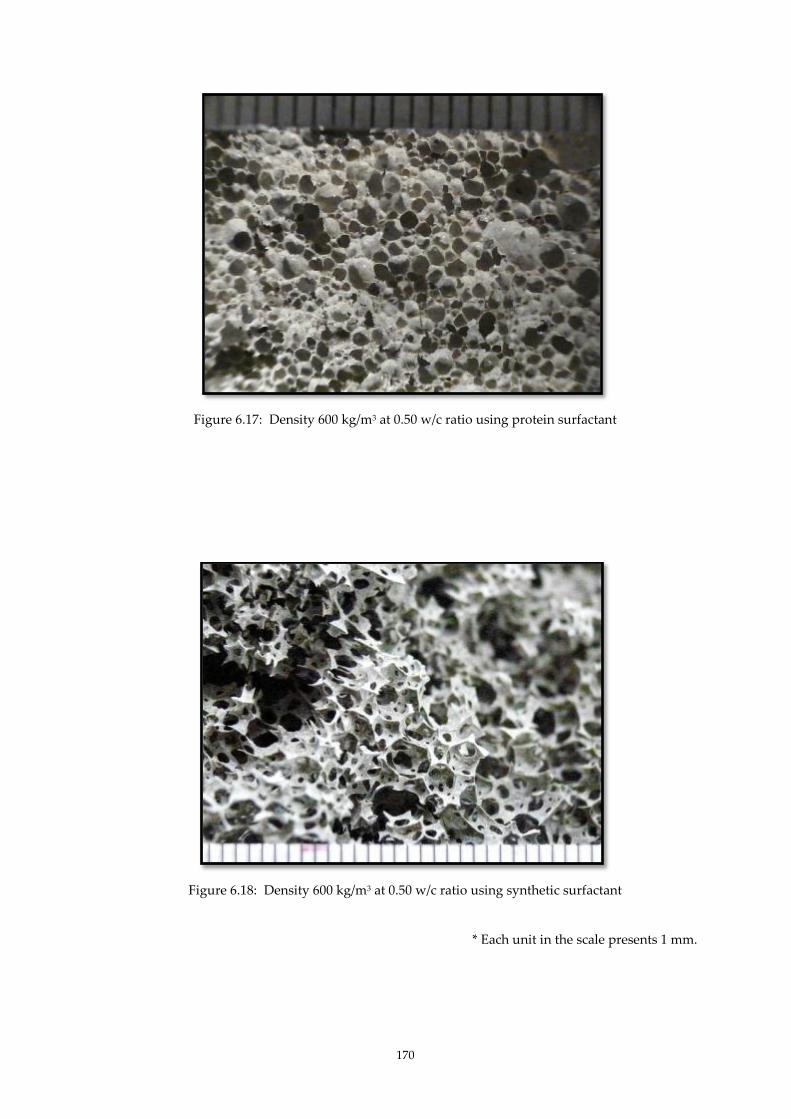
170
Figure 6.17: Density 600 kg/m3 at 0.50 w/c ratio using protein surfactant
Figure 6.18: Density 600 kg/m3 at 0.50 w/c ratio using synthetic surfactant
* Each unit in the scale presents 1 mm.

171
Figure 6.19: Small specimen of density 300 kg/m3 at w/c ratio 0.50 using synthetic surfactant
Figure 6.20: Density 300 kg/m3, w/c ratio 0.50 using synthetic surfactant
* Each unit in the scale presents 1 mm.
Each unit = 1 mm
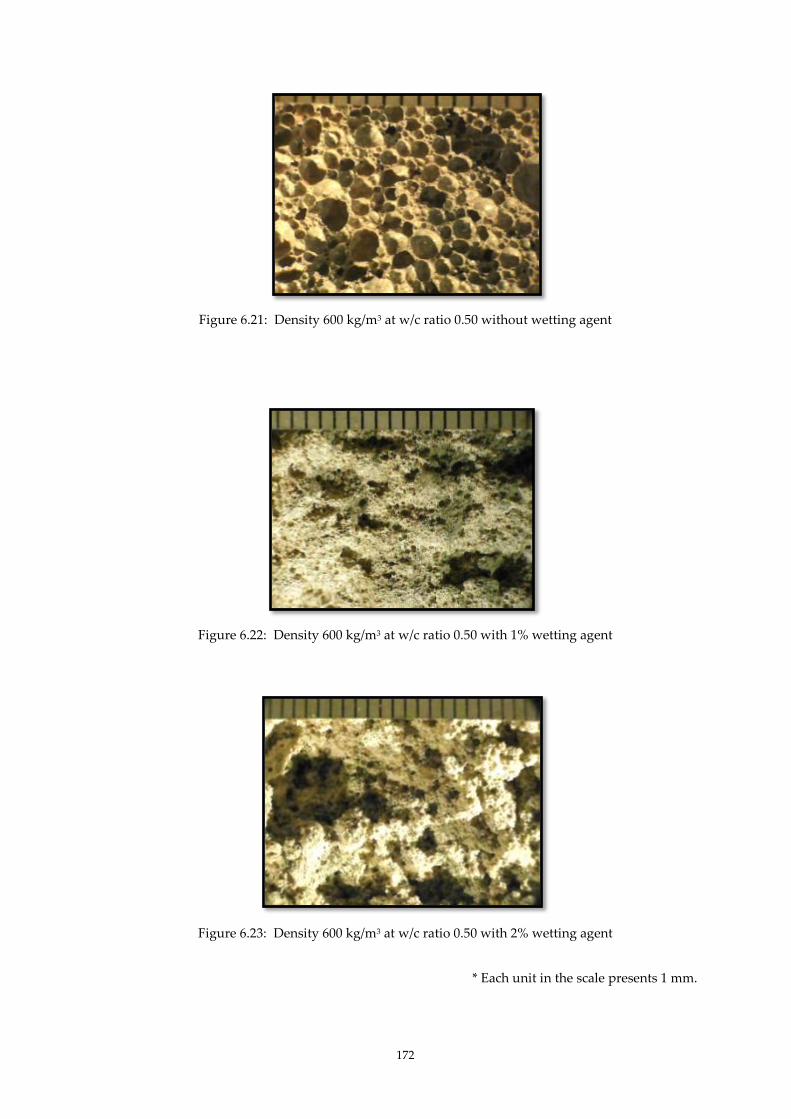
172
Figure 6.21: Density 600 kg/m3 at w/c ratio 0.50 without wetting agent
Figure 6.22: Density 600 kg/m3 at w/c ratio 0.50 with 1% wetting agent
Figure 6.23: Density 600 kg/m3 at w/c ratio 0.50 with 2% wetting agent
* Each unit in the scale presents 1 mm.

173
Figure 6.24: Density 300 kg/m3 at w/c ratio 0.50 without wetting agent
Figure 6.25: Density 300 kg/m3 at w/c ratio 0.50 with 1% wetting agent
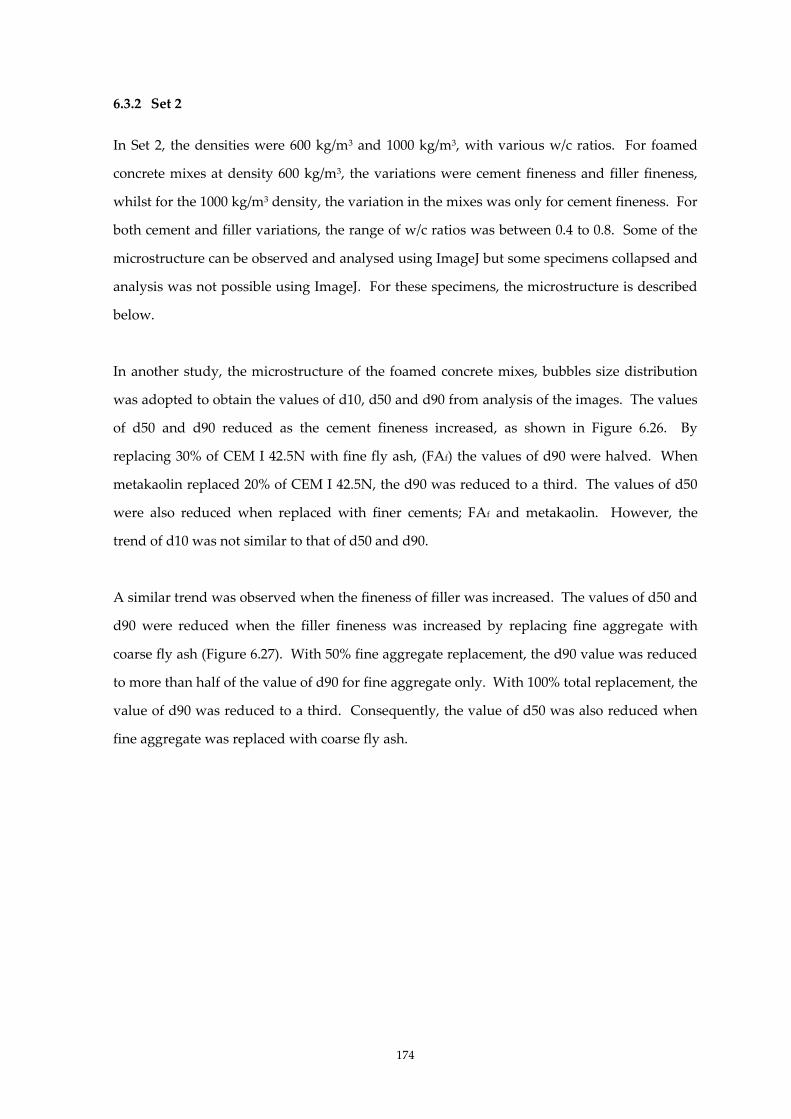
174
6.3.2 Set 2
In Set 2, the densities were 600 kg/m3 and 1000 kg/m3, with various w/c ratios. For foamed
concrete mixes at density 600 kg/m3, the variations were cement fineness and filler fineness,
whilst for the 1000 kg/m3 density, the variation in the mixes was only for cement fineness. For
both cement and filler variations, the range of w/c ratios was between 0.4 to 0.8. Some of the
microstructure can be observed and analysed using ImageJ but some specimens collapsed and
analysis was not possible using ImageJ. For these specimens, the microstructure is described
below.
In another study, the microstructure of the foamed concrete mixes, bubbles size distribution
was adopted to obtain the values of d10, d50 and d90 from analysis of the images. The values
of d50 and d90 reduced as the cement fineness increased, as shown in Figure 6.26. By
replacing 30% of CEM I 42.5N with fine fly ash, (FAf) the values of d90 were halved. When
metakaolin replaced 20% of CEM I 42.5N, the d90 was reduced to a third. The values of d50
were also reduced when replaced with finer cements; FAf and metakaolin. However, the
trend of d10 was not similar to that of d50 and d90.
A similar trend was observed when the fineness of filler was increased. The values of d50 and
d90 were reduced when the filler fineness was increased by replacing fine aggregate with
coarse fly ash (Figure 6.27). With 50% fine aggregate replacement, the d90 value was reduced
to more than half of the value of d90 for fine aggregate only. With 100% total replacement, the
value of d90 was reduced to a third. Consequently, the value of d50 was also reduced when
fine aggregate was replaced with coarse fly ash.

175
Figure 6.26: Bubble diameters of density 600 kg/m3 specimens with varying cement fineness
Figure 6.27: Bubble diameters of density 600 kg/m3 with varying filler fineness
0.0
0.2
0.4
0.6
0.8
1.0
1.2
1.4
d10 d50 d90 d10 d50 d90 d10 d50 d90
CEM I CEM I (70%) + FAf(30%) CEM I (80%) + Mk (20%)
Bu
bb
le d
iam
eter
(m
m)
0.0
0.2
0.4
0.6
0.8
1.0
1.2
1.4
d10 d50 d90 d10 d50 d90 d10 d50 d90
CEM I + sand CEM I + sand (50%) + FAc
(50%)
CEM I + Fac (100%)
Bu
bb
le d
iam
eter
(m
m)
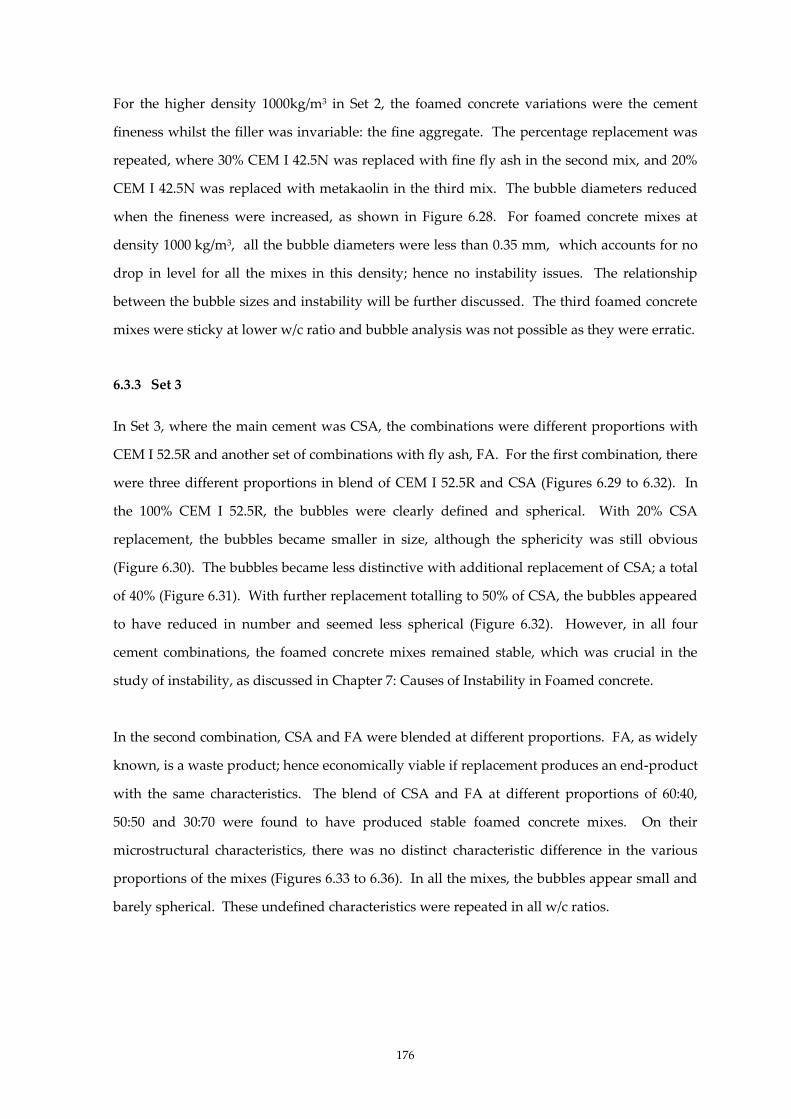
176
For the higher density 1000kg/m3 in Set 2, the foamed concrete variations were the cement
fineness whilst the filler was invariable: the fine aggregate. The percentage replacement was
repeated, where 30% CEM I 42.5N was replaced with fine fly ash in the second mix, and 20%
CEM I 42.5N was replaced with metakaolin in the third mix. The bubble diameters reduced
when the fineness were increased, as shown in Figure 6.28. For foamed concrete mixes at
density 1000 kg/m3, all the bubble diameters were less than 0.35 mm, which accounts for no
drop in level for all the mixes in this density; hence no instability issues. The relationship
between the bubble sizes and instability will be further discussed. The third foamed concrete
mixes were sticky at lower w/c ratio and bubble analysis was not possible as they were erratic.
6.3.3 Set 3
In Set 3, where the main cement was CSA, the combinations were different proportions with
CEM I 52.5R and another set of combinations with fly ash, FA. For the first combination, there
were three different proportions in blend of CEM I 52.5R and CSA (Figures 6.29 to 6.32). In
the 100% CEM I 52.5R, the bubbles were clearly defined and spherical. With 20% CSA
replacement, the bubbles became smaller in size, although the sphericity was still obvious
(Figure 6.30). The bubbles became less distinctive with additional replacement of CSA; a total
of 40% (Figure 6.31). With further replacement totalling to 50% of CSA, the bubbles appeared
to have reduced in number and seemed less spherical (Figure 6.32). However, in all four
cement combinations, the foamed concrete mixes remained stable, which was crucial in the
study of instability, as discussed in Chapter 7: Causes of Instability in Foamed concrete.
In the second combination, CSA and FA were blended at different proportions. FA, as widely
known, is a waste product; hence economically viable if replacement produces an end-product
with the same characteristics. The blend of CSA and FA at different proportions of 60:40,
50:50 and 30:70 were found to have produced stable foamed concrete mixes. On their
microstructural characteristics, there was no distinct characteristic difference in the various
proportions of the mixes (Figures 6.33 to 6.36). In all the mixes, the bubbles appear small and
barely spherical. These undefined characteristics were repeated in all w/c ratios.
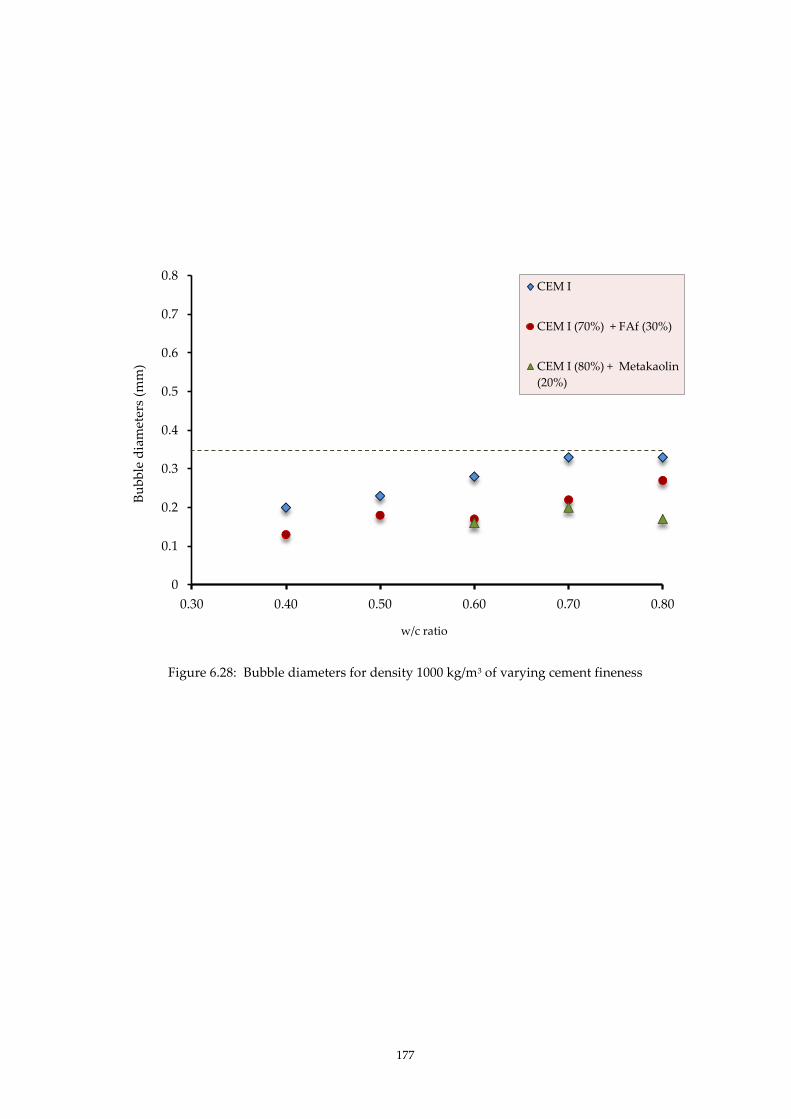
177
Figure 6.28: Bubble diameters for density 1000 kg/m3 of varying cement fineness
0
0.1
0.2
0.3
0.4
0.5
0.6
0.7
0.8
0.30 0.40 0.50 0.60 0.70 0.80
CEM I
CEM I (70%) + FAf (30%)
CEM I (80%) + Metakaolin
(20%)
w/c ratio
Bu
bb
le d
iam
eter
s (m
m)

178
Figure 6.29: 100 CEM I 52.5R (w/c ratio 0.50)
Figure 6.30: CEM I 52.5R : CSA / 80: 20
(w/c ratio 0.50)
Figure 6.31: CEM I 52.5R : CSA / 60: 40
(w/c ratio 0.50)
Figure 6.32: CEM I 52.5R CSA / 50: 50
(w/c ratio 0.50)
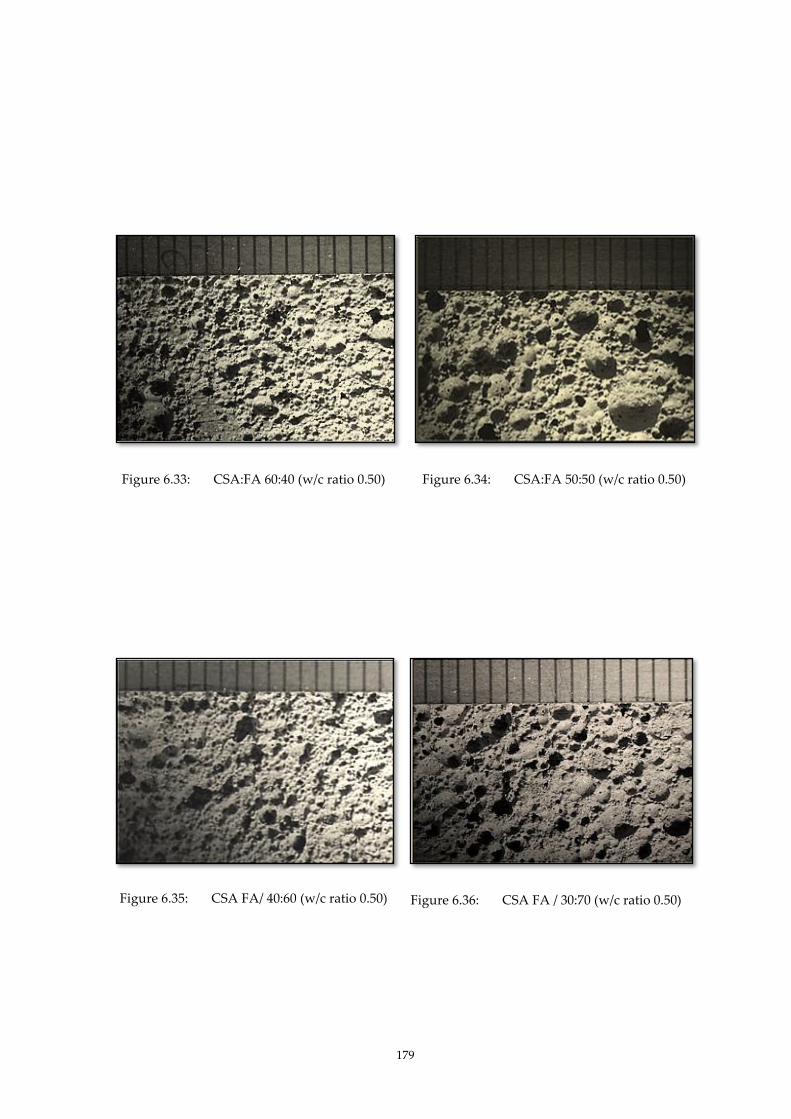
179
Figure 6.33: CSA:FA 60:40 (w/c ratio 0.50)
Figure 6.34: CSA:FA 50:50 (w/c ratio 0.50)
Figure 6.35: CSA FA/ 40:60 (w/c ratio 0.50)
Figure 6.36: CSA FA / 30:70 (w/c ratio 0.50)
180
6.4 SUMMARY OF RESULTS
In this chapter, the study on the microstructure of foamed concrete was conducted by
examining the factors that affected the structure and by observing its relationship with
rheological properties and instability. This phase of the study revealed that several factors
determine the microstructure of foamed concrete and it was not clear which had the most
influence. The determining factors were the density, w/c ratios, constituent materials, their
proportions and chemical additions. This study was confined to empirical results without in-
depth analysis of the chemistry, although some assumptions were made based on their
incompatibilities.
The significant outcomes from this phase of the study are:
1. An increase in density produced a decrease in bubble size but an increase in bubble count.
Correspondingly, an increase in w/c ratio of the same density reduced the bubble count
whilst the bubble size increased. With the same constituent materials, the lower density
produced bigger bubbles and, inversely, the higher density produced smaller bubbles.
2. Protein surfactant produced spherical, more defined and closed bubbles which were not
connected. Synthetic surfactant formed bubbles that were ‘open’, undefined, with ‘holes’
in their cells.
3. For the same density and w/c ratio, the bubble sizes decreased with increase in either the
cement fineness or the filler fineness. These were obtained using protein surfactant.
4. The addition of wetting agent to foamed concrete mixes disintegrated the bubbles.
Although it improved the occurrence of collapse, the foamed concrete was weak and
fractured easily.
5. Generally, using the same constituent materials, foamed concrete mixes at higher densities
(> 1000 kg/m3) did not drop more than 5% in height; hence they were construed as stable.
181
The bubbles were spherical and small, with d50 less than 0.3 mm. Foamed concrete mixes
of 600 kg/m3 experienced some occurrences of collapse. There were clear big bubbles;
notably with d90 greater than 1mm.
6. For foamed concrete mixes of density 300 kg/m3, using cement type CEM I 42.5N, the
episodes of collapses were frequent. Conversely, using cement type CEM I 52.5R (fast
setting cement), the foamed concrete mixes were stable. Stability was achieved with CSA
cement and blends of CSA and CEM I 52.5R and CSA and FAf.

182
CHAPTER 7: CAUSES OF INSTABILITY IN FOAMED CONCRETE
7.1 INTRODUCTION
The main characteristics of foamed concrete are the low self-weight, ability to flow and self-
levelling properties which it possesses in its hardened and fresh state. Ideally, foamed
concrete has to possess high flowability properties to ensure that it reaches the target
destination, yet stable enough to resist the high strain rates generated by the flow. However,
these are only beneficial if the material is stable with no segregation. Segregation, of foam
concrete may alter these characteristics, hence, nullifying the objective of using this innovative
form of concrete.
Low density foamed concrete is currently in demand in the construction industry. As
reported within this section, projects which in the past have utilised foamed concrete, have
typical deployed densities which were higher, when compared to those which have been used
in recent years. The first of these projects was the widening and strengthening project of the
Kingston Bridge, London, completed in 2001 (Figure 7.1). In this project, the foamed concrete
density was 1400 kg/m3. The second project is a mine stabilisation project in Combe Down,
Bath, which started in 2001, where foamed concrete with a density of 600 kg /m3 was, used
(Figure 7.2). The third and most recent project, involves topping up the structural infill for a
tunnel at Gerrards Cross, London which began in November 2009. In this project, the foamed
concrete density utilised was a low as 400 kg/m3.
These examples emphasises the concrete industries continued trend in utilising lower density
foamed concretes. However, achieving the ability to maintain a stable low self-weight
continues to present a challenge to the industry. Low self-weight corresponds to a high
percentage of air which is obtained by inclusion of a high amount of preformed foam. The
stability of the foam is a function of density and the type of surfactant employed (Highways
Agency and Transport Research Laboratory, 2001). By contrast, the instability of the foam can
be induced by a number of external environmental factors, which include; temperature,
humidity, alkalinity or acidity. Internal factors can also affect instability. These internal
factors include; incompatibility of the foamed concrete with other materials such as chemical
admixtures, and other constituent materials, such as GGBS and fly ash (Highways Agency and
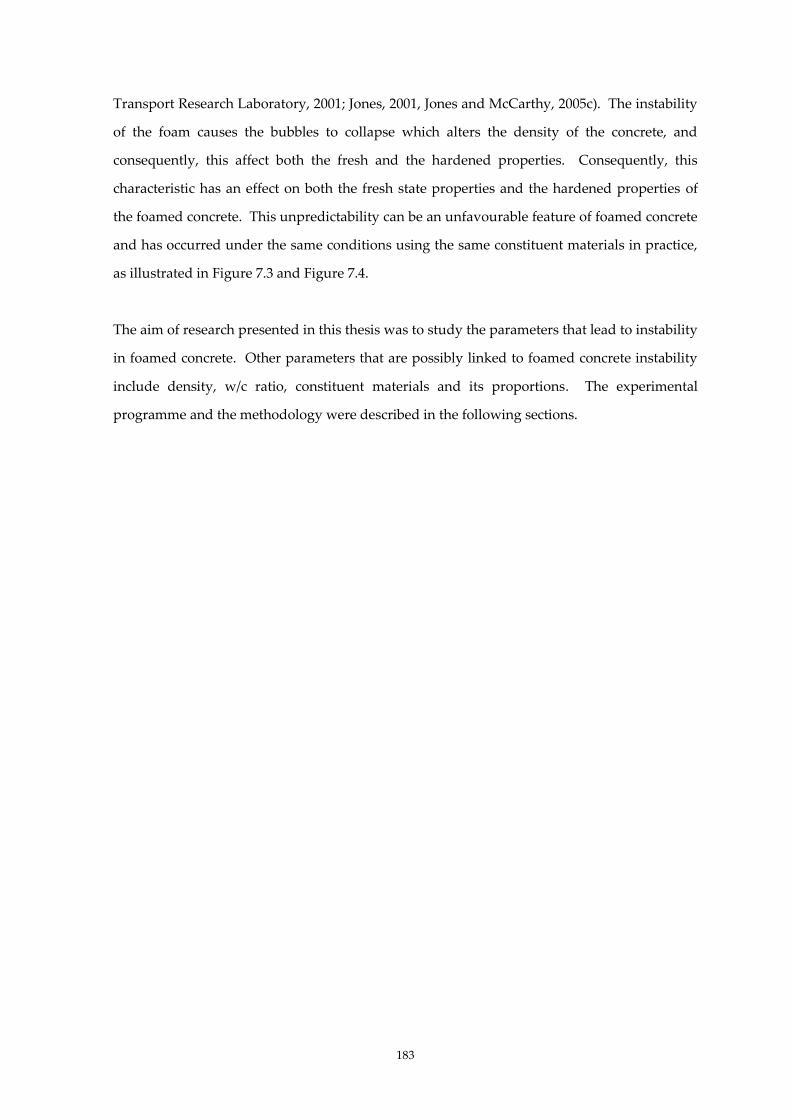
183
Transport Research Laboratory, 2001; Jones, 2001, Jones and McCarthy, 2005c). The instability
of the foam causes the bubbles to collapse which alters the density of the concrete, and
consequently, this affect both the fresh and the hardened properties. Consequently, this
characteristic has an effect on both the fresh state properties and the hardened properties of
the foamed concrete. This unpredictability can be an unfavourable feature of foamed concrete
and has occurred under the same conditions using the same constituent materials in practice,
as illustrated in Figure 7.3 and Figure 7.4.
The aim of research presented in this thesis was to study the parameters that lead to instability
in foamed concrete. Other parameters that are possibly linked to foamed concrete instability
include density, w/c ratio, constituent materials and its proportions. The experimental
programme and the methodology were described in the following sections.

184
Figure 7.1: Widening and strengthening of Kingston Bridge, West London
(http://www.lobeg.com/index.php?option=com_content&view=article&id=5&Itemid=13,
November 2010)
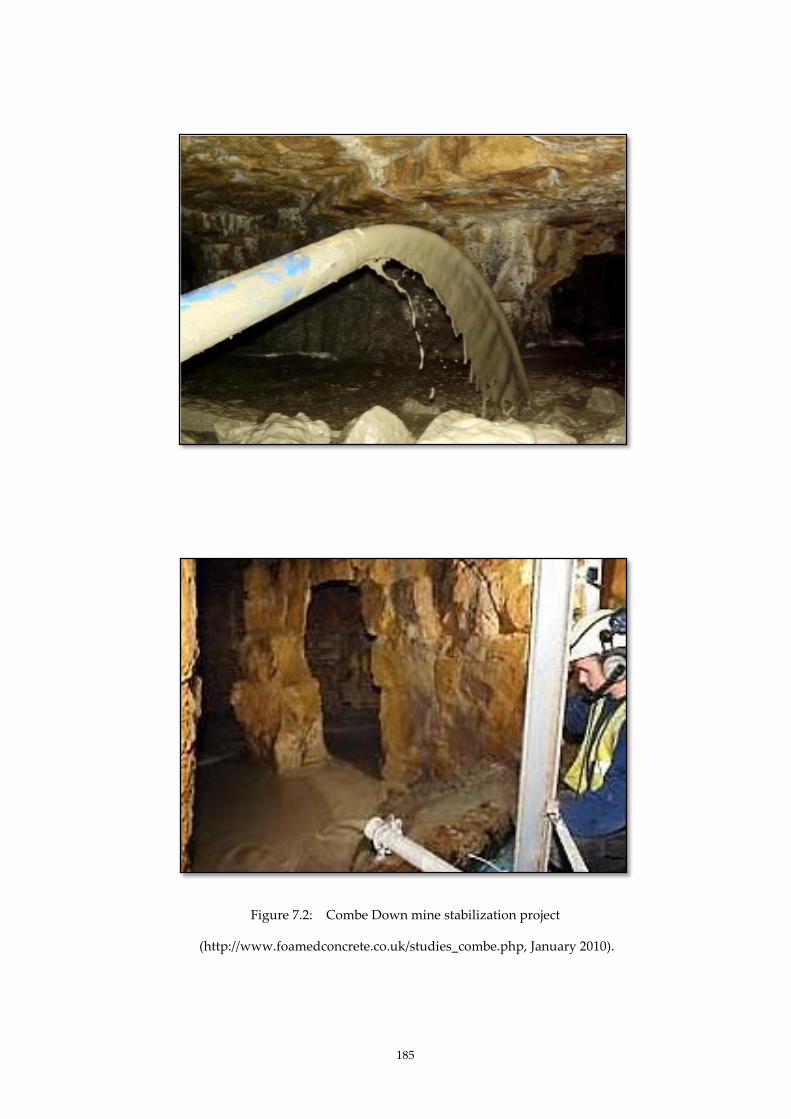
185
Figure 7.2: Combe Down mine stabilization project
(http://www.foamedconcrete.co.uk/studies_combe.php, January 2010).
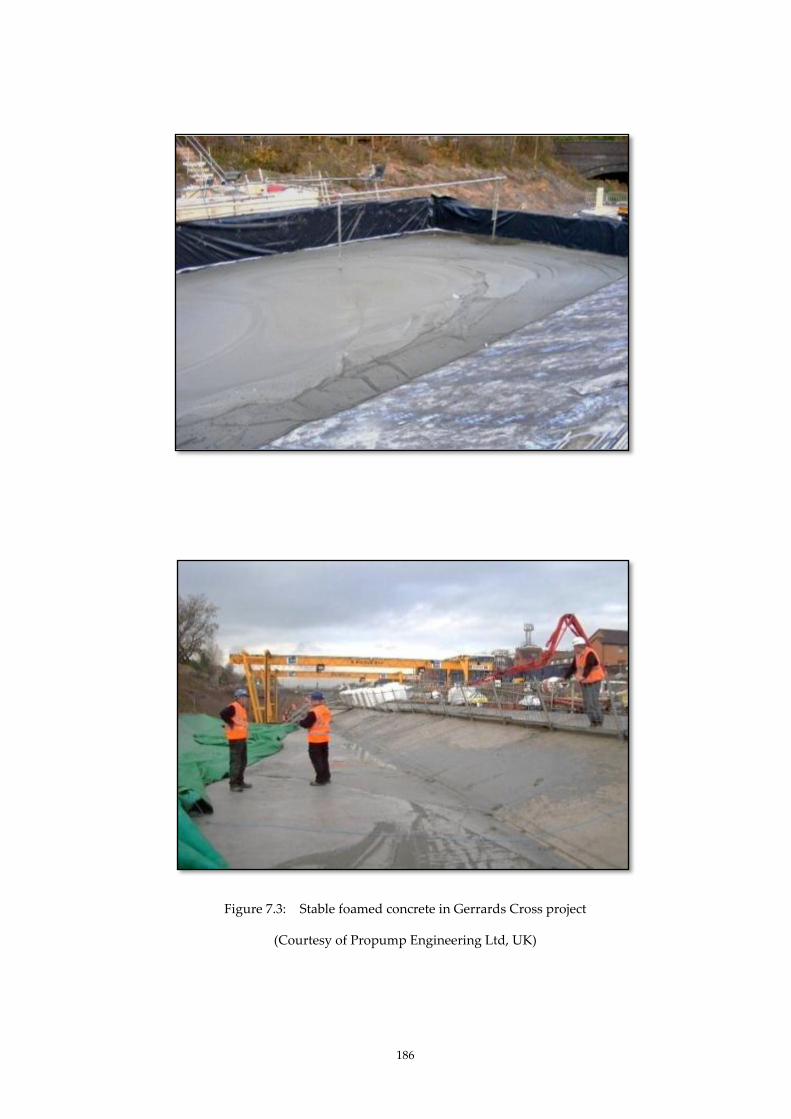
186
Figure 7.3: Stable foamed concrete in Gerrards Cross project
(Courtesy of Propump Engineering Ltd, UK)

187
Figure 7.4: Collapsed foamed concrete in Gerrards Cross project
(http://www.foamedconcrete.co.uk/news1.php, January 2010)
(http://www.nce.co.uk/news/geotechnical/cross-purpose/1995578.article, January 2010)

188
7.2 MATERIALS, EXPERIMENTAL PROGRAMMES AND METHODOLOGY
7.2.1. Introduction
Appraisal of the instability of foamed concrete especially at lower densities indicated that
there were several factors, rather than any single cause, which contributed to the instability of
foamed concrete (Highways Agency and TRL, 2001). No standard test to investigate
instability existed. Nevertheless, it was noted that assessment of instability within foamed
concrete could be achieved by visual observation of the consistency of mix (McCarthy, 2006;
Jones and McCarthy, 2005c; Nambiar and Ramamurthy 2007a). Adopting this technique in
the current study, the drop in the surface level was assumed to have resulted from instability
within the foamed concrete.
In the current study, it was observed that under normal laboratory conditions, preformed
foam collapsed easily, as shown in Figure 7.5 (1 - 6). Observations on the progressive collapse
of a synthetic-based foam were taken over a time period of approximately 1 minute 30
seconds. Based on this fragility, ‘dropout’ tests were done to study whether various
conditions had any effect on the speed of collapse of preformed foam. The conditions
included varying external humidity and temperature. For the study on stability of foamed
concrete, few possible factors were investigated in this study, as illustrated in Figure 7.6.
Primarily, the bubbles, produced from the surfactants were varied using two different
surfactants: protein and synthetic surfactant. Consecutively, the density and the w/c ratio
were altered by varying the proportions. These proportions were varied using the same or
different combinations of constituent materials. Recognizing that cement as the main
constituent may produce different results, several cement types were selected with varying
setting times and fineness. The different cement types and blends of cementitious materials
were CEM I 42.5N, CEM I 52.5R, Calcium sulfoaluminate (CSA), Rapid Hardening Portland
Cement (RHPC), metakaolin, and fine fly ash, FAf. The inclusion of calcium chloride, CaCl2
and wetting agent to the cement were aimed to alter the setting times. A slight variation of
fillers was included by replacing sand with different percentages of coarse fly ash, FAc, since
the latter has greater fineness. Varying heights of cylinders were incorporated to study the
rate of drainage and the effect of pressure arising from different heights.
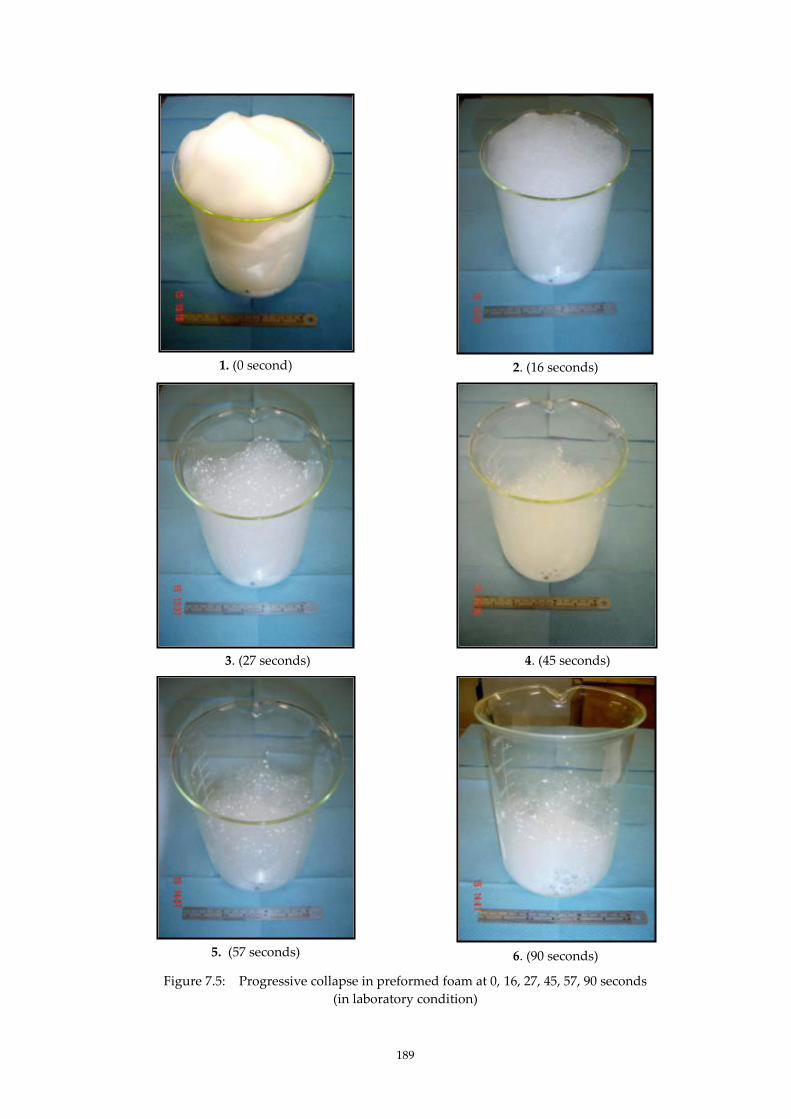
189
1. (0 second)
2. (16 seconds)
3. (27 seconds)
4. (45 seconds)
5. (57 seconds)
6. (90 seconds)
Figure 7.5: Progressive collapse in preformed foam at 0, 16, 27, 45, 57, 90 seconds
(in laboratory condition)

190
Photo: Foamed concrete mix density 600 kg/m3 at w/c ratio 0.70
using 80% CEM I 42.5N + 20% Metakaolin + sand
Figure 7.6: Parameters considered in the study of instability
External relative
humidity Bubbles types External
temperature
Setting time
Rate of
drainage
Bubbles sizes
Filler types
Cement types
Chemical
addition
191
7.2.2. Constituent Materials
1. Portland cement PC, CEM I 42.5N conforming to BS EN 197-1 was the main cement
employed in the study. In Set 3 study, CEM I 52.5R was employed.
2. ‘Fine’ fly ash (FAf) with a 45 m sieve retention of 7.5%, loss on ignition (LOI) of 5.0%
and conforming to BS EN 450.5 was used to replace CEM I 42.5N at 30% by mass
fraction.
3. Metakaolin used as replacement for cement to a level of 20% in the second study
(Set 2).
4. Calcium sulphoaluminate (CSA) was employed in the Set 3 study. CSA is a quick
setting and early strength cement, which is finer and lighter in colour compared to
CEM I 42.5N.
5. Natural sand, fine aggregate (conforming to BS EN 12620:2002 with particles greater
than 2.36 mm removed by sieving).
6. Coarse fly ash, FAc with a 45m sieve retention of 36.0% and conforming to BS 3892-2/
BS EN 450 and ASTM C 618-94a Class F was used as 50% and 100% replacement for
sand.
7. The surfactants used in this study were a protein-based surfactant – type Propump 40
and three types of synthetic surfactants – Propump Synthetic, TFAL -3 and Regular
3%. The TFAL-3 and Regular 3% surfactants were examined briefly as opposed to the
Propump 40 and synthetic surfactants which were used more widely in the current
experiments. The preformed foam was prepared from a 6% aqueous surfactant
solution in a dry system generator with density between 40 and 50 kg/m3.
8. The mixing water used conformed to BS EN 1008 Mixing water for concrete. In this
study, the w/c ratio was varied from 0.40 to 0.80.
9. Calcium chloride (Calcium chloride anhydrous granular) in addition up to 2% and 4%
cement content.
10. A commercially available wetting agent.
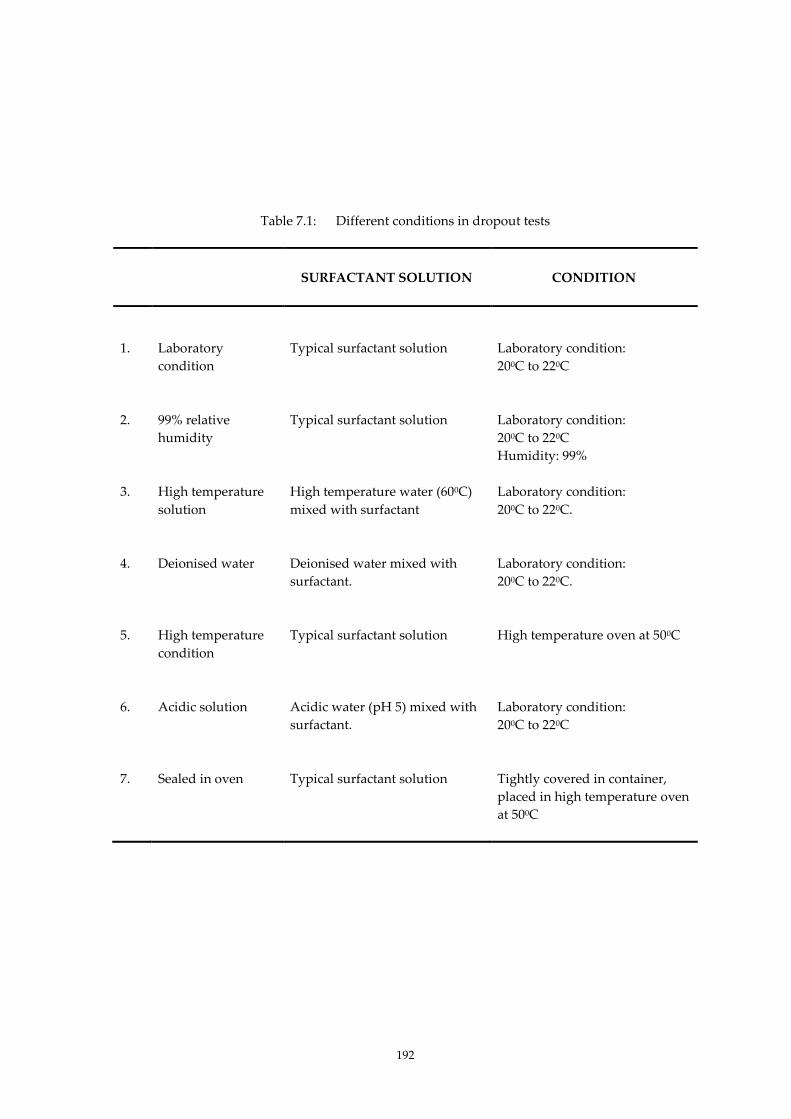
192
Table 7.1: Different conditions in dropout tests
SURFACTANT SOLUTION CONDITION
1. Laboratory
condition
Typical surfactant solution
Laboratory condition:
200C to 220C
2. 99% relative
humidity
Typical surfactant solution
Laboratory condition:
200C to 220C
Humidity: 99%
3. High temperature
solution
High temperature water (600C)
mixed with surfactant
Laboratory condition:
200C to 220C.
4. Deionised water Deionised water mixed with
surfactant.
Laboratory condition:
200C to 220C.
5. High temperature
condition
Typical surfactant solution
High temperature oven at 500C
6. Acidic solution Acidic water (pH 5) mixed with
surfactant.
Laboratory condition:
200C to 220C
7. Sealed in oven Typical surfactant solution
Tightly covered in container,
placed in high temperature oven
at 500C
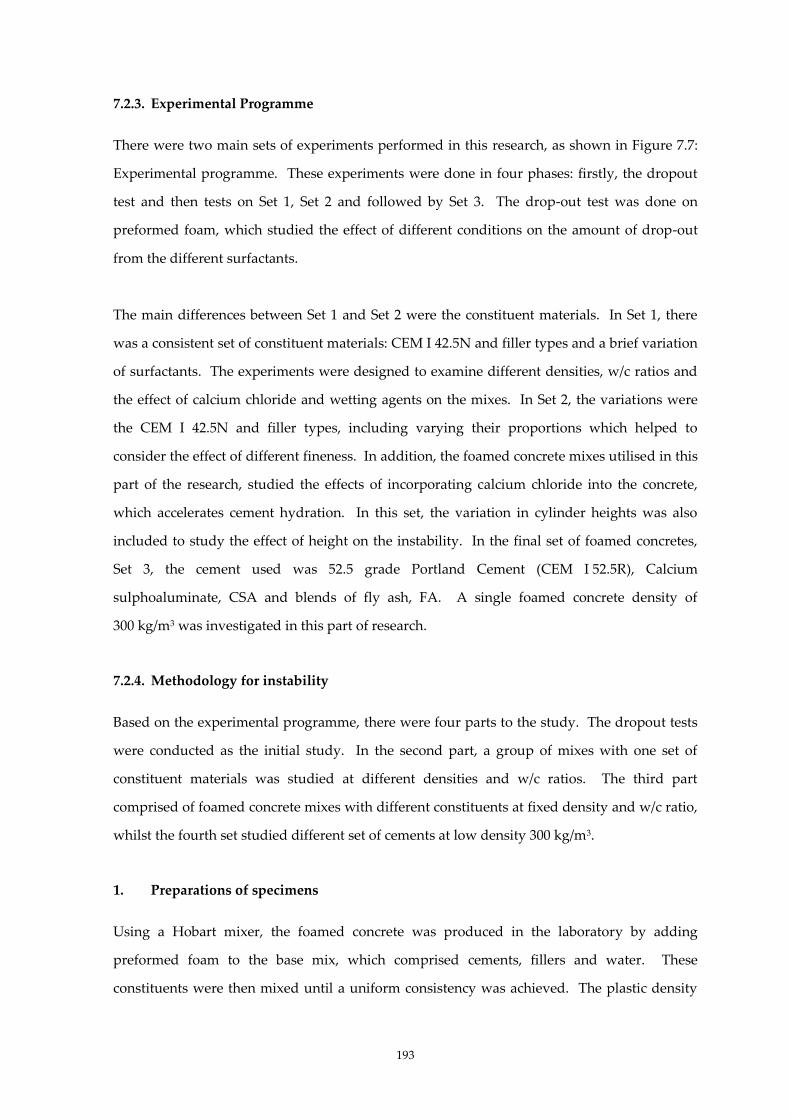
193
7.2.3. Experimental Programme
There were two main sets of experiments performed in this research, as shown in Figure 7.7:
Experimental programme. These experiments were done in four phases: firstly, the dropout
test and then tests on Set 1, Set 2 and followed by Set 3. The drop-out test was done on
preformed foam, which studied the effect of different conditions on the amount of drop-out
from the different surfactants.
The main differences between Set 1 and Set 2 were the constituent materials. In Set 1, there
was a consistent set of constituent materials: CEM I 42.5N and filler types and a brief variation
of surfactants. The experiments were designed to examine different densities, w/c ratios and
the effect of calcium chloride and wetting agents on the mixes. In Set 2, the variations were
the CEM I 42.5N and filler types, including varying their proportions which helped to
consider the effect of different fineness. In addition, the foamed concrete mixes utilised in this
part of the research, studied the effects of incorporating calcium chloride into the concrete,
which accelerates cement hydration. In this set, the variation in cylinder heights was also
included to study the effect of height on the instability. In the final set of foamed concretes,
Set 3, the cement used was 52.5 grade Portland Cement (CEM I 52.5R), Calcium
sulphoaluminate, CSA and blends of fly ash, FA. A single foamed concrete density of
300 kg/m3 was investigated in this part of research.
7.2.4. Methodology for instability
Based on the experimental programme, there were four parts to the study. The dropout tests
were conducted as the initial study. In the second part, a group of mixes with one set of
constituent materials was studied at different densities and w/c ratios. The third part
comprised of foamed concrete mixes with different constituents at fixed density and w/c ratio,
whilst the fourth set studied different set of cements at low density 300 kg/m3.
1. Preparations of specimens
Using a Hobart mixer, the foamed concrete was produced in the laboratory by adding
preformed foam to the base mix, which comprised cements, fillers and water. These
constituents were then mixed until a uniform consistency was achieved. The plastic density
194
was measured in accordance with BS EN 12350-611 by weighing a foamed concrete sample in
a pre-weighed container of a known volume. A tolerance on plastic density was set at
±50 kg/m3 of the target value.
The specimens were then cast in cylinder moulds lined with domestic plastic ‘cling’ film. The
cylinders were made of clear Perspex which allowed for visual observations. The height of the
cylinder moulds varied from 70 mm to 500 mm while the diameter was 75 mm throughout the
length. Once the cylinder was filled, the surface was covered with plastic cling film to prevent
dehydration. After 24 hours, the level of the specimens was observed and any drop in level of
the surface was recorded.
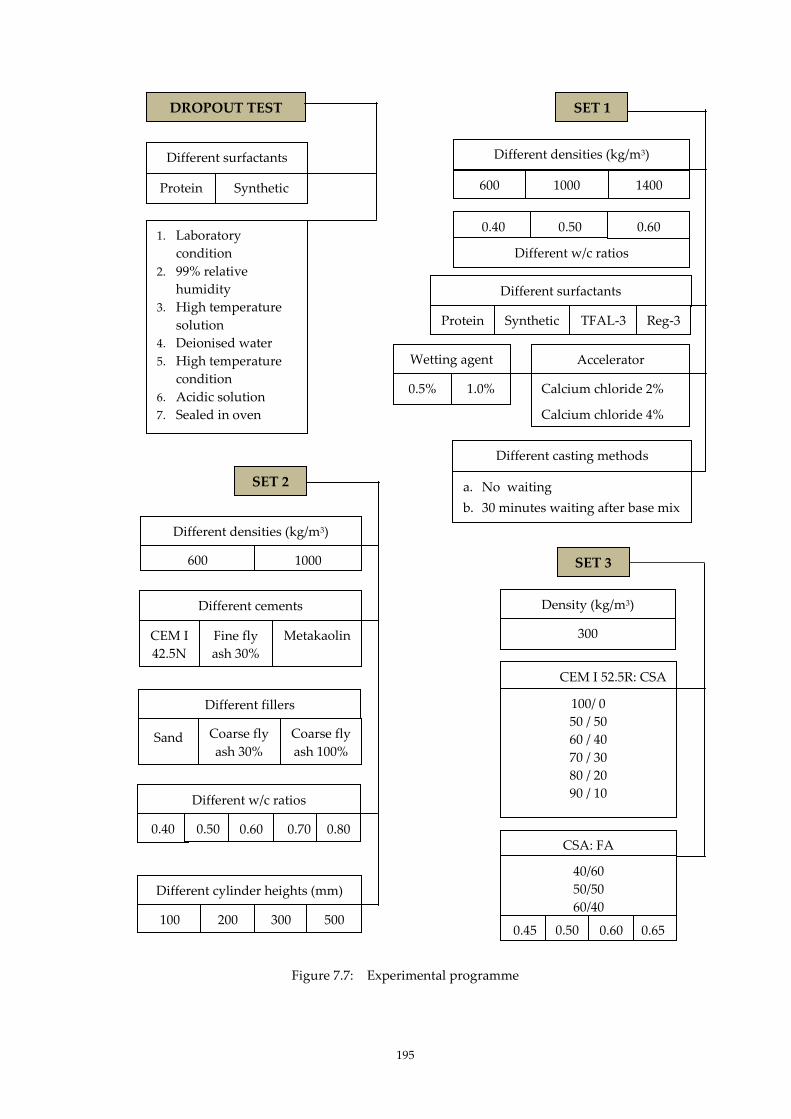
195
Figure 7.7: Experimental programme
Different surfactants
Protein Synthetic
Different Conditions
1. Laboratory
condition
2. 99% relative
humidity
3. High temperature
solution
4. Deionised water
5. High temperature
condition
6. Acidic solution
7. Sealed in oven
DROPOUT TEST SET 1
Different densities (kg/m3)
600 1000 1400
Different w/c ratios
0.40 0.50 0.60
Different surfactants
Protein Synthetic TFAL-3 Reg-3
Different casting methods
a. No waiting
b. 30 minutes waiting after base mix
Accelerator
Calcium chloride 2%
Calcium chloride 4%
Different densities (kg/m3)
600 1000
Different fillers
Coarse fly
ash 100%
SET 2
Wetting agent
0.5% 1.0%
Different cements
CEM I
42.5N
Fine fly
ash 30%
Metakaolin
Coarse fly
ash 30% Sand
Different cylinder heights (mm)
100 200 300 500
Different w/c ratios
0.40 0.50 0.60
SET 3
CEM I 52.5R: CSA
100/ 0
50 / 50
60 / 40
70 / 30
80 / 20
90 / 10
CSA: FA
40/60
50/50
60/40
0.45 0.65 0.50 0.60
Density (kg/m3)
300
0.70 0.80
196
Dropout test
The dropout test investigated the link between the preformed foam, a constituent in the mix
and the end product, foamed concrete. The behaviour of foams which break down easily
suggested that this fragility affected the stability of foamed concrete since foam constitutes a
major percentage in the mix. As shown in Figure 7.5, the preformed foam collapsed
catastrophically within one minute. Using this concept, the dropout test measured the
amount of liquid which resulted from the collapse of the foam within a specified time, when
the foams were formed and placed under various conditions.
One litre of foam was placed in a glass jar and after 20 minutes, the amount of dropout water
was measured. The preformed foam was typically prepared from a surfactant solution
consisting of one part surfactant to between 5 and 40 parts of water in a dry system generator.
The consistency was similar to that of shaving foam at a density of between 20 and 90 kg/m3
(Highways Agency and TRL, 2001). Typical density of a protein-based surfactant is 50 kg/m3.
In the drop-out tests, the variations in preparation of surfactants are as in Table 7.1 as
illustrated previously.
197
Instability test for Set 1, Set 2 and Set 3
The mix proportions of foamed concrete were carried out as described in Section 3.4 using a
Hobart mixer. The mixing method employed the typical method as mentioned in Section 3.6,
except for a small variation in Set 1, where the foam was added 20 minutes after the ‘base mix’
which was then mixed uniformly. The variations are shown in the experimental programme
(Figure 7.7).
The plastic density of all the foamed concretes were measured in accordance to BS EN 12350-
611 as described in Section 3.6. Then the instability of the foamed concrete was measured by
casting the concrete into cylinders of varying heights. The level of the top surface was marked
at the time of placing. After 24 hours, the new level was marked and any difference in the
level was recorded as the amount of drop.
7.3 RESULTS
7.3.1. Dropout tests
The purpose of these experiments was to study the constituent materials in foamed concrete
mixes since these have a strong influence on the behaviour of these mixes. Prior to
commencement of the experiments on foamed concrete mixes, dropout tests were carried out
to determine the effect of preformed foam on foamed concrete. In the dropout tests, two types
of surfactants were used: the protein PP40 and synthetic surfactant. Experiments were
conducted under various conditions and the amount of dropout was collected. Table 7.2
shows the quantity of dropout for the two surfactants.
The amount of dropout was highest in condition 5, where the preformed foam was placed at
high temperature, 500C for synthetic surfactant and in condition 7, sealed in oven for protein
surfactant. This was because the surface tension of bubbles decreased with increase in
temperature. The high in temperature accelerated foam collapsed and led to most dropout.
The least dropout for both surfactants was found in condition 4, where deionised water was
used to produce the preformed foam. Deionised water had its mineral ions and other water
impurities removed. These impurities interfered with the stability of the foam.

198
The pattern of dropout in the various conditions was similar in both surfactants, although the
quantity was higher in the synthetic surfactant under all conditions (Figure 7.8). Less water
drainage shown by protein surfactant was expected because protein surfactants produced
more stable, stronger, yet smaller bubbles with closed cells structure compared to synthetic
surfactants.
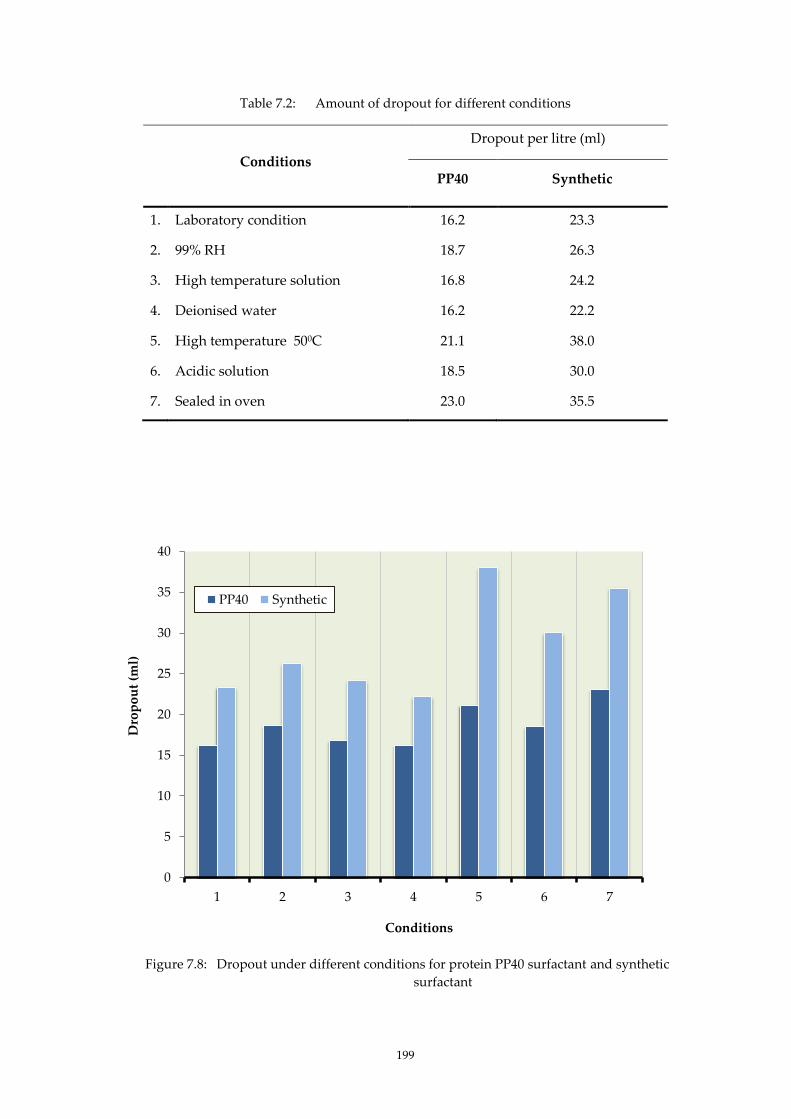
199
Table 7.2: Amount of dropout for different conditions
Conditions
Dropout per litre (ml)
PP40 Synthetic
1. Laboratory condition 16.2 23.3
2. 99% RH 18.7 26.3
3. High temperature solution 16.8 24.2
4. Deionised water 16.2 22.2
5. High temperature 500C 21.1 38.0
6. Acidic solution 18.5 30.0
7. Sealed in oven 23.0 35.5
Figure 7.8: Dropout under different conditions for protein PP40 surfactant and synthetic
surfactant
0
5
10
15
20
25
30
35
40
1 2 3 4 5 6 7
Dro
po
ut
(ml)
Conditions
PP40 Synthetic

200
7.3.2. Set 1
In the instability tests carried out in Set 1, the constituent materials were generally the same
with variation of the surfactants and with addition of calcium chloride and wetting agents to
the mixes. The cement used in Set 1 was CEM I 42.5N. Table 7.3 shows the drop in level for
protein surfactant and Table 7.4 show the drop in level for synthetic surfactant and surfactants
TFAL-3 and Regular 3%. Variations in mixing methods were also included in Table 7.3. The
readings from these tables; protein and synthetic surfactants were plotted in Figures 7.9 and
7.10. With both surfactants, the drop in level was lowest in the highest density concretes,
1400 kg/m3 compared to those mixes at lower densities, 1000 kg/m3 and 600kg/m3.
Comparatively, foamed concrete of 600 kg/m3 densities were observed to have produced the
highest drop in level across all w/c ratios. In high density concretes, the presence of sufficient
fillers induced limited spaces and prevented the bubbles from expanding. The bubbles are
‘confined’ because the surface tension of the bubble is more than the internal pressure, hence
preventing expansion and rupturing of the bubble. Compared to lower densities, this resulted
in least drainage. In contrast, a small amount of fillers provided ample spaces which allowed
the bubbles to expand. When the bubbles expanded and collapsed at a faster rate, the drop in
level was higher. The drop in level for foamed concretes using surfactants type TFAL-3 and
Regular -3% were in the same range as synthetic surfactant.
In addition, there was a possible link with yield stress of the foamed concretes. As explained
in section 5.3.2, the yield stress increased with increase in density. This is opposite to drop in
level, where the drop decreased with increase in density as shown in Figures 7.9 and 7.10.
Within the same low density of 600 kg/m3 in the protein surfactant, the drop was higher in
concretes with high w/c ratio compared to those with low w/c ratio. With reference to the
same possible relationship, yield stress decreased with increase in w/c ratio, which is
proportionate to drop in level. This pattern was repeated for concretes with densities of
1000 kg/m3 and 1400 kg/m3.
Overall, the foamed concrete mixes using synthetic surfactant produced higher drop in level
compared to mixes using protein surfactant. There was no clear pattern in the drop level with
regard to change in w/c ratio. In addition to higher drop out in synthetic surfactant as
mentioned in section 7.3.1, further studies were done using protein surfactant.
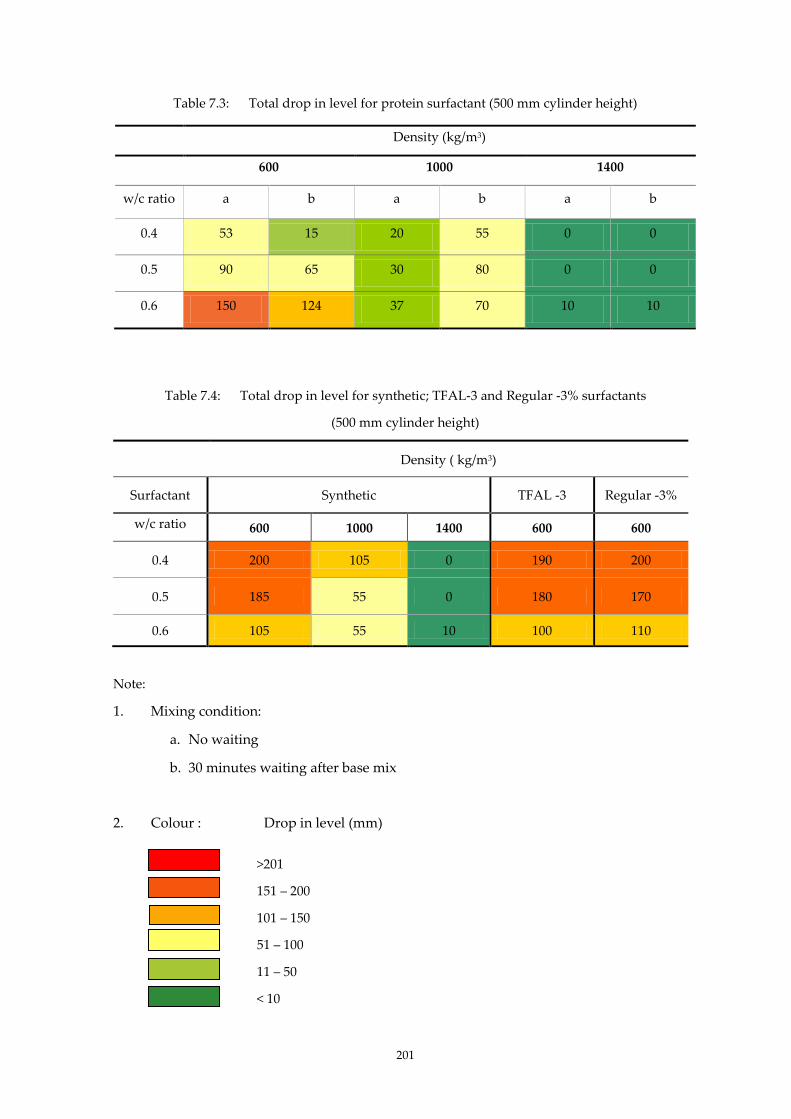
201
Table 7.3: Total drop in level for protein surfactant (500 mm cylinder height)
Density (kg/m3)
600 1000 1400
w/c ratio a b a b a b
0.4 53 15 20 55 0 0
0.5 90 65 30 80 0 0
0.6 150 124 37 70 10 10
Table 7.4: Total drop in level for synthetic; TFAL-3 and Regular -3% surfactants
(500 mm cylinder height)
Density ( kg/m3)
Surfactant Synthetic TFAL -3 Regular -3%
w/c ratio 600 1000 1400 600 600
0.4 200 105 0 190 200
0.5 185 55 0 180 170
0.6 105 55 10 100 110
Note:
1. Mixing condition:
a. No waiting
b. 30 minutes waiting after base mix
2. Colour : Drop in level (mm)
>201
151 – 200
101 – 150
51 – 100
11 – 50
< 10

202
Figure 7.9: Drop in level for foamed concrete mixes using protein surfactant in 500 mm cylinder
Figure 7.10: Drop in level for foamed concrete mixes using synthetic surfactant in 500 mm cylinder
0
50
100
150
200
250
0.40 0.50 0.60
Dro
p i
n l
evel
(m
m)
w/c ratio
Protein surfactant
600
1000
1400
Density (kg/m3)
0
50
100
150
200
250
0.40 0.50 0.60
Dro
p i
n l
evel
(m
m)
w/c ratio
Synthetic surfactant
600
1000
1400
Density (kg/m3)
203
In this experiment, a variation in mixing method was adopted to study the effect on the drop
level. Figure 7.11 shows a variation in mixing method using a protein surfactant. In mixing
condition B, the base mix was left for 30 minutes before including the foam. The hypothesis
was to investigate whether the resultant mix was more stable and, thus, leading to less drop in
level. As shown in Figure 7.11, in all three densities, there was no obvious trend evident
between the two parameters of mixing method and drop in level. In density 600 kg/m3,
mixing condition B resulted in a drop in level. In density 1000 kg/m3, mixing condition B
increased this drop further whilst no change in level was observed with the density 1400
kg/m3 density concretes across the two mixing methods. After 30 minutes, the base mix
became highly alkaline and also rich in divalent (Ca) ions. Additionally, within this 30 minute
period, the base mix precipitated, which would help stabilise the bubbles. The precise way in
which the delay in adding the foam had any effect on the stability was not fully understood.
This is a point for potential further investigation, in particular, by looking into the chemistry
of the foamed concretes with relation to effect of pH values, surfactant concentrations and
precipitations to the bubble walls and stability.
In another variation using protein surfactant, calcium chloride (CaCl2) was added to the mix at
2% and 4% of cement content. Calcium chloride was known to be the most common
accelerator for typical concretes over many decades, although its use had serious effects in
promoting corrosion of the steel reinforcement. In the current study, calcium chloride was
included to investigate the theoretical approach regarding how accelerated setting times may
stabilise and reduce drop in level. The additional Ca2+ ions added to the calcium from the
cement accelerate reactions. The results in Figure 7.12 show a reduction in dropped level
when 2% was added and a further reduction that resulted when using 4% CaCl2. This is
expected because calcium chloride accelerated the setting times.
In a further experiment to investigate the relationship between smaller bubbles and instability,
a wetting agent was added to the foamed concrete mixes. As explained in Chapter 6, the
addition of a wetting agent reduced the bubbles’ sizes (Figures 6.21 to 6.25). Figure 7.13
compared the microstructure of foamed concrete density 600 kg/m3 without any wetting agent
with using 1% wetting agent. Since smaller bubbles drain at a slower rate compared to bigger
bubbles, theoretically, this may result in more stable mixes. As shown in Figure 7.14, the
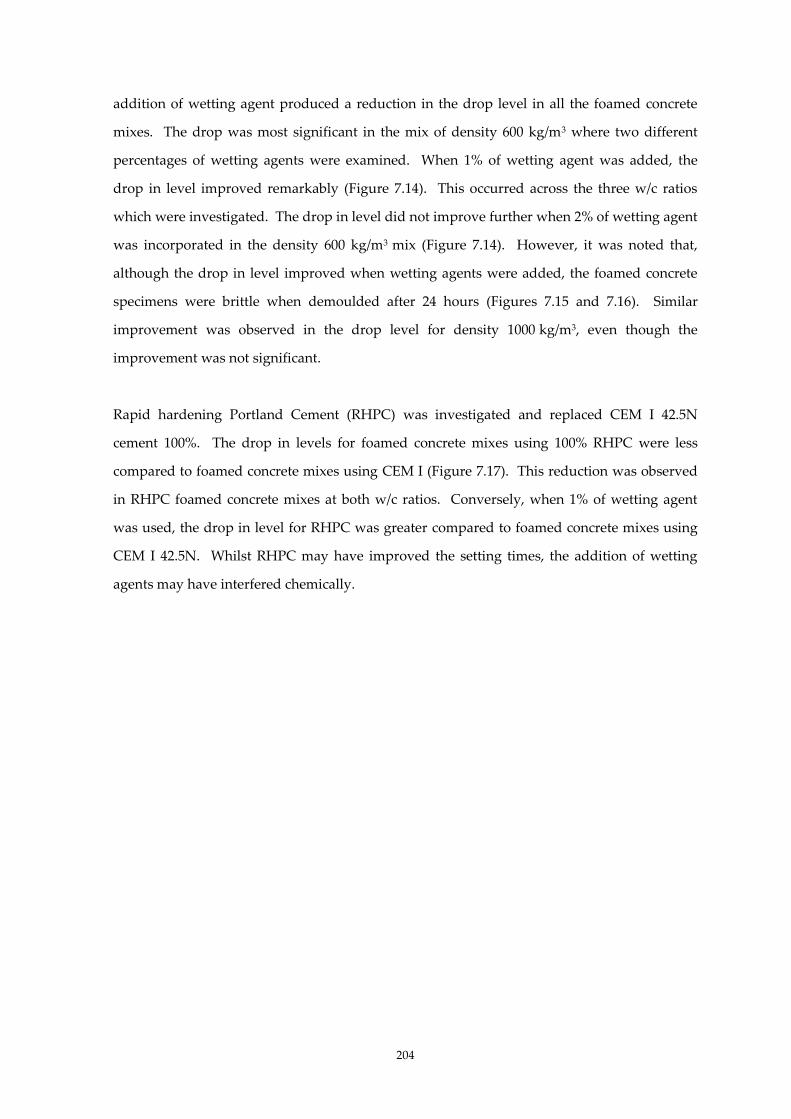
204
addition of wetting agent produced a reduction in the drop level in all the foamed concrete
mixes. The drop was most significant in the mix of density 600 kg/m3 where two different
percentages of wetting agents were examined. When 1% of wetting agent was added, the
drop in level improved remarkably (Figure 7.14). This occurred across the three w/c ratios
which were investigated. The drop in level did not improve further when 2% of wetting agent
was incorporated in the density 600 kg/m3 mix (Figure 7.14). However, it was noted that,
although the drop in level improved when wetting agents were added, the foamed concrete
specimens were brittle when demoulded after 24 hours (Figures 7.15 and 7.16). Similar
improvement was observed in the drop level for density 1000 kg/m3, even though the
improvement was not significant.
Rapid hardening Portland Cement (RHPC) was investigated and replaced CEM I 42.5N
cement 100%. The drop in levels for foamed concrete mixes using 100% RHPC were less
compared to foamed concrete mixes using CEM I (Figure 7.17). This reduction was observed
in RHPC foamed concrete mixes at both w/c ratios. Conversely, when 1% of wetting agent
was used, the drop in level for RHPC was greater compared to foamed concrete mixes using
CEM I 42.5N. Whilst RHPC may have improved the setting times, the addition of wetting
agents may have interfered chemically.
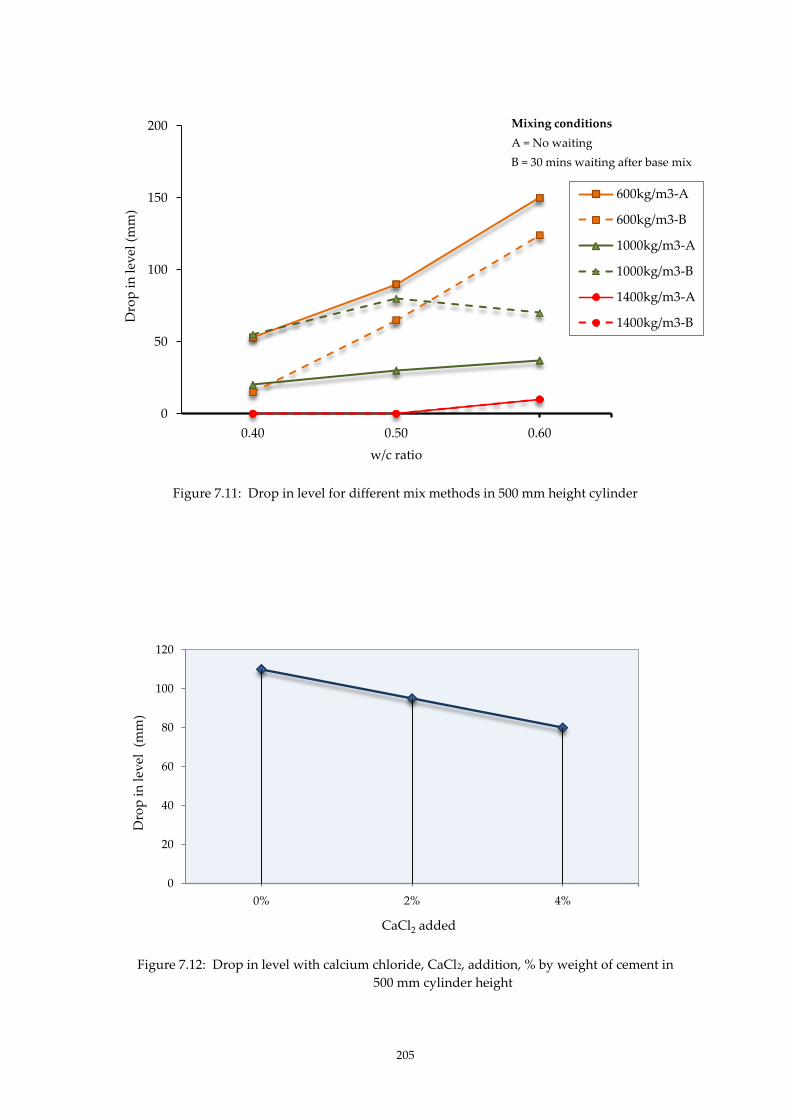
205
Figure 7.11: Drop in level for different mix methods in 500 mm height cylinder
Figure 7.12: Drop in level with calcium chloride, CaCl2, addition, % by weight of cement in
500 mm cylinder height
0
50
100
150
200
0.40 0.50 0.60
Dro
p i
n l
evel
(m
m)
w/c ratio
600kg/m3-A
600kg/m3-B
1000kg/m3-A
1000kg/m3-B
1400kg/m3-A
1400kg/m3-B
Mixing conditions
A = No waiting
B = 30 mins waiting after base mix
0
20
40
60
80
100
120
0% 2% 4%
Dro
p i
n l
evel
(m
m)
CaCl2 added
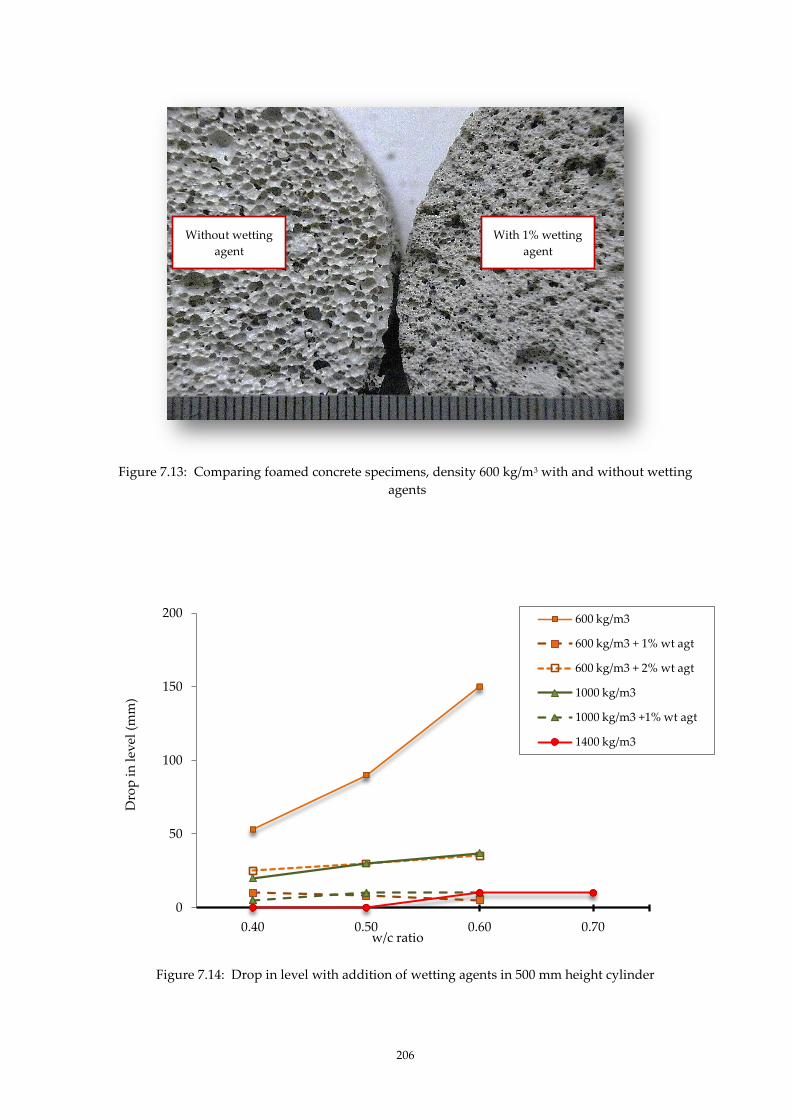
206
Figure 7.13: Comparing foamed concrete specimens, density 600 kg/m3 with and without wetting
agents
Figure 7.14: Drop in level with addition of wetting agents in 500 mm height cylinder
0
50
100
150
200
0.40 0.50 0.60 0.70
Dro
p i
n l
evel
(m
m)
w/c ratio
600 kg/m3
600 kg/m3 + 1% wt agt
600 kg/m3 + 2% wt agt
1000 kg/m3
1000 kg/m3 +1% wt agt
1400 kg/m3
Without wetting
agent
With 1% wetting
agent
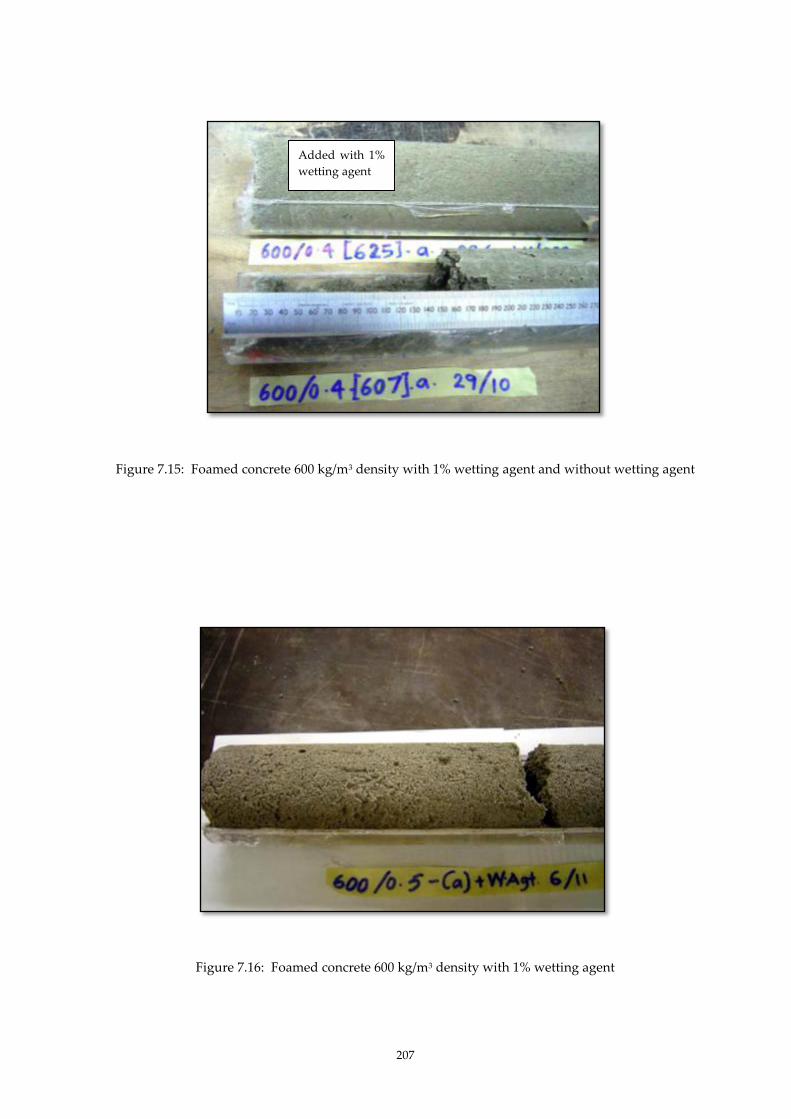
207
Figure 7.15: Foamed concrete 600 kg/m3 density with 1% wetting agent and without wetting agent
Figure 7.16: Foamed concrete 600 kg/m3 density with 1% wetting agent
Added with 1%
wetting agent
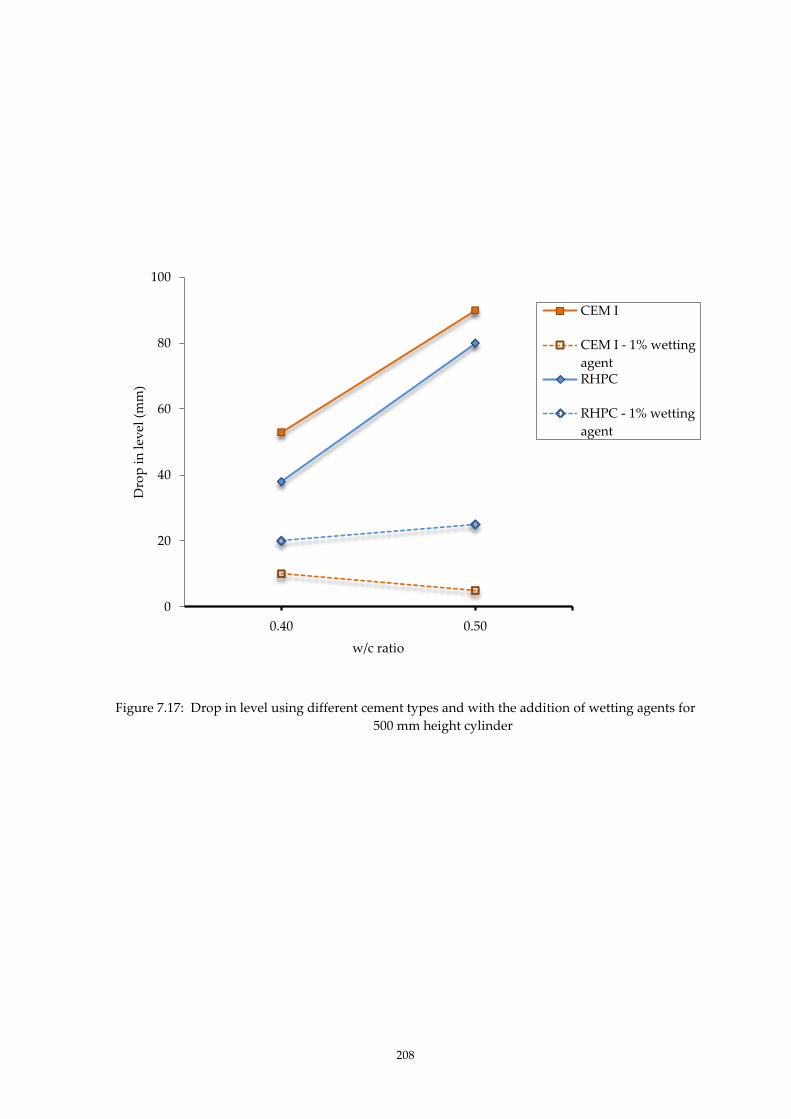
208
Figure 7.17: Drop in level using different cement types and with the addition of wetting agents for
500 mm height cylinder
0
20
40
60
80
100
0.40 0.50
Dro
p i
n l
evel
(m
m)
w/c ratio
CEM I
CEM I - 1% wetting
agent RHPC
RHPC - 1% wetting
agent

209
7.3.3. Set 2
In Set 2, different constituent materials were used to assess the effect of differing fineness and
variation in the proportions of particles on instability. In the first study in Set 2, different
cement types were employed. When 30% of the CEM I 42.5N was replaced with fine fly ash,
(FAf) the total cementitious materials were finer compared to the mixes that used CEM I 42.5N
only. This is because fly ash was much finer compared to CEM I 42.5N. The fineness of the
cements was increased further using 20% metakaolin in replacement of CEM I 42.5N; this
produced no drop in level. This part of the study sought to investigate the hypothesis
concerning cement fineness and instability, namely, finer cements reduced the drop in level;
thus increased in stability.
As shown in Figure 7.17, the percentage drop in the initial concrete decreased as cement
fineness increased. Thus, this current research supported the hypothesis that increased in
cement fineness improved stability. In this theory, the fineness of the cement plays a
significant part in protecting the bubbles. The presence of high fineness cement particles
‘stabilises’ the bubbles by distributing bubbles into smaller sizes and protecting the bubbles
from coalescing.
In a further study, fillers of different fineness were examined. Fifty per cent of sand was
replaced with coarse fly ash (FAc). The percentage drop in level was reduced compared to
concretes with sand only (Figure 7.18). When 100% sand was replaced with FAc, the
percentage drop in level increased further. This phenomenon can be explained by the effect of
finer pores on instability, akin to the effect of cement fineness. When the fillers were coarse
for example, as with sand, the bubbles clustered and formed irregular pores that were large
and irregular. When finer fillers were employed, there was a better distribution of bubbles,
disallowing the bubbles to expand, which resulted in more stable mixes.
As part of the objective of studying the effects of other parameters, various cylinder heights
were used for two foamed concrete mixes of different densities of 300 kg/m3 and 600 kg/m3 at
w/c ratio 0.50. In all cylinder heights, the lower density, 300 kg/m3 had a higher percentage
drop in level compared to foamed concrete mix of 600 kg/m3 density. Higher cylinder heights
produced a higher percentage drop in level in both densities (Figure 7.19).
210
Several theories have emerged regarding the high percentage drop in density 300 kg/m3. In
low density concretes, the percentages of solids were lower compared to the percentage of
foam, which allowed the bubbles to expand. In contrast, higher density concretes had more
filler which confined the bubbles from expanding. The high foam percentage allowed the
bubbles to coalesce easily. The bubbles adjoined each other, amalgamated and formed bigger
bubbles. When more bubbles grew at the expense of smaller bubbles, the bubbles ruptured as
they exceeded the ‘critical wall’ thickness. This resulted in more drainage compared to higher
densities.
The cause for higher percentage drop in tall cylinders can be multifactorial, namely, increased
pressure due to height, amount of foam and its effect on stiffening and drainage times. The
pressure exerted by a static fluid depends on the depth of the fluid, since density and
acceleration due to gravity are constant. In the cylinder, the pressure at any particular depth
depends on the height of the mix above that point; thus, taller cylinders induced more
pressure. The amount of foam incorporated into the mix has an effect on stiffening time of
foamed concrete. Lower density, means a higher percentage of foam and has longer stiffening
time (since foaming agents have retarding properties). During the hydration process, the
foam bubbles were initially ‘active’; the gravitational force caused the fluid to drain
downwards and the bubbles to move upwards. Subsequently, the liquid phase progressed to
‘gelling up’ phase which resulted in the slow-moving bubbles. Eventually the ‘gelling up’
phase shifted to the solid phase where the whole matrix hardened. Hypothetically, when the
stiffening time was delayed, the progression continued longer which resulted in more
drainage.
7.3.4. Set 3
In Set 3, low density 300 kg/m3 concrete was investigated with two blends of cement mixes;
and for a single 0.50 w/c ratio. The first blend was 52.5 grade Portland Cement (CEM I 52.5R)
with Calcium Sulfoaluminate (CSA) and the second blend was CSA and fine fly ash (FAf). All
combination ratios of CEM I 52.5R and CSA produced between 0-5 percent drop in level, an
indication of stable mixes (Figure 7.20). Unlike the previous studies Sets 1 and 2, which used
grade 42.5N Portland Cement, in this study, CEM I 52.5R was employed. CEM I 52.5R is a
211
rapid setting type cement. The objective was to accelerate the hardening times before the
bubbles started to rupture rapidly as investigated previously, in section 7.3.2, using rapid
hardening Portland cement (RHPC) and mixes which included calcium chloride.
Additionally, CSA cements were employed because of their expansive properties. When CSA
cements hydrates, large ettringite needles were formed, thus filling up the spaces. The blend
of CEM I 52.5R and CSA resulted in stable mixes.
In the second blend of CSA and fine fly ash, FAf, variations in proportions and w/c ratios were
examined in relation to the rheological properties of the mixes. The objective was to study the
effect of CSA replacement with FAf, at different proportions. All the mixes were stable, with
drop in level of less than 5% (Table 7.5). From this observation it was found that CSA was
effective in sustaining stability even when replaced with FAf at different proportions and w/c
ratios.
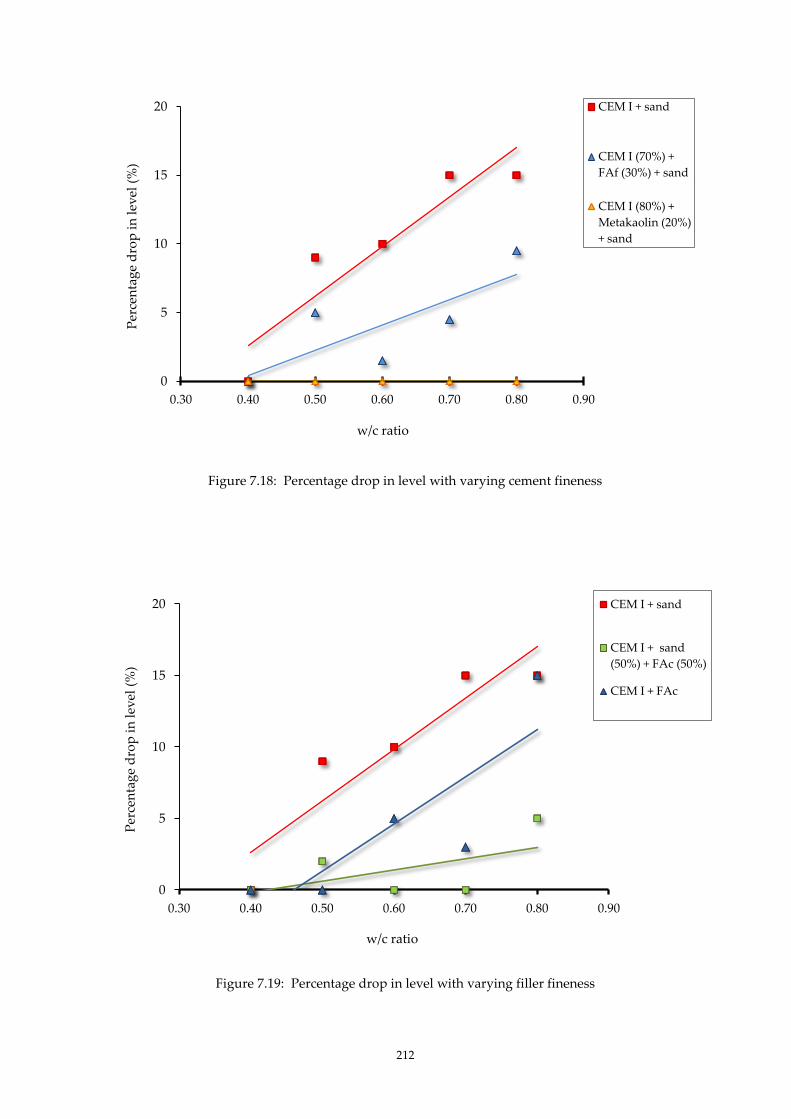
212
Figure 7.18: Percentage drop in level with varying cement fineness
Figure 7.19: Percentage drop in level with varying filler fineness
0
5
10
15
20
0.30 0.40 0.50 0.60 0.70 0.80 0.90
Per
cen
tag
e d
rop
in
lev
el (
%)
w/c ratio
CEM I + sand
CEM I (70%) +
FAf (30%) + sand
CEM I (80%) +
Metakaolin (20%)
+ sand
0
5
10
15
20
0.30 0.40 0.50 0.60 0.70 0.80 0.90
Per
cen
tag
e d
rop
in
lev
el (
%)
w/c ratio
CEM I + sand
CEM I + sand
(50%) + FAc (50%)
CEM I + FAc

213
Figure 7.20: Percentage drop for various cylinder heights
Figure 7.21: Percentage maintained in level for CEM I 52.5R/CSA blend
0
10
20
30
40
50
60
70
70 100 200 300 500
300 kg/m3
600 kg/m3
Per
cen
tag
e d
rop
in
lev
el (
%)
Cylinder heights (mm)
0
20
40
60
80
100
100/0 50/50 60/40 70/30 80/20 90/10 0/100
Per
cen
tag
e m
ain
tain
ed i
n l
evel
(%
)
CEM I /CSA
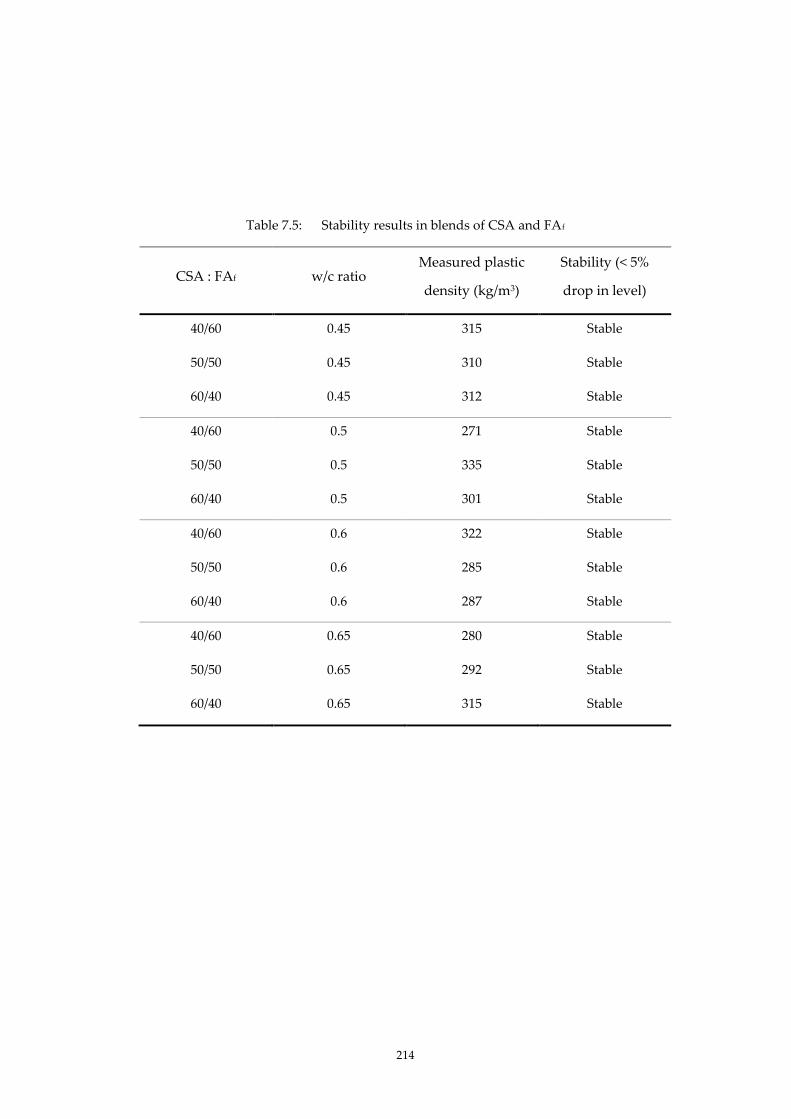
214
Table 7.5: Stability results in blends of CSA and FAf
CSA : FAf w/c ratio Measured plastic
density (kg/m3)
Stability (< 5%
drop in level)
40/60 0.45 315 Stable
50/50 0.45 310 Stable
60/40 0.45 312 Stable
40/60 0.5 271 Stable
50/50 0.5 335 Stable
60/40 0.5 301 Stable
40/60 0.6 322 Stable
50/50 0.6 285 Stable
60/40 0.6 287 Stable
40/60 0.65 280 Stable
50/50 0.65 292 Stable
60/40 0.65 315 Stable
215
7.4 SUMMARY OF RESULTS
The aim of the current study was to investigate the effects of a range of parameters which
included densities, w/c ratios and variations of materials to find the causes of instability in
foamed concrete. The empirical results reveal a multitude of possible defined factors affecting
the instability of foamed concrete mixes. These results are linked to other studies; rheological
properties and the microstructure of the foamed concrete and the relationship will be
discussed further in Chapter 8: Analysis and Discussion.
There were four sets of tests; dropout tests, Set 1, Set 2 and Set 3. The main Portland Cement
used in Set 1 and 2 was grade CEM I 42.5N whilst Set 3 used grade CEM I 52.5R.
1. Dropout tests
In the dropout tests, the drainage from neat bubbles was measured. In neat bubbles,
coarsening and draining cause coalescence, which leads to collapse of the bubbles. However,
it is not clear whether there exists a similar pattern in the characteristics of the neat foam
bubbles and the bubbles formed in the foamed concrete. The variations in this section of the
study included two different types of surfactants and different mixing and draining
conditions. For these tests, the significant outcomes were:
a. The dropout from protein surfactants produced less dropout compared to synthetic
surfactants, which was an indication of stronger bubbles.
b. The external temperature and relative humidity played a role in bubbles collapsing.
High temperature induced bubbles to collapse at a faster rate. The use of deionised
water decelerated bubble collapse as indicated by least drainage.
216
2. Set 1
Using the same basic constituent materials, the variations in Set 1 included variation in the
surfactants, densities and w/c ratios, the addition of wetting agent, calcium chloride, slight
differences in mixing method and replacement of CEM I 42.5N with RHPC. The significant
outcomes arose from this set were:
a. Foamed concrete mixes from synthetic surfactants had higher drop in level compared to
foamed concrete mixes from protein surfactant.
b. The higher densities; 1000 kg/m3 and 1400 kg/m3 were more stable compared to lower
density, 600 kg/m3. In 600 kg/m3, the drop was highest at w/c ratios 0.40.
c. There was no obvious pattern in the drop, when another variation of mixing method
was adopted (30 minutes delay in adding preformed foam).
d. The addition of CaCl2 and wetting agents improved the drop in level; although the latter
produced a ‘weaker’ foamed concrete.
e. Rapid hardening Portland Cement (RHPC) improved the drop in level but not with
inclusion of a wetting agent.
3. Set 2
In Set 2, the main variations were the differing cementitious which was achieved by replacing
percentages of the main CEM I 42.5N with other cement types; FAf and metakaolin. Similarly,
the fineness of the fillers was also varied by replacing sand with FAc at different percentages.
From this part of the investigation, the significant results were:
a. The drop in level improved when the fineness of cementitious materials increased.
b. The drop in level improved when the fineness of fillers increased.
c. Lower density, 300 kg/m3 had a higher percentage drop compared to higher density,
600 kg/m3.
d. Taller cylinders produced a bigger drop compared to shorter cylinders.

217
4. Set 3:
In Set 3, there were 2 parts of study using blended cements. The first was of blends of CSA
cement with CEM I 52.5R at 0.50 w/c ratio at different percentages and the second was of
blends of CSA with FAf at varying w/c ratios (0.45 to 0.65) and three different percentage
blends. The significant outcome from this study was:
a. Cement blends of CEM I 52.5R and CSA produced stable foamed concrete at varying
proportions which resulted in small drop (less than 5 percent).
b. Cement blends of CSA and FAf at w/c ratios ranging between 0.45 to 0.65 at varying
proportions resulted in a small drop (less than 5 percent), which dramatically improved
stability at low density, 300 kg/m3.
218
CHAPTER 8: ANALYSIS AND DISCUSSION
8.1 INTRODUCTION
This study comprised two phases: Phase 1 was intended to investigate the possibility of
foamed concrete being used as a structural element while Phase 2 complemented the pilot
study. The initial target of the study in Phase 1 was to confirm the status of foamed concrete
as a structural material. The aim was to improve the serviceability limit and reduce deflection,
which was achieved by post-tensioning. Glass-fibre reinforced polymer rod (GFRP) was used
to post-tension the beams because of its compatibility with foamed concrete. However, the
outcome of the first load test was not as expected and there was a high deflection on the first
crack. This unanticipated occurrence was not related to the foamed concrete as a material, but
it was identified as a problem with the reinforcement. Nevertheless, there was a positive
outcome to this test in that initial readings indicated that foamed concrete was behaving in a
predictable manner when it hogged and sagged with added stress by the tensioned bar. This
action suggested that it is possible to produce post-tensioned foamed concrete with improved
reinforcement. The minimum strength of 25 MPa, a criterion for foamed concrete to be
accepted as structural material, was achievable with density 1500 kg/m3 at 96 days using fly
ash. No attempt was made to increase the density, as lightweight aggregate concrete would
have provided a more suitable method for this to be achieved.
Following this episode, a different approach was taken to study the fundamental aspects of
foamed concrete. The focus of the research was diverted to understanding the behaviour and
characteristics. These objectives remain within the spectrum of exploring the potential of
foamed concrete. This research was based upon the intriguing characteristics relating to the
rheological properties of foamed concrete, the microstructure of the material and their effects
on the stability, which served as the ultimate criterion. In view of the fact that the
construction industry was moving towards using foamed concrete of lower densities, it was
logical to complement movement within the industry on this use. Achieving densities lower
than 600 kg/m3 poses a technical challenge with regard to stability while maintaining
flowability.
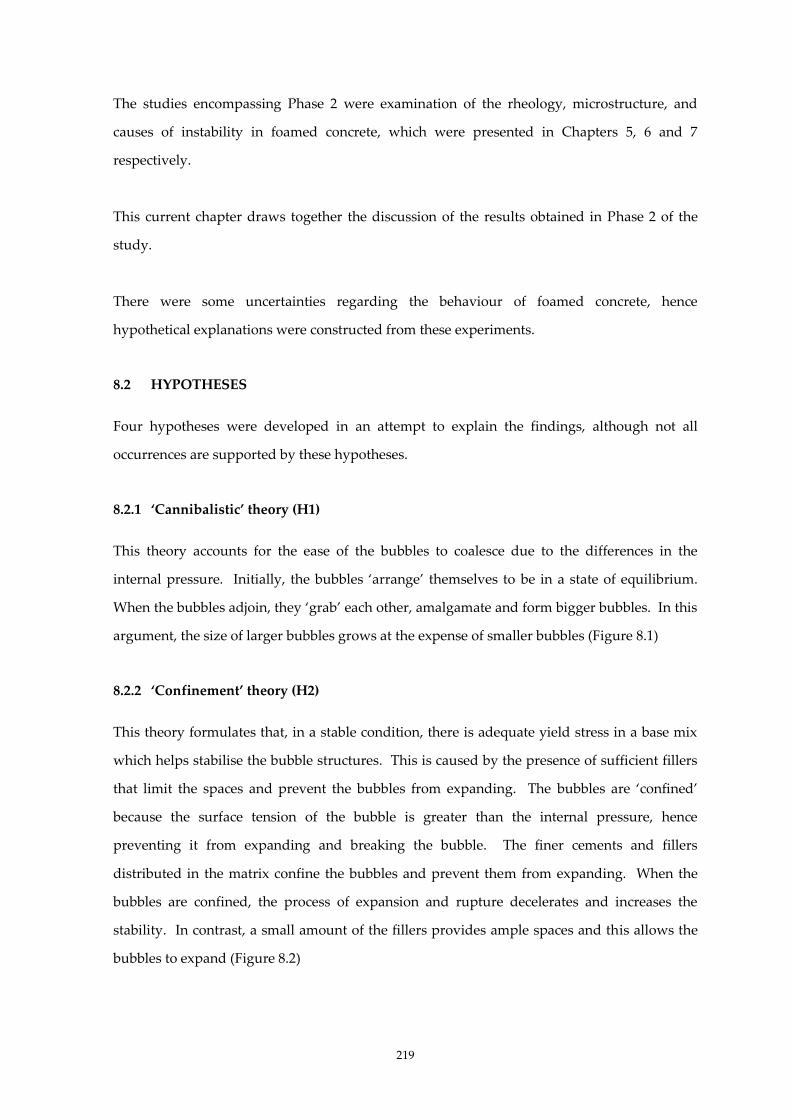
219
The studies encompassing Phase 2 were examination of the rheology, microstructure, and
causes of instability in foamed concrete, which were presented in Chapters 5, 6 and 7
respectively.
This current chapter draws together the discussion of the results obtained in Phase 2 of the
study.
There were some uncertainties regarding the behaviour of foamed concrete, hence
hypothetical explanations were constructed from these experiments.
8.2 HYPOTHESES
Four hypotheses were developed in an attempt to explain the findings, although not all
occurrences are supported by these hypotheses.
8.2.1 ‘Cannibalistic’ theory (H1)
This theory accounts for the ease of the bubbles to coalesce due to the differences in the
internal pressure. Initially, the bubbles ‘arrange’ themselves to be in a state of equilibrium.
When the bubbles adjoin, they ‘grab’ each other, amalgamate and form bigger bubbles. In this
argument, the size of larger bubbles grows at the expense of smaller bubbles (Figure 8.1)
8.2.2 ‘Confinement’ theory (H2)
This theory formulates that, in a stable condition, there is adequate yield stress in a base mix
which helps stabilise the bubble structures. This is caused by the presence of sufficient fillers
that limit the spaces and prevent the bubbles from expanding. The bubbles are ‘confined’
because the surface tension of the bubble is greater than the internal pressure, hence
preventing it from expanding and breaking the bubble. The finer cements and fillers
distributed in the matrix confine the bubbles and prevent them from expanding. When the
bubbles are confined, the process of expansion and rupture decelerates and increases the
stability. In contrast, a small amount of the fillers provides ample spaces and this allows the
bubbles to expand (Figure 8.2)
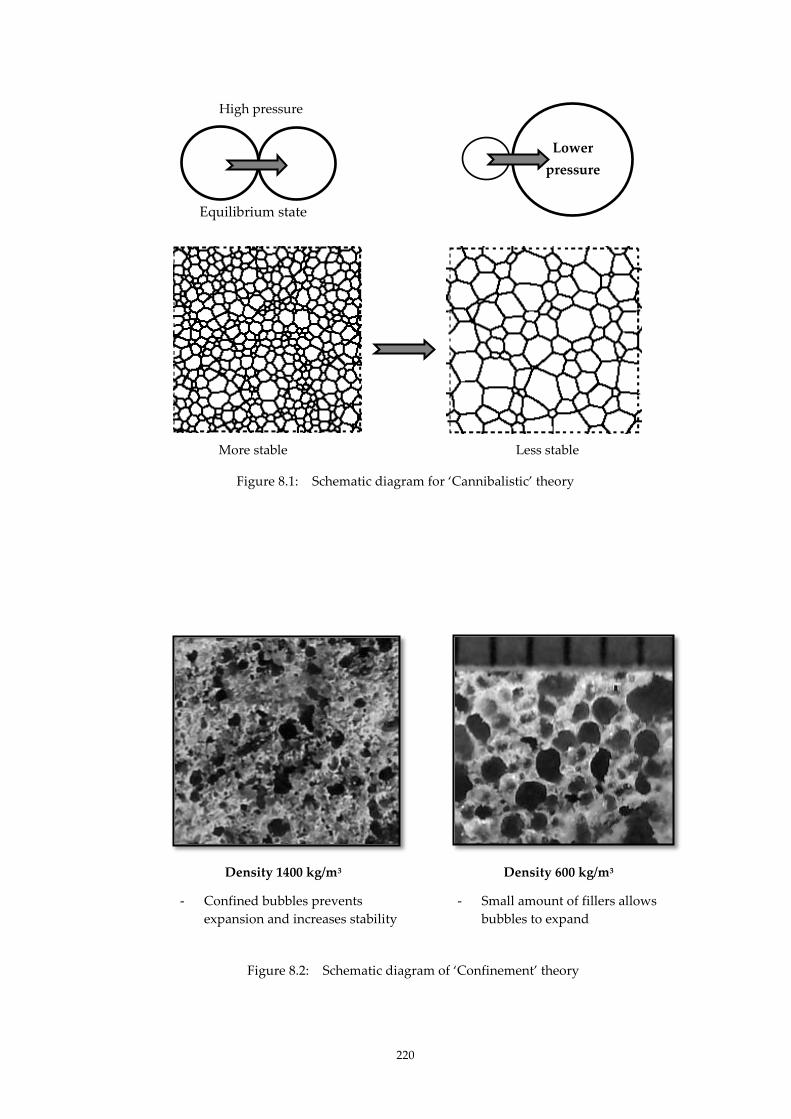
220
Equilibrium state
More stable
Less stable
Figure 8.1: Schematic diagram for ‘Cannibalistic’ theory
Density 1400 kg/m3
Density 600 kg/m3
- Confined bubbles prevents
expansion and increases stability
- Small amount of fillers allows
bubbles to expand
High pressure
Lower
pressure
Figure 8.2: Schematic diagram of ‘Confinement’ theory

221
8.2.3 ‘Cement fineness’ theory (H3)
In this theory, the fineness of the cement plays a significant part in protecting the bubbles.
The presence of high fineness cement particles ‘stabilises’ the bubbles by distributing bubbles
into smaller sizes and protecting the bubbles from coalescing (Figure 8.3).
8.2.4 ‘Hardening’ theory (H4)
The presence of cement and water induced the process of hydration. In the initial fluid phase,
the bubbles are ‘active’; the gravitational force causes the fluid to drain downwards and the
bubbles to move upwards (Figure 8.4). While this is happening, the liquid phase progresses to
a ‘gelling up’ phase which results in the bubbles becoming slow-moving. Eventually the
‘gelling up’ phase shifts to the solid phase, where the whole matrix hardens. At this juncture,
the bubble sizes and positions become fixed. Ideally, the bubbles must have a reasonably long
lifetime to withstand the processes and rupture caused by coalescence of the adjacent bubbles
and due to the surface tension gradient in the vertical direction resulting from the liquid
drainage.

222
Figure 8.3: Schematic of ‘Cement fineness’ theory
Drainage causes the liquid to drain
downwards and the bubbles to move
upwards.
The bubbles were active in the initial
fluid state, then began to progress
into the ‘gelling up’ and became slow
moving. In the solid state, the
bubbles sizes became fixed.
Figure 8.4 : Schematic diagram of ‘Hardening’ theory
Attraction of cement particles ‘stabilised’ the bubbles and prevented the bubbles
from coalescing
Dra
inag
e o
f fl
uid
223
8.3 SUMMARY OF FOAMED CONCRETE PROPERTIES
In order to establish the relationship between the properties, the individual sets of results are
summarised in each section accordingly.
8.3.1 Rheology
The first research in this set of studies was the study of foamed concrete rheology. Predictions
of the rheological behaviour of foamed concrete to different conditions and mix constituents
were uncertain because foamed concrete is a mass of concentrated dispersions of solids in
water. The rheological properties are controlled by the proximity of particles, the strength,
shape and surface properties of the particles together with the composition of the water.
Foamed concrete conforms to the Bingham model, which is defined by values of two
rheological parameters: yield stress and plastic viscosity. Yield stress is the minimum stress
required to initiate flow and plastic viscosity is the measure of the internal resistance for fluid
to flow. In this experiment, a Brookfield viscometer (two point tests) was mainly used to
obtain the yield stress and plastic viscosity values. The Dundee modified Marsh cone was also
employed to study the flowability, albeit that this is a single point test. From this experiment,
it was found that changing the densities exhibited significant variance in the rheological
values. Altering the w/c ratio had a considerable variation in the rheological values. An
increase in density induced an increase in yield stress. The high density corresponded to a
high percentage of solids and a reduced percentage in the foam/air per volume, and made it
harder to initiate flow. Lower w/c ratio at any one density induced a higher yield stress value
compared to higher w/c ratio because having less water required a higher force to initiate
flow.
Plastic viscosity increased when density increased, which implied that the internal resistance
increases with higher densities. A further, less significant, effect was that plastic viscosity
decreased with an increase in w/c ratio. Since the w/c ratio corresponds to the inter particle
distance, an increase in water content reduced the internal resistance making it less viscous.
In any one density, the mix with the highest w/c ratio showed the least plastic viscosity.
224
In a study of two densities, due to higher self-weight, the higher density gave a shorter flow
time compared to the lower density. Other factors which affected the values were the mix
constituents with different proportions and fineness. Cement fineness has an effect on the
water demand which affects flowability, thus leading to a sticky consistence or non-
flowability. When coarse fly ash replaced sand, the flow time reduced markedly, indicating
that fineness of the fillers affected flowability.
In this study, yield stress values were found to be within the range of 1.19 N/m2 to 30.50 N/m2,
the lowest value being foamed concrete with lowest density at highest w/c ratio. The
measurable range in the modified Marsh cone values ranged from less than 1 second to
approximately 3 minutes, with an acceptable value being within the range between 1 to 2
minutes. Corresponding to this flowable range, the yield stress was found to be between 6.0
and 8.5 N/m2.
8.3.2 Microstructure
The second study focussed on observing the microstructure, which was expected to influence
its characteristics. The motivation for the current research was to identify the governing
factors which induced some phenomenon and their relationships with other properties.
However, the characterisation was not easy because the microstructure was complex and
heterogeneous. Improvements in microscopy techniques have provided new insights into the
microstructure of foamed concrete, giving a better understanding of the material. Adopting
the advances in imaging technology, coupled with user-friendly software ImageJ, digital
analysis of the air void system was attempted, even though the values were not definitive.
Where it was not possible due to the nature of the specimens, visual analysis was attainable.
Several observations were made with regard to this second study. The properties of the
bubbles were governed by few parameters. The surfactant was the key factor in the types of
bubbles generated. Bubbles produced from a protein surfactant were more defined, not
connected and closed cell. In contrast, those produced using synthetic surfactants were more
open, had ‘holes in hole’ and were undefined. Within the same surfactant type, the most
significant finding was that density had the greatest effect on the bubbles sizes. An increase in
density resulted in a decrease in bubble size and increased bubbles counts, which can be
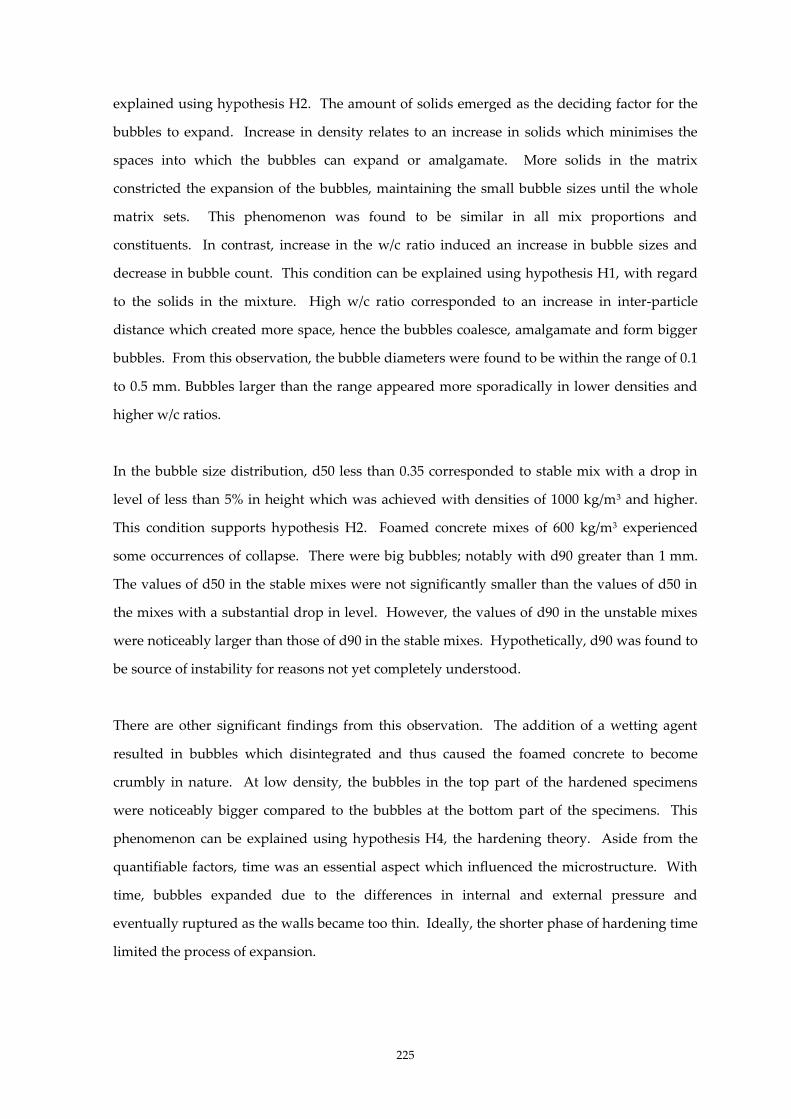
225
explained using hypothesis H2. The amount of solids emerged as the deciding factor for the
bubbles to expand. Increase in density relates to an increase in solids which minimises the
spaces into which the bubbles can expand or amalgamate. More solids in the matrix
constricted the expansion of the bubbles, maintaining the small bubble sizes until the whole
matrix sets. This phenomenon was found to be similar in all mix proportions and
constituents. In contrast, increase in the w/c ratio induced an increase in bubble sizes and
decrease in bubble count. This condition can be explained using hypothesis H1, with regard
to the solids in the mixture. High w/c ratio corresponded to an increase in inter-particle
distance which created more space, hence the bubbles coalesce, amalgamate and form bigger
bubbles. From this observation, the bubble diameters were found to be within the range of 0.1
to 0.5 mm. Bubbles larger than the range appeared more sporadically in lower densities and
higher w/c ratios.
In the bubble size distribution, d50 less than 0.35 corresponded to stable mix with a drop in
level of less than 5% in height which was achieved with densities of 1000 kg/m3 and higher.
This condition supports hypothesis H2. Foamed concrete mixes of 600 kg/m3 experienced
some occurrences of collapse. There were big bubbles; notably with d90 greater than 1 mm.
The values of d50 in the stable mixes were not significantly smaller than the values of d50 in
the mixes with a substantial drop in level. However, the values of d90 in the unstable mixes
were noticeably larger than those of d90 in the stable mixes. Hypothetically, d90 was found to
be source of instability for reasons not yet completely understood.
There are other significant findings from this observation. The addition of a wetting agent
resulted in bubbles which disintegrated and thus caused the foamed concrete to become
crumbly in nature. At low density, the bubbles in the top part of the hardened specimens
were noticeably bigger compared to the bubbles at the bottom part of the specimens. This
phenomenon can be explained using hypothesis H4, the hardening theory. Aside from the
quantifiable factors, time was an essential aspect which influenced the microstructure. With
time, bubbles expanded due to the differences in internal and external pressure and
eventually ruptured as the walls became too thin. Ideally, the shorter phase of hardening time
limited the process of expansion.

226
With regard to rheology, the bubble size was smaller with higher yield stress. In summary,
bubble size was found to be a function of yield stress, plastic viscosity, material fineness and
surfactant types.
8.3.3 Instability
The results from the experiments on rheology and microstructure contribute to the findings on
foamed concrete instability, which is the subject of the next study. In this study, instability
was assessed by observing the drop in level of the foamed concrete surface. Instability was
found to be affected by a variety of factors.
In the initial dropout tests, temperature was the most significant factor, where the highest
dropout was found under higher temperature conditions. Increase in temperature reduced
the surface tension of bubbles and encouraged collapse. In contrast, the least dropout resulted
from the use of deionised water, particularly because the impurities were removed. However,
there was no evidence to correlate the characteristics of the neat foam bubbles to the bubbles
formed in the foamed concrete. It was obvious that a protein surfactant produced less
dropout than a synthetic surfactant, the justification for which is stronger, more stable and
smaller bubbles with closed cell structure compared to those of synthetic surfactants.
In a variation of densities and w/c ratios, within a set of constituent materials, stability
increased with an increase in density, which can be explained using hypothesis H2. The high
percentage of solids in high density limited space and restricted the bubbles from expanding,
which resulted in slower rupture. In contrast, a small amount of the fillers provided ample
spaces to allow the bubbles to expand and coalesce easily. When the bubbles adjoined,
amalgamated and formed bigger bubbles, larger bubbles grew at the expense of smaller
bubbles, which supported hypothesis H1.
The variation of drop in level was not significant when the w/c ratio changed within the
selected range. Within the same set, slight variation of mixing method did not improve the
drop in level. However, when calcium chloride was added to the cement, the drop in level
improved slightly, but the foamed concrete was more brittle. Similarly, slight improvement in
the drop in level was observed with the use of Rapid Hardening Portland cement, an

227
indication of the effect of hardening times. When the fineness of the constituent materials was
increased, the drop in level decreased; indicating an improvement in stability. These
phenomena can be explained by hypothesis H3. However, the use of metakaolin improved
stability, but the mix suffered flowability issues because the surface area was too high and
produced a sticky mix in lower w/c ratio.
In tall cylinders, higher percentage drop was linked to the exerted pressure which increased
with depth. The gravitational force caused the fluid to drain downwards and the bubbles to
move upwards which is greater in tall cylinders compared to short cylinders. The progression
led from liquid phase to ‘soft solid’ phase and eventually to solid phase where the whole
matrix hardened. This supports hypothesis H4.
In an entirely new set, cement types CEM I 52.5R cement and CSA dramatically improved
stability. The blends of CEM I 52.5R, a rapid setting type cement and CSA cements produced
stable mixes since they have expansive properties. The blends included replacement with
percentages of FAf; sustained stability even at low density, 300 kg/m3. This added further
weight to hypothesis H4. This discovery demonstrated that hardening time is a dominant
factor.
8.4 RELATIONSHIP BETWEEN RHEOLOGICAL PROPERTIES AND
MICROSTRUCTURE
This study shows that the bubble sizes are related to the rheological properties of foamed
concrete. When the bubble sizes are tabled against yield stress and plastic viscosity, the
existence of a relationship between these values is observed (Table 8.1). This empirical data
was obtained from the same constituent materials, hence omitting other possible factors such
as effect of fineness and hardening time. It is most striking that, in general, the bubble sizes
reduced when the yield stress increased, as shown in Figure 8.5. The yield stress values,
which corresponded to an acceptable flowability between 1 to 2 minutes, lie between 6.0 N/m2
to 8.5 N/m2. The corresponding bubble sizes are between 0.33 to 0.35 mm in diameter.
Increase in yield stress and plastic viscosity reduced the bubble sizes although the effect of
yield stress is more significant (Figure 8.6). Within the same density, the lower w/c ratio
corresponded to smaller bubble sizes compared to higher w/c ratio.
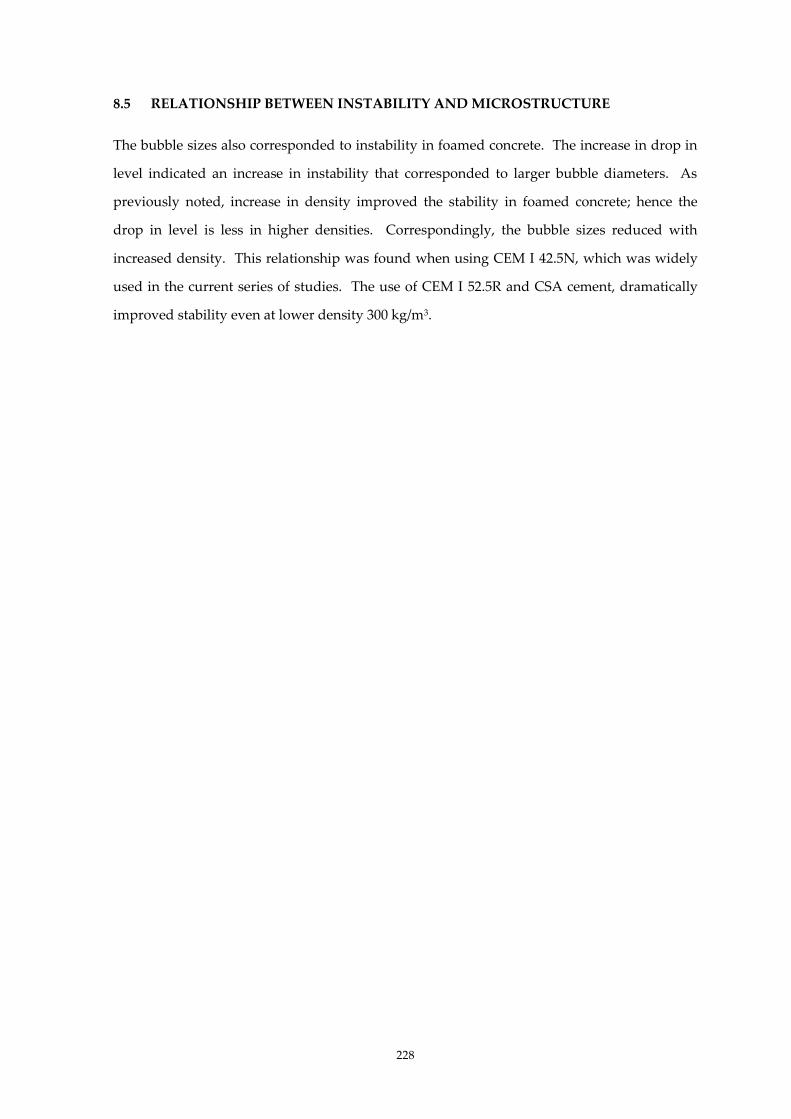
228
8.5 RELATIONSHIP BETWEEN INSTABILITY AND MICROSTRUCTURE
The bubble sizes also corresponded to instability in foamed concrete. The increase in drop in
level indicated an increase in instability that corresponded to larger bubble diameters. As
previously noted, increase in density improved the stability in foamed concrete; hence the
drop in level is less in higher densities. Correspondingly, the bubble sizes reduced with
increased density. This relationship was found when using CEM I 42.5N, which was widely
used in the current series of studies. The use of CEM I 52.5R and CSA cement, dramatically
improved stability even at lower density 300 kg/m3.

229
Table 8.1: Relationship between bubble sizes and rheological properties
DENSITY
600 kg/m3 1000 kg/m3 1400 kg/m3
w/c
ratio
Yield
stress
Plastic
viscosity
Bubble
diameter
Yield
stress
Plastic
viscosity
Bubble
diameter
Yield
stress
Plastic
viscosity
Bubble
diameter
(N/m2) (Ns/m2) (mm) (N/m2) (Ns/m2) (mm) (N/m2) (Ns/m2) (mm)
0.4 7.6 0.11 0.41 16.8 0.66 0.23 52.8 1.18 0.16
0.5 3.7 0.09 0.43 11.0 0.33 0.28 43.6 1.07 0.18
0.6 01.8 0.08 0.47 2.6 0.29 0.33 21.8 0.85 0.21
Figure 8.5: Bubble sizes against yield stress
0
0.1
0.2
0.3
0.4
0.5
0 10 20 30 40 50 60
Bu
bb
le d
iam
eter
s (m
m)
Yield stress (N/m2)
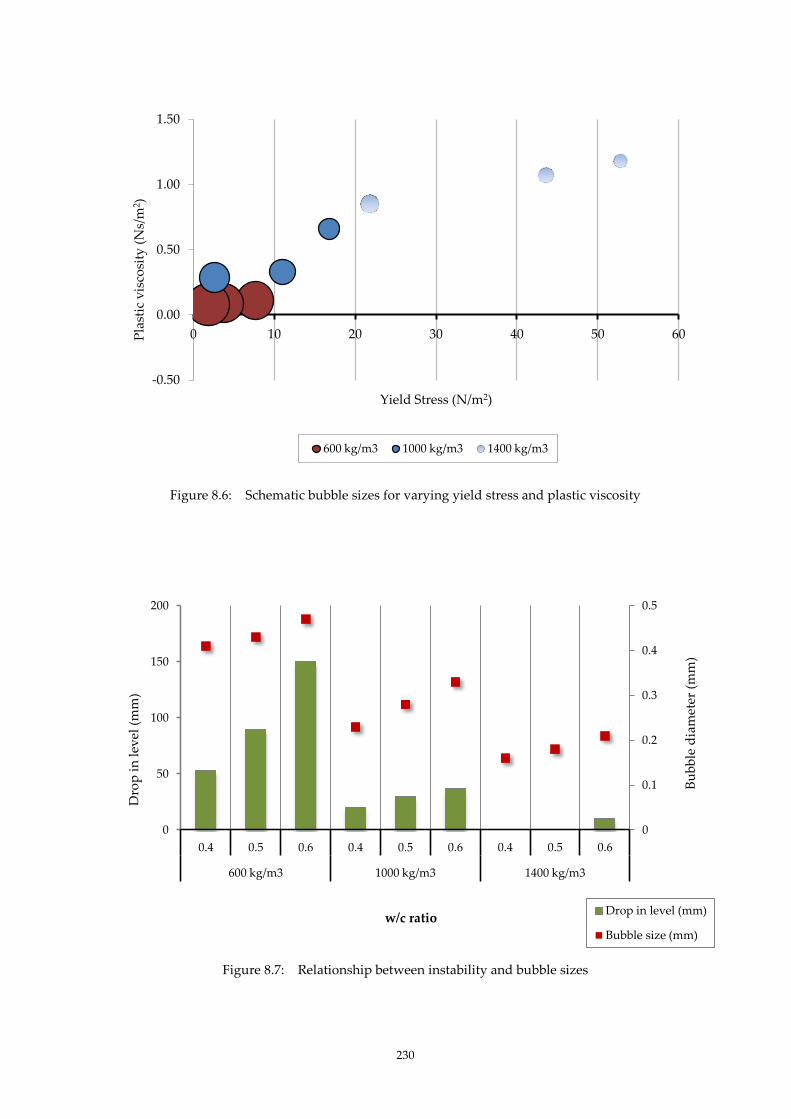
230
Figure 8.6: Schematic bubble sizes for varying yield stress and plastic viscosity
Figure 8.7: Relationship between instability and bubble sizes
-0.50
0.00
0.50
1.00
1.50
0 10 20 30 40 50 60 Pla
stic
vis
cosi
ty (
Ns/
m2 )
Yield Stress (N/m2)
600 kg/m3 1000 kg/m3 1400 kg/m3
0
0.1
0.2
0.3
0.4
0.5
0
50
100
150
200
0.4 0.5 0.6 0.4 0.5 0.6 0.4 0.5 0.6
600 kg/m3 1000 kg/m3 1400 kg/m3
Bu
bb
le d
iam
eter
(m
m)
Dro
p i
n l
evel
(m
m)
w/c ratio Drop in level (mm)
Bubble size (mm)

231
8.6 CONCEPTUAL DEVELOPMENT TIMELINE
From these relationships, using stability of the foamed concrete as the ultimate criterion, it is
possible to predict the stability of the foamed concrete by controlling the rheological
properties and hardening time.
Foamed concrete mixes exhibit yield stress because the network of attractive particle
interactions allows the suspension to support finite amount of stress without flowing. With
time, rheological effect took place, where the bubbles coalesced, expanded and amalgamated
(B1), as shown conceptually in the development timeline diagram (Figure 8.8). The
progression induced bigger bubbles with thinner bubble walls which were no longer aqueous
but have mixed with cement particles. This effect is multiplied by liquid drainage which
resulted from the surface tension differences. With ‘improved’ condition, the pattern B2 is
attainable by employing selected constituent materials and mix proportions.
The complex hydration of cement is continuous, where the rate changes with time. Increased
time produced continual processes of bubbles expanding. With reduced hardening time, they
are reduced and the rheological effect is minimised. This condition was achieved using CSA
and CEM I 52.5R where the hardening time was shortened drastically (B3).
The bubbles typically have a limited lifetime where the strength decreased rapidly (shown as
S1). With ‘improved’ intrinsic characteristics, smaller initial size, strong walls and sustainable
strength, S2 is the ideal pattern of decreasing strength bubbles which allows the bubble to
support its own weight for a longer duration until the whole matrix hardens. Inappropriate
techniques of mixing and placing before setting may affect the air-void system and interfere
with the stability of air-void system.
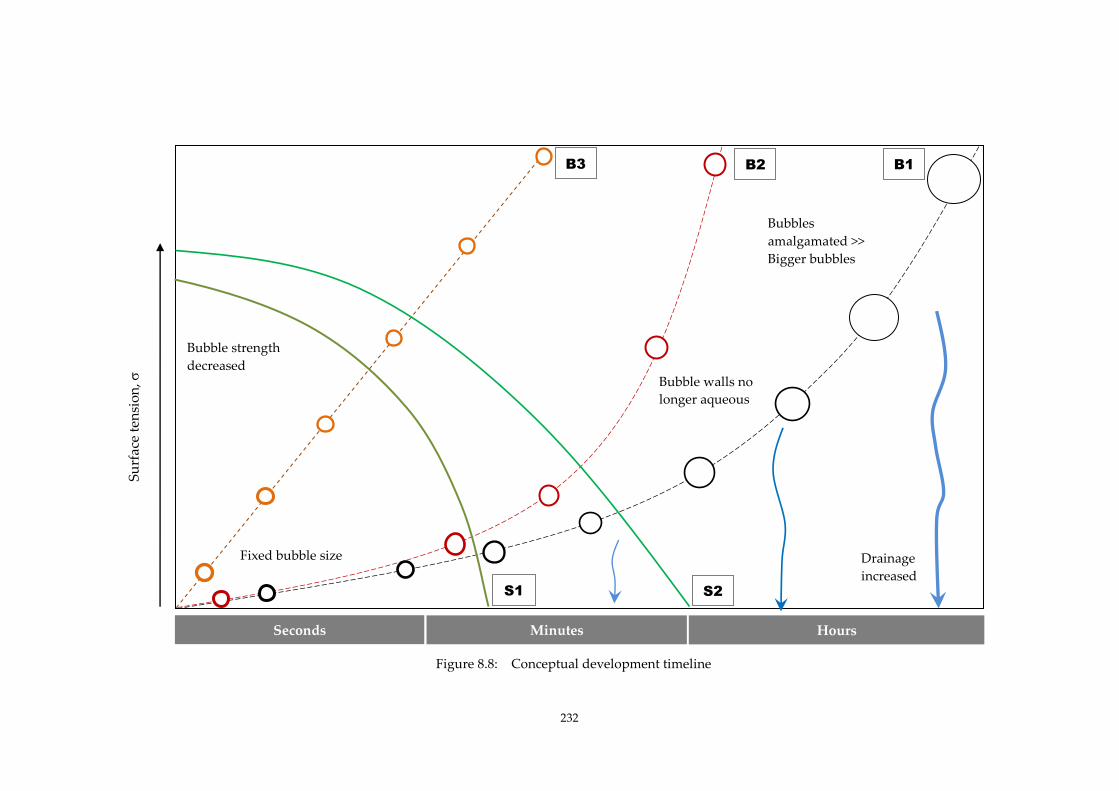
232
Bubble strength
decreased Bubble walls no
longer aqueous
Fixed bubble size
Bubbles
amalgamated >>
Bigger bubbles
S1 S2
Drainage
increased
Seconds Minutes Hours
Su
rfac
e te
nsi
on
,
B3 B2 B1
Figure 8.8: Conceptual development timeline
233
CHAPTER 9: CONCLUSION
9.1 OVERALL CONCLUSION
An improved understanding of the influence of constituent materials and mix proportions on
the basic properties and characteristics of foamed concrete is needed. This study looked at a
selection of parameters which may affect the design of foamed concrete. One of the important
properties is the rheological properties which are accepted as having direct relation to the
behaviour and properties of all cementitious materials. Since the importance of the
rheological properties has been acknowledged in the literature and in practice, this research
was done to investigate the effect of constituent materials and the mix proportion on the
rheological properties of foamed concrete. Another important area that required further
research was the understanding of bubble structures which were known to vary with different
mix proportions and constituent materials. In this study, a few parameters were selected and
their relationship to the microstructure was observed. Since it was virtually impossible to
characterise the microstructure without appropriate magnification, this study adopted a
technique which was able to examine to a certain degree, the sizes of the bubbles, which
enabled to observe the differences effect of the selected parameters. Accepting the stability of
foamed concrete as the main criterion for practical purposes, it was crucial to understand the
mechanisms that lead to the collapse of air. The basis of the stability measurements the foam
stability was evaluated by the drop in foamed concrete height.
9.2 PRACTICAL IMPLICATIONS
Despite the variety of parameters and the complexity of physical phenomena governing its
characteristics, this study shows that a few effects can be identified; major trends can be
predicted, thus assisting the selection of materials and proportions in achieving predictive
capabilities for specific purposes. On a practical basis, corresponding to acceptable flowability
range through the Dundee Marsh cone as 1 to 2 minutes, the yield stress was found to be
between 6.0 and 8.5 N/m2. Accepting stability of the foamed concrete mix as less than 5%
drop in level, the corresponding bubble diameter was found to be 0.35 mm. Overall, this basic
knowledge will significantly benefit accurate prediction of the general behaviour and future
practical applications.
234
9. 3 FUTURE RESEARCH
The findings of this study suggest a number of further avenues for future research. The first
of these is an in-depth study of CSA cements, which was found to have resolved instability
issues even at lower density. An area recommended for further study is intensive assessment
of rheological measurements, using reliable instruments to characterise fresh foamed concrete
and relating to its flow characteristics. Another area to study is the examination on bubble
sphericity specifically and in general, the microstructure of the whole matrix. A proper
magnification technique must be deployed to examine the microstructure of the mixes from
the fresh to the harden state. The use of Computed Tomography scan, a medical imaging
method that employs tomography, is a possible technique that can examine the bubbles
characteristics, namely the bubble diameter. Another point of interest is the blend of CSA and
other recycled materials which can be incorporated to further contribute towards sustainable
development. Overall, further studies on the performance of CSA foamed concrete is required
to develop the use in practical application of CSA foamed concrete mixes.
A second area for future study is the use of foamed concrete in acoustic transmission. Foamed
concrete has been established to have excellent thermal and sound insulation properties.
Further study will look at the properties of foamed concrete to identify whether it is possible
to attenuate sound transmission and the effective range of frequencies. In addition, an area
for further attention would be the use of foamed concrete as a composite panel to be
sandwiched with normal weight concrete.
A third aspect that would bear further investigation is the development of compatible
chemical admixtures and incorporation of fibres. In the current study, the use of chemical
admixture was found to have improved one aspect of foamed concrete, namely, its stability
whilst reducing the strength. Further improvement is required to improve the use of chemical
admixture which will improve the capacity of foamed concrete. With the advancement use of
fibres, the study of a wide range of properties and characteristics can further develop an
enhanced foamed concrete.
235
REFERENCES
AHMAD ZAIDI, A.M. and LI, Q.M., 2009. Investigation on penetration resistance of foamed
concrete. Proceedings of the Institution of Civil Engineers: Structures and Buildings, 162(1), pp. 77-
85.
ALDRIDGE D., 2000. Foamed concrete for Highway Bridge Works, One day awareness seminar
‘Foamed Concrete: Properties, Applications and Potential’, University of Dundee, Scotland,
23March 2000b, pp. 33-41.
ALDRIDGE, D., 2008. Foamed concrete for white city development. Concrete (London), 42(5), pp.
30-31.
ALDRIDGE, D., 2007. The world's largest foamed concrete project. Concrete (London), 41(7), pp.
33-35.
ALDRIDGE, D., 2005. Introduction to foamed concrete: What, why, how? Proceedings of the
International Conference on the Use of Foamed Concrete in Construction 2005, pp. 1-14.
ALDRIDGE D., 2000a. Foamed Concrete, Concrete, Vol. 34, No. 4, pp. 20-22.
AMBROISE, J. and PÉRA, J., 2003. Properties of high performance materials based on calcium
sulfoaluminate cement, Role of Cement Science in Sustainable Development - Proceedings of the
International Symposium dedicated to Professor Fred Glasser, University of Aberdeen, Scotland
2003, pp. 459-468.
BAI J. and WILD S., 2002. Investigation of the temperature change and heat evolution of mortar
incorporating PFA and metakaolin, Cement & Concrete Composites. Vol. 24, pp. 201–209.
BANFILL P.F.G., 1991. The rheology of fresh mortar, Magazine of Concrete Research, Vol. 43, No.
154, pp. 13-21.
BANFILL P.F.G., 2003. The rheology of fresh cement and concrete – A review. Proceeding of 11th
International Cement Chemistry Congress, Durban.
BARTOS P.J.M., 1992. Fresh concrete. Properties and tests. Amsterdam: Elsevier.
BASIURSKI J., 2000. Foamed concrete for void filling, insulation and construction, One day
awareness seminar ‘Foamed concrete: properties, Applications and Potential’, University of
Dundee, Scotland, pp. 42-52.
BENINGFIELD, N., GAIMSTER, R. and GRIFFIN, P., 2005. Investigation into the air voids
characteristics of foamed concrete, Proceedings of the International Conference on the Use of
Foamed Concrete in Construction, pp. 51-60.
BENNETT D., 2002. Innovations in Concrete, Thomas Telford, pp. 62-67.
BOUGHRAROU, R. and CALE, S.A., 2005. Stabilisation of old mine workings - A case study of the
use of foamed concrete in Combe down stone mines, Proceedings of the International Conference
on the Use of Foamed Concrete in Construction 2005, pp. 133-142.
References
236
BRADY, K.C. and GREEN, M.J., 1997. Foamed concrete: A review of Materials, Methods of
Production and Applications, Project Report PR/CE/149/97, Crowthorne, TRL Limited.
BRADY, K.C., 2000 “An investigation into the properties of foamed concrete” Project report
PRAS/99/00, Crowthorne, TRL Limited.
BRITISH RESEARCH ESTABLISHMENT, IP 12/04, 2004. Concrete with minimal or no primary
aggregate content.
BRITISH CEMENT ASSOCIATION
First interim report on foamed concrete. BCA Report RA1.007.00.1. 1990.
Foamed concrete. Ref. 46.041, 1991a, 4 pp.
Foamed concrete – a Dutch view. Simon Van Dijk, Voton International B.V., Reprint
2/91, 1991b.
Foamed concrete; Composition and Properties. Ref. 46.042, 1994, 4 pp.
Foamed concrete for improved trench reinstatements. Taylor R. W., Ref. 46.043, 1991c,
6 pp.
A Specification for Use in the Reinstatement of Openings in Highways.
BROOKFIELD ENGINEERING LABORATORIES. Brookfield Dial Viscometer, Operating
Instructions, Manual No. M/85-150-N898, 34 pp.
BROOKFIELD ENGINEERING LABORATORIES. More solutions to sticky problems; a guide to
getting more from your Brookfield viscometer, 1995.
CASTRO, A.L and LIBORIO J.B.L., 2006. Initial Rheological Description of High Performance
Concretes, Materials Research, Vol. 9, No. 4, 405-410.
CHANDLER J.W.E., 2000. Highway Reinstatement with Foamed Concrete, One day awareness
seminar on ‘Foamed Concrete: Properties, Applications and Potential’, University of Dundee,
Scotland, pp. 26-32.
CHIA, K.S. and ZHANG, M.H., 2004. Effect of chemical admixtures on rheological parameters and
stability of fresh lightweight aggregate concrete. Magazine of Concrete Research, 56(8), pp. 465-473
CHIA K.S., ZHANG M.H., 2007. Workability of air-entrained lightweight concrete from rheology
perspective, Magazine of Concrete research 2007 59, No.5 June pp.367 - 375
CHOPIN D., LARRARD F., CAZACLIU B., 2004. Why do HPC and SCC require a longer mixing
time? Cement and Concrete Composites 34 (2004) pp. 2237 - 2243
CONCRETE SOCIETY, 2009. Foamed Concrete: Application and Specification, 23 pp.
COX L.S. and VAN DIJK S., 2002. Foam concrete: a different kind of mix, Concrete, February 2002,
pp.54-55.
COX L.S. and VAN DIJK S., Foamed concrete for roof slopes and floor levelling, Concrete, Vol. 37,
No. 2, February 2003, pp. 37-39.
References
237
COX L.S., 2005. Major Road and Bridge Projects with Foamed concrete , Use of Foamed concrete in
construction, Proceedings of the International Conference on the Use of Foamed Concrete in
Construction 2005, pp. 105 - 113.
DE ROSE L. and MORRIS J., 1999. The influence of the mix design on the properties of micro-
cellular concrete, Specialist techniques and materials for concrete construction, Proceedings of the
International Conference ‘Creating with concrete’ (Ed R K Dhir and Henderson), University of
Dundee, Scotland, Thomas Telford, London, pp. 185-197.
DEREK B., 2008. The Bubble Structure of Foamed Concrete. B.Eng Thesis. University of Dundee.
DHIR R.K., JONES M.R. and NICOL L.A., 1999. Development of Structural Grade Foamed
concrete, Final Report, DETR Research Contract 39/3/385, 84 pp.
DOMONE P.L., 2003. Fresh concrete, Advanced Concrete technology – Concrete Properties (Ed.
Newman and Choo), Elsevier, pp. 1-5.
DOMONE P.L., YONGMO X. and BANFILL P.F.G., 1999. Developments of the two-point
workability test for high-performance concrete, Magazine of Concrete Research, Vol. 51, No. 3,
pp.171-179.
DRANSFIELD J.M., 2000. Foamed Concrete: Introduction to the Product and its Properties, One
day awareness seminar on ‘Foamed Concrete: Properties, Applications and Potential, University of
Dundee, Scotland, pp. 1-11.
DU, L. and FOLLIARD, K.J., 2005. Mechanisms of air entrainment in concrete. Cement and
Concrete Research, 35(8), pp. 1463-1471.
FERRARIS, C.F., 1999. Measurement of the Rheological Properties of High Performance Concrete:
State of the Art Report”, Journal of Research of the National Institute of Standards and Technology,
Volume 104, Number 5.
FRI´AS M., 2006. The effect of metakaolin on the reaction products and microporosity in blended
cement pastes submitted to long hydration time and high curing temperature - Advances in
Cement Research, 18, No. 1, January pp. 1–6
GHOSH, S N., 1999. Overview of cement and concrete - Research and Technology, Cement and
Concrete Science and Technology, (Ed. S N Ghosh), New Delhi L ABI Books, pp. 1-9.
GIANNAKOU A. and JONES M R., 2002. Potential of foamed concrete to enhance the thermal
performance of low-rise dwellings, Innovations and developments in concrete materials and
construction, Proceedings of the International Congress ‘Challenges of Concrete Construction’ (Ed
R K Dhir, Hewlett and Csetenyi), University of Dundee, Scotland, Thomas Telford, pp. 533-544.
GIRNIENE, I. and LAUKAITIS, A., 2003. Investigation of additives on the properties of foamed
concrete, Role of Cement Science in Sustainable Development - Proceedings of the International
Symposium - Celebrating Concrete: People and Practice 2003, pp. 567-574.
HAMIDAH, M.S., AZMI, I., RUSLAN, M.R.A., KARTINI, K. and FADHIL, N.M., 2005.
Optimisation of foamed concrete mix of different sand-cement ratio and curing conditions,

References
238
Proceedings of the International Conference on the Use of Foamed Concrete in Construction, 2005,
pp. 37-44.
HANEHARA, S. and YAMADA, K., 2008. Rheology and early age properties of cement systems.
Cement and Concrete Research, 38(2), pp. 175-195.
HIGHWAY AGENCY and TRANSPORT RESEARCH LABORATORY, 2001. Application Guide
AG39: Specification for foamed concrete, Brady K.C, Watts G.R.A. and Jones M.R., 62pp.
HILGENFELDT, S., KOEHLER, S.A. and STONE, H.A., 2001. Dynamics of coarsening foams:
Accelerated and self-limiting drainage. Physical Review Letters, 86(20), pp. 4704-4707.
HORNE M R., 1985. Review of the Public Utilities Street Works Act (PUSWA) 1950, HMSO,
London, 255 pp.
IKRAM, 2004. Final Report: Kajian Kejuruteraan Aplikasi Foamed concrete dalam Kerja
Pembinaan, Jabatan Kerja Raya Malaysia, 103 pp.
JONES M.R., 2000. Foamed Concrete for Structural Use, One day awareness seminar on ‘Foamed
Concrete: Properties, Applications and Potential’, University of Dundee, Scotland, pp. 54-79.
JONES, M.R. and GIANNAKOU, A., 2002. Foamed concrete for energy-efficient foundations and
ground slabs. Concrete (London), 36(3), pp. 14.
JONES, M.R. and GIANNAKOU, A., 2004. Thermally insulating foundations and ground slabs
using highly-foamed concrete, ASTM Special Technical Publication 2004, pp. 100-112.
JONES, M.R. and McCARTHY, A., 2005a. Utilising unprocessed low-lime coal fly ash in foamed
concrete. Fuel, 84(11), pp. 1398-1409.
JONES, M.R. and McCARTHY, A., 2005b. Preliminary views on the potential of foamed concrete
as a structural material. Magazine of Concrete Research, 57(1), pp. 21-31.
JONES, M.R. and McCARTHY, A., 2005c. Behaviour and assessment of foamed concrete for
construction applications, Proceedings of the International Conference on the Use of Foamed
Concrete in Construction 2005, pp. 61-88.
JONES, M.R., McCARTHY, A., KHARIDU, S. and NICOL, L., 2005. Foamed concrete
developments and applications. Concrete (London), 39(8), pp. 41-43.
JONES, M.R. and McCARTHY, A., 2006. Heat of hydration in foamed concrete: Effect of mix
constituents and plastic density. Cement and Concrete Research, 36(6), pp. 1032-1041.
JONES M.R., McCARTHY A and McCARTHY M.J., 2003. Moving fly-ash utilisation in concrete
forward: a UK perspective, Proceedings of the ‘2003 International Ash Utilization Symposium’,
Center for Applied Energy Research, University of Kentucky.
JUENGER, M.C.G., WINNEFELD, F., PROVIS, J.L. and IDEKER, J.H., 2010. Advances in
alternative cementitious binders. Cement and Concrete Research, In press. Corrected proof.
Available online 14 December 2010.
References
239
JUMAAT, M.Z., JOHNSON ALENGARAM, U. and MAHMUD, H., 2009. Shear strength of oil
palm shell foamed concrete beams. Materials and Design, 30(6), pp. 2227-2236.
JUST, A. and MIDDENDORF, B., 2009. Microstructure of high-strength foam concrete. Materials
Characterization, 60(7), pp. 741-748.
KALLIOPI K.A., 2006. Pore Structure of Cement-based materials, Taylor and Francis, pp286 – 331.
KEARSLEY E.P., 1996. The use of foamed concrete for affordable development in third world
countries, Appropriate Concrete Technology, Proceedings from the International Conference ‘
Concrete in the service of mankind’ (Ed R K Dhir and M J McCarthy), E & FN Spon, London,
Thomas Telford, pp. 233-243.
KEARSLEY E.P., 1999. Just foamed concrete – an overview, Specialist techniques and materials for
concrete construction, Proceedings of the International Conference ‘Creating with concrete’ (Ed R
K Dhir and Henderson), University of Dundee, Scotland, 8-10 September 1999, Thomas Telford,
pp. 227-237.
KEARSLEY, E.P. and MOSTERT, H.F., 2005. The use of foamed concrete in refractories,
Proceedings of the International Conference on the Use of Foamed Concrete in Construction 2005,
pp. 89-96.
KEARSLEY, E.P. and MOSTERT, H.F., 2005a. Designing mix composition of foamed concrete with
high fly ash contents, Proceedings of the International Conference on the Use of Foamed Concrete
in Construction 2005, pp. 29-36.
KEARSLEY, E.P. and MOSTERT, H.F., 2005b. Opportunities for expanding the use of foamed
concrete in the construction industry, Proceedings of the International Conference on the Use of
Foamed Concrete in Construction 2005, pp. 143-154.
KEARSLEY, E.P. and MOSTERT, H.F., 2003. The effect of fibre reinforcing on foamed concrete
behaviour, Role of Cement Science in Sustainable Development - Proceedings of the International
Symposium - Celebrating Concrete: People and Practice 2003, pp. 557-566.
KEARSLEY, E.P. and WAINWRIGHT, P.J., 2001a. Porosity and permeability of foamed concrete.
Cement and Concrete Research, 31(5), pp. 805-812.
KEARSLEY, E.P. and WAINWRIGHT, P.J., 2001b. The effect of high fly ash content on the
compressive strength of foamed concrete. Cement and Concrete Research, 31(1), pp. 105-112.
KEARSLEY, E.P. and WAINWRIGHT, P.J., 2002a. Ash content for optimum strength of foamed
concrete. Cement and Concrete Research, 32(2), pp. 241-246.
KEARSLEY, E.P. and WAINWRIGHT, P.J., 2002b. The effect of porosity on the strength of foamed
concrete. Cement and Concrete Research, 32(2), pp. 233-239.
KEARSLEY E.P. and VISAGIE M., 1999. Micro-properties of foamed concrete, Specialist techniques
and materials for concrete construction, Proceedings of the International Conference ‘Creating with
concrete’ (Ed R K Dhir and Henderson), University of Dundee, Scotland, 8 - 10 September 1999,
Thomas Telford, pp. 173-184.
References
240
KHAYAT, K.H. and ASSAAD, J., 2002. Air-void stability in self-consolidating concrete. ACI
Materials Journal, 99(4), pp. 408-416.
KOEHLER, S.A., STONE, H.A., BRENNER, M.P. and EGGERS, J., 1998. Dynamics of foam
drainage. Physical Review E - Statistical Physics, Plasmas, Fluids, and Related Interdisciplinary
Topics, 58(2 SUPPL. B), pp. 2097-2106.
LACHEMI M., HOSSAIN K M A, PATEL R., SHEHATA M. and BOUZOUBAA N., 2007. Influence
of paste/ mortar rheology on the flow characteristics of high-volume fly ash self-consolidating
concrete, Magazine of Concrete Research, Vol. 7, pp. 517 – 528.
LARRARD F. and MALIER Y., 1999. Engineering properties of very high performance concretes :
High Performance Concrete, Malier Y, E and FN Spon, London, 1999, pp. 85-115.
MADUR S., 2004. Effect of filler characteristic on the behaviour and performance of foamed
concrete, MSc dissertation, University of Dundee, 2004.
LEE, Y.L. and HUNG, Y.T., 2005. Exploitation of solid wastes in foamed concrete: Challenges
ahead, Proceedings of the International Conference on the Use of Foamed Concrete in Construction
2005, pp. 15-22.
McCARTHY A., 2004. Thermally insulating foundations and ground slabs for sustainable housing
using foamed concrete, PhD Thesis. University of Dundee.
McGOVERN G., 2000. Manufacture and Supply of Ready-Mix Foamed Concrete. One day
awareness seminar on ‘Foamed Concrete: Properties, Applications and Potential’, University of
Dundee, Scotland, pp. 12-25.
MEHTA P.K., MEHTA P.K., MONTEIRO P.J.M., 2006. Concrete: microstructure, properties, and
materials, McGraw-Hill
MELLIN P., 1999. Development of structural grade foamed concrete, MSc dissertation, University
of Dundee.
MYERS D., 1992. Surfactant Science and Technology, Second edition, VCH Publishers Inc,
Cambridge, 333 pp.
NAMBIAR, E.K.K. and RAMAMURTHY, K., 2006a. Models relating mixture composition to the
density and strength of foam concrete using response surface methodology. Cement and Concrete
Composites, 28(9), pp. 752-760.
NAMBIAR E.K.K and RAMAMURTHY K., 2006b. Influence of filler type on the properties of foam
concrete, Cement and Concrete Research, Vol. 28, pp. 475 – 480.
NAMBIAR E.K.K and RAMAMURTHY K., 2007a. Air-void characterisation of foam concrete,
Cement and Concrete Composites Vol. 37, pp. 221 - 230.
NAMBIAR E.K.K and RAMAMURTHY K., 2007b. Sorption characteristics of foam concrete,
Cement and Concrete Research 37, 2007b, pp. 1341–1347.
References
241
NAMBIAR E.K.K and RAMAMURTHY K., 2008. Fresh state characteristics of foam concrete,
Journal of Materials in Civil Engineering, Vol. 20, Issue 2, pp. 111 – 117.
NARAYANAN N. and RAMAMURTHY K., 2000. Structure and properties of aerated concrete: a
review, Cement and Concrete Composites, Vol. 22 pp. 321 – 329.
NAWY E.G., 2001. Fundamentals of high-performance concrete, New York; Chichester Wiley, pp.
3-11.
NEWMAN J. and OWENS P., 2003. Properties of lightweight concrete: Advanced Concrete
Technology – Processes, Elsevier, pp. 2/1 – 2/25.
NEVILLE A.M., 1995. Properties of Concrete, 4th Edition, Pearson Education Limited.
NONAT A. and MUTIN J.C., 1991. Hydration and setting of cements : Proceedings of the
International RILEM Workshop on Hydration and Setting organized by the Laboratoire de
Recherche sur la Reactivite des Solides, Universite de B, Dijon July – 3 -4, pp. 171- 191.
PAPAYIANNI, I. and MILUD, I.A., 2005. Production of foamed concrete with high calcium fly ash,
Proceedings of the International Conference on the Use of Foamed Concrete in Construction 2005,
pp. 23-27.
P RA, J. and AMBROISE, J., 2004. New applications of calcium sulfoaluminate cement. Cement
and Concrete Research, 34(4), pp. 671-676.
PUGH, R.J., 2005. Experimental techniques for studying the structure of foams and froths.
Advances in Colloid and Interface Science, 114-115, pp. 239-251.
RAO, K.S., 2008. Development of concrete materials with no or minimal primary aggregate
content. PhD Thesis. University of Dundee.
REGAN, P.E. and ARASTEH, A.R., 1990. Lightweight aggregate foamed concrete. Structural
engineer London, 68(9), pp. 167-173.
ROSEN M.J., 2004. Surfactant and Interfacial Phenomena, John Wiley & Sons, pp.1-34.
ROUSSEL N., 2007. Rheology of fresh concrete: from measurements to predictions of casting
processes, Materials and Structures, Vol. 40, pp.1001–1012.
ROUSSEL N., 2005. Steady and transient flow behaviour of fresh cement pastes, Cement and
Concrete Research, Vol. 35, pp. 1656-1664.
ROUSSEL N. and Roy R., 2005. The Marsh cone: a test or a rheological apparatus, Cement and
Concrete Composites 35(2005) pp. 823 - 830
SACH J. and SEIFERT H., 1999. Foamed concrete technology: possibilities for thermal insulation at
high temperatures. CFI Ceramic Forum International, 76(9), pp. 23-30.
SAINT-JALMES, A., 2006. Physical chemistry in foam drainage and coarsening. Soft Matter, 2(10),
pp. 836-849.
References
242
SIDDIQUE R. and KLAUS J., 2009. Influence of metakaolin on the properties of mortar and
concrete: A review, Applied Clay Science 43, pp. 392–400.
STRUBLE L.J. and JIANG Q. 2004. Effects of Air Entrainment on Rheology. ACI Materials Journal,
101, pp. 448-455.
TATTERSALL G.H., 1991. Workability and Quality Control of Concrete, E & FN Spon, London, 262
pp.
VALORE R.C., 1954. Cellular Concretes – part 1, Composition and methods of preparation,
Journal of the American Concrete Institute, Proceedings Vol. 25. No.9, pp. 773 -796
VAN DIJK S., 1991. Foamed Concrete, CONCRETE, July/August 1991, pp. 49-54.
VIGNES-ADLER, M. and WEAIRE, D., 2008. New foams: Fresh challenges and opportunities.
Current Opinion in Colloid and Interface Science, 13(3), pp. 141-149.
WALLEVIK J.E., 2006. Relationship between the Bingham parameters and Slump, Cement and
Concrete Composites 36, pp. 1214 – 1221.
WALLEVIK J.E., 2005. Thixotropic investigation on cement paste: Experimental and Numerical
approach, Journal of Non-Newtonian Fluid Mechanics 132, pp. 86 -99.
WEE T., BABU D.S., TAMILSELVAN T. and LIM, H., 2006. Air-void system of foamed concrete
and its effect on mechanical properties. ACI Materials Journal, 103(1), pp. 45-52.
WIMPENNY D.E., 1996. Some aspects of the design and production of foamed concrete,
Appropriate Concrete Technology, Proceedings from the International Conference ‘Concrete in the
service of mankind’ (Ed R K Dhir And McCarthy), E & FN Spon, London, 1996, Thomas Telford,
pp. 245-254.
YERRAMALA A., 2008. Development and characteristics of foamed concrete containing fine
recycled and secondary aggregate. University of Dundee. PhD Thesis. University of Dundee.
YONGMO X and DAHENG H.,1990. The relationship between microstructure and rheology of
fresh cement, Rheology of fresh cement and concrete (Ed. P F G Banfill), E & FN Spon , 1990, pp.
55.
UK WATER INDUSTRY RESEARCH,
Properties of foamed lean concrete, 1996 - Report Ref. No. 96/WM/01/18
Performance of foamed concrete, 1996 - Report Ref. No. 96/WM/01/19
Specification of foamed concrete , 1995 - Report Ref. No. 95/WM/01/7
WEAIRE D. and HUTZLER S. “The physics of foams” Oxford: Clarendon Press, 1999 pp.144-147.
YAKOVLEV G., KERIENE J., GAILIUS A. and GIRNIENE I., 2006. Cement based Foam Concrete
Reinforced by Carbon Nanotubes. ISSN 1392–1320 Materials Science (MedŽiagotyra). Vol. 12,
No.2. 2006