gamco · in 2005, gamco asset management inc. in cooperation with the columbia ... gbl - original...
TRANSCRIPT
The Advisor You Can Depend On
2008 ANNUAL REPORT
GAMCO I n v e s t o r s, I n c .

2
GAMCO Investors, Inc.GAMCO Investors, Inc.
Despite the many changes that have taken place in the investing landscape, the parable of Mr. Market has held true since The Intelligent Investor was first published in 1949. Its message – that the whims of Mr. Market do not represent the true intrinsic value of a security – is at the core of the value investing philosophy.
The value approach to investing pioneered by Professors Benjamin Graham and David Dodd and further developed by Professors Roger Murray and Bruce Greenwald of the Columbia University Graduate School of Business has been, by a wide margin, the most consistently successful approach to investing. This success has been validated by a number of academic/statistical studies, by the performance of value-oriented money management institutions, and by the records of individual, value-oriented investment managers. Our belief is that the dissemination, extension, and refinement of the value approach are broadly beneficial to investors at large. In 2005, GAMCO Asset Management Inc. in cooperation with the Columbia Business School, established an annual prize for Value Investing. The prize is intended to honor individual contributions in at least one of five areas, which serve the goals of refining, extending, and disseminating the practice of Value Investing. They are:— Innovative work in valuing securities in the Graham & Dodd tradition for either particular industries or particular asset classes. This work
may be either theoretical/academic or applied/practical. However, it will extend existing conventional wisdom on valuation in ways that can be usefully applied in practice.
— Innovative academic research of either a theoretical or statistical nature that illuminates and extends the principles of Value Investing.— Work in community building and/or information dissemination that contributes to the widespread practice of Graham & Dodd principles.— Outstanding contributions to Value Investing education by students, faculty (adjunct & full time), and practitioners.— Contributions to the implementation of sound Value Investing practices within companies either through investor activism or public
advocacy.
Benjamin Graham
David Dodd
Roger Murray Bruce Greenwald
THE GABELLI PRIZEin honor of
Graham & Dodd, Murray, Greenwaldfor
Value Investing“Imagine that in some private business you own a small share that cost you $1,000. One of your partners, named Mr. Market, is very obliging indeed. Every day he tells you what he thinks your interest is worth and furthermore offers either to buy you out or sell you an additional interest on that basis. Sometimes his idea of value appears plausible and justifi ed by business developments and prospects as you know them. Often, on the other hand, Mr. Market lets his enthusiasm or his fears run away with him, and the value he proposes seems to you a little short of silly.
If you are a prudent investor or a sensible businessman, will you let Mr. Market’s daily communication determine your view of the value of a $1,000 interest in the enterprise? Only in case you agree with him, or in case you want to trade with him. You may be happy to sell out to him when he quotes you a ridiculously high price, and equally happy to buy from him when his price is low. But the rest of the time you will be wiser to form your own ideas of the value of your holdings, based on full reports from the company about its operations and fi nancial position.“ - Benjamin Graham, The Intelligent Investor
A committee drawn from the Value Investing community will apply these criteria in awarding the prize. This year’s honoree, Richard H. Thaler, Ph.D., will be awarded the Gabelli prize at GAMCO’s 24th Annual Client Conference in May 2009. The first recipient was Joel Greenblatt who received the honor at GAMCO’s Annual Client Conference in May 2005. In 2006, it was Martin J. Whitman. In 2007, it was Robert W. Bruce III. For 2008, Jean Marie Eveillard was the recipeint.
GAMCO Investors, Inc.
3
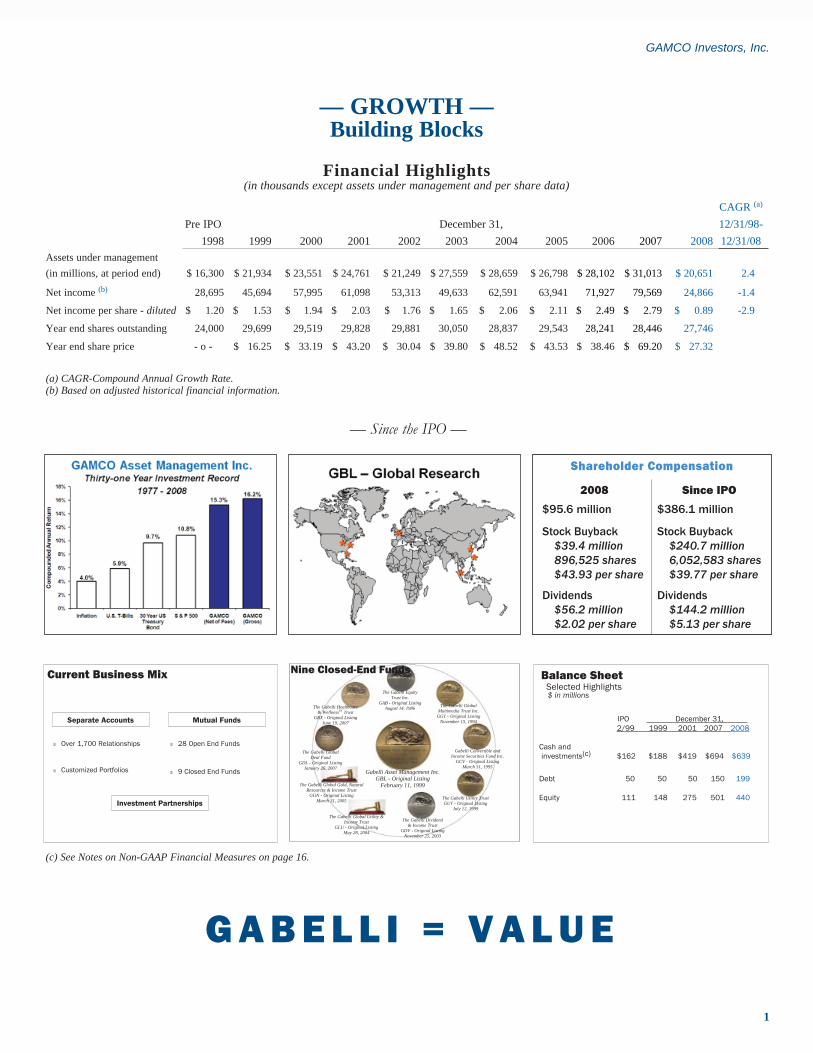
Financial Highlights(in thousands except assets under management and per share data)
CAGR (a)
Pre IPO December 31, 12/31/98-1998 1999 2000 2001 2002 2003 2004 2005 2006 2007 2008 12/31/08
Assets under management(in millions, at period end) $ 16,300 $ 21,934 $ 23,551 $ 24,761 $ 21,249 $ 27,559 $ 28,659 $ 26,798 $ 28,102 $ 31,013 $ 20,651 2.4%
Net income (b) 28,695 45,694 57,995 61,098 53,313 49,633 62,591 63,941 71,927 79,569 24,866 -1.4%
Net income per share - diluted $ 1.20 $ 1.53 $ 1.94 $ 2.03 $ 1.76 $ 1.65 $ 2.06 $ 2.11 $ 2.49 $ 2.79 $ 0.89 -2.9%
Year end shares outstanding 24,000 29,699 29,519 29,828 29,881 30,050 28,837 29,543 28,241 28,446 27,746
Year end share price - o - $ 16.25 $ 33.19 $ 43.20 $ 30.04 $ 39.80 $ 48.52 $ 43.53 $ 38.46 $ 69.20 $ 27.32
(a) CAGR-Compound Annual Growth Rate. (b) Based on adjusted historical financial information.
GAMCO Investors, Inc.
1
— GROWTH —Building Blocks
— Since the IPO —
G A B E L L I = V A L U E
Current Business Mix
Separate Accounts Mutual Funds
3 Over 1,700 Relationships
3 Customized Portfolios
3 28 Open End Funds
3 9 Closed End Funds
Investment Partnerships
(c) See Notes on Non-GAAP Financial Measures on page 16.
IPO December 31, 2/99 1999 2001 2007 2008
Cash and investments(c) $162 $188 $419 $694 $639
Debt 50 50 50 150 199
Equity 111 148 275 501 440
Balance Sheet Selected Highlights $ in millions
Nine Closed-End Funds
Gabelli Asset Management Inc.GBL - Original Listing
February 11, 1999
The Gabelli Equity Trust Inc.
GAB - Original ListingAugust 14, 1986 The Gabelli Global
Multimedia Trust Inc.GGT - Original Listing
November 15, 1994
Gabelli Convertible and Income Securities Fund Inc.
GCV - Original ListingMarch 31, 1995
The Gabelli Utility TrustGUT - Original Listing
July 12, 1999
The Gabelli Dividend & Income Trust
GDV - Original ListingNovember 25, 2003
The Gabelli Global Utility & Income Trust
GLU - Original ListingMay 28, 2004
The Gabelli Global Gold, Natural Resources & Income Trust
GGN - Original ListingMarch 31, 2005
The Gabelli Global Deal Fund
GDL - Original ListingJanuary 26, 2007
The Gabelli Healthcare & WellnessRX Trust
GRX - Original ListingJune 19, 2007
Shareholder Compensation
2008 Since IPO
$95.6 million $386.1 million
Stock Buyback $39.4 million 896,525 shares $43.93 per share
Stock Buyback $240.7 million 6,052,583 shares $39.77 per share
Dividends $56.2 million $2.02 per share
Dividends $144.2 million $5.13 per share

2
GAMCO Investors, Inc.
Chairman’s LetterFellow Shareholders/Partners:
After surging 80% in 2007, from $38 to $69, our stock tumbled during the bear market of 2008 to end the year at $27 and has climbed back to $42 per share so far this year.
The U.S. and global equity markets – like a levee under assault from a Class 5 hurricane – broke under the onslaught of economic dynamics which led to the collapse of the House of Lehman (Lehman Brothers) and the financial consequences that followed.
The destructive leverage that pervades our economic system was built up through easy money fueled by unregulated securitized debt creation by such entities as hedge funds and other non-bank financial institutions often referred to as the “Shadow Banking System.”
The excessive leverage generated by the more traditional deposit-based banks was also a significant contributor, as many bulked up their lending activities through structured investment vehicles and other off-balance sheet conduits.
The U.S. balance of trade deficit, particularly when coupled with the Chinese government’s policy of recycling U.S. dollars earned from their export driven economy, is also “a nominee for best supporting actor” in the recent turmoil.
Perhaps another candidate was the voracious appetite for new and what might at best be generously described as “poorly underwritten” mortgages that fueled the housing price bubble.
How about including the transformation of “thy home is thy castle” to “thy home is thy ATM machine”?
Then, too, the mispricing of risk, the mislabeling of risk (remember AAA was unjustifiably given to what?), and of course, the mismarking of risk were also important contributors to the current credit problems, as was the federal and state governments’ laissez faire attitude toward regulation. Instead of putting a chill on speculative forces, initiatives such as the elimination of the uptick rule for short sales, which aided and abetted “trading” in place of “investing” is just one of myriad actions of commission or omission that spawned today’s challenges.
The stock market collapse from September 2008 through March 2009 was intensified by investors’ fears due to the lack of transparency in our financial system. We could continue on and on. In retrospect, though we were mindful of the various risks, we did not anticipate that all would come together at the same time nor did we gauge their speed and impact on the capital markets.
Hindsights • We have one of the highest quality and best yielding U.S. Treasury money market funds, but did not communicate the benefits of investing in GUSTO aggressively enough to corporate clients and prospects. Had we done so, we might have spared a few from the angst associated with the Reserve Fund.
• We did not alert clients to allocate their assets to our non-market correlated products, particularly our merger arbitrage fund that has earned positive annual gross returns since inception twenty-four years ago.
• We should have moved faster to rebalance our cost structure, that is, shifting professional staff from administrative and support to equity research and client services.
• We were not persuasive enough to convince other firms that are complementary to our business, to sell their publicly traded companies and join us.
• We put the monetization of our intellectual property in digital through the creation of a Special Purpose Acquisition Company (SPAC) on hold.
• Returns on our corporate liquidity are low due to the Federal Reserve’s near zero interest rate policy. However, keeping our powder safe and dry has protected the firm and provides the flexibility to implement our business plan, when opportunity arises, regardless of the business backdrop at that time.
3
GAMCO Investors, Inc.
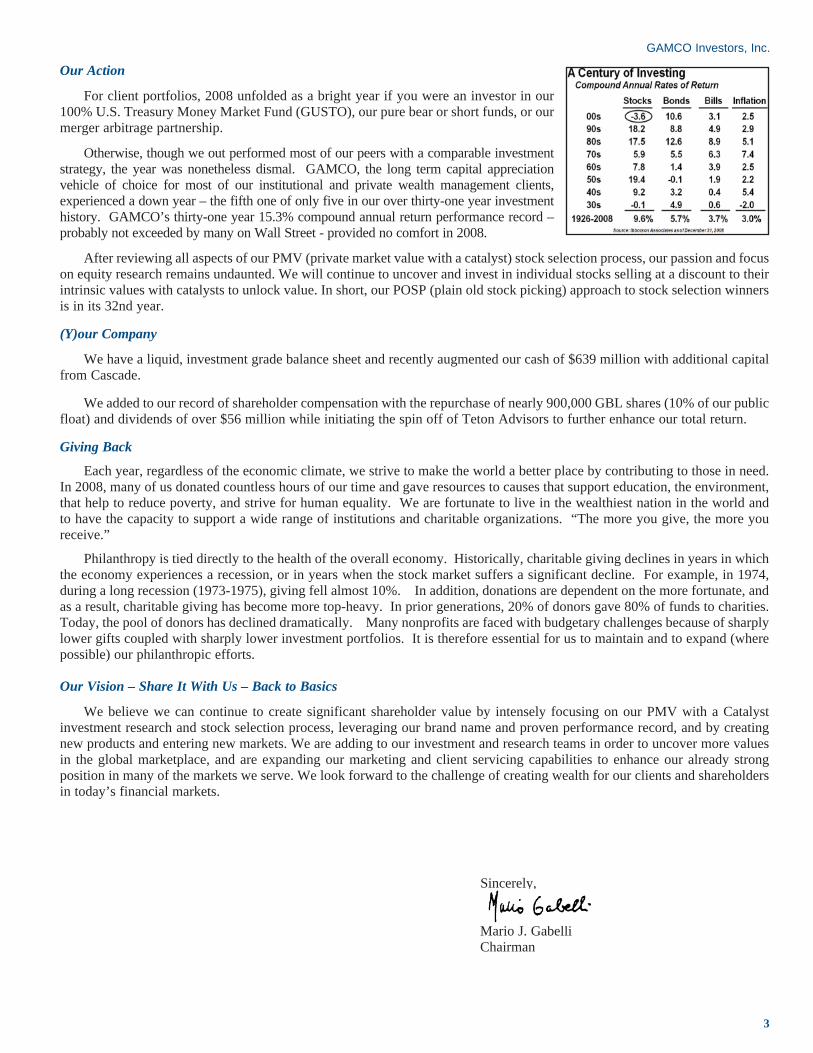
Our Action
For client portfolios, 2008 unfolded as a bright year if you were an investor in our 100% U.S. Treasury Money Market Fund (GUSTO), our pure bear or short funds, or our merger arbitrage partnership.
Otherwise, though we out performed most of our peers with a comparable investment strategy, the year was nonetheless dismal. GAMCO, the long term capital appreciation vehicle of choice for most of our institutional and private wealth management clients, experienced a down year – the fifth one of only five in our over thirty-one year investment history. GAMCO’s thirty-one year 15.3% compound annual return performance record – probably not exceeded by many on Wall Street - provided no comfort in 2008.
After reviewing all aspects of our PMV (private market value with a catalyst) stock selection process, our passion and focus on equity research remains undaunted. We will continue to uncover and invest in individual stocks selling at a discount to their intrinsic values with catalysts to unlock value. In short, our POSP (plain old stock picking) approach to stock selection winners is in its 32nd year.
(Y)our Company
We have a liquid, investment grade balance sheet and recently augmented our cash of $639 million with additional capital from Cascade.
We added to our record of shareholder compensation with the repurchase of nearly 900,000 GBL shares (10% of our public float) and dividends of over $56 million while initiating the spin off of Teton Advisors to further enhance our total return.
Giving Back Each year, regardless of the economic climate, we strive to make the world a better place by contributing to those in need. In 2008, many of us donated countless hours of our time and gave resources to causes that support education, the environment, that help to reduce poverty, and strive for human equality. We are fortunate to live in the wealthiest nation in the world and to have the capacity to support a wide range of institutions and charitable organizations. “The more you give, the more you receive.”
Philanthropy is tied directly to the health of the overall economy. Historically, charitable giving declines in years in which the economy experiences a recession, or in years when the stock market suffers a significant decline. For example, in 1974, during a long recession (1973-1975), giving fell almost 10%. In addition, donations are dependent on the more fortunate, and as a result, charitable giving has become more top-heavy. In prior generations, 20% of donors gave 80% of funds to charities. Today, the pool of donors has declined dramatically. Many nonprofits are faced with budgetary challenges because of sharply lower gifts coupled with sharply lower investment portfolios. It is therefore essential for us to maintain and to expand (where possible) our philanthropic efforts.
Our Vision – Share It With Us – Back to Basics
We believe we can continue to create significant shareholder value by intensely focusing on our PMV with a Catalyst investment research and stock selection process, leveraging our brand name and proven performance record, and by creating new products and entering new markets. We are adding to our investment and research teams in order to uncover more values in the global marketplace, and are expanding our marketing and client servicing capabilities to enhance our already strong position in many of the markets we serve. We look forward to the challenge of creating wealth for our clients and shareholders in today’s financial markets.
Sincerely,
Mario J. Gabelli Chairman
4
GAMCO Investors, Inc.
Financial Highlights — Jeffrey M. Farber, Chief Financial Officer
Overall, 2008 was a challenging year as assets under management (“AUM”), revenues, operating income, other income and net income all declined from the previous year reflecting the difficult global equity market environment. Importantly, however, the Company’s operating income was $85.0 million in 2008 down 17.6% from the record $103.2 million in 2007.
Revenues for the year were $245.0 million, a decrease of $47.4 million or 16.2%, from $292.4 million in 2007. The majority of this decline was from investment advisory and incentive fees, as a direct result of the market related decline in average AUM. Investment advisory and incentive fee revenues fell 18.4% to $204.3 million in 2008 from the $250.4 million in 2007. Revenues decreased for open-end and closed-end mutual funds by $25.4 million to $129.2 million, for institutional and private wealth management by $16.4 million to $72.3 million and for Investment Partnership by $4.4 million to $2.7 million. We earn incentive fees on certain assets based upon annual performance. Total incentive fees declined $20.2 million in 2008 to $2.3 million from the $22.5 million in 2007, driven by declines in the Investment Partnership area, Closed-End Funds and private wealth management where AUM levels were lower in 2008 relative to 2007.
Operating income before management fee was $89.1 million, a decrease of $28.5 million or 24.3%, from the prior year’s $117.6 million. The current year’s amount includes an incremental $4.8 million in stock based compensation relating to restricted stock awards and a $1.5 million impairment charge to write down an intangible asset. Other income, which consists of gains and losses on investments and net interest expense, was a net expense of $48.8 million for 2008 versus income of $26.7 million in 2007. This $75.5 million swing drove the substantial reduction in net income and earnings per share.
Net income decreased 68.7% to $24.9 million from $79.6 million in the year ago period. Fully diluted earnings per share were $0.89 per share versus $2.79 per share in 2007.
As the market deteriorated and our AUM declined, we accelerated our efforts to rationalize our cost structure. By being extremely vigilant regarding general and administrative costs, we are able to invest in our sales and research areas through acquisition, lift-outs, and organically.
Our balance sheet and and enlarged shelf registration ($520 million in total) allow us to be flexible should opportunities arise. We ended 2008 with approximately $639 million in cash and investments. With total debt of $199 million, consisting of $99 million of 5.5% senior notes due May 2013, a $40 million 6% convertible note due August 2011 and a $60 million 6.5% convertible note due October 2, 2018, our cash and investments, net of debt and minority interest, were $15.47 per share at December 31, 2008.
During 2008 we returned to shareholders $95 million, or approximately $3.40 per share, in a combination of stock repurchases and dividends to shareholders.
The Market in 2009 — Howard F. Ward, CFA, Chief Investment Officer — Growth Investments The bull market that began in October of 2002 ended in October of 2007. The recession officially began two months later, in December of 2007, as the housing downturn weighed on economic growth. The housing slump and unwinding of leverage was manageable and fairly well contained, however, until the bankruptcy of Lehman Brothers in mid – September of 2008. Lehman, the nation’s fourth largest investment bank with over $600 billion in debt, dwarfs all other bankruptcies. The Standard & Poor’s 500 fell 40% in the ensuing 10 weeks as the credit markets froze and deleveraging of portfolios reached panic levels.
This is shaping up to be no ordinary recession. Although comparisons to the thirties are extreme, it will be one of the longest and deepest on record. Should it last until July, it will be the longest since the 43 - month recession that ended in March of 1933. The economic news will be bleak and the media won’t let us forget it. The good news is the policy response has never been greater during economic downturns. The Federal Reserve Board has dropped the Federal Funds interest rate to zero, for all practical purposes, and is buying various securities in an attempt to prop up markets and stimulate risk taking. Like monetary policy, fiscal policy has never been more expansionary. The goal is to create jobs, nurse the credit markets back to health and ward off talk of deflation. New policy tools, designed to address bank capital needs, are also being employed. Additionally, the dramatic fall in the price of oil (average price for ’08, $99 per barrel, current price $41) would be equal to a tax cut of about $400 billion at current prices.
The economy is expected to improve sometime in the second half of this year. The worst quarterly decline in GDP was most likely the fourth quarter of 2008, although the first quarter of 2009 could be equally bad. Reasonable prospects for rising GDP in the third or fourth quarter is good news for investors, as stocks will rise before the economy recovers, just as they fell prior to the onset of recession and a full 14 months before the National Bureau of Economic Research was able to identify the
— (Y)our Financial Highlights for 2008 —
— The Market in 2009 —

GAMCO Investors, Inc.
5
recession’s starting point. While historical patterns are not always helpful, stocks tend to advance a full 5 or 6 months before the economy and long before economic data confirms a recovery has started.
Last year was the worst year for the Dow Jones Industrial Average since 1931. In fact, stock prices as measured by the Standard & Poor’s 500 are at levels first seen in 1997. The modestly negative return on the S & P 500 over the past decade is nearly identical to the return for the ten years that ended in 1938. Negative ten - year returns on stocks have always led to positive ten - year returns, with an average gain of 183%, according to The Leuthold Group. Current valuations seem supportive of higher prices, with below average price to earnings multiples and above average dividend yields. Stocks also appear cheap given historical relationships between earnings yields, dividend yields and yields currently available on Treasuries.
Historically, an extreme level of public buying and selling of stocks has been a good reverse market indicator. In 2000, the public invested a record amount of $260 billion in equity mutual funds. The market peaked in March of 2000 and then declined until October of 2002. In 2008, the public pulled a record $168 billion from equity funds. The cash on the sidelines is adding up. Money market funds now hold about $4 trillion and are yielding close to zero. This compares to a stock market capitalization in the U.S. of roughly $10 trillion. Expect sophisticated institutional investors to fuel the first phase of the next bull market, as they pull dollars from real estate, hedge funds, private equity, Treasuries and cash equivalents. Market volatility has never been greater and a better opportunity to buy stocks may present itself. However, a number of conditions that accompany market bottoms are evident and bull markets do have a tendency to “climb a wall of worry”.
— The Market in 2009 —
— Invest With Us —
Gabelli S&P Russell CPI Value 500 2000 + 10
Number of Up Years 28 25 21* Number of Down Years 4 7 9* Years Gabelli Beat Index 20 19* 20Total Return (CAGR) (a) 16.2% 10.8% 10.8%* 4.0%Number of Stocks 101 500 1,934 Median Market Capitalization $2.4 bn $6.5 bn $321 mm Mean Market Capitalization $8.0 bn $16.6 bn $890 mm Beta 0.82
* Calculation of Russell 2000 commenced 1/1/79. (a) Annual periods ending December 31, 2008, gross of fees
Expressed Another Way
In 28 out of the first 32 years, GAMCO’s (GAMCO Asset Management Inc.) institutional accounts (Gabelli Value Composite) experienced positive results. More importantly, the returns earned by the composite exceeded the S&P 500 by 5.4% on an annualized basis (or in dollar terms, by $5,095 on a $100 investment) with less risk as measured by the beta of 0.82. The institutional portfolios typically hold fewer stocks than the index with an average market capitalization of $11.1 billion. Institutional accounts generally have an initial investment of $5 million or more.
GAMCO has focused on absolute returns since the firm was founded in 1977. We launched our first partnership, or hedge fund, in 1985 to invest in merger arbitrage situations, and Gabelli Associates just completed its twenty-second consecutive year of positive gross performance in 2008.
In merger arbitrage, the investment process begins with the announcement of an acquisition, a deal. In most mergers an acquirer makes an offer for all of the target’s stock; however, the target’s share price usually trades at a discount, or spread, to the final deal price because of the time value of money, regulatory approval risk, financial risks and other deal risks. Our role, as arbitrageurs, is to quantify and discount these factors and make investment decisions we believe compensate our partners for the assumed deal completion risk.
— Merger Arbitrage —
6
GAMCO Investors, Inc.
“Green” is emerging as the investment theme for the next decade. Dur-ing the past 20 years, the green theme was obscured by environmentalists and activists who dominated the green agenda. Not until 2006 when Vice Presi-dent Al Gore educated the world through his documentary, “An Inconvenient Truth”, which highlighted our environmental impact and challenged us to fix it, did Green take center stage. T. Boone Pickens, the prominent oil investor, embraced wind power and offered the Picken’s plan to help America end its dependence on foreign oil.
In 2008, green emerged as a central issue for the US Presidential election. This completed its assimilation into mainstream thought. Sustainability issues such as climate change, energy security and independence, natural resource shortages, consumer attitude toward organic living, and urbanization are core issues. The issues are accompanied by a series of Economic, Social, and Po-litical (ESP) changes that have significant global impact and should not be ignored by companies, investors, or individuals.
Despite the economic turmoil, we believe the sustainability issues, and the companies that address them, will create significant investment opportunities for our clients.
Venture capitalists placed nearly $8.4 billion in 2008 (representing close to 20% of all VC investments) in the greentech sector – up nearly 38% from 2007. Yet, the actual adoption of green technologies is still in its infancy – less than 0.3% of households in California have solar power for example. In 2008, we estimate that 5,550 MW of solar modules were installed, more than double the 2,400 installed in 2007 and representing the equivalent of 5-6 nuclear power plants. New wind installations reached 27,000MW from the 19,800MW installed in 2007. Despite this rapid growth, the total installed base of renewable only accounts for a few percentage points of elec-tricity generation.
The legislative framework drafted by President Obama’s administration continues to support renewables. Whereas renewable power generation is strongly supported through feed in tariffs in Germany and Spain, the US framework is less robust. The Ameri-can Reinvestments and Recovery Act (ARRA) broadened and extended the tax framework as well as established loan guarantees which should help to drive investment in wind, solar and geothermal power generation. Senator Harry Reid (NV) is proposing a transmission bill to help overhaul the frail transmission and distribution grid so that we can connect green power to the consumer.
The pending Cap and Trade proposal will establish the US as a peer in the global climate debate, by putting a price on carbon and thereby permanently changing the economics of fossil fuels. We believe this triple legislative combination will drive significant investment in green power in the US over the coming decade.
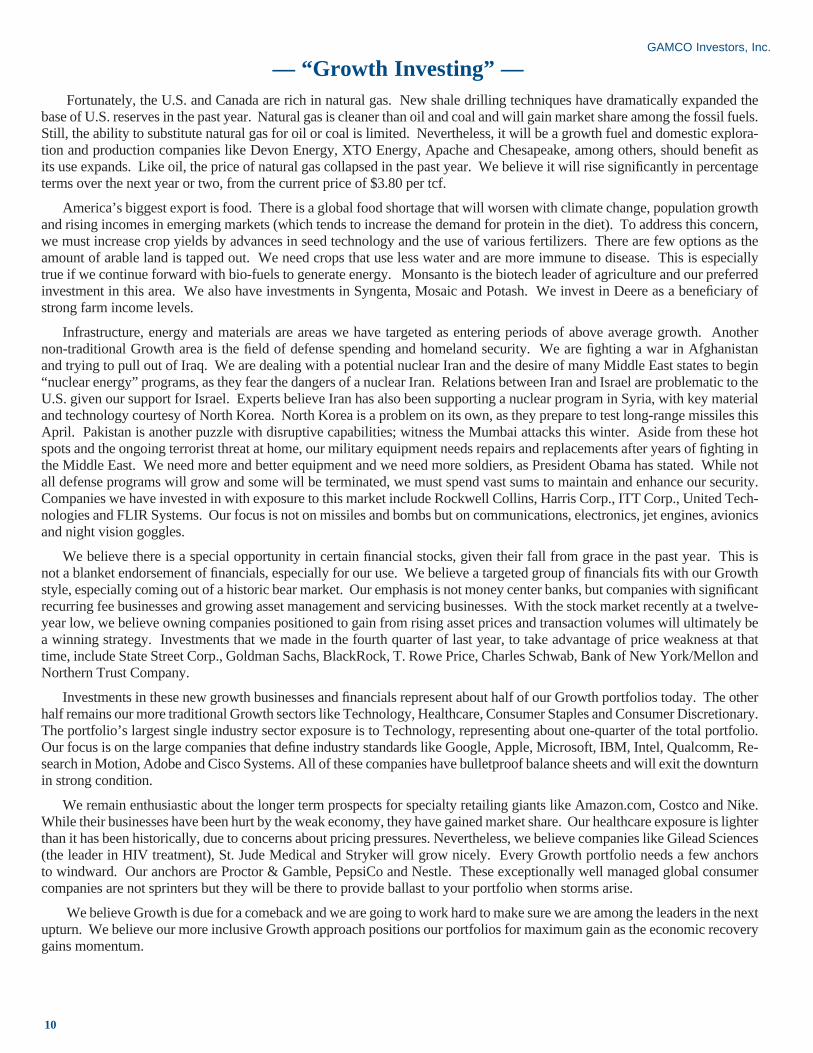
Sarah Donnelly John M. Segrich, CFA, Joined Gabelli & Company, Inc. in July 2008 to head the Ga-belli Green research team, which focuses on sustainability cri-teria, bringing his 15 years of institutional research experience to the team. Previously, he spent seven years in Europe where he was most recently the head of JPMorgan’s sell side European Technology research team. Prior to that, Mr. Segrich was head of the European Software research team for Goldman Sachs in London. John began his career in 1993 at Gabelli & Company as a research analyst focused on the Internet industry. He is a Chartered Financial Analyst and graduated from Boston Col-lege in 1995 with a BA in philosophy.
— Gabelli Green —
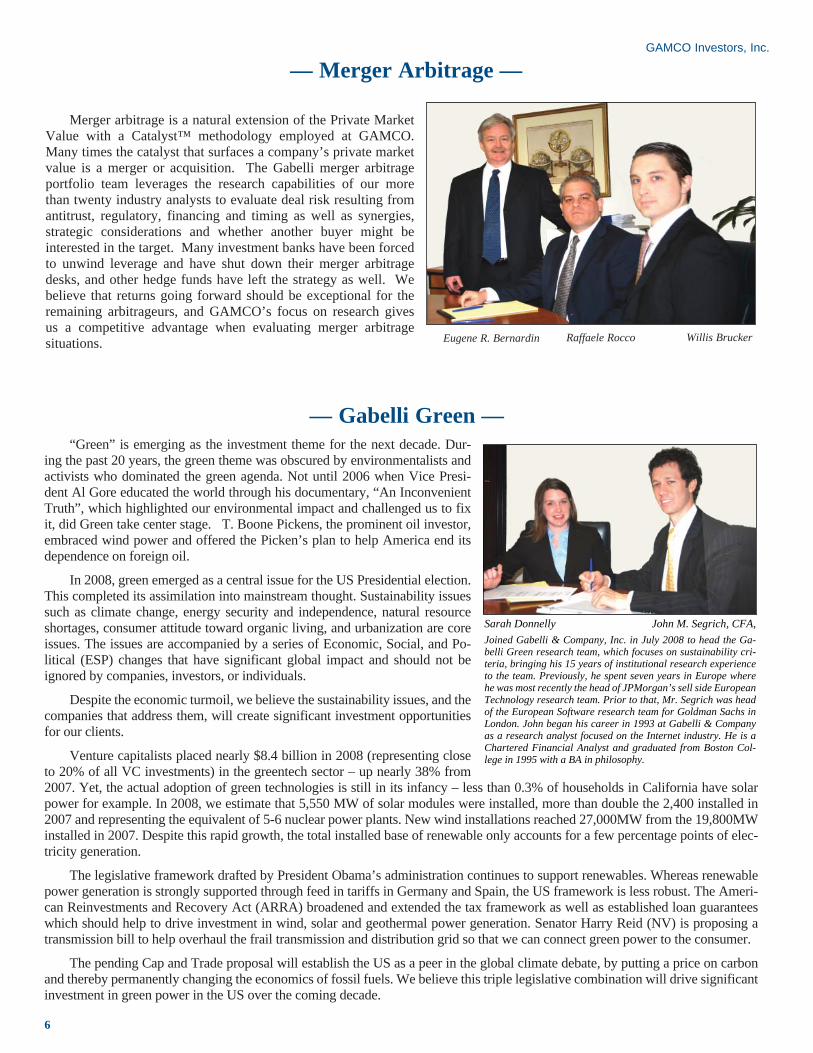
Merger arbitrage is a natural extension of the Private Market Value with a Catalyst™ methodology employed at GAMCO. Many times the catalyst that surfaces a company’s private market value is a merger or acquisition. The Gabelli merger arbitrage portfolio team leverages the research capabilities of our more than twenty industry analysts to evaluate deal risk resulting from antitrust, regulatory, financing and timing as well as synergies, strategic considerations and whether another buyer might be interested in the target. Many investment banks have been forced to unwind leverage and have shut down their merger arbitrage desks, and other hedge funds have left the strategy as well. We believe that returns going forward should be exceptional for the remaining arbitrageurs, and GAMCO’s focus on research gives us a competitive advantage when evaluating merger arbitrage situations.
— Merger Arbitrage —
Eugene R. Bernardin Raffaele Rocco Willis Brucker

GAMCO Investors, Inc.
7
— The Shadow Banking System — The excessive U.S. credit expansion over the last twenty years was acceler-ated in the late 1980s by the newly formed mortgage loan securitization process and the rise of the ‘shadow banking system’ comprised of unregulated and highly interconnected non-bank financial institutions. These ‘non bank’ banks originated the packaging and sale of securitized loans, enabling the traditional deposit based banks to remove these loans from their balance sheets. During this period, the Savings and Loan crisis caused a shortage of mortgage lending capacity which further enhanced new loan securitization and the increase in credit creation by non-deposit based financial firms.
The ratios of total debt relative to U.S. GDP and household debt relative to personal income again accelerated around 1995 as ‘financial innovation’, lax regulation of subprime and other mortgage products, and the 1999 repeal of the Glass-Steagall Act of 1933 took hold. When the SEC deregulated investment banks by permitting capital ratio calculations using value-at-risk formulas, lever-age ratios rocketed from 10-to-1 to a high risk 30-to-1 and above. This set the stage for the eventual collapse and total shut down of the mortgage, auto, student, and credit card loan securitization process.
TARP, TALF AND PPIF In response to the standstill in new credit formation by both the traditional de-posit based banks and the ‘shadow banking system’, Washington policy makers, the Federal Reserve and the Treasury Department have devised three basic plans to restart the loan making process.
The Troubled Asset Relief Program or TARP was put in place primarily to recapitalize the banks and get new lending underway. The just initiated Term As-set Backed Securities Loan Facility or TALF is intended to jump start the securi-tization process for consumer and small business loans and, if successful, will in effect, replace some of the defunct lending capacity of the ‘shadow banks’. Third, the Public Private Investment Fund or PPIF, which is similar in structure to TALF is intended to remove the ‘toxic’, difficult to price and illiquid, loans from the banks’ balance sheets.
Ironically, we have come full circle with these programs, since the Federal government is essentially taking over the function of the ‘shadow banking system’. A resumption of net credit formation will indicate that the stimulus of monetary and fiscal policy is working. So far, economic contraction, the deleveraging of households and financial institutions, the winding down of derivatives contracts and the declining velocity of money have more than offset the various policy initiatives intended to spark the credit creation process.
Henry G. Van der Eb, CFAis Senior Vice President of GAMCO Investors, Inc. with a wide range of both investment and operating responsibilities across the firm. He joined GAMCO in October 1999 as President and Portfolio Manager of The GAMCO Mathers Fund which he has managed for over thirty years. Henry is a member of the CFA Institute and the CFA Society of Chicago where he served as President from 1979-80 and a Director from 1981-83. Henry received an MBA with honors from Northwestern University Graduate School of Management in 1970 and a BA in Biology from Vanderbilt University.
Anne E. Morrissy, CFA is Vice President of GAMCO Asset Management, Inc. and serves as a portfolio manager for institutional and individual accounts and a relationship manager for accounts managed by Mario J. Gabelli. She joined GAMCO in 1999 as Executive Vice President of the GAMCO Mathers Fund. Anne is a member of the CFA Society of Chicago and CFA Institute, and received an M.M. from the Kellogg School of Business at Northwestern University in 1990 and a BA in English and History from the University of Illinois in Champaign.
— Institutional Brokerage — Gabelli & Company, Inc., our institutional brokerage business, experienced another year of growth in 2008. We continue to gain market share, building on our strong reputation for providing research services to institutional investors.
As of December, 2008, our team of 24 research analysts, 8 institutional sales-people, and 4 equity traders followed over 500 publicly traded equities and did business with over 200 institutions. We enhanced our research coverage to in-clude asset managers, alternative energy and clean technology firms, and grew our presence in London, Singapore, and Shanghai.
In addition to publishing daily research notes and comprehensive reports utilizing our Private Market Value (PMV) with a Catalyst methodology, we held 7 industry conferences and dozens of non-deal road-shows throughout the country, including our 32nd Annual Automotive Aftermarket Symposium in Las Vegas, and Inaugural Specialty Chemicals and Best Ideas Conferences in New York. 2008 marked another successful year for Gabelli & Company’s Focus Five, a quarterly publication of the broker dealer’s favorite stock ideas. Since Janu-
ary, 2006, the Focus Five index, which is compiled by a rotating committee of research analysts and institutional sales professionals, increased 35.1% vs. a decline of 35.5% for the S&P500. We believe this outstanding performance is indicative of the firm’s competitive edge in provid-ing unique equity analysis to our clients, which in turn should allow us to continue to grow our business in the years ahead.
YoY Revenue Growth21% 5 Yr CAGR
39.8%
11.7%
22.5%
7.3%25.9%
2003 2004 2005 2006 2007 2008

8
GAMCO Investors, Inc.
— Private Wealth Management —Mr. Market presented a number of challenges to the long-only equity investor in 2008. The GAMCO portfolios showed
little or no immunity to “beta-driven” returns. As the year 2008 drew to a close, hedge funds rushed to meet their liquidity demands and indiscriminate tax selling impacted our portfolios. At the end of the day, it was not return on capital that mat-tered, it was return of capital.
We founded Gabelli in 1977 with a focus on generating absolute returns by using our proprietary Private Market Value with a Cata-lyst™ value investing style, and with a commitment to generating superior risk-adjusted returns on an absolute, tax-efficient basis. Over the past 31 years, we added other investment styles to com-plement our value strategy. Throughout, the common thread of the various investment approaches is that they all remain embedded in fundamental research. At the core is our proprietary, research-driv-en, stock selection methodology without using leverage or deriva-tives. Our long-term, buy-hold, tax-sensitive strategy works.
The foundation of our intense research on portfolio companies is based on evaluating the role of a strategic or financial buyer deciding whether or not to acquire the company. This gives us a clear understanding of values and allows us to gauge whether Mr. Market has mispriced the stock price of the company in question. It also puts us in the enviable position of having a fair number of takeover targets in our portfolios.
Our Investor Symposium(s)
Each year we hold an investment seminar for our private wealth management and institutional clients. We began hosting research symposiums as a way to meet and review our investment process and results with our many different constituents in 1986. We continued to vary the format of our meeting in 2008 as we had done over the past several years.
In 2008, we had the privilege of having presentations from a number of guest speakers, including Fred Krupp, President of the Environmental Defense Fund; Michael Eisner, former chairman of Disney and Lewis Kling, the Chairman of Flowserve, one of our portfolio companies. Frank Fahrenkopf, the co-chair of the Com-mission on Presidential debates handicapped the outcome of the November elections for us as well.
In early December, following the collapse of Lehman, the na-tionalization of Fannie and Freddie, the Reserve Fund (money mar-ket fund) breaking the “buck” ($1.00 Net Asset Value), a monu-mental Congressional log jam and the freezing of the credit markets, we hosted a special second client gathering at the Paley Center. Over the course of the morning, Howard F. Ward, the head of our Global Growth team reviewed the critical path of the economic meltdown; analysts focused our attention on a number of net-nets, truly inexpensive stocks; and Barbara Marcin provided her views on the state of the market and posed audience questions to Mario Gabelli.
Larry J. Haverty Michael D. Eisner of Disney Chris Marangi

GAMCO Investors, Inc.
9
After a tumultuous year, investors should review how they are positioned with an eye for the economic recovery that is expected to begin later this year. The exceptional decline in share prices over the past year has created numerous moneymaking opportunities for long-term investors. There is evidence that in-vestors are slowly returning to stocks as our record setting monetary and fiscal stimulus begins to sow the seeds of recovery and the banking system emerges from the intensive care unit. While consumers will play a role in recovery, it may be secondary to the immediate impact of government spending, both feder-al and state, on a variety of construction and infrastructure projects. Consumers are apt to play on more pronounced role in the recovery as the unemployment rate eventually moderates, sometime in 2010.
Our approach to Growth investing extends beyond the more typical Growth domain of Technology, Healthcare, Specialty Retailing and Consumer Staples, especially as we believe the current set of circumstances points to a strong pe-riod of growth in industries more associated with cyclical growth than secular growth. We want to be well represented in areas where growth is headed. Times change. Nothing is constant. In addition to ongoing investments in traditional Growth industries, we have added exposure to businesses that will benefit from global infrastructure spending, both here in the U.S., as well as in the emerging markets. Many billions of dollars will be spent on infrastructure projects in the years ahead as a matter of public policy. While we are largely repairing existing infrastructure domestically, the emerging markets must build infrastructure in order to accommodate their economic and population growth.
Improving economies led by infrastructure spending will result in supply and demand imbalances for a variety of building materials and capital goods. The stocks of many of these companies were hit hard during the market sell-off and now offer compelling value. We may be revisiting higher prices for many commodities soon, as rising demand will illuminate supply bottlenecks resulting from years of underinvestment and a more hostile political climate in some areas of the world. Not only is the era of cheap energy on the wane, so is the era of abundance in other commodities too. The world’s population growth is likely to strain a number of resources, including energy, water, food and certain industrial materials. We want to be in front of this developing story. There is money to be made in machinery, materials, water infrastructure, and energy.
Our energy investments are significant and reflect troubling realities. The science of global warming is dictating a change in public policy to embrace clean alternative fuels such as wind and solar. We support this effort and have investments in lead-ing solar companies like First Solar and leading wind power companies like Vestas Wind Systems.
The entire clean energy field offers tremendous growth over the next decade. No area offers as much potential if the de-veloped and developing economies join together to support these new sources of energy. At the same time, we are largely wed to existing fossil fuel technologies for most of our energy needs for many years. We simply cannot grow the new clean fuel technologies fast enough to become a meaningful piece of the pie for some time. Therefore, oil and natural gas are industries we cannot ignore.
While oil prices will fluctuate due to seasonal considerations and the pace of economic growth, we believe meeting the world’s oil demand will become a greater, if not graver, challenge in the years ahead. Non-OPEC supply is struggling to grow as major exporters like Mexico and Russia fail to meet expectations. Increasingly, Saudi Arabia seems to be the one major producer with excess capacity, although the lack of third party verification of Saudi’s proved reserves is troubling. The col-lapse in oil prices late last year is a setback for future capacity as a number of projects have been cancelled or postponed.
Additionally, OPEC producers are using much more of their production for internal use, leaving less available for export. These tend to be high population growth countries whose economies grow in synch with the price of crude. Consequently, higher crude prices will accelerate their own economic growth and leave still less fuel available for export. The world con-sumes about 85 million barrels of oil a day (20 million in U.S.) and it will be a challenge to grow this figure after accounting for annual oil field depletion rates. Petrobras, the Brazilian oil major, is our favorite oil company due to its strong growth prospects in deep waters off the coast of Brazil. The price of crude bottomed at about $30 per barrel last December and is currently sell-ing at $52 per barrel.
Howard F. Ward, CFA
Joined GAMCO Investors, Inc. in 1995 as Senior Vice President and Portfolio Manager of the GAMCO Growth Fund. In 2004 he was named Director of Growth Products. Prior to joining Gabelli, Howard spent twelve years at Scudder, Stevens and Clark where he served as Managing Director and Product Leader of Scudder’s large capitalization growth product and lead portfolio manager of the Scudder Large Company Growth Fund and the Scudder Balanced Fund. Howard is a Chartered Financial Analyst and a member of the New York Society of Security Analysts. He graduated from Northwestern University in 1978 with a BA in economics.
— “Growth Investing” —
10
GAMCO Investors, Inc.
— “Growth Investing” — Fortunately, the U.S. and Canada are rich in natural gas. New shale drilling techniques have dramatically expanded the base of U.S. reserves in the past year. Natural gas is cleaner than oil and coal and will gain market share among the fossil fuels. Still, the ability to substitute natural gas for oil or coal is limited. Nevertheless, it will be a growth fuel and domestic explora-tion and production companies like Devon Energy, XTO Energy, Apache and Chesapeake, among others, should benefi t as its use expands. Like oil, the price of natural gas collapsed in the past year. We believe it will rise signifi cantly in percentage terms over the next year or two, from the current price of $3.80 per tcf.
America’s biggest export is food. There is a global food shortage that will worsen with climate change, population growth and rising incomes in emerging markets (which tends to increase the demand for protein in the diet). To address this concern, we must increase crop yields by advances in seed technology and the use of various fertilizers. There are few options as the amount of arable land is tapped out. We need crops that use less water and are more immune to disease. This is especially true if we continue forward with bio-fuels to generate energy. Monsanto is the biotech leader of agriculture and our preferred investment in this area. We also have investments in Syngenta, Mosaic and Potash. We invest in Deere as a benefi ciary of strong farm income levels.
Infrastructure, energy and materials are areas we have targeted as entering periods of above average growth. Another non-traditional Growth area is the fi eld of defense spending and homeland security. We are fi ghting a war in Afghanistan and trying to pull out of Iraq. We are dealing with a potential nuclear Iran and the desire of many Middle East states to begin “nuclear energy” programs, as they fear the dangers of a nuclear Iran. Relations between Iran and Israel are problematic to the U.S. given our support for Israel. Experts believe Iran has also been supporting a nuclear program in Syria, with key material and technology courtesy of North Korea. North Korea is a problem on its own, as they prepare to test long-range missiles this April. Pakistan is another puzzle with disruptive capabilities; witness the Mumbai attacks this winter. Aside from these hot spots and the ongoing terrorist threat at home, our military equipment needs repairs and replacements after years of fi ghting in the Middle East. We need more and better equipment and we need more soldiers, as President Obama has stated. While not all defense programs will grow and some will be terminated, we must spend vast sums to maintain and enhance our security. Companies we have invested in with exposure to this market include Rockwell Collins, Harris Corp., ITT Corp., United Tech-nologies and FLIR Systems. Our focus is not on missiles and bombs but on communications, electronics, jet engines, avionics and night vision goggles.
We believe there is a special opportunity in certain fi nancial stocks, given their fall from grace in the past year. This is not a blanket endorsement of fi nancials, especially for our use. We believe a targeted group of fi nancials fi ts with our Growth style, especially coming out of a historic bear market. Our emphasis is not money center banks, but companies with signifi cant recurring fee businesses and growing asset management and servicing businesses. With the stock market recently at a twelve-year low, we believe owning companies positioned to gain from rising asset prices and transaction volumes will ultimately be a winning strategy. Investments that we made in the fourth quarter of last year, to take advantage of price weakness at that time, include State Street Corp., Goldman Sachs, BlackRock, T. Rowe Price, Charles Schwab, Bank of New York/Mellon and Northern Trust Company.
Investments in these new growth businesses and fi nancials represent about half of our Growth portfolios today. The other half remains our more traditional Growth sectors like Technology, Healthcare, Consumer Staples and Consumer Discretionary. The portfolio’s largest single industry sector exposure is to Technology, representing about one-quarter of the total portfolio. Our focus is on the large companies that defi ne industry standards like Google, Apple, Microsoft, IBM, Intel, Qualcomm, Re-search in Motion, Adobe and Cisco Systems. All of these companies have bulletproof balance sheets and will exit the downturn in strong condition.
We remain enthusiastic about the longer term prospects for specialty retailing giants like Amazon.com, Costco and Nike. While their businesses have been hurt by the weak economy, they have gained market share. Our healthcare exposure is lighter than it has been historically, due to concerns about pricing pressures. Nevertheless, we believe companies like Gilead Sciences (the leader in HIV treatment), St. Jude Medical and Stryker will grow nicely. Every Growth portfolio needs a few anchors to windward. Our anchors are Proctor & Gamble, PepsiCo and Nestle. These exceptionally well managed global consumer companies are not sprinters but they will be there to provide ballast to your portfolio when storms arise.
We believe Growth is due for a comeback and we are going to work hard to make sure we are among the leaders in the next upturn. We believe our more inclusive Growth approach positions our portfolios for maximum gain as the economic recovery gains momentum.
GAMCO Investors, Inc.
11
— What is next for Japan — Japan is not known for its trade deficits. So it came as a mild surprise when a monthly deficit appeared in August 2008 – a surprise that turned into full-scale alarm when the deficit ballooned throughout the year and into the early months of 2009.
So much for Japan as export superpower.
The disappearance of the trade surplus was one of many setbacks for Japan in 2008. The financial crisis on Wall Street and its effects on the global economy of course precipitated many of these problems: accelerating bankruptcies in the real estate sector, a resurgent Yen, an operating loss at Toyota for the first time since 1937, and a 26-year low for stocks. The underlying problems, however, are Japan’s alone.
What the widening trade deficit and the resulting –12.1% plunge in GDP during the last quarter of 2008 revealed was the fragility of Japan’s post-2002 economic recovery, following a 12-year period of deregulation and restructuring. Japan, as it turns out, is still beholden to the US, and now China, for growth and has done little to shift its economy to a more balanced structure. Economists tell us that a trade deficit is not bad in and of itself. In Japan’s case, however, the reversal has been so swift, resulting mainly from a steep fall-off in exports (e.g., -45% YoY to China), that unemployment is now likely to rise sharply, hurting domestic con-sumption and re-introducing deflation only a year after it was thought to have been defeated.
We now have the pathetic spectacle of a Japan looking to China’s fiscal stimulus package to pull it out of its economic doldrums. (China’s GDP is three-quarters the size of Japan’s.) This, of course, is not a recipe for sustainable recovery.
It is undeniable that Japan will need to rely on the rest of the world to grow its economy over the long run, because Japan’s population is in decline and getting older. The challenge is to access external growth in a balanced manner, rather than through the simple exporting of goods.
Fortunately, a growing number of Japanese companies are facing up to this issue, without waiting for policymakers to help. In practical terms, this means more overseas M&A. Japanese corporations held $1.25tril. in cash at the end of 2008. The current depressed market for assets worldwide, coupled with the strongest Yen in 13 years, provides a window for more Japanese com-panies to strike.
‘Over-capitalized’ and with large cash holdings, pharmaceutical and food companies became active in global M&A in 2008. All top-5 drug companies have by now made major acquisitions overseas, mostly in all-cash deals. We expect activity to increase soon in the video game, household goods, natural resource, technology, and chemical sectors as well, with a focus on companies in Asia and Australia.
This trend marks an important step in the maturation of Japan’s economy, as companies move beyond their Japanese identity to assure long-term growth.
Population Change Through Year 2050 (millions)Countries 2000 2050e ChangeIndia 1,017 1,531 +51%USA 285 409 +44%Brazil 172 233 +35%China 1,275 1,395 + 9%Japan 127 110 - 13%Russia 146 102 - 30%Source: UN
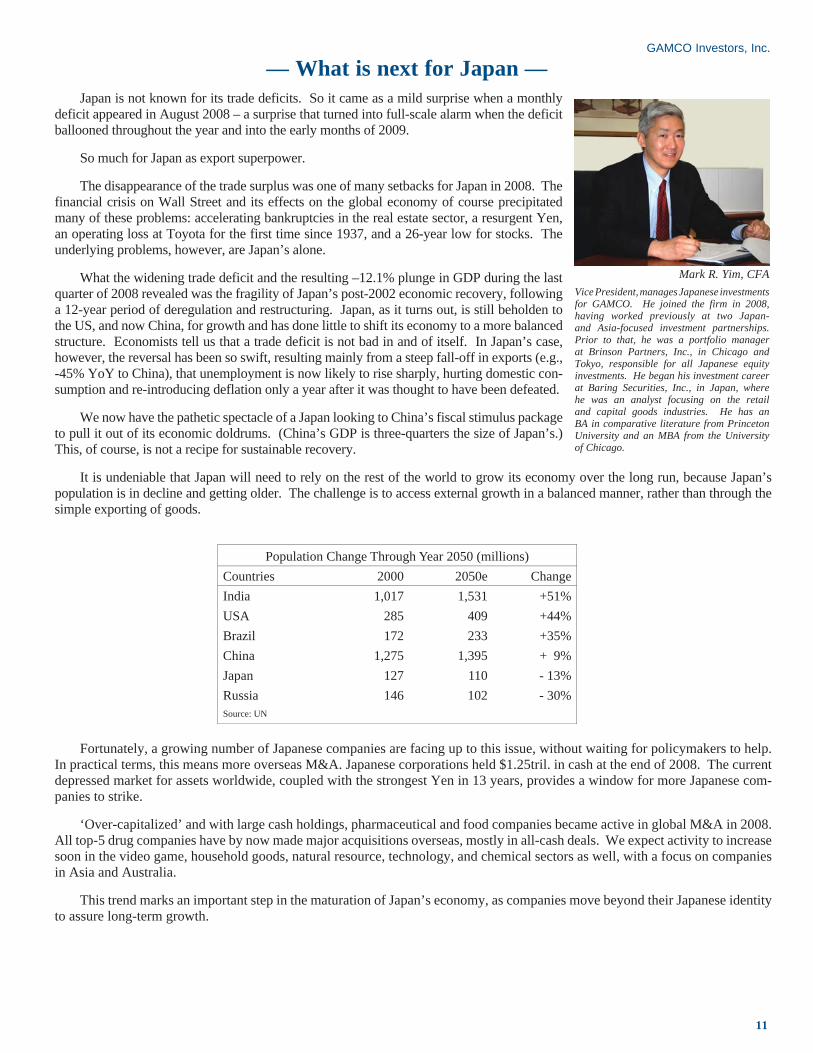
Mark R. Yim, CFAVice President, manages Japanese investments for GAMCO. He joined the firm in 2008, having worked previously at two Japan- and Asia-focused investment partnerships. Prior to that, he was a portfolio manager at Brinson Partners, Inc., in Chicago and Tokyo, responsible for all Japanese equity investments. He began his investment career at Baring Securities, Inc., in Japan, where he was an analyst focusing on the retail and capital goods industries. He has an BA in comparative literature from Princeton University and an MBA from the University of Chicago.
— Gold — On 15th August 1971 President Richard Nixon took the U.S. off the gold stan-dard and the world entered a new monetary era. A world of fi at currencies. The word fi at comes from Latin “let it be done.” Fiat money assumes value because a government requires it in payment of taxes and decrees it can be used to pay debt or buy goods and services.
It took investors a few years to grasp the consequence of this action as cen-tral bankers aided and abetted the creation of credit on a massive scale. But investors soon became busy. What did they do? Borrow and buy assets. Assets of any kind; stocks, bonds, real estate, art and others. Financial deregulation and the development of new fi nancial products added gasoline to the fi re. Do you remember your grandparents talking about the “Shadow Banking System”? Probably not. Indeed, their generation did not think houses were an asset that appreciated in value and that could fund a comfortable retirement.
Debt exploded. Total U.S. credit market debt stood at about 150% of the economy in 1971. This had not changed much since the Second World War. By the end of 2008 this had grown to over 370% of GDP or $52.6 trillion. Equally over the past few decades it has taken more and more debt to generate a dollar of GDP growth. In the 1920’s it took $1.70 of debt to generate a dollar of growth. Since 2000 this has risen to $5.40 of debt to generate a dollar of economic activity.*
This has proven to be unsustainable. Debt supercharges returns when asset values are rising but is miserable when asset values decline. This is now happening. How does an economy solve a debt overhang? There are three ways; through rapid economic growth, default or infl ation. The latter often appears to be the solution of choice. Mr. Bernanke, Chairman of the Federal Reserve, made a speech before the National Economists Club on 21 November 2002 titled Defl ation – Making Sure “It” Doesn’t Happen Here. He said the following:
“... a central bank whose accustomed policy rate has been forced down to zero has most defi nitely not run out of ammunition. The conclusion that defl ation is always reversible under a fi at money system follows from basic economic reasoning. A little parable may prove useful: Today an ounce of gold sells for $300, more or less. Now suppose that a modern alchemist solves his subject’s oldest problem by fi nding a way to produce unlimited amounts of new gold at essentially no cost. Moreover, his invention is widely publicized and scientifi cally verifi ed, and he announces his intention to begin massive production of gold within days. What would happen to the price of gold? Presumably, the potentially unlimited supply of cheap gold would cause the market price of gold to plummet. Indeed, if the market for gold is to any degree effi cient, the price of gold would collapse immediately after the announcement of the invention, before the alchemist had produced and marketed a single ounce of yellow metal. ... Like gold, U.S. dollars have value only to the extent that they are strictly limited in supply. But the U.S. government has a technology, called a printing press (or, today, its electronic equivalent), that allows it to produce as many U.S. dollars as it wishes at essentially no cost. By increasing the number of U.S. dollars in circulation, or even by credibly threatening to do so, the U.S. government can also reduce the value of a dollar in terms of goods and services, which is equivalent to raising the prices in dollars of those goods and services. We conclude that, under a paper-money system, a determined government can always generate higher spending and hence positive infl ation. ”
[ * Ned Davis Research - http://www.ndr.com ]
During March 2009 the Bank of England announced that they would spend over $100 billion to purchase government debt. They are likely to double this program creating over $200 billion “new” money. This equates to about 20% of the outstanding government debt. The Japanese central bank has adopted a similar policy although the amounts are smaller and the Swiss central bank has intervened in the exchange market to reduce the value of the Franc. Then on March 18th 2009
GAMCO Investors, Inc.
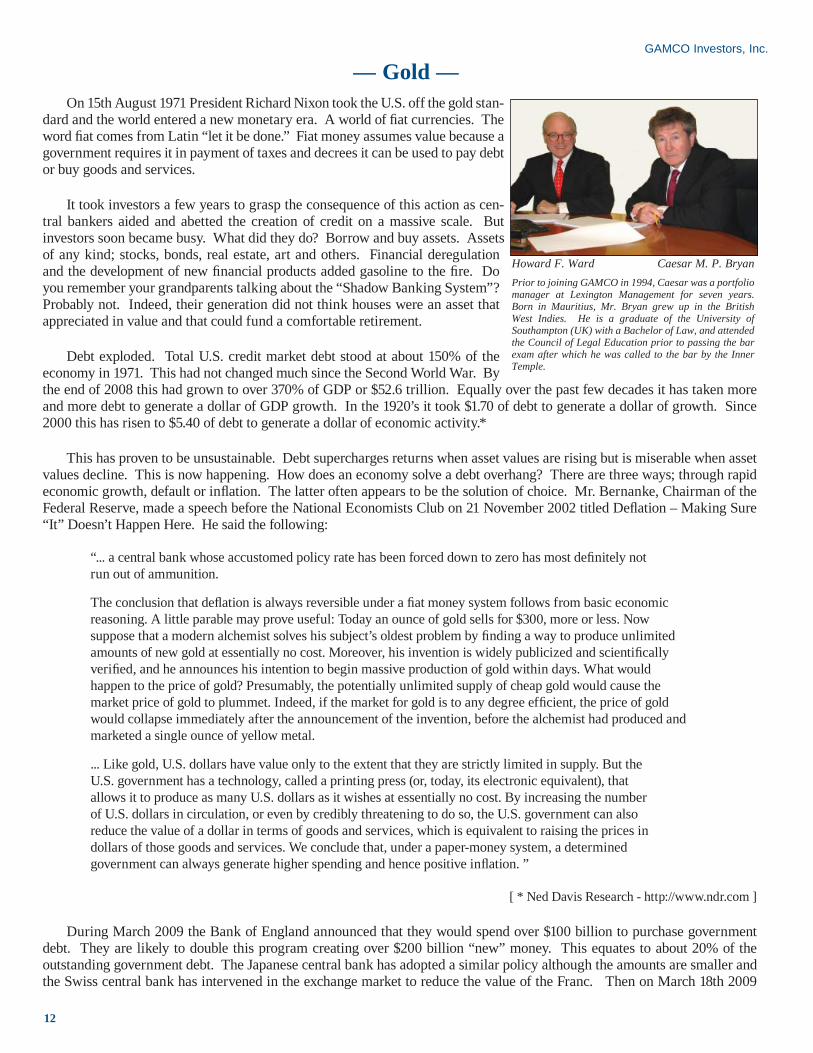
Howard F. Ward Caesar M. P. BryanPrior to joining GAMCO in 1994, Caesar was a portfolio manager at Lexington Management for seven years. Born in Mauritius, Mr. Bryan grew up in the British West Indies. He is a graduate of the University of Southampton (UK) with a Bachelor of Law, and attended the Council of Legal Education prior to passing the bar exam after which he was called to the bar by the Inner Temple.
12

following a policy meeting the Federal Reserve said:
“To provide greater support to mortgage lending and housing markets, the Committee decided today to increase the size of the Federal Reserve’s balance sheet further by purchasing up to an additional $750 billion of agency mortgage-backed securities, bringing its total purchases of these securities to up to $1.25 trillion this year, and to increase its purchases of agency debt this year by up to $100 billion to a total of up to $200 billion. Moreover, to help improve conditions in private credit markets, the Committee decided to purchase up to $300 billion of longer-term Treasury securities over the next six months.”
What does this mean? The Federal Reserve has embarked on a policy of printing money. Over the past year the Federal Reserve balance sheet has risen $900 billion to $1.9 trillion. The percentage held in Treasuries has fallen to 25% from 88%. Instead, lower quality assets have been purchased. Its balance sheet will now likely grow to over $4 trillion by year end. This is the monetary equivalent of “shock and awe.” This may be necessary but is unprecedented and is likely to have some unin-tended consequences. Will they be able to withdraw this liquidity in a timely manner when the economy recovers preventing a rise in the rate of infl ation? Gold, the ultimate monetary asset, offers investors insurance against a policy mistake.
Investors can gain exposure to gold by owning bullion or investing in gold stocks. We believe gold stocks offer an interesting investment opportunity in an environment of higher gold prices. First, they have underperformed gold since the price of gold started rising in 2001. Second, with a cost of production of up to $500 per ounce a rising gold price offers substantial earnings leverage. Third, a higher gold price translates into rising reserves and revenues.
Under the Bretton Woods Agreement of 1944 which established the dollar as the world’s reserve currency, the U.S. had to have enough gold to swap it for the dollars held by the rest of the world. At the current market price the gold held by the U.S. is worth about $250 billion. This compares with dollar reserves of about $4.6 trillion. Mr. Bernanke has suggested that the current fi nancial mess had its genesis in the large build up of global fi nancial imbalances. There is a chance that the global fi nancial architecture will be reformed. Could gold play a role? Possibly.
— Gold —GAMCO Investors, Inc.
13
— South East Asia = China — China, the world’s third largest economy, is not immune to the global fi nancial crisis. On the contrary, China’s GDP growth rate slid to a seven-year low of 9% in 2008, breaking a string of fi ve straight years of double-digit growth, due to the deterioration in the global economy. The World Bank cut its 2009 growth estimate for China’s GDP from 7.5% to 6.5%. This is well below China’s Premier Wen Jia Bao’s promise to deliver GDP growth of 8% and to create 9 million urban jobs (to cap city unemployment rate at 4.6%.) The concern is that if GDP falls below 8%, unemployment will escalate, and with it, a growing level of social unrest.
The recession will likely continue through the de-leveraging process of the global economies. To counter-act a collapse in exports, Chinese authorities announced on No-vember 9, 2008, a two-year stimulus plan of RMB 4 trillion (USD 585 billion) to boost domestic demand. By increasing domestic consumption, China will reduce its reliance on exports (China’s exports account for 36% of its GDP). The expected decline in exports also prompted the government to implement several measures, including a gradual reduction of export taxes to zero, introduction of tax rebates and fi nancial support to exporters.
Virgil ChanJoined GAMCO in 2008 to manage its Asia operations. Mr. Chan will be based in Hong Kong. Before GAMCO, Mr. Chan was with Symphony Capital Partners (formerly Schroder Capital Partners) in Singapore. He received his MBA from the Fellows Program at the MIT of the Sloan School of Manage-ment and holds an undergraduate degree from Washington University in St. Louis.

16
GAMCO Investors, Inc.
— South East Asia = China —On March 6, 2009, the National Development and Reform Commission (NDRC) revised the stimulus package by focusing in-vestments on social welfare projects, rural development, and technology advancement. The allocations of the revised stimulus package investments are summarized below 1:
• 38% Public Infrastructure Development – Railway, roads, irrigation, and airport construction projects • 25 Post-Quake Reconstruction – Reconstruction of regions hit by the May 2008 Sichuan earthquake • 10 Social Welfare – Construction of low-cost housing, rehabilitation of slums, and other social safety-net projects • 9 Technology Advancement – Upgrading the Chinese industrial sector with a focus on high-end production • 9 Rural Development – Building public amenities, resettling nomads, supporting agricultural works, and providing safe drinking water • 5 Sustainable Development – To promote energy saving and poison gas emission cuts and environmental engineering • 4 Educational & Cultural Projects – Funding for educational, cultural, and family planning purposes
[ 1 Source: The Economic Observer Online ]
On March 13, 2009, Premier Wen reiterated China’s goal of 8% GDP growth for 2009. He acknowledged the challenges but voiced his willingness to launch additional economic stimulus plans to ensure the goal is achieved. China has the fl exibility to run a large fi scal defi cit to support the economy. However, retail sales appear to have stabilized, fi xed asset investments have accelerated underscoring that consumption and investments are resilient. In addition, over half of China’s bank lending goal of at least RMB 5,000 billion was met in the fi rst two months of 2009. This spurred the broad money supply (M2) to jump 20.5% YOY in February. Clearly, China’s state-owned banks are responding to the government’s request for them to extend credit to support the stimulus package initiatives.
Sales surged in January and February in response to the Chinese government’s reduction in consumption tax on small-engine cars plus an allocation of RMB15 billion to stimulate the sales of small and environmentally friendly vehicles. In Janu-ary, China, sold the most vehicles (735,500 units) on a global basis for the fi rst time.
China’s foreign exchange reserves of approximately USD 2.0 trillion are the largest. China’s leaders have voiced their con-cern regarding the security of these assets, the bulk of which has been invested in low-yielding US government-backed bonds and they are under increasing pressure to diversify these reserves. Chinese companies are encouraged to go abroad to purchase assets and to pursue expansion opportunities. This led to a sharp increase in acquisitions, mostly energy and resource com-panies because of their strategic importance to China (in addition to the decline in commodity prices). Chinese fi rms pledged more than $50 billion USD in Russian and Brazilian oil deals, as well as Australian mining fi rms including Mount Gibson, Fortescue Metals Group, Rio-Tinto, OZ Minerals, and Murchison. To help expedite the investments, the Chinese government recently decentralized the approval process for investments. The Central Government will approve only large deals; otherwise the transactions will be reviewed and approved by local governments.
There is no doubt that 2009 will be a challenging one for China. It faces many of the same problems confronting neighbor-ing countries and the rest of the world as we cope with the economic crisis. However, if China’s stock market can be considered a good proxy, China will re-main resilient and will push through this diffi cult time in good form. The China Share Index 300 (CSI) is up 17.6% year to date, making it one of the best per-forming indices in the world. With its strong balance sheet and aggressive fi s-cal stimulus packages, China is poised to be one of the fi rst (and many believe China will be the fi rst) to recover from this economic downturn.
14

GAMCO Investors, Inc.
17
May 15, 2008
Gabelli & Company, Inc.
-Please Refer To Important Disclosures On The Last Page Of This Report-
One Corporate Center Rye, NY 10580-1422 Tel (914) 921-3700 Fax (914) 921-5098 www.gabelli.com
ABUSE DETERRENT OPIOIDS
FDA Advisory Panel
- Alpharma (ALO - $25.70 – NYSE) - Pain Therapeutics (PTIE - $8.48 – NASDAQ) - Purdue Pharma (Privately Owned) Kevin Kedra (914) 921-7721
Remoxy – Pain Therapeutics
Embeda - Alpharma
OTR – Purdue Pharma
Source: Durect Corp. presentation
Source: FDA Panel briefing documents
Source: Alpharma presentation
June 13, 2008
Gabelli & Company, Inc.
-Please Refer To Important Disclosures On The Last Page Of This Report-
American Water Works Association
Annual Conference & Exposition
“Recap”
- Badger Meter (BMI – $48.59 – NYSE)
- Basin Water (BWTR – $4.15 – NASDAQ)
- Mueller Water Products (MWA’B – $8.93 – NYSE)
Tony Fritz, CFA (914) 921-7792 ©2008 Gabelli & Company, Inc.
One Corporate Center Rye, NY 10580-1422 Tel (914) 921-3700 Fax (914) 921-5098 www.gabelli.com
July 30, 2008
Gabelli & Company, Inc.
-Please Refer To Important Disclosures On The Last Page Of This Report-
One Corporate Center Rye, NY 10580-1422 Tel (914) 921-8355 Fax (914) 921-5098 www.gabelli.com
The Pearl Of The Bosporus
Emerging Markets Wireless At Discount Prices
Source: www.ling.gu.se, www.turkcell.com.tr, www.webscavengers.net
Source: www.turkcell.com.tr
©2008 Gabelli & Company, Inc.Sergey Dluzhevskiy (914) 921-8355
Turkey GSM/1 011 – 90 – 532
Ukraine Mobile II 011 – 380 – 63
September 10, 2008
Gabelli & Company, Inc.
-Please Refer To Important Disclosures On The Last Page Of This Report-
SMOKELESS TOBACCO
UST Altria
Conwood Reynolds Swedish Match
(UST – NYSE) (MO – NYSE) (RAI – NYSE) (SWMA – SS)
Premium
Mid-priced
Value
# of Cans (a) 660 350 350 (a) Millions. 2008 estimated. © 2008 Gabelli & Company, Inc. Kevin Dreyer (914) 921-7791
One Corporate Center Rye, NY 10580-1422 Tel (914) 921-7791 Fax (914) 921-5098 www.gabelli.com
August 12, 2008
Gabelli & Company, Inc.
-Please Refer To Important Disclosures On The Last Page Of This Report-
One Corporate Center Rye, NY 10580-1422 Tel (914) 921-3700 Fax (914) 921-5098 www.gabelli.com
Trash Compaction
- Allied Waste Industries (AW – $13.68 – NYSE)
- Republic Services, Inc. (RSG – 35.05 – " )
- Waste Management, Inc. (WMI – 36.11 – " )
Tony Fritz, CFA (914) 921-7792 ©2008 Gabelli & Company, Inc.
http://www.logancountyrecycles.com
April 24, 2008
Gabelli & Company, Inc.
-Please Refer To Important Disclosures On The Last Page Of This Report-
Pet Market
Source: www.petfoodinstitute.org
Companies Highlighted
Alpharma Inc. (ALO – NYSE) Animal Health International , Inc. (AHII – NASDAQ) Del Monte Foods Company (DLM – NYSE) Idexx Laboratories, Inc. (IDXX – NASDAQ) MWI Veterinary, Inc. (MWIV – " ) PetSmart Inc. (PETM – NYSE) Petsmed Express, Inc. (PETS – NASDAQ) VCA Antech (WOOF – " )
©2008 Gabelli & Company, Inc. Sarah Donnelly (914) 921-5197 Kevin Kedra (914) 921-7721
One Corporate Center Rye, NY 10580-1422 Tel (914) 921-3700 Fax (914) 921-5098 www.gabelli.com
June 30, 2008
Gabelli & Company, Inc.
-Please Refer To Important Disclosures On The Last Page Of This Report-
Food Inflation Supermarket Impact
Winn-Dixie Stores, Inc. (WINN – NASDAQ) Whole Foods Market (WFMI – NASDAQ) ©2008 Gabelli & Company, Inc. Justyn Putnam (914) 921-8325
One Corporate Center Rye, NY 10580-1422 Tel (914) 921-5100 Fax (914) 921-5098 www.gabelli.com
Gabelli & Company, Inc.
-Please Refer To Important Disclosures On The Last Page Of This Report-
Indian Hospitality, Global Ambitions
Source: Indian Hotels Company Ltd.
Indian Hotels Company Limited (IHCL-INR111.85- Mumbai)
Amitabh Kapoor Research Analyst (914) 921-7786
One Corporate Center Rye, NY 10580-1422 Tel (914) 921-3700 Fax (914) 921-5098 www.gabelli.com
April 1, 2008
— Depend On Our Ideas —— 2008 —
Ideas . . . Focus . . . Innovation
R E S E A R C H
CASHFLOW
EPS
EPS
PMV
MANAGEMENT
15
Our research analysts follow their industries on a global basis. They gather, array, and project detailed fi nancial data to provide a basis for com-pany valuations. They identify and follow sector trends, fi nd the companies that will benefi t or hurt the most, and make investment recommendations accordingly. Meeting management and competi-tors, attending tradeshows and company meetings are also important elements in the research process. By looking at smaller companies that are ignored or undiscovered by the rest, we gain an edge which allows us to add alpha. - Laura Linehan

GAMCO Investors, Inc.
Assets Under Management($ in millions)
December 31, % CAGR
1998 1999 2000 2001 2002 2003 2004 2005 2006 2007 2008 12/98-12/08
Equity: Mutual Funds $ 7,159 $10,459 $10,680 $10,165 $ 8,091 $11,618 $12,371 $12,963 $14,195 $16,115 $10,367 3.8 %
Institutional and High Net Worth Direct 6,436 8,227 8,248 8,855 7,410 9,107 9,881 9,550 10,283 10,708 $6,861 0.6 Sub-advisory 697 1,143 1,894 2,658 2,580 3,924 3,706 2,832 2,339 2,584 1,585 8.6 Total Equity $14,292 $19,829 $20,822 $21,678 $18,081 $24,649 $25,958 $25,345 $26,817 $29,407 $18,813 2.8
Fixed Income: Total Fixed Income $ 1,862 $ 1,875 $ 2,292 $ 2,510 $ 2,590 $ 2,218 $ 1,887 $ 819 $ 794 $ 1,146 $1,543 -1.9
Investment Partnerships: Investment Partnerships $ 146 $ 230 $ 437 $ 573 $ 578 $ 692 $ 814 $ 634 $ 491 $ 460 $295 7.3Total Assets Under Management $16,300 $21,934 $23,551 $24,761 $21,249 $27,559 $28,659 $26,798 $28,102 $31,013 $20,651 2.4
Assets Under Management: Mutual Funds $ 8,197 $11,640 $12,113 $11,955 $10,068 $13,332 $13,870 $13,698 $14,939 $17,237 $11,888 3.8 Institutional and High Net Worth Direct 7,260 8,921 9,107 9,575 8,023 9,611 10,269 9,634 10,333 10,732 6,883 -0.5 Sub-advisory 697 1,143 1,894 2,658 2,580 3,924 3,706 2,832 2,339 2,584 1,585 8.6 Investment Partnerships 146 230 437 573 578 692 814 634 491 460 295 7.3Total Assets Under Management $16,300 $21,934 $23,551 $24,761 $21,249 $27,559 $28,659 $26,798 $28,102 $31,013 $20,651 2.4
Notes on Non-GAAP Financial MeasuresA. Operating income before management fee expense is used by management for purposes of evaluating its business operations. We believe this measure is useful in illustrating the operating results of the Company as management fee expense is based on pre-tax income and includes non-operating items including investment gains and losses from the Company’s proprietary investment portfolio and interest expense.
Reconciliation of Non-GAAP Financial Measures to GAAP:
The reconciliation of operating income before management fee to operating income for each of the four quarters in 2007 and 2008 is computed as follows (in thousands):
2007 20081st QTR 2nd QTR 3rd QTR 4th QTR Full Year 1st QTR 2nd QTR 3rd QTR 4th QTR Full Year
Operating income before management fee $23,912 $20,617 $30,641 $42,460 $117,630 $25,238 $23,793 $23,013 $17,059 $89,103 Management fee 3,401 3,449 3,541 4,072 14,463 1,981 2,586 1,740 (2,221) 4,086
Operating income $20,511 $17,168 $27,100 $38,388 $103,167 $23,257 $21,207 $21,273 $19,280 $85,017
B. Cash and investments as adjusted have been computed as follows (in millions):
December 31,1999 2000 2001 2002 2003 2004 2005 2006 2007 2008
Cash and cash equivalents $103 $ 69 $305 $311 $387 $257 $173 $138 $168 $333 Investments (marketable securities) 91 191 115 218 228 306 415 480 367 215 Totalcash and investments (marketable securities) 194 260 420 529 615 563 588 618 535 548 Amounts payable to /receivable from brokers (6) — (8) (17) (5) 5 6 17 32 15 Adjusted cash and investments (marketable securities) 188 260 412 512 610 568 594 635 567 563 Investments (available for sale) — — 7 6 67 76 81 102 127 76Total adjusted cash and investments $188 $260 $419 $518 $677 $644 $675 $737 $694 $639 C. Net income and net income per shareNet income for 1999 as adjusted of $45.7 million or $1.53 per share was computed before non-recurring charges of $30.9 million (net of $19.8 million tax benefit)or $1.03 per share, respectively. Net income for 1999, including non-recurring charges, was $14.8 million of $0.50 per share.
16

GAMCO Investors, Inc.
Quarterly Financial Data2008 - 2007
(In thousands, except per share data)
20081ST Quarter 2ND Quarter 3RD Quarter 4TH Quarter Full Year
Income Statement Data:Revenues . . . . . . . . . . . . . . . . . . . . . . . . . . . . . . . . . . 66,548 65,424 62,980 50,060 245,012 Expenses . . . . . . . . . . . . . . . . . . . . . . . . . . . . . . . . . . 41,310 41,631 39,967 33,001 155,909 Operating income before management fee 25,238 23,793 23,013 17,059 89,103
Investment income . . . . . . . . . . . . . . . . . . . . . . . . . . . . . . . . . . . . . . . (3,615) 4,206 (3,446) (36,308) (39,163)Interest expense . . . . . . . . . . . . . . . . . . . . . . . . . . . . . . . . . . . . . (2,067) (2,199) (2,139) (3,269) (9,674)Other income (expense), net. . . . . . . . . . . . . . . . . . . . . . . . . (5,682) 2,007 (5,585) (39,577) (48,837)Income before management fee, income taxes and minority interest . . . . . . . . . . . . 19,556 25,800 17,428 (22,518) 40,266 Management fee. . . . . . . . . . . . . . . . . . . . . . . . . . . . . . . . . . . 1,981 2,586 1,740 (2,221) 4,086 Income before income taxes and minority interest 17,575 23,214 15,688 (20,297) 36,180 Income taxes . . . . . . . . . . . . . . . . . . . . . . . . . . . . . . . . . . . . . . 7,326 8,719 3,837 (7,559) 12,323 Minority interest. . . . . . . . . . . . . . . . . . . . . . . . . . . . . . . . . . . (237) 36 (134) (674) (1,009)Net income . . . . . . . . . . . . . . . . . . . . . . . . . . . . . . . . . . . . . . . . . . $10,486 $14,459 $11,985 $(12,064) $24,866
Net income per share: Basic . . . . . . . . . . . . . . . . . . . . . . . . . . . . . . . . . . . . . . . . . . . . . $0.37 $0.52 $0.43 $(0.44) $0.89
Diluted Basic . . . . . . . . . . . . . . . . . . . . . . . . . . . . . . . . . . . . . $0.37 $0.51 $0.43 $(0.44) $0.89
Weighted average shares outstanding: Basic . . . . . . . . . . . . . . . . . . . . . . . . . . . . . . . . . . . 28,175 27,948 27,602 27,472 27,805
Diluted . . . . . . . . . . . . . . . . . . . . . . . . . . . . . . . . . . . . . . . . . . 29,031 28,743 28,400 27,482 27,841
20071ST Quarter 2ND Quarter 3RD Quarter 4TH Quarter Full Year
Income Statement Data:Revenues . . . . . . . . . . . . . . . . . . . . . . . . . . . . . . . . . . $ 66,606 $ 68,277 $ 68,469 $ 89,017 $ 292,369Expenses . . . . . . . . . . . . . . . . . . . . . . . . . . . . . . . . . . 42,694 47,660 37,828 46,557 174,739Operating income before management fee 23,912 20,617 30,641 42,460 117,630
Investment income . . . . . . . . . . . . . . . . . . . . . . . . . . . . . . . . . . . . . . . 13,572 17,359 7,324 389 38,644Interest expense . . . . . . . . . . . . . . . . . . . . . . . . . . . . . . . . . . . . . (3,380) (3,329) (2,828) (2,428) (11,965)Other income (expense), net. . . . . . . . . . . . . . . . . . . . . . . . . 10,192 14,030 4,496 (2,039) 26,679Income before management fee, income taxes and minority interest . . . . . . . . . . . . 34,104 34,647 35,137 40,421 144,309 Management fee. . . . . . . . . . . . . . . . . . . . . . . . . . . . . . . . . . . 3,401 3,449 3,541 4,072 14,463Income before income taxes and minority interest 30,703 31,198 31,596 36,349 129,846 Income taxes . . . . . . . . . . . . . . . . . . . . . . . . . . . . . . . . . . . . . . 11,207 12,856 13,340 12,145 49,548 Minority interest. . . . . . . . . . . . . . . . . . . . . . . . . . . . . . . . . . . 332 345 (81) 133 729Net income . . . . . . . . . . . . . . . . . . . . . . . . . . . . . . . . . . . . . . . . . . $ 19,164 $ 17,997 $ 18,337 $ 24,071 $ 79,569
Net income per share: Basic . . . . . . . . . . . . . . . . . . . . . . . . . . . . . . . . . . . . . . . . . . . . . $ 0.68 $ 0.64 $ 0.65 $ 0.86 $ 2.83
Diluted Basic . . . . . . . . . . . . . . . . . . . . . . . . . . . . . . . . . . . . . $ 0.67 $ 0.63 $ 0.64 $ 0.84 $ 2.79
Weighted average shares outstanding: Basic . . . . . . . . . . . . . . . . . . . . . . . . . . . . . . . . . . . 28,228 28,160 28,106 28,077 28,142 Diluted . . . . . . . . . . . . . . . . . . . . . . . . . . . . . . . . . . . . . . . . . . 29,196 29,147 29,099 29,075 29,129
17
20
GAMCO Investors, Inc.
18
GAMCO Investors, Inc.
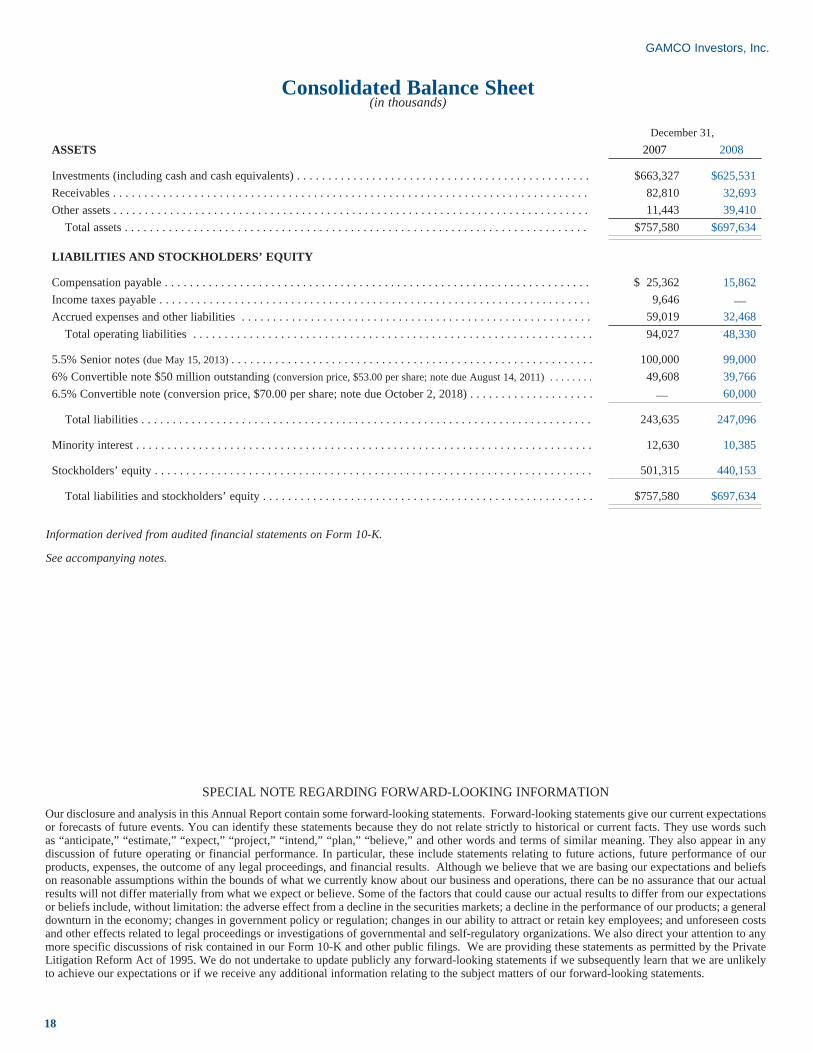
Consolidated Balance Sheet(in thousands)
December 31,ASSETS 2007 2008
Investments (including cash and cash equivalents) . . . . . . . . . . . . . . . . . . . . . . . . . . . . . . . . . . . . . . . . . . . . . . . $663,327 $625,531 Receivables . . . . . . . . . . . . . . . . . . . . . . . . . . . . . . . . . . . . . . . . . . . . . . . . . . . . . . . . . . . . . . . . . . . . . . . . . . . . 82,810 32,693 Other assets . . . . . . . . . . . . . . . . . . . . . . . . . . . . . . . . . . . . . . . . . . . . . . . . . . . . . . . . . . . . . . . . . . . . . . . . . . . . 11,443 39,410 Total assets . . . . . . . . . . . . . . . . . . . . . . . . . . . . . . . . . . . . . . . . . . . . . . . . . . . . . . . . . . . . . . . . . . . . . . . . . . $757,580 $697,634
LIABILITIES AND STOCKHOLDERS’ EQUITY
Compensation payable . . . . . . . . . . . . . . . . . . . . . . . . . . . . . . . . . . . . . . . . . . . . . . . . . . . . . . . . . . . . . . . . . . . . $ 25,362 15,862 Income taxes payable . . . . . . . . . . . . . . . . . . . . . . . . . . . . . . . . . . . . . . . . . . . . . . . . . . . . . . . . . . . . . . . . . . . . . 9,646 __
Accrued expenses and other liabilities . . . . . . . . . . . . . . . . . . . . . . . . . . . . . . . . . . . . . . . . . . . . . . . . . . . . . . . . 59,019 32,468 Total operating liabilities . . . . . . . . . . . . . . . . . . . . . . . . . . . . . . . . . . . . . . . . . . . . . . . . . . . . . . . . . . . . . . . . 94,027 48,330
5.5% Senior notes (due May 15, 2013) . . . . . . . . . . . . . . . . . . . . . . . . . . . . . . . . . . . . . . . . . . . . . . . . . . . . . . . . . . 100,000 99,000 6% Convertible note $50 million outstanding (conversion price, $53.00 per share; note due August 14, 2011) . . . . . . . . 49,608 39,766 6.5% Convertible note (conversion price, $70.00 per share; note due October 2, 2018) . . . . . . . . . . . . . . . . . . . . __ 60,000
Total liabilities . . . . . . . . . . . . . . . . . . . . . . . . . . . . . . . . . . . . . . . . . . . . . . . . . . . . . . . . . . . . . . . . . . . . . . . . 243,635 247,096
Minority interest . . . . . . . . . . . . . . . . . . . . . . . . . . . . . . . . . . . . . . . . . . . . . . . . . . . . . . . . . . . . . . . . . . . . . . . . . 12,630 10,385
Stockholders’ equity . . . . . . . . . . . . . . . . . . . . . . . . . . . . . . . . . . . . . . . . . . . . . . . . . . . . . . . . . . . . . . . . . . . . . . 501,315 440,153
Total liabilities and stockholders’ equity . . . . . . . . . . . . . . . . . . . . . . . . . . . . . . . . . . . . . . . . . . . . . . . . . . . . . $757,580 $697,634
Information derived from audited financial statements on Form 10-K.
See accompanying notes.
GAMCO Investors, Inc.
SPECIAL NOTE REGARDING FORWARD-LOOKING INFORMATIONOur disclosure and analysis in this Annual Report contain some forward-looking statements. Forward-looking statements give our current expectations or forecasts of future events. You can identify these statements because they do not relate strictly to historical or current facts. They use words such as “anticipate,” “estimate,” “expect,” “project,” “intend,” “plan,” “believe,” and other words and terms of similar meaning. They also appear in any discussion of future operating or financial performance. In particular, these include statements relating to future actions, future performance of our products, expenses, the outcome of any legal proceedings, and financial results. Although we believe that we are basing our expectations and beliefs on reasonable assumptions within the bounds of what we currently know about our business and operations, there can be no assurance that our actual results will not differ materially from what we expect or believe. Some of the factors that could cause our actual results to differ from our expectations or beliefs include, without limitation: the adverse effect from a decline in the securities markets; a decline in the performance of our products; a general downturn in the economy; changes in government policy or regulation; changes in our ability to attract or retain key employees; and unforeseen costs and other effects related to legal proceedings or investigations of governmental and self-regulatory organizations. We also direct your attention to any more specific discussions of risk contained in our Form 10-K and other public filings. We are providing these statements as permitted by the Private Litigation Reform Act of 1995. We do not undertake to update publicly any forward-looking statements if we subsequently learn that we are unlikely to achieve our expectations or if we receive any additional information relating to the subject matters of our forward-looking statements.

GAMCO Investors, Inc.
21
GAMCO Investors, Inc.
Edwin L. ArtztFormer Chairman and Chief Executive OfficerProcter & Gamble Company
Raymond C. Avansino, Jr.ChairmanE.L. Wiegand Foundation
Richard L. BreadyChairman & Chief Executive OfficerNortek Inc.
Elisa M. WilsonDirectorGAMCO Investors, Inc.
Mario J. GabelliChairman and Chief Executive OfficerGAMCO Investors, Inc.
Eugene R. McGrathFormer ChairmanConsolidated Edison Company of NY
Robert S. Prather, Jr.President and Chief Operating OfficerGray Television
Karl Otto Pöhl, Director EmeritusFormer President of Deutsche Bundesbank
Board of Directors
Investor Relations For our 10-K and other shareholder information, visit our website at www.gabelli.com or write to:
One Corporate CenterRye, New York 10580-1422914-921-5147email: [email protected]
Transfer AgentComputerShare250 Royall StreetCanton, MA 02021(781) 575-2000
Trading InformationNew York Stock ExchangeClass A Common Stock Symbol - GBL
Websitewww.gabelli.com
Investment Services InformationMutual FundsContact: Jason G. Swirbul800-GABELLIemail: [email protected]
Institutional AccountsContact: Christopher C. Desmarais914-921-5237email: [email protected]
Private AccountsContact: Paul M. Swirbul914-921-5084email: [email protected]
Investment PartnershipsContact: Daniel M. Miller914-921-5135email: [email protected]
Annual MeetingOur 2009 Annual Meeting of Shareholders will be held at 8:30 a.m. on May 5, 2009 at theGreenwich Library, 101 W. Putnam AvenueGreenwich, CT 06830
Corporate and Shareholder Information
19
Officers
Mario J. GabelliChairman and Chief Executive Officer
Douglas R. JamiesonPresident and Chief Operating Officer
Henry G. Van der EbSenior Vice President
Jeffrey M. FarberExecutive Vice President and Chief Financial Officer
Bruce N. AlpertExecutive Vice President and Chief Operating Officer, Gabelli Funds, LLC

22
GAMCO Investors, Inc.
GAMCO Investors, Inc.One Corporate Center, Rye, New York 10580-1422
www.gabelli.com800-GABELLI [email protected]