roberth.jennings indianauniversity monograph 20
TRANSCRIPT

REACTION OF FINANCIAL ANALYSTSTO MANAGEMENT
EARNINGS FORECASTS
By
Robert H. JenningsIndiana University
Monograph 20
THEFINANCIALANALYSTSRESEARCHFOUNDATION

REACTION OF FINANCIAL ANALYSTSTO MANAGEMENT
EARNINGS FORECASTS
ERRATA TO PAGE 6
Institutional Brokers Estimate System (I/B/E/S), a service ofLynch, Jones & Ryan, is available on a weekly basis. This weeklyavailability extends from well before the initial study date and continues, uninterrupted, through today. The database will continue tobe updated daily and the summary statistics recomputed and madeavailable to clients weekly.
In the study period, I/B/E/S reported on 2,400 companies. Thedata were collected from 65 major brokerage firms. Today, data isavailable on over 3,200 companies with contributed forecasts fromover 100 brokerage firms and over 25 institutions.

Copyright © 1985by
The Financial Analysts Research FoundationCharlottesville, Virginia
All Rights Reserved
Financial Analysts Research FoundationMonograph Series
Richard F. DeMong, CFAResearch Director
No. 17 Edmund A. Mennis, CFA Understanding Corpora te Penand Chester D. Clark, FSA sion Plans, 1983
No.18 Robert W. Kolb andGerald D. Gay
No.19 James E. Hatch andRobert W. White
No.20 Robert H.Jennings
Interest Rate and Stock IndexFutures and Options: Characteristics, valuation and Portfolio Strategies, 1985
Canadian Stocks, Bonds, Billsand Inflation: 1950 - 1983,1985
Reaction ofFinancial Analyststo Management EarningsForecasts, 1985
lO-digit ISBN: 0-9721477-3-X 13-digit ISBN: 978-0-9721477-3-6

I would like to thank Leonard Zacks of Zacks InvestmentResearch, Inc. for providing the financial analyst forecast dataused in this study.
RH]

CONTENTS
I INTRODUCTION 1
II THE DATA AND METHODOLOGY 5A. Data 5B. Methodology 7
III ANALYST RESPONSE TO MANAGEMENTEARNINGS FORECASTS 12
IV THE OPTIMALITY OF ANALYST RESPONSE 23
V SUMMARY 29
APPENDIX 32
FOOTNOTES 34
REFERENCES 37
v

THE FINANCIAL ANALYSTS RESEARCH FOUNDATION
Board of Trustees and Officers
Alfred C. Morley, CFA, PresidentThe Institu te of Chartered
Financial AnalystsP.O. Box 3668Charlottesville, Virginia 22903
JamesR. Vertin,CFA, Vice PresidentAlpine Counselors136 Pecora WayMenlo Park, California 94025
George W. Noyes, CFA, SecretaryStandish, Ayer & Wood, Inc.I Beacon StreetBoston, Massachusetts 02116
Edus H. Warren,Jr., CFA, TreasurerCapital Research Company280 Park AvenueNew York, New York 10017
Richard F. DeMong, CFA, Research DirectorMcintire School of CommerceMonroe Hall- University of VirginiaCharlottesville, Virginia 22903
John C. BurtonColumbia University101 Uris HallNew York, New York 10027
Charles A. D'Ambrosio, CfA, Ex OfficioUniversity of WashingtonGraduate School of Business
AdministrationSeattle, Washington 98195
M. H. Earp, CFABrittany Associates, Inc.P. O. Box 26177Dallas, Texas 75226
Charles D. Ellis, CFAGreenwich Research AssociatesOffice Park EightGreenwich, Connecticut 06830
William S. Gray, III, CFAHarris Trust & Savings BankIII West Monroe StreetChicago, Illinois 60690
Jay O. LightHarvard Business SchoolBaker 331Boston, Massachusetts 02163
Edmund A. Mennis, CFAConsultant to Investment Management405 Via Chico, Suite 7Palos Verdes Estates,
California 90274
vi
Robert D. Milne, CFADuff & Phelps Investment
Management Co.710 Ohio Savings PlazaCleveland, Ohio 44114
Roger F. MurrayP.O. Box 669Wolfeboro, New Hampshire 03894
Matthias Plum,Jr.Global Investments, L.P.600 Atlantic Avenue, Suite 1400Boston, Massachusetts 02110
William G. Shenkir, Ex OfficioMcIntire School of CommerceUniversity of Virginia, Monroe HallCharlottesville, Virginia 22903
A. A. Sommer,Jr.Morgan, Lewis & Bockius1800 M Street, N. W.Washington, D. C. 20036
Walter P. Stern, CFACapital Research Company280 Park AvenueNew York, New York 10017
Jack L. TreynorTreynor-Arbit AssociatesIII West Jackson BoulevardChicago, Illinois 60604
Donald L. Tuttle, CFAIndiana UniversityGraduate School of BusinessBloomington, Illinois 47405
Jay Vawter, CFA, Ex OfficioStein Roe & Farnham1271 Avenue of the AmericasNew York, New York 10020Chairman, Institute ofChartered
Financial Analysis
Ernest R. Widmann, CFA, Ex OfficioWidmann, Blee & Co. IncorporatedOne Station CircleNarbeth, Pennsylvania 19072Chairman, Financial Analysts
Federation
Arthur ZeikelMerrill Lynch Asset
Management, Inc.633 Third AvenueNew York, New York 10017
THE FINANCIAL ANALYSTS RESEARCH FOUNDATIONAND ITS PUBLICATIONS
1. The Financial Analysts Research Foundation is an autonomous charitablefoundation, as defined by Section SOl (c) (3) of the Internal Revenue Code.The Foundation seeks to improve the professional performance of financialanalysts by fostering education, by stimulating the development of financialanalysis through high quality research, and by facilitating the disseminationof such research to users and to the public. More specifically, the purposesand obligations of the Foundation are to commission basic studies (I) withrespect to investment securities analysis, investment management, financialanalysis, securi ties markets and closely related areas that are not presen tly oradequately covered by the available literature, (2) that are directed towardthe practical needs of the financial analyst and the portfolio manager, and (3)that are of some enduring value. The Financial Analysts ResearchFoundation is affiliated with The Financial Analysts Federation, TheInstitu te of Chartered Financial Analysts, and the University of Virginiathrough The McIntire School of Commerce.
2. Several types of studies and publications are au thorized:
A. Studies based on existing knowledge or methodology which resultin a different arrangement of the subject. Included in this categoryare papers that seek to broaden the understanding within theprofession of financial analysis through reviewing, distilling, orsynthesizing previously published theoretical research, empiricalfindings, and specialized literature;
B. Studies that apply known techniques, methodology, andquantitative methods to problems of financial analysis;
C. Studies that develop new approaches or new solutions to importantproblems existing in financial analysis;
D. Pioneering and original research that discloses new theories, newrelationships, or new knowledge that confirms, rejects, or extendsexisting theories and concepts in financial analysis. Ordinarily,such research is intended to improve the state of the art. Theresearch findings may be supported by the collection ormanipulation of empirical or descriptive data from primary sources,such as original records, field interviews, or surveys.
3. The views expressed in this book and in the other studies published by theFoundation are those of the authors and do not necessarily represent theofficial position of the Foundation, its Board of Trustees, or its staff. As amatter of policy, the Foundation has no official position with respect tospecific practices in financial analysis.
4. The Foundation is indebted to the voluntary financial support of itsinstitutional and individual sponsors by which this and other publicationsare made possible. As a SOl (c)(3) foundation, contributions are welcomedfrom interested donors, including individuals, business organizations,institutions, estates, foundations, and others. Inquiries may be directed to:
Research DirectorThe Financial Analysts Research FoundationUniversity of Virginia, Post Office Box 366.1Charlottesville, Virginia 22903
(804) 924-30.1 1
vii

I. INTRODUCTION
Perhaps the best evidence of the economic importance ofearnings per share forecast data is the quantity of resources devotedto the production and analysis of such information by theinvestment community. Investors appear to impute specialimportance to information relevant to future earnings figures.Givoly and Lakonishok (1983, p.l), for example, state that:"Earnings per share emerge from various studies as the single mostimportant accounting variable in the eyes of the investors."Likewise, investment firms seem eager to provide the data. Inaddition to the earnings forecasts provided by nearly everyfull-service brokerage house, at least three sources exist (Standardand Poors' Earnings Forecaster, Lynch, Jones and Ryan's InstitutionalBrokerage Estimation System and the Icarus Service of ZacksInvestment Research, Inc.) which aggregate many brokers' beliefsand provide investors with consensus earnings forecasts.
Academic research over the last decade or so also providessubstantial support for the usefulness of such earnings information.Gonedes, Dopuch and Penman (1976) rank firms based onforecasted earnings/price (E/P) ratios and form four portfoliosbased on thoses E/P rankings. They find that, on average, thehighest E/P portfolio earns risk-adjusted returns significantlygreater than expected while the returns on the lowest E/P firms areless than expected.
Although Gonedes, Dopuch and Penman document returnpredictive ability from the (normalized) absolute level of forecastearnings, most research concentrates on forecast errors (forecastedEPS minus actual EPS) or revisions in forecasts. N eiderhoffer andRegan (1972) find that high (low) equity returns were associatedwith firms, in which analysts underestimated (overestimated)earnings relative to actual. Thus, those investors able to produceconsistently more accurate earnings estimates would be capable ofproducing consistently greater portfolio returns. Zacks (1979) andElton, Gruber and Gultekin (1981) provide evidence thatknowledge of the consensus analyst earnings forecast itself is of novalue. However, both studies show that the ability to anticipatemovements in the consensus forecast or to foresee the forecast errorwould be extremely valuable to investors. Givoly and Lakonishok(1979) and (1980) further document the association betweenrevisions in analyst forecasts and stock price movements.
1

While the link between the revisions of analyst earnings forecastsand subsequent stock price movements is well supported by theextant empirical evidence, little research effort has been exertedattempting to identify the factors that are important to financialanalysts in forming their earnings per share forecasts. This studyexamines the response of financial analysts' forecasts to onepotential source of information: earnings forecasts attribu ted to thefirm's management.
Although the exact model used to construct an earnings pershare forecast is difficult to specify precisely, typically it is positedthat information concerning the general economy, the economicsector/industry and the specific firm are somehow combined toproduce the desired result. It is likely that the weights attached toeach of these three types of information vary depending on who ispreparing the EPS forecast. Specifically, it is possible that firmmanagement has superior firm-specific data and, therefore, placesspecial significance on this when estimating earnings. Analysts, onthe other hand, may rely more heavily on macro-economic andind ustry data. If this firm-specific data is useful to firmmanagement in their forecasts of earnings, it seems reasonable toassume financial analysts (FA) also would find the informationvaluable and would incorporate that data into their forecasts at thepoint in time it becomes available to them. Thus, to the extent thatthe manager's announcement at least partially reveals the manager'sinside information, one would expect a response in the earningsforecasts of financial analysts.
The first part of this study, therefore, examines the behavior ofconsensus financial analyst EPS forecasts around the dates onwhich management forecasts are made public. Specifically, thisinvestigation seeks to determine whether the FA appears to find thepublic announcement of a management forecast a relevant eventwhen preparing his or her own earnings estimate. A more completeknowledge of the type of data useful to an analyst in forecastingEPS will lead to a better understanding of how such forecasts areconstructed. This understanding may, in turn, provide investorsand researchers valuable insights into the security return generatingprocess.
Besides the rather vague benefit of a better understanding of thefinancial analyst belief formation process, this study should providemore direct payoffs. One question concerns the issue of informationefficiency. If the market is perfectly information efficient, the publicannouncement of the manager's EPS forecast should provide littlenew data for the analyst. From independent data collection efforts
2

the FA should have been able to uncover the information on whichthe manager bases his or her forecast. In this case, one would expectto find that changes in the FA forecast anticipate the publicannouncement of the management forecast. If, on the other hand,the market is not perfectly information efficient, the managerindeed may have information that cannot be discovered by thefinancial analyst from external sources.
Another motive for studying the reaction of analyst forecasts tothe release of a management forecast is to evaluate the usefulness ofmanagers' forecasts to investors. In the 1970s the Securities andExchange Commission debated the imposition of mandatorymanagement EPS forecasts. To the extent that financial analystsare representative of the general investing community,l a findingthat FA forecasts respond to the release of management estimateswould be consistent with the claim that managers possessinformation that might remain undisclosed to investors without theannouncement of an EPS forecast. On the other hand, ifmanagement forecasts are based on the same data set used byinvestors-resulting in minimum FA forecast revision upon therelease of management forecast- the rationale for requiring themanagement forecast is weakened considerably.
The above discussion is concerned with whether the financialanalyst responds to a management earnings forecast and the timingof that reaction relative to the release of the manager's estimate. If itis determined that analysts do react to the information contained inthe management forecast, another issue is the analysts' ability to usethat information optimally. In this context the term optimallydenotes a situation in which the analyst is able to combine theinformation contained in the manager's forecast with his or herprior data to form superior (more accurate) forecasts. This impliesthat the FA must be able to correctly discount the managementforecast when the prior FA forecast is more accurate thanmanagement's prediction and correctly react to the managementforecast in those cases in which management is more accurate. Inother words, the financial analyst should not merely mimic themanager.
The justification for this is that, since the production anddissemination of a financial analyst's forecast consume resources,the financial analyst must "add value." In this context, value isadded by using the management announcement to producesuperior forecasts. Consider the belief formation model suggestedpreviously. Ostensibly, management possesses superior firm-specificdata. Analysts, on the other hand, may possess superior industry
3

and/or general economic information due to their more objectiveviewpoin t or their familiarity with the competitive relationship ofthe firms in an industry. The release of the manager's EPS estimate
should provide the analyst with insights into the managers'firm-specific data. The analyst, in turn, should be able to use thisinsight to produce superior forecasts. If the FA forecast only mimicsthe management number, the SEC conceivably could conservesocietal resources by mandating management forecasts, therebyeliminating (or at least reducing) the need for analyst forecasts.
The remainder of this paper consists of four sections. Thefollowing section discusses the data sources and methodology usedin the analysis. In the third section I present the results of testsdesigned to determine if analysts respond to the release ofmanagement EPS forecasts. The question of whether analysts makeoptimal use of the management estimate is addressed in the fourthsection. The paper concludes with a summary of the findings andsome suggestions for further research.
4

II. THE DATA AND METHODOLOGY
In the first part of this section, the forecast data base used in thisstudy is described. The latter part of this portion of the paperdetails the empirical techniques employed to address the issuesunder study.
A. Data
In order to assess the issue of financial analyst response tomanagement earnings forecasts, a sample of forecast data wasconstructed. Since management forecasts are issued relativelyinfrequently, the first portion of the data set consisted ofmanagement earnings forecasts. The data set was completed bygathering financial analyst earnings forecasts of those firms forwhich management forecasts were obtained.
The Dow Jones News Retrieval Service (DJNRS) was used as thesource of management earnings forecasts. The DJNRS contains adata base of articles published by Dow Jones & Company in TheWall Street Journal and Barrons as well as any announcementsappearing on the Broad Tape but not published. Thiscomputerized data base is constantly updated and can be accessedon an on-line basis. The data base is accessed by specifying certainkeywords that relate to the topic of interest. A text searchprocedure is used to scan either headlines or entire articles for theselected keywords. Any headline or article containing the keywordscan be retrieved for examination.
The keywords used to query the data base were words that wouldindicate the article was reporting a management forecast of EPS. Inresponse to inquiries using these keywords, approximately 2,150articles published between June 1979 and December 1982 wereretrieved. Each article was examined to determine if it contained auseful annual EPS forecast. To be included in the sample, thefollowing conditions were imposed:
1. The forecast was attribu ted to a corporate official;2. The forecast was a specific point estimate of annual
EPS or, if range estimates were presented, themidpoint was used;
3. The forecast had to be issued at least one monthbefore year-end; and,
5

4. In order for more than one forecast for a givenfirm/fiscal year to be used the two forecasts had to bemore than twenty weeks apart. 2 For any pair offorecasts not meeting this five-month screen, only theforecast occurring earlier in the fiscal year wasretained.
Upon imposing these constraints, a sample of 191 usablemanagement forecasts of annual EPS was obtained for this study.3
After this management forecast sample was assembled, weeklyconsensus analyst forecasts of EPS were collected. The source of theanalyst forecasts was Zacks Investment Company's Icarus Service.Zacks accumulates up to sixty analyst forecasts for about 2,400companies and resells them to interested subscribers. Beginningwith its inception in November of 1979, the service has reported,among other things, a weekly consensus analyst annual EPSforecast and the number of analysts included in the consensuscomputation.
The Zacks data base is superior to other available data sourcesdue to the frequency of its updating and its extensive coverage ofanalysts. The Standard and Poor's Earnings Forecaster is publishedweekly but generally follows considerably fewer analysts. On theother hand, IBES from Lynch, Jones and Ryan offers extensiveanalyst coverage but is only updated monthly which is tooinfrequent to be very useful in the type of analysis performed in thisstudy. Thus, the Zacks' data base offers a unique combination ofattributes in dealing with consensus date.
Consensus analyst forecasts were collected, both before and afterthe date of the management forecasts, for a maximum of twentyweeks in either direction. The data collection can be bestunderstood by envisioning a time line (Figure 1). The week of amanagement forecast is defined as time O. Weeks after themanagement forecast week are numbered + 1 to +20. Weeks beforethe management forecasts are numbered -1 to -20. The weeksdirectly preceding and after the management forecast aredesignated -1 and +1, respectively.
As far as was possible consensus analyst forecasts were obtainedfor each firm with a management forecast for weeks -20 through+20.4 After examining the data base provided by Zacks for analystforecasts of the firms that had management forecasts, 115 firms(principally traded over the counter) were found that were missingor had incomplete data. Therefore, the sample for this studyconsists of seventy-six management forecasts. (See the Appendixfor a list of the firms used in the study.)
6

Weeks before themanagement forecast
FIGURE 1
Weeks after themanagement forecast
- 20 - 19 ... - 4 - 3 - 2 - 1 0
I+ 1 + 2 + 3 + 4 ... + 19 + 20
The week ofthe management
forecast
B. Methodology
This study examines two hypotheses. One is that financialanalysts react to earnings forecasts released by management. Thesecond is that the analysts react optimally.
The first null hypothesis to be tested is that the level ofvariability in the mean analyst forecast is not abnormally elevatedduring the time period surrounding the public release of amanagement forecast. In order to test the hypothesis a normal (orexpected) level of FA forecast volatility is established by examininga period of time removed from the date of the management forecast.Then the FA forecast volatility during the period surrounding themanagement forecast is tested for a significant difference from this"normal" level. Finding significant levels of abnormal volatilitywould be consistent with the hypothesis that analysts findmanagement forecasts useful in preparing their EPS forecasts.
The test for a non-normal level of FA forecast volatility is anapplication of the traditional Fama, Fisher, Jensen and Roll (1969)event study methodology. In this case, the release of themanagement forecast is the event of interest, and the weeklypercent changes in the consensus analyst EPS forecasts are thevariables of interest (in place of security returns). In this study, theexpected level of the weekly percent change in the financial analystforecast (FAF) is established by calculating the sample meanpercent change in the FAF in the weeks prior to the manager'sannouncement. Although this represents a fairly naive approach toforming an expectation, the results of Brown and Warner (1980)
7
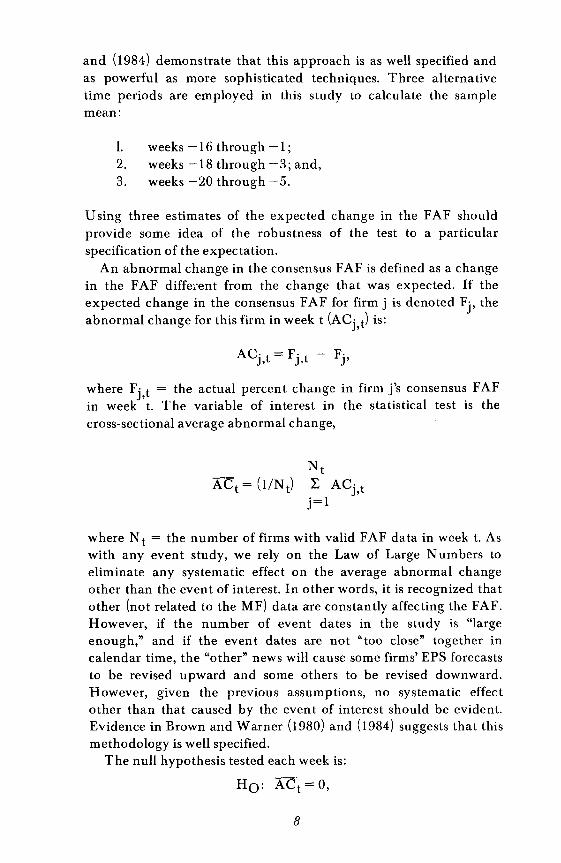
and (1984) demonstrate that this approach is as well specified andas powerful as more sophisticated techniques. Three alternativetime periods are employed in this study to calculate the samplemean:
1. weeks -16 through -1 ;2. weeks -18 through -3; and,3. weeks -20 through -5.
U sing three estimates of the expected change in the FAF shouldprovide some idea of the robustness of the test to a particularspecification of the expectation.
An abnormal change in the consensus FAF is defined as a changein the FAF different from the change that was expected. If theexpected change in the consensus FAF for firm j is denoted Fj> theabnormal change for this firm in week t (ACj,t) is:
AC· t = F· t - F·J, J, J'
where Fj,t = the actual percent change in firm j's consensus FAFin week t. The variable of interest in the statistical test is thecross-sectional average abnormal change,
NtACt = (l/N t) L ACj,t
j=1
where Nt = the number of firms with valid FAF data in week t. Aswith any event study, we rely on the Law of Large Numbers toeliminate any systematic effect on the average abnormal changeother than the event of interest. In other words, it is recognized thatother (not related to the MF) data are constantly affecting the FAF.However, if the number of event dates in the study is "largeenough," and if the event dates are not "too close" together incalendar time, the "other" news will cause some firms' EPS forecaststo be revised upward and some others to be revised downward.However, given the previous assumptions, no systematic effectother than that caused by the event of interest should be evident.Evidence in Brown and Warner (1980) and (1984) suggests that thismethodology is well specified.
The null hypothesis tested each week is:
HO: ACt=O,
8

with an alternative hypothesis of
Rejection of the null is support for the conjecture that financialanalysts respond to the public release of management earningsforecasts. The statistical test of significant is done using atraditional T-test.5
This technique also provides direct evidence whether the analystis able to anticipate the information contained in a managementforecast or only reacts to the public announcement. If the elevationin FA forecast volatility occurs after the announcement date, theanalyst apparently is unable to independently produce theinformation contained in the management forecast and must relyon the announcement itself to provide the information. It isconceivable, however, that the analyst is able to duplicate theinformation contained in the management forecast from alternativesources, i.e., related news items. In that case, the data should showelevation in FA forecast variability prior to the actual date at whichmanagement publicly releases a forecast.
Examining the issue of whether analysts respond in an optimalmanner to the release of management EPS forecasts is moredescriptive in nature. In order to determine how analysts shouldreact to a management forecast, the management forecast and thefinancial analyst forecast that exists the week the managementforecast is released (FAF0) are compared to actual earnings.Obviously this comparison requires knowledge of the actualearnings (AE) that is not available to the analyst at the time themanagement forecast is released. Recall, however, that thehypothesis being examined is that analysts are able to combine theinformation in a MF with their own information to producesuperior EPS forecasts. Whether the FAFs are superior must bejudged relative to the actual earnings which eventually arerevealed. The MF, FAFO and AE have one of three relative sizerelationships.6 T he analyst forecast may:
1. have a forecast error (FAF0-AE) with the same sign asthe management forecast error (MF-AE), but besmaller in absolute value, i.e., be more accurate thanthe management forecast;
2. have a forecast error with a different sign thanmanagement; or
9

3. have a forecast error with the same sign as themanagement forecast error, but be larger in absolutevalue, i.e., be less accurate than the managementforecast.
Each of these situations calls for a different response by the analysts.Consider the first case. We can envision an EPS number line, as
illustrated in the upper panel of Figure 2. The financial analysts'forecast in week 0 lies between the management forecast and theactual earnings figure. What constitutes an optimal response to theMF by the analyst? Simply stated, the analyst should be able to usethe information contained in the manager's announcement toreduce the analyst forecast error. That is, the analysts' forecasts inthe weeks subsequent to the announcement date should move inthe direction indicated by the arrows above the Figure 2 numberlines. At a minimum, the analysts should not be misled by themanager's estimate. Likewise, the analysts should not view themanagement forecast as so informative as to overreact by movingpast the actual earnings figure.
The middle panel of Figure 2 illustrates the second case. In thissituation the manager's belief and the analysts' forecast initially areon opposite sides of the actual earnings figure. In tuition wouldsuggest a movement toward the manager's estimate as a naturalresponse to the new information. However, if the analysts are ableto use the MF information optimally, they should not overreact. Arather strict definition of overreaction is adopted in this study.Specifically, if subsequent FAFs are revised sufficiently so that theforecast error sign becomes the same as the management forecasterror, the financial analysts are said to have overreacted. Theargument in favor of this definition is that, by moving theconsensus forecast past the actual earnings, the analysts are placingtoo much weight on the MF when calculating their revisedforecasts. If (on average) the analysts "overshoot" the actualearnings number, this is evidence of a tendency for the analysts tomimic the management estimate.
Finally, the third case is demonstrated in the bottom panel ofFigure 2. In this case the management forecast lies between theanalyst estimate and the actual earnings figure. Once again,intuition might suggest that analysts revise their beliefs byproducing an averaging of their prior beliefs and the managementforecast number. This would leave the revised analyst forecastsomewhere between FAFO and MF on the EPS number line. Inorder for the analyst to respond optimally to the information in the
70

manager's forecast, however, he or she must produce a moreaccurate EPS estimate. This implies a movement past the MF andcloser to the actual earnings. Thus, while the analyst appears tooverreact to the release of the MF, ex post the "overreaction" isjustified.
Conceivably, one could design a null hypothesis consistent withthe statement that analysts do (or do not) optimally use theinformation contained in a MF. The approach taken here, however,is descriptive. In order to assess whether analysts behave optimally,the relative frequencies of "correct" and "incorrect" FAF revisionsin each of the three cases outlined are tabulated.
FIGURE 2
Case 1 - MF < FAFo < AE or AE < FAFo < MFAnalysts should not move toward the MF.
AEFAFoFAFoMF____---'==~.~I__ EPS or _--,:I"'~=i.- EPS
AE AE
Case 2 - MF < AE < FAFo or FAFo < AE < MFAnalysts should react (but not overreact) to the MF.
MFMF
____---.tI...!==L-__ EPS or _-----' •....;.1 EPS
AE FAFo FAFo AE
Case 3 - AE < MF < FAFo or FAFo < MF < AEAnalysts should "overreact" to the MF.
_-----'1_... -----'__ EPS or __J:::====~.~I__ EPSAE MF FAFo FAFo MF AE
17

III. ANALYST RESPONSE TO MANAGEMENTEARNINGS FORECASTS
The first issue examined in this section is whether financialanalysts react to the public release of management earningsforecasts. In order to determine this, the weekly percent change inthe FAF, beginning the week the management forecast is released(week 0), is compared to the expected percent change. Initially, theexpected change for each firm is derived by computing the averagepercent change in the sixteen weeks prior to the announcement(weeks -16 through -1).7 In addition to anticipating that therelease of a MF might affect the FAF, a moment's reflection alsoprovides an expectation concerning the direction of this revision.Specifically, if the level of earnings forecast by the manager isgreater than the level contemporaneously predicted by the analysts,the MF constitutes "good news" and should be followed by anincrease in the FAF. Analogous logic applies for "bad news."Instead of splitting the sample into good news and bad newssubsamples (which would reduce sample size), the percent changesof the analyst forecast of bad news firms are multiplied by minusone (-1). Thus, a positive abnormal level of revision represents agreater than expected revision in the predicted direction. The nullhypothesis to be tested is that the across-firm average percentchange in the FAF each week subsequent to the release of themanagement forecast is not different from its expected value, i.e.,abnormal revision equals zero. Table 1 summarizes the findings.
The results are consistent with the claim that analysts react to thepublic announcement of management earnings forecasts.Significant levels of abnormal revision in the anticipated directionoccur in weeks 0 through 3. In addition, six of the first seven weeksfollowing a MF have abnormal revision of the correct sign. Thus,the FAF revision begins at the time the management forecast isreleased, proceeds strongly for three weeks, and continues to driftfairly consistently in the predicted direction through the seventhweek subsequent to the manager's announcement.
Another issue of interest in this study is whether the analysts areable to anticipate the news contained in the release of a MF. Inorder to address this issue, the level of abnormal FAF revisions inweeks preceding the release of the manager's forecast must becomputed. This requires that the period of time used to computethe expected revision be modified to exclude the weeks
72

immediately preceding the management announcement. Since it isalso important to assess the robustness of the results to theexpectation formation procedure, two alternative expectationcalculation periods are examined. The first alternative estimationperiod includes weeks -18 through week -3 and computesabnormal FAF revision levels for weeks -2 through +20, while thefinal estimation period is weeks -20 through -5 with abnormalrevision computations performed for weeks -4 through +20. Again,the null hypothesis is that no abnormal levels of FAF revision exist.Table 2 presents the findings.
TABLE 1
ABNORMAL FAF REVISION ACTIVITY FOLLOWING THERELEASE OF MANAGEMENT EARNINGS FORECASTS
Week N Abnormal Revision T -statistic
0 76 .00442 2.296**1 76 .00599 1.994* *2 76 .00575 2.677***3 76 .00323 1.851 *4 75 .00090 .4875 71 -.00016 - .1216 68 .00651 1.1737 65 .00083 .5358 61 -.00152 -.6739 58 -.00374 -1.24410 54 .00246 .56811 50 -.00094 - .56412 45 -.00291 - 1.30113 43 -.00036 - .11214 41 -.00859 -1.42015 39 -.00843 -93016 38 .00138 .68617 38 .00586 .84418 36 -.00230 .75619 34 .00152 .62120 33 -.00053 - .186
* significant at the 90 % confidence level** significant at the 95 % confidence level
*** significant at the 99 % confidence level
73

TABLE 2
ABNORMAL FAF REVISION ACTIVITY AROUND THERELEASE OF MANAGEMENT EARNINGS FORECASTS
Estimation Period -18 to -3 Estimation Period -20 to - 5
Abnormal AbnormalWeek N Revision T -statistic N Revision T -statistic
-4 74 -.00414 - .465-3 74 -.01225 -1.455-2 76 -.00164 -.826 74 -.00914 - 1.127-1 76 -.00171 - 1.126 74 -.00934 -1.191
0 76 .00373 1.906* 74 -.00343 - .4231 76 .00529 1. 720* 74 -.00211 -.2482 76 .00506 2.273** 74 -.00238 -.2893 76 .00253 1.391 74 -.00503 -.6314 75 .00020 .103 73 -.00748 -.9185 71 -.00046 -.358 69 -.00033 -.2486 68 .00062 1.127 66 .00723 1.2487 65 .00058 .373 63 .00139 .8378 61 -.00183 -.807 59 -.00110 -.4939 58 -.00407 -1.357 56 -.00332 - 1.015
10 54 .00213 .491 52 .00315 .67911 50 -.00136 -.816 48 -.00033 -.20112 45 -.00337 -1.506 43 -.00240 -1.06513 43 -.00069 -.210 41 .00110 .34014 41 -.00895 -1.480 39 -.00789 - 1.24515 39 - .00877 -.969 37 -.00801 -.83916 38 .00104 .518 39 .00222 1.00017 38 .00552 .795 36 .00685 .94618 36 -.00263 -.876 34 -.00192 -.58619 34 .00118 .508 32 .00238 .90420 33 -.00091 -.341 31 .00002 .008
* significant, a .10** significant, a = .05
In neither case is there any evidence that analysts are able toanticipate the information contained in the forthcomingmanagement forecasts. All weeks prior to the MF have negativeabnormal FAF revision (implying a less than expected revision),
although none are significantly less than zero.Unfortunately, the significance of the FAF revision effect noted
14

in Table 1 is diminished in the -18 to -3 estimation period anddisappears entirely in the -20 to -5 estimation period. Thus, theresults do not appear to be robust with respect to the estimationperiod used to compu te the normal level of FAF revision.
Below, it will be argued that the results presented in Table 2 arepotentially misleading due to the inclusion of "information" eventsthat should not be expected to alter the consensus FAF. Beforeexploring that point, however, let us see what can be learned froman examination of Tables 1 and 2.
As noted previously, all of the FAF revisions in the weeks prior tothe MF are less than the revisions expected. In addition, the level ofabnormal revision in periods subsequent to the management'sforecast diminish as the expectation estimation period is pushedfurther back in time. Both of these imply that the percent changesin the FAF decline in the weeks immediately prior to the release ofthe manager's announcement. That is, the average percent changein weeks -20 to -5 is greater than the average in weeks -18 to -3which, in turn, exceeds that of weeks -16 to -1. Thus, it requires alarger FAF change to be considered significantly abnormal in anygiven week using the expectation calculated over the -20 to -5estimation period than the expectation calculated in the -16 to -1period.
While this phenomenon may be consistent with severalhypotheses, one of interest in this context concerns the behavior ofanalysts. If analysts are able to anticipate the release of amanagement forecast, it may be reasonable to assume that theobserved revision activity would decline just prior to theanticipated date of the management announcement. This may betrue if analysts defer an analysis of a firm in anticipation of anupcoming news event that would have a significant impact on thatanalysis. Thus, the reduction in FAF volatility prior to the MF dateis consistent with analysts having the ability to predict theforthcoming news event. Analysts apparently are unable todetermine the information content of the managementannouncement, however, since no movement of the consensusanalyst forecast in the predicted direction prior to the publicannouncement is evident.
Let us now return to the statement made previously that theresults in Table 2 may be misleading. The figures in Table 2 (as wellas Table 1) reflect the inclusion of all management forecasts in thesample. Some of these MF, however, may be expected to lead tominimal changes in the consensus FAF. Specifically, if the MF isnearly equal to the current consensus FAF, the consensus forecast
15
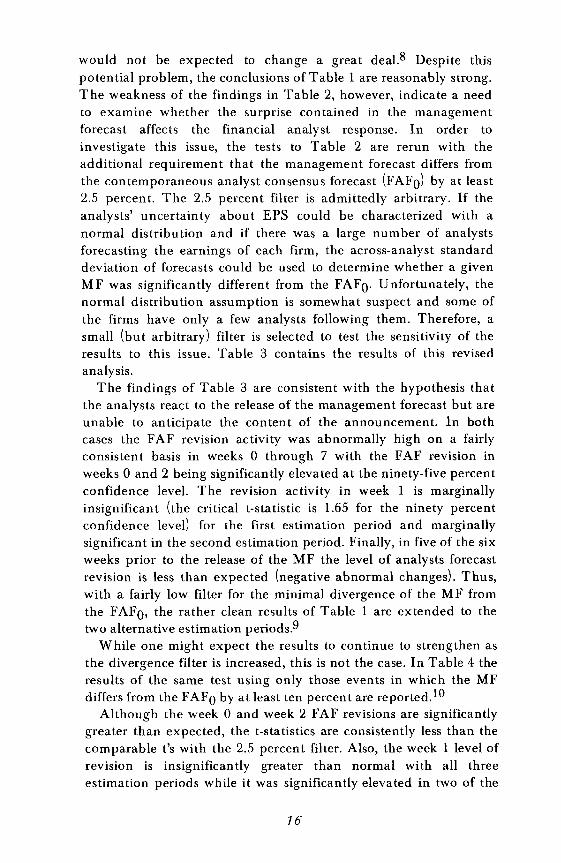
would not be expected to change a great deal.8 Despite thispotential problem, the conclusions of Table 1 are reasonably strong.The weakness of the findings in Table 2, however, indicate a needto examine whether the surprise contained in the managementforecast affects the financial analyst response. In order toinvestigate this issue, the tests to Table 2 are rerun with theadditional requirement that the management forecast differs fromthe contemporaneous analyst consensus forecast (FAFO) by at least2.5 percent. The 2.5 percent filter is admittedly arbitrary. If theanalysts' uncertainty about EPS could be characterized with anormal distribution and if there was a large number of analystsforecasting the earnings of each firm, the across-analyst standarddeviation of forecasts could be used to determine whether a givenMF was significantly different from the FAFO' Unfortunately, thenormal distribution assumption is somewhat suspect and some ofthe firms have only a few analysts following them. Therefore, asmall (but arbitrary) filter is selected to test the sensitivity of theresults to this issue. Table 3 contains the results of this revisedanalysis.
The findings of Table 3 are consistent with the hypothesis thatthe analysts react to the release of the management forecast but areunable to anticipate the content of the announcement. In bothcases the FAF revision activity was abnormally high on a fairlyconsistent basis in weeks 0 through 7 with the FAF revision inweeks 0 and 2 being significantly elevated at the ninety-five percentconfidence level. The revision activity in week 1 is marginallyinsignificant (the critical t-statistic is 1.65 for the ninety percentconfidence level) for the first estimation period and marginallysignificant in the second estimation period. Finally, in five of the sixweeks prior to the release of the MF the level of analysts forecastrevision is less than expected (negative abnormal changes). Thus,with a fairly low filter for the minimal divergence of the MF fromthe FAF0, the rather clean results of Table 1 are extended to thetwo alternative estimation periods.9
While one might expect the results to continue to strengthen asthe divergence filter is increased, this is not the case. In Table 4 theresults of the same test using only those events in which the MFdiffers from the FAFO by at least ten percent are reported. 10
Although the week 0 and week 2 FAF revisions are significantlygreater than expected, the t-statistics are consistently less than thecomparable 1's with the 2.5 percent filter. Also, the week 1 level ofrevision is insignificantly greater than normal with all threeestimation periods while it was significantly elevated in two of the
16

three estimation periods using the smaller filter and only marginallyinsignificant in the third estimation period. Finally, the pre-eventreaction documented in Table 4 is different from the reaction usingthe zero percent or 2.5 percent filters.The pre-event results for the-18 to -3 estimation period, while still negative are considerablysmaller than those with the 2.5 percent filter in effect. Using the-20 to -5 estimation period, three of the four pre-event weeks havegreater than expected forecast revisions.
TABLE 3
ABNORMAL FAF REVISION ACTIVITY AROUND THERELEASE OF MANAGEMENT EARNINGS FORECASTS
I (MF-FAFo) / FAFo I~ .025
1.277-1.120
2.044**1.6202.097**1.187.186
-.6071.105
.276-1.063- 1.425
.328-.886
- 1.652*- .124
- 1.463-.986
.217
.801-.868
.211-.093
.761-1.297-.992-.8982.219**1.700*2.120**1.286.364
-.3331.249
.850-.6461.016
.565- .180
-1.094.327
- 1.270-.834
.848
.992-.482
.747
.477
T -statistic
.00369-.00502-.00244-.00167
.00510
.00636
.00591
.00296
.00080-.00051
.00838
.00159-.00159-.00365
.00290-.00032-.00265
.00114-.00837-.00867
.00203
.00794-.00173
.00209
.00137
Estimation Period - 20 to - 5
AbnormalRevisionN
63636363636363636260575653514744403836343333313029
Estimation Period - 18 to - 3
AbnormalWeek N Revision T-statistic
-4-3- 2 63 - .00280-1 63 - .00204
o 63 .004731 63 .005992 63 .005553 63 .002594 62 .000435 60 - .000916 57 .007307 56 .000508 53 - .002749 51 - .00485
10 47 .0016411 44 - .0016812 40 -.0041213 38 -.0004614 36 - .0100315 34 - .0102216 33 .0004917 33 .0064018 31 - .0030119 30 .0005520 29 - .00026
* significant, a .10** significant, a = .05
17

TABLE 4
ABNORMAL FAF REVISION ACTIVITY AROUND THERELEASE OF MANAGEMENT EARNINGS FORECASTS
I (MF-FAFo) / FAFo I 3.010
Estimation Period - 16 to - 1 Estimation Period - 18 to - 3 Estimation Period - 20 to - 5
Week N Abnormal Revision T N Abnormal Revision T N Abnormal Revision T
-4 43 .00721 1.03-3 43 -.00320 - 1.17-2 43 -.00052 -.233 43 .00052 .215-1 43 -.00082 -.467 43 .00019 .094
..... 0 43 .00645 2.06* * 43 .00552 1.69* 43 .00656 2.01 **Co 1 43 .00561 1.24 43 .00469 .987 43 .00573 1.23
2 43 .00697 1.98* 43 .00605 1.65* 43 .00709 1.87*3 43 .00312 1.14 43 .00219 .742 43 .00323 .9914 42 .00132 .427 42 .00038 .114 42 .00144 .4515 40 -.00195 -1.03 40 -.00216 -1.11 40 - .00102 - .4736 39 .01067 1.11 39 .01040 1.08 39 .01156 1.187 38 -.00055 - .246 38 -.00079 -.346 38 .00040 .1638 35 -.00078 -.306 35 - .00113 - .435 35 .00017 .0629 33 -.00794 -1.64 33 -.00831 -1.71* 33 -.00693 -1.33
10 30 .00464 .633 30 .00429 .583 30 .00574 .748
. significan t, a =.10significant, a = .05

The combination of a. stronger pre-event forecast revision and aweaker post-event reaction is consistent with several hypothesesabout analyst behavior. One is that, because the ten percent filterleaves a sample of more newsworthy events than the zero or 2.5percent filter, the analysts are better able to anticipate the contentof the upcoming earnings announcement by monitoring alternativenews sources. Thus, as the analysts monitor their other data sources,they are more likely to uncover related information that issignificant enough to force them to revise their beliefs prior to theMF date. This implies that part of the FAF revision takes placebefore the MF is announced leaving less to take place in thepost-event period.
The evidence presented thus far appears to indicate that analystsdo indeed respond to management earnings forecasts and thatanalysts do not seem to be able to anticipate the informationcontained in these announcements. In the remainder of this section,the possibility of observing different analyst responses to varioussubsamples of the data is investigated. A somewhat differentresponse has already been noted when we divide the data based onthe size of the discrepancy of the MF from the current (time zero)FAF.
The two factors that were chosen to subdivide the sample are: 1)the year in which the MF is made; and 2) the half of the fiscal yearin which the MF was made. Along the first dimension the samplewas divided into those MFs occurring in 1979-80 and those in1981-82. The first time period represents a time over whichmarket-wide corporate earnings were relatively flat, while the latterdates represent a period over which earnings fell dramatically withsome recovery at the end of 1982. Table 5 presents the results usinga zero filter and the -18 to -3 estimation period) 1
The results indicate a marked difference in analyst responseduring the two time periods. The 1979-80 time period resultsindicate no significant analyst response except in week 5. However,the sign of the abnormal revision in that, as in weeks 0, 1,3 and 4,was the reverse of that hypothesized. On the other hand, the1981-82 findings indicate a strong and consistently significant FAFrevision in the expected direction for weeks 0 through 5. Onepotential explanation for this phenomenon revolves around tberelative uncertainty and volatility of the two periods. The year 1981marked the beginning of a fairly severe recession and a period ofrelatively high uncertainty for analysts. In this enviroment theanalysts are more likely to be influenced by and hypersensitive toany data source they view as informed.1 2
19
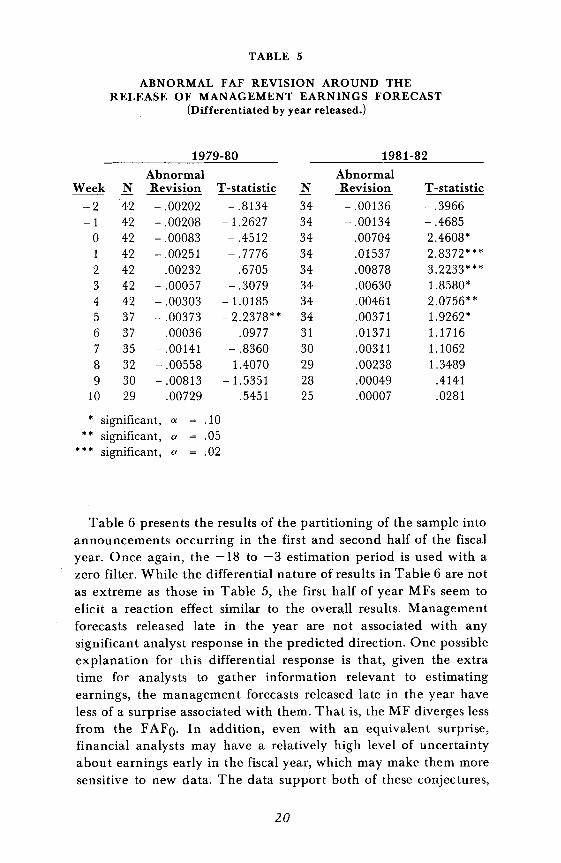
TABLE 5
ABNORMAL FAF REVISION AROUND THERELEASE OF MANAGEMENT EARNINGS FORECAST
(Differentiated by year released.)
1979-80 1981-82
Abnormal AbnormalWeek N Revision T -statistic N Revision T -statistic
-2 42 -.00202 -.8134 34 -.00136 -.3966-1 42 -.00208 - 1.2627 34 -.00134 -.4685
0 42 -.00083 -.4512 34 .00704 2.4608*1 42 -.00251 - .7776 34 .01537 2.8372***2 42 .00232 .6705 34 .00878 3.2233***3 42 -.00057 -.3079 34 .00630 1.8580*4 42 -.00303 -1.0185 34 .00461 2.0756**5 37 -.00373 - 2.2378** 34 .00371 1.9262*6 37 .00036 .0977 31 .01371 1.17167 35 -.00141 -.8360 30 .00311 1.10628 32 -.00558 1.4070 29 .00238 1.34899 30 -.00813 -1.5351 28 .00049 .4141
10 29 .00729 .5451 25 .00007 .0281
* significant, a .10** significant, a .05
*** significant, a .02
Table 6 presents the results of the partitioning of the sample intoannouncements occurring in the first and second half of the fiscalyear. Once again, the -18 to -3 estimation period is used with azero filter. While the differential nature of results in Table 6 are notas extreme as those in Table 5, the first half of year MFs seem toelicit a reaction effect similar to the overall results. Managementforecasts released late in the year are not associated with anysignificant analyst response in the predicted direction. One possibleexplanation for this differential response is that, given the extratime for analysts to gather information relevant to estimatingearnings, the management forecasts released late in the year haveless of a surprise associated with them. That is, the MF diverges lessfrom the FAFO. In addition, even with an equivalent surprise,financial analysts may have a relatively high level of uncertaintyabout earnings early in the fiscal year, which may make them moresensitive to new data. The data support both of these conjectures,
20
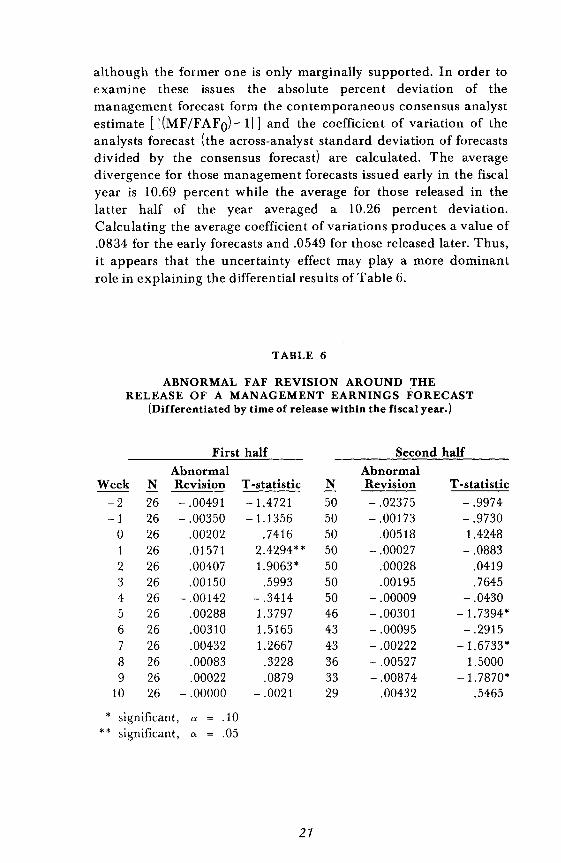
although the former one is only marginally supported. In order toexamine these issues the absolute percent deviation of themanagement forecast form the contemporaneous consensus analystestimate [!(MF/FAFO)-ll] and the coefficient of variation of theanalysts forecast (the across-analyst standard deviation of forecastsdivided by the consensus forecast) are calculated. The averagedivergence for those management forecasts issued early in the fiscalyear is 10.69 percent while the average for those released in thelatter half of the year averaged a 10.26 percent deviation.Calculating the average coefficien t of variations produces a value of.0834 for the early forecasts and .0549 for those released later. Thus,it appears that the uncertainty effect may playa more dominantrole in explaining the differential results of Table 6.
TABLE 6
ABNORMAL FAF REVISION AROUND THERELEASE OF A MANAGEMENT EARNINGS FORECAST
(Differentiated by time of release within the fiscal year.)
First half Second half
Abnormal AbnormalWeek N Revision T -statistic N Revision T -statistic
-2 26 -.00491 -1.4721 50 -.02375 -.9974-1 26 -.00350 -1.1356 50 -.00173 -.9730
0 26 .00202 .7416 50 .00518 1.42481 26 .01571 2.4294** 50 -.00027 -.08832 26 .00407 1.9063* 50 .00028 .04193 26 .00150 .5993 50 .00195 .76454 26 -.00142 -.3414 50 -.00009 -.04305 26 .00288 1.3797 46 -.00301 -1. 7394*6 26 .00310 1.5165 43 -.00095 -.29157 26 .00432 1.2667 43 -.00222 -1.6733*8 26 .00083 .3228 36 -.00527 1.50009 26 .00022 .0879 33 -.00874 -1.7870*
10 26 -.00000 -.0021 29 .00432 .5465
* significant, a = .10** significant, a .05
27

This section has examined the question of whether financialanalysts react to the public announcement of management earningsforecasts. The findings indicate that an abnormally high level ofFAF revision is associated with such a news event. In addition,there is no evidence that analysts are able to anticipate theinformation contained in the MF. Finally, different analystresponses were documented by subdividing the sample based onthe difference between the analysts' and the management'sforecasts, the year in which the management forecast occurred andthe half of the fiscal year in which the forecast occurred.
22

IV. THE OPTIMALITY OF ANALYST RESPONSE
Evidence in the previous section indicates that financial analystsdo appear to respond to the information contained in the earningsforecast released by management. In this section the analysis iscarried a step further. Specifically, the issue of whether the reactionby analysts indicates that they are able to combine the MF withprior information to produce superior earnings forecasts or whetherthey tend merely to mimic the MF is examined. If analysts onlymimic management estimates, the Securities and ExchangeCommission should be able to reduce society's resource expenditureon information production by mandating management earningsforecasts.
In order to discuss whether analysts react as they "should" uponthe release of a management earnings estimate, hindsight isemployed by comparing the relative magnitudes of the MF, theFAFO and the AE. Given the three quantities, there are six (31)possibilities for the relative magnitudes to arrange themselves. Thepossible permutations are:
1. AE ~FAF ~MF;
2. MF ~FAF ~AE;
3. MF ~AE ~FAF;
4. FAF ~AE ~MF;
5. FAF ~MF ~AE; and6. AE ~MF ~FAF.
If analysts are able to use the management forecast informationoptimally, three correct (again with twenty/twenty hindsight)reactions emerge. The first two cases represent situations in whichthe analyst should at least refuse to be misled by the manager'sforecast and preferably move his or her forecast away from themanagement number. Permutations three and four representsituations in which analysts should move toward the managementforecast but should not overreact. The final two possibilities aresituations in which analysts should "overreact" to the managementforecast by moving past the management number to a revisedforecast closer to the actual. Each of these hypotheses areinvestigated in the paragraphs below.
The sample events for the second set of tests include the
23

seventy-six events listed in the Appendix plus two additional firmsthat had missing data in the twenty weeks prior to the managementforecast date. 14 While this missing data forced these firms to beexcluded from the prior portion of the study (which required acalcu lation of the expected FAF revision based on this prior data),no data prior to the MF is necessary for the latter tests. Thus, thesample in this section consists of seventy-eight events. Of theseseventy-eight events fourteen are classified as Case 1, twenty-four asCase 2 and forty fit the Case 3 classification. The relativefrequencies of firms in each classification is consistent with previouswork [see Jaggi (1980)1which finds that managemen t EPS forecastsare more accurate than contemporaneous financial analystestimates. It is interesting to note that for the majority of the eventsincluded in the study (seventy-one percent), the analysts and themanagement forecast error has the same sign. This is consistentwith the hypothesis that the two groups use similar sets of data toconstruct their forecasts.
In Table 7 the relative frequency of correct reactions by analystsare summarized. The results are subdivided by the size of forecastdiscrepancy and the length of time (in weeks) post-announcementfor observing the revised FAF for determining whether correctmovements have been made. Forecast discrepancy filters of zero,2.5, 5.0 and 10.0 percent are employed. (Recall that a five percentfilter implies that the contemporaneous FAF differs from the MF byat least five percent.) In order to determine whether the financialanalysts respond correctly, the changes in their forecasts, relative totheir time zero forecast, are computed at weeks +2, +4 and +8.
That is, FAF2, FAF4 and FAF8 are compared to FAFO andclassified as either correct or incorrect revisions. A maximum ofeight weeks was chosen since the results of the previous sectionindicated that analysts adjust their forecasts by that time. Thus, the72.7 entry in the 4 week, 2.5% filter position in the Case 1 panelsignifies that, of the firms in which the manager was less accuratethan the analysts (but had the same forecast error sign) and the MFdiffered from FAFO by at least 2.5%,72.7% of the time the FA hadeither ignored or had moved away from the MF by the fourth weekafter the manager's announcemen t.
Consider the first panel of Table 7. In these fourteen cases boththe manager and the analyst begin (at time zero) with forecasterrors of the same sign, i.e., they both overestimate or bothunderestimate earnings. However, the analyst forecast is moreaccurate. An optimal interpretation of this MF would requireanalysts to view the firm-specific news in a manner that would lead
24

the analysts to ignore or move away from the MF. This implies thatthe analyst forecast should not be made less accurate by the releaseof the MF.
TABLE 7
PERCENT OF EARNINGS ANNOUNCEMENTS TO WHICHFINANCIAL ANALYSTS RESPOND "CORRECTLY"
Case 1 - MF < FAFo < AE or AE < FAFo < MFAnalysts should ignore the MF. (N = 14)
Divergence Between MF and FAFo:
~O% ~2.5% ~5.0% ~10.0% Row Total
2 57.1 45.4 28.5 40.0 45.9Week: 4 78.6 72.7 71.4 80.0 75.6
8 66.7 75.0 60.0 66.7 65.5
Column Total 67.5 58.1 52.6 61.5 61.2
Case 2 - FAFo < AE < MF or MF < AE < FAFoAnalysts should react, (but not overreact) to the MF. (N =24)
Divergence Between MF and FAFo:
~O% ~2.5% ~5.0% ~10.0% Row Total
2 40.0 38:9 33.3 36.4 37.9Week: 4 45.8 47.1 50.0 50.0 47.7
8 47.1 46.2 44.4 50.0 46.8
Column Total 43.8 43.8 42.4 45.2 43.8
Case 3 - FAF0 < MF < AE or AE <MF < FAFo
Analysts should overreact to the MF. (N = 40)
Divergence Between MF and FAFo:
~O% ~ 2.5% ~5.0% ~10.0% Row Total
2 5.0 3.8 0 0 2.4Week: 4 12.5 5.4 3.8 0 6.3
8 26.5 20.8 14.3 16.7 15.4
Column Total 9.6 9.1 5.1 5.1 7.8
25
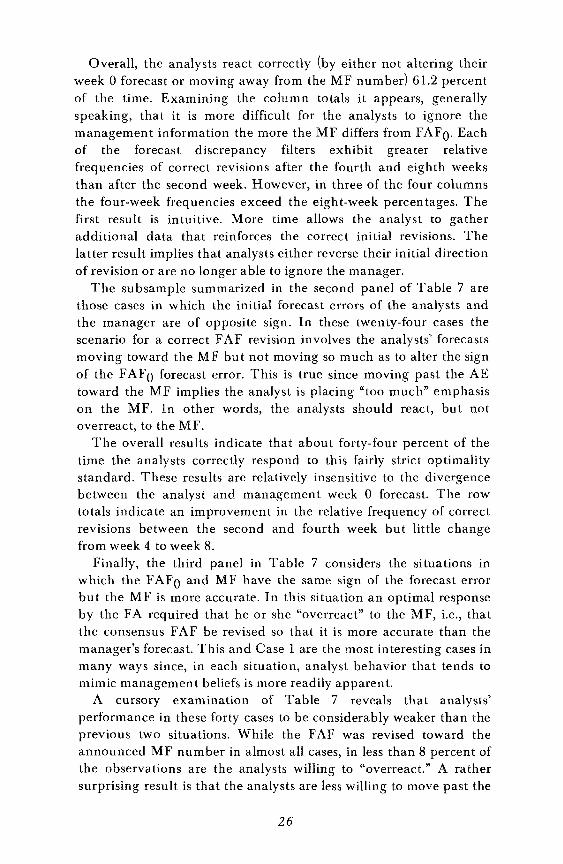
Overall, the analysts react correctly (by either not altering theirweek 0 forecast or moving away from the MF number) 61.2 percentof the time. Examining the column totals it appears, generallyspeaking, that it is more difficult for the analysts to ignore themanagement information the more the MF differs from FAFO' Eachof the forecast discrepancy filters exhibit greater relativefrequencies of correct revisions after the fourth and eighth weeksthan after the second week. However, in three of the four columnsthe four-week frequencies exceed the eight-week percentages. Thefirst result is intuitive. More time allows the analyst to gatheradditional data that reinforces the correct initial revisions. Thelatter result implies that analysts either reverse their initial directionof revision or are no longer able to ignore the manager.
The subsample summarized in the second panel of Table 7 arethose cases in which the initial forecast errors of the analysts andthe manager are of opposite sign. In these twenty-four cases thescenario for a correct FAF revision involves the analysts' forecastsmoving toward the MF but not moving so much as to alter the signof the FAFO forecast error. This is true since moving past the AEtoward the MF implies the analyst is placing "too much" emphasison the MF. In other words, the analysts should react, but notoverreact, to the MF.
The overall results indicate that about forty-four percent of thetime the analysts correctly respond to this fairly strict optimalitystandard. These results are relatively insensitive to the divergencebetween the analyst and management week 0 forecast. The rowtotals indicate an improvement in the relative frequency of correctrevisions between the second and fourth week but little changefrom week 4 to week 8.
Finally, the third panel in Table 7 considers the situations inwhich the FAFO and MF have the same sign of the forecast errorbu t the MF is more accurate. In this situation an optimal responseby the FA required that he or she "overreact" to the MF, i.e., thatthe consensus FAF be revised so that it is more accurate than themanager's forecast. This and Case 1 are the most interesting cases inmany ways since, in each situation, analyst behavior that tends tomimic management beliefs is more readily apparent.
A cursory examination of Table 7 reveals that analysts'performance in these forty cases to be considerably weaker than theprevious two situations. While the FAF was revised toward theannounced MF number in almost all cases, in less than 8 percent ofthe observations are the analysts willing to "overreact." A rathersurprising result is that the analysts are less willing to move past the
26

MF in those situations in which the MF differs from the FAFO bylarger margins. Furthermore, on a relative basis, the sensitivity ofthe results to the time period is greater than the previouslyexamined two cases. (With the zero filter the movements from twoto four weeks and from four to seven weeks both double the relativefrequency of a correct movement,)
In this section the issue of whether analysts optimally respond tothe release of a management forecast in a descriptive fashion hasbeen examined. The findings indicate that analysts are fairlysuccessful in identifying those cases in which they should ignore ormove away from the management forecast. In this case the analystscorrectly react over sixty-one percent of the time. Results from themiddle panel of Table 7 indicate that in those cases in which theanalyst and management initially have forecast errors of oppositesign (Le., one overestimates and one underestimates) analystsrefrain from overreacting almost one-half of the time. The third caseexamined, however, demonstrates that analysts are unwilling tooverreact to the MF, even in those cases in which it is (withhindsight) reasonable. Thus, the evidence on whether analysts tendto excessively mimic management is somewhat mixed.
It is difficult to identify an explanation of why analysts respondcorrectly to the MF relatively frequently in Cases 1 and 2 and soinfrequently in the third case. One model of analyst behavior is thatthey tend to "split the difference" between the MF and the FAFO'The results of Cases 2 and 3 are consistent with this hypothesis.Unfortunately, this proposition does not explain the Case 1 results.Other underlying characteristics of the forecasts might help explainwhy analysts react as they do in the different situations. Threevariables that appear to be important are the uncertainty of theanalysts about their forecasts, the number of analysts follOWing agiven firm at the time of the MF and divergence of the MF from theFAF0 (Le., the surprise).
One measure of analyst uncertainty is the coefficient variation(CV) of the individual analysts' forecasts. The CV is defined as thestandard deviation of the analysts' forecasts of a given firms' EPS inweek 0 divided by the consensus (mean) forecast. As analystsbecome less certain of the EPS they tend to disagree with eachother, increasing the across-analyst variability of their forecasts andthe CV. Given the results of Table 7 one would expect a low CV forCase 1 firms since the analysts appear to be relatively sure ofthemselves in responding to the MF, and a high CV in Case 3 sincethe analysts underreact in this situation. In fact, however, theopposite is true. The average CV in Case 1 is .0828 versus a Case 3
27

average of .0607. Thus, it does not appear that the differentialrelative frequencies of a correct response noted in Table 7 can beexplained by analyst uncertainty.
The number of analysts providing EPS forecasts for a firm at agiven point in time may act as a proxy for the following a firm'sstock enjoys. A large number of analysts indicates a firm that ismore closely followed than a firm that has only a few analystsfollowing it. A closely followed firm, in turn, is one for which a greatdeal of information exists and additional information in the form ofa MF is less valuable (marginally speaking) than in less closelyfollowed firms. In Case 1 the analyst is expected to ignore themanagement forecast. This implies that the information containedin the management forecast is relatively insignificant to the entireinformation set, which is consistent with the situation of a closelyfollowed firm. In Case 2 the analyst is expected to react to the MFannouncement in a controlled fashion and in Case 3 the analyst isexpected to overreact. The latter two cases are consistent with anincreasing importance of the MF. Therefore, if Nj is the averagenumber of analysts following a firm in case j G=1,2,3), one wouldexpect N 1~ N 2~ N 3. However, for the sample used in this studyN 1 = 7.93, N2 = 6.71 and N3 = 7.03. Thus, while Case 1 does havethe greatest number of analysts, the number of analysts in Cases 2and 3 are reversed from what was expected.
The third possible explanation for the differential success ofanalysts in optimally responding to management forecasts is adifference in the surprise contained (measured by the differencebetween the MF and FAFO) in the manager's announcement.Evidence that the surprise factor tended to be lower in the first andthird case is consistent with the ability of analysts to ignoremanagement when they should (Case 1) and analysts inability tooverreact (Case 3). In Case 2 the results indicated that a largemajority of the analysts responses were in the correct direction;however, a significant proportion of the time analysts overreact tothe information. A high surprise factor might explain thisphenomenon. This is exactly what the data indicate. Cases 1 and 3have an average deviation of the MF and the FAFO of about ninepercent while the Case 2 average is greater than 13.5 percent. Thus,as might be expected when the analysts and the managementforecasts differ in forecast error sign, the surprise content of the MFis greater.
28

v. SUMMARY
The purpose of this study was to examine the response offinancial analysts' EPS forecasts to the release of a managementearnings estimate. Of particular interest were the issues of (1)whether analysts reacted, (2) when (relative to the date of the MF)they reacted, and (3) whether they reacted "correctly." The findingsindicate that analysts indeed did react to the public announcementof a MF but were unable to anticipate the content of suchannouncements. Overall, analysts failed to respond correctly tonearly two-thirds of the MFs. Analysts did demonstrate, however,some ability to ignore MFs when the management figure was lessaccurate than their own.
As with any research effort, several caveats are in order. One isthat we have used consensus financial analyst forecasts instead ofindividual analysts' estimates. Due to a diversification effect, theconsensus forecast is generally more accurate, on average, than anyindividual's forecast.l S Thus, the analyst accuracy may beoverstated in some sense. However, this practice is consistent withprevious research and its effect may be somewhat offset by the factthat all management forecasts are voluntary.
Another possible difficulty of interpreting the results is theexistence of lapses in time between when the management andanalyst forecasts are computed and when the forecasts are madepublic. This factor should present only a minor problem. The datesof the analyst forecasts are the dates on which the earnings forecastsare announced to the brokerage firm's sales force. Publicdissemination begins immediately thereafter. In this case theanalyst conceivably could have actually revised the estimate duringthe preceding day or two. Aggregation of this date to weeklyobservations should minimize the problem of timingmisclassification. Likewise, there is little reason to believemanagement would delay releasing a revised forecast for anysignificant period of time. Overall, therefore, the dates recorded forboth the management and analyst forecasts used in this studyshould accurately represent the point in time when the respectiveforecasts were produced.
Finally, there may be some concern about whether firms thatvoluntarily issue management forecasts are representative of allfirms. Research by Imhoff (1978), Hagerman and Ruland (1979)and Penman (1980) address this issue. Firms releasing management
29

forecasts, on average, are smaller in size, have greater systematicrisk, have lower variability in earnings, and have common stockthat has experienced greater price appreciation than controlportfolios of similar firms that do not release management forecasts.In addition, analysts forecasting the earnings of firms withoutmanagement EPS forecasts available tend to be less accurate thananalysts that have management forecasts available. While it is notobvious that any of these factors would induce a systematic biasinto the results of this study, it is important to recognize that firmsreleasing management forecasts are apparently different from thosethat do not along several dimensions.
This paper provides some insight into the belief revision processof financial analysts by identifying one event that analysts appearto find interesting and analyzing the analysts' response to thatevent. As the first (to the author's knowledge) research effort aimedat examining the factors underlying revisions in analyst forecasts,several issues are left to future research. Perhaps the most obviousneed is to identify other news events that affect analysts' EPSforecasts and investigate the effect these events have on theanalysts' beliefs. A number of possible events such as realinvestment decisions, decisions to change dividends and changes inthe competitive enviroment, as well as many others, offer thepotential for a significant impact on EPS.
A second avenue of investigation that would be interesting topursue, if the data were to become available, is to compare thereactions of individual analysts to news events. Using consensusdata this study finds that, on average, analysts do not do a verygood job of using MF information to "correctly" revise theirearnings forecasts. It may be that there exists a minority of analystswith superior abilities whose effect on the consensus FAF is beingswamped by a mediocre majority. Unfortunately, the publiclyavailable data sources provide only consensus forecasts. Theinvestigation of whether superior analysts exist must wait for amore detailed data base.
Another refinement to the current study would be to lookbeyond the effect of a news event on the mean forecast. Both theZacks and the Lynch, Jones and Ryan data bases provide ameasure of the dispersion of FAF, typically the standard deviation.One might expect that news events have an effect on the standarddeviation as well as the mean FAF. This implies that additionalresearch could be conducted examining the effect of various newsevents on the standard deviation of FAF in isolation as well asinvestigating for joint movements in both variables.
30

Finally, one might be able to expand the data base ofmanagement forecasts to include additional firms with multipleforecasts either within a year or over several years. This would allowan analysis aimed at whether analysts respond differently todifferent management forecasts prepared by the same management.It may be that management is able to establish a "track record" thataffects the reaction of analysts to a particular MF.
31

APPENDIX(Firm Name and MF Date)
Avemco Corp - AVE (10/24/79)Automatic Data Processing - AUD (8/24/81)Allen Group Inc. - ALN (3/13/80,6/26/81)ARKLA, Inc. - ALG (5/22/80)Arizona Public Service - AZP (11/5/80,2/11/81)Bangor Punta Corp - BNK (5/22/80)Baldor Electric Co. - BEZ (3/18/80)Baxter Travenol Labs - BAX (7/21/80)Best Products - BES (2/6/80)Browning Ferris, Ind. - BFI (1/29/81)Binney and Smith, Inc. - BYS (11/20/81)CBI Ind. - CBH (10/7/82)Chyron Corp. - CHYC (12/11/81)Coleman Co. - CLN (10/25/79,7/16/82)Crown Zellerback - ZB (10/16/79)Community Psychiatric Centers - CMY (9/26/79,5/22/80,7/13/81)Circle K Corp. - CKP (11/20/79)CPC Internat'l - CPC (7/26/79)Dexter Corp. - DEX (12/27/79)Eastern Gas & Fuel- EFU (10/18/79)Eckert Corp. - ECK (5/10/82)El Paso Co. - ELG (2/26/81)Fuqua Ind. - FQA (11/17/82)Federal Express Corp. - FDX (3/27/80)First Mississippi Corp. - FRM (5/29/80)Goulds Pumps, Inc. - GULD (9/12/79)General Cinema Corp. - GCN (7/14/80,9/8/81)Global Marine Inc. - GLM (7/23/81)Harcourt Brace and]ovan., Inc. - HB] (8/14/79)Hoover Universal, Inc. - HVU (1/24/80)Hercules, Inc. - HPC (2/13/81)Heinz Co. - HNZ (1/24/80)IMS Internat' 1- IMSI (3/22/82)Internat'l Mineral & Chemicals Corp. - IGL (8/31/79,2/28/80,
10/15/80, 10/21/81)]ostens Inc. - lOS (1/16/80)Kaiser Alumnium and Chemical Co. - KLU (10/14/80)Knight-Ridder Co. - KRN (11/12/81)
32

K-Mart Corp. - KM (9/20/79)Limited Corp. - LTD (11/30/82)Leggett and Platt - LEG (9/24/79)MASCO Corp. - MAS (10/28/80)MAPCO - MDA (10/6/81)Manufacturers Hanover Corp. - MHC (10/27/80)N alco Chemical Co. - NLC (6/24/82)NL Industries - NL (11/28/79)N ucor Corp. - NUE (8/28/79, 11/17/82)O'Mark Ind. - OMK (4/8/81)ONEOK Inc. - OKE (6/17/82)Orange and Rockland Utilities - ORU (10/7/81)Portland General Electric - PGN (5/14/80)Raytheon - RTN (10/23/81)Royal Crown Cola - RCC (11/6/80)Reading and Bates - RB (2/18/82)Scott and Fetzer - SFZ (3/25/80)Stauffer Chemical Co. - STF (1/28/80, 1/26/81)Sundstrand Corp. - SNS (4/15/82,9/28/82)Scotty's Inc. - SHB (5/7/80)Standard Brands Paints - SBP (1/25/80)U. S. Gypsum - USG (6/9/80)U. S. Leasing - USL (10/1/81)V ulcan Materials Co. - VMC (6/24/82)Whittaker Corp. - WKR (9/11/79,3/22/82)Wickes Co. - QWIX (10/20/80)
33

FOOTNOTES
1. Ample empirical evidence indicates that financialanalyst earnings forecasts represents a reasonableproxy for the "market's" expectations. See forexample, studies by Malkiel and Cragg (1970),Malkiel (1970) and Fried and Givoly (1982).
2. The time period of twenty weeks is necessitated by thestatistical tests used to examine the hypotheses.
3. It might be instructive to discuss briefly examples ofmanagement earnings forecasts that did not meet thedata requiremen ts.
(1) By far the most frequent reason managementearnings forecasts were not usable was becausean EPS forecast was open-ended. For example, aforecast that read "at least" $3.00 per share is notusable because it cannot always beunambiguously compared to the FA forecast.Other examples of open-ended wording are:greater than, record profits (losses), better than,etc.(2) The forecast was of earnings rather than EPS.(3) Many EPS forecasts are issued fairly close toyear end. This study omitted EPS forecasts thatwere made within one month of year end.(4) Many articles were retrieved for dates afteryear end but before audited financials wereavailable. Any forecast made after year end wasexcluded from the sample.
4. The exception to this collection procedure was whenmanagement earnings forecasts occurred less thantwenty weeks prior to the end of the fiscal year. In thiscase analysts' forecasts were included only for thelength of time available in the current fiscal year.
5. The actual cross-sectional T -statistic is computed as,
34

NT t = ACt· Nt(1/2) / ([l/(N t-l)] :E t (ACj,t-ACt)2}(1/2)
j=l
6. The financial analyst forecast may change from weekto week and, therefore, has a subscript denoting theweek of the forecast. The management forecast, bydefinition, occurs in week 0 so the subscript issuppressed. Likewise, there is one actual earningsfigure for each MF making the subscript unnecessary.
7. While there is nothing magical about a sixteen-weekperiod, the idea is to select a period of time to get areasonable estimate of the mean change, but not solong as to include nonrepresentative date.Experimen ts with time periods slightly longer andshorter than sixteen weeks produced similar results.
8. This does not imply that the management forecast isuninformative. It may be very valuable in confirminganalysts' current beliefs. As a confirming piece of news,however, one would anticipate an effect on theacross-analyst variability of forecasts rather than onthe mean (consensus) forecast.
9. When the same 2.5 percent filter is applied to theestimation period beginning in week -16, theconclusions do not change from those in Table 1.
10. The significance levels of the results using a 5 percentfilter test are between those reported in Table 3 andthose in Table 4.
11. For both of these tests the choice of the particularestimation period and forecast divergence filter issomewhat arbitrary. The zero filter was chosen inorder to use all of the available data. In order to detectany anticipatory FAF movement one of the estimationperiods that compute abnormal revisions in weeksprior to the management forecast must be used.
12. An alternative explanation is that the earningsforecasts in 1981-82 are more divergent from the
35

associated FAF. Examining the number of firmsincluded in the ten percent filter subsample negatesthis argument. Of the forty-two firms in the 1979-80sample sixty percent are still in the sample with theten percent filter in effect, while only forty-five percentare included in the ten percent filter for 1981-82.
14. The additional firms and the dates of the release of themanagement forecasts are Avemco (10/24/79) andMission Insurance Group (5/23/79).
15. Employing multiple forecasts to represent a moreappropriate estimate is well documented in theliterature (Beaver [1982)). Also, recent Wall StreetJournal articles have noted that consensus forecastsconsistently outperform individuals (April 6, 1983: 48;November 3,1981: 31).
36

REFERENCES
Beaver, W. H., Financial Reporting: An Accounting Revolution(Englewood Cliffs, N.J.: Prentice Hall, 1981), 160-163.
S. Brown and J. Warner, "Measuring Security Price Performance,"Journal ofFinancial Economics, September 1980,205-258.
S. Brown andJ. Warner, "Using Daily Stock Returns: The Case ofEvent Studies," forthcoming Journal of Financial Economics,1984.
E. Elton, M. Gruber and B. M. Gultekin, "Expectations and SharePrices," Management Science, September 1981, 975-987.
E. Fama, L. Fisher, M.Jensen and R. Roll, "The Adjustment ofStock Prices to New Information," International EconomicReview, February 1969, 1-21.
D. Fried and D. Givoly, "Financial Analysts Forecasts of Earnings:A Better Surrogate for Earnings Expectations," Journal ofAccounting and Economics, October 1982,85-107.
D. Givoly andJ. Lakonishok, "The Information Content ofFinancial Analysts' Forecasts of Earnings," Journal ofAccounting and Economics, Winter 1979, 165-185.
D. Givoly andJ. Lakonishok, "Financial Analysts' Forecast ofEarnings: The Value to Investors," Journal of Banking andFinance, September 1980,221-233.
D. Givoly and J. Lakonishok, "Earnings Expectation andProperties of Earnings Forecasts - A Review and Analysis ofthe Research," Working paper 778/83, April 1983.
N. Gonedes, N. Dopuch and S. Penman, "Disclosure Rules,Information Production and Capital Market Equilibrium:The Case of Forecast Disclosure Rules," Journal of AccountingResearch, Spring 1976,89-137.
37
R. Hagerman and W. Ruland, "The Accuracy of ManagementForecasts and Forecasts of Simple Alternative Models,"Journal ofEconomics and Business, Spring 1979, 172-179.
E. Imhoff, "The Representativeness of Management EarningsForecasts," The Accounting Review, October 1978, 836-850.
Jaggi, Bikki, "Further Evidence on the Accuracy of ManagementForecasts Vis-a-Vis Analysts' Forecasts," The Accounting ReviewJanuary 1980,96-101.
B. Malkiel, "The Valuation of Public Utility Equities," BeliJournalofEconomics, Spring 1970,143-160.
B. Malkiel and J. Cragg, "Expectations and the Structure of SharePrices" A merican Economic Review, September 1970,601-617.
V. N eiderhoffer and P. Regan, "Earnings Changes, Analysts'Forecasts and Stock Prices," Financial Analysts Journal,May-June 1972,65-71.
S. Penman, "An Empirical Investigation of the VoluntaryDisclosure of Corporate Earnings Forecasts," Journal ofAccounting Research, Spring 1980, 132-160.
L. Zacks, "EPS Forecasts - Accuracy is not Enough," FinancialAnalystsJourna4 March-April 1979.
38