iiieprints.utm.my/id/eprint/5506/1/wongkwoncheongmfkm2006.pdf · iv acknowledgements first and...
TRANSCRIPT


iii
To my beloved mother and father

iv
ACKNOWLEDGEMENTS
First and foremost, I must thank to Universiti Teknologi Malaysia for
supporting my Master studies by providing me the scholarship.
Secondly, I would like to pay my sincere appreciation and gratitude to my
supervisor Prof. Dr. Ir. Farid Nasir Bin Hj. Ani and co-supervisor Prof. Dr. Ir. Wan
Ramli Bin Wan Daud for their invaluable guidance and helpful ideas throughout this
research work. Their appreciation, continuous support and words of encouragement
gave me a new life to my effort especially during my hard time. This thesis would
not have been completed without their patience and constant support. Not forgetting,
technical staffs at the Combustion Laboratory, Faculty of Mechanical Engineering,
UTM Skudai, my fellow friends especially Mr Lim, Mr Elhadi, Mr Muhammad and
Mr. Zainal who have been extremely helpful during my study.
In the last, but not the least, I would like to thank all my family members
especially my mother and sister for her never-ending support.

v
ABSTRACT
Various types of microporous carbon gas adsorbents have been prepared from Malaysia carbonaceous solid waste, the palm shell as the precursor for further modification into carbon molecular sieve (CMS). It is an advantage to utilize the palm shell as starting material by converting into useful CMS since it can be obtained easily and abundantly in the country. The precursors were prepared in laboratory fluidized and fixed bed reactors by one-step physical treatments, which included carbonization in N2 flow and directly followed by CO2 activation. The effects of carbonization parameters, such as carbonization temperature, hold time and N2 flow rate on the porosity development have been studied. The characterizations of precursors were carried out by constant volumetric physisorption analyzer to determine various characteristic parameters from the analysis of adsorption isotherm. Here, N2 and CO2 have been used as the adsorptive gas for analysis at 77 and 273 K, respectively. Although the entire precursor appeared to be highly microporous, only some precursors produced were considered suitable to be used as precursor of CMS for O2/N2 separation based on the literature survey finding. Then the precursors were modified into CMS using chemical vapor deposition (CVD) technique. The CVD technique involved deposition of pyrolytic carbon on the precursor by cracking of hydrocarbon gas substance. CVD parameters such as type of hydrocarbon gas substance, deposition temperature, deposition hold time and % v/v of hydrocarbon gas substance were manipulated to have pyrolytic carbon deposited on the pore mouth for improving separation selectivity with some trade-off in O2 adsorption capacity. The characterizations of CMS were carried out by constant volumetric physisorption analyzer to determine the adsorption kinetic of O2 and N2 for determining the selectivity and O2 adsorption capacity from isotherm at 298 K. The deposition mechanisms were proposed from the result obtained. By directly applied CVD to deposit carbon on precursor for modifying the pore mouth produced CMS which is not up to expected performance compared to commercial carbon molecular sieve (CCMS). It was due to the existence of a small portion of pore with bigger pore size. These pores could not be effectively lowered because further deposition of the pyrolytic carbon will close the smaller pore resulting in abrupt reduction in O2 adsorption capacity. The conventional CVD involving pore blocking by pyrolytic carbon followed by control gasification in CO2 atmosphere were used. In this experiment, the best samples from directly applied CVD and conventional CVD have selectivity of 8.00 and 5.00 respectively compared to the selectivity of 2.09 for the precursor.
vi
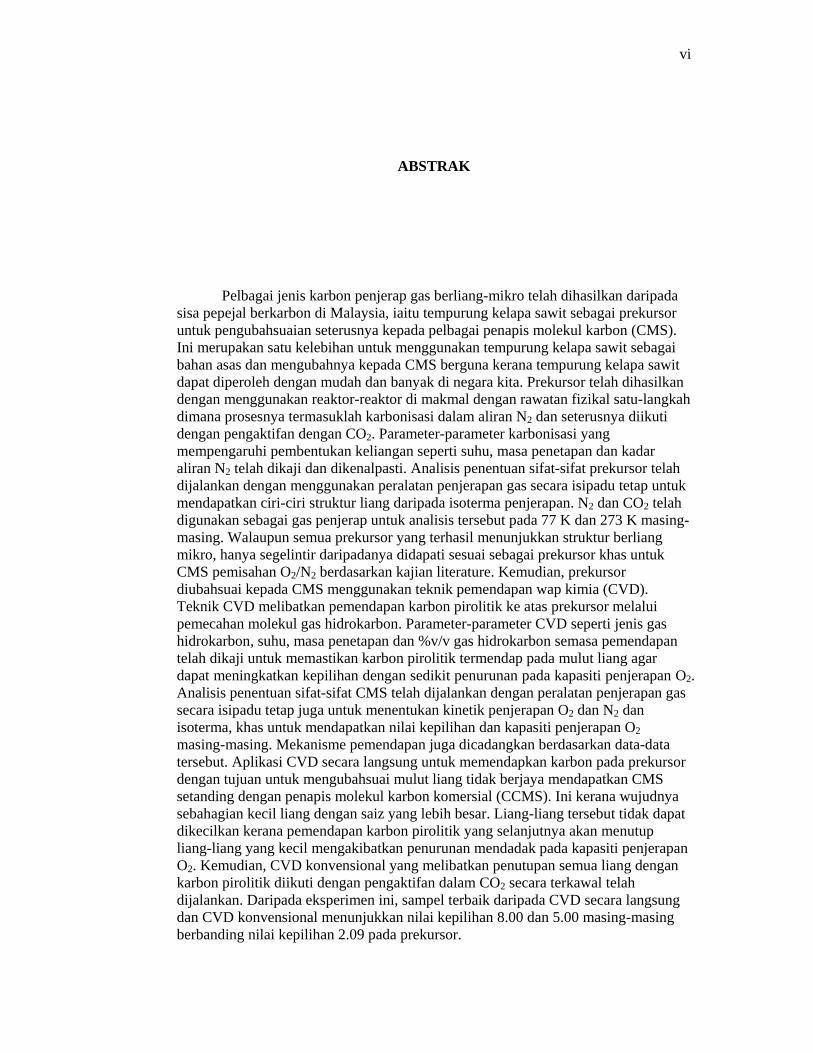
ABSTRAK
Pelbagai jenis karbon penjerap gas berliang-mikro telah dihasilkan daripada sisa pepejal berkarbon di Malaysia, iaitu tempurung kelapa sawit sebagai prekursor untuk pengubahsuaian seterusnya kepada pelbagai penapis molekul karbon (CMS). Ini merupakan satu kelebihan untuk menggunakan tempurung kelapa sawit sebagai bahan asas dan mengubahnya kepada CMS berguna kerana tempurung kelapa sawit dapat diperoleh dengan mudah dan banyak di negara kita. Prekursor telah dihasilkan dengan menggunakan reaktor-reaktor di makmal dengan rawatan fizikal satu-langkah dimana prosesnya termasuklah karbonisasi dalam aliran N2 dan seterusnya diikuti dengan pengaktifan dengan CO2. Parameter-parameter karbonisasi yang mempengaruhi pembentukan keliangan seperti suhu, masa penetapan dan kadar aliran N2 telah dikaji dan dikenalpasti. Analisis penentuan sifat-sifat prekursor telah dijalankan dengan menggunakan peralatan penjerapan gas secara isipadu tetap untuk mendapatkan ciri-ciri struktur liang daripada isoterma penjerapan. N2 dan CO2 telah digunakan sebagai gas penjerap untuk analisis tersebut pada 77 K dan 273 K masing-masing. Walaupun semua prekursor yang terhasil menunjukkan struktur berliang mikro, hanya segelintir daripadanya didapati sesuai sebagai prekursor khas untuk CMS pemisahan O2/N2 berdasarkan kajian literature. Kemudian, prekursor diubahsuai kepada CMS menggunakan teknik pemendapan wap kimia (CVD). Teknik CVD melibatkan pemendapan karbon pirolitik ke atas prekursor melalui pemecahan molekul gas hidrokarbon. Parameter-parameter CVD seperti jenis gas hidrokarbon, suhu, masa penetapan dan %v/v gas hidrokarbon semasa pemendapan telah dikaji untuk memastikan karbon pirolitik termendap pada mulut liang agar dapat meningkatkan kepilihan dengan sedikit penurunan pada kapasiti penjerapan O2. Analisis penentuan sifat-sifat CMS telah dijalankan dengan peralatan penjerapan gas secara isipadu tetap juga untuk menentukan kinetik penjerapan O2 dan N2 dan isoterma, khas untuk mendapatkan nilai kepilihan dan kapasiti penjerapan O2 masing-masing. Mekanisme pemendapan juga dicadangkan berdasarkan data-data tersebut. Aplikasi CVD secara langsung untuk memendapkan karbon pada prekursor dengan tujuan untuk mengubahsuai mulut liang tidak berjaya mendapatkan CMS setanding dengan penapis molekul karbon komersial (CCMS). Ini kerana wujudnya sebahagian kecil liang dengan saiz yang lebih besar. Liang-liang tersebut tidak dapat dikecilkan kerana pemendapan karbon pirolitik yang selanjutnya akan menutup liang-liang yang kecil mengakibatkan penurunan mendadak pada kapasiti penjerapan O2. Kemudian, CVD konvensional yang melibatkan penutupan semua liang dengan karbon pirolitik diikuti dengan pengaktifan dalam CO2 secara terkawal telah dijalankan. Daripada eksperimen ini, sampel terbaik daripada CVD secara langsung dan CVD konvensional menunjukkan nilai kepilihan 8.00 dan 5.00 masing-masing berbanding nilai kepilihan 2.09 pada prekursor.
vii
TABLE OF CONTENTS
CHAPTER TITLE
PAGE
DECLARATION
DEDICATION
ACKNOWLEDGEMENT
ABSTRACT
ABSTRAK
TABLE OF CONTENTS
LIST OF TABLES
LIST OF FIGURES
LIST OF SYMBOLS
LIST OF APPENDICES
ii
iii
iv
v
vi
vii
xiii
xv
xxvi
xxx
1 INTRODUCTION
1.1 Typical Characteristics of Adsorbents.
1.1.1 Molecular Sieve Carbon or Carbon
Molecular Sieve
1.2 Gas Adsorption Processes
1.3 Air Separation Technologies
1.4 Adsorption Mechanism
1.5 Research on Palm Oil Wastes for Carbon
Adsorbent Preparation
1.6 Research Objectives
1.7 Research Scopes
1.8 Contribution
1
1
3
4
5
7
8
10
11
11

viii
2 PREPARATION AND PROCESSING OF
MICROPOROUS CARBON ADSORBENTS BY
PHYSICAL TREATMENT
2.1 Introduction
2.2 Literature Findings on Various Methods in
Preparation of Microporous Carbons by
Different Starting Material and Processing
Method.
2.3 Processing Methods, Experimental Rig Set
Up and Procedures for Preparing
Microporous Carbon for CVD Process from
Palm Shell.
2.4 Physical Treatment to Produce Microporous
Carbon Acts as Ideal Precursor for CVD
Process into CMS.
2.4.1 Physical Treatment Parameters Used
in the Experiment
13
13
15
19
21
23
3 CHARACTERIZATION OF MICROPOROUS
CARBON ADSORBENTS FROM PALM SHELL
BY PHYSISORPTION TECHNIQUE
3.1 Introduction
3.2 Theory and Concept of Physical Gas
Adsorption (or physisorption analysis)
3.2.1 Adsorption Isotherm
3.2.2 BET (Brunauer, Emmett and Teller)
Equation
3.2.3 Standard Isotherms, t-plot
3.2.4 Pure Component Adsorption in
Microporous Solid
3.2.4.1 Dubinin-Radushkevich (DR)
Equation
27
27
29
30
31
33
35
35

ix
3.2.4.2 Dubinan-Astakhov (DA)
Equation
3.2.5 Horvath-Kawazoe (H-K) Method
3.2.6 Density Functional Theory (DFT)
Formulation
3.2.6.1 Fitting Model Isotherms to
Experimental Data by Method
of Deconvolution
3.2.7 Summary of Theory and Concept of
Physisorption Analysis
3.2.8 Typical Experimental Parameter or
Condition Used.
3.3 Instrumental Operation, Theory and Method
3.4 Experimental
3.5 Results and Discussion on the Effects of
Physical Treatment Parameters on the Pore
Structure Development of Microporous
Carbon Adsorbents (CMS Precursor)
3.5.1 Microporous Carbon Adsorbent from
Tuyere Type Reactor
3.5.2 Microporous Carbon Adsorbent from
Mesh Wire Type Reactor
3.5.2.1Microporous carbon carbonized
at different temperature
3.5.2.2 Microporous carbon
carbonized at different hold
time
3.5.2.3 Microporous carbon
carbonized at different
carbonization flow rate
3.6 Discussion
37
38
40
42
43
44
46
47
48
49
56
56
65
71
79

x
4 PREPARATION AND PROCESSING OF
CARBON MOLECULAR SIEVE BY
CHEMICAL VAPOR DEPOSITION (CVD)
METHOD
4.1 Introduction
4.2 Vapor Substance used in Chemical Vapor
Deposition (CVD)
4.3 Theory of Carbon Molecular Sieve (CMS)
from Chemical Vapor Deposition (CVD) for
Air Separation
4.4 Literature Findings on Various Methods in
the Preparation of CMS
4.5 Method of Preparation of CMS by Direct
Deposition (DD) Process.
4.5.1 Pore Blocking Mechanism
4.6 Method of Preparation of CMS by CVD
Process of Chemisorbed Carbon Deposition
(CCD)
4.7 Literature Findings on Chemistry and
Kinetics of CVD
4.8 Procedure for CVD Process and Experimental
Rig Set Up
80
80
81
82
84
89
90
93
94
96

xi
5 ADSORPTION RATE AND GAS DIFFUSION
EFFECTS ON THE KINETICS SEPARATION
OF NITROGEN AND OXYGEN GAS
5.1 Introduction
5.2 Kinetics of Adsorption and Diffusional
Characteristics of CMS
5.2.1 Phenomenological Model for
Adsorption Kinetics
5.2.2 Fickian Model for Adsorption
Kinetics
5.3 Experimental Technique
5.4 Characteristic of Initial Precursor Used and
Commercial Carbon Molecular Sieve
5.5 Chemical Vapor Deposition by Using
Methane Substance.
5.5.1 Chemical Vapor Deposition of the
Precursor Using Methane at Different
Temperature
5.5.2 Chemical Vapor Deposition of the
Precursor at Different Methane-
Nitrogen Gas Fractional Volume
5.5.3 Chemical Vapor Deposition of the
Precursor Using Methane at Different
Hold Time
5.5.3.1 Chemical Vapor Deposition at
750 °C at Different Hold Time
5.5.3.2 Chemical Vapor Deposition at
700 °C at Different Hold Time
5.5.4 Discussion
5.6 Chemical Vapor Deposition by Using Ethane
Substance
99
99
101
102
103
106
107
116
116
120
126
126
131
133
134
xii
5.6.1 Chemical Vapor Deposition of
Precursor Using Ethane at Different
Temperature
5.6.2 Chemical Vapor Deposition of
Precursor at Different Ethane-
Nitrogen Gas Fractional Volume
5.6.3 Chemical Vapor Deposition of
Precursor at Different Hold Time.
5.6.3.1 Chemical Vapor Deposition at
Different Hold Time at 750 °C
5.6.3.2 Chemical Vapor Deposition at
Different Hold Time at 775 °C
5.6.4 Discussion
5.7 Ethylene Cracking to Seal All Pore Entrances
and Followed by Control Gasification
5.7.1 Control Gasification Using CO2 at
Different Temperature
5.7.2. Control Gasification Using CO2 at
Different Hold Time at 600 °C and
700 °C
5.7.3. Control Gasification Using CO2 at
Different Hold Time at 800 °C
5.7.4. Control Gasification Using CO2 at
Different CO2 Activation Fractional
Volume
5.7.5. Discussion
134
138
141
141
144
148
152
152
155
160
164
169
6 CONCLUSION AND RECOMMENDATION
6.1 Limitation of Experiment
6.2 Conclusion
6.3 Recommendations for Future Work.
170
170
171
174

xiii
LIST OF TABLES
TABLE NO. TITLE PAGE
1.1
1.2
3.1
3.2
3.3
5.1
5.2
5.3
Typical process using adsorption technology
Technology comparison table
N2 adsorption and CO2 adsorption at 77K and 273K for
microporous carbon and char carbonized at different
temperature in Tuyere type reactor.
N2 adsorption at 77K for microporous carbon carbonized
at different temperature, hold time and heating rate in
mesh wire reactor.
CO2 adsorption at 273K for microporous carbon
carbonized at different temperature, hold time, and
heating rate in mesh wire reactor.
Diffusion of atmospheric gases in various molecular
sieve carbons
Summary of the experimental results for diffusivity,
adsorption capacity and selectivity of various
microporous carbon precursors, commercial carbon
molecular sieve and samples with precursors after
deposited by methane cracking on O2 and N2 adsorption
at 25 °C.
Summary of the experimental results for diffusivity,
adsorption capacity and selectivity of various samples
from precursor after deposited by ethane cracking on O2
and N2 adsorption at 25 °C.
4
6
55
77
78
104
108
151

xiv
5.4 Summary of the experimental results for diffusivity,
adsorption capacity and selectivity of various samples by
ethane cracking to seal all pores entrances and followed
by control gasification.
163

xv
LIST OF FIGURES
FIGURE NO. TITLE PAGE
2.1
2.2
2.3
2.4
2.5
3.1
3.2
3.3
3.4
3.5
3.6
3.7
3.8
3.9
Microporous carbons experimental rig set-up
Raw oil palm shells from palm oil mills
Fluidized bed design (mesh wire)
Flow chart of microporous carbons prepared by
physical treatment
Brief experimental technique used in the experiment
Six types of gas adsorption isotherm according to the
international IUPAC classification
t-plots of mesoporous and nonporous solids
t-plot of microporous and micro- and mesoporous solids
Diagrammatic representation of the variations in DR
plots with associated pore size distribution
Model isotherm for argon at 87.3 K in a 40Å carbon
substrate slit by the DFT method. The inset and
corresponding points on the isotherm show the gas
density (y-axis) in respect to distance from the pore wall
(x-axis)
Model isotherms in the micropore size range of the pore
width argon on carbon at 87.3 K
The functional diagram of the Micromeritics ASAP
2010 manifold
The N2 adsorption isotherm of single-step activated
carbon and char produced from Tuyere type reactor at
different carbonization temperature
Micropore and mesopores pore volume from N2
20
21
25
25
26
33
36
36
38
43
43
49
52
52

xvi
3.10
3.11
3.12
3.13
3.14
3.15
3.16
3.17
3.18
3.19
3.20
3.21
adsorption (77K) of samples produced from tuyere type
reactor (a) based on total pore volume (b) percentage
Horvath-Kawazoe plots of the equivalent micropore
size distribution of SACC and Char carbonized at
different temperature from N2 adsorption (77K)
DR plots of the SACC carbonized at different
temperature
The N2 adsorption isotherm of microporous carbon
produced from mesh wire type reactor at different
carbonization temperature
The CO2 adsorption isotherm of microporous carbon
produced from mesh wire type reactor at different
carbonization temperature.
Density Functional Theory plot of pore size distribution
of sample SACC400/0.5/0.2
Microporous volume from N2 adsorption (77K) and
CO2 adsorption (273K) of samples produced from mesh
wire reactor at different temperature
Micropore and mesopores volume from N2 adsorption
(77K) of samples produced from mesh wire type reactor
at different temperature (a) based on total pore volume
(b) percentage
Horvath-Kawazoe plots of the equivalent micropore
size distribution of samples produced from the mesh
wire type reactor at different carbonization temperature
from the N2 adsorption (77K)
Density Functional Theory plot of pore size distribution
of sample SACC500/0.5/0.2
Density Functional Theory plot of pore size distribution
of sample SACC600/0.5/0.2
Density Functional Theory plot of pore size distribution
of sample SACC700/0.5/0.2
Density Functional Theory plot of pore size distribution
55
56
59
59
60
60
61
61
62
62
63
63

xvii
3.22
3.23
3.24
3.25
3.26
3.27
3.28
3.29
3.30
3.31
3.32
3.33
of sample SACC800/0.5/0.2
DR plots of samples produced from mesh wire type
reactor at different carbonization temperature from N2
adsorption (77 K)
DR plots of samples produced from mesh wire type
reactor at different carbonization temperature from CO2
adsorption (273 K)
The N2 adsorption isotherm of microporous carbon
produced from mesh wire type reactor at different
carbonization hold time.
The CO2 adsorption isotherm of microporous carbon
produced from mesh wire type reactor at different
carbonization hold time.
Microporous volume from N2 adsorption (77K) and
CO2 adsorption (273K) of samples produced from mesh
wire reactor at different hold time.
Density Functional Theory Plot of pore size distribution
of sample SACC500/1.0/0.2
Density Functional Theory Plot of pore size distribution
of sample SACC500/1.5/0.2
Density Functional Theory Plot of pore size distribution
of sample SACC500/2.0/0.2
Horvath- Kawazoe plots of the equivalent micropore
size distribution of samples produced from the mesh
wire type reactor at different carbonization hold time
from N2 adsorption (77K)
DR plots of samples produced from mesh wire type
reactor at different carbonization hold time from N2
adsorption (77K)
DR plots of samples produced from mesh wire type
reactor at different carbonization hold time from CO2
adsorption (273K)
The N2 adsorption isotherm of microporous carbon
66
66
68
68
69
69
70
70
71
72
73
74

xviii
3.34
3.35
3.36
3.37
3.38
3.39
3.40
3.41
4.1
4.2
4.3
4.4
produced from mesh wire type reactor at different
carbonization flowrate.
The CO2 adsorption isotherm of microporous carbon
produced from mesh wire type reactor at different
carbonization flow rate.
Microporous volume from N2 adsorption (77K) and
CO2 adsorption (273K) of samples produced from mesh
wire reactor at different carbonization flow rate
Density Functional Theory plot of pore size distribution
of sample SACC500/0.5/0.5
Density Functional Theory plot of pore size distribution
of sample SACC500/0.5/0.3
Density Functional Theory plot of pore size distribution
of sample SACC500/0.5/0.4
Horvath-Kawazoe plots of equivalent micropore size
distribution of samples produced from the mesh wire
type reactor at different carbonization flow rate from N2
adsorption (77K)
DR plots of samples produced from mesh wire type
reactor at different carbonization flow rate from N2
adsorption (77K)
DR plots of samples produced from mesh wire type
reactor at different carbonization flow rate from CO2
adsorption (273K)
(a) Schematic diagram of the suggested pore blocking
mechanism. (b) The pore reopening process by
gasification
Mechanism of carbon deposition on activated carbon
Schematic representation of carbon deposition under
different regimes: A-clean pore, B-deposition in
chemical kinetic regime-case 1, C-pore mouth
deposition in internal diffusion regime-case 2.
Reaction scheme for pyrocarbon deposition from
74
75
75
76
76
77
78
79
88
89
90
98

xix
4.5
4.6
5.1
5.2
5.3
5.4
5.5
5.6
5.7
5.8
5.9
5.10
5.11
5.12
5.13
5.14
methane
Carbon molecular sieve prepared by chemical vapour
deposition processing rig set up
Flowchart of carbon molecular sieve prepared by
chemical vapour deposition method.
(a) Equilibrium isotherms and (b) experimental uptake
curves for sorption of O2 and N2 on Bergbau-Forschung
CMS at 193 K and 273 K
Experimental uptake curves for N2 and O2 in the
Bergbau-Forschung CMS at 193 K and 273 K
Graph of fractional uptake versus time for
SACC500/0.5/0.2 and SACC500/0.5/0.4 at 25 °C
Graph of fractional uptake versus time for CCMS at 25
°C
Plot of ln(1-(Mt/M∞)) versus time for diffusivity
evaluation of SACC500/0.5/0.2 and SACC500/0.5/0.4.
Plot of ln(1-(Mt/M∞)) versus time for diffusivity
evaluation of CCMS
The adsorption isotherm evaluated at 25 °C for
SACC500/0.5/0.2 and SACC500/0.5/0.4
The adsorption isotherm evaluated at 25 °C for CCMS
Graph of fractional uptake versus time for CMS1
deposited from 600-700 °C
Graph of fractional uptake versus time for CMS2
deposited from 600-700 °C
Plot of ln(1-(Mt/M∞)) versus time for diffusivity
evaluation of CMS1 deposited from 600-700 °C
Plot of ln(1-(Mt/M∞)) versus time for diffusivity
evaluation of CMS2 deposited from 600-700 °C
The adsorption isotherm evaluated at 25 °C for CMS1
deposited from 600-700 °C
The adsorption isotherm evaluated at 25 °C for CMS2
100
101
104
109
113
113
114
114
115
115
117
118
118
119
119
120

xx
5.15
5.16
5.17
5.18
5.19
5.20
5.21
5.22
5.23
5.24
5.25
5.26
5.27
5.28
deposited from 600-700 °C
Graph of fractional uptake versus time for CMS1
deposited from 750-850 °C
Graph of fractional uptake versus time for CMS2
deposited from 750-850 °C
Plot of ln(1-(Mt/M∞)) versus time for diffusivity
evaluation of CMS1 deposited from 750-850 °C
Plot of ln(1-(Mt/M∞)) versus time for diffusivity
evaluation of CMS2 deposited from 750-850 °C
The adsorption isotherm evaluated at 25 °C for CMS1
deposited from 750-850 °C
The adsorption isotherm evaluated at 25 °C for CMS2
deposited from 750-850 °C
The trend of selectivity and O2 adsorption capacity
versus deposition temperature for CMS1
The trend of selectivity and O2 adsorption capacity
versus deposition temperature for CMS2
Graph of fractional uptake versus time for CMS1
deposited at different methane-nitrogen gas fractional
volume.
Graph of fractional uptake versus time for CMS2
deposited at different methane-nitrogen gas fractional
volume
Plot of ln(1-(Mt/M∞)) versus time for diffusivity
evaluation of CMS1 deposited at different methane-
nitrogen gas fractional volume
Plot of ln(1-(Mt/M∞)) versus time for diffusivity
evaluation of CMS2 deposited at different methane-
nitrogen gas fractional volume
The adsorption isotherm evaluated at 25 °C for CMS1
deposited at different methane-nitrogen gas fractional
volume
The adsorption isotherm evaluated at 25 °C for CMS2
120
121
121
122
122
123
123
124
126
126
127
127
128
128

xxi
5.29
5.30
5.31
5.32
5.33
5.34
5.35
5.36
5.37
5.38
5.39
5.40
5.41
5.42
deposited at different methane-nitrogen fractional gas
volume
The trend of selectivity and O2 adsorption capacity
versus CH4 fraction for CMS1
The trend of selectivity and O2 adsorption capacity
versus CH4 fraction for CMS2
The trend of selectivity and O2 adsorption capacity
versus hold time for CMS1 (750 °C)
The trend of selectivity and O2 adsorption capacity
versus hold time for CMS2 (750 °C)
Graph of fractional uptake versus time for CMS1
deposited at 750 °C at different hold time
Graph of fractional uptake versus time for CMS2
deposited at 750 °C at different hold time
Plot of ln(1-(Mt/M∞)) versus time for diffusivity
evaluation of CMS1 deposited at 750 °C at different
hold time
Plot of ln(1-(Mt/M∞)) versus time for diffusivity
evaluation of CMS2 deposited at 750 °C at different
hold time
The adsorption isotherm evaluated at 25 °C for CMS1
deposited at 750 °C at different hold time
The adsorption isotherm evaluated at 25 °C for CMS2
deposited at 750 °C at different hold time
The trend of selectivity and O2 adsorption capacity
versus hold time for CMS1 (700 °C)
Graph of fractional uptake versus time for CMS1
deposited at 700 °C at different hold time
Plot of ln(1-(Mt/M∞)) versus time for diffusivity
evaluation of CMS1 deposited at 700 °C at different
hold time
The adsorption isotherm evaluated at 25 °C for CMS1
129
129
131
131
132
132
133
133
134
134
135
136
136
137

xxii
5.43
5.44
5.45
5.46
5.47
5.48
5.49
5.50
5.51
5.52
5.53
5.54
5.55
5.56
deposited at 700 °C at different hold time
Graph of fractional uptake versus time for CMS3
deposited from 600 °C to 700 °C
Graph of fractional uptake versus time for CMS3
deposited from 750 °C to 800 °C
Plot of ln(1-(Mt/M∞)) versus time for diffusivity
evaluation of CMS3 deposited from 600 °C to 700 °C
Plot of ln(1-(Mt/M∞)) versus time for diffusivity
evaluation of CMS3 deposited from 750 °C to 800 °C
The adsorption isotherm evaluated at 25 °C for CMS3
deposited from 600 °C to 700 °C
The adsorption isotherm evaluated at 25 °C for CMS3
deposited from 600 °C to 700 °C
The trend of selectivity and O2 adsorption capacity
versus temperature of chemical vapour deposition by
ethane
Graph of fractional uptake versus time for CMS3
deposited at different ethane-nitrogen gas fractional
volume
Plot of ln(1-(Mt/M∞)) versus time for diffusivity
evaluation of CMS3 deposited at different ethane-
nitrogen gas fractional volume
The adsorption isotherm evaluated at 25 °C for CMS3
deposited at different ethane-nitrogen gas fractional
volume
The trend of selectivity and O2 adsorption capacity
versus ethane-nitrogen gas fractional volume
The trend of selectivity and O2 adsorption capacity
versus hold time of chemical vapour deposition by
ethane (750 °C)
Graph of fractional uptake versus time for CMS3
deposited at different hold time (750 °C)
Plot of ln(1-(Mt/M∞)) versus time for diffusivity
139
139
140
140
141
141
142
143
144
144
145
146
147
147

xxiii
5.57
5.58
5.59
5.60
5.61
5.62
5.63
5.64
5.65
5.66
5.67
5.68
evaluation of CMS3 deposited at different hold time
(750 °C)
The adsorption isotherm evaluated at 25 °C for CMS3
deposited at different hold time (750 °C)
The trend of selectivity and O2 adsorption capacity
versus hold time of chemical vapour deposition by
ethane (775 °C)
Graph of fractional uptake versus time for CMS3
deposited at different hold time (775 °C)
Plot of ln(1-(Mt/M∞)) versus time for diffusivity
evaluation of CMS3 deposited at different hold time
(775 °C)
The adsorption isotherm evaluated at 25 °C for CMS3
deposited at different hold time (775 °C)
Schematic representation of carbon deposition under
different hold time regime: (a) initial deposition without
the formation of carbon deposited at the pore mouth; (b)
carbon deposition at the pore mouth; (c) formation of
micropore framework with some wider pore compared
with pore internal; (d) minor narrowing of micropore
framework formed previously
Density Functional Theory plot of pore size distribution
of sample Commercial Carbon Molecular Sieve
(CCMS) by CO2 adsorption at 273 K.
Density Functional Theory plot of pore size distribution
of sample CMS3/775/6/25 by CO2 adsorption at 273 K
Density Functional Theory plot of pore size distribution
of sample CMS1/750/10/75 by CO2 adsorption at 273 K
The trend of selectivity and O2 adsorption capacity
versus gasification temperature
Graph of fractional uptake versus time for CMS4
gasified at different temperature
Plot of ln(1-(Mt/M∞)) versus time for diffusivity
148
149
150
150
151
151
153
154
154
157
157
158

xxiv
5.69
5.70
5.71
5.72
5.73
5.74
5.75
5.76
5.77
5.78
5.79
5.80
5.81
5.82
5.83
evaluation of CMS4 gasified at different temperature
The adsorption isotherm evaluated at 25 °C for CMS4
gasified at different temperature
The trend of selectivity and O2 adsorption capacity
versus gasification hold time (600 °C)
Graph of fractional uptake versus time for CMS4
gasified at different hold time (600 °C)
Plot of ln(1-(Mt/M∞)) versus time for diffusivity
evaluation of CMS4 gasified at different hold time (600
°C)
The adsorption isotherm evaluated at 25 °C for CMS4
gasified at different hold time (600 °C)
The trend of selectivity and O2 adsorption capacity
versus gasification hold time (700 °C)
Graph of fractional uptake versus time for CMS4
gasified at different hold time (700 °C)
Plot of ln(1-(Mt/M∞)) versus time for diffusivity
evaluation of CMS4 gasified at different hold time (700
°C)
The adsorption isotherm evaluated at 25 °C for CMS4
gasified at different hold time (700 °C)
The trend of selectivity and O2 adsorption capacity
versus gasification hold time (800 °C)
Graph of fractional uptake versus time for CMS4
gasified at different hold time (800 °C)
Plot of ln(1-(Mt/M∞)) versus time for diffusivity
evaluation of CMS4 gasified at different hole time (800
°C)
The adsorption isotherm evaluated at 25 °C for CMS4
gasified at different hold time (800 °C)
The trend of selectivity and O2 adsorption capacity
versus CO2 fractional volume (700 °C)
Graph of fractional uptake versus time for CMS4
158
160
160
161
161
162
162
163
163
165
165
166
166
169
169

xxv
5.84
5.85
5.86
5.87
5.88
5.88
gasified at different CO2 fractional volume (700 °C)
Plot of ln(1-(Mt/M∞)) versus time for diffusivity
evaluation of CMS4 gasified at different CO2 fractional
volume (700 °C).
The adsorption isotherm evaluated at 25 °C for CMS4
gasified at different CO2 fractional volume (700 °C)
The trend of selectivity and O2 adsorption capacity
versus CO2 fractional volume (800 °C)
Graph of fractional uptake versus time for CMS4
gasified at different CO2 fractional volume (800 °C)
Plot of ln(1-(Mt/M∞)) versus time for diffusivity
evaluation of CMS4 gasified at different CO2 fractional
volume (800 °C)
The adsorption isotherm evaluated at 25 °C for CMS4
gasified at different CO2 fractional volume (800 °C)
170
170
171
171
172
172

xxvi
LIST OF SYMBOLS
a - Radius of homogeneous sphere
A - Adsorption potential
Aa - Constant in Lennard-Jones potential for adsorbent
AA - Constant in Lennard-Jones potential for adsorbate
At - Reactor cross sectional area
AC - Activated carbon
ASAP - Accelerated Surface Area and Porosimetry
ASU - Air separation unit
b - Affinity constant
BET - Brunauer, Emmett and Teller
BJH - Barrett, Joyner and Halenda
CA - Chemical activation
CAU - Circulating Adsorption Unit
CCD - Chemisorbed carbon deposition
CCl4 - Chloroform
Cd,or - Orifice coefficient
CH2Cl - Dichloromethane
CMS - Carbon molecular sieve / molecular sieve carbon
CMSN2 - CMS produced by Bergbau-Forschung for air separation.
CO2 - Carbon dioxide gas
CVD - Chemical vapor deposition
d - Diameter for the adsorbate molecule
dp - Particle size of raw palm shell
dt - Fluidized bed internal diameter
dor - Diameter of orifice of the tuyere
D - Diffusivity constant
DA - Dubinin Astakhov
xxvii
DD - Direct deposition
DFT - Density Functional Theory
DR - Dubinin Radushkevich
Eo - Characteristic Energy – adsorption strength between adsorbate
& adsorbent
FTIR - Fourier Transformed Infrared Spectroscopy
GC - Gas Chromatography
GCMS - Gas Chromatography Mass Spectroscopy
H-K - Horvath-Kawazoe
HTT - Heat treatment temperature
ID - Internal Diameter
ITM - Ion transport membrane
IUPAC - International Union of Pure and Applied Chemistry
K - Avogrado’s number
l - Distance between nuclei of two layers (slit width)
L - Nucleus to nucleus slit width
Lmf - Minimum fluidization height.
mshell - Mass feed of raw palm shell
MW,N2 - Molecular weight of N2
MSCs - Molecular sieve carbon
Mt - Gas uptake at time, t
M∞ - Gas uptake at equilibrium
n - Surface heterogeneity in DA equation
Na - Number of atoms per unit area of adsorbent
NA - Number of molecules per unit area of adsorbate
N2 - Nitrogen gas
NH3 - Ammonia gas
NO2 - Nitrogen dioxide gas
Nor - The number of orifice of the tuyere
O2 - Oxygen gas
P - Pressure
Po - Saturation pressure of the gas
PSA - Pressure swing adsorption
PT - Physical treatment

xxviii
Ret - Vessel Reynolds number
Rg - Gas constant
SBET - BET surface area
SEM - Scanning electron microscope
SE - External surface area by t-plot
SM - Micropore surface area by t-plot
sTPD - Production in Ton per day
T - Temperature
TEM - Transmission electron microscope
TSA - Temperature swing adsorption
uo - Velocity of gas in reactor tube
Uo - Adsorbent-adsorbate interaction
Uor - Maximum allowable jet velocity from holes
Ua - Implicit function of the adsorbate-adsorbent interaction
V - Quantity of gas adsorbed at pressure P
VDA - Micropore volume by DA equation
VDR - Micropore volume by DR equation
Vm - Quantity of gas adsorbed when entire surface is covered with a
monomolecule layer
VT - Total pore volume
W - Volume of adsorbate in the microporous
Wo - Maximum volume that the adsorbate can occupy
z - Distance of the adsorbate molecule from a surface atom in the
slit wall
Greek symbol
β - Coefficient of similarity (ratio of the liquid molar volume to
that of the reference benzene vapor)
α - Degree of transformation
ε - Potential energy of interaction
εmf - void between particle during minimum fluidization
ε* - Minimum potential energy

xxix
σ - Distance from a surface atom at zero interaction energy
ρs - Density of raw palm shell
ρg,N2 - Density of nitrogen gas at 800°C, 1 atm
μ - nitrogen gas viscosity at 800°C, 1 atm
ΔPb - Pressure drop across the bed
ΔPd - Distributor pressure drop

xxx
LIST OF APPENDICES
APPENDIX TITLE PAGE
A
B
C
D
E
F
G
H
Tuyere Type Fluidized Bed Reactor Design
An Example of Fluidization Calculation (Estimation) for
Fluidized Bed Reactor According to Fluidization
Engineering by Kunii and Levenspiel (1991) and Cold
Test Result Summary
Schematic Diagrams of Liquid and Simple Gas Delivery
System
Comparison of Chemical & Physical Properties and
Toxicology and Safety of Benzene and Methane
Sample Report of Characterization by Physisorption
Analysis Using Micromeritics ASAP 2010 (with
Micropore Option) –Nitrogen Adsorption-
Sample Report of Characterization by Physisorption
Analysis Using Micromeritics ASAP 2010 (with
Micropore Option) –Carbon Dioxide Adsorption-
Sample Calculation to Convert the Rate of Adsorption
Analysis Report to the Graph of Fractional Uptake versus
Time.
Schematic Diagram of Carbon Deposition and
Gasification under Different Condition
191
194
199
202
205
224
241
247

CHAPTER 1
INTRODUCTION
1.1 Typical Characteristics of Adsorbents
Adsorption process can be defined as when porous and discontinuity surface
of a solid is exposed to a gas, the gas molecules will form bonds with it and become
attached (Yang,1987). In another words, adsorption is a separation process in which
certain components of a gaseous or liquid phase are selectively transferred to the
surface of a solid adsorbent. There are four principles type of adsorption (Slejko,
1985):
(a) Exchange (ion exchange) – The electrostatic attachment of ionic species to
site of opposite charge at the surface of the adsorbent, with subsequent
displacement of these species by other ionic adsorbate of greater electrostatic
affinity.
(b) Physical – The action of Van der Waals forces, which are comprised of both
London dispersion forces and classical electrostatic affinity.
(c) Chemical – The reaction between an adsorbate and an adsorbent resulting in a
change in the chemicals form of the adsorbate.
(d) Specific – The attachment of adsorbate molecules at functional groups on
adsorbent surfaces can also result from specific interactions, which do not
result in adsorbate transformation.

2
The physical adsorption is based on three distinct separation mechanisms
(Do. 1998):
(a) Steric - The porous solid has pores with dimension such that it allows small
molecules to enter while excluding large molecules from entry. Steric
separation occurred unique with zeolite due to the uniform aperture size in
the crystalline structure (Safarudin, 2000).
(b) Equilibrium - Solid has different abilities to accommodate different species
that is the solid preferentially removes the stronger adsorbing species.
(c) Kinetic – Different species have different rates of diffusion into the pores.
Thus by controlling the time of exposure, the comparable faster diffusing
species is preferentially removed by the solid. Kinetic separation is possible
only with carbon molecular sieve (CMS) because of the distribution of pore
sizes and has found only one commercial application: the production of
nitrogen from air (Yang, 1987).
The success or failure of the process depends on how the solid performs in
both equilibria and kinetics. A solid with good capacity but slow kinetic will take
adsorbate molecules too long time to reach the particle interior. This means long gas
residence times in a column, hence a long throughput. On the other hand, a solid
with fast kinetics but low capacity will require large amount of solid for a
throughput. To satisfy these two requirements, the following aspects must be
satisfied (Do, 1998).
(a) The solid must have reasonably high surface area or micropore volume.
(b) The solid must have relatively large pore network for the transport of
molecules to the interior.
The classification of pore size as recommended by International Unit of Pure
and Applied Chemistry (IUPAC) (Sing, 1985) is often used to delineate the range of
pore size (d is the pore diameter).

3
Micropores d < 2nm
Mesopores 2 < d < 50 nm
Macropores d > 50 nm
This classification is arbitrary and was developed based on the adsorption of
nitrogen gas at its normal boiling point (77K).
Micropores can be further subdivided into ultramicroporosity and
supermicroporosity (Marsh, 1987).
Ultramicroporosity d < 0.5 nm
Supermicroporosity 1.4 <d< 3.2 nm
As ultramicroporosity has pore diameter equal or less than the diameter of the
adsorbate molecule and activated diffusion effects and/or molecular sieve effects are
the indication of the presence of ultramicroporosity. While for supermicroporosity,
adsorption occurs by cooperative effects. The definitions and mechanisms of the
above three effects will be discussed later in Chapter 3.
1.1.1 Molecular Sieve Carbon or Carbon Molecular Sieve
Since it is less hydrophilic than zeolite, carbon molecular sieve (CMS) can be
used more efficaciously in separation processes involving wet gas stream. At present
CMS is produced commercially by Bergbau-Forschung GmbH in West Germany and
by Takeda Chemical Company and Kuraray Chemical Company in Japan. The raw
material for Bergbau-Forchung’s MSC is bituminous coal, 40 microns. Commercial
CMS for air separation is produced by cracking hydrocarbon such as methane in
order to deposit a thin layer of coke at the pore mouth. CMSN2 produced by
Bergbau-Forchung GmbH was used in PSA for the production of dry and CO2 free
N2 at 99.9% purity without the need to predry the air feed (Yang, 1987). Today,
most commercial carbon sieves are prepared from anthracite or hard coal by

4
controlled oxidation and subsequent thermal treatment. Subsequent treatments
including controlled cracking of hydrocarbon within the micropore system and
partial gasification under carefully regulated condition (Manzoor Zahur, 1991). Such
a treatment is known as Chemical Vapor Deposition (CVD) and will be discussed in
detail in Chapter 4. Table 1.1 shows the typical usage of different adsorbent in
industrial processes nowadays.
Table 1.1: Typical process using adsorption technology (Do,1998)
Separation Adsorbent Normal paraffin, iso-paraffin Zeolite 5-A Nitrogen / oxygen gas Zeolite 5-A Oxygen / nitrogen gas Carbon molecular sieve Ethylene / vent stream Activated carbon VOCs removal from air Activated carbon Carbon dioxide, ethylene from natural gas
Zeolite
Sulfur compound from natural gas Zeolite Drying of reactive gases Zeolite 3-A, Silica gel, Alumina Solvent removal from air Activated carbon Ordors from air Activated carbon NOx, SOx, from flue gas Zeolite, Activated carbon
1.2 Gas Adsorption Processes.
Large-scale adsorption processes can be divided into two broad classes. The
first and the most important is the cyclic batch system, in which the adsorption bed is
alternately saturated and then regenerated in a cyclic manner. The second is a
continuous flow system, which involves a continuous flow of adsorbent
countercurrent to a flow of feed (Geankoplis, 1993). For system where the
separation factor is high and mass transfer resistance is small, cyclic processes are
generally employed because of advantages of simplicity and cost. Continuous
countercurrent operation is generally used only where selectivity are low and mass
transfer resistance is high as it is only under these conditions that the additional
capital cost of a countercurrent system can be justified (Manzoor Zahur, 1991).

5
There are four basic methods in common use for the cyclic batch adsorption
system using fixed beds such as temperature-swing adsorption (TSA), pressure-
swing adsorption (PSA), inert-purge gas stripping cycle and displacement-purge
cycle. In general, these four basic methods operate with two or sometimes three
fixed beds in parallel, one in adsorption cycle and the other two in a desorbing cycle
to provide continuity of flow. After a bed has completed the adsorption cycle, the
flow is switched to second newly regenerated bed for adsorption. These methods
differ from each other mainly in the means used to regenerate the adsorbent after the
adsorption cycle (Geankoplis, 1993).
For PSA cyclic batch adsorption the bed is desorbed by reducing pressure at
essentially constant temperature and purging the adsorbate. This process for gases
uses very short cycle time for regeneration compared to that for the temperature-
swing cycle. However, the major limitation is that PSA cycles are restricted to
components that are not too strongly adsorbed. For equilibrium system, usually high
vacuum is not desirable for desorption process, but if the preferentially adsorbed
species is too strongly adsorbed, an uneconomically high vacuum is required for an
effective desorption. Thus, for this case, TSA is a generally preferred option due to
modest change of temperature produces, in general, a significant change in the gas-
solid adsorption equilibrium constant (Ruthven et al., 1994).
1.3 Air Separation Technologies.
Cryogenic separation that is liquefaction followed by distillation-remains the
most frequently used process for large-scale application. Adsorption by PSA might
be an alternative for N2/O2 separation as the cost required for a low temperature and
high-pressure liquefaction during cryogenic separation is very expensive. While
major cost for PSA is in the compressor costs and volume of the beds. The cost for
adsorption is generally lower than distillation from small to medium throughput and
when high purity products are not required (Yang, 1987). Basically for adsorption of
air by PSA, bed size is the controlling factor in capital cost. Since production is

6
proportional to bed volume, capital costs increase more rapidly as a function of
production rate compared to cryogenic plants (Smith and Klosek, 2001). Moreover
the compression power is also proportional to the volume bed size, causing
proportional increase in utility cost. Currently there are many other air separation
technologies available such as chemical processes, polymeric membranes and ion
transport membrane and Table 1.2 presented the brief comparison among those
technologies (Smith and Klosek, 2001).
Table 1.2: Technology comparison table (Smith and Klosek, 2001).
Process Status Economic range
(sTPD)
Byproduct
capability
Purity limit
(vol%)
Adsorption semi mature <150 poor 95 Chemical developing undetermined poor 99+ Cryogenic mature >20 excellent 99+ Membrane semi mature <20 poor ~40 ITM developing undetermined poor 99+ Note to Table1.2: Status – degree to which the technology has been commercialized. Economic range – typical production range where the technology is currently economically feasible. Byproduct capability – is a measure of the ability of the process to produce relatively pure nitrogen or argon stream without add-on DEOXO or cryogenic systems. Purity limit – maximum purity that can be economically produced using specific technology. DEOXO process – the stoichiometric quantity of hydrogen required to oxide the residual oxygen is introduced, and the gas stream is then passed over a catalyst bed in which essentially all the oxygen is oxidized to water which is then removed by adsorption on a zeolite desiccant. sTPD – Production in Ton per day.
For air separation by using CMS, the PSA cycle used is vacuum swing cycle.
For sorption of oxygen and nitrogen on the CMS, it is apparent that there is the little
difference in equilibrium but a large difference in diffusivity, with oxygen being
more rapidly adsorbed species. The high pressure raffinate product in the PSA
process is therefore nitrogen. In such a system purging with nitrogen to remove the
faster diffusing oxygen from the bed is undesirable, since, as well as wasting
product, a certain fraction of slowly diffusing nitrogen will adsorbed, thus reducing
the capacity for oxygen during the next adsorption step. The kinetic PSA processes
avoided this difficulty by using a vacuum to clean the bed rather than a purge
(Ruthven et al., 1994). Adsorption and polymeric membrane process will continue to

7
improve in both cost and energy efficiency through ongoing research and
development of adsorbents and membrane materials. None of the technology is
expected to challenge cryogenics for large tonnage production of high purity oxygen.
ITM technology is currently foreseen as the best candidate to challenge cryogenics
for the production of high purity, tonnage quantities of oxygen. The limitation for all
the non-cryogenic processes is the requirement of liquid oxygen or nitrogen for
system back up (Smith and Klosek, 2001).
Cryogenic process is currently the most efficient and cost-effective
technology to produce large quantities of oxygen, nitrogen, and argon products.
However, it requires stringent air pretreatment section to remove process
contaminants, including water, CO2 and hydrocarbons. Van Hardeveld et al. (2001)
have analyzed the cause of a serious explosion in an air separation unit (ASU) in
Bintulu (Malaysia) on 25 December 1997. Ultimately, conclusive evidence was
obtained that combustible airborne particulates had passed the main purification
section of the air separation unit. These combustible contaminants had accumulated
on the aluminium main vaporizers of the distillation column. Once hydrocarbon
combustion was triggered, it led to aluminium combustion, which generated heat and
vaporized the cryogenic liquids.
1.4 Adsorption Mechanism
Forces of adsorption of relevant interest here is the van der Waals forces,
which exists between all atoms and molecules and can be classified into three groups
(Do, 1998).
a) Dipole-dipole forces
b) Dipole-induced dipole forces – in this case one molecule having a permanent
dipole will induce a dipole in a non-polar atom.
c) Dispersion forces.

8
The dispersion force is the most important force in physical adsorption. It
has an origin in the quantum mechanics. Non-polar atom such as neon or helium, the
time average of its dipole moment is zero. But at instant time “t” there is an
asymmetry in the distribution of electrons around the nucleus and this generates a
finite dipole. This so generated dipole will polarize any nearby atom (that is it
distorts the electron distribution) so that the nearby atom will acquire a dipole. These
two dipoles will attract and the time average of this attractive force is finite
(Do,1998). As a result, our characterization was solely based on physical adsorption
with dipole-dipole and dipole-induced dipole forces is neglected as these forces were
proved not playing an important role in air separation by CMS which will be further
described in Chapter 3.
1.5 Research on Palm Oil Wastes for Carbon Adsorbent Preparation
Malaysia palm oil industries are producing about 27.6 million tons of solid
wastes, including 14.8 million tons of empty palm oil fruit bunches, 2.7 million tons
of fruit fibers and 7.7 million tons of palm shells in year 2000 (Wong and Nasir Ani,
2002). Palm kernel shells have long been used as fuel in boiler to produce steam and
electricity for mill. Palm kernel shell is the hard portion of the oil palm fruit that is
broken to extract oil from the kernel. Generally, the palm oil mills have excess shells
that are unutilized and contribute to environmental pollution (Puad, Hamami and
Zaihan, 2002).
The principle commercial activated carbon feed stocks and proportions in
which they are used were summarized by Bansal et.al. at 1988 as wood,35%;
coal,28%; lignite,14%; coconut shell,10%; peat,10% and others, 3% (Guo and Lua.
2002). As the price of commercial activated carbon has dropped continually over the
last decade or so, agricultural by-products are gaining great importance as precursors
to active carbon production. First, they lost their role as a major fuel and source of
energy; second, they are ever accumulating renewable sources; and third, they are
low-ash materials (Pastor-villegas and Duran-Valle. 2002).
9
There are two factors contributing to the properties in activated carbon
produced that are raw material and processing method. The selection of the
precursor essentially determines the range of adsorptive and physical properties that
can be attained in the activated carbon products (Guo. and Lua. 2002). Asiah (1992)
has conducted the experiment on several local agricultural by-products suitable for
producing active carbon. She carbonized sugarcane fibre, rice husk, fiber and shell
of palm at 450 °C. The first two precursor produced chars showing standard
isotherm of type II with hysteresis loop are closed in the pressure range near
saturation. This shape reveals that the adsorbing solid contains mesopores with an
upper size restriction whilst palm fiber char sample adsorption isotherm is mixed
type I and IV. This isotherm showed that char is mixed of micro and mesopore.
Palm shell char however showing type I isotherm indicating microporous property.
As char will be further activated to activated carbon it is important to ensure the
quality of char prior to the further process. Generally, the activation reaction rate is
dependent on the transient pore structure of char during the activation process (Lua
and Guo, 2001). Guo and Lua (2000) in his experiment have drawn the conclusion
that the shell activated carbon was predominantly microporous whilst activated
carbon derived from fibre predominant mesopore and macropore because of severe
reduction of carbon-CO2. Furthermore, hardness is an important property of the
activated carbon and experimental result obtained by Lua and Guo (2001) has proven
that the lowest Rockwell Hardness of activated carbon carbonized at 873K for 3h and
activated at 1173 K for 30 min for palm shell is 19.0, which was sufficiently high to
minimum hardness required. Hardness or durability of individual adsorbent particles
is an important property to be considered, for granular type adsorbent application as
a result of attrition during regeneration (Slejko, 1985).
Safaruddin (2000) has also characterized both palm shells after pyrolysis
(char) and (activated carbon) activation after pyrolysis. He found that palm char has
surface area higher than coal char and average pore diameter was smaller than coal
char. Furthermore, compared to coal, palm shell has another merit of high carbon
but low ash contents, which are associated with the feasibility of highly porous
structures within the carbon matrix. The characterization came out with conclusion
that palm shell can be used to prepare microporous adsorbent as a starting material
for carbon molecular sieve. He also proposed that the suitable method for

10
developing carbon molecular sieve from microporous adsorbent is by deposition of
carbon or Chemical Vapor Deposition (CVD).
CMS exists for air separation by using PSA system in industry. In this
experiment, we are aimed to diverse the sources studied for the production of CMS.
As the commercial carbon molecular sieve available in the market now is produced
from hard coal (anthracite) with methane deposition as stated in 1.1.1. The above
statement has supported our research objective to convert the palm oil waste
especially palm shell into carbon molecular sieve. Besides being value added to the
waste palm shell, the environmental problem of ever accumulating waste will be
solved. Palm shell was chosen in view of its suitability as precursor and the
processing parameter and method will be manipulated to obtain the CMS suitable for
air separation by PSA.
1.6 Research Objectives
1. To develop microporous carbon from palm shell as a precursor for further
pore mouth modification by using CVD method.
2. To characterize the microporous carbon with appropriate calculation
method by physisorption technique.
3. To modify the microporous carbon by one-step CVD process by directly
applying of CVD and conventional CVD involving pore blocking by
pyrolytic carbon followed by careful gasification in CO2 atmosphere.
4. To characterize the CMS after CVD with appropriate calculation method
by Rate of Adsorption technique.

11
1.7 Research Scopes
This research is the preliminary study of the conversion of palm shell into
CMS capable for the separation on O2/N2. The procedure is first to fabricate
microporous carbon with high micropore volume to serve as precursor for further
pore mouth modification by using CVD method. Selection of appropriate starting
material and various kind of processing method of microporous material is
essentially important to produce the microporous carbon with narrow pore size
distribution and relatively small pore size suitable for further modification. The
microporous carbon is then undergoes the CVD process which mainly deposits
carbon on the pore entrance until the desired pore size and distribution is obtained.
Only one step CVD with direct deposition (DD) is explored in this research although
two steps CVD and other type of one step CVD technique are available due to some
constraint. The CVD research here involved two different approaches that are first
direct deposition the carbon on the precursor until narrow pore size is reached and
second closure of the pore of the precursor at the pore entrance followed by pore
reopening by activation with CO2. The mechanism of CVD and the development of
carbon deposit at different parameters is discussed and compared with the existing
literature survey available.
1.8 Contribution
The research on CMS and particularly CVD method for pore modification is
of interest of local researcher in the recent years although Bergbau Forchung
manufactured CMS for PSA process in 1973. From the literature survey, there is no
journal published on fabricating CMS for O2/N2 separation using CVD method
particularly using palm shell as starting material. Even though, there are published
journal on fabricating CMS for O2/N2 separation using CVD method using different
starting material such as coconut shell (Braymer et al., 1994, Cabrera et al., 1993),
walnut shell (Hu and Vansant, 1995), carbon fiber from petroleum pitch (Casa Lillo
et al., 2002) and coal (Hu and Vansant, 1995, Chagger et al., 1995), there are no

12
complete formulation on CVD process and the parameters used are differ from one to
another due to different precursor and gas or liquid substances used for carbon
deposition. The contribution of the research is summarized as followed:
• Establishing the detail on fabricating CMS for O2/N2 separation from
palm shell waste which involved a series of processes. Appropriate
analysis methods developed are used for the adsorbent for the
intermediate products and the end product also included.
• The ever accumulating palm shell is possible to be solved by
converting it into high value added product as their role as fuel is still
not attractive although oil prices have surged high recently due to
some problem (STAR, 17 Jul. 2004).
• Served as preliminary research and finding for complete understanding
of CVD process. Some useful recommendation was suggested for
further research direction.

176
REFERENCES
Abdul Rahman Hashin (2003). Berita Sawit – Pelbagai Kebaikan Minyak Sawit. In
Berita Harian. : 6.
Ahmadpour, A. and Do, D.D. (1995). Characterization Of Modified Activated
Carbons: Equilibria and Dynamics Studies. Carbon. 33(10): 1393-1398.
Asiah Hussain. and Mohd. Yusni Md. Yunus. (1992). Kajian Sifat Permukaan Dan
Keliangan Serta Kesan Terma Terhadap Karbon Teraktif Tempatan. Penilaian
Program IRPA & UPP UTM 25-26 Ogos 1992.: 272-288.
Asiah Hussain and Ui, S.Y. (1993). Penentuan Kaedah Optimum Bagi Penyediaan
Karbon Teraktif Daripada Tempurung Kelapa Sawit. Kongres Sains and
Teknologi Malaysia 93’ Kuala Lumpur, 11-14 August 1993 Vol. I – New
Products : 188-198.
Auvil, S.R., Macungie, Schork, J.M. and Srinivasan, R. (1993). Air Separation by
Pressure Swing Adsorption with a High Capacity Carbon Molecular Sieve.
US Patent 5,240,474.
Becker, A. and Huttinger, K.J. (1998a). Chemistry And Kinetics Of Chemical Vapor
Deposition Of Pyrocarbon – II, Pyrocarbon Deposition from Ethylene,
Acetylene and 1,3-Butadiene in the Low Temperature Regime. Carbon. 36(3):
177-199.
Becker, A. and Huttinger, K.J. (1998b). Chemistry And Kinetics Of Chemical Vapor
Deposition Of Pyrocarbon – III, Pyrocarbon Deposition From Propylene And
Benzene In The Low Temperature Regime. Carbon. 36(3): 201-211.

177
Becker, A. and Huttinger, K.J. (1998c). Chemistry And Kinetics Of Chemical Vapor
Deposition Of Pyrocarbon – IV, Pyrocarbon Deposition From Methane In The
Low Temperature Regime. Carbon. 36(3): 213-224.
Bello, G., Garcia, R., Arriagada, R and Sepulveda-Escribano, A (2002). Carbon
Molecular Sieves From Eucalyptus Globular Charcoal. Microporous &
Mesoporous Materials. 56: 139-145.
Blazek, A. (1973). Thermal Analysis. London, England: Van Nostrand Reinhold
Company Ltd. 61-64
Braymer, T.A., Coe, C.G., Farris, T.S., Gaffney, T.R., Schork, J.M. and Armor, J.M.
(1994). Granular Carbon Molecular Sieves. Carbon. 32(3): 445-452.
Cagnon, B., Py, X., Guillot, A, and Stoeckli, F. (2002). The Effect Of The
Carbonization / Activation Procedure On The Microporous Texture Of The
Subsequent Chars And Active Carbons. Microporous and Mesoporous
Materials. Article in Press.
Cabrera, A.L., Zehner, J.E., Coe, C.G., Gaffney, T.R., Farris, T.S. and Armor, J.N.
(1993). Preparation Of Carbon Molecular Sieves, I. Two-Step Hydrocarbon
Deposition With A Single Hydrocarbon. Carbon. 31(6): 969-976.
Carrott, P.J.M., Robert, R.A. and Sing, K.S.W. (1986). Adsorption of Nitrogen By
Porous and Nonporous Carbons. Carbon. 25: 59-68.
Carrott, P.J.M., Nabais, J.M.V., Ribeiro Carrott, M.M.L. and Menendez, J.A. (2004).
Microwave Heating as a Novel Method for Introducing Molecular Sieve
Properties into Activated Carbon Fibres. Carbon. 42: 227-228
Casa-Lillo, M.A., Moore, B.C., Cazorla-Amoros, D. and Linares-Solano. (2002).
Molecular Sieve Properties Obtained by Cracking of Methane on Activated
Carbon Fibers. Carbon. 40: 2489-2494.

178
Chagger, H.K., Ndaji, F.E., Sykes, M.L. and Thomas, K.M. (1994). Kinetics of
Adsorption and Diffusional Characteristics of Carbon Molecular Sieves.
Carbon. 33(10): 1405-1411.
David, E., Stanciu, V and Stefanescu, D. (2002). Composites Obtained from Carbon
Molecular Sieves and Copper Oxide. Journal of Material Processing
Technology. Article in Press.
Do, D.D. (1998). Adsorption Analysis: Equilibria and Kinetics. London: Imperial
College Press. 1-10.
Freitas, M.M.A. and Figueiredo, J.L. (2001). Preparation of Carbon Molecular
Sieves for Gas Separations by Modification of the Pore Sizes of Activated
Carbons. Fuel. 80(1): 1-6.
Gaffney, T.R. (1996). Porous Solids for Air Separation. Current Opinion in Solid
State & Materials Science. 1: 69-75
Gaffney, T.R., Farris, T.S., Cabrera, A.L. and Armor, J.N. Modified Carbon
Molecular Sieves for Gas Separation. US Patent 5,098,880. 1992.
Geankoplis, C.J. (1993). Transport Processes and Unit Operations. Eaglewood
Cliffs, N.J.: Prentice Hall P T R. 707-708.
Gergova, K. and Eser, S. (1996). Effects of Activation Method on the Pore Structure
of Activated Carbons from Apricot Stones. Carbon. 34(7) : 879-888
Girgis, B.S., Yunis, S.S. and Soliman, A.M. (2002). Characteristics Of Activated
Carbon From Peanut Hulls In Relation To Condition of Preparation. Material
Letters. 57: 164-172.
Gomez-de-Salazar, C., Sepulveda-Escribano, A. and Rodriguez-Reinoso, F. (2000).
Preparation of Carbon Molecular Sieves by Controlled Oxidation Treatment.
Carbon. 38(13): 1889-1892.

179
Guo, J and Lua, A.C. (2000). Preparation & Characterization of Adsorbent from
Palm Fruit Solid Wastes. Journal of Oil Palm Research. 12(1): 64-70.
Guo,J and Lua A.C. (2001). Experimental and Kinetic Studies on Pore Development
During CO2 Activation of Oil-Palm-Shell Char. Journal of Porous Materials
8: 149-157.
Guo, J. and Lua, A.C.(2002). Characterization of Adsorbent Prepared from Oil-Palm
Shell by CO2 Activation for Removal of Gaseous Pollutants. Materials Letters.
55: 334-339
Hu, Z. and Vansant, E.F. (1995). Carbon Molecular Sieve Produced from Walnut
Shell. Carbon. 33(5): 561-567.
Jagiello, J. and Thommes, M. (2004). Comparison of DFT Characterization methods
based on N2, Ar, CO2 and H2 adsorption applied to carbons with various pore
size distributions. Carbon. 42: 1225-1229
Katyal, S., Thambimuthu, K. and Valix. M. (2003). Carbonization of Bagasse in a
Fixed Bed Reactor: Influence of Process Variables on Char Yield and
Characteristics. Renewable Energy. 28: 713-725.
Kawabuchi, Y., Oka, H., Kawano, S., Mochida, I. and Yoshizawa, N. (1997). The
Modification of Pore Size in Activated Carbon Fibers by Chemical Vapor
Deposition and Its Effects on Molecular Sieve Selectivity. Carbon. 36(4): 377-
382.
Kunii, D. and Levenspiel, O. (1991). Fluidization Engineering. 2nd Ed. Stoneham.
MA, USA: Butterworth-Heinemann. 256-263.
Lede, J. (1997). Chemical Engineering Aspects of Solid (Biomass) Particle
Pyrolysis: A Review of the Possible Rate Limiting Factors. In. Bridgwater, A.V.
and Boocock, D.G.B. Development in Thermochemical Biomass Conversion.
Vol.1. London: Chapman & Hall. 104-116.

180
Lillo-Rodenas, M.A., Cazorla-Amoros, D. and Linares-Solano, A. (2003).
Understanding Chemical Reactions Between Carbons and NaOH and KOH –
An Insight into the Chemical Activation Mechanism. Carbon. 41: 267-275.
Linares-Solano, A. (1986). Textural Characterization of Porous Carbons by Physical
Adsorption of Gases. In. Figueiredo, J. L. and Moulijn, J.A. Carbon and Coal
Gasification. Boston: Martinus Nijhoff Publishers: 137-178.
Linares-Solano, A., Martin-Gullon, I., Salinas-Martinez de Lecea, C. and Serrano-
Talavera, B. (2000). Activated Carbons from Bituminous Coal: Effect of
Mineral Matter Content. Fuel. 79: 635-643.
Lozano-Castello, D., Carzola-Amoros, D., and Linares-Solano, A. (2004).
Usefulness of CO2 adsorption at 273 K for the characterization of porous
carbons. Carbon. 42: 1231-1236.
Lu, A-H. and Zheng, J-T. (2002). Microstructures of PAN-ACF Modified by
Catalytic Benzene Deposition. Carbon. 40: 1353-1361.
Lua, A.C. and Guo, J. (1998a). Preparation and Characterization of Chars from Oil
Palm Waste. Carbon. 36(11): 1663-1670.
Lua, A.C. and Guo, J. (1998b). Activate Carbons Prepared from Extracted Oil Palm
Fibers for Nitric Oxide Reduction. Energy and Fuels. 12: 1089-1094.
Lua, A.C. and Guo, J. (2000). Activated Carbon Prepared from Oil Palm Stone by
One-Step CO2 Activation for Gaseous Pollutant Removal. Carbon 38: 1089-
1097.
Lua, A.C. and Guo, J. (2001). Microporous Oil-Palm-Shell Activated Carbon
Prepared by Physical Activation for Gas-Phase Adsorption. Langmuir 17: 7112-
7117

181
Al-Khatib, M.F., Iyuke, S.E., Abu Bakar Mohamad, Daud, W.R.W., Khadhum,
A.A.H., Shariff, A.M. and Yarmo, M.A. (2002). The Effect of Impregnation of
Activated Carbon with SnCl2.2H2O on Its Porosity, Surface Composition and
CO Gas Adsorption. Carbon 40: 1929-1936.
Malek, A. and Farooq, S. (1998). Hydrogen Purification from Refinery Fuel Gas by
Pressure Swing Adsorption. AIChE Journal. 44(9):
Manzoor Zahur (1991). Air Separation On Carbon Molecular Sieves, 4A and 5A
Zeolites By Pressure Swing Adsorption. Faculty of The College Of Graduate
Studies, King Fahd University Of Petroleum & Minerals: Thesis of Master of
Science In Chemical Engineering.
Marsh, H. (1987). Adsorption Methods to Study Microporosity in Coals and Carbon
– A Critique. Carbon 23: 49-58
McCabe, W.L., Smith, J.C. and Harriott, P. (1993). Unit Operations of Chemical
Engineering. Edition (5). New York: McGraw-Hill. 1092-1093.
Micromeritics Instrument Corporation (1996). DFT Plus Models Library. Norcross
(USA): User’s Guide.
Micromeritics Instrument Corporation (1998). ASAP 2010 Accelerated Surface Area
and Porosimetry System. Norcross (USA): Operator’s Manual.
Mochida, I., Yatsunami, S., Kawabuchi, Y. and Nakayama, Y. (1995). Influence Of
Heat-Treatment On The Selective Adsorption Of CO2 In A Model Natural Gas
Over Molecular Sieve Carbons. Carbon. 33(11): 1611-1619.
Motoaki Kawase, Takeshi Nakai, Hiroshika Goshima and Kouichi Miura. (2004)
Chemical Vapor Deposition Rate of Pyrolytic Carbon from Hydrocarbon.
ISCRE. 18 (Chicago): 5-6.

182
Moore , S.V. and Trim, D.L. (1977). The Preparation of Carbon Molecular Sieve by
Pore Blocking. Carbon. 15: 177-180.
Molina-Sabio, M., Gonzalez, M.T., Rodriguez-Reinoso, F. and Sepulveda-Escribano,
A. (1996). Effect of Steam and Carbon Dioxide Activation in the Micropore
Size Distribution of Activated Carbon. Carbon. 34(4): 505-509
Moreira, R.F.P.M., Jose, H.J. and Rodrigues A.E (2000). Modification of Pore Size
in Activated Carbon by Polymer Deposition and Its Effects on Molecular Sieve
Selectivity. Carbon. 39: 2269-2276.
Murphy, D.B., Carroll, R.W. and Klonowski, J.E. (1997). Analysis of Products of
High-Temperature Pyrolysis of Various Hydrocarbons. Carbon. 35(12): 1819-
1823.
Nguyen, C., Do, D.D. (1995). Preparation of Carbon Molecular Sieves From
Macadamia Nut Shells. Carbon. 33(12): 1717-1725.
Olivier, J.P. and Conklin, W.B. (1992). Determination of Pore Size Distribution from
Density Functional Theoretic Models of Adsorption and Condensation within
Porous Solid. Presented in: International Symposium on the Effects of Surface
Heterogeneity. Kazimierz Dolny, Poland.
Olivier, J.P. (1995a). Modeling Physical Adsorption on Porous and Nonporous
Solids Using Density Functional Theory. Journal of Porous Materials. 2: 9-17.
Olivier, J.P. (1995b). The Determination of Surface Energetic Heterogeneity Using
Model Isotherms Calculated by Density Functional Theory. Presented in: Fifth
International Conference on the Fundamentals of Adsorption. Pacific Grove,
CA. USA.
Pastor-villegas, J. and Duran-Valle, C.J. (2002). Pore Structure of Activated Carbons
Prepared by Carbon Dioxide and Steam Activation at Different Temperatures
from Extracted Rockrose. Carbon. 40: 397-402.

183
Puad, E., Hamami, M. and Zaihan, J. (2002). The Carbonization of Palm Kernel
Shell by the Continuous Kiln. Proceeding of the 6th Asia-Pacific International
Symposium on Combustion and Energy Utilization. Johor, Malaysia: Universiti
Teknologi Malaysia. 308-312.
Pierson, H.O.(1999). Handbook of Chemical Vapor Deposition-Principles,
Technology and Applications. 2nd Ed. Norwich, New York: Noyes Publications.
12, 84-94.
Ramirez, S., Ferreira, D., Gottberg, V., Labary, M., Albornoz, A. and Laine, G.
(2003). Adding a micropore framework to a parent activated carbon by
carbon deposition from methane and ethylene. Carbon. 41: 2653-2689.
Rodriguez-Reinoso, F., Lopez-Gongalez, J.D. and Berenguer, C. (1982). Activated
Carbons from Almond Shells-I - Preparation and Characterization by
Nitrogen Adsorption. Carbon. 20(6): 513-518
Rodriguez-Reinoso, F., Lopez-Gongalez, J.D. and Berenguer, C. (1984). Activated
Carbons from Almond Shells-II – Characterization of the Pore Structure.
Carbon. 22(1): 13-18.
Ruthven, D.M., Farooq, S. and Knaebel, K.S. (1994). Pressure Swing Adsorption.
New York: VCH Publishers, Inc.: 203-210.
Ryu, Zhengyu, Zheng, Jingtang, Wang, Maozhang and Zhang, Bijiang. (2000).
Nitrogen Adsorption Studies of PAN-Based Activated Carbon Fibers
Prepared by Different Activation Methods. Journal of Colloid and Interface
Science. 230: 312-319.
Safarudin, G.H. (2000). Characterization and Analysis of Carbon Molecular Sieve
from Oil Palm Shell. Faculty of Mechanical Engineering, Universiti Teknologi
Malaysia (UTM): Thesis of Master in Mechanical Engineering.
184
Schroter, H.J., Mulhelm, Schulte-schulze, A. and Heimbach, B-H. (1994). Process
for Obtaining Nitrogen from Air or Nitrogen-Containing Gases by PSA on
CMS. US Patent 5,275,640.
Sing, K.S.W. (1985). Characterization of Adsorbents. In. Rodrigues, A.E., LeVan,
M.D. and Tondeur, D. Adsorption Science & Technology. London: Kluwer
Academic Publishers. 3-13.
Sircar, S., Golden, T.C. and Rao, M.B. (1996). Activated Carbon for Gas Separation
and Storage. Carbon. 34(1): 1-12.
Slejko, F.L. (1985). Adsorption Technology – A Step-by-Step Approach to Process
Evaluation and Application. New York: Marcel Dekker Inc.: 3-4
Smith, A.R. and Klosek, J. (2001). A Review of Air Separation Technologies and
Their Integration with Energy Conversion Processes. Fuel Processing
Technology. 70(2): 115-134.
Stoeckli, F., Slasli, A., Hugi-Cleary, D. and Guillot, A. (2002). The Characterization
of Microporosity in Carbon with Molecular Sieve Effects. Microporous and
mesoporous Materials. 51(3): 197-202.
Storck, S., Bretinger, H. and Maier, W.F. (1998). Characterization of Micro- and
Mesoporous Solids by Physisorption Methods and Pore-Size Analysis.
Applied Catalysis A: General. 174: 137-146.
Suzuki, M (1990). Adsorption Engineering. Tokyo: Kodansha Ltd.: 24-32
Tan, J.S. (2001). Preparation of Microporous Carbon Adsorbents from Oil Palm
Shell by Physical and Chemical Treatments for Gas Separation. Faculty of
Mechanical Engineering, Universiti Teknologi Malaysia (UTM): Thesis of
Master in Mechanical Engineering.

185
Turmuzi, M., Daud W,R,W., Tasirin, S.M. and Iyuke, S.E. (2004). Production of
Activated Carbon from Candlenut Shell by CO2 Activation. Carbon. 42: 453-
455.
Valente Nabais, J.M., Carrott, P.J.M., Ribeiro Carrott, M.M.L. and Menendez, J.A.
(2004) Preparation and Modification of Activated Carbon Fibres by
Microwave Heating. Carbon. 42: 1309-1314.
Valladares, D.L., Rodriguez Reinoso, F. and Zgrablich, G. (1998). Characterization
of Active Carbons: The Influence of the Method in the Determination of the
Pore Size Distribution. Carbon. 36(10): 1491-1499.
Valco Instruments Co. Inc. (1992). Microvolume Thermal Conductivity Detector.
Houston (USA): Instruction Manual.
Van Hardeveld, R.M., Groeneveld, M.J., Lehman, J.Y. and Bull, D.C. (2001).
Investigation of an Air Separation Unit Explosion. Journal of Loss
Prevention in the Process Industries. 14(3): 167-180.
Verma, S.K.(1991). Development of Molecular Sieving Properties in Microporous
Carbons. Carbon. 29: 793-803.
Verma, S.K. and Walker, P.L. (1992). Preparation of Carbon Molecular Sieves by
Propylene Pyrolysis over Microporous Carbon. Carbon. 30(66): 829-836.
Wan Mohd. Ashri, Wan Shabuddin and Mohd. Zaki Sulaiman.(2000). The Effects of
Carbonization Temperature on Pore Development in Palm-Shell-Based
Activated Carbon. Carbon 38: 1925-1932.
Wang, Z-M, Kanoh, H, Kaneko, K, Lu, G.Q. and Do, D. (2002). Structural and
Surface Property Changes of Macadamia Nut-Shell Char Upon Activation
and High Temperature Treatment. Carbon 40: 1231-1239.

186
Webb, Paul A. and Orr, C. (1997). Analytical Methods in Fine Particle Technology.
Norcross, GA, USA: Micromeritics Instrument Corporation. 96-127.
Wong, C. C. and Farid Nasir Ani. (2002). Thermo-Chemical Recycling of Palm
Solid Waste to Phenolic Resin. Proceeding of the 6th Asia-Pacific
International Symposium on Combustion and Energy Utilization. Johor,
Malaysia: Universiti Teknologi Malaysia. 297-302.
Yang, R.T. (1987). Gas Separation by Adsorption Processes. Butterworth
Publishers.: 54-56.