j. j. b , jr., chai an yäybür.j/k
TRANSCRIPT

~ /
ALKALI ATTACK OF COAL GASIFIER REFRACTRRY LINING
byMaria Gentile
Thesis submitted to the Graduate Faculty of the
Virginia Polytechnic Institute and State University
in partial fulfillment of the requirements for the degree of
MASTER OF SCIENCE
in
MATERIALS ENGINEERING
A1>1>R0vEb: Ä, 7 g I 7/ / /
, ,.%/6/ J. J. B , Jr., Chai an
//7 » ßJ/KyäybüR.H. Yoon D. Farkas
J¥· ALKALI ATTACK OF COAL GASIFIER REFRACTORY LINING
IÜ by
Maria Gentile
Committee Chairman: Jesse J. Brown
Materials Engineering
(ABSTRACT)
II An experimental test system was designed to simulate the operating
conditions found in nonslagging coal gasifiers. The reaction products
that form when refractory linings in coal gasifiers are exposed to
alkali impurities (sodium or potassium) were experimentally determined.
Analysis of selected physical and chemical properties of the reaction
products, which typically form between the alkali and the refractory
will lead to a better understanding of the mechanisms behind refractory
failures associated with alkali attack.
The reaction products sodium aluminate (Na2O•Al203), N2C3A5(2Na20·3CaO·5Al203), nepheline (Na20•Al203•2SiO2), potassium aluminate
, (K2O•Al203), and kaliophilite (K2O•Al203•2Si02) were synthesized andtheir solubility in water and coefficients of linear thermal expansion
were: measured. Of the compounds tested, the formation of potassium
aluminate would be the most detrimental to the gasifier lining. The
linear thermal expansion. of _potassium. aluminate ·was 2.05% from room
I

I1II
temperature to 800OC, which was twice as large as the other compounds. [
Potassium aluminate also possessed the highest solubility im water which
was 8.893/L at 90OC.
II1I
1
I1
11
II I

11
Acknowledgements
I would like to thank Dr. J. J. Brown, Jr. for his guidance and
patience throughout my graduate studies in Materials Engineering. To
Nancy Brown for her editorial assistance.

Table of ContentsPage
Abstract ...................................................... ii
Acknowledgements .............................................. iv
I. Introduction ............................................ 1
A. Background Information .............................. 1B. Alkali Attack of Alumino—Silicate Refractories ...... 3
1. Reactions with Sodium ........................... 32. Reactions with Potassium ........................ 4
C. Alkali Attack of Calcium Aluminate Cements .......... 4
1. Alkali—53% Alumina Cement Reactions ............. 52. Alkali-71% Alumina Cement Reactions ............. 8
II. Experimental Procedure .................................. 13
AlB.
Alkali Compound Syntheses ........................... 13C. Solubility Measurements ............................. 15D. Thermal Expansion Measurements ...................... 16
III. Results and Discussion .................................. 18
A. Identification of Alkali—Alumina CementReaction Products ................................... 18
B. Solubility Results .................................. 24C. Thermal Expansion Results ........................... 24
D!IV.Conclusions ............................................. 39
V. References .............................................. 40
VII. Appendix II ............................................. 47
v

I
List of Tables
Table Page
1. Composition of Gas Atmosphere (in molZ) ...................... 6
2. Composition of Alumina Cement (in molZ) ...................... 7
3. Calculated Equilibrium Phases and the Experimentally ObservedPhases for the Sodium—53Z Alumina Cement Reactions ........... 19
4. Calculated Equilibrium Phases and the Experimentally ObservedPhases for the Potassium—53Z Alumina Cement Reactions ........ 20
5. Calculated Equilibrium Phases and the Experimentally ObservedPhases for the Sodium—71Z Alumina Cement Reactions ........... 22
6. Calculated Equilibrium Phases and the Experimentally ObservedPhases for the Potassium-71% Alumina Cement Reactions ........ 23
7. Coefficients of Linear Thermal Expansion of the TestedAlkali Compounds ............................................. 35
vi _

List of Figures
Figure Pagg
1. Na20—CaO—Al2O3 Phase Diagram ............................. 92. KZO-Ca0—Al203 Phase Diagram .............................. 10
3. Schematic of Test System ................................. 14
4. Solubility Curve for Sodium Aluminate .................... 25
5. Solubility Curve for Soda-Lime—Aluminate ................. 26
6. Solubility Curve for Nepheline ........................... 27
7. Solubility Curve for Potassium Aluminate ................. 28
8. Solubility Curve for Kaliophilite ........................ 29
9. Thermal Expansion Curve for Sodium Aluminate ............. 30
10. Thermal Expansion Curve for Soda—Lime-Aluminate .......... 31
11. Thermal Expansion Curve for Nepheline .................... 32
12. Thermal Expansion Curve for Potassium Aluminate .......... 33
13. Thermal Expansion Curve for Kaliophilite ................. 36
vii
3

MI.IntroductionA.Background Information
There are many industrial processes in which refractory structures
are subjected to alkali vapors or slags. These structures include the
linings of cement kilns and blast furnaces, much of the interior ofglass tank furnaces, and coal gasifier linings. The result of combining
the operating conditions of high temperature and pressure with alkali
impurities (often in the presence of steam) is degradation and premature
failure of the refractory structures. The Grand Forks Energy Technology
Center (GFETC) slagging gasifier failure demonstrates the devasting
effect alkali impurities may have on a refractory structure.(l) The
mullite refractory lining in the gasifier cracked and spalled after only
125 hours of exposure in a coal gasification atmosphere. The mullite
refractory was found to have reacted with sodium (probably NaOH) to form
carnegiete and beta—alumina (Na20 •1lAl2O3). Thefailure occurred as a result of the volume expansion associated with
this reaction. Chemical spalling due to reactions of mullite and
alumina refractories with sodium compounds to form carnegiete (and its
polymorphic variety, nepheline) and beta—alumina is Ma common problem.
Analogs of these reactions have also been identified in the presence of
potassium with leucite (K2O'Al203•4SiO2), kaliophilite (K2O•A12O3•2Si02)and beta-alumina (K2O·12Al2O3) as reaction products.(2) These productsare formed as the alkali initially attacks the cristobalite and glass of
the matrix bond, and then the fine crystalline mullite associated with
bonding. Higher temperatures intensify the alkali attack of the coarser
mullite. Free alumina is the most resistant component in the refractory
1 MMMMM

2 Isystem. It is not readily attacked until all the available
cristobalite, glass and mullite have reached equilibrium with the
alkali. The reaction product formed from alkali and free alumina is
beta-alumina, which is formed above ZOOOOF and exists up to
approximately 3O00°F(3). The exact chemical composition of beta-alumina
is still problematical. From chemical analysis a composition
composition of Na2O •12Al2O3 has been reported by a number of
sources(4_S). However a 1:11 ratio gives the best agreement with the
crystal structure and density data. Two factors continue to influence
this ratio: (1) the recognized difficulty of chemical analysis; and (2)
the more recent possibility of more than one beta—alumina phase combined
with nonstoichiometry dependent on the thermal history. Yamaguchi and
Suzuki have identified another alkali polyaluminate by chemical analysis
and x—ray methods and reported an approximate composition of Na2O·8Al2O3
or· K2O··8Al2O3(6). Higher concentrations of alkali will lead to theformation of alkali aluminates such as sodium aluminate (Na2O•Al2O3) orpotassium aluminate (KZO •Al2O3). However, other factors besidesreactivity must be considered in the resistance of a refractory to
alkali attack.
Of the other factors to be considered, surface area is probably the
most important. The extent of alkali attack is limited by access to the
internal matrix of the refractory. Further resistance to alkali
penetration is exhibited by the ability of some aluminous refractories
to seal the surface by forming a glass (glazing). This leads, in
general, to failure only if repetitive peeling of surface layers occurs.
This peeling effect is often found in refractories exposed to cyclic
I

S
heating and cooling. In general, the alkali compounds tend to be
hydrophylic when exposed to ambient atmospheric conditions, which
results in rapid moisture removal and spalling when the alkali laden
refractory structure is shut down then reheated. The alkali compounds
also tend to have higher thermal expansion coefficients which makes the
exposed surface layer more prone to thermal spalling upon subsequent
heating and cooling.
B. Alkali Attack of Alumino—Silicate Refractories
When mullite or alumina refractories are exposed to alkali
impurities (sodium or potassium), dry expansive type compounds form
which are less dense than the parent refractory. Being less dense, the
formation of alkali compounds will produce a volume expansion.
1. Reactions with Sodium
Nepheline and beta—alumina are the two most commonly formed alkali
compounds in mullite structures. The formation of nepheline will result
in a 17% volume expansion. A 20% volume increase is associated with the
formation emf beta-alumina. Two typical mullite—sodium. reactions are
shown below:
3Al 0 ·2SiO + Na 0 —-•· Na O•Al O ·2SiO + 2Al O (7)2 3 2 2 2 2 3 2 2 3
Nepheline + 17% vol. increase
11(3Al203·2Si02) + 26(NaOH) -—•
11(Na2O•Al2O3•2SiO2) + 2(Na20•1lAl2O3) + 13H20(8)Carnegeite + beta—alumina + 30% vol. increase
irE
I4
2. Reactions with Potassium
When potassium is present as the alkali impurity, kaliophilite
(analogous to the sodium compound nepheline) or leucite are often the
alkali compounds which form. The formation of kaliophilite will result
in a 6% volume increase; while the formation of leucite will result in a
10% volume increase. A potassium form of beta—alumina is also observed
in the alumina—potassia system with an accompanying 17% volume
increase.(9)
K + 2/3(3Al2O3·2SiO2) + 8/3(SiO2) + CO-—• 2(K2O·Al2O3•2Si02) + 2C
kaliophilite + 6% vol. increase
or—• 2(K2O3•Al2O3•4SiO2) + 2C
leucite + 10% vol. increase
2K + 11(Al2O3) + CO —• K2O·11Al2O3 + Cbeta—a1umina + 17% vol.increase
C. Alkali Attack of Calcium Aluminate Refractory Cements
In the present investigation, the alkali attack of non—slagging
coal gasifier refractory linings was studied. Alkali vapors are almost
always present in coal gasifiers because feed coals contain alkali
compounds. In general, the alkali attack is viewed as a long term
phenomena, with the damage occurring over a period of many months or
years of unit operation. Because gasifiers are frequently refractory
lined, operated at high temperatures, and contain alkali immpurities, it I
is important to study the reactions that occur and to evaluate the
IIII
5 Äresults in view of design, operation, and lifetime of the refractory
gasifier linings.
From a thermodynamic viewpoint, when refractories made from the
CaO—Al2O3—SiO2 system are exposed to alkali impurities, alkali reactions
are inevitable, since the total energy of the system will be lowered by
the formation of alkali compounds. The mechanism of alkali attack on
coal gasifier linings consists of the release of the alkali species from
the coal and the subsequent reactions with the gasifier linings. It is
known that the reactions primarily take place at the cement bonding
phase. The aggregate remains unreacted with the alkali impurity. This
is attributed to the larger grain size and smaller surface area of the
aggregates as compared to the cement bonding phase.
The computer program SOLGASMIX-PV has been used to calculate the
stable phases that form under equilibrium conditions in a nonslagging
coal gasifier.(10) In the calculations, the thermodynamic system
contained one gas mixture, one liquid solution, and various invariant
solid phases. The liquid solution is assumed to be ideal, and all the
solid phases occur as stoichiometric compounds. The simulated gas
atmosphere used in the calculations is listed in Table 1. A 53% alumina
and a 71% alumina cement were used in the calculations. The
compositions of the cement are given in Table 2. The calculations of
interest were carried out at ambient pressure and temperatures ranging
from 12OOK to 1800K.
1. Alkali-53% Alumina sement Reactions éTables 3 and 4 show the mineralogical change of a 53%
aluminaCemetltafter Exposure to an atmosphere containing sodium or potassium, E
Ä

S6
Table 1. Composition of Gas Atmosphere (in mol Z)
H2 CHA CO CO2 H20 N212 18 17 12 20 20

Table 2. Composition of Alumina Cement (in. wtZ)
A12O3 CaO Fe203 SiO2
Intermediate purity 53.5 40.5 1.6 4.4
High purity 71.5 27.9 0.17 0.16
11

n8I
respectively. After exposure to a sodium atmosphere, the primary phases
formed were CaO and Na2O·A12O3 at low temperatures. Above 1400K, CaOdisappearmd and 3CaO•Ai2O3 formed. No sodium compunds formed above
1600K. In the potassium calculations, CaO and K2O•Al2O3 were the primaryphases formed throughout the testing temperatures.
2. Alkali—71Z Alumina Cement Reactions
Similiar results were obtained for the 712 alumina cement
reactions. The equilibrium phases predicted from the calculation under
sodium and potassium atmospheres are shown in Tables 5 and 6.
In a sodium atmosphere, the primary phases were CaO and Na2O•Al2O3
at low temperatures. Above 1400K, CaO disappears and 3CaO·Al2O3 and
CaO·Al2O3 form. Again no sodium compounds formed above 1600K. In the
potassium atmosphere, CaO and K2O·Al2O3 were the only phases which
formed throughout the temperature range tested.
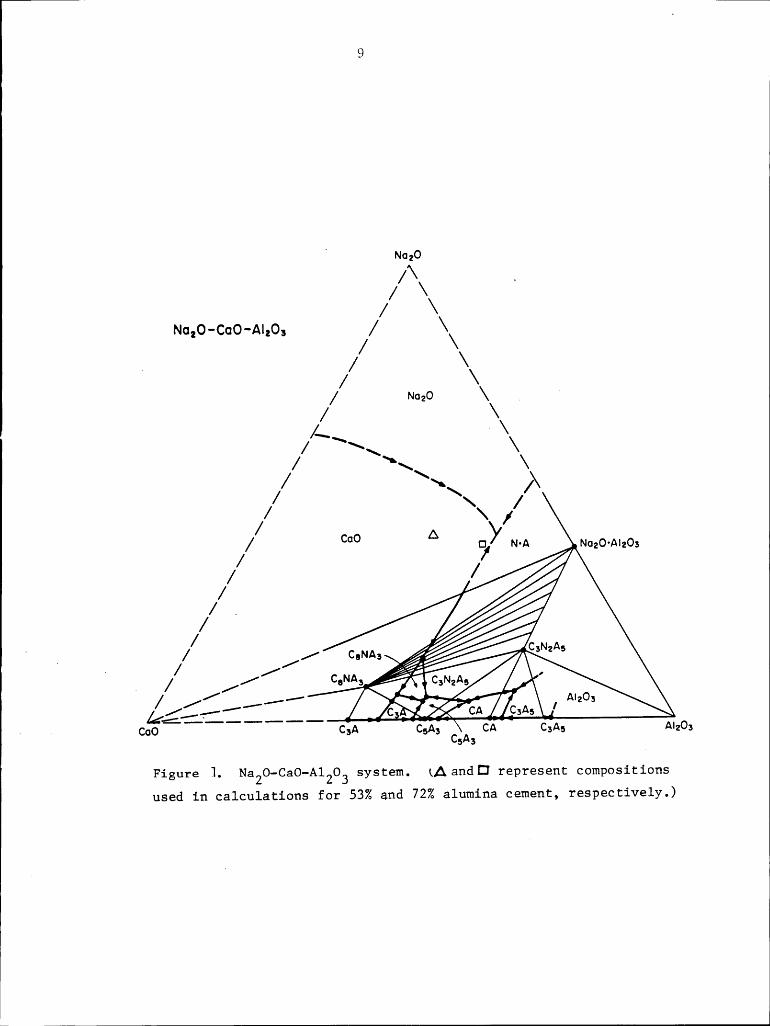
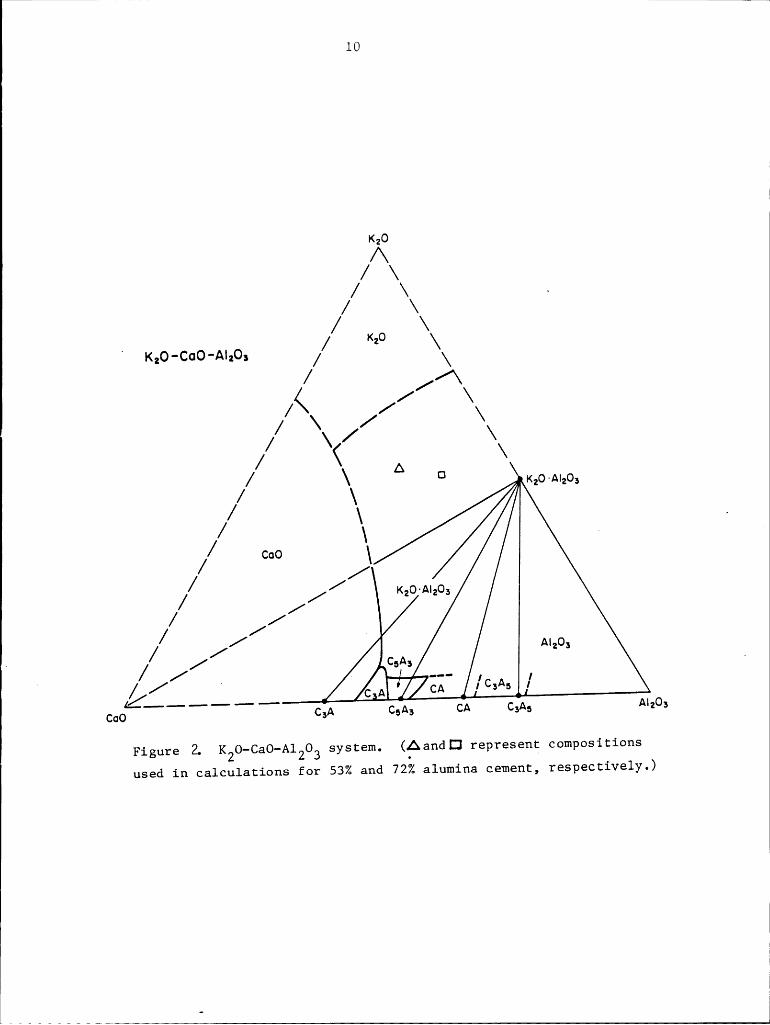
The above results were compared with existing phase diagrams for
Na2O—Al2O3-CaO and K2O—Al2O3—CaO (see Figures 1 and 2); the compositionsof the cements used in the calculations are labeled on the diagrams. .
According to the phase diagrams, the stable phases corresponding to the
labeled compositions are likely to be CaO and Na2O•Al203 for Figure 1
and CaO and K2O•Al2O3 for Figure 2. In the calculations, the sodium andpotassium input levels were fixed at 1 mol!. Higher amounts of alkali
produce alkali aluminates of higher alkali contents; thus the 1:1 ratio
alkali—alumina compounds rather than the beta—alumina type compounds
formed.
Anaylsis of the physical and chemical properties of the reaction
products, which typically form between the alkali and the refractory
9
UNüzo/\ ./ \
/ \N¤,O-C¤O-AIZO, / \
/ \. / \
/ \/ N¤2O I
V
/ \L\ ‘ \
/ \\ \/ ‘x\ \
/ \ ’N•/Ä N0gO•A|zO3
/ /// ./
. / c NA .. a s
CGNAS§;;_¢;;f_:___Figure]. Na2O-CaO-Al2O3 system. QA andi:] represent compositions
used in calculations for 53% and 72% alumina cement, respectively.)
lO/\
/ \/ \ —
// \\
»<,o-c¤o—A¤,o, / \/ //\Ä // \
\ / \/ / \// \< A \/ \ Ü •<,0—A¤20,
/ \// \ .\ 1
/ c¤o \/ //
// K20-Auzo,/ //
/ // .1 / /
/ // °°A’ ‘14..-..-.. Aw
COO CSA C5A; CA C;A5 Al2O3
Figure 2. K20—CaO—Al2O3 system. (AandÜ represent: compositions
used in calculations for 53% and 72% alumina cement, respectiVely•)

2
11
will lead to a better understanding of the mechanisms behind the
refractory failures associated with alkali attack. Of these properties,
it is felt that dimensional changes, thermal expansion and water
absorption are the most important. Sodium aluminate (Na2O• Al2O3),
soda-lime—aluminate (2Na2O·3CaO•5Al2O3), nepheline (Na2O•Al2O3•2SiO2),
potassium aluminate (K2O•Al2O3), and kaliophilite (K2O·A12O3·2SiO2) werethe compounds chosen for physical and chemical testing.
In the ternary system soda—lime—alumina, the formation of N2C3A5 ispossible since its stability field is adjacent to the three basic
calcium aluminate cement phases: CIZA7, CA, and CA2.(l1) When theamount of Na20 present is increased, sodium aluminate becomes the stable
phase. The stability field of solid solutions of NA and N2C3A5 liesbetween the stability field for NZCBAS and the single phase region where
NA is stable; so at intermediate concentrations of Na2O, both NA andNZCBAS are the stable equilibrium phases. X-ray diffraction studies
have shown that the 1ow—temperature tetragonal modification of sodium
aluminate is converted to cubic fomm at 450°C.(12) A characteristic
feature of this polymorphic conversion is the constancy of the unit cell
volumes, which are 2054 and 2058 Ä3 for the low and high temperature
forms respectively.
In the potassia-lime—alumina system, the field of K2O•Al2O3 isadjacent to C3A, CIZA7, and CA and a eutectic is formed between C3A,CIZA7, and K]. at 1425oC.(1l) Potassium aluminate crystallises in thecubic system with a refractive index of 1.603.
The compound Na2O •A12O3 •2SiO2 has four known polymorphs.High—carnegiete (cubic) is stable from the liquidus down to 1250OC,

12 1
where it transforms to high—nepheline (hexagonal) which is stable down
to room temperature. The transformation of high—carnegiete to
high—nepheline is sluggish and, by quenching, high—carnegiete may be
obtained in the stability field of nepheline but at 69OOC it undergoes a
displacive inversion into low—carnegiete (low symmetry).(13)
Five polymorphs of K2O·Al2O3·2SiO2 are known. Below 850OC, kalsité(hexagonal) is the stable phase. From 900oC to the liquidus, laboratory
syntheses have yielded orthorhombic KAlSiO4 (denoted Ol); near 100OOC a
synthetic kaliophilite with aa hexagonal structure was also obtained.
The synthetic kaliophilite is not identical to the natural kaliophilite
which also has aa hexagonal structure, but their powder patterns are
remarkably similar. A second form of natural kaliophilite exists which
is known as anomalous natural kaliophilite. Kaliophilite is analogous
to the phase nepheline found in the soda—lime-alumina system. Both
nepheline and kaliophilite exist in the hexagonal and the orthorhombic
structural forms.
1' 1
rtttil

II. Experimental Procedure
A. Test Apparatus
The test apparatus shown in Figure 3 consists of a resistance
heated tube furnace, a mechanical syringe pump, flow meters and a glass
tube where the individual gases were premixed. The input gas
composition (in mol%) was fixed at 12% H2, 18% CH4, 17% CO, 12% CO2, 20%H20, and 2O%N2. The mechanical syringe pump was used to inject distilled
water into, the tube furnace at a constant rate of 0.3ml/hr. during
testing. The furnace was operated at ambient pressure and temperatures
ranging from 120OK to 1600K.
The alkali impurities were introduced by mixing sodium carbonate or
potassium carbonate in a 1:1 weight ratio the calcium aluminate cement.
The composition of the cements is given in Table 2. The ground sample
was then fired in an alumina combustion boat for 30 hours in the gaseous
atmsophere described above. At the completion of the run, the samples
were removed at the testing temperature in an inert atmosphere. The
samples were reground and sealed in plastic containers. The phase
assemblage of each sample was identified by x-ray diffraction analysis.
B. Alkali Compound Syntheses
Sodium aluminate was formed by heating a stoichiometric mixture of
sodium oxylate and aluminum hydroxide (Al(OH)3) at 1000OC for
15 hours, after a preliminary heat of 6O0°C.(14)
Soda—lime—aluminate (2Na20•3CaO•5Al2O3) was synthesized by reacting
sodium oxylate, calcium nitrate (Ca(NO3)2) and alumina powder in a 2:3:5 A
ratio. The mixture was heated at 110OOC for two days. ä13ll

II 14 IIII
QDEWG Q.J.J O2z;°
CQ( D
.§ I". Lg '
LE I-~ •—•
·‘;‘
II.: <:gg D« g- i .
OJCQ · khz .0 0 . Ü?+ O O _ +->
- uh„~ ° ° Z. · '-·'° . ·~•-
+ OG ä .2¤ ‘ $2 *6;;* ÄÄ L2 ä
. Q) C6 ä' · Z „>’„N <-¤ I .EZ cw > Ä 6cz Z: Q,. O ) . 65
•"
LZjI U)
äI"gj .
~ ‘ Z« _ •1. . _|
U-
I

I15 I
INepheline was prepared by reacting two moles of sodium hydroxide I
(NaOH) and one mole of kaolin (Al2O3·2Si02•H2O)(15) at 1100OC for 4days.(l6) Potassium aluminate was synthesized by reacting stoichiometric
amounts of KZO and Al2O3 in the form of KZCOB and Al(OH)3. The mixturewas heated in air at 1170K for 4 h; 870K for 64h; 1185K for 20.5h; 1185K
for Sh; and 1185K for 25h. The mixture was cooled and thoroughly
blended after each of the 1185K heatings.(17)
Kaliophilite was synthesized by reacting 2 moles of potassium
hydroxide (KOH) and 1 mole of kaolin (Al203•2SiO2·H2O). The mixture was
heated for four days in air at 1100°C.
After the compounds were synthesized, x—ray powder diffraction
analysis was performed to confirm that only the specificied compounds
were present. The compounds were immediately placed in sealed
containers to prevent the absorption of moisture. The percent absorbed
water was measured for each compound after the physical testing was
completed. None of the compounds contained more than 0.15% absorbed
water. .
C. Solubility Measurements
Quantative determination of solubility consists essentially of two
operations: the preparation of a saturated solution and its subsequent
analysis. The most important consideration is the assurance that final
equilibrium between solvent and solute has been reached. This is the
point at which no further change occurs in the relationship between the
amount of the compound in solution and that remaining undissolved. Only
by thorough mixing which agitation or effective stirring provides can I
the point of saturation be reached with certainty. Since solubility is
III

16 ;1
1a function of temperature, the temperature of the water must be
accurately controlled when measuring solubility. In general, it may be
stated, that every procedure designed for preparing a saturated solution
must include provisions for accurate control of temperature and for
active and continuous agitation or stirring of the solution.
To determine the solubility of the alkali compounds, saturated
solutions were prepared in distilled water and mixed thoroughly with a
magnetic stirrer. After a sufficient length of time for the attainment
of saturation, the undissolved solid was allowed to settle. The clear
solution was then collected with a pipet and the temperature and weight“ of the solution were recorded. The solution was then placed in a drying
oven to remove all moisture. The remaining solid represents the amount
of the compound that was soluble in the water. The solubility was
calculated by dividing the weight of the dissolved solid by the volume
of the distilled water. The procedure was performed at room temperature,
90oC and SOC. Each solubility measurement was repeated four times. The
values measured on successive trials were precise to one-hundredth of a
gram per liter which is within the accuracy of the balance used to weigh
the samples. All test conditions were kept constant to maintain the
reproducibility of the measurements.
D. Thermal Expansion Measurements
To prepare the test samples for thermal expansion measurements, the
compounds were finely ground and mixed with acetone. The powder was
then pressed into 1/2“ by 4" bars using a hydraulic press. Next the
pressed bars were sintered at 1000°C for twenty—four hours. To measure
the thermal expansion of the samples, the test bars were placed in a

I17
fused quartz tube with a push rod centered on top of the sample. The
push rod ‘was connected to a 'Teclock dial gage capable of measuring
dimensional changes to 0.001 of an inch. The samples were heated at a
rate of 10oC/min. to 800OC in a tube furnace controlled by aa variac
power source. The coefficient of thermal expansion was calculated by
measuring the dimensional change of the test bars in the direction of
the longest dimension.
Thermal expansion curves were constructed for each of the compounds
tested. The thermal expansion measurements were repeated three times
and at the completion of each test the coefficient of thermal expansion
was calculated and compared to the previously obtained values. The
results obtained on successive trials differed by approximately 1% of
the calculated mean value, indicating that the results were
reproducible.

L
III. Results and Discussion
A. Identification of Alka1i—Alumina Cement Reaction Products
The experimentally detected phases that formed between the alumina
cement and alkali (sodium or potassium) were compared to the
theorectically calculated stable, equilibrium phases reported by
Sun.(lO)
The 53% alumina cement-sodium phases are listed in Table 3. At
1200K, C12A7 (12CaO•7Al2O3) and sodium aluminate (Na2O•Al2O3) were theexperimentally detected phases. According to the theorectical
calculation, lime (CaO) and sodium aluminate are the stable phases. the
~ loss of the lime phase is attributed to the formation of the
nonequilibrium cement phase CIZA7, which formed as a result ofinsufficient test time to allow equilibrium to be attained. At 130GK
and 1400K, lime and sodium aluminate were the experimentally detected
phases which agrees with the theoretical calculations. At higher
temperatures (15OOK and 1600K), lime and sodium aluminate were detected
along with NZCBAS. This can be explained. by' noting that at higher
temperatures sodium is lost in the exit gas during testing; therefore,
the composition of the sample drops into the region on the
soda—1ime—alumina„ diagram (see ‘Figure 1) where N2C3A5 is the stablephase.
The 53% alumina cement—potassium phases are listed in Table 4. At
120OK, CIZA7 and potassium aluminate (K2O·Al2O3) were the experimentallydetected phases. At 130OK and 140OK, lime and potassium aluminate were
observed experimentally which agrees with the theoretical calculations.
These results are very similiar to those observed when sodium was
18

I
19 I
Table 3. Calculated Equilibrium Phases and the ExperimentallyObserved Phases for the Sodium-53% Alumina Cement Reactions
Temperature (K) Calculated Observed
1200 C, NA CIZA7, NA
1300 C, NA . C, NA
1#00 C, NA C, NA
1500 C3A, NA C, NA, NZCBAS
1600 C3A, CA C, NA, NZCBAS
*Conventional cement chemistry notation used in Tables 3-6, i.e. C=Ca0,N=Na2O, A=Al2O3, K=K2O.

20 'II
I I
Table 4. Calculated Equilibrium Phases and the ExperimentallyObserved Phases for the Potassium—53Z Alumina Cement Reactions
Temperature (K) Calculated Observed
V 1200 C, KA Cl2A7, KA
1300 C, KA C, KA
1400 C, KA C, KA
1500 C, KA CIZA7, CA
1600 C, KA CIZA7, CA

I21
present as the alkali species. At 15OOK and 1600K, the experimentally
detected phases were CIZA7 and CA. No potassium phases were detected.It is known that alkali vapors react aggressively· with the calcium
aluminate cement; however, our experimental apparatus allows the
potassium to flow out of the tube furnace in the exit gas as it
vaporizes. It should also be noted that only a finite amount of
potassium is available during each testing. Therefore, at 1500K and
1600K no potassium compounds formed and only the cement portion of the
sample was detected.
The 711 alumina cement—sodium listed in Table 5 shows the” appearance of sodium aluminate and CIZA7 at all temperatures tested. The
thermodynamic calculations predict the formation of sodium aluminate
throughout the temperature range tested.(10) The lime phase disappears
between 1500K and 1600K. The ternary compound, NZCBAS first appears at
1400K.
The 71% alumina cement—potassium phases listed in Table 6 confirm
the theoretical calculations up to 1600K, with the formation of lime and
potassium aluminate. At 1600K, the loss of potassium during testing
prevented the formation of potassium aluminate.
It should be noted that the formation of the high molar ratio (1:1)
alkali—aluminates was a direct result of the excess amounts of alkali
impurities used during testing. A 1:1 weight ratio of alkali carbonates
to alumina cement was used to promote reaction in the relatively short
testing period of 30 hours. At low alkali levels, beta-alumina will
form above 200OOF and will be stable up to 3000°F. The formation of
beta-alumina will result in a 20% volume increase.

22 l
Table 5. Calculated Equilibrium Phases and the ExperimentallyObserved Phases for the Sodium—71% Alumina Cement Reactions
1200 C, NA CIZA7, NA
1300 C, NA Cl2A7, NA, C
1400 C, NA Cl2A7, NA, C, N2C3A5
1500 CSA, CA, NA CIZA7, NA, C, NZCBAS
1600 ACA, NA Cl2A7, NA, NZCBAS

23 I
I
Table 6. Calculated Equilibrium Phases and the ExperimentallyObserved Phases for the Potassium—71Z Alumina Cement Reactions
Temberature (K) Calculated Obserged
1200 C, KA CIZA7, KA, C
1300 C, KA CIZA7, KA, C
1400 C, KA CIZA7, KA, C
1500 C, KA Cl2A7, KA, C
1600 C, KA CA, CA2

24
B. Solubility Results
The solubility curves of sodium aluminate and potassium aluminate
are shown in Figures 4 and 7, respectively. Both curves increase with
increasing temperatures and begin to level off at 9000 to 10000, where
steam will begin to first appear. In a steam containing atmosphere,
approximately 9.0g/L of sodium aluminate or potassium aluminate was
soluble. The solubility curve for N203A5 (see Figure 5) levels off atso°c and remains constant up to 10000; over this temperature range
3.lg/L was soluble. The solubility curve for nepheline (see Figure 6)
increases with increasing temperature but shows no tendency to level
off. In a steam containing atmosphere only 1.1g/L of nepheline was
soluble. Kaliophilite was the least soluble mmf the alkali compounds
tested. For all practical purposes, kaliophilite was insoluble at 500
(0.025g/L). The solubility curve for kaliophilite shown :h1 Figure 8
also increases with increasing temperature without leveling off. At
9000, only 0.70g/L of kaliophilite was soluble.
0. Thermal Expansion Results
The thermal expansion curves for sodium aluminate and nepheline
(Figures 9 and 11, respectively) have a constant slope from 30000 to
80000. The slope of the thermal expansion curves is defined as the
coefficient of thermal expansion. The slope of the thermal expansion
curve is constant from 200OC to 800oC for NZCBAS (see Figure l0). The
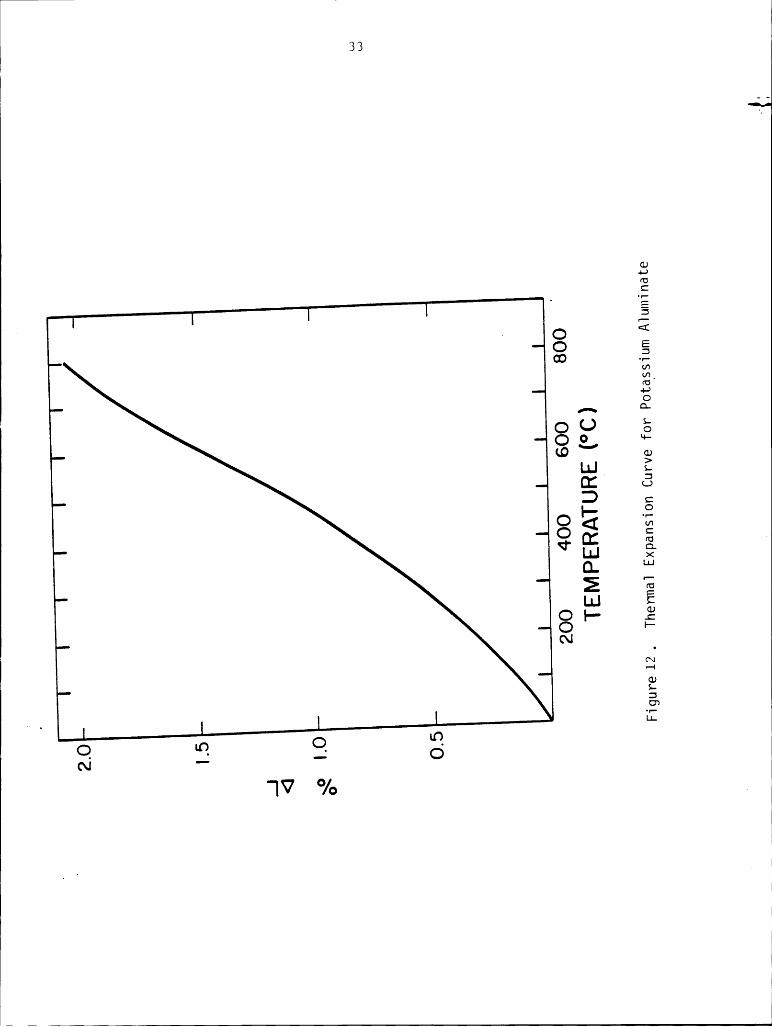
slope of the thermal expansion curve for potassium aluminate (Figure 12)
increases nonlinearly with increasing temperature. A constant
coefficent of thermal expansion can not be assumed over the temperature
range from room temperature to 80000. The coefficient of thermalI

309- 2
E"‘ EU E2, Eäé 2
c E 3mn 4 is)& 3* 3¤- FE éLn.! ,-F- 1%
2;· E
. Q C2Ö LO 1
(*1/b) A.L|'lI80"lOS 1
11

I
:6I
° O 53Q Z2é
IEJ,E0 E ‘
O ·¤*’ 8LQ gQ; E
c E 3LO FE; äI
Lg 5*Q. TlE ELu .-I- 3
LO LQE
N cx:('I/Ö) A.Ll'I|8f1'IOS

27
09.Z
EZ3 2P-· 2:1.;.1 Z ‘g E[E7 3*Ü- ?2 5LLJ E|·-· 3
~¤ =¤ E— 0
_("I/Ö) Ä.LI”I|8Ü'lOS

28‘I
L 3 22
Z30+->-· 2
¤-¤-¤ 2E w-
o D2 2~¤ 2 2Ei 2¤- EEE 2E 2
Ec> Q LL 29; LO
("I/Ö) A.LI'IIQf1'IOS „

‘ ’
29
_ OQ BEO-
u·~ OU I19.. S2LU Eä 29 gt äE E¤» EE 2
°Z$-4
. 2 ähIO LO ‘ ua
E NN O O
('I/Ö) A.L|'||8fT'lOS 9
Ü ‘ 4
— — —

30
1I
Bg· E
.
¤¤ E<:ä
0 0 S L
O9-!L
“° 2LUIZ Z'.;E 2,
O {Ig
Om .„_
O. S.
E 1350 I-
Tg
O GJN E
·¤Ä
O
E
.4my
g„
‘ 0II
'IV %

1Bl
B
1ESS S
°° 䥷3 TE
¤£„ Ü·Ü cuzum *·—
¤= 29 2|— <.>0< äoE tz¢¤_ E-E 1::¤—O
E3 .-2,2‘ E3
<2 ~¤ L?‘ *' O
WV c/Q .

I‘ I
O
2 °° 2ää^ 2
CD6%) ig °
LO"’ <+-¤-I 2Q s.D 5
¤ Z 2O 5,
0. i“E E
(\j I--
E
'93E
C2 wa“
— " O-1V °/Q
.
l I
·I
za«I
33
B
_ füEgg E<D
EEig.@6
EOc
isww
~·—
LLJ2
0:3 ä
ELJC
S<¤{rm<:ä ä
2ELUfü
Q.
N10
$3
2=¤
3
-1V o/OO
""
11
1111
34 31
expansion of potassium aluminate was the largest of the reported values
given in Table 7. Heating potassium aluminate from room temperature to
800OC would result in 2.05% linear expansion. The thermal expansion
curve for kaliophilite is shown in Figure 12. The slope also increases
nonlinearly with increasing temperature. Therefore, a constant
coefficient of thermal expansion can not be assumed for kaliophilite. A
linear expansion of 1.48% can be expected when kaliophilite is heated
from room temperature to 800OC.
D. Discussion
If the presence of the alkali impurities cannot be avoided by
changes in the operating conditions or coal, then the rate of alkali
attack must be retarded. The attack mechanism of alkali on aluminous
refractories is impregnation, bond reaction, and bond depletion. As
previously stated, the sequence of alkali attack is initially the glass
and cristoblalite phases, then the mullite and finally· the alumina.
Resistance to alkali attack by aluminous refractories was characterized
by Farris and Allen as follows(18): for aluminous refractories of 50
percent or less alumina, the refractory microstructure must be mature
and have low surface area, low porosity, and low alkali content. For
aluminous refractories containing 50 percent alumina and higher, the
matrix umllite bond should be umture and of udnimum exposed surface
area. The matrix should also have minimum glass and cristobalite, and
should be of low alkali content. Maturity of the matrix bond and
minimum surface area are important aspects of alkali resistance. They
appear to be as important as the refractory composition.

L 35
Table 7. Coefficients of Linear Thermal Expansion of theTested Alkali Compounds
Alkali Compounds §<xlO_gin/in/ C
Sodium Aluminate (NA) l4.05
Nepheline (NAS2) l4.20
Soda-Lime-Aluminate (N2C3A5) 9.75Potassium Aluminate (KA) 27.75
Kaliophilite (KAS2) 22.35
L

36
I.5
I.0..1<l$
0.5
200 400 600 800° TEMPERATURE (°C)
Fioure 13. Thermal Expansion Curve for Kaiiophilite

37 Q11
From a refractory selection standpoint, superduty fireclay
refractories can be used as long as the maximum hot—face temperature
does not exceed IOOOOC. The hot—face would show a volume contraction at
temperatures below 100OOC and melting would occur above IOOOOC. As the
temperature is increased, the alumina content must be increased.
Sillimanite could be used up to 130OOC and pure alumina brick beyond
1600oC without appreciable fluxing of the hot—face. At lower
temperatures both of these bricks would show an expansive tendency at
the hot—face.
Since alkali impurities are almost always present in coal
processing, the formation of the dry expansive compounds is inevitable.
By estimating the amount of alkali present in the coal feed and
monitoring the operating temperature of the Qgasifier, the relative
amounts of the alkali compounds which will form can be calculated. The
coefficients of thermal expansion of the alkali compounds can then be
used to calculate the percent linear expansion which will occur upon
heating of the refractory lining tc> a specified temperature. These
calculations can be used to estimate the life of the refractory lining.
From a design viewpoint, improving the cooling system will minimize
the solubility of the alkali compounds. Lowering the solubility of the
alkali compounds will result in less moisture removal when the gasifier
is cooled to ambient conditions and subsequently reheated. Effective
lowering of the operating temperature will also lead to less damage of
the refractory lining by reducing the amount of thermal expansion and ‘
the subsequent spalling. The phase beta-alumina could also be designed
into the refractory to tie up all the free alumina. This would prevent

I 38
further reaction between the alkali impurities and the refractory
lining. The large volume expansion associated with the beta—alumina
phase occurs only upon formation. After the initial volume expanion,
subsequent heating of beta—alumina would produce a coefficient of
thermal expansion comparable to corundum.
IIIIIIIIIII
3·-f-——————————————-———————-—------.............___________________________________

IV. ConclusionsThe experimental results confirmed the formation of sodium
aluminate (Na20 •Al2O3), soda—lime—alumina (2Na2O· 3CaO •5Al2O3), and
potassium aluminate (K2O•Al203) predicted by thermodynamic calculations.
These compounds along with nepheline (Na2O·Al2O3•2SiO2) and kaliophilite
(K2O·Al2O3-2SiO2) were synthesized and characterized according to their
solubility in water and linear thermal expansion. The water solubility
at 90OC of sodium aluminate and potassium aluminate was approximately
9.0g/L for both samples; they were found to be the most soluble of the
compounds tested. The solubility of the ternary compound, N2C3A5, was
3.lg/L. The solubility at 90OC of nepheline was 1.1g/L. Kaliophilite
was the least soluble with only 0.7g/L being soluble at 90OC.
The linear thermal expansion of sodium aluminate and nepheline was
found to be 1.1% from room temperature to 800OC. Over the same
temperature range, N2C3A5 expanded only 0.57%. The linear thermal
expansion of kaliophilite was 1.48% from room temperature to 800OC. The
thermal expansion of potassium aluminate was the highest at 2.05% from
room temperature to 800OC. Of the compounds tested, the formation ofA
potassium aluminate would be the most detrimental to the gasifier
lining. The thermal expansion of potassium aluminate was twice as large
}
as the other compounds and it possessed the highest solubilty in water.
F39

V. References
1. C.R. Kennedy, "Alkali Attack on a Mullite Refractory in the GrandForks Energy Technology Center Slagging Gasifier," J. Materials forEnergy Systems, Vol. 3, p.28, June, 1981.
2. R.E. Farris and J.E. Allen, "Aluminous Refractories—AlkaliReactions," Iron and Steel Engineer, p.68, Feb., 1973.
3. Ibid.
4. R.C. DeVries and W.L. Roth, "Critical Evaluation of the LiteratureData on Beta Alumina and Related Phases: Phase Equilibria andCharacterization of Beta Alumina Phases," Journal of AmericanCeramic Society, Vol. 52, No.7, p.364, July 1969.
5. Raymond Ridgeway, Albert Klein and W.J. O'Leary, "The Preparationand Properties of So—Called Beta Alumina," Trans. Electrochem. Soc.,Vol.70, p.71, 1936.
6. Yamaguchi and Suzuki, "On the Structure of Alkali Polyaluminates,"Bulletin of the Chemical Society of Japan, Vol. 41, p.93, 1968.
7. G. Rigby and R. Hutton, "Action of Alkali and Alkali—Vanadium OxideSlags on Alumina—Silica Refractories," J. Amer. Cer. Soc., Vol. 45,February, p.70, 1962.
8. C.R. Kennedy, "Alkali Attack on a Mullite Refractory in the GrandForks Energy Technology Center Slagging Gasifier," J. Materials forEnergy Systems, Vol. 3, p.29, June, 1981.
9. P.H. Havranek, "Alkali Attack on Blast Furnaces Refractories,"Trans. J. Brit. Ceram. Soc., Vol. 77, p.93, 1978.
10. Tawei Sun, Master's Thesis, Virginia Polytechnic Institute andState University, June, 1986.
11. F.M. Lea, The Chemistry of Cement and Concrete, p.72, Edward ArnoldPublishers Ltd., 1970.
12. M.S. Beletskii and Yu.G. Saksonov, "X—ray Diffraction Studies ofPolymorphic Transformations in Sodium Aluminate," Russian Journalof Inorganic Chemistry, Vol. 4, No.5, p.442, May, 1959.
13. J.V. smith and 0.F. Tuttle, "The Nepheline—Kalsilite System: X—rayData for the Crystalline Phases," Amer. J. Sci., Vol. 255, p.283,April, 1957. ;
¥14. A.F. Reid and A.E. Ringwood, "High—Pressure NaAlO , an<X—NaFeO2 E
Isotype," Inorganic Chemistry, Vol. 7, p.444, 1968.1I40i

I
Sl IIIIII
15. Borchert and Keidel, Heidelberger Beitr. Mineral U Petrog., Vol. 1,pp.17-30. 1949.
16. Hughes, "Formation of Alkali Silicates and Alumino—Silicates andTheir Occurrence in Blast Furnaces," Trans. Brit. Cer. Soc., Vol.65, p.662, 1966.
17. R.P. Meyer, M.J. and R.R. Brown, "Thermodynamic Properties ofKA1O2," J. Chem. Thermodynamics, Vol. 12, pp.985—991, 1980.
18. R.E. Farris and J.E. Allen, "Aluminous Refractories—AlkaliReactions," Iron and Steel Engineer, p.74, Feb., 1973.
IIIIIIIIIII
1
1
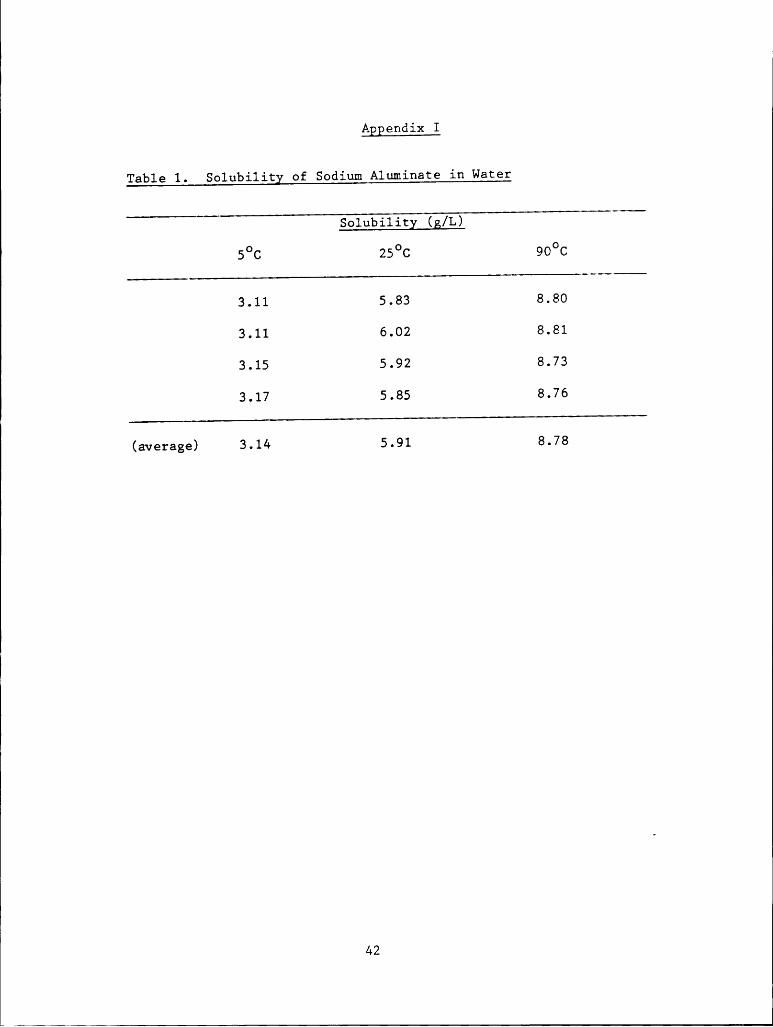
Aggendix I
Table 1. Solubility of Sodium Aluminate in Water
Solubility (g/L)
s°c 25OC 90°c
3.11 5.83 8.80
3.11 6.02 8.81
3.15 5.92 8.73
3.17 5.85 8.76
(average) 3.14 5.91 8.78
42

43Table 2. Solubility of Potassium Alum1¤ate 1m Water
Solubility (g/L)
s°c 2500 90°c
2.58 6.03 8.83
2.60 6.04 9.02
2.59 6.00 8.89
2.59 5.96 8.81
(average) 2.59 6.00 8.89
E
44I
JTable 3. Solubility of NZCBAS in Water ;
Solubilitj (g/L)s°c 25OC 90°c
0.420 2.16 3.17
0.372 2.14 3.17
0.305 2.16 3.16
0.350 2.19 3.19
(average) 0.362 2.16 3.17
I
45 1
1Table A. Solubility of Neghellne 1D Water
—_———”” yß"°""”‘
s°c 2s°<: 90°c
0.104 0.219 1.09
0.082 0.219 1.18
0.098 0.181 1.20
0.091 0.209 1.16
(average) 0.09A 0.207 1.16

L6 ‘I
Table 5. Solubility of Kalioghilite inWater_'
Solubility (g/L)__,-
s°c 25OC 90%
0.027 0.030 0.69
0.027 0.031 0.7A
0.027 0.032 0.70
0.020 0.032 0.67
(average) 0.025 0.031 0.70
IIII
II
III
I
· — -e—~—~—f—————————————-—-—--............__________________________________________J

1
Appendix II
Table l. Thermal Expansion of Sodium Aluminace
Temperature Decimal Qdl/lo) (Z)°c in/1623 0 0
100 0.0005 0.05
200 0.0015 0.15
300 0.0026 0.26
400 0.0041 0.41
500 0.0057 0.57
600 0.0073 0.73
700 0.0090 0.90
800 0.0105 1.05
47

48
Table 2. Thermal Exgansion 0f Negheline
Temperature Decimal (A1/10) (Z)°c in/in23 0 0
100 0.0005 0.05
200 0.0017 0.17
300 0.0030 0.30
400 0.0044 0.44
500 0.0058 0.58
600 0.0073 0.73
700 0.0092 0.92
800 0.0112h
1.12

} 49 1E
Table 3. Thermal Expansion of N2C3A5
Temperature Decimal GA1/lo) (Z)
°c 1¤/ in
23 0 0
100 0.0003 0.03
200 0.001 0.10
300 0.0018 0.18
400 0.00255 0.255
500 0.00338 0.338
600 0.0042 0.42 ,800 0.0057 0.57»
E

50 é
Table 4. Thermal Exgansion of Potassium Aluminace
Temperature Decimal (Al/10) (Z)°c in/in23 0 0
100 I 0.00105 0.105
200 0.0032 0.320
300 0.00555 0.555
400 0.00825 0.825
500 0.01115 1.115
600 0.01465 1.465
700 0.01795 1.795
800 0.02045h
2.045
SlTab1e5. Therma1 Exgansion of Ka11ogh11ite
Temperature Decimal (r¥L/10) (%)Oc man23 0 0
100 0.0007 0.07
200 0.0023 0.23
300 0.0039 0.39
400 0.00645 0.645
500 0.009175 0.9175
600 0.011725 1.1725
700 0.013725 _ 1.3725800 0.0148 1.48
