# landsat and thermal infrared imaging - nasa · 2011. landsat 6 never reached its operational...
TRANSCRIPT

# Landsat and Thermal Infrared Imaging
Terry Arvidson, Julia Barsi, Murzy Jhabvala, Dennis Reuter
Introduction
The purpose of this chapter is to describe the collection of thermal images by Landsat sensors already on orbit and to introduce the new thermal sensor to be launched in 2013. The chapter describes the thematic mapper (TM) and enhanced thematic mapper plus (ETM+) sensors, the calibration of their thermal bands, and the design and prelaunch calibration of the new thermal infrared sensor (TIRS).
Background
The current Landsat mission is to systematically image the Earth’s landmasses, building an essentially cloud-free global archive that is refreshed seasonally. However, the original mission was a demonstration of the value of space technol-ogy to Earth applications. The first satellite, Earth Resources Technology Satellite 1 (later renamed Landsat 1) was launched in 1972 with instruments covering the solar reflective band regions. Six years later, the first thermal capability was intro-duced on Landsat 3’s multispectral scanner (MSS). The thermal band’s on-orbit performance was disappointing and its operation was terminated in March 1979, one year after launch [NASA, 1979]. No further discussion is provided for the MSS thermal band due to its poor performance.
Although very little good data were acquired from the MSS thermal band, ap-plications using thermal data were starting to emerge—including thermal map-ping, plant stress, and urban/non-urban land use differentiation—and there were firm plans to try again with a thermal band on the TM, the next generation Landsat instrument. Launched in 1982 on Landsat 4 and 1984 on Landsat 5, the TM ther-mal band improves upon the MSS and, in general, does not suffer from the same problems. Landsat 4 operated successfully for over ten years, with data collection terminated in 1993. The Landsat 5 TM acquired data for over 27 years until com-munication system failures essentially ended the TM data collections in November 2011. Landsat 6 never reached its operational orbit after launching in 1993. In 1999, Landsat 7 was launched with the ETM+ instrument.
The newest Landsat mission, Landsat Data Continuity Mission (LDCM, or Landsat 8 after launch), will launch in February 2013 and carry the next genera-tion Landsat thermal imaging capability.
https://ntrs.nasa.gov/search.jsp?R=20120015404 2019-04-29T23:57:40+00:00Z
2
TM and ETM+ Design and Operation
The TM and ETM+ instruments are whiskbroom radiometers, with an oscillat-ing scan mirror in front of the telescope optics that sweeps back and forth across the field of view, roughly perpendicular to the direction of spacecraft travel (Fig-ure 1). The scan mirror sweeps the ground, projecting the energy through the tele-scope and onto the focal plane, which consists of four detectors in the TM or eight detectors in the ETM+. A scan-line corrector assembly compensates for the for-ward motion of the spacecraft during each sweep, returning adjacent sweeps to a parallel alignment.
The TM and ETM+ on-board calibration systems consist of a single on-board cavity blackbody and a black, highly emissive shutter (Figure 1) [Markham et al., 1997]. The blackbody sits off the optical axis at a constant temperature. The shut-ter, which carries the calibration lamps across the optical axis for the reflective band calibration, has on it a toroidal mirror. As the shutter sweeps across the opti-cal axis, the mirror reflects the radiation from the blackbody onto the optics and through to the cold focal plane. The non-mirror part of the shutter is coated with a high-emissivity paint and sits at the instrument ambient temperature. Outputs from thermistors located within TM and ETM+—monitoring temperatures of the indi-vidual components such as the shutter and the mirrors—are included in the down-linked data.
The cold focal plane, which includes the thermal band detector array as well as those of the shortwave infrared bands, is housed in a dewar to isolate and control the thermal environment. There is a zinc selenide window in the dewar, with an antireflective coating, to allow light to reach the detector array with maximum transmission. In the TM instruments, a contaminant, most probably ice, builds up on the dewar window over time [Helder et al., 2004]. Periodically, outgassing is performed wherein the cold focal plane is warmed up to remove the contaminant.
The TM and ETM+ thermal bands improve upon the MSS design (Table 1). The TM instruments increase the spatial resolution and correct the features that led to the poor quality of the MSS thermal data. The TM radiometric resolution has been well below 0.5 K (Table 2). For additional radiometric resolution, the ETM+ outputs two versions of the thermal data, one in high gain to improve radiometric sensitivity and one in low gain to prevent saturation. The ratio of high gain to low gain is approximately a factor of two. The actual spectral response of the thermal bands has varied due to manufacturing processes, but the TM and ETM+ thermal band requirement has always been a wide bandpass, from approximately 10.5 to 12.5 µm (Figure 2).

3
Fig. 1. The thematic mapper optical layout, from the scan mirror that whisks across the field of view to the focal planes. The shutter flag is shown in the calibration position, blocking energy from the ground and reflecting the blackbody radiance onto the cold focal plane. The shutter flag detail (inset) shows the dark surface used as a cool target and the mirror that reflects energy emit-ted by the blackbody onto the focal plane. The lenses pipe the light from the calibration lamps onto the focal planes for reflective band calibration.
Tab. 1. Landsat thermal band characteristics; Landsats 3–7 were implemented with mercury-cadmium-telluride detectors. LDCM uses quantum well infrared photodetectors.
Satellite and Sensor
Number of Detectors
Focal Plane Temperature (K)
Resolution (m)
Landsat 3 MSS 2 90 240 Landsat 4, 5 TM 4 90 120 Landsat 7 ETM+ 8 91 60 LDCM TIRS 1850 40 100
Ground'track
Cold'focal'plane
Relay'����� Primary'
focalplane
Scan'line'corrector ���������
�������������� �����
Dewar'window
Blackbody ���������Dewar
Shutter Flag Detail
Shutter
MirrorLenses

4
Fig. 2. Relative spectral responses of the Landsat thermal bands, including the new TIRS sensor.
Tab. 2. Comparison of noise equivalent change in brightness temperature (NE∆T) and ra-diometric ranges of the thematic mapper class instruments. For the TM instruments, the smaller NE∆T is when the dewar window is clear of contaminant, the larger is when contaminant build-up is at its peak. ETM+ operates in two gain states simultaneously, so the values for both states are provided here. The radiance and temperature ranges are the ranges to which the TM and ETM+ data are scaled during processing, not necessarily the native sensitivity of the instruments. The TIRS numbers are derived from requirements and pre-launch measurements.
Satellite Instrument
NE∆T at 285K (K)
Radiometric Scaling Range (W/m2 sr µm)
Useful Temperature Range
(K) Landsat-4 TM 0.22–0.32 1.238–15.300 200–340 Landsat-5 TM 0.17–0.30 1.238–15.300 200–340 Landsat-7 ETM+ 0.26
0.21 0.00–17.04 3.20–12.65
130–350 240–320
LDCM TIRS < 0.1 (to be determined) 240–360
TM and ETM+ Calibration
Calibration relates the radiance received by the sensor to the digital output of that sensor. Calibration parameters are applied during image processing to create
0
0.1
0.2
0.3
0.4
0.5
0.6
0.7
0.8
0.9
1
10 10.5 11 11.5 12 12.5 13
rela
tive
resp
onse
[]
wavelength [um]
Landsat Thermal Band Spectral Response
Landsat 4 TM Landsat 5 TM Landsat 7 ETM+
LDCM TIRS 10.8um LDCM TIRS 12.0um

5
products where the corrected digital numbers are linearly scaled to at-sensor radi-ance. In the thermal bands, apparent brightness temperature can be calculated from radiance.
The calibration parameters are initially determined from pre-launch laboratory calibration with external National Institute of Standards and Technology (NIST)-traceable radiance sources. Instrument gains and biases are used to calibrate the data so that users can convert the data to radiance using fixed calibration coeffi-cients. These gains and biases are determined using the calibration parameters, along with the responses to the blackbody and shutter flag in the internal calibra-tion system of the sensor and the temperatures of the blackbody and shutter flag.
The development of an Image Assessment System (IAS) has been essential to the knowledge of the calibration of the ETM+ [Storey et al., 1999]. Developed by the United States Geological Survey (USGS) Earth Resources Observation and Science center, the IAS includes all the functionality of the primary processing system for ETM+ data, but it also features additional analysis tools and a trending database to record calibration information. Some data from every scene processed through the primary processing system is recorded to the IAS database. An addi-tional four scenes per day are further processed through the IAS’s analysis tools and statistics on each detector for each scan of both scene content and internal calibrators are recorded to the database. In this way, the instrument gains and bi-ases can be monitored on a very short time scale, to reveal abrupt changes or slow degradations.
Initially developed for Landsat 7, the IAS has proven to be invaluable in moni-toring the stability of the ETM+ and in 2008, the capability to process TM data was added [Micijevic and Morfitt, 2010]. Early attempts at long-term TM trending involved using one scene every 60 days; with the TM IAS, data from at least one scene per day are available. The populated TM IAS database increased the knowl-edge of the instruments’ long-term behavior, in absolute gain and offset for exam-ple, and allowed for the monitoring of short-term trends in relative gain and out-gassing behavior.
Thermal band vicarious calibration provides an independent means of measur-ing on-orbit sensor performance using well-instrumented water bodies. There was a single attempt at vicarious calibration for each of the TM instruments soon after their launches [Schott, 1988] though further validation attempts were not regularly scheduled again until the launch of Landsat 7. Vicarious calibration was per-formed immediately after the ETM+ launch and continues to this day. Since 1999, four unmanned instrumented buoys on Lake Tahoe record the surface-leaving ra-diance every two minutes [Hook et al., 2004]. Another unmanned station was es-tablished in 2007 on the Salton Sea. Manned campaigns on Lakes Ontario and Erie in support of ETM+ began just after launch and, soon after, teams were de-ploying in support of Landsat 5 TM as well [Barsi et al., 2003].
More recently, the network of the National Buoy Data Center archive has been used to increase the extent of the vicarious calibration capabilities, both spatially and temporally. These buoys record hourly subsurface water temperature as well
6
as meteorological data. Padula and Schott [2010] developed methods for using this archive for Landsat 5 TM and Schott et al. [2012] extended the vicarious calibra-tion method for use with Landsat 4 TM.
The vicarious calibrations track the absolute calibration of the sensor data and have spawned several updates of the calibration parameters. Adding the relatively hot Salton Sea site expanded the temperature range of the vicarious data and un-covered gain errors in the prelaunch calibration parameters that had been previ-ously undetected.
TM and ETM+ Performance
Beginning with Landsat 4, the Landsat thermal bands have been generally well-behaved. The TM and ETM+ thermal systems are designed to rely on the stability of the internal calibration systems as opposed to the bands themselves, though in most cases the thermal band focal planes are as stable as the calibration system. For the TM, it is necessary to rely on scene-by-scene calibration of the thermal bands using the calibration systems, due to the dewar window contamination. Outgassing restores the system to its previous sensitivity, indicating that the focal plane itself is stable. Because of the contamination, the gain of the TM instru-ments could drop as much as 40% between outgassings [Barsi et al., 2007]. The effect of the decreasing gain is accounted for in the calibration processing, so the decrease does not inherently result in a calibration error. It does, however, reduce the sensitivity of the detectors; thus the NE∆T is presented as a range for Landsats 4 and 5 in Table 2.
For ETM+, the contamination is not an issue and the average responsivity of the cold focal plane has been stable since launch to within 0.2% for gain and 0.4% for offset [Barsi et al., 2009]. One thermal band detector did change relative to the others by about 1%, perhaps due to a localized contamination.
Only two updates to the calibration parameters have been made as a result of actual instrument change. The Landsat 5 TM offset was updated to reflect a 0.092 W/m2 sr µm bias error seen in the vicarious calibration results starting in 1999 [Barsi et al., 2007]. With the addition of the historical buoy data, this change was determined to have actually occurred in the early part of 1997 and was revised to 0.11 W/m2 sr µm [Schott et al., 2012]. Records of spacecraft and instrument be-havior from that time period are incomplete, so while it is suspected that an event occurred within the instrument to cause the offset change, there is no definitive proof of what it was. The Landsat 4 TM bias was also updated as a result of a change in the instrument [Schott et al., 2012]. The simple calibration model used for TM does not account for changing instrument temperatures and so a change in the Landsat 4 TM instrument operating temperature, resulting after a long period of non-use, manifested itself as a change in instrument offset. The 0.43 W/m2 sr µm offset error was corrected in the processing system in 2011.
7
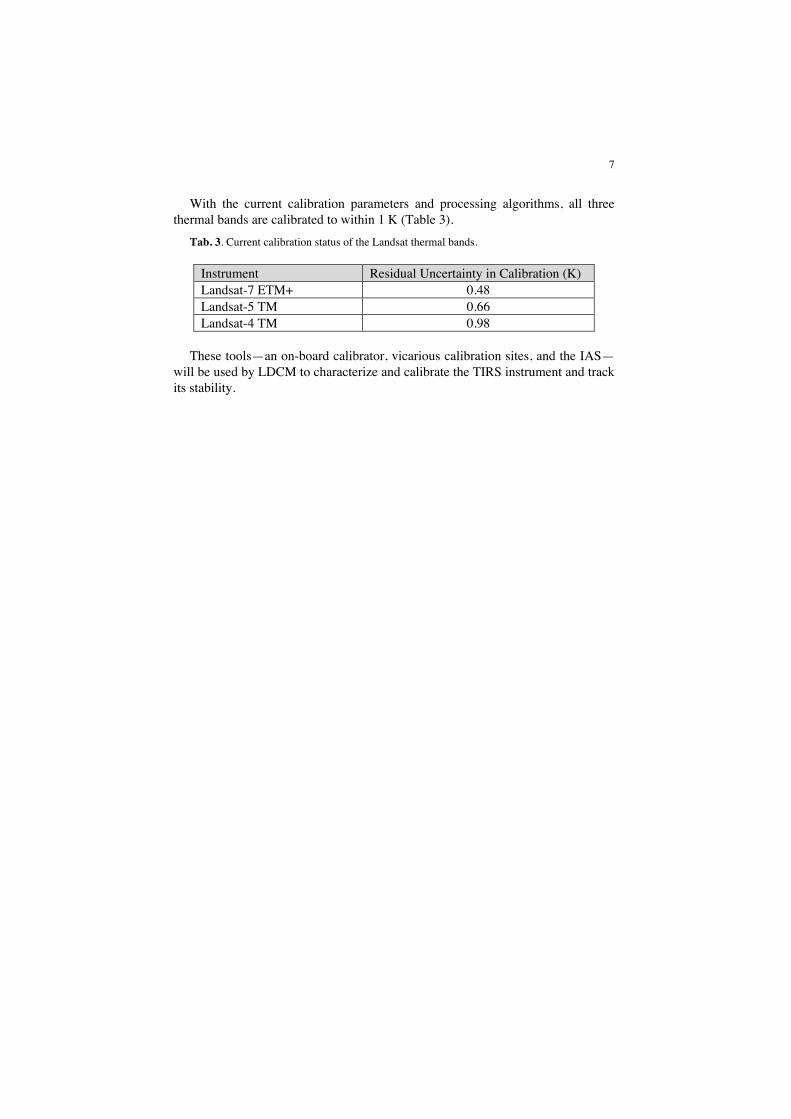
With the current calibration parameters and processing algorithms, all three thermal bands are calibrated to within 1 K (Table 3).
Tab. 3. Current calibration status of the Landsat thermal bands.
Instrument Residual Uncertainty in Calibration (K) Landsat-7 ETM+ 0.48 Landsat-5 TM 0.66 Landsat-4 TM 0.98
These tools—an on-board calibrator, vicarious calibration sites, and the IAS—
will be used by LDCM to characterize and calibrate the TIRS instrument and track its stability.
8
LDCM (Landsat 8) TIRS Instrument Description
The Landsat Data Continuity Mission (Figure 3) is scheduled to launch in Feb-ruary 2013 with two instruments that will be operated simultaneously: 1) the op-erational land imager (OLI) that images in the visible, near-infrared, and short-wave infrared; and 2) the thermal infrared sensor (TIRS). In keeping with the Landsat continuity directive, the LDCM specifications are compatible and compa-rable with most of the heritage Landsat specifications, including ground resolu-tion, swath width, radiometric and geometric accuracy, and bandwidths.
Both instruments introduce a technology new to the Landsat program—pushbroom sensor operation—in which rows of detectors for each channel are swept in the along-track direction by spacecraft motion. For each channel, an im-age is built-up by concatenating successive single-row measurements. Previous Landsat instruments used whiskbroom operations, in which a few detectors for each channel are swept across track by a system of moving mirrors as the space-craft travels in the along-track direction. Because, in a pushbroom sensor, each spatial element has its own detector, integration times can be much longer, which leads to improved noise performance. Furthermore, unlike in whiskbroom sensors, in pushbroom sensors there is no need for a large, continuously moving scan mir-ror or for the scan-line corrector, eliminating sources of jitter and possible failure modes.
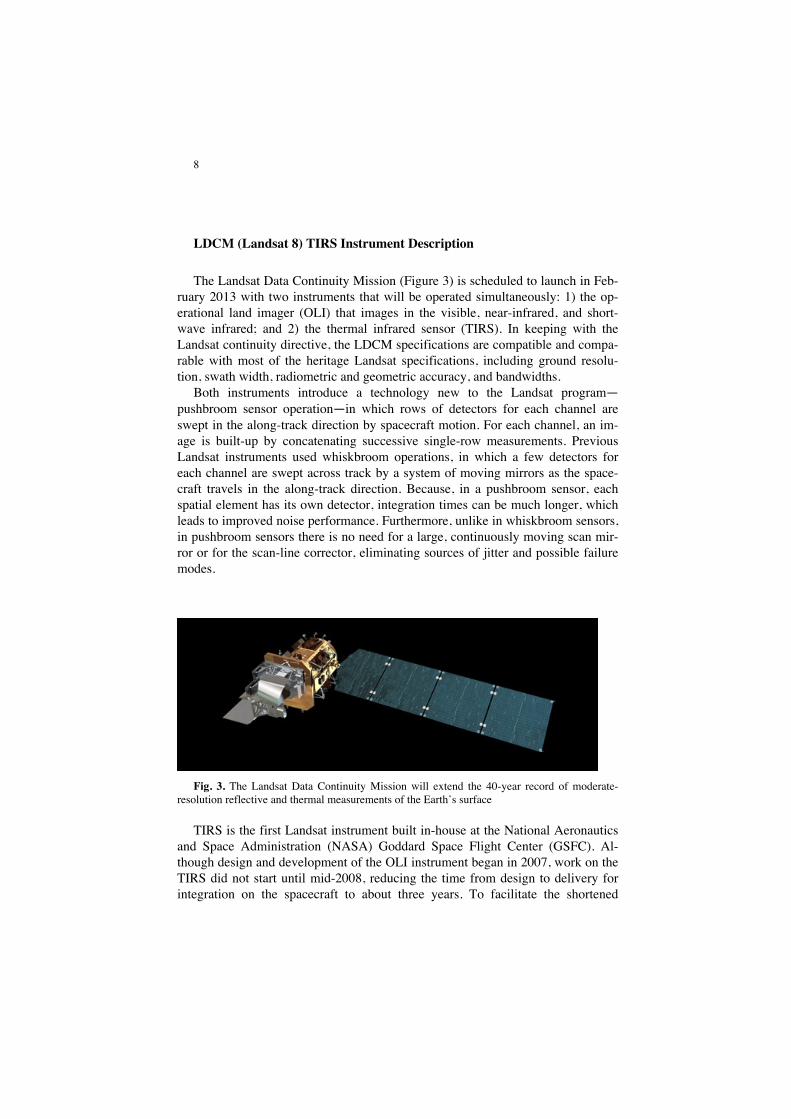
Fig. 3. The Landsat Data Continuity Mission will extend the 40-year record of moderate-resolution reflective and thermal measurements of the Earth’s surface
TIRS is the first Landsat instrument built in-house at the National Aeronautics and Space Administration (NASA) Goddard Space Flight Center (GSFC). Al-though design and development of the OLI instrument began in 2007, work on the TIRS did not start until mid-2008, reducing the time from design to delivery for integration on the spacecraft to about three years. To facilitate the shortened
9
schedule, TIRS was built as a Class C instrument [NASA, 2004]—reducing the re-quired end-of-life reliability somewhat and simplifying the review process—and with a 3.25-year design life. In contrast, the OLI is a Class B instrument with a five-year design life. Technology improvements over previous Landsat thermal capabilities include: pushbroom mode, two spectral channels, a cooled optical path to reduce background noise, and quantum well infrared photodetector (QWIP) ar-rays.
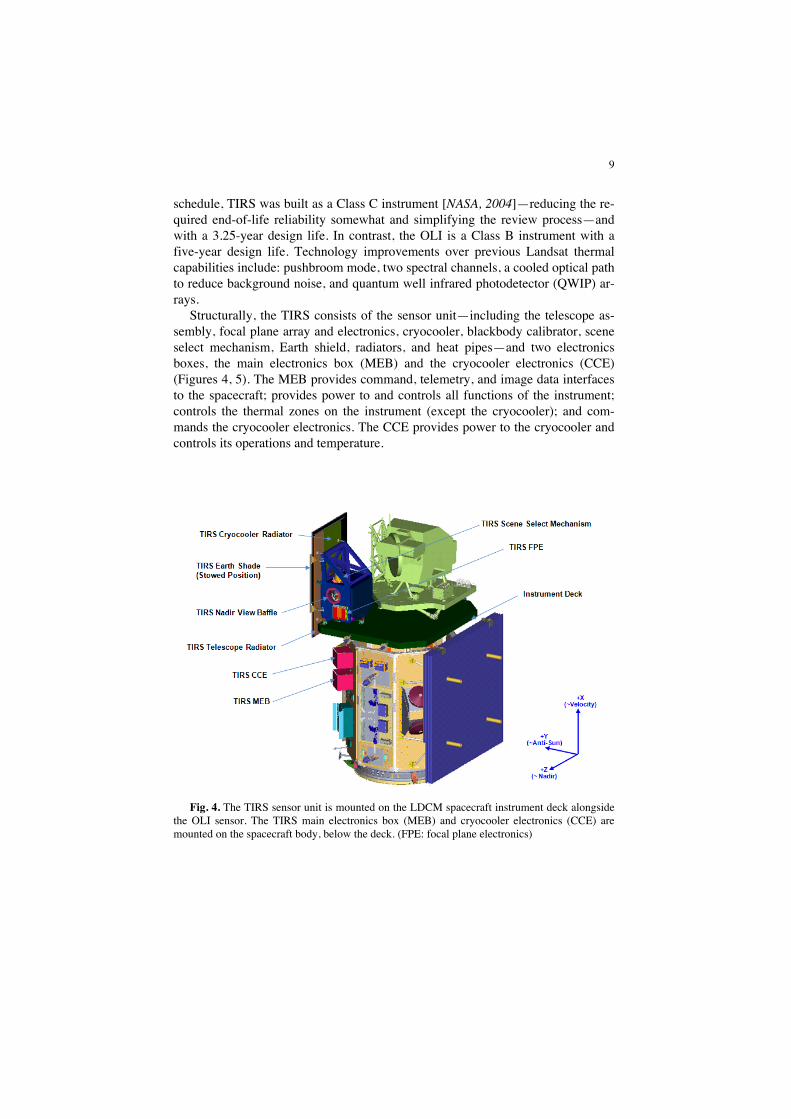
Structurally, the TIRS consists of the sensor unit—including the telescope as-sembly, focal plane array and electronics, cryocooler, blackbody calibrator, scene select mechanism, Earth shield, radiators, and heat pipes—and two electronics boxes, the main electronics box (MEB) and the cryocooler electronics (CCE) (Figures 4, 5). The MEB provides command, telemetry, and image data interfaces to the spacecraft; provides power to and controls all functions of the instrument; controls the thermal zones on the instrument (except the cryocooler); and com-mands the cryocooler electronics. The CCE provides power to the cryocooler and controls its operations and temperature.
Fig. 4. The TIRS sensor unit is mounted on the LDCM spacecraft instrument deck alongside the OLI sensor. The TIRS main electronics box (MEB) and cryocooler electronics (CCE) are mounted on the spacecraft body, below the deck. (FPE: focal plane electronics)

10
Fig. 5. Block diagram showing interfaces among major parts of TIRS and the spacecraft, in-cluding light paths and relative temperatures along the heat pipes. (SSM: scene select mirror, SCA: sensor chip assembly, TMU: thermal unit, HSI: high speed interface, L: lens, CDH: com-mand and data handling)
TIRS has 100 m spatial resolution, not as fine as the ETM+ at 60 m, but better than the TM sensors at 120 m thermal band resolution (Table 1). To produce the 185 km swath width of TIRS, 1850 pixels are required for each row in each chan-nel. At a ground speed of 7 km/sec, it requires approximately 0.014 seconds to move 100 meters and 70 effective rows of pixels are produced in each second for each channel. TIRS uses a 3.4 millisecond integration time and the resultant 25 meter image motion, when convolved with the instrument spatial function, does not excessively broaden the spatial resolution. The 12-bit digitized output data are required to produce precise temperature measurements over the range of 240 to 360 K—a temperature range slightly larger than previous Landsat thermal bands.
There are two spectral channels, centered near 10.9 and 12 µm, effectively splitting the heritage TM/ETM+ band into two (Figure 2, Table 4). The two chan-nels—a “split-window” approach—allow for compensation of the thermal effects of the atmospheric column in transforming at-satellite radiances into surface tem-peratures [Prabhakara et al., 1974; Kerr at al., 1992]. To accomplish this with the ETM+ single thermal band, an atmospheric propagation model and supplementary atmospheric data must be used.

11
Tab. 4. TIRS band definitions and maximum radiance error [Reuter et al., 2010, 2011].
Channel Band 50% response lower band edge (µm)
50% response upper band edge (µm)
Center wavelength
(µm)
Maximum allowed
Radiance error W/(m2 sr µm)
10 Thermal 1 10.6 11.2 10.9 0.059 11 Thermal 2 11.5 12.5 12 0.049 The TIRS telescope uses a temperature-stabilized four-element refractive lens
system—three germanium (Ge) elements and one zinc selenide element—to pro-duce nearly diffraction-limited images at the focal plane (Figure 6). A scene select mechanism (SSM) allows the field of regard to be pointed in the nadir direction for surface imaging, to a temperature-controlled on-board blackbody for radiomet-ric calibration, and to a deep space view for thermal background subtraction.
Fig. 6. TIRS optics showing the SSM, lens, focal plane and cryocooler assemblies. (FPA: fo-cal plane array)
To reduce the thermal background, the TIRS optics are cooled to 185 K and temperature-stabilized to ~0.1 K, using a radiative cooler and heaters controlled by the MEB. In addition, the first stage of the cryocooler is used to cool the focal plane enclosure to ~100 K. The optics temperature directly affects the focus of the Ge elements, because the Ge index of refraction is a strong function of tempera-ture [Reuter et al., 2010, 2011]. This coupling provides a means of adjusting the focus. The blackbody calibrator temperature is controlled by the MEB and can be set from 270 to 330 K, within an accuracy of 0.1 K. The focal plane array is
12
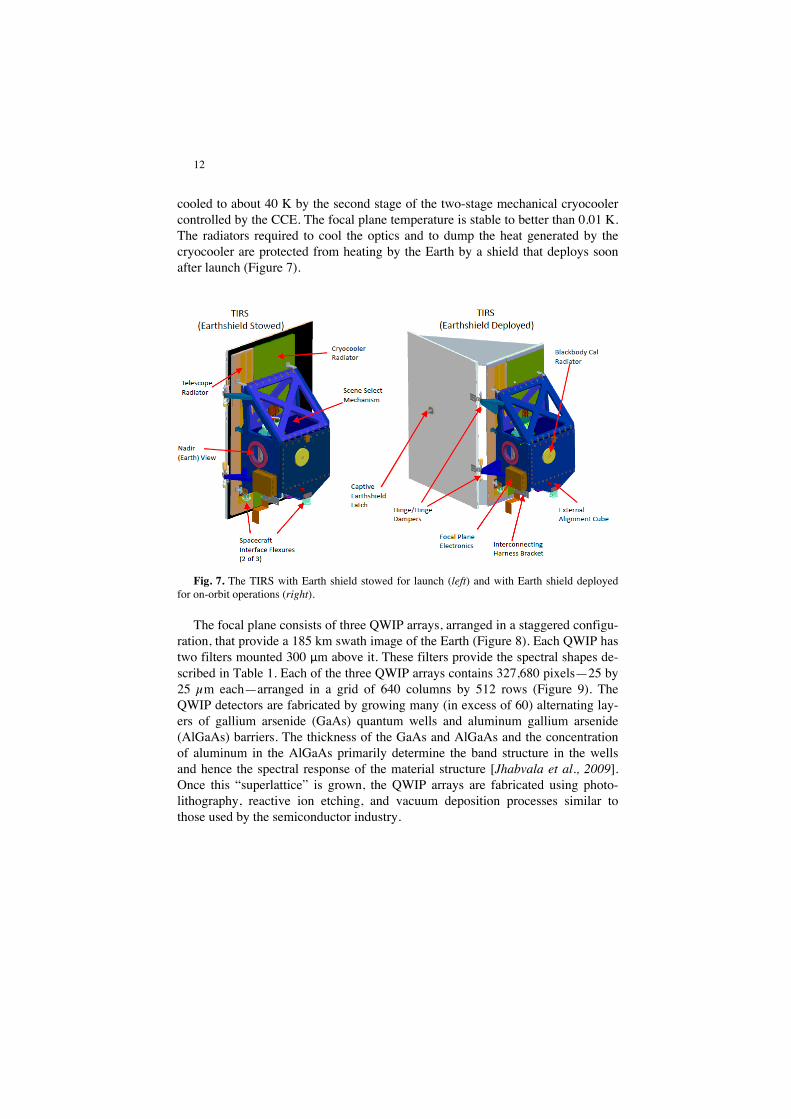
cooled to about 40 K by the second stage of the two-stage mechanical cryocooler controlled by the CCE. The focal plane temperature is stable to better than 0.01 K. The radiators required to cool the optics and to dump the heat generated by the cryocooler are protected from heating by the Earth by a shield that deploys soon after launch (Figure 7).
Fig. 7. The TIRS with Earth shield stowed for launch (left) and with Earth shield deployed for on-orbit operations (right).
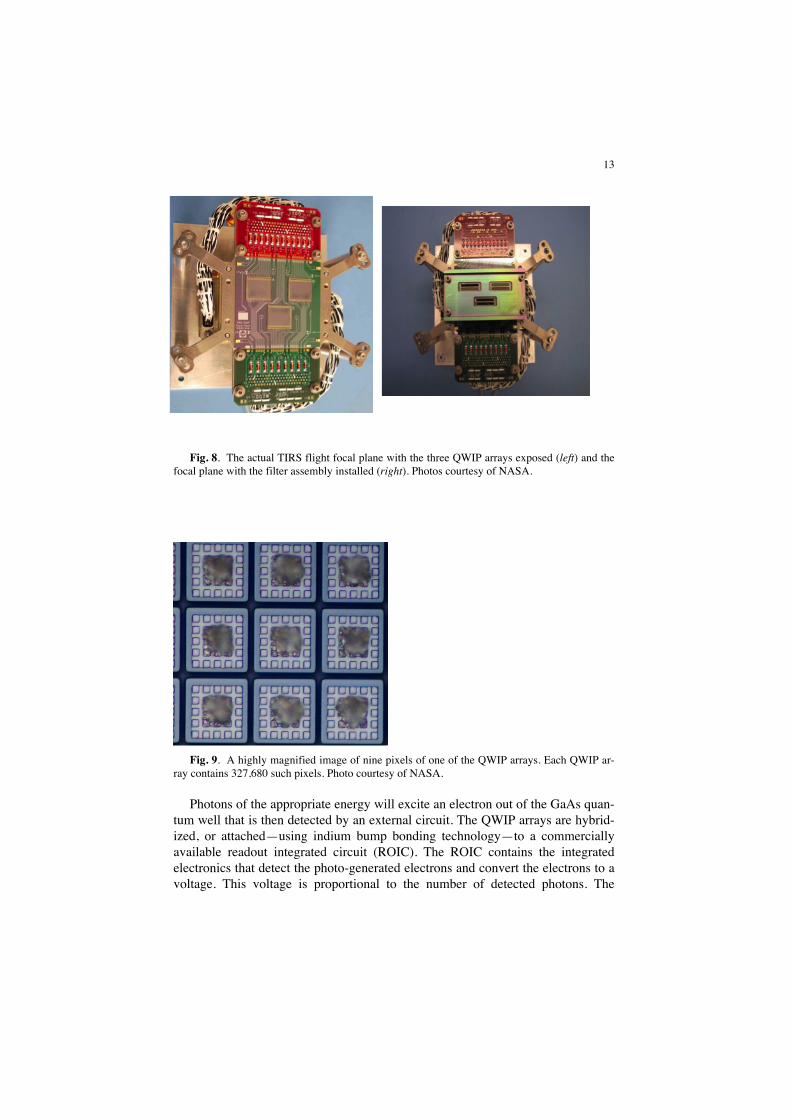
The focal plane consists of three QWIP arrays, arranged in a staggered configu-ration, that provide a 185 km swath image of the Earth (Figure 8). Each QWIP has two filters mounted 300 µm above it. These filters provide the spectral shapes de-scribed in Table 1. Each of the three QWIP arrays contains 327,680 pixels—25 by 25 µm each—arranged in a grid of 640 columns by 512 rows (Figure 9). The QWIP detectors are fabricated by growing many (in excess of 60) alternating lay-ers of gallium arsenide (GaAs) quantum wells and aluminum gallium arsenide (AlGaAs) barriers. The thickness of the GaAs and AlGaAs and the concentration of aluminum in the AlGaAs primarily determine the band structure in the wells and hence the spectral response of the material structure [Jhabvala et al., 2009]. Once this “superlattice” is grown, the QWIP arrays are fabricated using photo-lithography, reactive ion etching, and vacuum deposition processes similar to those used by the semiconductor industry.
13
Fig. 8. The actual TIRS flight focal plane with the three QWIP arrays exposed (left) and the focal plane with the filter assembly installed (right). Photos courtesy of NASA.
Fig. 9. A highly magnified image of nine pixels of one of the QWIP arrays. Each QWIP ar-ray contains 327,680 such pixels. Photo courtesy of NASA.
Photons of the appropriate energy will excite an electron out of the GaAs quan-tum well that is then detected by an external circuit. The QWIP arrays are hybrid-ized, or attached—using indium bump bonding technology—to a commercially available readout integrated circuit (ROIC). The ROIC contains the integrated electronics that detect the photo-generated electrons and convert the electrons to a voltage. This voltage is proportional to the number of detected photons. The
14
QWIP/ROIC hybrid is then bonded to a custom-developed silicon substrate that contains metal traces. The QWIP hybrids are wire bonded to the traces on the sili-con substrate and this subassembly is attached to an invar baseplate. Also mounted on the baseplate are two printed circuit (PC) boards located at either end of the silicon substrate. Wire bonds connect the silicon substrate traces to these PC “daughter” boards. Connectors on these daughter boards provide the interface be-tween the QWIP hybrids and the external focal plane electronics.
Once the filters are positioned over the focal plane, the two infrared bands and the dark pixel regions are precisely defined in each QWIP hybrid—down to the individual pixels as shown in Figures 10 and 11 [Jhabvala et al., 2010].

15
Fig. 10. The focal plane layout illustrating the infrared band locations and the specific pixel columns that participate in the image collection and reconstruction. The 1920 total row pixels (3 x 640) are reduced to 1850 pixels by including array overlap and eliminating the first and last 8 columns. The areas of the hybrids not directly under the filters are shielded from illumination. (GSD: ground sample distance)
16
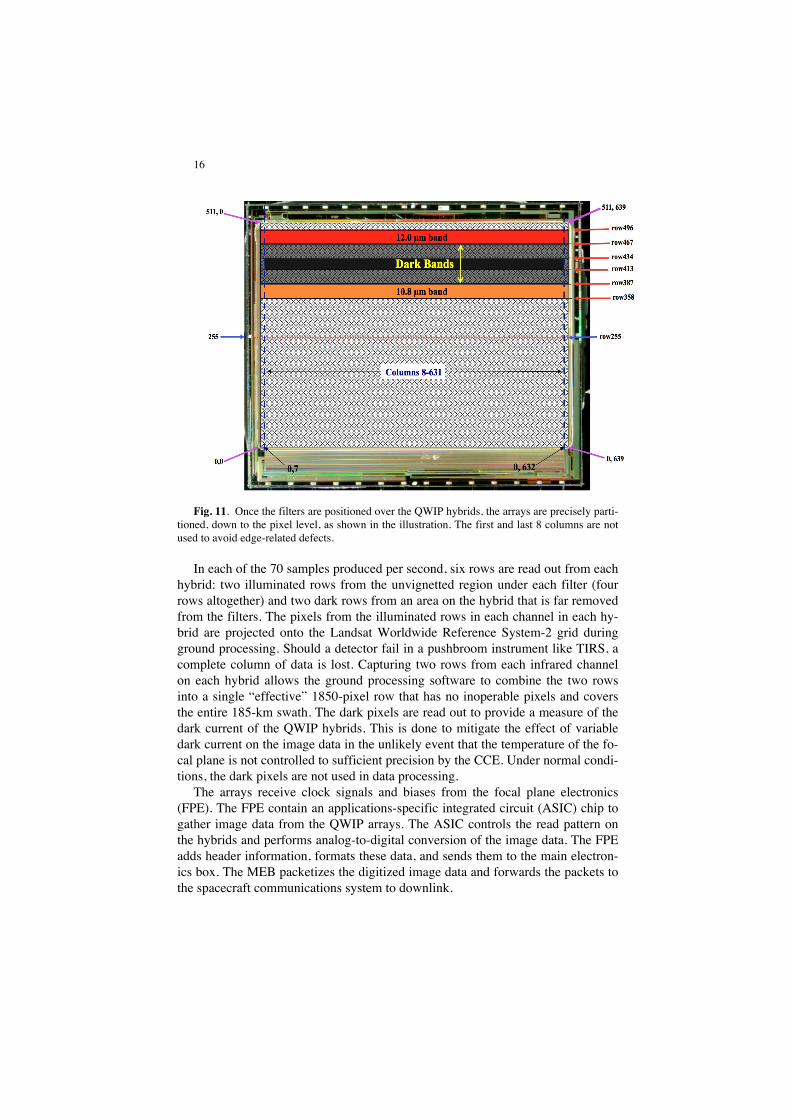
Fig. 11. Once the filters are positioned over the QWIP hybrids, the arrays are precisely parti-
tioned, down to the pixel level, as shown in the illustration. The first and last 8 columns are not used to avoid edge-related defects.
In each of the 70 samples produced per second, six rows are read out from each hybrid: two illuminated rows from the unvignetted region under each filter (four rows altogether) and two dark rows from an area on the hybrid that is far removed from the filters. The pixels from the illuminated rows in each channel in each hy-brid are projected onto the Landsat Worldwide Reference System-2 grid during ground processing. Should a detector fail in a pushbroom instrument like TIRS, a complete column of data is lost. Capturing two rows from each infrared channel on each hybrid allows the ground processing software to combine the two rows into a single “effective” 1850-pixel row that has no inoperable pixels and covers the entire 185-km swath. The dark pixels are read out to provide a measure of the dark current of the QWIP hybrids. This is done to mitigate the effect of variable dark current on the image data in the unlikely event that the temperature of the fo-cal plane is not controlled to sufficient precision by the CCE. Under normal condi-tions, the dark pixels are not used in data processing.
The arrays receive clock signals and biases from the focal plane electronics (FPE). The FPE contain an applications-specific integrated circuit (ASIC) chip to gather image data from the QWIP arrays. The ASIC controls the read pattern on the hybrids and performs analog-to-digital conversion of the image data. The FPE adds header information, formats these data, and sends them to the main electron-ics box. The MEB packetizes the digitized image data and forwards the packets to the spacecraft communications system to downlink.
17
The MEB controls the scene mirror position and provides mirror position data to the spacecraft for incorporation into the telemetry. The scene mirror can be po-sitioned with an accuracy better than 10 µradians (3 σ) in order to meet the geo-detic requirement that pixel location on the ground be known to 18 m (27 µradi-ans).
The FPE, ASIC, and CCE software are loaded from electrically erasable pro-grammable read-only memory, which can be updated from the ground. The MBE uses field-programmable gate arrays for its operations.
Once turned on, the TIRS instrument continually gathers image data but these data are recorded and brought to the ground only on command. Nominally, this will be whenever the OLI is acquiring data. The two data sets are merged onboard, downlinked in a single data stream, and processed into a single product. None of the calibration modes of the TIRS require maneuvering of the satellite, although TIRS will collect image data during OLI calibrations that do require maneuvers.
The LDCM will collect and archive the global, synoptic, and repetitive OLI and TIRS imagery and will electronically distribute data products to the general public on a no-cost basis. USGS is responsible for the ground system, including the Ground Network Element, the Mission Operations Element, and the Data Processing and Archive System (DPAS). The DPAS consists of several subsys-tems that produce the Level 0 data and associated metadata, and generate the Level 1 radiometrically calibrated and orthorectified images of the Earth’s surface. It also includes the IAS developed for OLI and TIRS. The processing algorithms are being developed by USGS and NASA GSFC calibration and validation teams.
TIRS calibration and pre-launch performance
The existing suite of thermal data calibration and validation tools will be ap-plied to the TIRS data set. Vicarious calibrations will continue to play an impor-tant role. The IAS has been updated to process pushbroom data, after proving the concept with data from the Earth Observer-1 advanced land imager, also a push-broom instrument [Micijevic and Morfitt, 2010]. Additionally, there are new ca-pabilities on the LDCM for calibration and for validation of TIRS. Table 5 lists the types of calibrations that will be used by TIRS on orbit.

18
Tab. 5. TIRS calibration data types and their application.
Detector-to-Detector Relative Calibration
Long Term Stability (Change
Monitoring)
Absolute Cali-bration (Geo-
physical Parame-ter Retrieval)
Dark (Deep Space) X X X Blackbody X X X Vicarious Sites X X Band-to-Band Reg-
istration (Within and Between Sensors
Geodetic Accuracy
Focus
Geometric Super-sites
X X
Focus Check Sites X For normal radiometric calibration, the scene mirror uses the scene select
mechanism to change its field of view from a nadir Earth view to the on-board blackbody calibrator for 60 seconds and then to deep space for 60 seconds. This is done twice each orbit, before the first imaging interval and after the last imaging interval (the Landsat 4–7 thermal bands perform similar calibrations twice each data line). The TIRS is capable of imaging up to 35 minutes between calibration sequences. The data acquired during these calibration cycles is used during ground processing to correct offsets and gains that may vary over time. There is a re-quirement for less than 0.7% drift between calibrations. As noted by Reuter et al. [2010, 2011], the QWIP array is in itself temporally stable, thus facilitating ra-diometric stability between calibrations.
The normal calibration sequence described above is replaced on a periodic ba-sis by two other calibration modes: 1) an integration time sweep calibration during the blackbody portion of the normal calibration, and 2) a series of normal calibra-tions during a blackbody temperature sweep. If required, a stability calibration may be performed in which the normal calibration sequence is repeated, every 5 minutes, for a total of 10 times across 50 minutes.
As the TIRS will image coincidentally with the OLI, the TIRS will collect data during the OLI calibrations. TIRS-driven acquisitions will include ocean and night collects. The IAS performs long-term trending, characterization, and calibration of the TIRS data and updates the processing parameters as needed.
Calibration has been performed at the component, subsystem, and instrument level throughout the TIRS fabrication process. Comprehensive requirements veri-fication, and calibration and measurements, were made in a thermal vacuum envi-ronment prior to shipment of TIRS for integration on the spacecraft. These meas-urements employed NIST-traceable radiometric sources. A detailed description of the results of these tests is beyond the scope of this chapter and will be published later. In general, all requirements were met with a few minor exceptions. Model-

19
ing studies indicate that these exceptions will not impact the TIRS data quality. A high level summary of the overall performance is as follows:
Radiometric accuracy. The requirements of 2% accuracy for temperatures be-tween 260 and 330 K and 4% for the rest of the range from 240 to 360 K appear to be met. The absolute accuracy is obtained using NIST-traceable laboratory sources in instrument-level thermal vacuum testing. Final verification of the ra-diometric accuracy will take place on orbit through vicarious methods.
Noise. This measure includes noise equivalent radiance, banding, streaking, and the like. The noise is typically less than the requirements shown in Table 4 by a factor of 5 or more. This corresponds to a NE∆T of <0.1 K at 285 K. The band-ing, streaking, stability, and coherent noise performance is similarly good.
Spatial. There are slight deficiencies in some pixels’ edge slope and edge ex-tent, but these do not significantly degrade the image quality and will not affect the science results.
Geometric. The various geometric requirements are generally met, although the measured pointing stability as the instrument temperature is varied over its quali-fication range is somewhat worse than desired. The stability requirements, how-ever, are near the limits of measurement capability and it is probable that chamber vibrations and ground support equipment effects are contributing to the instability.
Spectral. The majority of the spectral requirements are met, although there are some very minor deficiencies in the pixel average response and in-band spectral variation. These are mitigated by the spectral uniformity of the atmosphere and surface in the TIRS spectral bands and no science impact is expected.
Scattering, stray light, etc. These parameters meet requirements. In some cases, the calibration equipment was not capable of illuminating the extended fo-cal array area but analytical modeling results indicate that the regions not included will not contribute to the signal in flight.
Except where indicated above, all the instrument parameters were stable over the range of thermal conditions and electrical variability expected in flight.
Conclusion
The TM and ETM+ instruments have proven to be very stable. With the current calibration data, TM and ETM+ products are accurate with respect to thermal ra-diance.
The TIRS provides thermal data continuity with previous Landsat sensors. As of August 2012, the TIRS is in Arizona at the spacecraft contractor, Orbital Sci-ences Corporation (Figures 12, 13). It has been integrated with the spacecraft and is undergoing final testing before shipment to the launch site. The TIRS promises improved performance and more challenging calibration.

20
Fig. 12. (Left) The fully assembled TIRS primary structure, with radiators and Earth shield. (Photo courtesy of NASA.) (Right) The TIRS, shrouded in gold thermal blanketing, is mounted on the top left of the LDCM spacecraft (nadir view is to the left). The OLI is on the right of the payload deck, with white blanketing. Photo credit: Orbital Sciences Corp.

21
Fig. 13. Montage of actual photographs of TIRS hardware. Photos courtesy of NASA.
Acknowledgements
Work described in this chapter was performed under NASA Contracts NNG09HP18C/Task 061 and NNG09HP08C. The authors would like to thank all partners in the LDCM mission. In particular, they would like to express their

22
deepest gratitude to the members of the TIRS development, analysis, fabrication, and test teams without whose exceptional efforts TIRS would not exist.
References
Barsi, J. A., J. R. Schott, F. D. Palluconi, D. L. Helder, B. L. Markham, and G. Chander (2003), Landsat TM and ETM+ thermal band calibration, Canadian Journal of Remote Sensing, 29(2), 141–153.
Barsi, J. A., S. J. Hook, J. R. Schott, N. G. Raqueno, B. L. Markham (2007), Landsat-5 Thematic Mapper Thermal Band Calibration Update, IEEE Geoscience and Remote Sensing Letters, 4(4), 552–555, doi: 10.1109/LGRS.2007.896322.
Barsi, J. A., B. L. Markham, J. R. Schott, S. J. Hook, and N. G. Raqueno (2009), Landsat-7 and Landsat-5 thermal band calibration updates, paper pre-sented at SPIE Earth Observing Systems XIV, in Proceedings SPIE Vol. 7452, eds. J. J. Butler, X. Xiong, X. Gu, 21 August 2009, doi: 10.1117/12.828501.
Helder, D. L., E. Micijevic (2004), Landsat-5 Thematic Mapper outgassing ef-fects, IEEE Transactions on Geoscience and Remote Sensing, 42(12), 2717–2729, doi: 10.1109/TGRS.2004.839086.
Hook, S. J., G. Chander, J. A. Barsi, R. E. Alley, A. Abtahi, F. D. Palluconi, B. L. Markham, R. C. Richards, S. G. Schladow, D. L. Helder (2004), In-flight vali-dation and recovery of water surface temperature with Landsat-5 thermal infrared data using an automated high-altitude lake validation site at Lake Tahoe, IEEE Transactions on Geoscience and Remote Sensing, 42(12), 2767–2776, doi: 10.1109/TGRS.2004.839092.
Jhabvala, M., D. Reuter, K. Choi, C. Jhabvala, M. Sundaram (2009), QWIP-based thermal infrared sensor for the Landsat Data Continuity Mission, Infrared Physics & Technology, 52(6), 424–429.
Jhabvala, M., D. Reuter, K. Choi, M. Sundaram, C. Jhabvala, A. T. La, A. Waczynski, and J. Bundas (2010) The QWIP focal plane assembly for NASA’s Landsat Data Continuity Mission, paper presented at SPIE Defense, Security, and Sensing, in Proceedings SPIE Vol. 7660, Infrared Technology and Applications XXXVI, eds. B. F. Andresen, G. G. Gulop, P. R. Norton, 3 May 2010.
Kerr, Y. H., J. P. Lagouarde, and J. Imbernon (1992) Accurate land surface temperature retrieval from AVHRR data with use of an improved split window al-gorithm, Remote Sensing of Environment, 41(2-3), 197-209, doi: 10.1016/0034-4257(92)90078-X
Markham, B. L., W. C. Boncyk, D. L. Helder, J. L. Barker (1997), Landsat-7 Enhanced Thematic Mapper Plus radiometric calibration, Canadian Journal of Remote Sensing, 23(4), 318–332.
Micijevic, E. and R. Morfitt (2010) Operational calibration and validation of Landsat Data Continuity Mission (LDCM) sensors using the Image Assessment System (IAS), paper presented at IGARSS 2010, 25–30 July 2010.
23
NASA (1979), Landsat-3 MSS band 5 (thermal) data, NASA Landsat Newslet-ter, 25, 1–2.
NASA (2004), Risk classification for NASA payloads, NASA Procedural Re-quirement 8705.4 Appendix B, NASA Office of Safety and Assurance, http://nodis3.gsfc.nasa.gov/displayDir.cfm?Internal_ID=N_PR_8705_0004_&page_name=AppendixB (accessed 29 June 2012).
Padula, F. P. and J. R. Schott (2010), Historic calibration of the thermal infra-red band of Landsat-5 TM, Photogrammetric Engineering & Remote Sensing, 76(11), 1225–1238.
Prabhakara, C., G. Dalu, and V. G. Kunde (1974) Estimation of sea surface temperature from remote sensing in the 11 to 13-µm window region, Journal of Geophysical Research, 79, 5039-5044, doi: 10.1029/JC079i033p05039.
Reuter, D., C. Richardson, J. Irons, R. Allen, M. Anderson, J. Budinoff, G. Casto, C. Coltharp, P. Finneran, B. Forsbacka, T. Hale, T. Jennings, M. Jhabvala, A. Lunsford, G. Magnuson, R. Mills, T. Morse, V. Otero, S. Rohrbach, R. Smith, T. Sullivan, Z. Tesfaye, K. J. Thome, G. Unger, P. Whitehouse (2010) The Ther-mal Infrared Sensor on the Landsat Data Continuity Mission, in Proceedings of IEEE International Geoscience and Remote Sensing Symposium (IGARSS) 2010, 754–757, doi:10.1109/IGARSS.2010.5653746
Reuter, D., J. Irons, A. Lunsford, M. Montanaro, F. Pellerano, C. Richardson, R. Smith, Z. Tesfaye, K. Thome (2011), The Operational Land Imager (OLI) and the Thermal Infrared Sensor (TIRS) on the Landsat Data Continuity Mission (LDCM), in Algorithms and Technologies for Multispectral, Hyperspectral, and Ultraspectral Imagery XVII, eds. S. S. Shen, P. E. Lewis, Proc. Of SPIE, 8048.
Schott, J. R. (1988), Thematic Mapper, Band 6, radiometric calibration and as-sessment, in Proceedings, Recent Advances in Sensors, Radiometry, and Data Processing for Remote Sensing, SPIE 924, 6–8 April 1988, 72–88.
Schott, J. R., S. J. Hook, J. A. Barsi, B. L. Markham, J. Miller, F. P. Padula, N. G. Raqueno (2012), Thermal infrared radiometric calibration of the entire Landsat 4, 5, and 7 archive (1982–2010), Remote Sensing of Environment, doi:10.1016/j.rse.2011.07.022
Storey, J. C., R.A. Morfitt, P. R. Thorson (1999), Image processing on the Landsat 7 image assessment system, paper presented at 1999 ASPRS Annual Con-ference, From Image to Information, Portland, Oregon, May 17–21, 1999, Pro-ceedings: Bethesda, Maryland, American Society of Photogrammetry and Remote Sensing, CD-ROM, 1 disc, 743–758.