© lloyd’s 1 © lloyd’s 1 sharing data analysis between r and non-r users
TRANSCRIPT

© Lloyd’s 1
< Picture to go here >
© Lloyd’s 1
Sharing Data AnalysisBetween R and non-R Users

© Lloyd’s 2
Sharing Data Analysis
Overview
► Lloyd’s Internal Model
► The Problem
► R Analysis
► Excel Analysis
► Reports
► Future Work
► Acknowledgements

© Lloyd’s 3
► Generate stochastic insurance losses
► Apply to the Lloyd’s Market
► Output results
► Analyse output and generate reports
Lloyd’sInternalModel
~185GB per run

© Lloyd’s 4
The Problem
► Limited sharing
► Repetition
CSV
► Untested
► Undocumented
© Lloyd’s 5
R Analysis Analysis & Reporting Tools (ART)
► R Packages
► Continuous Integration
► R Server
► Excel Add-In

© Lloyd’s 6
R Analysis Analysis
InformationName, Description, Author, Date
DatasetsInputs and Results (by run ID)
External (GitHub: by repo & commit)
ContentCode to Execute (wrapped in a function)Standard Output (data.frame/data.table)
FormatBy Column, Row or Cell
Labels (text, number, percent)

© Lloyd’s 7
An analysis is an S4 class
► Create using new()
R Analysis
#' Top n Syndicates#' #' The n largest syndicates based on benchmark capital#' #' @usage top_n_syndicates#' @format An ART analysis#' #' @param Run_Request A CCK run request ID for a syndicate run#' @param n The number of syndicates#' #' @author Chad Goymer \email{chad.goymer@@lloyds.com}#' @exporttop_n_syndicates <- new("analysis", name = "Top n Syndicates", description = "The n largest syndicates based on benchmark capital", author = "Chad Goymer", date_created = "2014-08-13")
© Lloyd’s 8
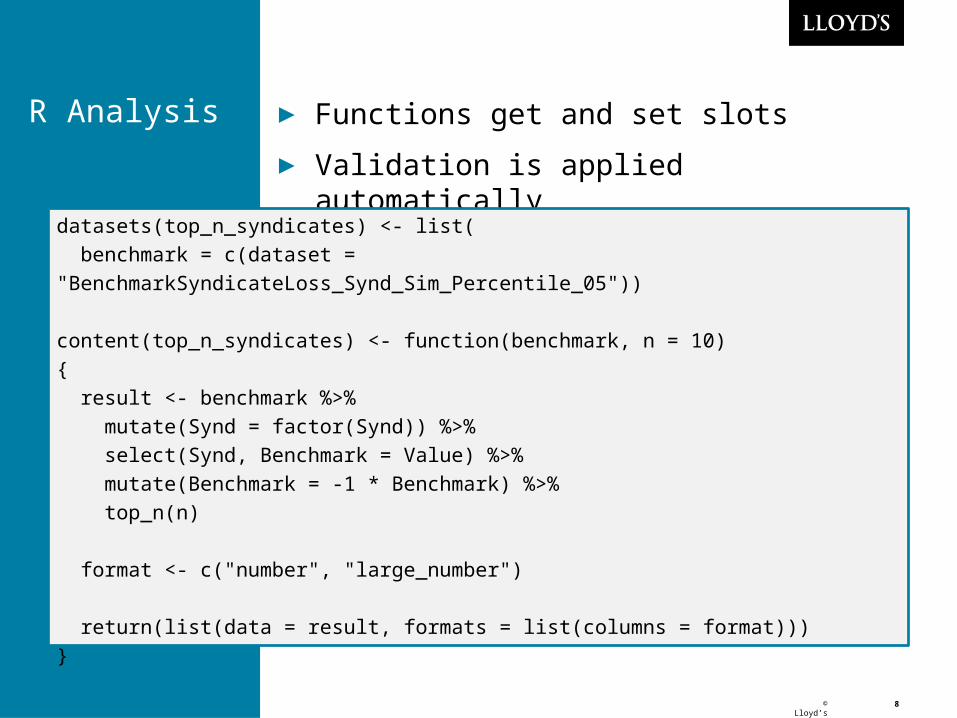
► Functions get and set slots
► Validation is applied automatically
R Analysis
datasets(top_n_syndicates) <- list( benchmark = c(dataset = "BenchmarkSyndicateLoss_Synd_Sim_Percentile_05"))
content(top_n_syndicates) <- function(benchmark, n = 10){ result <- benchmark %>% mutate(Synd = factor(Synd)) %>% select(Synd, Benchmark = Value) %>% mutate(Benchmark = -1 * Benchmark) %>% top_n(n) format <- c("number", "large_number") return(list(data = result, formats = list(columns = format)))}

© Lloyd’s 9
► Run using the execute() function
► Get the datasets and run the content
R Analysis
> execute(top_n_syndicates, cck_run = 9836, n = 5)Searching for BenchmarkSyndicateLoss_Synd_Sim_Percentile_05 in P:\55884Reading model result BenchmarkSyndicateLoss_Synd_Sim_Percentile_05$data Synd Benchmark 1 1000 99900000 2 2000 88800000 3 3000 77700000 4 4000 66600000 5 5000 55500000
$formats$formats$columns[1] "number" "large_number"
© Lloyd’s 10
R Analysis Analyses are:
► Stored in a package (ARTanalyses)
► Tested using testthat
► Documented using roxygen2 & staticdocs
► Version controlled using git & GitHub
► Deployed by Bamboo

© Lloyd’s 11
R Analysis GitHub
site-library
ART Server
New/changedanalyses Deploy package
& documentation if tests pass
All R installations use same library of packages
Excel Add-In

© Lloyd’s 12
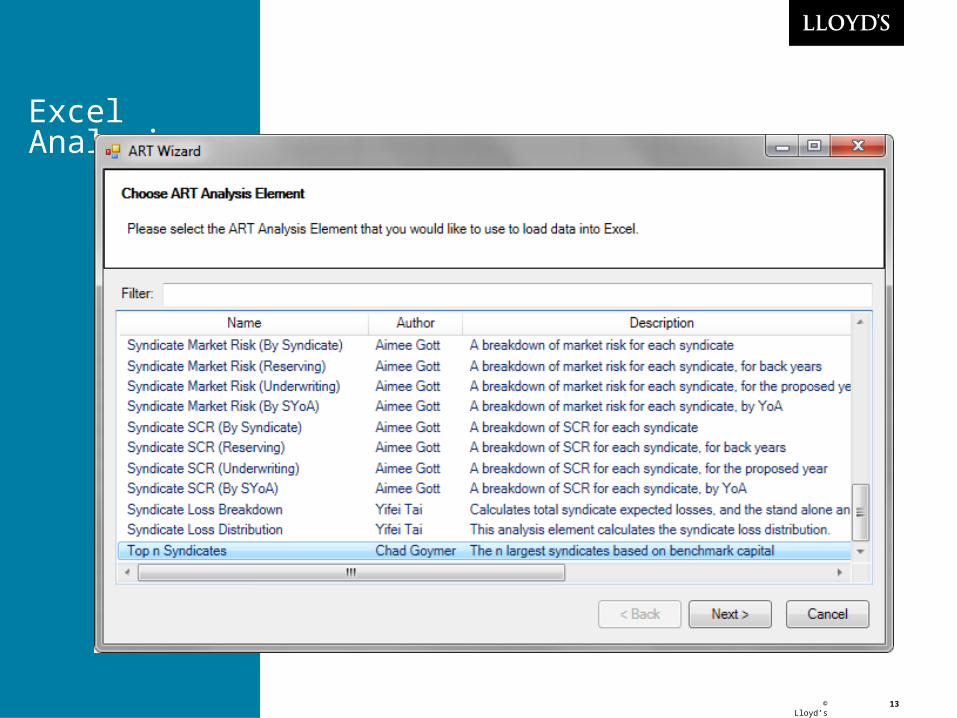
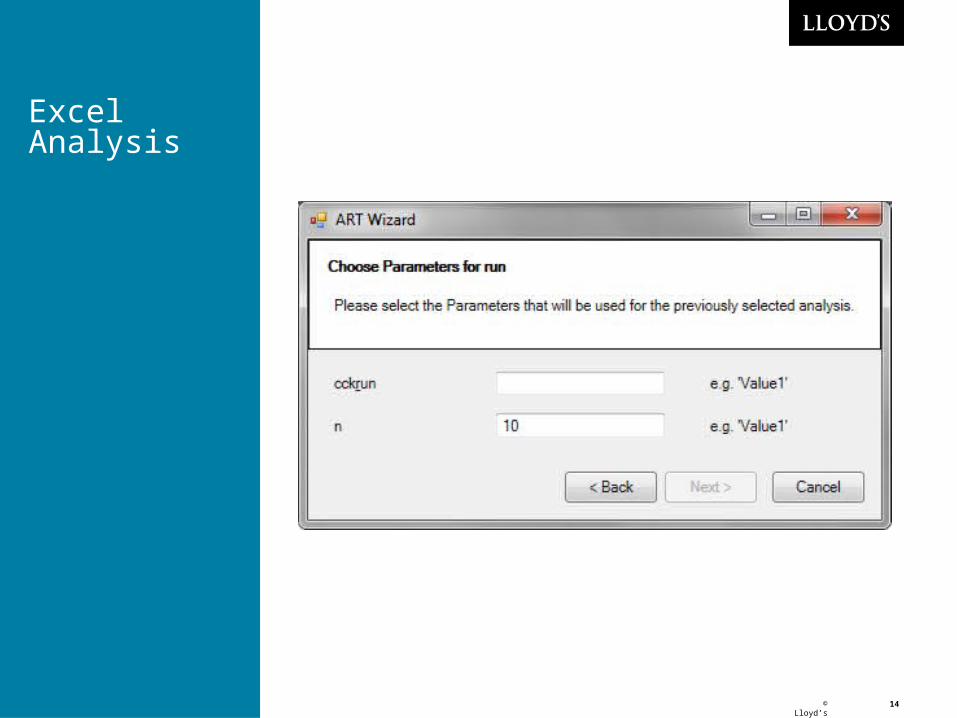
► Select an analysis
► Specify parameters
► Executes on ART server
► Presents the results according to specified format
Excel Analysis
© Lloyd’s 13
Excel Analysis
© Lloyd’s 14
Excel Analysis

© Lloyd’s 15
Excel Analysis
© Lloyd’s 16
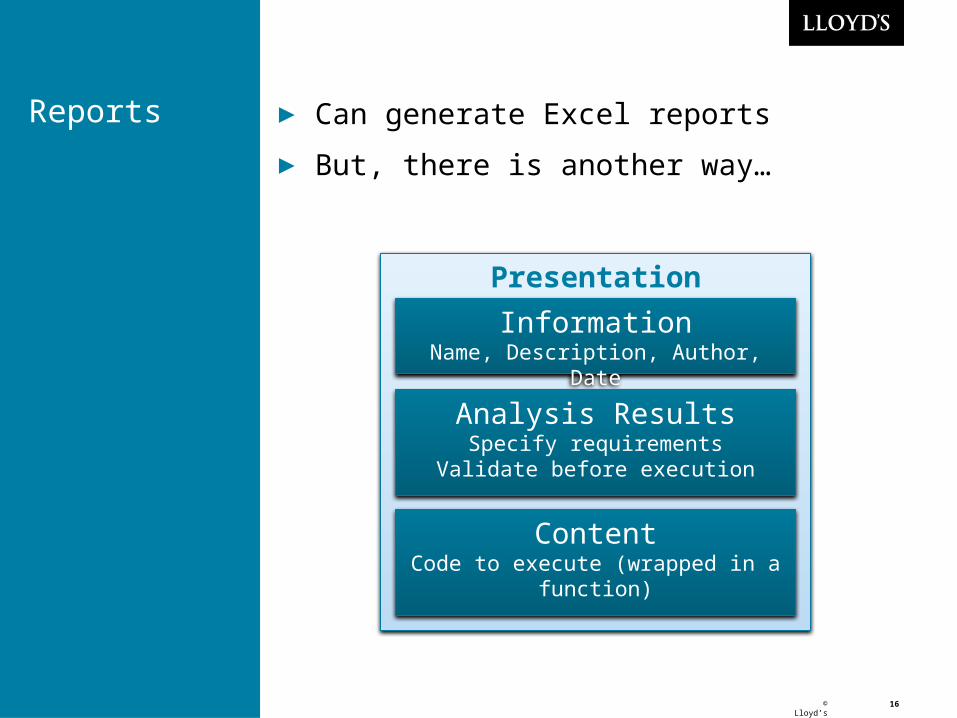
► Can generate Excel reports
► But, there is another way…
Reports
Presentation
InformationName, Description, Author, Date
Analysis ResultsSpecify requirements
Validate before execution
ContentCode to execute (wrapped in a function)

© Lloyd’s 17
► Presentation is also an S4 class
► Stored in a package (ARTpresentations)
Reports
#' Simple Table#' #' Presents a table in markdown format for HTML reports#' #' @param data (required) data.frame to be presented as a table#' @param header character vector header names to replace data column names#' @param formats list specifying formatting hints for each column#' @param use_rownames (Default FALSE) Whether to output rownames#' @author Chad Goymer \email{chad.goymer@@lloyds.com}#' @export simple_table <- new("presentation", name = "Simple Table", description = "Presents a table in markdown format for HTML reports", author = "Chad Goymer", date_created = "2013-09-26")

© Lloyd’s 18
► Specifiy valid analysis resultsReports
parameter_validation(simple_table) <- function(params){ valid = TRUE if ("formats" %in% names(params) && "columns" %in% params$formats){ valid <- c(valid, identical(length(params$formats$columns), ncol(params$data))) valid <- c(valid, all(params$formats$columns %in% c("number", "large_number", "small_number", "percent", "text", "header", "footer", "bold", "italic"))) } } return(all(valid))}

© Lloyd’s 19
► Specifiy content
► Can use execute() to run standalone
► Can also be combined with an analysis…
Reports
content(simple_table) = function( data, header, formats, use_rownames = FALSE) { require(knitr, quietly = TRUE) <...apply specified formats to data...> return(kable(data, format = "markdown", align = align, row.names = FALSE))}

© Lloyd’s 20
ReportsReport Element
Analysis Presentation
► An analysis may be presented in multiple ways
► A presentation can be applied to multiple analyses
© Lloyd’s 21
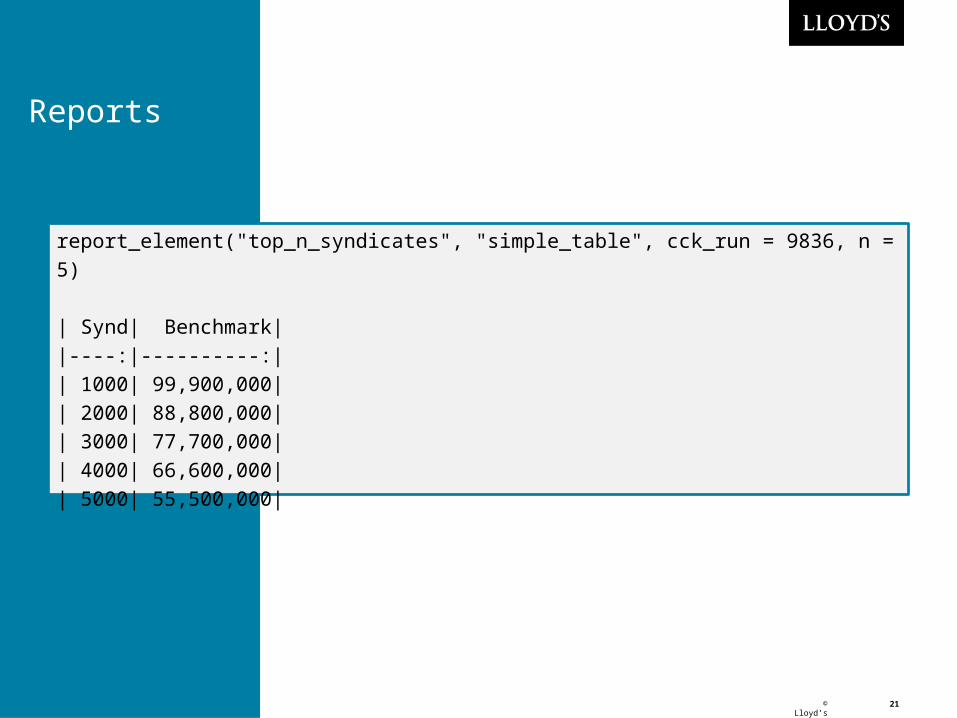
Reports
report_element("top_n_syndicates", "simple_table", cck_run = 9836, n = 5)
| Synd| Benchmark||----:|----------:|| 1000| 99,900,000|| 2000| 88,800,000|| 3000| 77,700,000|| 4000| 66,600,000|| 5000| 55,500,000|

© Lloyd’s 22
Reports Report
Analysis Presentation
Analysis Presentation

© Lloyd’s 23
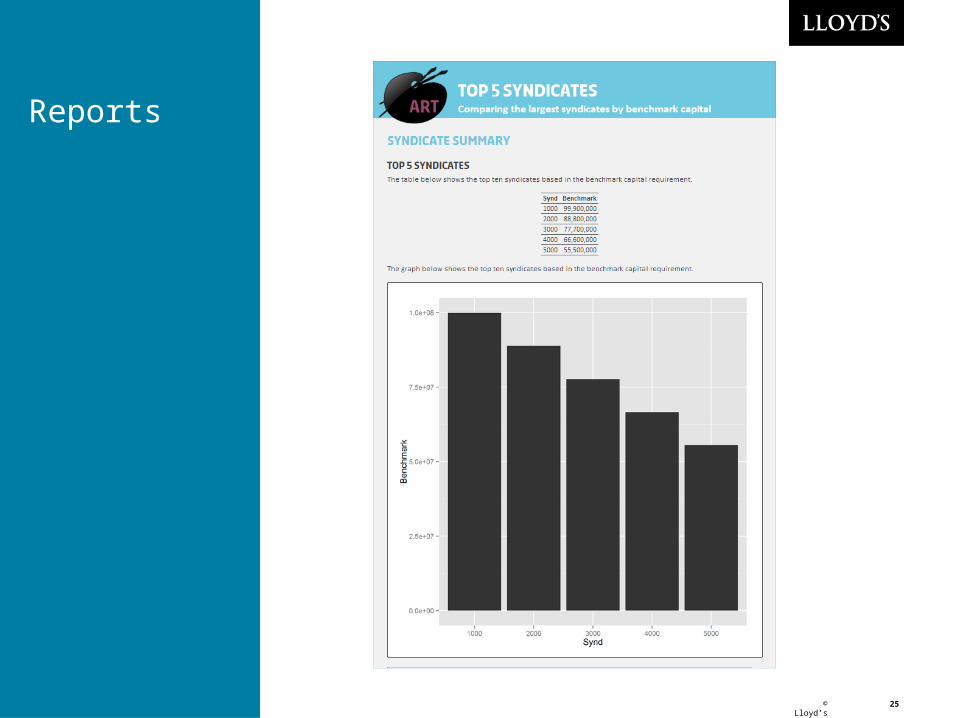
ReportsSyndicate Summary=================
Top 5 Syndicates----------------The table below shows the top ten syndicates based in the benchmark capital requirement.
```{r top_5_synds_table}report_element("top_n_syndicates", "simple_table", cck_run = report_datasets$run_request, n = 5)```
The graph below shows the top ten syndicates based in the benchmark capital requirement.
```{r top_5_synds_graph}report_element("top_n_syndicates", "bar_chart", cck_run = report_datasets$run_request, n = 5)```

© Lloyd’s 24
► Report is also an S4 class
► Stored in a package (ARTreports)
Reports
#' Top 5 Syndicates#' #' Comparing the largest syndicates by benchmark capital#' #' @param cck_run A society run request ID#' @author Chad Goymer <chad.goymer@@lloyds.com>#' @exporttop_5_syndicates <- new("report", name = "Top 5 Syndicates", description = "Comparing the largest syndicates by benchmark capital", author = "Chad Goymer", date_created = "2014-08-13")
definition(top_5_syndicates) <- "top_5_syndicates.Rmd"
© Lloyd’s 25
Reports
© Lloyd’s 26
Summary Formal definition of an analysis
► Testing & documenting made easy
► Sharing automatically
► Available to R and Excel users
Flexible Reports
► Combine an analysis with a presentation
► Create reports using report elements
► (Re)generate reports in HTML & Word

© Lloyd’s 27
Future Work Shiny!
► Create interactive reports

© Lloyd’s 28
Acknowledements Mango: R packages design & development
► Gemma Stephenson
► Aimee Gott
Riskcare: ART server and Excel Add-In
► David Grierson
► Bobby Jagdev