· nancy ross sutherland, ... atk elemental analysis 52 ... the final solutions will be...
TRANSCRIPT


ACKNOWLEDGMENTS
The authors wish to acknowledge and appreciate the work performed by Reed Blau and Curtis Fielding for their contribution to the data provided by Alliant Techsystems Launch Systems. They also would like to acknowledge the work performed by Fred Matt, Linda Lorenz, Nancy Ross Sutherland, and Ann Masko from United States Department of Agriculture Forest Products Laboratory.
CONTENTS
Page
Introduction 1
Technical Approach 2
Tests and Results 3
U.S. Army Armaments Research, Development and Engineering Center 3 Forest Products Laboratory 15 Alliant Techsystems Inc. 32
Discussion 49
Viscosity and Shelf-life Testing (ATK Task 300) 49 Number 34 Primers - Closed Bomb and Pellet Integrity (ATK Task 600) 50 Gum Solution - LCC Testing (ATK Task 700) 51 Cartridge - Ballistic Testing (ATK Task 800) 51 ATK Elemental Analysis 52 Moisture Loss and Friability Evaluation of ATK LSG FA956 Primers 52
Conclusions 53
U.S. Army Armament Research, Development and Engineering Center 53 Forest Products Laboratory 54 Alliant Techsystems Inc. 54
References 57
Bibliography 59
Distribution List 61
FIGURES
1 SDT summary for Colony sample 7
2 SDT summary for Hummel sample 7
3 SDT summary for Quadra sample 8
4 Particle size analysis summary for gum arabic samples 9
5 SEM images of Colony gum arabic at 230x and 550x magnification (L to R) 10
6 SEM images of Hummel gum arabic at 55x and 600x magnification (L to R) 10
7 SEM images of Quadra gum arabic at 100x and 800x magnification (L to R) 10
in
FIGURES (continued)
Page
8 Reaction temperature of sample Colony plotted verses temperature 13
9 Reaction temperature of sample Hummel plotted verses temperature 13
10 Reaction temperature of sample Quadra plotted verses temperature 13
11 Gum arabic rheology, 42% solids 17
12 Normalized moisture gain 17
13 Rl versus time 19
14 Surface tension by contact angle diagram 20
15 Chart of shear strengths 21
16 Color analysis: Colony after 5.0 hrs 23
17 Color analysis: Hummel after 5.0 hrs 23
18 Color analysis: Brenntag after 5.0 hrs 23
19 Gel permeation chromatography 25
20 Infrared spectroscopy 27
21 Overlay of 13C spectra of GA-1 (Colony), GA-6 (Hummel), and GA-3 (Brenntag) 28 gum arabic samples in D20.
22 Regression analysis-1st test 34
23 Regression analysis - 2nd test 35
24 Shelf-life viscosity 38
25 H-Bar comparison 44
IV
TABLES
Page
1 Test names and specification requirements 3
2 Component values derived from the tests 6
3 SDT summary 6
4 Particle size analysis summary 8
5 Surface area analysis results 9
6 ERL Impact data for FA956 with different sources of gum arabic 11
7 BAM Friction data for FA956 with different sources of gum arabic 11
8 ESD data for FA956 with different sources of gum arabic 12
9 BOE Impact data for FA956 with different sources of gum arabic 12
10 Viscosity in centipoises 16
11 Rate of dissolution 18
12 Optical rotation in degrees 19
13 Contact angle in degrees 20
14 Peel force in grams 22
15 Nitrogen content 24
16 CHN analysis 25
17 Gel permeating chromatography 26
18 Sugar analysis 29
19 Uronic acid content 29
20 Metals analysis 30
21 Performance tests - viscosity and shelf-life 32
22 Viscosity results -1st test 33
23 Viscosity results - 2nd test 34
24 Viscosity comparison - 2nd test 35

TABLES (continued)
Page
25 Shelf-life raw results 36
26 Deliverables 39
27 Performance tests - closed bomb test and PIT 40
28 PIT results 41
29 PIT gum vendor: analysis of means and variance 42
30 PIT operator: analysis of means and variance 42
31 Brunig's versus Mansfield's PIT ratings 42
32 Performance tests - primer drop sensitivity 43
33 Performance tests - EPVAT 45
34 Ambient EPVAT comparison 46
35 EPVAT: analysis of means and analysis of variance 46
36 CHN quantity analysis 47
37 Weight data concerning % moisture 48
38 Data table concerning friability loss 49
VI

INTRODUCTION
Misfiring or hangfiring of 7.62-mm ammunition has been a long-term, sporadic problem. The primer composition FA-956 formulation (ref. 1) is believed to be the cause. More specifically, the binder gum arabic (ref. 2) is believed to be the major factor contributing to the problems. There have also been recurring problems with the primer mix upon vendor change for gum arabic. Alliant Techsystems, Lake City Army Ammunition Plant (LCAAP) confirmed increased primer mix dusting coincided with change in gum arabic supplier.
Gum arabic is a natural product from the trees of Acacia Senegal. Because the gum arabic comes from natural sources, the physical, chemical, and mechanical properties of this material may vary and contribute to primer malfunctions. Currently, there are no gum arabic fingerprints or baseline specifications available for procurement. The Federal Specification JJJ- A-20 (ref. 3) and MIL-STD-1437A are not adequate to identify reliable sources or workable materials.
The program's objective ultimately is to solve the misfiring or hangfiring of the 7.62-mm ammunition problem. To accomplish this goal, gum arabic and possibly synthetic replacements' chemical, physical, and mechanical properties will be fingerprinted. Primer composition will be improved by identification of alternate gum arabic sources, implementation of a gum arabic synthetic replacement, and formulation optimization to improve performance and reliability. Gum arabic and/or synthetic replacement performance based specifications and primer com- position (ref.1) performance requirements will be developed. Primer mix dusting problems during production need to be mitigated. The final solutions will be implemented to the produc- tion line. Finally, the current primer specifications will be updated to incorporate lessons learned.
The program was jointly performed by the U.S. Army Armament Research, Development and Engineering Center (ARDEC), Picatinny Arsenal, New Jersey; Forest Products Lab (FPL); and ATK (LLAP and Thiokol), with support from Joint Munitions Command (JMC). There will be a parallel effort on gum arabic and synthetic replacement to mitigate risks. This report is written in three sections composed of those tests that were performed by each organization. The program consists of three phases: a basic contract on phase I and optional phase II and phase
Phase I - Characterization and Performance Testing
• Characterization of existing gum arabic inventory materials (three candidates) FA-956 primer performance testing
Phase II - Alternate Product Identification and Formulation/Process Optimization
• Alternate binder source identification and material acquisition • Characterization of materials • Primer mix formulation and manufacturing process improvement
(performance, producibility and dusting issues) • Performance/QC requirement testing

Phase III - Specification and Implementation
• Establishment of gum arabic or synthetic replacement performance based specification
• Establishment of primer performance specification • Establishment of quality assurance testing requirements • Implementation/collaboration
This report includes the results from Phase 1 of the three phase program. Gum arabic samples from three different sources were obtained for testing and evaluation. The following are the supply sources.
Sample A
Manufacturer: Colony Industries (Colony) Sample Name: gum arabic Lot no.: 07/03286 Appearance: White to off white
Sample B
Manufacturer: Hummel Croton (Hummel) Sample Name: gum arabic Lot no.: GA-04-271 Appearance: White to off white
Sample C
Manufacturer: Quadra Chemicals Inc. (Quadra) - Brenntag North America (Brenntag)* Sample Name: gum arabic Lot no.: 12281 Appearance: White to off white
*Effective 10/31/05, Brenntag North America acquired 100% of the outstanding shares of Quadra Chemicals Inc. For purposes of this report, the names will be used interchangeably.
The phase 1 deliverable reports provided by ARDEC, FPL, and ATK are contained in this report.
TECHNICAL APPROACH
Samples of gum arabic from the three suppliers were tested to identify any character- istics that could be used as criteria for successful use in the primer. The tests selected were used to identify the different chemical, thermal, and physical properties of each gum arabic sample from the different suppliers. The individual test procedures, results, and the organiza- tions performing the tests are identified in this report.

TESTS AND RESULTS
U.S. Army Armament Research, Development and Engineering Center (ARDEC)
ARDEC's work in phase I included specification testing (according to ref. 3 listed properties), material analysis (thermal, physical, morphological characterization), and sensitivity evaluation of the reference 1 primer mix. The component requirements, test protocols, and results follow.
Specification Testing
The requirements for the properties of gum arabic listed in table 1 are identified in reference 3. The numbers used in the first column (Requirement Number) are the same as the paragraph numbers listed in the specification. The referenced numbers listed in the Specifica- tion Requirement column are paragraph numbers listed in the specification.
Table 1 Test names and specification requirements
Requirement number Test name Specification requirement
3.2 Insoluble residue No more than 1.0% by weight when tested as specified in 4.3.1 3.3 Total ash No more than 4.0% by weight when tested as specified in 4.3.2 3.4 Acid-insoluble salt No more than 0.5% by weight when tested as specified in 4.3.3 3.5 Moisture No more than 15.0% by weight when tested as specified in 4.3.4
3.6 Tannin-bearing gums None when tested as specified in 4.3.5
3.7 Starch and dextrin None when tested as specified in 4.3.6
3.8 Identification A flocculent or curdy white precipitate immediately formed when tested as specified in 4.3.7
3.9 Solubility A free-flowing liquid, uniform in appearance and without any indication of ropiness when tested as specified in 4.3.8
3.10 Reduction of Fehling's solution
Not more than a trace of cuprous oxide shall be formed when tested as specified in 4.3.9
3.11 Acidity
3.11.1 Inorganic acidity The acacia shall have no inorganic acidity when tested as specified in 4.3.10.1
3.11.2 Organic acidity No more than 0.4 percent as acetic acid when tested as specified in 4.3.10.2
The following test procedures were performed as stated in reference 3 and listed in table 1. The tests were run a single time for familiarization with method and then tests with numerical results were run in duplicate. The procedures were performed on gum arabic samples from Colony, Hummel, and Quadra.

Test 4.3.1 - Insoluble Residue (IR). Z 250 mL Erlenmeyer flask was filled with 5 gm of sample. Added to the flask was 100 mL of deionized water. The sample was dissolved with a Glas-Col Multi-pulse Vortexer (which continuously swids the flask and its contents). After the samples were dissolved, 10 mL of 10% hydrochloric acid was added and the flask was boiled gently for 15 min. While the flask was still hot, filtering by suction technique was performed using a pre-weighed Gooch crucible. (The crucibles were perforated crucibles with removable fitted filter pads. The pads were Whatman 934AH porosity.) The residues retained in the crucibles were washed with hot deionized water. The crucibles were dried at 100°C, cooled in a desiccator, and weighed. The Colony sample had more residue than the other samples and filtering was difficult. The duplicate test for the Colony sample was run using 1.5 g samples. The IR was calculated as follows:
IR% = [(A-B)/C]x100 IR = Weight percent of insoluble residue A = Weight of crucible and residue B = Weight of crucible C = Weight of crucible
Test 4.3.2 - Total Ash (TA). A sample of 2 to 4 gm was weighed into a pre- weighed crucible. The sample was incinerated at a low temperature (not to exceed very dull redness) until the sample was carbon free. For these tests, a muffle furnace was used. It was determined that a temperature of about 825°C had to be used to ensure that all the carbon was gone. However, at these temperatures, the Colony sample was slightly darker than the others indicating possible carbon content.
The crucibles were cooled in a desiccator and weighed. The TA was calculated as follows:
TA% = [(A-B)/C]x100 TA = Weight percent of total ash A = Weight of crucible and residue B = Weight of crucible C = Weight of sample
Test 4.3.3 - Acid Insoluble Ash. The residual ash from the previous test (4.3.2) was transferred to a beaker. Twenty-five milliliters of 10% hydrochloric acid was added and the contents of the beaker were boiled for 5 min. The contents were filtered into a pre-weighed crucible, washed with hot deionized water, and reheated in the muffle furnace to about 825°C. The crucibles were cooled in a desiccator and weighed. In all three cases, the ash appeared to have been completely dissolved. The test was repeated in duplicate, but instead of incinerating a second time, the contents of the crucibles were filtered into Gooch crucibles with Whatman 9234AH fritted filters, and dried. The carbon content of the Colony sample was more apparent this way.
Test 4.3.4 - Moisture (M). Approximately 10 gm of sample were weighed into a pre-weighed porcelain dish and dried at 100 to 105°C for 5 hrs. The dish was cooled in a desiccator and reweighed. The dish was heated for another hour, cooled, and reweighed to see if there was any further weight loss. In all three cases, there were no significant changes after the first weighing. The moisture content was calculated as follows:
M% = [(A-B)/C]x100 M = Weight percent moisture A = Weight of dish and sample before heating B = Weight of dish and sample after heating C = Weight of sample
Test 4.3.5 - Tannin-bearing Gums. There was 2% solution of the gums prepared. A 0.1 mL of 0.3 N ferric chloride solution was added to a 10 mL aliquot. (An approximate concentration of Fisher Scientific's 10% ferric chloride solution was used). Formation of blackish coloration or blackish precipitate would indicate the presence of tannin-bearing gums.
Test 4.3.6 - Starch and Dextrin. There was 2% solution of the gums prepared. The solutions were boiled for several minutes and allowed to cool. Three drops of a 0.10 N iodine solution was added. Formation of a bluish or reddish coloration would indicate starch or dextrin.
Test 4.3.8 - Solubility. Approximately 35 mL of sample was added to a 250 mL Erlenmeyer flask. Then 100 mL of deionized water was added to the flask. The flask was stoppered and placed overnight in the Glas-Col Multipulse Vortexer. In the morning, the sample solution was poured into a beaker. It was inspected for uniformity in appearance, free flow, and absence of ropiness.
Test 4.3.9 - Reduction of Fehling's Solution. Fehling's reagent is a mixture of two solutions: copper sulfate and alkaline sodium tartrate. These solutions (available from Fisher Scientific) were mixed just before use. There was 2% solution of the samples prepared. Sample solutions of 25 to 50 mL were mixed with an equal volume of Fehling's reagent. The combined solution was brought to a boil and heated for 2 min. The solution was examined for the presence of cuprous oxide. Lessening of blue color or formation of insoluble precipitant would be an indicator.
Test 4.3.10.1 - Inorganic Acidity. A sample of 1 gm was dissolved in 100 mL of deionized water. Then 1 mL of a 0.1 methyl orange solution was added. If inorganic acidity was absent, the color would remain orange-yellow. The color changing to red would indicate strong acidity.
Test 4.3.10.2 - Organic Acidity. A sample of 1 gm was dissolved in 100 mL of deionized water. The 0.1 mL of phenolphthalein indicator was added. The solution was titrated with 0 .1 N sodium hydroxide solution until a permanent pink color was obtained. The organic acidity to acetic acid (AA) was calculated as follows:
AA% = 6.0 V N / W AA = percent acidity as acetic acid V = ml of sodium hydroxide solution used N = normality of the sodium hydroxide solution W = weight of the sample
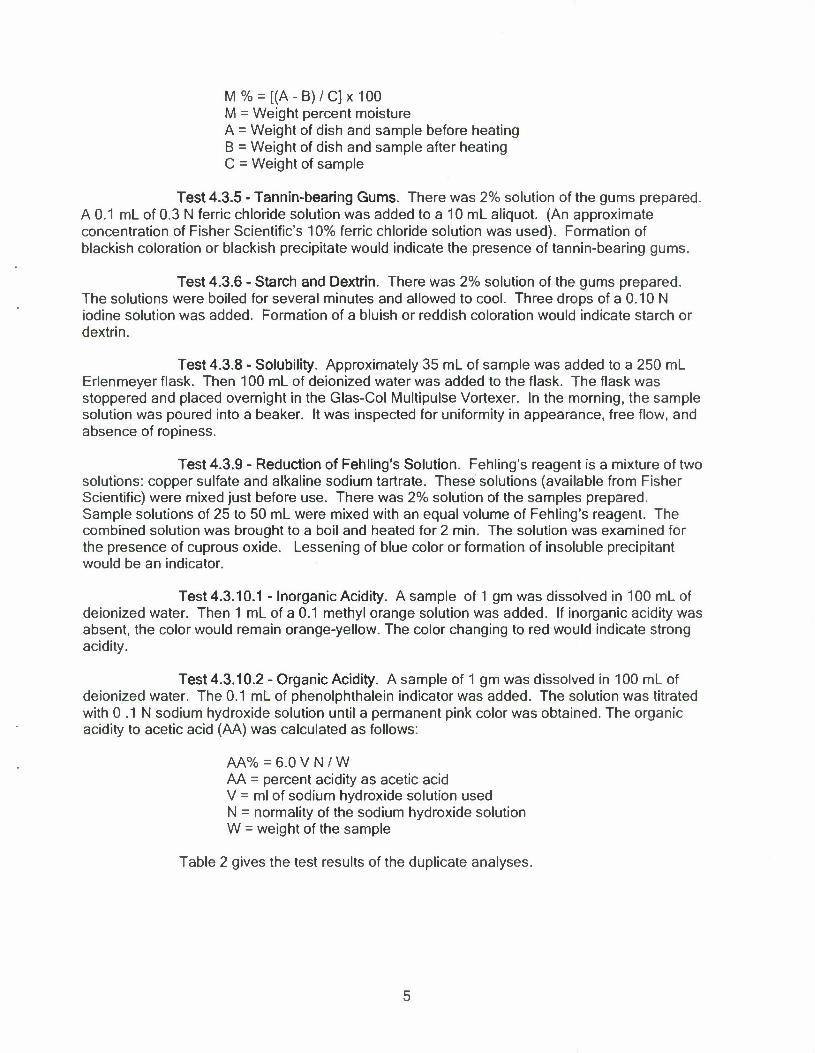
Table 2 gives the test results of the duplicate analyses.
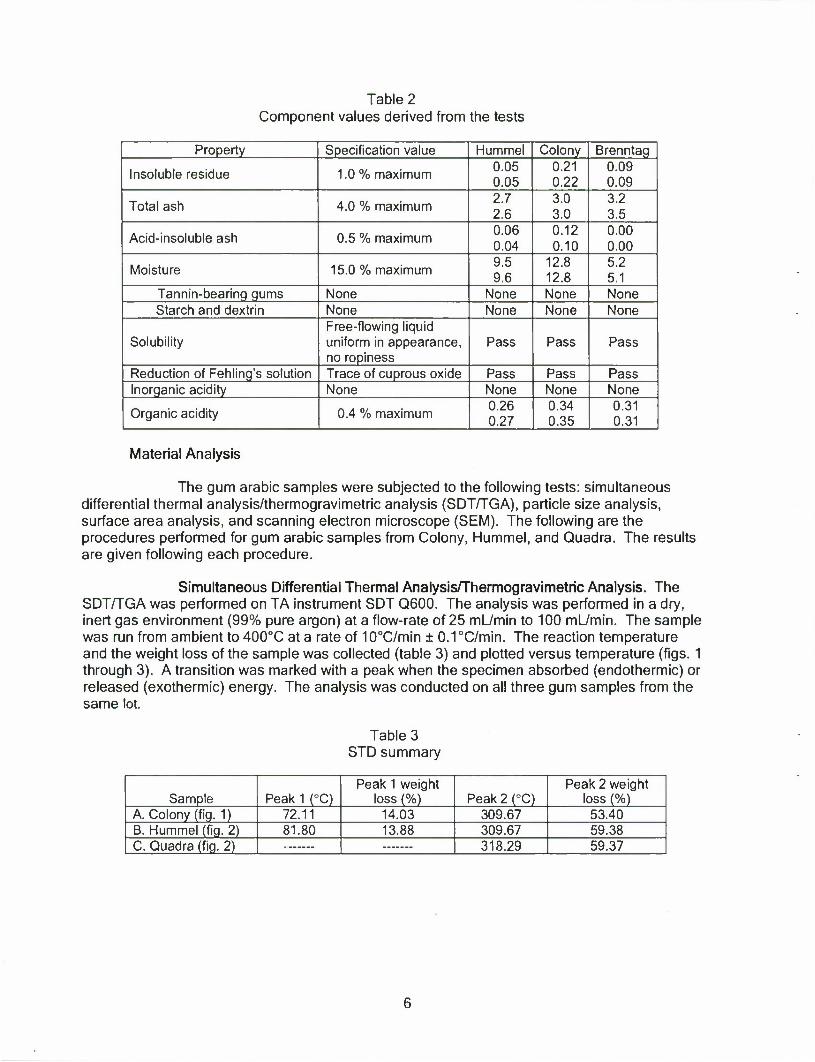
Table 2 Component values derived from the tests
Property Specification value Hummel Colony Brenntag
Insoluble residue 1.0 % maximum 0.05 0.05
0.21 0.22
0.09 0.09
Total ash 4.0 % maximum 2.7 2.6
3.0 3.0
3.2 3.5
Acid-insoluble ash 0.5 % maximum 0.06 0.04
0.12 0.10
0.00 0.00
Moisture 15.0 % maximum 9.5 9.6
12.8 12.8
5.2 5.1
Tannin-bearing gums None None None None Starch and dextrin None None None None
Solubility Free-flowing liquid uniform in appearance, no ropiness
Pass Pass Pass
Reduction of Fehling's solution Trace of cuprous oxide Pass Pass Pass Inorganic acidity None None None None
Organic acidity 0.4 % maximum 0.26 0.27
0.34 0.35
0.31 0.31
Material Analysis
The gum arabic samples were subjected to the following tests: simultaneous differential thermal analysis/thermogravimetric analysis (SDT/TGA), particle size analysis, surface area analysis, and scanning electron microscope (SEM). The following are the procedures performed for gum arabic samples from Colony, Hummel, and Quadra. The results are given following each procedure.
Simultaneous Differential Thermal Analysis/Thermogravimetric Analysis. The SDT/TGA was performed on TA instrument SDT Q600. The analysis was performed in a dry, inert gas environment (99% pure argon) at a flow-rate of 25 mL/min to 100 mL/min. The sample was run from ambient to 400°C at a rate of 10°C/min ± 0.1°C/min. The reaction temperature and the weight loss of the sample was collected (table 3) and plotted versus temperature (figs. 1 through 3). A transition was marked with a peak when the specimen absorbed (endothermic) or released (exothermic) energy. The analysis was conducted on all three gum samples from the same lot.
Table 3 STD summary
Sample Peak 1 (°C) Peak 1 weight
loss (%) Peak 2 (°C) Peak 2 weight
loss (%) A. Colony (fig. 1) 72.11 14.03 309.67 53.40 B. Hummel (fig. 2) 81.80 13.88 309.67 59.38 C. Quadra (fig. 2) 318.29 59.37
Samoto Colony Size 10 3570 mo, Method Heating tOCAntn Comment lOOmtn
00
E -04 o
oe
DSC-TGA Fit: C \TA\Data\SOTUH\Gum arablc\Cotony 001 Operator JH RunDattH-Oct-07 04 57 Instrument SDT Q600 V6 1 Butd 72
150 200 250
Temperature (*C)
18C
140
BO
400 VSQATA
Figure 1 SDT summary for Colony sample
^arnou* 0"m aran*r-Hnmm*l Size -19810mg Method Heating Comment Hummei sample
00
DSC-TGA «« C \TA\T>ataiSr>TUH\(Vim aranfe-Uummw 001 Operator JH Run Date 04-Oct-07 14 28 instrument SOT Q600 V6 1 BUM 72
180
^,—' 263.71'C
•v X».«7'C
** '
/ • 4t KTC jS'
IUM
"^~^^- 59 18%
\
. 1 1 1 1 ,—
U0
100 |
Temperature (*C)
500 V1WTA
20
Figure 2 SDT summary for Hummel sample

Sample Quadra Size 11 0180 mg Method Heating 10C/mm Comment lOC/mtn
DSC-TGA
oo
-0 2-
-0 4-
$ -06
-0 8
-10
Fee: C \TA\Data\SDT\JH\Gum aratxcNQuadra 001 Operator JH Run Date 11 Oct-07 08 34 instrument. SOT Q600 V6 1 BuM 72
220 /K 31«2»'C
\ \
ieo
140
50 100 150
E.oue 200
Temperature (*C) 250 300
60
20 350 400
UrvwMl VJ 0A TA kwexjm*
Figure 3 SDT summary for Quadra sample
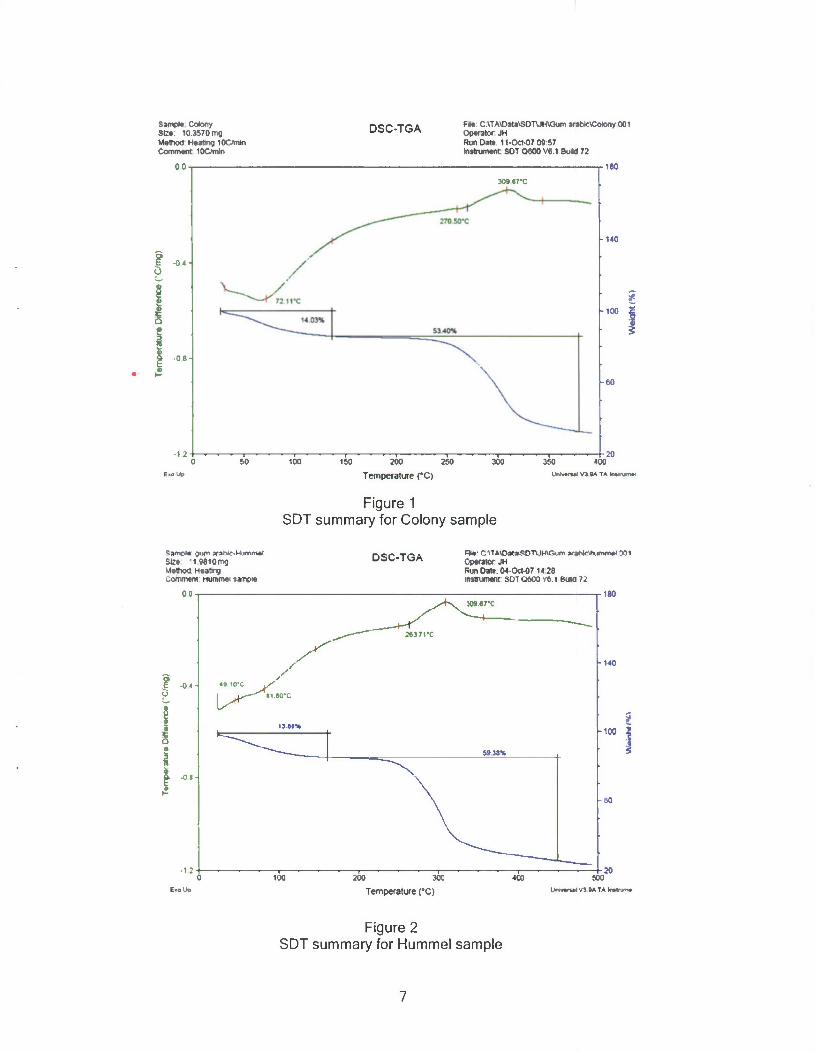
Particle Size Analysis. The particle size analysis was performed on a Microtrac S3500 in accordance with International Organization for Standardization (ISO) 13320-1. A small amount of each gum arabic sample was transferred to the particle size analyzer. The flow rate of the instrument was set to 35% (measured versus full power) for each sample. Each sample was sonicated for 60 sec at 25 W prior to measuring the particle size. The refractive index of the titanium dioxide was set to 1.476. Each sample was run three times and the results are the average of three measurements (table 4).
Table 4 Particle size analysis summary
Sample 10% (urn) 50% (urn) 90% (urn) Mean value
(urn) Colony 15.45 46.34 86.15 49.16 Hummel 27.64 79.38 181.3 97.81 Quadra 23.14 57.79 133.3 76.37
All gum arabic samples exhibited a single distribution (fig. 4). The samples appear to have a maximum between 10 and 100 urn. The Colony sample has a tighter distribution than both the Hummel and Quadra samples. The Quadra and Hummel samples were both similar in size while the Colony sample exhibited a tighter distribution.
8
Particle Size Analysis
18
16
H A
u •/, CK»nn»
•
10 !: 1 "" 8 f » \
1 •
• •
•
• •
Colony
Hummel
Quadra
*• V
n n(>i p m n n n n n n n n r> n n n f* n rwi r\ "*"«»->?••• «
(I 1 10
Slzt (microns)
100 1000
Figure 4 Particle size analysis summary for gum arabic samples
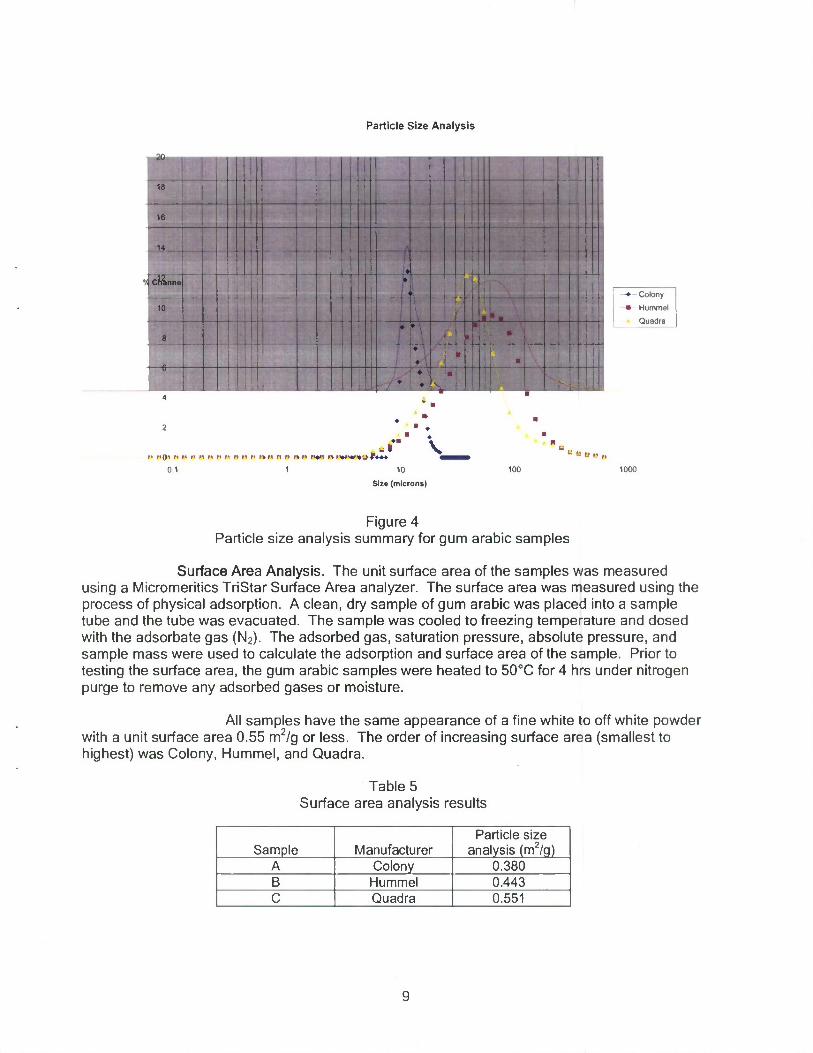
Surface Area Analysis. The unit surface area of the samples was measured using a Micromeritics TriStar Surface Area analyzer. The surface area was measured using the process of physical adsorption. A clean, dry sample of gum arabic was placed into a sample tube and the tube was evacuated. The sample was cooled to freezing temperature and dosed with the adsorbate gas (N2). The adsorbed gas, saturation pressure, absolute pressure, and sample mass were used to calculate the adsorption and surface area of the sample. Prior to testing the surface area, the gum arabic samples were heated to 50°C for 4 hrs under nitrogen purge to remove any adsorbed gases or moisture.
All samples have the same appearance of a fine white to off white powder with a unit surface area 0.55 m2/g or less. The order of increasing surface area (smallest to highest) was Colony, Hummel, and Quadra.
Table 5 Surface area analysis results
Sample Manufacturer Particle size
analysis (m2/g) A Colony 0.380 B Hummel 0.443 C Quadra 0.551

Scanning Electron Microscopy (SEM). The gum arabic samples were placed on brass analysis stubs and placed into a JEOL JSM-6380LV SEM. The samples were run as- received without any coating or processing. The microscopy power was kept low (to prevent imaging problems) and images were taken at varying magnifications under vacuum (figs. 5 through 7).
Figure 5 SEM images of Colony gum arabic at 230x and 550x magnification (L to R)
Figure 6 SEM images of Hummel gum arabic at 55x and 600x magnification (L to R)
Figure 7 SEM images of Quadra gum arabic at 100x and 800x magnification (L to R)
10
Sensitivity Evaluation of the FA956 Primer Composition
All primer samples were provided by LCAAP ATK during the gum arabic characterization phase using the production manufacturing method. Samples were wetted with over 10% moisture for shipping and handling. Samples were dried in the oven following ATK recommended procedure (ref. 4) prior to testing at ARDEC.
ERL Impact Tester. The ERL, type 12 impact tester using a 2.5 kg drop weight was used to determine the impact sensitivity of the sample. The drop height corresponding to the 50% probability of initiation was used to measure impact sensitivity (table 6). The impact test is described in MIL-STD-1751A (ref. 5), Method 1012, "Impact Sensitivity Test- ERL Explosives Research Laboratory)/Bruceton Apparatus."
Table 6 ERL impact data for FA956 with different sources of gum arabic
Colony Hummel Quadra ERL impact
10.0 cm 4/10 0/10 0/10 12.6 cm 7/10 5/10
BAM Friction Test. The Large BAM Friction Test Method is described in reference 5, Method 1024, "BAM Friction Test." A sample was placed on the porcelain plate. The porcelain pin was lowered onto the sample and a weight was placed on the arm to produce the desired load. The tester was activated and the porcelain plate was reciprocated once to and fro. The results were observed as either a reaction (i.e., flash, smoke, and/or audible report) or no reaction. Testing was begun at the maximum load of the apparatus (360 N) or lower if experience warranted it (table 7).
Table 7 BAM friction data for FA956 with different sources of gum arabic
Colony Hummel Quadra BAM friction
6N 0/10 0/10 0/10
Electrostatic Sensitivity Test. The Electrostatic Sensitivity Test is described in reference 5, Method 1032, "Electrostatic Discharge Sensitivity Test (ARDEC, Picatinny Arsenal Method)."
This test determined the energy threshold required to ignite explosives by electrostatic stimuli of varying intensities. Material response data obtained can then be used to characterize the probability of initiation due to electrostatic discharge (ESD) events. The energy for this test was initially fixed at 0.25 J. In this case, a 0.02 pF capacitor was connected to the discharge circuit and charged to 5.0 kV. The electrode spacing (gap) was set to 0.007 in. Approximately 30 mg of the test sample was placed into the hole of the washer fastened to the top of the sample holder. In general, there should be sufficient sample to fill the washer. Electrical insulating or Mylar tape was then placed over the sample opening to confine the powder.
11
The charged upper electrode was released and moved downward to the preset gap distance. The needle punctured the tape, penetrated the sample materials, discharged through the interstices of the material, and raised to its initial position. A positive result is defined as a flash, spark, burn, or noise other than instrument noise. If no reaction occurred, the procedure was repeated until no reaction was obtained in 20 trials. The material was recorded as having passed the electrostatic test if there were no reactions in the 20 consecutive trials at the 0.25 J level (0.02 pF capacitor charged to 5.0 kV). If a reaction is obtained, the energy was reduced by decreasing the potential on the capacitor in 500 V increments and repeating the previous procedure. The voltage was reduced until the charging voltage was 2500 V and then the next lower capacitance was selected. When an energy level was reached where there was no reaction, the procedure was repeated at that energy until no reaction was obtained in 20 consecutive trials (table 8). The results were reported as "no reaction."
Table 8 ESD data for FA956 with different sources of gum arabic
Colony Hummel Quadra ESD
0.00010 J 0/20 2/20 0.00023 J 2/20
Bureau of Explosives Impact Test. The Bureau of Explosives (BOE) Impact Test method is given in the Department of Defense Explosive Hazard Classification Procedures; ARMYTB 700-2, dated 5 January 1998. It is also described in reference 5, Method 1011, "Impact Test (Laboratory Scale) - Bureau of Explosives Apparatus." This test is used for classification of explosive substances. The BOE testing apparatus was designed so that a 2.5 kg weight is free to fall between two parallel cylindrical guide rods from variable heights. The weight struck a plunger-and-plug assembly that was in contact with the sample. The results for the BOE testing are shown in table 9.
Table 9 BOE impact data for FA956 with different sources of gum arabic
Colony Hummel Quadra BOE impact
4 in. 10/10 10/10 10/10
Thermal Analysis. The thermal analysis was performed on a Perkin-Elmer Instrument DSC Pyris 7. The analysis was performed in a dry, nitrogen inert gas environment. The sample was run from ambient to 800°C at a rate of 5°C/min ± 0.1°C/min.
The reaction temperature of the sample was collected and plotted versus temperature (figs. 8 through 10). A transition is marked with a peak when the specimen absorbs (endothermic) or releases (exothermic) energy.
12
-1 773
0
10
UJ 15
1 X
20
25
30 91
COLONY PF UMER MIX
Onset = 269.11 IX |[
Area = -1271 9 Delta H = -321
38 mJ \| 1081 J/g V
Peak = 285 11 Peak Height =
•c 6.0723 mW
36.41 10O .Tin 300 400 500 Temperature (*C)
600 700 811 '
0 4036
a
|l5
20
25
Figure 8 Reaction temperature of Colony sample plotted verses temperature
HUMMEL P RIMER MIX
Onset = 26
Area = -12 Delta H = -
'.96 X
!8 828mJ (86.1412 J/g
Peak = 283 Peak Heigh
87 T = 6 1113mW
4315 100 200 300 400 500 Temperature (X)
600 700 811!
Figure 9 Reaction temperature of Hummel sample plotted verses temperature
13
2.36
! 15
10
25
29.67
l/\
Area =-1302.043 mJ Delta H = -496.J 653 J/g
QUADRA PRIMER MIX
Onset = 267.CK X
Peak = 283.50 Peak Height =
°C 6.8959 mW
43.61 100 2O0 300 400 500 Temperature ("C)
600 700 811.:
Figure 10 Reaction temperature of Quadra sample plotted verses temperature
Discussion
Federal Specification JJJ-A-20 Specification (ref. 3) Testing. All three samples passed all the tests. The Hummel and Brenntag gum samples appeared cleaner. The Colony gum sample had more IR. For this material, smaller aliquots of sample were needed to allow a reasonable rate of filtration. It also had more carbonaceous matter that resisted burning off in the TA test. The amount was still so low that attempting to burn it all off by transferring it to another beaker and filtering into filter paper, and incinerating the filter paper could have caused further significant errors to accumulate. It also had slightly greater values of organic acidity and moisture.
Material Specification. The results of the tests performed on the gum arabic samples indicated that macroscopically they all appear very similar. All the samples exhibited similar thermal profiles when analyzed with the SDT analyzer.
The SEM showed that the Quadra and Hummel samples were similar in exhibiting round structures while also appearing similar in size. The distribution displayed for particle size of both Quadra and Hummel samples were similar in size (between 70 and 90 um). Due to the larger particle size of the Hummel and Quadra samples as compared to the Colony sample, the surface areas of both were larger than the Colony sample. In order of decreasing surface area (largest to smallest), the samples are Quadra, Hummel, and Colony. The distribution of the Colony sample was tighter with a smaller particle size of 49 pm, which was also seen through the SEM images. The Colony sample showed a flaky structure as compared to the round structure of the other two samples.
14
Although all samples exhibit a similar thermal profile, the Quadra and Hummel are distinctively similar in both size and structure as compared to the Colony.
Sensitivity Evaluation of the FA956 Primer Composition (ref. 1). In general, the results shown in tables 6 through indicate the FA956 composition is extremely impact, friction, and ESD sensitive. This is due to the 37% lead styphnate in the composition. For ERL impact sensitivity, the Colony sample yielded the most sensitive level, at the lowest height of 10 cm. The Quadra sample yielded slightly better results than the Hummel sample at the 12 cm impact height. Such difference may suggest the source of gum arabic will have an impact on the impact sensitivity and should be noted since the FA956 is a percussion primer composition. However, the BOE impact test could not differentiate the sensitivity level as all 10 runs of each primer sample reacted at the 4 cm height. For friction sensitivity, only the Large BAM Friction Test was conducted. All samples did not react in 10 trials at 6 N. However, each primer sample did react at the forces above 6 N, ranging from 8 to 10 N. For ESD sensitivity, all three primer samples had very low initiation energy at 0.00001 to 0.00002 J levels, compared to 0.004 to 0.005 J for lead azide (ref. 6). The human body can store 20 to 30 mJ of energy although not all the energy can be transferred at discharge (ref. 7). Therefore, the FA956 composition is considered highly dangerous in this matter.
The thermal signature of the three primer mixes are near identical, indicated by an ignition temperature near 285°C. This suggests the source of gum arabic has no impact on their thermal characteristics.
Forest Products Laboratory (FPL)
The FPL's work in phase I was to characterize the properties of different gum arabic samples. These properties are not specified in the previously described specification testing. Since the project began, much about gum arabic has been learned by gathering and analyzing literature information. The food uses of gum arabic have been the driving force of many investigations and some have relevance to the gum arabic use as a binder in the primer formulation. Analysis of these documents has transformed what was initially just a list of possible test methods into a series of tests that are more interrelated to actual performance criteria. The gum arabic characterization falls into two main classes: those that measure a physical property and those that relate to chemical composition. It should be noted that the chemical composition influences the physical properties.
Physical Properties
Rotational Apparent Viscosity Using a Brookfield Viscometer. Viscosity is the measure of the flow of a material under an applied force: this area of science is called rheology. Alliant Techsystems has done some standard Brookfield rotational apparent viscosity studies and seen some unusual phenomena (ref. 8). The plan was to measure the viscosities of the six samples using 40% solid dispersions on the third day after the initial mixing as is used in this binder application. It was decided to add one day after mixing measurement to determine if any long time-dependent changes in the apparent viscosity existed. The measurements were done using a Brookfield LVT viscometer with a no. 3 spindle at 25°C and 60 rpm at 5.5 min after beginning agitation in the viscometer. The prior ATK studies were done using similar conditions except that no. 4 spindle, 48% solids, and 21 °C were used, but it was noted that this temperature was hard to control. The current data is given in table 10 with the GA-1 to GA-6 being the blind sample labels used in our work.
15

Table 10 Viscosity in centipoises (cP)
Apparent viscosity in centipoises Sample 1day 3 day
Colony (current) (GA-1) 1170 818 Colony (prior) (GA-4) 1174 782 Hummel (current) (GA-6) 1456 921 Hummel (repeat) (GA-2) 1486 886 Brenntag (GA-3) 1104 944 Quadra (GA-5) 1142 750 The pooled standard deviation was ±25 cP.
The data was interesting in that the Hummel sample tests demonstrated a higher 1-day apparent viscosity for the one sample that we had in comparison to the two Colony and Brenntag samples and Quadra sample. All samples showed an apparent viscosity drop between the 1-day and 3-day measurements. The question that arose was, if the entrapped air from the original mixing of the powdered samples led to the high 1 day apparent viscosities and if the degassing over the 2 days of sitting led to this decrease. The surfactant properties of the gum arabic and the high apparent viscosities would slow the deaeration of the samples. To determine if the entrapped air led to the higher 1 -day apparent viscosities, a sample of the Colony (GA-1) was dissolved in water. After a 1/z hr of mixing, the apparent viscosity was 1426 cP upon placing it in the Brookfield viscometer and 1260 cP after 30 sec of agitation in the cup. This sample was then transferred to a beaker and degassed in a vacuum of 25 psi (1.7 bar) for 2 hrs. The apparent viscosity of the degassed sample was 1654 and 1398 cP for the immediate and 30 sec viscosities, respectively. Thus, the deaeration raised the apparent viscosity and was not a reasonable explanation for the drop in viscosities between the 1 and 3-day measurements. Studies of the pH effect on the measured viscosities were also added and found that the apparent viscosity was insensitive to pHs between 3.5 and 9.8.
These results may be explained by changes in the distribution of the gum arabic components over time. Although the gum arabic appears to form a solution, most of the material is actually dispersed in extremely fine particles forming a fine dispersion (colloid). The size of these particles, the molecules on the particle surfaces, and the molecules in solution can take time to reach an equilibrium state. This unusual Brookfield viscosity behavior supported the original plan to use more sophisticated rheological techniques. Although the Brookfield is widely used laboratory equipment for measuring viscosity, it is not able to truly provide an understanding of the properties of non-Newtonian (flow being dependent upon shear rate) systems. The use of a fluid rheometer to provide a better understanding of the rheology is given in the next section.
Rotational Viscosity Using a Fluid Rheometer. The plans for these more sophisticated rheological measurements changed from the original proposal because the gum arabic dispersions were much more complicated than originally anticipated. The original plan was to use an oscillatory rheometer to look at both the flow and elastic properties of the gum arabic dispersions, but given their non-Newtonian behavior, it was felt that a rotational shear method with emphasis on shear rate was more important. The rheometer that was used was a TA Instruments AR1000 unit operated under controlled shear rate that allows the control of the
16

shear rate over many decades. The FPL does not have such a unit, so this work was contracted out to Arizona Chemical in Savannah, Georgia. More importantly is that upon sitting for longer periods, the dispersion becomes structured and this structure is removed by mixing. Thus, the samples need to be pre-sheared prior to obtaining the desired data. In figure 11 the viscosity curves are shown for samples GA-1 to GA-6.
2.5
2.3
2.1 0- 1.9
f 1-7 8 1.5 £. 1.3 a 3 11
0.9
0.7
0.5
Gum Arabic Rheology, 42% Solids
0 0.2 0.4 0.6 0.8 1 1.2 1.4 1.6 1.8
Log(Shear Rate)
Figure 11 Gum arabic rheology, 42% solids
The most important aspect is that the Hummel material (GA-2 and GA-6), that had performed poorly in prior primer pellet manufacturing, had a much higher viscosity at the low shear rates than the Colony (GA-1 and GA-4), Brenntag (GA-3), and Quadra (GA-5) samples. Note that the viscosity and shear rates are plotted as the log values and so the ranges are a lot wider than they seem. In addition, the result was repeatable with the only Hummel sample that was available. This high viscosity may be a reflection of higher molecular weight components or greater protein content, but could lead to poor distribution of the gum arabic. Obviously, more testing would need to be done. In general, the Colony, Hummel, and Quadra samples were unusual because they show both shear thickening and shear thinning depending upon the shear rate. The complex behavior of gum arabic dispersions is discussed in the reference 9.
With the observed viscosity measurements and the literature data, there is ample evidence that more studies on the rheological properties should be done. However, the literature has indicated that the measurement of these properties is not very straightforward. Surface tension properties can also interfere with the rheological determinations (ref. 9).
Moisture Adsorption of Dried Gum Arabic. Moisture absorption of the gum arabic can lead to inconsistent charging of the gum arabic because the current protocol does not correct for the moisture content of the gum arabic. Thus, it is valuable to understand the hydroscopic nature of the gum samples. The method selected for this determination was to dry the gum arabic samples in an oven, then to spread them in a thin layer in a weighing dish that is placed in a room at 22°C and 42% relative humidity. The weight was measured at different times and the increase in weight was plotted against time (fig. 12).
17

Normalized Moisture Gain
0.09 0.08 0.07 0.06 0.05 0.04 0.03 0.02 0.01
0
• •
~r:* 9 w
15^1 ^»
i
• 1
GA-1
• GA-2
-GA-3 GA-4
• GA-5
-GA-6
10 20
time (hr)
30 40
Figure 12 Normalized moisture gain
The weight gain is much higher for the Colony gum (GA-1 and GA-4), than for the other gums. The cause of this may be due to the higher surface areas for the Colony sample based upon its fine and more irregular surface area (ref. 10) compared to the other samples, rather than any great difference in the chemical hydrophilicity of the different gum arabic samples themselves.
Rate of Dissolution. The rate of dissolution of the gum arabic was carried out by adding 100 mL of deionized water to 17.5 g of the gum sample in a 250 mL beaker. The samples were gently stirred using a magnetic stir bar and a stir plate. Aliquots were removed at 0.5, 1.0,1.5, 2.0, 3.0, 5.0, 22.0, 23.0, and 24.0 hrs and the refractive index (Rl) measured. The Rl was used to have a numerical property compared to strictly visual observation. It was noted that the Rl values generally had a maximum value before a small decline. The complete dissolution of the gum was obtained by determining when the Rl value had virtually leveled off and reached a maximum. These times and the maximum Rl value are given in table 11:
Table 11 Rate of dissolution
Sample Time in hours Maximum
Virtual Max in Rl Value of Rl Colony (current) (GA-1) 1.5 3 1.3680 Colony (prior) (GA-4) 1 1 1.3700 Hummel (current) (GA-6) 1 1 1.3700 Hummel (repeat) (GA-2) 1.5 3 1.3706 Brenntag (GA-3) 1 1 1.3721 Quadra (GA-5) 0.5 0.5 1.3720
An example of the dissolution data is given for the Colony sample GA-1 (fig. 13) with the 0 time being the Rl index of the water.
18

Figure 13 Rl versus time
The rate of dissolution did not provide any likely differences between the gum samples. The differences are small after the first 1/2 hr and suspended insolubles and gas bubbles may have interfered with the measurements. During these tests, visual determination of the dissolution was also determined and the results are discussed under the Color Analysis section.
Optical Rotation. Organic compounds of the same formulation can be different on the attachment of atoms in such a way that the material can rotate polarized light to different degrees. Thus, a pure single compound has a defined degree of rotation. The light rotation of a sucrose solution in water is dependent upon the purity of the sucrose and the solution concen- tration. Addition of other carbohydrates will alter the optical rotation of the solution. For a long time optical rotation was used as a measure of purity of natural materials, including gum arabic. For our tests, sucrose solutions of different concentrations in distilled water were measured as a control on the Perkin-Elmer Model 141 polarimeter using a 589 nm lamp and 10 cm length cell at 68°F. The optical rotations of the gums were also measured at 2 and 10% concentration.
Table 12 Optical rotation in degrees
Sample Optical rotation in degrees
2% concentration 10% concentration Colony (current) (GA-1) -0.60 -3.20 Colony (prior) (GA-4) -0.51 -3.14 Hummel (current) (GA-6) -0.55 -2.90 Hummel (repeat) (GA-2) -0.57 -3.14 Brenntag (GA-3) 0.85 4.55 Quadra (GA-5) 1.00 4.74
19

The polarimeter values show that the Hummel and Colony material were similar, but the Brenntag/Quadra samples had different values. Although the optical rotation values have long been used as purity criteria, we agree with Anderson (ref. 11) that blending of different gums could lead to the target optical rotation. Anderson has proposed using a nuclear magnetic resonance method performed and documented in the section labeled "Sugar Analysis by Nuclear Magnetic Analysis" in this report.
Surface Tension by Contact Angle. The ability of a liquid to wet a surface is important for many processes, including adhesive bonding. A standard way to determine the ability of a liquid to wet or flow over a surface is to place a drop on a flat surface and measure the angle between the surface and the droplet surface with respect to air; the better the wetting, the lower the contact angle. Both the polarity properties of the surface and the liquid influence this angle (fig. 14).
*, Y LG
SL
Figure 14 Surface tension by contact angle diagram
After testing a number of variables, a test method was established using a Fibro PGX unit with 10 pl_ of dispersion (20% gum arabic in water) dropping onto an unpolished aluminum surface. The contact angle for each dispersion sample was measured five times. Two samples of water had contact angle values of 78.3 and 78.5 deg (table 13).
Table 13 Contact angle in degrees
Sample Contact angle in degrees
1-day 3-day Colony (current) (GA-1) 78.6 68.5 Colony (prior) (GA-4) 71.7 66.2 Hummel (current) (GA-6) 72.1 69.5 Hummel (repeat) (GA-2) 81.1 72.6 Brenntag (GA-3) 68.0 76.0 Quadra (GA-5) 64.7 69.3
Given the large variability in the measurements, there was no significant difference between the gum dispersions. All samples reduced the contact angle of the water. It was interesting that the Colony and Hummel samples decreased in contact angle, while the Brenntag/Quadra samples increased in contact angle between the data measured after 1 day versus 3 days after mixing.
20
Adhesion Tests - Shear. With the gum being the binder holding the other particles together in the primer, an adhesion test should be an important performance measure. A number of methods were examined because there was no information in the literature on the testing of gum arabic adhesion or any appropriate standard adhesion method used for a similar material. Therefore, two very different methods to evaluate the overall bond strength were used. This first test was aimed at examining differences in the cohesive strength of the gum arabic samples, while the next section covers a test that is aimed more at the adhesive strength. For both of these cases, at least one of the substrates in the test needs to be porous for drawing the water away from the bond line to produce a solid gum arabic film for the adhesive testing.
A common way to test the adhesive strength is to do a shear test where two pieces of the substrate are bonded at an overlap section of both pieces. The shear test involves pulling on the other ends of the bonded pieces until the bond or the substrate fails. For this type of test the substrates should be stiff. To have stiff, easily bonded, and moisture- absorbing substrates, pairs of rectangular pieces of maple veneer (0.08 cm thickness and 2.0 by 11.7 cm) were bonded with a small overlap (0.5 cm) giving a 1 cm2 bond. The samples were bonded under two conditions of 120°C for 2 min and 23°C for 10 min under 9.1 kg/cm pressure. The samples were then stored overnight and the strength was tested by pulling on the ends of the bonded specimen. The strength of the bond was measured as an average of three specimens. As shown in figure 15, there was not a large difference between the samples for each of the two methods, although the lowest strengths were for the Brenntag and Quadra samples. It was also observed that there were higher strengths for the room temperature bonds compared to the hot bonding method.
• 120C2min
D23C10min
GA1 GA2 GA3 GA4 GA5 GA6
Figure 15 Chart of shear strengths
Adhesion Tests - Peel. The shear adhesive tests in the previous method to determine the cohesive strength of the adhesive was used, but it was also necessary to use a peel test to measure the strength of the adhesive to the substrate. Again, one substrate was needed to be porous to allow the water in the gum arabic dispersion to be drawn away from the bond line. Thus, using wood as one of the substrates made sense. Several other materials were tried as other substrates: white office paper, glassine, and Tyvek. The bond strength was so great that white office paper and glassine tore before failure in the bond line was observed. The Tyvek worked reasonably well to provide bond line failure. The bonds were made by applying 0.21 g of 40% dispersion to a rectangular piece of wood of 0.08 cm thickness and 2.0 by 11.7 cm. Then, a piece of Tyvek was placed on the surface with about 1 cm not bonded on
21
one end, and 500 g of weight was placed upon the assembly and left overnight. Several angles were observed and rates of peel before settling on 180 deg and 60 in./min. This procedure was then used for all six samples (table 14). The wood sides of the samples were bonded to a metal plate using double side tape and tested using an I MASS peel tester, model TL-2200 with the results analyzed with IMASS peel software v0-9c.
Table 14 Peel force in grams
Sample Peel force in grams
Average Standard deviation Colony (current) (GA-1) 271 24 Colony (prior) (GA-4) 297 54 Hummel (current) (GA-6) 375 29 Hummel (repeat) (GA-2) 319 43 Brenntag (GA-3) 239 22 Quadra (GA-5) 267 27
The results show that the Hummel sample gave higher peel strength than the other samples, although for any future testing, more specimens would be required to improve the repeatability. Again the higher bond strength may reflect greater concentration of high molecular weight components and/or more protein content. Either of these qualities is consistent with bond strength. However, these tests used an adhesive film, while the actual use is more of a spot weld of particles. Of greater importance is that no way could be found to test the bonded surfaces that represented the actual chemical composition of the particles being bonded in the primer application.
Color Analysis. Color measurements are often used as a measure of purity. Especially with a white colored material, even small amounts of impurity readily show up in the solid form and even more so in the dispersion. However, it should be remembered that any colored impurity may be a very small amount of the product and may play no role in the performance of the product.
The ultraviolet (UV)-visible spectra from 200 to 1000 nm were measured for each of the samples. Just the graphs for the three main samples from each supplier are shown in figures 16 through 18. The Brenntag and Quadra gums were distinctive in having higher relative absorbance of the light above 240 nm. All gum arabic samples had a main peak in the 210 to 220 nm range, which is normal for carbonyl containing organics. The gums contain both organic acids and proteins. The greater absorbance at the longer wavelengths gave the Brenntag gum dispersions a distinctive light yellowish color. The spectra shown here are for samples at 30 wt.% dispersions measured on a Hitachi U-3010 spectrophotometer.
22
200
Colony after 5.0 hr.
400 600 800
UV-visible range
1C00
Figure 16 Color analysis: Colony sample after 5.0 hrs
Hummel after 5.0 Hr.
UV-visible range (nm)
1000
Figure 17 Color analysis: Hummel sample after 5.0 hrs
Brentag after 5.0 hr..
'.5200 400 600 800
UV-visible range (nm)
1000
Figure 18 Color analysis: Brenntag sample after 5.0 hrs
23
The Colony and Hummel samples were very similar in the UV-visible spectra, with the main absorbance being around 220 nm which is typical for organic acids. On the other hand, the Brenntag/Quadra samples had greater absorbance in the 300 to 400 nm that would indicate other compounds being present.
Although not part of the original plan, the visual appearance of the samples when the dissolution experiments were performed in the section labeled "Sugar Analysis by Nuclear Magnetic Analysis" of this part of the report was also recorded. It was interesting that two operators could tell each pair of samples from the other two pairs on the basis of visual appearance of the dispersions. The observed yellowness of the Brenntag/ Quadra sample dispersion was illustrated in the UV-visible spectra, and the insolubles of the Hummel sample dispersions were darker than that for the Colony sample dispersions. The Colony sample showed a translucent, cloudy, gel-like behavior. The Hummel and Brenntag/ Quadra sample formed a more opaque, chalky-like mixture. This may relate to the particle size in the dispersions, but this was not part of the original study plan.
Chemical Properties
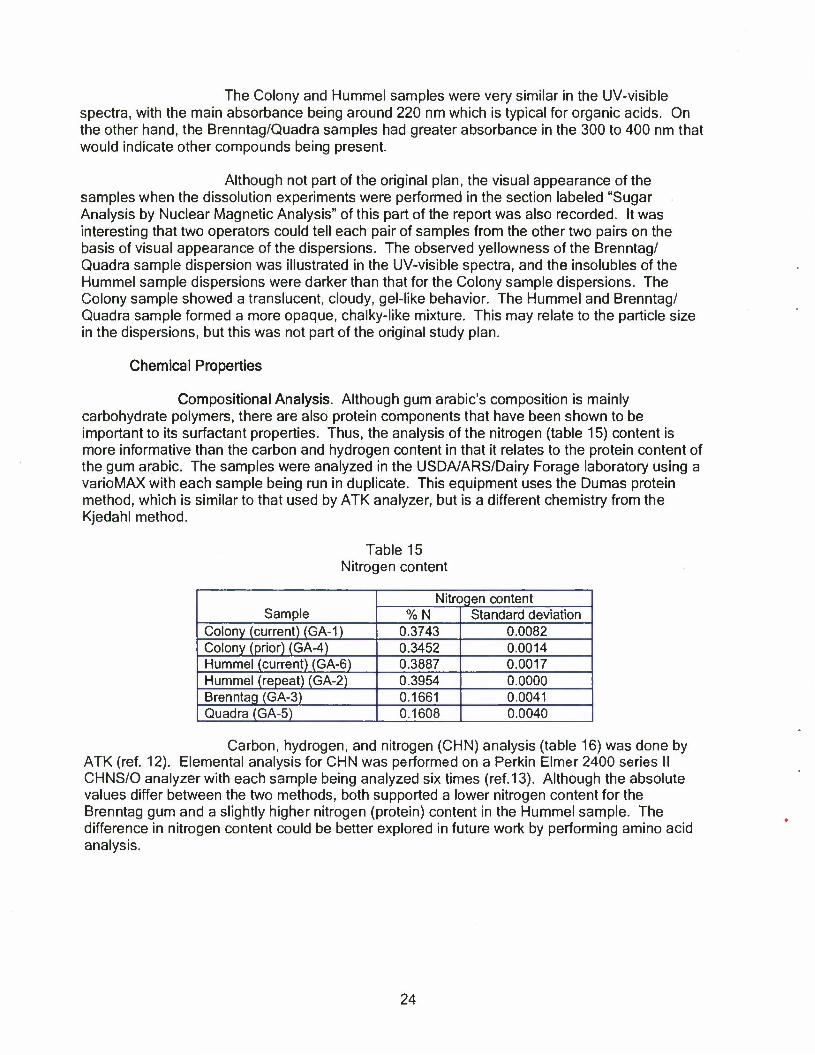
Compositional Analysis. Although gum arable's composition is mainly carbohydrate polymers, there are also protein components that have been shown to be important to its surfactant properties. Thus, the analysis of the nitrogen (table 15) content is more informative than the carbon and hydrogen content in that it relates to the protein content of the gum arabic. The samples were analyzed in the USDA/ARS/Dairy Forage laboratory using a varioMAX with each sample being run in duplicate. This equipment uses the Dumas protein method, which is similar to that used by ATK analyzer, but is a different chemistry from the Kjedahl method.
Table 15 Nitrogen content
Sample Nitrogen content
%N Standard deviation Colony (current) (GA-1) 0.3743 0.0082 Colony (prior) (GA-4) 0.3452 0.0014 Hummel (current) (GA-6) 0.3887 0.0017 Hummel (repeat) (GA-2) 0.3954 0.0000 Brenntag (GA-3) 0.1661 0.0041 Quadra (GA-5) 0.1608 0.0040
Carbon, hydrogen, and nitrogen (CHN) analysis (table 16) was done by ATK (ref. 12). Elemental analysis for CHN was performed on a Perkin Elmer 2400 series II CHNS/O analyzer with each sample being analyzed six times (ref. 13). Although the absolute values differ between the two methods, both supported a lower nitrogen content for the Brenntag gum and a slightly higher nitrogen (protein) content in the Hummel sample. The difference in nitrogen content could be better explored in future work by performing amino acid analysis.
24

Table 16 CHN analysis
Supplier Element Average ± 2 standard deviation Hummel Carbon 39.64±0.14 Brenntag Carbon 40.82±0.10 Colony Carbon 38.38±0.16 Hummel Hydrogen 6.22±0.10 Brenntag Hydrogen 5.97±0.10 Colony Hydrogen 6.26±0.30 Hummel Nitrogen 0.60±0.06 Brenntag Nitrogen 0.43±0.08 Colony Nitrogen 0.54±0.06
Molecular Weight by Gel Permeation Chromatography. The molecular weights of the components of the gum were investigated because the higher molecular portion tends to contain most of the protein-carbohydrate component. These proteins are often considered to influence positively the surface active properties (ref. 14). The different molecular weight components can be separated using gel permeation chromatography (fig. 19). Although several methods have been used, the procedure of Osman et al. (ref. 15) seemed to be the most useful. A high pressure liquid chromatography system was modified to run this method. The use of a UV detector gave much closer relative distribution of the different molecular weight components to that obtained by the multi-angle light scattering detector than did a Rl detector (ref. 16). The method that was used was gel permeation chromatography (GPC) using an Agilent 1100 high performance liquid chromatography (HPLC) system. The gum arabic dispersions (1% w/v dry wt.) in 0.5 m NaCI were fritted through 0.45 nm membrane filters and 100 uL were injected with the autosampler onto a Superose 6 column (Amersham Biosciences). The samples were eluted with 0.5 m NaCI at a flow rate of 0.5 mL/min and monitored by UV at 206 nm.
Colony (GA 1 Brenntag (GA 3) Quadra (GA 5)
Figure 19 Gel permeation chromatography
25
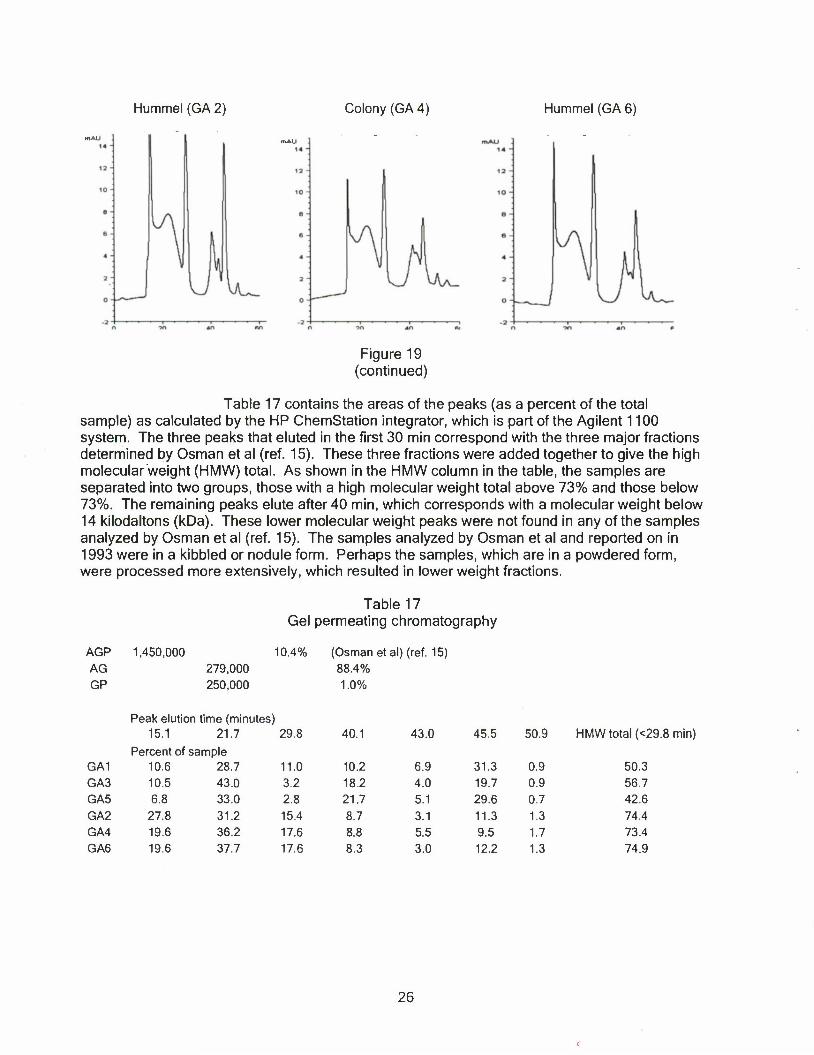
Hummel (GA 2) Colony (GA 4) Hummel (GA6)
Figure 19 (continued)
Table 17 contains the areas of the peaks (as a percent of the total sample) as calculated by the HP ChemStation integrator, which is part of the Agilent 1100 system. The three peaks that eluted in the first 30 min correspond with the three major fractions determined by Osman et al (ref. 15). These three fractions were added together to give the high molecular weight (HMW) total. As shown in the HMW column in the table, the samples are separated into two groups, those with a high molecular weight total above 73% and those below 73%. The remaining peaks elute after 40 min, which corresponds with a molecular weight below 14 kilodaltons (kDa). These lower molecular weight peaks were not found in any of the samples analyzed by Osman et al (ref. 15). The samples analyzed by Osman et al and reported on in 1993 were in a kibbled or nodule form. Perhaps the samples, which are in a powdered form, were processed more extensively, which resulted in lower weight fractions.
Table 17 Gel permeating chromatography
AGP 1,450,000 10.4% (Osman etal)(ref. 15) AG 279,000 88.4% GP 250,000 1.0%
Peak elution time (minutes 15.1 21.7
) 29.8 40.1 43.0 45.5 50.9 HMW total (<
GA1 Percent of sample
10.6 28.7 11.0 10.2 6.9 31.3 0.9 50.3 GA3 10.5 43.0 3.2 18.2 4.0 19.7 0.9 56.7 GA5 6.8 33.0 2.8 21.7 5.1 29.6 0.7 42.6 GA2 27.8 31.2 15.4 8.7 3.1 11.3 1.3 74.4 GA4 19.6 36.2 17.6 8.8 5.5 9.5 1.7 73.4 GA6 19.6 37.7 17.6 8.3 3.0 12.2 1.3 74.9
26

It was observed that the two Colony samples showed somewhat different molecular weight distributions, but that the Brenntag and Quadra samples were quite different from the Colony and Hummel samples. In gel permeation chromatography, the high molecular weight components elute from the column first. The Hummel sample has more of the high molecular weight components than the other gum arabic samples. This factor could be underlying the viscosity and peel strength results.
Infrared Spectroscopy. The gum arabic samples were examined by infrared spectroscopy because these spectra are usually sensitive to chemical composition. The spectra of carbohydrates are rather complex and tend to be similar because different sugars still tend to contain the same numbers of the same functional groups.
The infrared spectra of the six samples are very similar. To test this, the spectrum of each sample was overlapped with that of GA-2, Hummel. The spectral intensities were matched at 1435 cm'1. This absorbance band is largely attributed to skeletal motions of the carbon rings, CH and CH2 wagging motions all of which should be relatively common among the samples. The largest mismatch was observed between the GA-1, Colony and GA-2, Hummel samples. This is judged to be a small difference, which is mainly attributable to carbon/oxygen vibrations and is illustrated in figure 20.
Figure 20 Infrared spectroscopy
Infrared spectra of GA-1 overlapped with that of GA-2.
Sugar Analysis by Nuclear Magnetic Analysis. Concern about the purity of gum arabic for food uses has lead to extensive research on identifying the quality of the gums. Of the methods examined, Anderson (ref. 11) recommended the use of carbon-13 nuclear magnetic resonance spectroscopy (C-13 NMR) as being the most powerful method. Many of the other methods either are too dependent upon the specific gum source or cannot distinguish between the pure gum arabic and blends of gum. For example, blends of gums can be used to match the
27
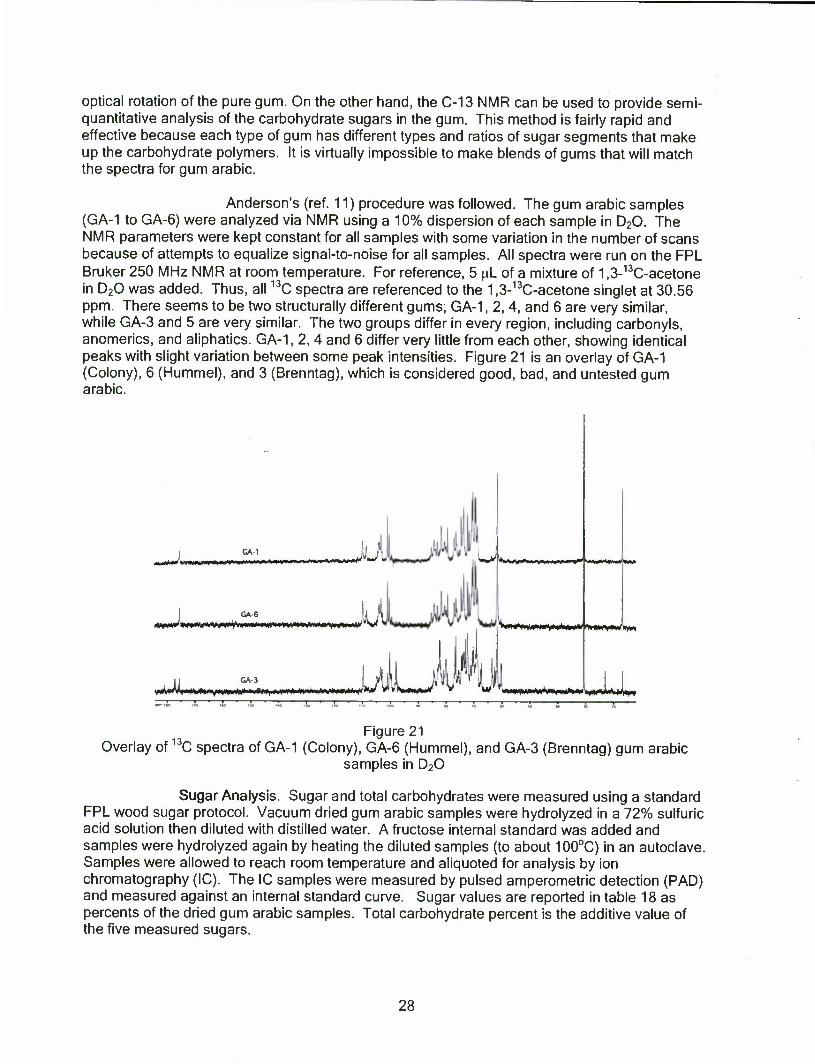
optical rotation of the pure gum. On the other hand, the C-13 NMR can be used to provide semi- quantitative analysis of the carbohydrate sugars in the gum. This method is fairly rapid and effective because each type of gum has different types and ratios of sugar segments that make up the carbohydrate polymers. It is virtually impossible to make blends of gums that will match the spectra for gum arabic.
Anderson's (ref. 11) procedure was followed. The gum arabic samples (GA-1 to GA-6) were analyzed via NMR using a 10% dispersion of each sample in D20. The NMR parameters were kept constant for all samples with some variation in the number of scans because of attempts to equalize signal-to-noise for all samples. All spectra were run on the FPL Bruker 250 MHz NMR at room temperature. For reference, 5 ^L of a mixture of 1,3-13C-acetone in D20 was added. Thus, all 13C spectra are referenced to the 1,3-13C-acetone singlet at 30.56 ppm. There seems to be two structurally different gums; GA-1, 2, 4, and 6 are very similar, while GA-3 and 5 are very similar. The two groups differ in every region, including carbonyls, anomerics, and aliphatics. GA-1, 2, 4 and 6 differ very little from each other, showing identical peaks with slight variation between some peak intensities. Figure 21 is an overlay of GA-1 (Colony), 6 (Hummel), and 3 (Brenntag), which is considered good, bad, and untested gum arabic.
IMH«/W
GA-1 I—M—0M%*> JJ
PWWW GA-6
GA-3
y^^M*»i*i"iy»»i>«i*»'»'»W'l»«i*'»*'«»lllil"*'»MWi»« I** ^X X - A Z 5 1 • ,1 IT
\AJWL~
^*^*rf*^w
*m0mmt*0+mm trnm/mnm
i^pwaw IM>
W)M»WwwWi> W^pr I • I • t • T • f
Figure 21 Overlay of 13C spectra of GA-1 (Colony), GA-6 (Hummel), and GA-3 (Brenntag) gum arabic
samples in D20
Sugar Analysis. Sugar and total carbohydrates were measured using a standard FPL wood sugar protocol. Vacuum dried gum arabic samples were hydrolyzed in a 72% sulfuric acid solution then diluted with distilled water. A fructose internal standard was added and samples were hydrolyzed again by heating the diluted samples (to about 100°C) in an autoclave. Samples were allowed to reach room temperature and aliquoted for analysis by ion chromatography (IC). The IC samples were measured by pulsed amperometric detection (PAD) and measured against an internal standard curve. Sugar values are reported in table 18 as percents of the dried gum arabic samples. Total carbohydrate percent is the additive value of the five measured sugars.
28
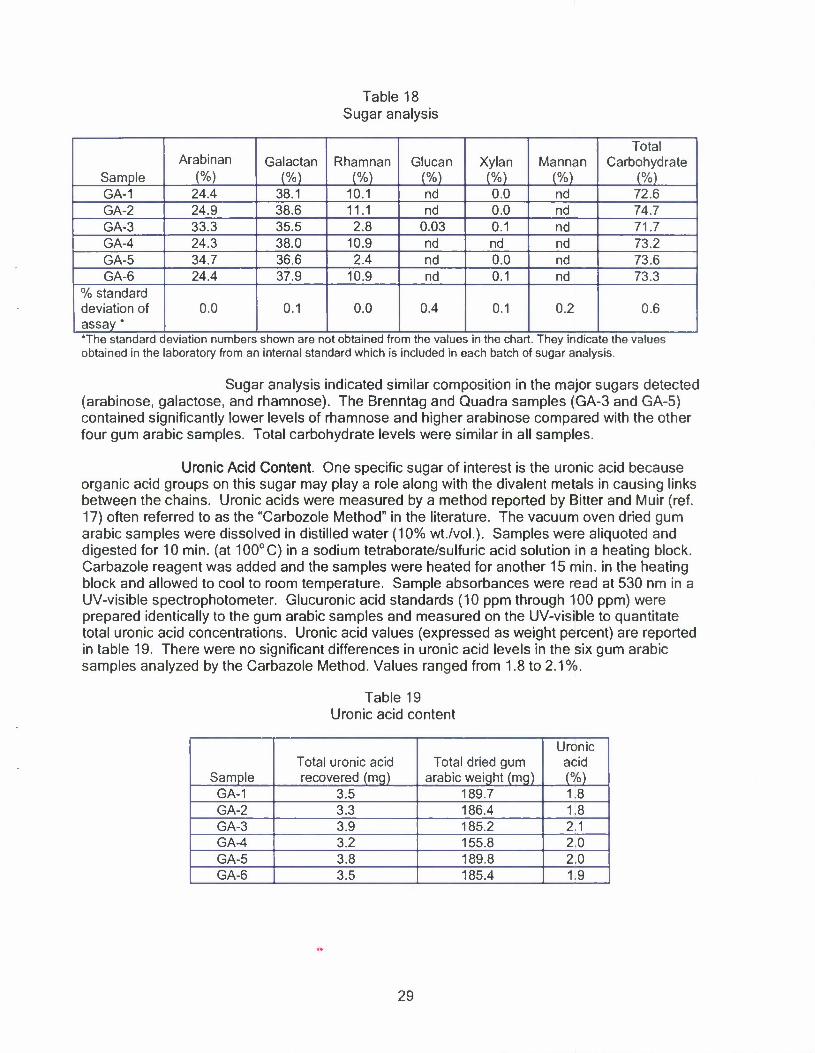
Table 18 Sugar analysis
Sample Arabinan
(%) Galactan
(%) Rhamnan
(%) Glucan
(%) Xylan
(%) Mannan
(%)
Total Carbohydrate
(%) GA-1 24.4 38.1 10.1 nd 0.0 nd 72.6 GA-2 24.9 38.6 11.1 nd 0.0 nd 74.7 GA-3 33.3 35.5 2.8 0.03 0.1 nd 71.7 GA-4 24.3 38.0 10.9 nd nd nd 73.2 GA-5 34.7 36.6 2.4 nd 0.0 nd 73.6 GA-6 24.4 37.9 10.9 nd 0.1 nd 73.3
% standard deviation of assay *
0.0 0.1 0.0 0.4 0.1 0.2 0.6
*The standard deviation numbers shown are not obtained from the values in the chart. They indicate the values obtained in the laboratory from an internal standard which is included in each batch of sugar analysis.
Sugar analysis indicated similar composition in the major sugars detected (arabinose, galactose, and rhamnose). The Brenntag and Quadra samples (GA-3 and GA-5) contained significantly lower levels of rhamnose and higher arabinose compared with the other four gum arabic samples. Total carbohydrate levels were similar in all samples.
Uronic Acid Content. One specific sugar of interest is the uronic acid because organic acid groups on this sugar may play a role along with the divalent metals in causing links between the chains. Uronic acids were measured by a method reported by Bitter and Muir (ref. 17) often referred to as the "Carbozole Method" in the literature. The vacuum oven dried gum arabic samples were dissolved in distilled water (10% wt./vol.). Samples were aliquoted and digested for 10 min. (at 100°C) in a sodium tetraborate/sulfuric acid solution in a heating block. Carbazole reagent was added and the samples were heated for another 15 min. in the heating block and allowed to cool to room temperature. Sample absorbances were read at 530 nm in a UV-visible spectrophotometer. Glucuronic acid standards (10 ppm through 100 ppm) were prepared identically to the gum arabic samples and measured on the UV-visible to quantitate total uronic acid concentrations. Uronic acid values (expressed as weight percent) are reported in table 19. There were no significant differences in uronic acid levels in the six gum arabic samples analyzed by the Carbazole Method. Values ranged from 1.8 to 2.1%.
Table 19 Uronic acid content
Sample Total uronic acid recovered (mg)
Total dried gum arabic weight (mg)
Uronic acid (%)
GA-1 3.5 189.7 1.8 GA-2 3.3 186.4 1.8 GA-3 3.9 185.2 2.1 GA-4 3.2 155.8 2.0 GA-5 3.8 189.8 2.0 GA-6 3.5 185.4 1.9
29
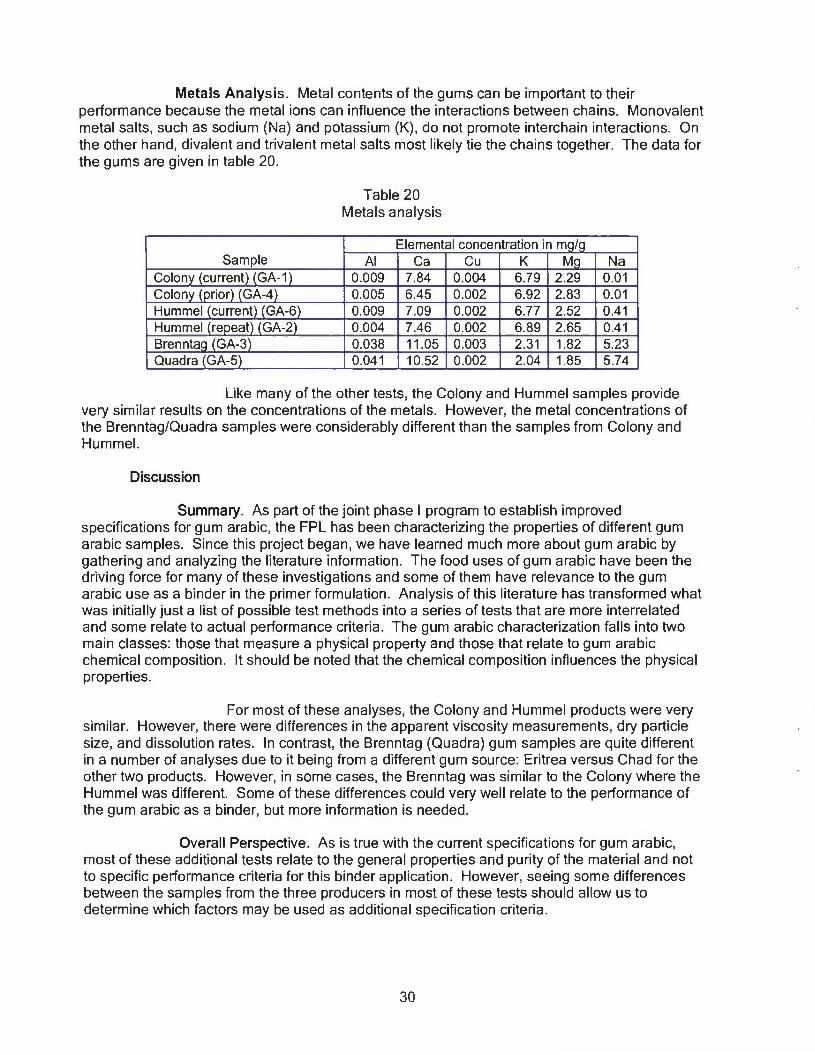
Metals Analysis. Metal contents of the gums can be important to their performance because the metal ions can influence the interactions between chains. Monovalent metal salts, such as sodium (Na) and potassium (K), do not promote interchain interactions. On the other hand, divalent and trivalent metal salts most likely tie the chains together. The data for the gums are given in table 20.
Table 20 Metals analysis
Sample Elemental concentration in mg/g
Al Ca Cu K Mg Na Colony (current) (GA-1) 0.009 7.84 0.004 6.79 2.29 0.01 Colony (prior) (GA-4) 0.005 6.45 0.002 6.92 2.83 0.01 Hummel (current) (GA-6) 0.009 7.09 0.002 6.77 2.52 0.41 Hummel (repeat) (GA-2) 0.004 7.46 0.002 6.89 2.65 0.41 Brenntag (GA-3) 0.038 11.05 0.003 2.31 1.82 5.23 Quadra (GA-5) 0.041 10.52 0.002 2.04 1.85 5.74
Like many of the other tests, the Colony and Hummel samples provide very similar results on the concentrations of the metals. However, the metal concentrations of the Brenntag/Quadra samples were considerably different than the samples from Colony and Hummel.
Discussion
Summary. As part of the joint phase I program to establish improved specifications for gum arabic, the FPL has been characterizing the properties of different gum arabic samples. Since this project began, we have learned much more about gum arabic by gathering and analyzing the literature information. The food uses of gum arabic have been the driving force for many of these investigations and some of them have relevance to the gum arabic use as a binder in the primer formulation. Analysis of this literature has transformed what was initially just a list of possible test methods into a series of tests that are more interrelated and some relate to actual performance criteria. The gum arabic characterization falls into two main classes: those that measure a physical property and those that relate to gum arabic chemical composition. It should be noted that the chemical composition influences the physical properties.
For most of these analyses, the Colony and Hummel products were very similar. However, there were differences in the apparent viscosity measurements, dry particle size, and dissolution rates. In contrast, the Brenntag (Quadra) gum samples are quite different in a number of analyses due to it being from a different gum source: Eritrea versus Chad for the other two products. However, in some cases, the Brenntag was similar to the Colony where the Hummel was different. Some of these differences could very well relate to the performance of the gum arabic as a binder, but more information is needed.
Overall Perspective. As is true with the current specifications for gum arabic, most of these additional tests relate to the general properties and purity of the material and not to specific performance criteria for this binder application. However, seeing some differences between the samples from the three producers in most of these tests should allow us to determine which factors may be used as additional specification criteria.
30

Although mixing the gum with water seems to provide a solution, the literature and our observations clearly indicate that the gum arabic forms dispersion in water, with the gum being suspended as droplets so fine that they scatter only a small amount of the visible light. This provides the low viscosity to the aqueous dispersions. Several pieces of data indicate that there are significant changes in these dispersions between 1 and 3 days after mixing.
To perform as a binder, the gum arabic has to have specific properties for both the mixing step and the final dry state. In the mixing step, the gum dispersion needs to be well distributed among the wet solid particles of the reactive chemicals and the gum molecules need to contact these reactive particles at the molecular level in order to work well as a binder. Thus, important properties are likely to be apparent for the gum dispersion viscosity and its surfactant properties so that the gum rapidly distributes among the other materials under the mild agitation of the blending process. Differences were observed in the apparent viscosity, but at this point there is not enough information to know if these differences relate to actual performance. The Hummel gum had a high apparent viscosity under very low shear conditions. This high viscosity, both Brookfield and fluid rheometer viscosity, may reflect large domains in the dispersion that result in greater domain-domain interaction, which could reflect interaction of dispersion particles or higher molecular weight components. This might inhibit the gum's even distribution in the mixing step. There did not seem to be large differences in the surface wetting properties. For the final dry state, the gum needs to bond the particles together. The adhesive strength of the gum to the particles and its cohesive strength need to be sufficient to hold the mixture together. In the adhesive tests that were developed, there were no large differences. However, the Hummel material exhibited slightly higher bonding strength in the peel test, which again could be a reflection of either higher molecular weight or higher protein content.
For testing, the three official samples from Colony, Hummel, and Brenntag and three additional samples of a different batch of the Colony, a Quadra sample, and a repeat of the Hummel were used. Although these additional samples were beyond the original scope of the FPL contract, it was felt that the newness of these tests needed additional samples to give us some confidence that the observed differences might be real. All tests were done in a blind manner in that the analyst did not know the source of each sample. It should be noted that all the tests conducted fell outside of the standard gum arabic qualification testing, but evaluation of the literature helped in some cases to define the procedures. In other cases, completely new tests had to be developed based upon past experiences. In any case, tests selected for the next phase will need to be investigated more thoroughly to establish a more defined procedure. Particle size of the dispersion droplets was not part of the program and should be part of the next phase.
To make this report easier to read, a large amount of data has been winnowed down to a few pieces of data in each area. As part of the third phase of the planned program, all the data, detailed methods, and evaluation of the literature information will be incorporated in a permanent FPL General Technical Report.
31
Alliant Techsystems Inc. (ATK)
Alliant Techsystems' work in phase I was to evaluate the gum solution physical property and shelf life, manufacture the FA-956 primer mix (ref. 1), conduct no. 34 primer (ref. 18) closed bomb and ballistic performance testing, and analyze the elementals in the gum materials.
Gum Solution Testing
Viscosity and Shelf-life Testing (ATK Task 300) (ref. 19) - per the scope of work (SOW) for gum arabic (ref. 20)
Gum Solution: Manufacture gum solution per standard process record and perform the following tests per table II (ref. 20). Gum solution concentration shall be identical for each sample and represents the production process.
Solution Viscosity: Viscosity of un-aged samples measured by the Brookfield Viscometer at 25°C may indicate composition differences. Results determine the gum solution baseline viscosity, gum process settings, and operating conditions, such as temperature, as well.
Solution Shelf-life: Conduct visual and olfactory observation (odor, appearance, color, etc.) and the viscosity measurement of the aged gum solution with a Brookfield Viscometer. The test shall be conducted with four variables for each sample (Colony, Hummel, and Quadra): cold (refrigerator temperature)/tap water, ambient (25°C)/tap water, cold/ distilled water, and ambient/distilled water. Single run for each variable and inspect/test the sample every week (every Friday) for a total of 4 weeks. All variables should be run in parallel. The results on visual/olfactory observation and viscosity shall be recorded at each specified interval and are to be used to determine the storage temperature and type of water to be used.
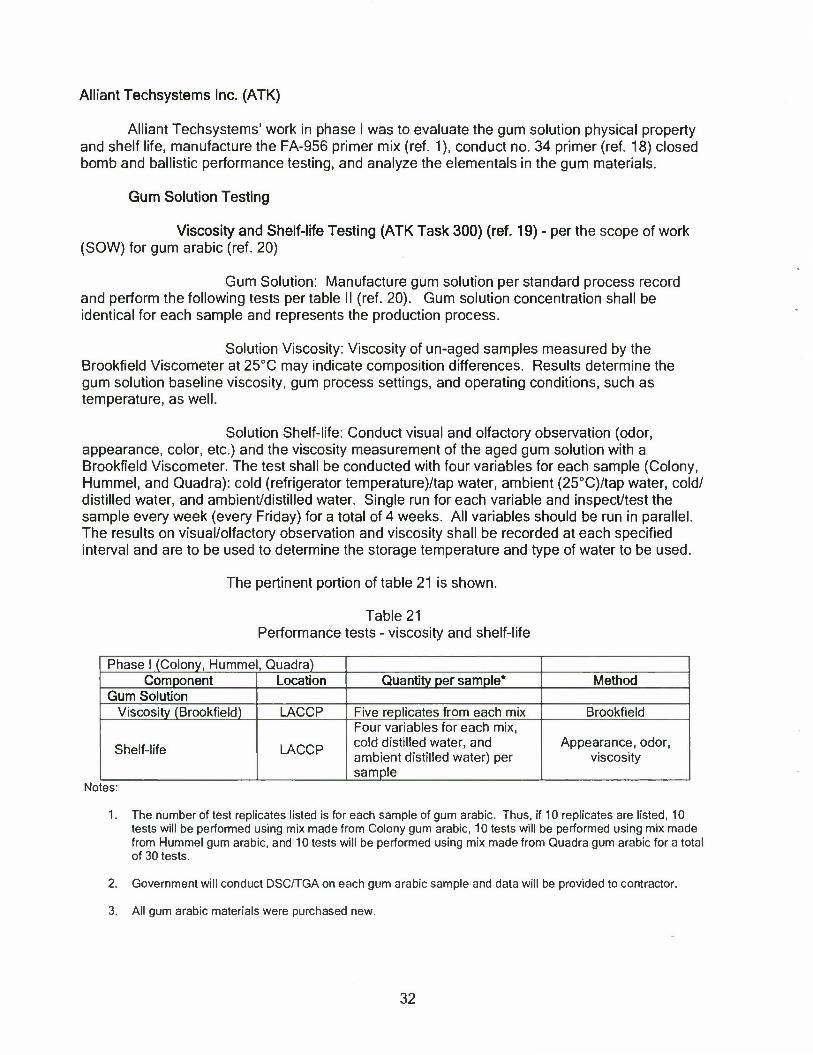
The pertinent portion of table 21 is shown.
Table 21 Performance tests - viscosity and shelf-life
Phase I (Colony, Humme , Quadra) Component Location Quantity per sample* Method
Gum Solution Viscosity (Brookfield) LACCP Five replicates from each mix Brookfield
Shelf-life LACCP
Four variables for each mix, cold distilled water, and ambient distilled water) per sample
Appearance, odor, viscosity
Notes:
1. The number of test replicates listed is for each sample of gum arabic. Thus, if 10 replicates are listed, 10 tests will be performed using mix made from Colony gum arabic, 10 tests will be performed using mix made from Hummel gum arabic, and 10 tests will be performed using mix made from Quadra gum arabic for a total of 30 tests.
2. Government will conduct DSC/TGA on each gum arabic sample and data will be provided to contractor.
3. All gum arabic materials were purchased new.
32
Viscosity at 25°C. Lake City Armament Division (LCAD) tested gum solution viscosity at 25°C using a Brookfield viscometer. The Brookfield was outfitted with a Brookfield LV4 spindle and set to 50 rpm. The solution was conditioned to ambient temperature. The solution was placed in a 300 cm3 tall-form glass beaker. The exact solution temperature was measured by the Brookfield's temperature probe. Temperature readings were taken at the same time as the viscosity. Both readings were taken 5 min after the spindle began spinning. Percent solids of the solutions were measured.
Work done prior to this project had already shown the Brookfield viscosity of gum arabic was complex (ref.21).
"Results indicated that the gum solution displayed shear-thinning- then-thickening (minima at approximately 40 rpm) behavior with increasing spindles RPM. It displayed time-dependence with increasing-then-decreasing viscosity (maxima at approximately 5 minutes). The solution also displayed inversely proportional temperature-dependence (decreasing viscosity with increasing temperature)."
Based on Nicholas Tharp's (ref. 21) recommendation and for comparison to historical data, the settings of 50 rpm spindle speed and an elapsed time of 5 min of spindle rotation were chosen, as well as using a 300 cm3 tall-form beaker.
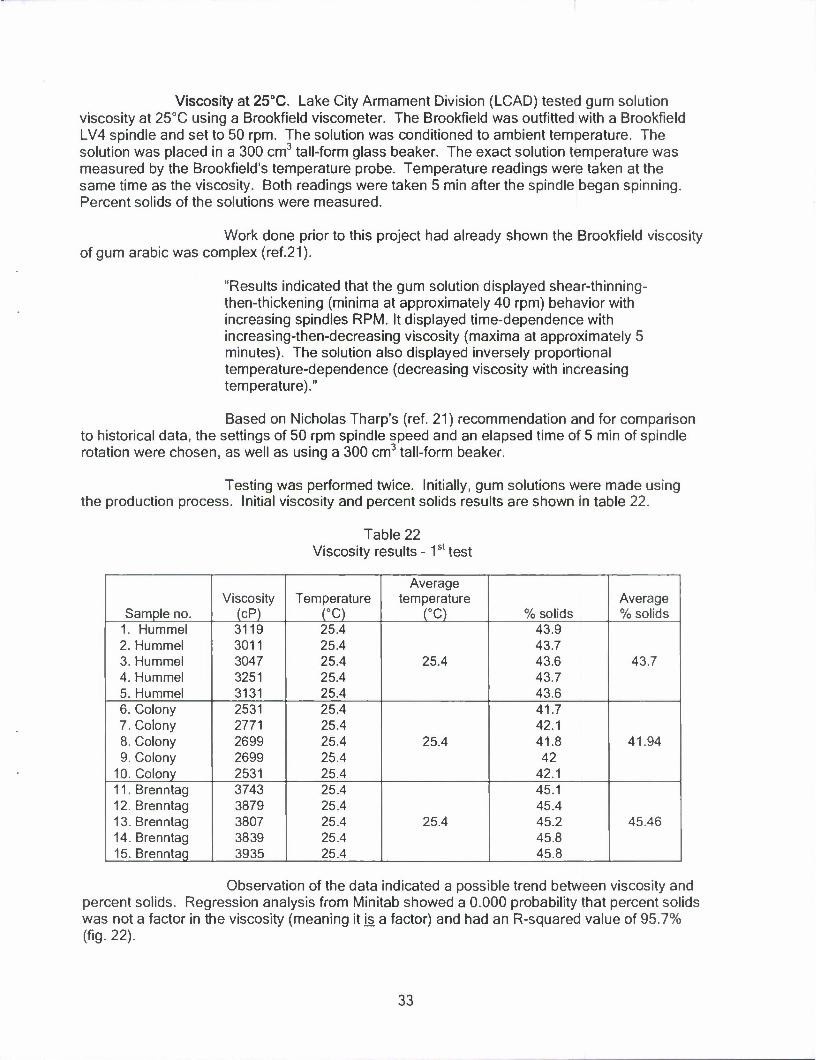
Testing was performed twice. Initially, gum solutions were made using the production process. Initial viscosity and percent solids results are shown in table 22.
Table 22 Viscosity results - 1st test
Average Viscosity Temperature temperature Average
Sample no. (cP) (°C) (°C) % solids % solids 1. Hummel 3119 25.4 43.9 2. Hummel 3011 25.4 43.7 3. Hummel 3047 25.4 25.4 43.6 43.7 4. Hummel 3251 25.4 43.7 5. Hummel 3131 25.4 43.6 6. Colony 2531 25.4 41.7 7. Colony 2771 25.4 42.1 8. Colony 2699 25.4 25.4 41.8 41.94 9. Colony 2699 25.4 42
10. Colony 2531 25.4 42.1 11. Brenntag 3743 25.4 45.1 12. Brenntag 3879 25.4 45.4 13. Brenntag 3807 25.4 25.4 45.2 45.46 14. Brenntag 3839 25.4 45.8 15. Brenntag 3935 25.4 45.8
Observation of the data indicated a possible trend between viscosity and percent solids. Regression analysis from Minitab showed a 0.000 probability that percent solids was not a factor in the viscosity (meaning it is a factor) and had an R-squared value of 95.7% (fig. 22).
33

Regression Analysis: Viscosity at 25.4°C versus % solids
The regression equation is
Viscosity at 25.4°C = -11480 + 336 %solids
Predictor Coef SE Coef T P
Constant -11479.8 866.9 -13.24 0.000
% solids 335.91 19.83 16.94 0.000
S = 111.448 R-Sq • = 95.7% R-Sq(adj) = 95.3%
Figure 22 Regression analysis - 1st test
It was concluded that the viscosity results were not reliable because of the change in percent solids. To fix this problem, the solutions' percent solids were adjusted by adding precise amounts of water, thereby, reducing the percent solids to a consistent value targeted at 41.7% (which is still inside specification limits for production). Solutions were thoroughly mixed after water addition and percent solids retested. The results looked good and viscosity was re-measured. Data from the second test is shown in table 23.
Table 23 Viscosity results - 2nd test
Average Viscosity Temperature temperature Average
Sample no. (cP) (°C) (°C) % solids % solids 1. Hummel 1740 25.1 41.68 2. Hummel 1704 25.3 41.55 3. Hummel 1824 25.1 25.16 41.77 41.676 4. Hummel 1764 25.3 41.69 5. Hummel 1800 25.0 41.69 6. Colony 1824 25.2 41.78 7. Colony 1776 25.1 41.69 8. Colony 1932 25.4 25.32 41.94 41.762 9. Colony 1800 25.5 41.62
10. Colony 1788 25.4 41.78 11. Brenntag 1992 25.6 41.89 12. Brenntag 2076 25.2 41.79 13. Brenntag 1812 25.1 25.32 41.8 41.592 14. Brenntag 1740 25.2 41.46 15. Brenntag 1560 25.5 41.02
34
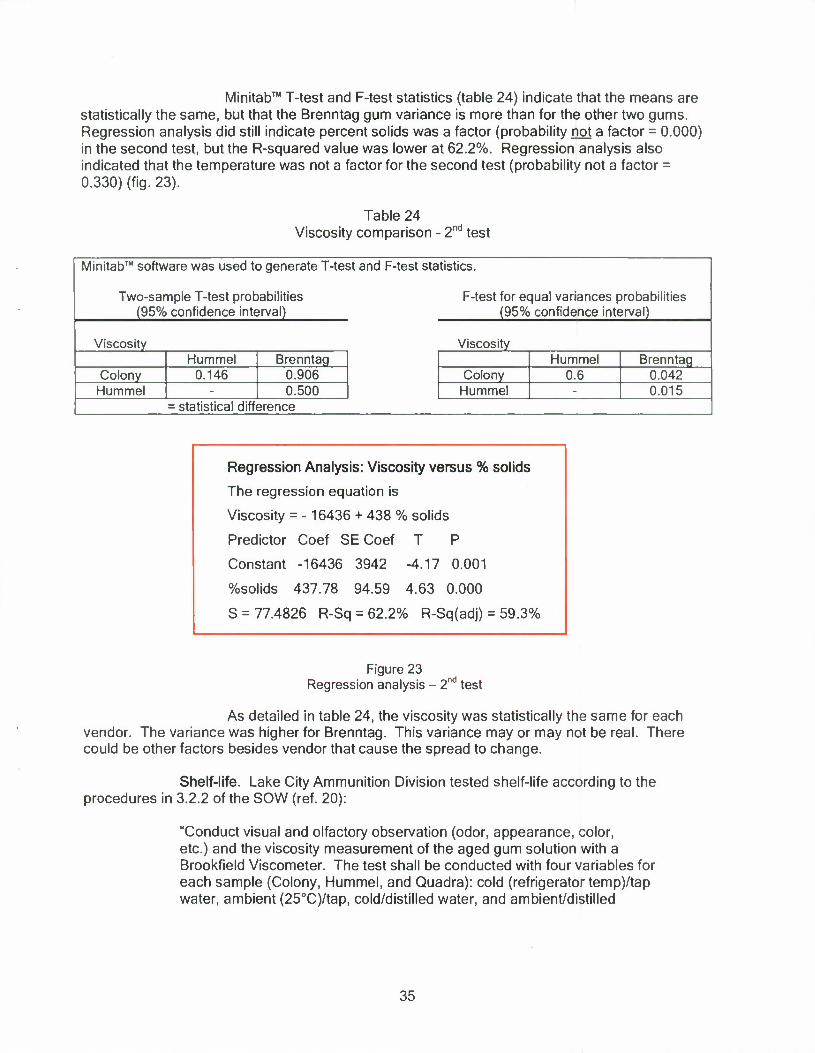
Minitab• T-test and F-test statistics (table 24) indicate that the means are statistically the same, but that the Brenntag gum variance is more than for the other two gums. Regression analysis did still indicate percent solids was a factor (probability not a factor = 0.000) in the second test, but the R-squared value was lower at 62.2%. Regression analysis also indicated that the temperature was not a factor for the second test (probability not a factor = 0.330) (fig. 23).
Table 24 Viscosity comparison - 2nd test
Minitab• software was used to generate T-te;
Two-sample T-test probabilities (95% confidence interval)
st and F-test sta tistics.
F-test for equal variances probabilities (95% confidence interval)
Viscosity Viscosity Hummel Brenntag Hummel Brenntag
Colony 0.146 0.906 Colony 0.6 0.042 Hummel - 0.500 Hummel - 0.015
= statistical difference
Regression Analysis: Viscosity versus % solids
The regression equation is
Viscosity = -16436 + 438 % solids
Predictor Coef SE Coef T P
Constant -16436 3942 -4.17 0.001
%solids 437.78 94.59 4.63 0.000
S = 77.4826 R-Sq = 62.2% R-Sq(adj) = 59.3%
Figure 23 nd Regression analysis - 2 test
As detailed in table 24, the viscosity was statistically the same for each vendor. The variance was higher for Brenntag. This variance may or may not be real. There could be other factors besides vendor that cause the spread to change.
Shelf-life. Lake City Ammunition Division tested shelf-life according to the procedures in 3.2.2 of the SOW (ref. 20):
"Conduct visual and olfactory observation (odor, appearance, color, etc.) and the viscosity measurement of the aged gum solution with a Brookfield Viscometer. The test shall be conducted with four variables for each sample (Colony, Hummel, and Quadra): cold (refrigerator tempVtap water, ambient (25°C)/tap, cold/distilled water, and ambient/distilled
35
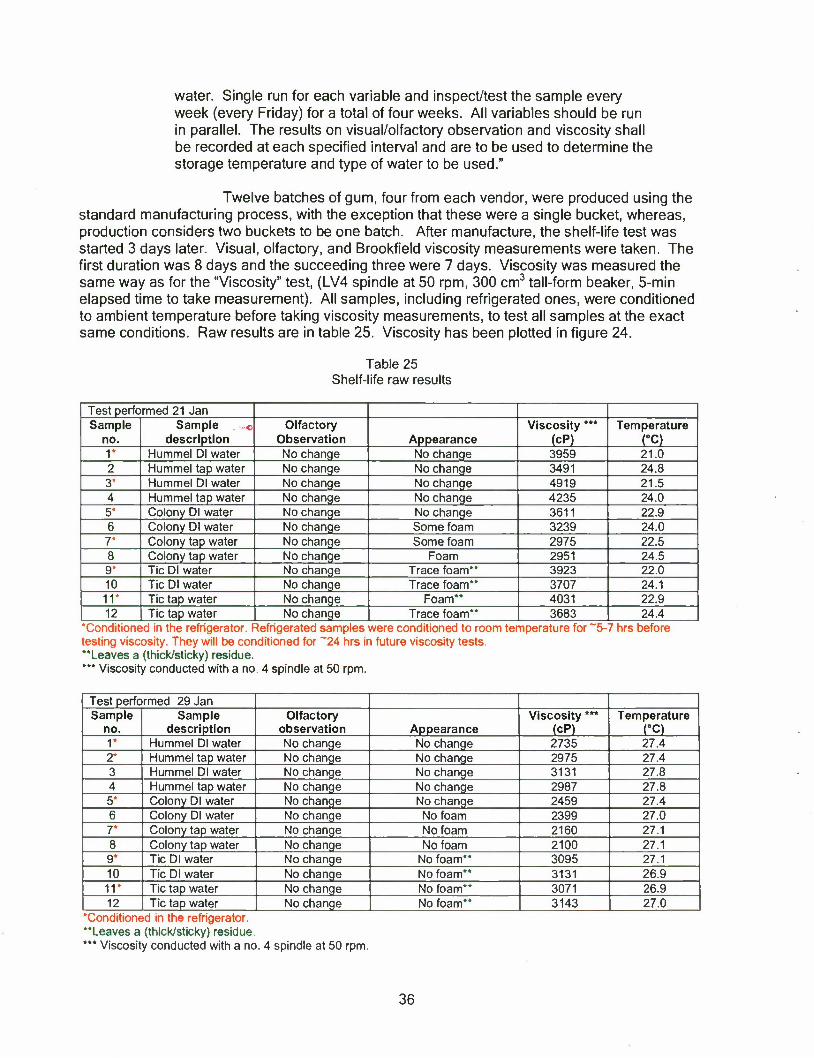
water. Single run for each variable and inspect/test the sample every week (every Friday) for a total of four weeks. All variables should be run in parallel. The results on visual/olfactory observation and viscosity shall be recorded at each specified interval and are to be used to determine the storage temperature and type of water to be used."
Twelve batches of gum, four from each vendor, were produced using the standard manufacturing process, with the exception that these were a single bucket, whereas, production considers two buckets to be one batch. After manufacture, the shelf-life test was started 3 days later. Visual, olfactory, and Brookfield viscosity measurements were taken. The first duration was 8 days and the succeeding three were 7 days. Viscosity was measured the same way as for the "Viscosity" test, (LV4 spindle at 50 rpm, 300 cm3 tall-form beaker, 5-min elapsed time to take measurement). All samples, including refrigerated ones, were conditioned to ambient temperature before taking viscosity measurements, to test all samples at the exact same conditions. Raw results are in table 25. Viscosity has been plotted in figure 24.
Table 25 Shelf-life raw results
Test performed 21 Jan Sample
no. Sample «
description Olfactory
Observation Appearance Viscosity ***
(cP) Temperature
(°C) 1* Hummel Dl water No change No change 3959 21.0 2 Hummel tap water No change No change 3491 24.8 3* Hummel Dl water No change No change 4919 21.5 4 Hummel tap water No change No change 4235 24.0 5* Colony Dl water No change No change 3611 22.9 6 Colony Dl water No change Some foam 3239 24.0 7* Colony tap water No change Some foam 2975 22.5 8 Colony tap water No change Foam 2951 24.5 9* Tic Dl water No change Trace foam** 3923 22.0 10 Tic Dl water No change Trace foam** 3707 24.1 IV Tic tap water No change Foam** 4031 22.9 12 Tic tap water No change Trace foam** 3683 24.4
"Conditioned in the refrigerator. Refrigerated samples were conditioned to room temperature for ~5-7 hrs before testing viscosity. They will be conditioned for ~24 hrs in future viscosity tests. "Leaves a (thick/sticky) residue. *** Viscosity conducted with a no. 4 spindle at 50 rpm.
Test performed 29 Jan Sample
no. Sample
description Olfactory
observation Appearance Viscosity ***
(cP) Temperature
<°C) V Hummel Dl water No change No change 2735 27.4 2 Hummel tap water No change No change 2975 27.4 3 Hummel Dl water No change No change 3131 27.8 4 Hummel tap water No change No change 2987 27.8 5* Colony Dl water No change No change 2459 27.4 6 Colony Dl water No change No foam 2399 27.0 7* Colony tap water No change No foam 2160 27.1 8 Colony tap water No change No foam 2100 27.1 9' Tic Dl water No change No foam** 3095 27.1 10 Tic Dl water No change No foam** 3131 26.9 11* Tic tap water No change No foam** 3071 26.9 12 Tic tap water No change No foam** 3143 27.0
'Conditioned in the refrigerator. "Leaves a (thick/sticky) residue. *** Viscosity conducted with a no. 4 spindle at 50 rpm.
36
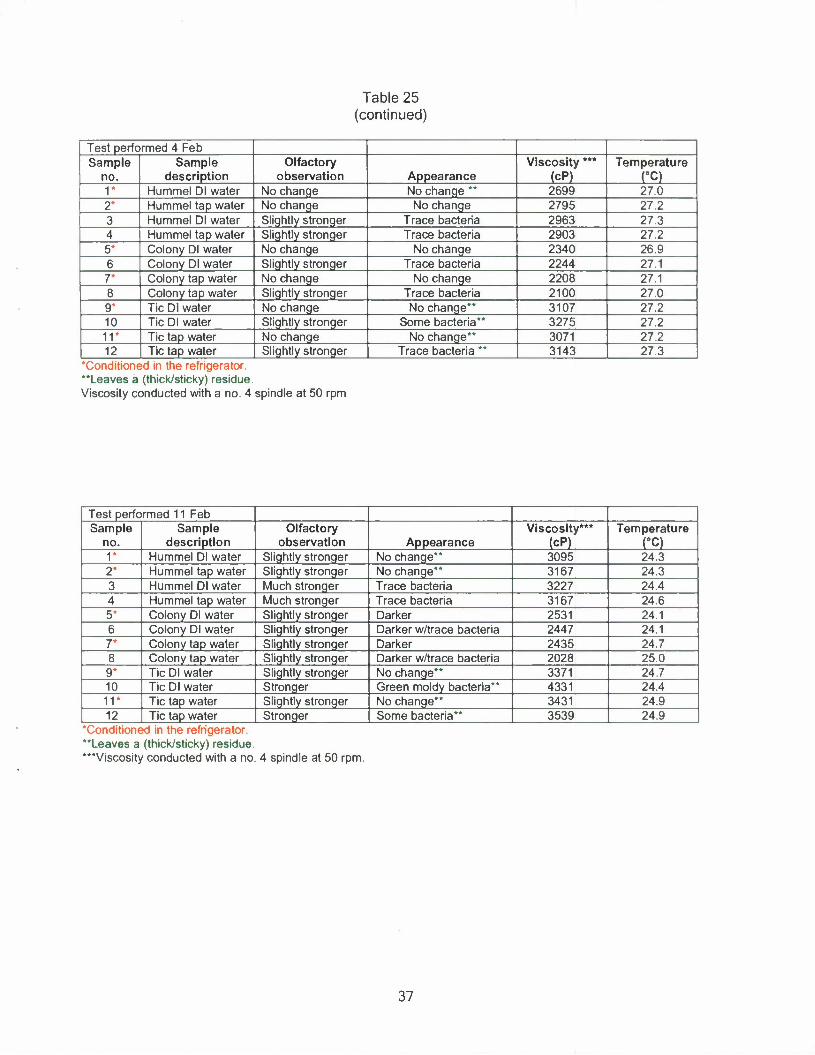
Table 25 (continued)
Test performed 4 Feb Sample
no. Sample
description Olfactory
observation Appearance Viscosity ***
(cP) Temperature
CO 1* Hummel Dl water No change No change " 2699 27.0 2* Hummel tap water No change No change 2795 27.2 3 Hummel Dl water Slightly stronger Trace bacteria 2963 27.3 4 Hummel tap water Slightly stronger Trace bacteria 2903 27.2 5* Colony Dl water No change No change 2340 26.9 6 Colony Dl water Slightly stronger Trace bacteria 2244 27.1 7* Colony tap water No change No change 2208 27.1 8 Colony tap water Slightly stronger Trace bacteria 2100 27.0 9* Tic Dl water No change No change** 3107 27.2 10 Tic Dl water Slightly stronger Some bacteria** 3275 27.2 11* Tic tap water No change No change** 3071 27.2 12 Tic tap water Slightly stronger Trace bacteria ** 3143 27.3
'Conditioned in the refrigerator "Leaves a (thick/sticky) residue. Viscosity conducted with a no. 4 spindle at 50 rpm
Test performed 11 Feb Sample
no. Sample
description Olfactory
observation Appearance Viscosity*"
(cP) Temperature
(°C) 1* Hummel Dl water Slightly stronger No change" 3095 24.3 2* Hummel tap water Slightly stronger No change" 3167 24.3 3 Hummel Dl water Much stronger Trace bacteria 3227 24.4 4 Hummel tap water Much stronger Trace bacteria 3167 24.6 5' Colony Dl water Slightly stronger Darker 2531 24.1 6 Colony Dl water Slightly stronger Darker w/trace bacteria 2447 24.1 7* Colony tap water Slightly stronger Darker 2435 24.7 8 Colony tap water Slightly stronger Darker w/trace bacteria 2028 25.0 9 Tic Dl water Slightly stronger No change** 3371 24.7 10 Tic Dl water Stronger Green moldy bacteria** 4331 24.4 11' Tic tap water Slightly stronger No change** 3431 24.9 12 Tic tap water Stronger Some bacteria** 3539 24.9
"Conditioned in the refrigerator. "Leaves a (thick/sticky) residue. "'Viscosity conducted with a no. 4 spindle at 50 rpm.
37
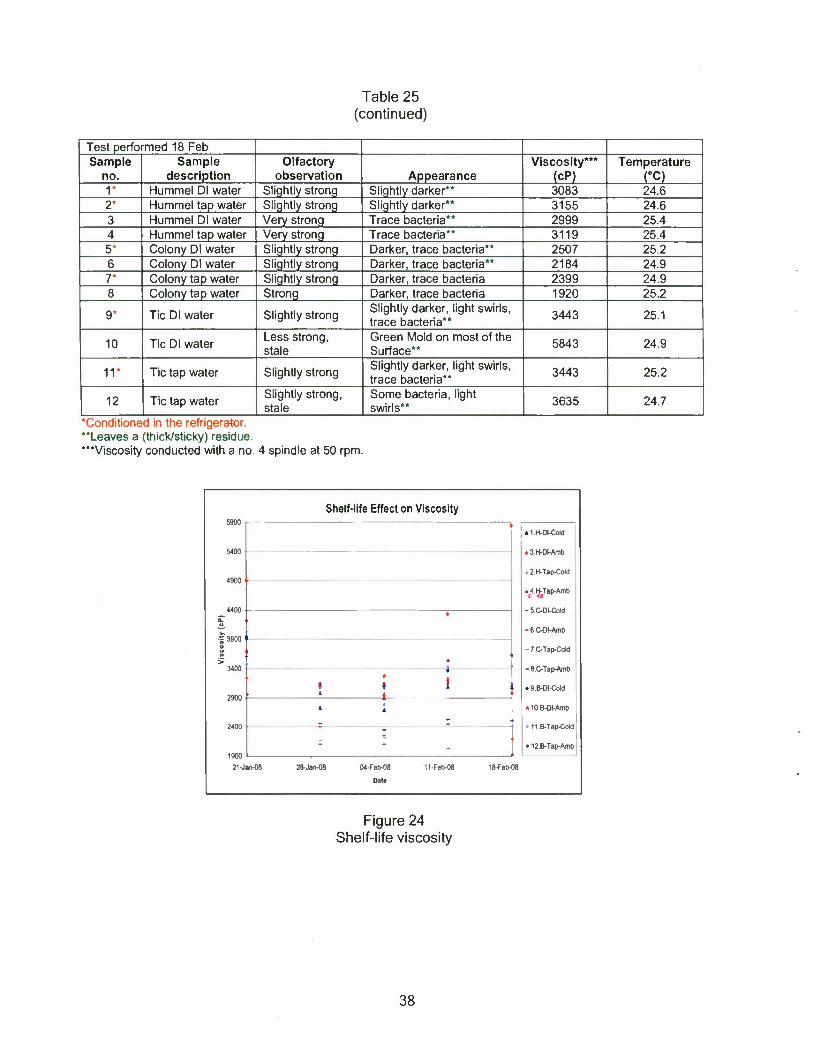
Table 25 (continued)
Test performed 18 Feb Sample
no. Sample
description Olfactory
observation Appearance Viscosity***
(cP) Temperature
PC) r Hummel Dl water Slightly strong Slightly darker" 3083 24.6 2* Hummel tap water Slightly strong Slightly darker" 3155 24.6 3 Hummel Dl water Very strong Trace bacteria" 2999 25.4 4 Hummel tap water Very strong Trace bacteria" 3119 25.4 5* Colony Dl water Slightly strong Darker, trace bacteria** 2507 25.2 6 Colony Dl water Slightly strong Darker, trace bacteria** 2184 24.9 7 Colony tap water Slightly strong Darker, trace bacteria 2399 24.9 8 Colony tap water Strong Darker, trace bacteria 1920 25.2
9' Tic Dl water Slightly strong Slightly darker, light swirls, trace bacteria** 3443 25.1
10 Tic Dl water Less strong, stale
Green Mold on most of the Surface** 5843 24.9
11' Tic tap water Slightly strong Slightly darker, light swirls, trace bacteria**
3443 25.2
12 Tic tap water Slightly strong, stale
Some bacteria, light swirls** 3635 24.7
•Conditioned in the refrigerator. "Leaves a (thick/sticky) residue. •"Viscosity conducted with a no. 4 spindle at 50 rpm.
5900 •
Shelf-life Effect on Viscosity
5400
•
1
3400
2900
1 « 1
i * A
2400
190(1
_ 3
- S
»1H-DI-Cold
13.H-DI-Amb
. 2H-Tap-CokJ
«4.l£Tap-Amb
-5C-DI-Cold
-6-C-DI-Amb
- 7.C-Tap-Cold
- fl.C-Tap-Amb
• 9B-DI-Cold
• 10.8-DI-AmD
• 11.B-Tap-Cold
• 12.B-Tap-Amt>
21-Jan-08 04-Feb-08
Date
11-Feb-08 18-Feb-08
Figure 24 Shelf-life viscosity
38
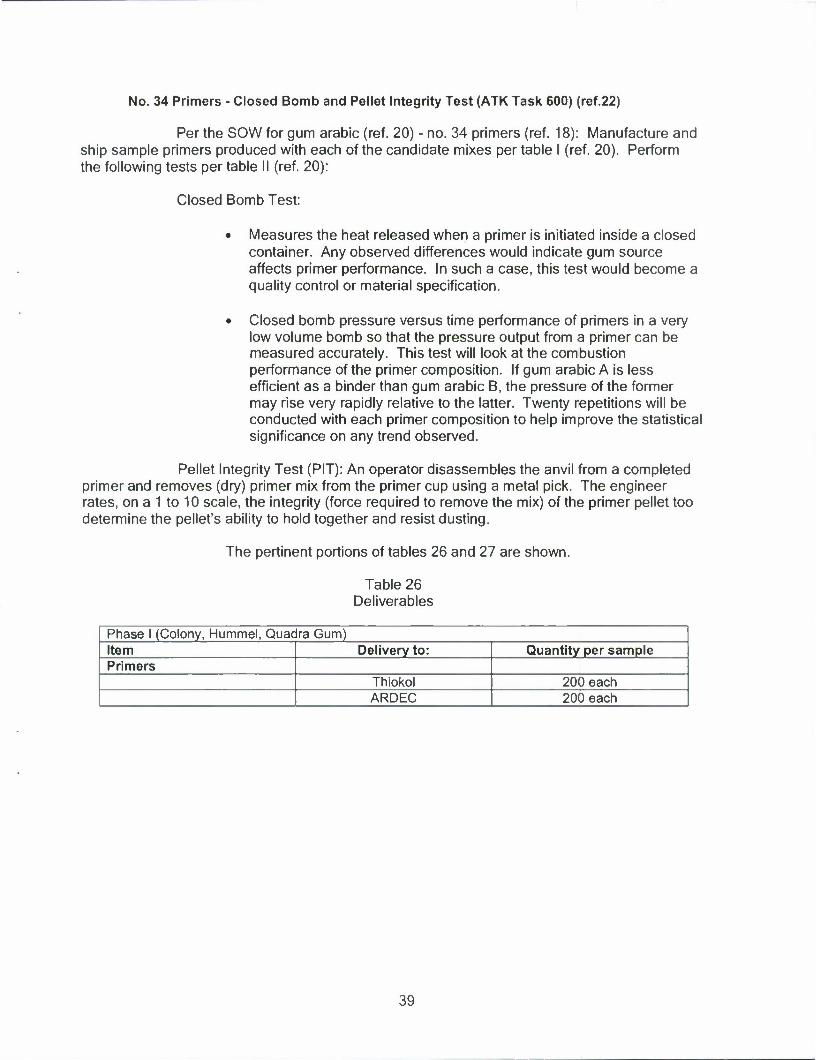
No. 34 Primers - Closed Bomb and Pellet Integrity Test (ATK Task 600) (ref.22)
Per the SOW for gum arabic (ref. 20) - no. 34 primers (ref. 18): Manufacture and ship sample primers produced with each of the candidate mixes per table I (ref. 20). Perform the following tests per table II (ref. 20):
Closed Bomb Test:
• Measures the heat released when a primer is initiated inside a closed container. Any observed differences would indicate gum source affects primer performance. In such a case, this test would become a quality control or material specification.
• Closed bomb pressure versus time performance of primers in a very low volume bomb so that the pressure output from a primer can be measured accurately. This test will look at the combustion performance of the primer composition. If gum arabic A is less efficient as a binder than gum arabic B, the pressure of the former may rise very rapidly relative to the latter. Twenty repetitions will be conducted with each primer composition to help improve the statistical significance on any trend observed.
Pellet Integrity Test (PIT): An operator disassembles the anvil from a completed primer and removes (dry) primer mix from the primer cup using a metal pick. The engineer rates, on a 1 to 10 scale, the integrity (force required to remove the mix) of the primer pellet too determine the pellet's ability to hold together and resist dusting.
The pertinent portions of tables 26 and 27 are shown.
Table 26 Deliverables
Phase I (Colony, Hummel, Quadra Gum) Item Delivery to: Quantity per sample Primers
Thiokol 200 each ARDEC 200 each
39
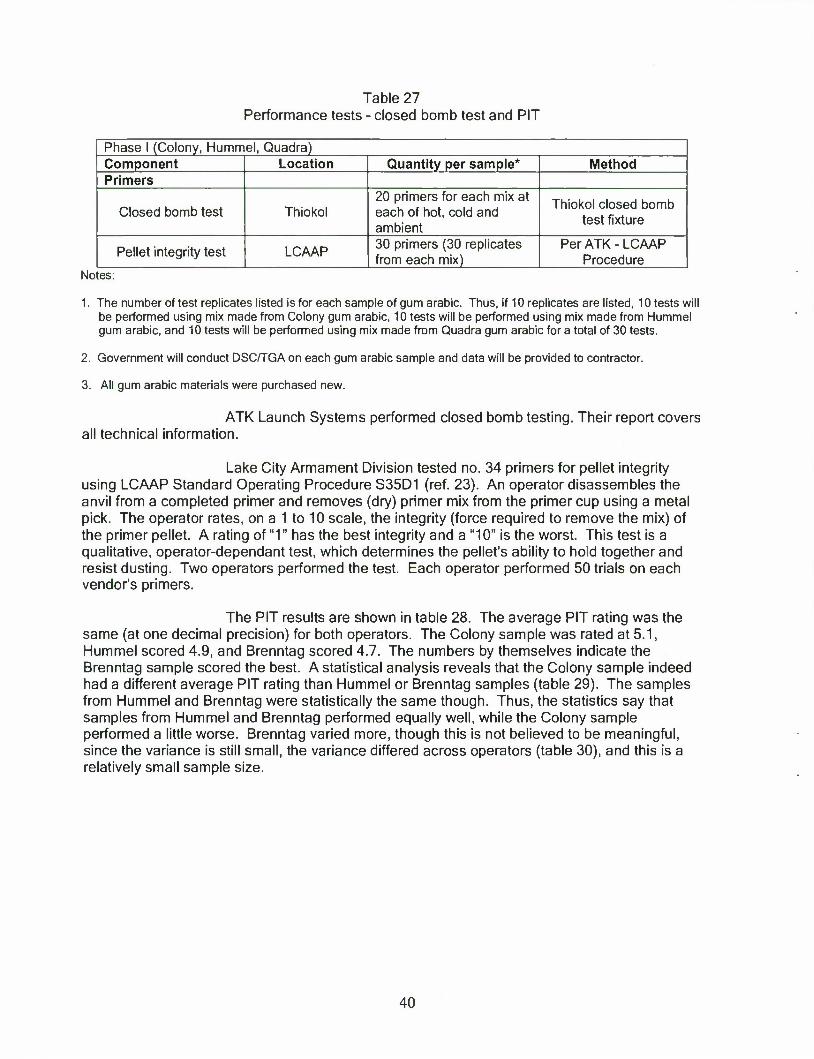
Table 27 Performance tests - closed bomb test and PIT
Phase 1 (Colony, Hummel, Quadra) Component Location Quantity per sample* Method Primers
Closed bomb test Thiokol 20 primers for each mix at each of hot, cold and ambient
Thiokol closed bomb test fixture
Pellet integrity test LCAAP 30 primers (30 replicates from each mix)
Per ATK - LCAAP Procedure
Notes:
1. The number of test replicates listed is for each sample of gum arabic. Thus, if 10 replicates are listed, 10 tests will be performed using mix made from Colony gum arabic, 10 tests will be performed using mix made from Hummel gum arabic, and 10 tests will be performed using mix made from Quadra gum arabic for a total of 30 tests.
2. Government will conduct DSC/TGA on each gum arabic sample and data will be provided to contractor.
3. All gum arabic materials were purchased new.
ATK Launch Systems performed closed bomb testing. Their report covers all technical information.
Lake City Armament Division tested no. 34 primers for pellet integrity using LCAAP Standard Operating Procedure S35D1 (ref. 23). An operator disassembles the anvil from a completed primer and removes (dry) primer mix from the primer cup using a metal pick. The operator rates, on a 1 to 10 scale, the integrity (force required to remove the mix) of the primer pellet. A rating of "1" has the best integrity and a "10" is the worst. This test is a qualitative, operator-dependant test, which determines the pellet's ability to hold together and resist dusting. Two operators performed the test. Each operator performed 50 trials on each vendor's primers.
The PIT results are shown in table 28. The average PIT rating was the same (at one decimal precision) for both operators. The Colony sample was rated at 5.1, Hummel scored 4.9, and Brenntag scored 4.7. The numbers by themselves indicate the Brenntag sample scored the best. A statistical analysis reveals that the Colony sample indeed had a different average PIT rating than Hummel or Brenntag samples (table 29). The samples from Hummel and Brenntag were statistically the same though. Thus, the statistics say that samples from Hummel and Brenntag performed equally well, while the Colony sample performed a little worse. Brenntag varied more, though this is not believed to be meaningful, since the variance is still small, the variance differed across operators (table 30), and this is a relatively small sample size.
40
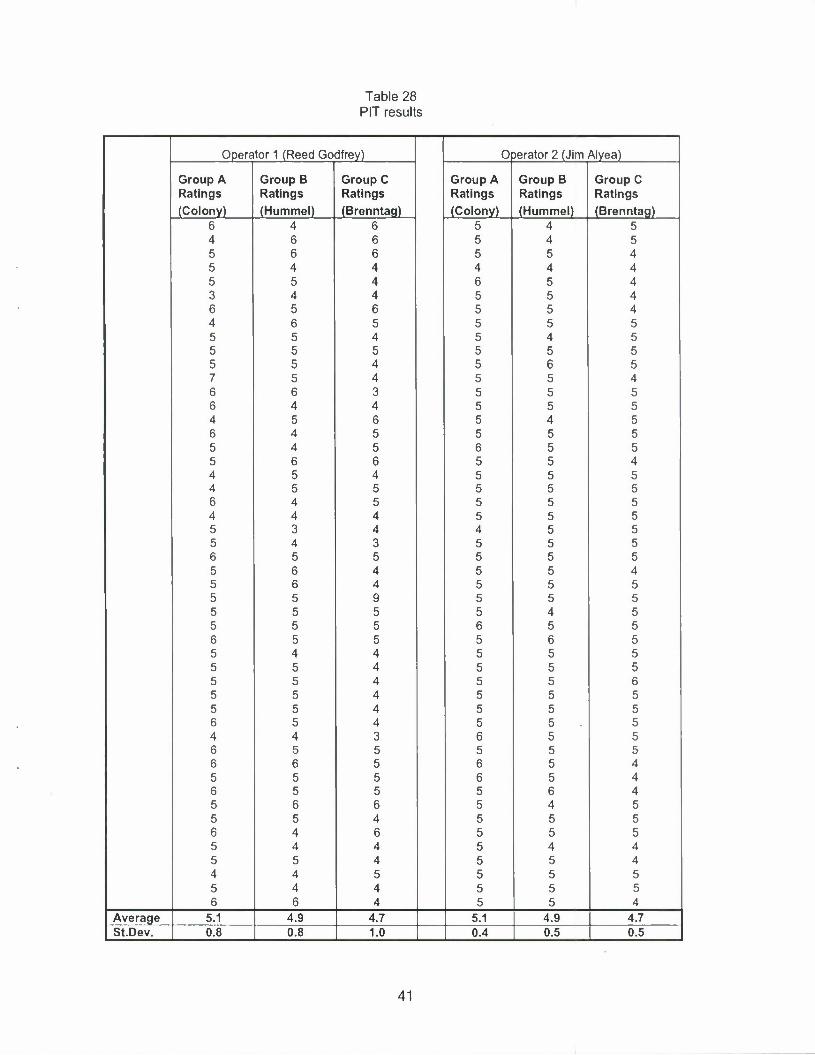
Table 28 PIT results
Operator 1 (Reed Godfrey) 0 jerator 2 (Jim Myea)
Group A Group B Group C Group A Group B Group C Ratings Ratings Ratings Ratings Ratings Ratings (Colony) (Hummel) (Brenntag) (Colony) (Hummel) (Brenntag)
6 4 6 5 4 5 4 6 6 5 4 5 5 6 6 5 5 4 5 4 4 4 4 4 5 5 4 6 5 4 3 4 4 5 5 4 6 5 6 5 5 4 4 6 5 5 5 5 5 5 4 5 4 5 5 5 5 5 5 5 5 5 4 5 6 5 7 5 4 5 5 4 6 6 3 5 5 5 6 4 4 5 5 5 4 5 6 5 4 5 6 4 5 5 5 5 5 4 5 6 5 5 5 6 6 5 5 4 4 5 4 5 5 5 4 5 5 5 5 5 6 4 5 5 5 5 4 4 4 5 5 5 5 3 4 4 5 5 5 4 3 5 5 5 6 5 5 5 5 5 5 6 4 5 5 4 5 6 4 5 5 5 5 5 9 5 5 5 5 5 5 5 4 5 5 5 5 6 5 5 6 5 5 5 6 5 5 4 4 5 5 5 5 5 4 5 5 5 5 5 4 5 5 6 5 5 4 5 5 5 5 5 4 5 5 5 6 5 4 5 5 5 4 4 3 6 5 5 6 5 5 5 5 5 6 6 5 6 5 4 5 5 5 6 5 4 6 5 5 5 6 4 5 6 6 5 4 5 5 5 4 5 5 5 6 4 6 5 5 5 5 4 4 5 4 4 5 5 4 5 5 4 4 4 5 5 5 5 5 4 4 5 5 5 6 6 4 5 5 4
Average 5.1 4.9 4.7 5.1 4.9 4.7 St.Dev. 0.8 0.8 1.0 0.4 0.5 0.5
41

Table 29 PIT gum vendor: analysis of means and variance
Minitab• software was used to generate'
Purpose: To determine if there was a diff(
Two-sample T-test probabilities (95% confidence interval)
F-test and F-te
irence betwee
st statistics
n the gum vendors
F-test for equal variance probabilities (95% confidence interval)
Hummel Brenntag Hummel Brenntag Colony 0.013 0.00 Colony 0.838 0.005
Hummel - 0.081 Hummel - 0.010
Table 30 PIT operator: analysis of means and variance
Mimitab• software was used to genera
Purpose: To determine if there was a di
Two-sample T-test probabilities (95% confidence interval)
te T-test and
fference betw
F-test statistics
een the two operators
F-test for equal variances probabilities (95% confidence interval)
Operator 1 versus Operator 2 Operator 1 versus Operator 2 Colony Hummel Brenntag Colony Hummel Brenntag All gums 0.746 0.751 0.624 0.000 0.001 0.000 0.000
These results were compared to Brunig's (ref. 24) (table 31). Numerically, gum arabic from Hummel and Brenntag scored essentially the same in this and Brunig's tests, 4.9 and 4.7, respectively. However, Colony gum arabic scored about 4.8 in Brunig's test compared to 5.1 in this one.
Table 31 Brunig's versus Mansfield's PIT ratings
Comparison of PIT Data (ref. 22)
Vendor Lot Number Mansfield's Results Brunig's Results Colony Different 5.1 4.8 Hummel Same 4.9 4.9 Brenntag Different 4.7 4.8
Statistics shown in table 30 prove the two operators got the same average PIT for each vendor, but that Operator 1 consistently had higher variance in his score than Operator 2. Since the means were the same, both operators' results were combined into a single data set, even though the variance was different.
42
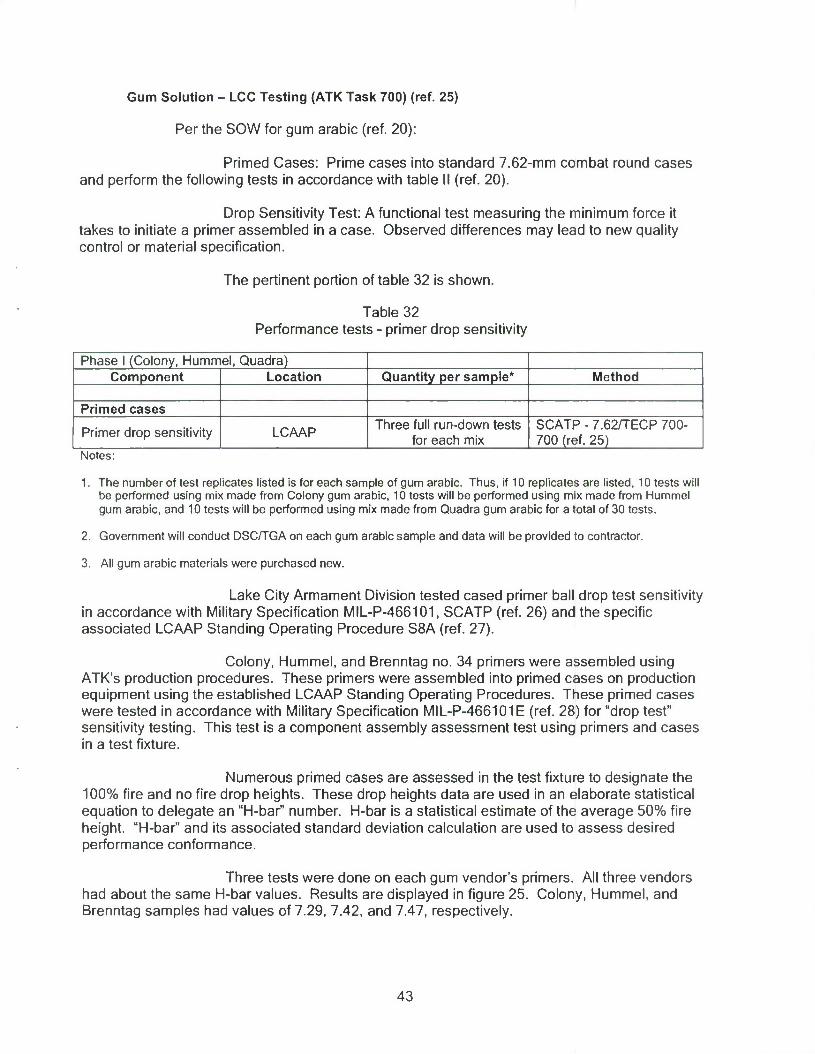
Gum Solution - LCC Testing (ATK Task 700) (ref. 25)
Per the SOW for gum arabic (ref. 20):
Primed Cases: Prime cases into standard 7.62-mm combat round cases and perform the following tests in accordance with table II (ref. 20).
Drop Sensitivity Test: A functional test measuring the minimum force it takes to initiate a primer assembled in a case. Observed differences may lead to new quality control or material specification.
The pertinent portion of table 32 is shown.
Table 32 Performance tests - primer drop sensitivity
Phase 1 (Colony, Hummel, Quadra) Component Location Quantity per sample* Method
Primed cases
Primer drop sensitivity LCAAP Three full run-down tests for each mix
SCATP - 7.62/TECP 700- 700 (ref. 25)
Notes:
1. The number of test replicates listed is for each sample of gum arabic. Thus, if 10 replicates are listed, 10 tests will be performed using mix made from Colony gum arabic, 10 tests will be performed using mix made from Hummel gum arabic, and 10 tests will be performed using mix made from Quadra gum arabic for a total of 30 tests.
2. Government will conduct DSC/TGA on each gum arabic sample and data will be provided to contractor.
3. All gum arabic materials were purchased new.
Lake City Armament Division tested cased primer ball drop test sensitivity in accordance with Military Specification MIL-P-466101, SCATP (ref. 26) and the specific associated LCAAP Standing Operating Procedure S8A (ref. 27).
Colony, Hummel, and Brenntag no. 34 primers were assembled using ATK's production procedures. These primers were assembled into primed cases on production equipment using the established LCAAP Standing Operating Procedures. These primed cases were tested in accordance with Military Specification MIL-P-466101E (ref. 28) for "drop test" sensitivity testing. This test is a component assembly assessment test using primers and cases in a test fixture.
Numerous primed cases are assessed in the test fixture to designate the 100% fire and no fire drop heights. These drop heights data are used in an elaborate statistical equation to delegate an "H-bar" number. H-bar is a statistical estimate of the average 50% fire height. "H-bar" and its associated standard deviation calculation are used to assess desired performance conformance.
Three tests were done on each gum vendor's primers. All three vendors had about the same H-bar values. Results are displayed in figure 25. Colony, Hummel, and Brenntag samples had values of 7.29, 7.42, and 7.47, respectively.
43
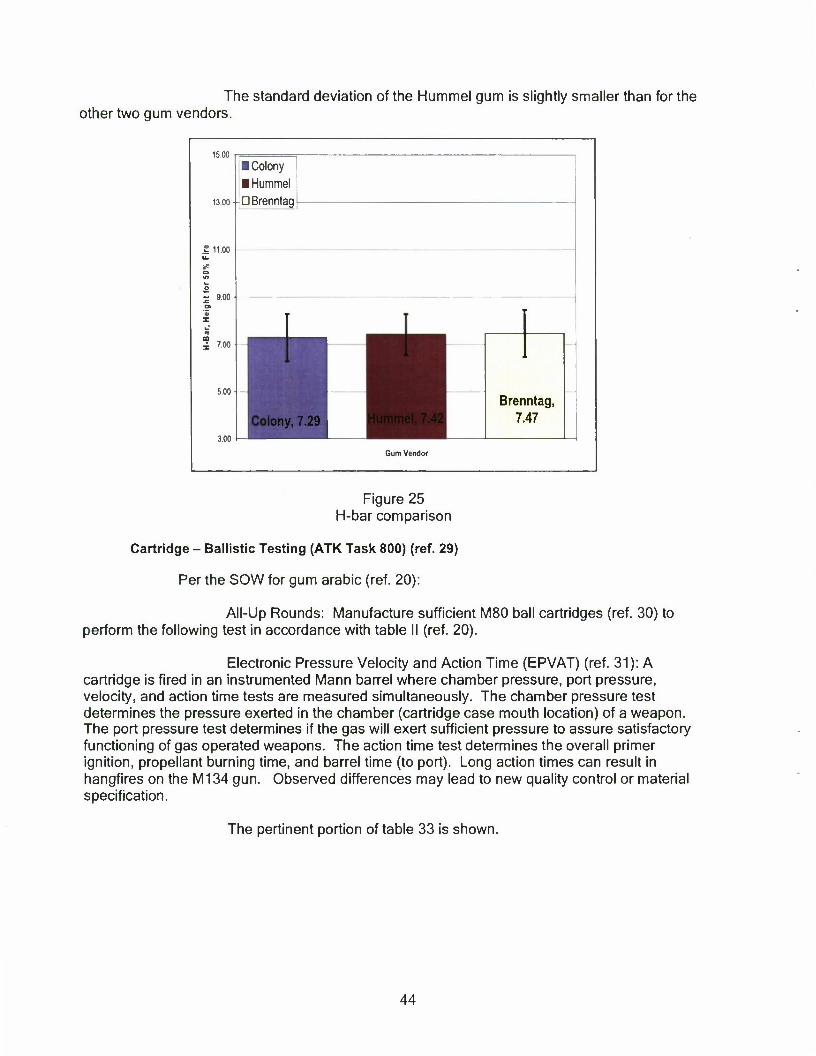
The standard deviation of the Hummel gum is slightly smaller than for the other two gum vendors.
15.00
1100
- 9.00
7 00
5.00
3 00
• Colony • Hummel
-DBrenntag
lony, 7.29
Brenntag, 7.47
Gum Vendor
Figure 25 H-bar comparison
Cartridge - Ballistic Testing (ATK Task 800) (ref. 29)
Per the SOW for gum arabic (ref. 20):
Ail-Up Rounds: Manufacture sufficient M80 ball cartridges (ref. 30) to perform the following test in accordance with table II (ref. 20).
Electronic Pressure Velocity and Action Time (EPVAT) (ref. 31): A cartridge is fired in an instrumented Mann barrel where chamber pressure, port pressure, velocity, and action time tests are measured simultaneously. The chamber pressure test determines the pressure exerted in the chamber (cartridge case mouth location) of a weapon. The port pressure test determines if the gas will exert sufficient pressure to assure satisfactory functioning of gas operated weapons. The action time test determines the overall primer ignition, propellant burning time, and barrel time (to port). Long action times can result in hangfires on the M134 gun. Observed differences may lead to new quality control or material specification.
The pertinent portion of table 33 is shown.
44

Table 33 Performance tests - EPVAT
Colony, Hummel, Quadra Component Location Qty per Sample* Method
All Up Rounds
EPVAT LCAAP
20 cartridges from each mix (20 Colony, 20 Hummel, and 20 Quadra) for a total of 60 cartridges. Testing will be at ambient temperature.
SCATP - 7.62/TECP 700-700 (ref. 25)
Notes:
1. The number of test replicates listed is for each sample of gum arabic. Thus, if 10 replicates are listed, 10 tests will be performed using mix made from Colony gum arabic, 10 tests will be performed using mix made from Hummel gum arabic, and 10 tests will be performed using mix made from Quadra gum arabic for a total of 30 tests.
2. Government will conduct DSC/TGA on each gum arabic sample and data will be provided to contractor.
3. All gum arabic materials were purchased new.
Lake City Armament Division tested EPVAT in accordance with Military Specification MIL-P-46391 (ref. 30), SCATP (ref. 26), and the specific associated LCAAP Standing Operating Procedure S8H1 (ref. 31).
Propellant Charge Weight Establishment. The propellant charge weight establishment was performed via LCAAP Standing Operating Procedure. The charge weight was established at 43.8 gr of WC846 propellant, lot 81926, to produce chamber pressures of 50 to 57 ksi.
Ballistic Testing, Velocity, Pressure, and Action Time. Colony, Hummel, and Brenntag no. 34 primers were assembled using ATK's production procedures. These primers were assembled into primed cases on production equipment using the established LCAAP Standing Operating Procedures. These primed cases were hand assembled into cartridges using production bullets and propellant powder. They were tested in a single barrel in accordance with SCATP (ref. 26) for chamber pressure, port pressure, velocity, and action time (all together, EPVAT) at ambient temperature using the Oehler data collection system. Additionally, an oscilloscope was used to collect pressure-time curves at the chamber and port for each shot. Reference ammunition lot LC06D000R015 was used. Twenty-five cartridges were fired for each gum vendor; one Colony sample shot was dropped due to an error in the data collection system. Electronic pressure velocity and action time results and basic specifications are shown in table 34.
45
Table 34 Ambient EPVAT comparison
Colony: Samp! 8 A, corrected Hummel: Sample B, corrected Brenntag: Sample C, corrected Chamber pressure maximum
(psi) Velocity
dps)
Port Pressure Maximum
(psi)
Action time (MS)
Chamber pressure maximum
(psi) Velocity
(fps)
Port Pressure Maximum
(psi)
Action time (MS)
Chamber pressure maximum
(psi) Velocity
(fps)
Port Pressure Maximum
(psi)
Action time
(MS)
Mean 53564 2743 11167 1275 52265 2735 11294 1265 51498 2732 11258 1278 Std Dev 1201 13 84 29 1549 14 83 32 1297 14 88 26
Max 56514 2767 11397 1352 55712 2765 11428 1350 54709 2770 11375 1342 Mm 50824 2712 11004 1230 49790 2707 11138 1189 49371 2705 10968 1224
Range 5690 55 393 122 5922 58 290 161 5338 65 407 118 Mean+3sd 57167 2783 11420 1363 56911 2777 11545 1361 55389 2773 11522 1354 Mean-3sd 49962 2701 10915 1187 47619 2693 11044 1169 47606 2690 10994 1201
Correction factors Basic specifications: Chamber pre ssure +765 Chamber pressure (mean) <=57,000 psi Port pressure -281 Velocity 2750 +/- 30 ft/s Velocity -4 Port pressure 10,900 +/-1750 psi
Action time <= 4 ms
Data was analyzed using Minitab•. T-test and F-test statistics are shown in table 35. Individual shot data is in reference 32.
Table 35 EPVAT: analysis of means and analysis of variance
Minitab• software was used to generate T-
Two-sample T-test probabilities (95% confidence interval)
test and F-test statistics
F-test for equal variances probabilities (95% confidence interval)
Chamber pressure Chamber press ure Hummel Brenntag Colony Hummel Brenntag
Colony 0.002 0.000 Hummel - 0.064
R015 Colony Hummel
0.650 0.661 0.858 0.227 0.714
0.392
Velocity Velocity Hummel Brenntag Colony Hummel Brenntag
Colony 0.033 0.004 Hummel - 0.429
R015 Colony Hummel
0.456 0.328 0.341 0.734 0.764
0.968
Port pressure Port pressure Hummel Brenntag Colony Hummel Brenntag
Colony 0.000 0.001 Hummel - 0.137
R015 Colony Hummel
0.157 0.163 0.121 0.967 0.834
0.8100
Action time Action time Hummel Brenntag Colony Hummel Brenntag
Colony 0.277 0.719 Hummel 0.134
R015 Colony Hummel
0.682 0.488 0.941 0.687 0.503
0.279 = Statistical d fference
R015 refers to reference ammunition lot LC06D000R015. "R015" was used.
46
ATK Elemental Analysis
Elemental analysis for CHN was performed on a Perkin Elmer 2400 series II CHNS/O Analyzer. The results showed a statistical difference in the quantity of carbon and nitrogen between the three sources of gum arabic (table 36). For the hydrogen content, it could not be demonstrated that there was a significant difference between the Hummel and Colony sources; however, between the Brenntag sample and the other two sources, there was a statistical difference in the hydrogen content.
Table 36 CHN quantity analysis
Supplier Element Average ± 2std dev Hummel Carbon 39.64 ±0.14 Brenntag Carbon 40.82 ±0.10
Colony Carbon 38.38 ±0.16
Hummel Hydrogen 6.22 ±0.10
Brenntag Hydrogen 5.97 ±0.10
Colony Hydrogen 6.26 ± 0.30
Hummel Nitrogen 0.60 1 0.06 Brenntag Nitrogen 0.43 ±0.08 Colony Nitrogen 0.54 ± 0.06
The CHN analyzer uses a combustion method to convert the sample elements to simple gases, (C02, H20 and N2). The sample is first oxidized in a pure oxygen environment using classical reagents. Products produced in the combustion zone include CO2, H20 and N2. Elements such as halogens and sulfur are removed by scrubbing reagents in the combustion zone. The resulting gases are homogenized and controlled to exact conditions of pressure, temperature, and volume. The gases are allowed to de-pressurize through a column where they are separated in a stepwise steady-state manner and detected as a function of their thermal conductivities. The instrument's quality control was performed with Cyclohexanone-2,4-dinitro- phenylhydrazone and Acetanilide.
ATK Moisture Loss and Friability Evaluation of ATK Logistics Support Group (LSG) FA956 Primers
Alliant Techsystems Automation Systems Group (ASG) requested an evaluation of friability and moisture loss characteristics on FA956 primers built from various suppliers of gum arabic. A friability test was devised and primers were submitted for testing at the ATK LSG 1-5 facility.
Three primer types were built by ATK ASG. Primers were packaged water wet sealed in bags for shipment to ATK LSG.
• Sample A-Colony gum arabic • Sample B-Hummel gum arabic • Sample C-Brenntag/Quadra gum arabic
Weight data furnished by ATK ASG showed tablets to have the following %moisture (table 37).
10% and
47

Table 37 Weight data concerning % moisture
Brass cup + Brass cup wet pellet Wet pellet Dry pellet
Vendor Sample ID no. weight (g) weight (g) weight (g) weight (g) 1 0.2326 0.2697 0.0371 0.0330 2 0.2318 0.2700 0.0382 0.0340 3 0.2307 0.2683 0.0376 0.0334 4 0.2316 0.2707 0.0391 0.0348
"A," Colony 5 0.2313 0.2705 0.0392 0.0349 6 0.2313 0.2692 0.0379 0.0337 7 0.2319 0.2702 0.0383 0.0341 8 0.2311 0.2686 0.0375 0.0334 9 0.2317 0.2707 0.0390 0.0347 10 0.2317 0.2714 0.0397 0.0353
1 0.2322 0.2688 0.0366 0.0324 2 0.2310 0.2684 0.0374 0.0331 3 0.2319 0.2697 0.0378 0.0334 4 0.2334 0.2711 0.0377 0.0333
"B," Hummel 5 0.2317 0.2397 0.0380 0.0336 6 0.2305 0.2677 0.0372 0.0329 7 0.2320 0.2717 0.0397 0.0351 8 0.2308 0.2695 0.0387 0.0342 9 0.2311 0.2676 0.0365 0.0323 10 0.2305 0.2680 0.0375 0.0331
1 0.2304 0.2698 0.0394 0.0350 2 0.2316 0.2693 0.0377 0.0335 3 0.2320 0.2722 0.0402 0.0357 4 0.2320 0.2713 0.0393 0.0349
"C," Quadra 5 0.2316 0.2726 0.0410 0.0364 6 0.2315 0.2696 0.0381 0.0338 7 0.2334 0.2703 0.0369 0.0328 8 0.2328 0.2702 0.0374 0.0332 9 0.2314 0.2673 0.0359 0.0319 10 0.2312 0.2688 0.0376 0.0334
% moisture Vendor % moisture
"A," Colony 11.04 "B," Hummel 00.61 "C," Quadra 00.20
%moisture is average of individual test results.
Moisture content of tablets was verified at ATK LSG to determine extent of drying during shipping and storage. Moisture content was obtained by drying tablets (removed from cups) at 135 +/-5T for +10 hrs. Tablets from each sample type were dried in groups of three and tested in triplicate.
48
Friability loss was obtained by vibrating tablets over a 4-in. 45-mesh sieve and catch pan secured to a FMC Technologies Syntron Model J-1-B vibrating table. Tablets were subjected to vibration on the sieve for 60 sec at the highest equipment setting and then an additional 4 min (5 min total). Tablets from each sample type were vibrated in groups of three and tested in triplicate. Pre and post weights of the tablets were obtained using a four place analytical balance. Sieves were washed, oven dried, and cooled between each test.
Initial inspection of the provided primers indicated that the material as received had already dried somewhat. It was observed that most tablets had material separated from the edges of the primer cup and that these tablets would easily fall from the cup if inverted. It was determined to proceed with the drying process. Previously provided data indicate that 'wet' tablets should experience a moisture loss of ~11% (table 38).
Table 38 Data table concerning friability loss
Material Description Primer pellets Date: 1-4-08
Chemist: Curtis Fielding
Pellet I
tare weight of aluminum
tray weight with
primers
primera wet weight
(3ea) Primers dry weight
(3ea) % Moisture weight after 60 sec run (3ea)
weight after 4 min run (3ea)
% Material Loss
Difference (dry-wet)
Difference Cl*Y-60sec)
Difference (dry - 4 nwi)
A1 1 2849 1 3840 0.0991 0.0988 •0 0003 0.30 0 0945 -0 0043 00749 -0 0239 24 19 A2 1 2763 1 3739 00976 00973 -0 0003 031 0 0936 -0 0037 0 0793 -0 0180 18 50 A3 1 2943 1 3930 00987 00985 -0 0002 020 00943 0 0042 00794 -0 0191 1939
STDDEV 005 ' 250 AVG 1.2852 1.3836 0.0985 0.0982 O.0003 0.27 0.094 0.004 0.078 0.020 20.71
B1 1 2807 1 3801 0 0994 0.1005 0.0011 -1.11 00992 -0 0013 00948 -0 0057 567 B2 1 2792 1 3768 0 0976 0 0987 0 0011 -1.13 0 0974 00013 00953 -0 0034 344 B3 1 2847 1 3869 01012 01024 00012 •1.19 01006 -0 0018 0 0954 •00070 6 84
STD [lEV 0.03 1.41 Avr, 1.2815 1.3809 0.0994 0.1005 0.0011 1.14 0.099 41.001 0.095 0.005 5.34
C1 1 2896 1 3897 00999 0.0974 •0 0025 2.50 0 0961 -0 0013 00924 -0 0050 5 13 a 1.2782 13773 0 0991 00966 -0.0025 252 00952 -0.0014 00907 -0 0059 6.11 a 1 2875 1 3923 01048 01006 -0.0042 401 0 0993 -0X13 0.0951 -0 0055 5 47
STDDEV 070 ' 0.40 AV<; 1.2852 1.3864 0.1013 0.0982 41.0031 3.01 0.097 O.001 0.093 41.005 5.57
A-Colony B-Hiininiel (-Bieitnl.il) i>u.i.Ii.i
DISCUSSION
Viscosity and Shelf-life Testing (ATK Task 300)
Lake City Armament Division tested gum solution viscosity at 25°C using a Brookfield viscometer. Test parameters used were an LV4 spindle and 50 rpm solution at ambient temperature in a 300 cm3 tall-form glass beaker. Temperature and viscosity readings were taken at the same time. Both readings were taken 5 min after the spindle began spinning.
Initially, the viscosity results were highly confusing by an unintended correlation with percent solids. Percent solids were adjusted and a second test of viscosity was performed.
49
When tested at precise percent solids content, the Brookfield viscosity is the same for each gum vendor. Percent solids are a factor in viscosity. Brenntag gum arabic had more variance in its viscosity results.
Investigation of FA-956 mixing action correlation with gum arabic viscosity is recommended. Depending on correlation, the percent solids may need to be better controlled in production, or at least for the test method for SPC testing.
Review FPL data to determine if the Brenntag's sample higher viscosity variance is real and what causes it.
Lake City Armament Division tested shelf-life according to the procedures in paragraph 3.2.2 of the SOW (ref. 20) making visual, olfactory, and viscosity measurements of aged gum. Twelve batches of gum arabic were made using the production equipment. Each batch was a single trial for a 2 by 2 by 3 full-factorial experiment with factors of storage temperature (cold and ambient), water source (distilled and tap), and vendor (Colony, Hummel, and Brenntag), respectively.
Visually, all the samples stayed about the same. All three vendors grew some mold, but the sample from Brenntag grew a little more than the others. Refrigerated samples grew less mold. The range in the amount of mold was not great.
Odor followed along with the visual observations. There were no significant changes for a couple weeks. Then, odor increased, more so for the unrefrigerated samples. Hummel's gum arabic odor was a little stronger than the other's.
Viscosity was interesting. The vendor type had the most influence on viscosity. Temperature had some effect, more so for Hummel and Brenntag gums, and more so later in the test. Over time, Colony's gum viscosity dropped the first week and then stayed fairly level. Hummel gum also dropped the first week, but then increased slightly from there. Gum from Brenntag dropped the first week and then rebounded by about 500 cP. It is surprising to note that the variance in viscosity initially was high, but tightened up in weeks two and three, finally spreading out again thereafter. This suggests it may be advantageous to let gum solutions sit on the shelf for a minimum time before using to increase process control. This data indicates it should rest between 1 and 2 weeks before use.
Number 34 Primers - Closed Bomb and Pellet Integrity Test (ATK Task 600)
Task 600 was written to assess the primer mix made from each vendor's gum. Alliant Techsystems' LCAD evaluated primer mix resistance to dusting using a current test method: the PIT. Alliant Techsystems Launch Systems used closed bomb testing to search for differences in primer thermodynamic performance due to gum vendor.
Alliant Techsystems Launch Systems closed bomb testing is fully detailed in ATK Launch Systems Memo 3310-FY08-M408 (ref. 33).
Lake City Armament Division tested no. 34 primers for pellet integrity using LCAD Standard Operating Procedure S35D1 (ref. 23). This test is a qualitative test that determines the pellet's ability to hold together and resist dusting.
50

Powders made with gum from Hummel and Brenntag performed equally well; powder made from gum from Colony trailed by a little in pellet integrity. The difference is very small. Integrity results are in-family to previous results.
Colony gum performed differently in this test versus Brunig's. It is possible that the difference in gum lot is the cause; currently there is no conclusive evidence that would explain this difference.
Even though the test is subjective, the same lot of Hummel gum scored the same across two separate tests (this and Brunig's). This test seems valid for determining gross order changes to pellet integrity. Its validity is uncorroborated. The precision of the test is unknown.
It is recommended to determine the cause of the difference in Colony PIT results between this and Brunig's work, particularly if Colony gum arabic continues to be used as a binder in the future. Validation of the PIT's applicability and usefulness is recommended.
Gum Solution - LCC Testing (ATK Task 700) (ref. 25)
Lake City Armament Division tested cased primer ball drop test sensitivity in accordance with Military Specification MIL-P-466101 (ref. 28), SCATP (ref. 26), and the specific associated LCAAP Standard Operating Procedures.
Numerous primed cases are assessed in the test fixture to designate the 100% fire and no-fire drop heights. These drop heights data are used in an elaborate statistical equation to delegate an H-bar number. H-bar is a statistical estimate of the average 50% fire height. H-bar and its associated standard deviation calculation are used to assess desired performance conformance.
Three tests were done on each gum vendor's primers. All three vendors had about the same H-bar values. Results are displayed in figure 25. Colony, Hummel, and Brenntag samples had values of 7.29, 7.42, and 7.47, respectively.
The standard deviation for Hummel samples is slightly smaller than for the other two gum vendors.
All the tests passed the specifications for both mean and standard deviation. None of the tests came close to failing. This test's purpose was to look for large-order changes. None were found. This data is useful as a baseline of the current binder's performance.
If the variance difference found needs verification, it is recommended a larger test plan be created. A larger sample size is needed for this test plan, as is accounting for the factors of machine, case, assembled primed case, and operator.
Cartridge - Ballistic Testing (ATK Task 800)
Task 800 was written to assess and capture weapons level ballistics testing. Alliant Techsystems' LCAD was to perform EPVAT testing in an attempt to identify the potential of hangfires or misfires and to characterize each vendor's gum arabic.
Lake City Ammunition Division tested EPVAT at ambient temperature using Military Specification MIL-P-46391AF and the SCATP (ref. 26). Oscilloscope data was also collected.
51
All tests met specification. Pressure-time traces showed no large-order differences between gum vendors. Action time was well below the 4 ms specification. Action time was statistically equivalent for all three vendors. In all tests, the variance was statistically equivalent. A statistical shift in mean of chamber pressure, port pressure, and velocity was detected, but additional trials across additional barrels are suggested to determine the legitimacy of these results.
ATK Elemental Analysis
Elemental analysis for CHN was performed on a Perkin Elmer 2400 series II CHNS/O Analyzer. The results showed a statistical difference in the quantity of carbon and nitrogen between the three sources of gum arabic. The test was not able to demonstrate a significant difference for the hydrogen content between the Hummel and Colony samples. However, there was a statistical difference in the hydrogen content between the Brenntag sample and the Hummel and Colony samples.
Moisture Loss and Friability Evaluation of ATK LSG FA956 Primers
All samples experienced significantly less moisture loss than the expected ~11%. Apparently, significant loss of moisture occurred during the handling, shipping, and storage during the time that the pellets were packaged at ATK ASG and when they were dried at ATK LSG.
Percent moisture results indicate significant variation in loss between the three sample types. Sample C had the highest moisture content 3.0 ± 0.8% (95% confidence), Sample A lost 0.27 ± 0.06%, and Sample B actually gained 1.14 ± 0.03%. Additional investigation is necessary in order to determine why Sample B gained weight.
Percent material loss results from the friability test indicate significant variation between primer composition containing Colony gum arabic (Sample A) and those compositions containing Hummel or Brenntag (Quadra) gum arabic, Samples B or C, respectively. Sample A material loss after the 4 min run was 21 ± 3% (95% confidence), whereas, Samples B and C had material losses of 5.3 ± 1.6% and 5.6 ± 0.5%, respectively. It appears that the primer composition containing Colony gum arabic is more susceptible to dusting.
Average 60 sec versus 4 min results indicate the rate of material loss (group of three) to be consistent regardless of the duration of test.
Sample A = 0.004 g/min Sample B = 0.001 g/min Sample C = 0.001 g/min
This data might suggest that there are no surface vulnerabilities on the pellets and that the morphology of the pellet seems consistent throughout the grain.
Ballistic Evaluation of 7.6-MM Rifle Primers containing FA956 Primer Compositions
See reference 32 for report on ballistic evaluation.
52

CONCLUSIONS
U.S. Army Armament Research, Development and Engineering Center
Specification Testing
All three samples passed all the tests. The Hummel and Brenntag samples appeared cleaner. The Colony sample had more insoluble residue. Smaller aliquots of sample were needed to allow a reasonable rate of filtration. It also had more carbonaceous matter that resisted burning off in the total ash test. The amount was still so low that attempting to burn it all off by transferring it to another beaker and filtering into filter paper, and incinerating the filter paper could have caused further significant errors to accumulate. It also had slightly greater values of organic acidity and moisture.
Material Analysis
The results of the tests performed on the gum arabic samples indicate that macroscopically they all appear very similar. All the samples exhibited similar thermal profiles when analyzed with the Simultaneous differential thermal (SDT) analysis.
Scanning electron microscopy (SEM) showed that the Quadra and Hummel samples were similar in exhibiting round structures while also appearing similar in size. The distribution displayed for particle size of both Quadra and Hummel gums were similar in size between 70 and 90 pm. The samples from Quadra and Hummel had larger particle sizes and exhibited larger surface areas as compared to the Colony gum. In order of decreasing surface area (largest to smallest) the samples are Quadra, Hummel, and Colony. The distribution of the Colony gum is tighter with a smaller particle size of 49 pm, which is also seen through the SEM images. The Colony gum showed a flaky structure as compared to the round structure of the other two samples.
Although all samples exhibit a similar thermal profile, the Quadra and Hummel gums are distinctively similar in both size and structure as compared to the Colony gum.
Sensitivity Evaluation of the FA956 Primer Composition
In general, tables 6 through 8 indicate that the FA956 composition is extremely impact, friction, and electrostatic discharge sensitive because it contains 37% lead styphnate. For ERL impact sensitivity, the Colony sample yielded the most sensitive level, at the lowest height of 10 cm. The Quadra sample yielded slightly better result than Hummel sample at the 12 cm impact height. Such difference may suggest the source of gum arabic will have an impact on the impact sensitivity and should be noted since the FA956 is a percussion primer composition. However, the BOE impact test could not differentiate the sensitivity level: all 10 runs of each primer sample reacted at the 4 cm height. For friction sensitivity, only the large BAM friction test was conducted. All samples did not react in 10 trials at 6N. However, each primer sample did react at the forces above 6 N, ranging from 8 to 10 N. For ESD sensitivity, all three primer samples had very low initiation energy, at 0.00001 to 0.00002 J levels, compared to 0.004 to 0.005 J for lead azide (ref 2). The human body can store 20 to 30 mJ of energy although not all the energy can be transferred at discharge (ref 3). Therefore, the FA956 composition is considered highly dangerous in this matter.
53
The thermal signature of the three primer mixes are near identical, indicated by an ignition temperature near 285°C. This suggests the source of gum arabic has no impact on their thermal characteristics.
Forest Products Laboratory
As part of the joint phase I program to establish improved specifications for gum arabic, the Forest Products Laboratory has been characterizing the properties of different gum arabic samples. Since this project began, much has been learned about gum arabic by gathering and analyzing the literature information. The food uses of gum arabic have been the driving force for many of these investigations and some of them have relevance to the gum arabic use as a binder in the primer formulation. Analysis of this literature has transformed what was initially just a list of possible test methods into a series of tests that are more interrelated, and some relate to actual performance criteria. The gum arabic characterization falls into two main classes: those that measure a physical property and those that relate to gum arabic chemical composition. It should be noted that the chemical composition influences the physical properties.
For most of these analyses, the Colony and Hummel products were very similar. However, there were differences in the apparent viscosity measurements, dry particle size, and dissolution rates. In contrast, the Brenntag (Quadra) gum is quite different in a number of analyses, due to it being a different gum source from Eritrea versus Chad for the other two products. However, in some cases, the Brenntag gum was similar to the Colony gum, whereas, the Hummel gum was different. Some of these differences could very well relate to the performance of the gum arabic as a binder, but more information is needed.
Alliant Techsystems
Task 300 (GUM SOLUTION-VISCOSITY AND SHELF-LIFE TESTING)
Viscosity at 25°C. When tested at precise percent solids content, the Brookfield viscosity is the same for each gum vendor. Percent solids are a factor in viscosity. Brenntag gum had more variance in its viscosity results.
Shelf-Life. Visually, all the samples stayed about the same. They all lost some of their foaminess in the first 2 weeks. Colony and Hummel gums darkened with age. Samples from all three vendors grew some mold, but the one from Brenntag grew a little more than the others. Refrigerated samples grew less mold. The range in the amount of mold was not great.
Odor followed along with the visual observations. There were no significant changes for a couple weeks. Then odor increased, more so for the unrefrigerated samples. The odor from the Hummel sample was a little stronger than the other's.
Viscosity was interesting. The vendor type had the most influence on viscosity. Temperature had some effect, more so for the Hummel and Brenntag gums and more so later in the test. Over time, the viscosity for the Colony sample dropped the first week and then stayed fairly level. The Hummel sample also dropped the first week, but then increased slightly from there. The Brenntag sample viscosity dropped the first week and then rebounded by about 500 cP. It is surprising to note that the variance in viscosity initially was high, but tightened up in weeks two and three, finally spreading out again thereafter. This suggests it may be advantageous to let gum solutions sit on the shelf for a minimum time before using to increase process control. This data indicates it should rest between 1 and 2 weeks before use.
54

Task 600 (No. 34 Primers-Closed Bomb and Pellet Integrity Test)
Both operators got the same results, and thus their data was combined into a single data set for comparison of each vendor. The samples from Hummel and Brenntag performed equally well; Colony trailed by a little in pellet integrity. The difference in integrity is very small. Integrity results are in-family to previous results.
Colony gum performed differently in this test versus Brunig's. It is possible that the difference in gum lot is the cause; currently there is no conclusive evidence that would explain this difference.
Operator 1 's scores varied more; it is not known if this is real, nor of benefit. It is of no particular importance for this effort.
Even though the test is subjective, the same lot of Hummel gum scored the same across two separate tests (this and Brunig's). This test seems valid for determining gross order changes to pellet integrity. Its validity is uncorroborated. The precision of the test is unknown.
Task 700 (Gum Solution - LCC Testing)
All the test results passed the specification requirements for both mean and standard deviation. None of the test results came close to failing. The purpose of the tests was to look for large-order changes. None were found. This data is useful as a baseline of the current binder's performance.
Task 800 (Cartridge - Ballistic Testing)
All of the test results were within specification limits. All cartridges fired and performed within the specification parameters in the thermodynamics or interior ballistics due to gum vendor. Pressure-time traces showed no large-order differences between gum vendors. The action time was statistically equivalent for all three gums. It was well below the 4 ms specification limit. F-test probabilities shown in the table prove the variance was the same across all tests. Although a statistical difference of means was found for chamber pressure, port pressure, and velocity between the Colony sample and the other two gums, comments from research and design engineers of Lake City Ammunition Division, stated that this may not be meaningful. They said the shift in mean for a single test can be high, as high as that seen in these results. Also, there are many other possible causes of the shift besides gum vendor.
55
REFERENCES
1. "Primer Composition FA-956," U.S. Government Dwg. 10522388, Rev. AD.
2. "Technical Acacia (Gum Arabic)," U.S. Government Dwg. 12990883, Rev. B.
3. "Acacia, Technical (Gum Arabic)," Federal Specification JJJ-A-20, January 1958.
4. Alliant Techsystems Lake City Chemical (LCC) #8: Gum Arabic, Rev. M.
5. MIL-STD-1751, "Safety and Performance Tests for the Qualification of Explosives," December 2001.
6. "Green Primaries: Environmentally Friendly Energetic Complexes," Proceedings National Academic Science USA, v.103 (14); 4 April 2006.
7. Linear Technology, Volume III, Number 3, October 1992.
8. Bitter, T. and Muir, H.M., "(U)Primer Mix Binder Study," Alliant Techsystems, Lake City, MO, Confidential, 2006.
9. Sanchez, C, Renard, D., Robert, P., Schmitt, O, and Lefebvre, J., "Structure and Rheological Properties of Acacia Gum Dispersions," Food Hydrocolloids, 16: 257-267, 2002.
10. "Material Analysis on Three Gum Arabic Samples, U.S. Army Armament Research, Development and Engineering Center, Picatinny Arsenal, NJ, 2007.
11. Anderson, D.M.W., Millar, J. R. A., and Wang, W., "Gum Arabic {Acacia Senegal Unambiguous Identification by 13C-NMR Spectroscopy as an Adjunct to the Revised JECFA Specification and the Application of 13C-NMR Spectra for Regulatory Legislative Purposes," Food Additives and Contaminates, 8(4): 405-421, 1991.
12. Suber, Eric, "Elemental Analysis for Carbon, Hydrogen, and Nitrogen," Alliant Techsystems Launch Systems Memo 3310-FY08-M210, Alliant Techsystems, Lake City, MO, September 2007.
13. Tanner, R., "Elemental Analysis for Carbon, Hydrogen and Nitrogen," Internal ATK memo to R. Blau, Allliant Techsystems, Lake City, MO, September 28, 2007.
14. Jayme, M.L., Dunstan, D.E., and Gee, M.L., Zeta Potentials of Gum Arabic Stabilized Oil in Water Emulsions, Food Hydrocolloids, 13: 459-465, 1999.
15. Osman, M. E., Williams, P. A., Menzies, A. R., and Phillips, G. O., "Characterization of Commercial Samples of Gum Arabic," J. Agric. Food Chem., 41:71-77, 1993.
16. Glyn, Al-Assaf, S., Phillips, O., Aokia, H.a, and Sasaki, Y., "Characterization and Properties of Acacia Senegal (L.) Willd. var. Senegal with Enhanced Properties (Acacia (sen) SUPER GUM•): Part 1-Controlled Maturation of Acacia Senegal var. Senegal to Increase Viscoelasticity, Produce a Hydrogel Form, and Convert a Poor into a Good Emulsifier," Food Hydrocolloids, 21:319-328, 2007.
57
17. Bitter, T. and Muir, H.M., "A Modified Uronic Acid Carbazole Reaction," Analytical Biochemistry, 4: 330- 334, 1962.
18. U.S. Government Dwg. 10522621, Rev.T, Primer No.34.
19. Mansfield, M., "Gum Arabic Phase I: Gum Solution Testing - Viscosity and Shelf-life Testing," Lake City Ammunition Division Report, Lake City, MO, May 2008.
20. SOW for Gum Arabic Characterization and Synthetic Replacement for 7.62-mm Ammunition Primer Product Improvement
21. Tharp, Nicholas, "Primer Mix Binder Study (and .50 Cal Anvil OD Measurement System Evaluation)," Lake City Ammunition Division Six Sigma - Green Belt Project Report, Lake City, MO, April 2006.
22. Mansfield, M., "Gum Arabic Phase I: #34 Primers - Closed Bomb and Pellet Integrity Test," Lake City Ammunition Division Report, Lake City, MO, May 2008.
23. Lake City Army Ammunition Plant Standing Operating Procedure Primer Misfire/Hangfire Record Number S35D1, Lake City Ammunition Plant, Lake City, MO.
24. Burnig, K., "7.62mm Primer DOE; Gum, Shellac Pins, and Mix Method," Lake City Ammunition Division Summary Report, Lake City, MO, April 2006.
25. Mansfield, M., "Gum Arabic Phase I: Primed Case- Ball Drop Height Sensitivity," Lake City Ammunition Division Report, Lake City, MO, June 2008.
26. Small Caliber Ammunition Testing Procedures 7.62mm
27. "Lake City Army Ammunition Plant Standing Operating Procedure Sensitivity Test, Percussion Primed Cases and Primers," Record Number S8A, Lake City Ammunition Plant, Lake City, MO.
28. "Military Specification Primers, Percussion, Styphnate and Chlorate types for Small Arms Ammunition," MIL-P-466101E,
29. Mansfield, M., "Gum Arabic Phase I: Cartridge - Ballistic Testing," Lake City Ammunition Division Report, Lake City, MO, May 2008.
30. "Military Specification Cartridge, 7.62mm, Ball, M80 Procedures," MIL-C-46931F (AR),
31. "Lake City Army Ammunition Plant Standing Operating Procedure Ballistic Testing, Velocity, Pressure and Action Time Record", Number S8H1, Lake City Ammunition Plant, Lake City, MO.
32. Mansfield, M., "Gum Arabic Phase I Cartridge - Ballistic Testing," Lake City Ammunition Division Summary Report, Lake City, MO, May 2008.
33. Blau, Reed, "Ballistic Evaluation of 7.62-MM Rifle Primers Containing FA956 Primer Composition as a Function of Gum Arabic Source and Primer Temperature," Alliant Techsystems Launch Systems Memo 3310-FY08-M408, Lake City, MO, February 2008.
58
BIBLIOGRAPHY
R.C. Randall, G. O. Philips, and P. A. Williams, "Fractionation and Characterization of Gum from Acacia Senegal," Food Hydrocolloids, 3(1): 65-75, 1989.
U.S. Army Hazardous Component Data Sheet (HCSDS), Document No. 20, 11 March, 1993.
"Standard Test Method for Shear Testing of Bulk Solids Using the Jenike Shear Cell," ASTM D 6128-00.
Lake City Army Ammunition Plant Standing Operating Procedure Instrumental Analysis of Explosives, Building 35, Record Number S35T3.
Mansfield, M., "Gum Arabic Phase I: Gum Powder Testing - LCC, EA, Ring Shear, Moisture, and Bulk Density, Lake City Ammunition Division Report, Lake City, MO, May 2008.
Mansfield, M., "Gum Arabic Phase I: FA-956 Primer Mix - Penetrometer and DSC," Lake City Ammunition Division Report, Lake City, MO, May 2008.
Utt, Darrel, Chemlab Notebook DLU 22, Lake City Ammunition Plant, Lake City, MO, Page 160,
59
DISTRIBUTION LIST
U.S. Army ARDEC ATTN: RDAR-EIK
RDAR-GC RDAR-MEE-T (8)
Picatinny Arsenal, NJ 07806-5000
Defense Technical Information Center (DTIC) ATTN: Accessions Division 8725 John J. Kingman Road, Ste 0944 Fort Belvoir, VA 22060-6218
Commander Soldier and Biological/Chemical Command ATTN: AMSSB-CII, Library Aberdeen Proving Ground, MD 21010-5423
Director U.S. Army Research Laboratory ATTN: AMSRL-CI-LP, Technical Library Bldg. 4600 Aberdeen Proving Ground, MD 21005-5066
Chief Benet Weapons Laboratory, WSEC U.S. Army Research, Development and Engineering Command Armament Research, Development and Engineering Center ATTN: RDAR-WSB Watervliet, NY 12189-5000
Director U.S. Army TRADOC Analysis Center-WSMR ATTN: ATRC-WSS-R White Sands Missile Range, NM 88002
Chemical Propulsion Information Agency ATTN: Accessions 10630 Little Patuxent Parkway, Suite 202 Columbia, MD 21044-3204
GIDEP Operations Center P.O. Box 8000 Corona, CA 91718-8000
61