добро́ пожа́ловать! novemberrustec.asu.edu/2012/2012-11 rustec-asu greater phoenix...
TRANSCRIPT

добро́ пожа́ловать!
Global Business Opportunities in Greater Phoenix
Rudy Vetter Senior Vice President Greater Phoenix Economic Council
November
5
2012
2nd RUSTEC – Workshop – Arizona State University

Greater Phoenix Economic Council
• GPEC is the Region’s Economic Development Authority • A regional model where public and private members collaborate to promote
Greater Phoenix as a great place to grow business • Supported by Maricopa County, 20 cities and towns, and more than 150
private-sector businesses • The catalyst that strengthens the region’s economic base, ensuring it is both
diversified and competitive

• Works closely with the Governor’s office and state legislators to improve the region’s competitiveness and eliminate hurdles for businesses.
• Provides complimentary site-selection services, supporting data and analysis
• Fosters partnerships between companies entering the market and key leaders/ businesses in AZ
Greater Phoenix Economic Council

• Since inception, GPEC has assisted 488 companies to locate in the region
• Resulting in $9.96 Billion in capital investment
• Creating 88,610 jobs
• Fiscal Year 2011 Performance:
• One of the best year’s in history
• 31 GPEC Assisted Companies
• 7,000+ Jobs
• 5,358,054 SF of Office and Industrial Space Occupied
GPEC’s Performance History Building a stronger and sustainable economy

GPEC Business Development Landing a business in Arizona
CONTACT
• GPEC Lead Generation
• Site Selectors
• Real Estate Brokers
• Law Firms
• Embassies/ Trade Commissions
• GPEC Members
• Referral System
DUE DILIGENCE
• Metro- Comp
• Operational Cost
• Data Mining
• Legal
• Tax Policy
• Workforce
• Sourcing/ Supply
• Quality of Life
LOCATION SEARCH
• “E-Track”
• Site Visit
• Incentives
• State
• County
• City
• Site Negotiation
LANDING
• Site Contract
• Licenses
• Permits
• Workforce
• Hiring
• Immigration
• Incentives
• Community

Operational Cost Analysis
Labor Market Data
/Employment Assistance
Economic Impact
Analysis
GIS Site Selection
Connectivity to Key
Resources
Greater Phoenix Economic Council (GPEC) GPEC Services

Population
WEST
VALLEY
710,532 EAST
VALLEY
1,359,839
PHOENIX
1,451,966
Population: Maricopa County 3,843,370
Maricopa County expected to grow more than 30% by 2020
• Greater Phoenix topped large metro areas as the best place for recruitment and attraction
(Expansion Management)
• Arizona among the top 5 friendliest states for business and #1 for our quality and availability of workforce (CNBC)
• Arizona is one of the top 10
states for doing business (Development Counselors
International)
• Top 5 market offering strong
job opportunities for young professionals
(Business Journal)

Metropolitan Community Map

Market Presence: Notable Corporate and Regional Headquarters
APL Avnet Banner Health Best Western Clear Channel Outdoor Coldstone Creamery Dial Corporation/Henkel Fender Freeport McMoRan
ON Semiconductor PetSmart Poore Brothers Republic Services Shamrock Farms Taser International U-Haul University of Phoenix US Airways Viad Corporation
Go Daddy Hensley & Co. Honeywell Aerospace JDA Software Group Knight Transportation Limelight Networks Medicis Pharmaceutical Microchip Technology Nighthawk Radiology

High-Technology Market After WWII, five aerospace companies were located in Greater Phoenix – Motorola, Hughes Aircraft, Goodyear Aircraft, Sperry Phoenix Company and AiResearch The cutting-edge technology being developed in AZ led to the area’s reputation as a hub for aerospace…then electronics…then semiconductor. Companies morphed over time: Goodyear Aircraft later became Lockheed Martin Hughes Aircraft became Raytheon Sperry Phoenix company became part of Lockheed and Honeywell AiResearch later became Honeywell Today, high-tech companies employ thousands in Greater Phoenix: Honeywell – 10,000; Intel – 10,000; Avnet – 5,300; Boeing – 4,700; Freescale – 3,00

Emerging Technology
• Greater Phoenix’s vibrant, entrepreneurial culture grows emerging technology
• Arizona Technology Enterprises, Impact Accelerator at Biodesign Institute, and numerous other city-based incubators support new innovations
Anchored by:
First Solar Stirling Energy Systems
Suntech Power Holdings Covance
Fluidic Energy Celgene
TPI Composites ON Semiconductor
Go Daddy Insight
Ebay/Paypal Infusionsoft

Our Infrastructure: Major Transportation Hub Accessible, Strategic Southwest Location
Airports
• Sky Harbor International Airport
• #14 airport in the world (take-off/ landings)
• 248 daily domestic non-stop flights
• 75 domestic non-stop destinations
• 20 non-stop international destinations
• 9 additional municipal airports in the region
Highways and Railways
• Access to major western U.S. cities and Mexico
• Two major interstates
• Five freeways
• Two transcontinental railroads
• 10 intrastate railroads

Our Infrastructure: Water and Power Resources Reliable Water, Electricity and Telecommunications
Water
• 100+ years of planning and investments in region’s water supply system have helped prepare for growth.
• Population projections (1995-2025) grow 50% but water demand expected to grow by only 25%
Electricity
• 2 primary electric utilities: APS and Salt River Project rank as top business service providers (J.D. Power & Associates)
Telecommunications
• More than 60 fiber, telecom, broadband and wireless providers
• One of top 5 regional fiber optic deployments in U.S., with more than 156,000 route miles of network capacity
• AZ has faster internet speeds than California, Colorado, Texas, New Mexico, Utah, and Nevada
Low Catastrophic Risk
• Rank among the top 10 US cities for lowest natural disaster risk
Our Talent Pool: Higher Education in Greater Phoenix
Arizona State University 70K students at four campuses and 14,400 degrees annually
Maricopa Community Colleges largest provider of job training serving more than 270K students annually
Thunderbird School of Global Management currently ranked #1 for International Full-Time MBA
University of Phoenix the largest, private university in North America, focuses on business curriculum
Grand Canyon University known for some of the best online education programs

Our Advantage: A geostrategic position
• Strategic location in the Southwest
• Close proximity to California, the world’s 8th largest economy

Wage and Labor Force Sample
Occupational Title Mean Wage 10th
Percentile Wage
Median Wage
90th Percentile
Wage
Rounded Employ-
ment
Accountants and Auditors $29.62 $19.04 $27.61 $43.60 14,550
Financial Managers $51.98 $28.47 $47.22 $81.93 6,760
Sales Managers $50.74 $24.97 $43.80 $85.46 6,400
Market Research Analysts and Marketing Specialists $33.84 $16.75 $29.48 $59.70 5,470
Financial Analysts $31.40 $17.11 $28.10 $48.60 3,900
Compliance Officers $29.66 $17.87 $28.54 $44.35 3,040
Cost Estimators $30.41 $15.20 $28.32 $49.61 2,750
Financial Specialists $25.38 $16.00 $23.05 $38.71 1,900
Credit Analysts $28.54 $13.34 $23.64 $51.24 1,660
Compensation, Benefits, and Job Analysis Specialists $26.73 $16.33 $25.22 $41.80 1,440
Wholesale and Retail Buyers, Except Farm Products $24.26 $15.77 $21.19 $38.91 880
Tax Preparers $28.37 $10.66 $26.79 $50.99 660
Budget Analysts $32.31 $21.75 $31.60 $44.29 630
Tax Examiners and Collectors, and Revenue Agents $27.50 $14.99 $24.10 $45.59 560
Financial Examiners $35.66 $20.21 $33.44 $57.06 320
Source: AZ Office of Employment and Population Statistics 2010

Our Advantage: Operational Cost Comparison

Affordable Lifestyle • Median household income is $54,713
• Mean home price in Greater Phoenix is $141,200 West Valley $120,480 East Valley $218,940 Phoenix $85,000
• Residential Property Tax: .9% effective rate
• Sales Tax Rates: 9.43%
• Personal Income Tax Rate: ~ 4%
Married Arizona Taxable Income
Rate
$20,001 - $50,000 $518 plus 2.88%
$50,001 - $100,000 $1382 plus 3.36%
$100,001 - $300,000 $3,062 plus 4.24%
$300,000 and over $11,542 plus 4.54%

Greater Phoenix: Arts & Outdoors • More than 230 art galleries, 50 performing arts theaters and 40 museums
• Thousands flock to Downtown Phoenix each month for the First Friday ArtWalk
• Easy drive or flight to San Diego, Los Angeles, Las Vegas, Mexico, Utah and New Mexico
• 7 lakes are within a one-hour drive
• Hike the Grand Canyon
• More than 200 golf courses in Greater Phoenix
• Hundreds of miles of trails for hiking, mountain biking and off-road driving
• Art and music festivals
• Phoenix Symphony, Ballet Arizona

Greater Phoenix: Sports • Home of the 2008 NFL Super Bowl XLII and 2015
• NCAA - College sporting events year-round at ASU with three bowl games 2007 and 2011 BCS National Championship
• NASCAR - Phoenix International Raceway hosts two annual Sprint Cup races
• PGA - The Waste Management Phoenix Open Best-attended event; record attendance of more than 536,000 fans
• Professional sports - Arizona Diamondbacks (MLB) - Arizona Cardinals (NFL) - Phoenix Suns & Phoenix Mercury (NBA & WNBA) - Phoenix Coyotes (NHL) • MLB Spring Training Cactus League

SOLAR ENERGY VALUE PROPOSITION

• #1 State for Alternative Energy -- Business Facilities
Magazine
• Top State for Potential Solar Capacity by NREL
• First U.S. market to land China’s investment -- by a
solar company
• One of the most aggressive incentive programs for
renewable firms in the country
Arizona – A strong solar contender

Abundance of Sunshine – Abundance of Opportunity Prime Location for Solar Power Generation
• Arizona’s technical potential for concentrating solar power is nearly 2.5 TW.
• No.1 energy exporter to high-cost markets like California,
• Meeting peak demand and Renewables Portfolio Standard (RPS) requirements.
.
Arizona’s 321 days of sun
--- enough solar energy
to power the U.S.
Arizona
Source: National Renewable Energy Laboratory

Top Mountain West Markets for Solar Capacity
Source: US Department of Energy
#1
AZ
#2
CA
#3 CO
#4 NV
#5
NM
#6 TX
#7
UT
Arizona #1 for Potential Solar Capacity
Land Area
(Square Miles)
Solar Capacity
(MW)
Solar Generation
Capacity (GWh)
AZ 19,279 2,467,663 5,836,517
CA 15,156 1,939,970 4,588,417
CO 6,853 877,204 2,074,763
NV 5,589 715,438 1,692,154
NM 3,564 456,147 1,078,879
TX 2,124 271,903 643,105
UT 1,162 14,729 351,774
Total 53,727 6,743,054 16,265,609

RPS Comparison
Mountain West Region
Solar water
heating (SWH)
eligible TX: 5,880 MW by 2015
*NM: 20% by 2020 (IOUs) 10% by 2020 (co-ops) ☼ AZ: 15% by 2025
CA: 33% by 2020
☼ NV: 25% by 2025
State RPS
☼ Minimum solar or customer-sited RE requirement
* Increased credit for solar or customer-sited RE
HI: 20% by 2020
☼ CO: 30% by 2020 (IOUs) *10% by 2020 (co-ops & large munis)
MT: 15% by 2015
State Goal
*WA: 15% by 2020
OR: 25% by 2025 (large utilities) 5% - 10% by 2025 for smaller utilities
Solar Power Generation RPS Policy US -Southwest

Prime Location for Solar Power Generation RPS Solar Carve Out
Arizona is committed to the largest solar carve out in the US
4,5%


State-by-State Total Installations, Q2 2012

Prime Location for Solar Power Generation Utility PV Pipeline
AUSTRALIA
CANADA
FRANCE
JAPAN
SWITZERLAND
ITALY
UK
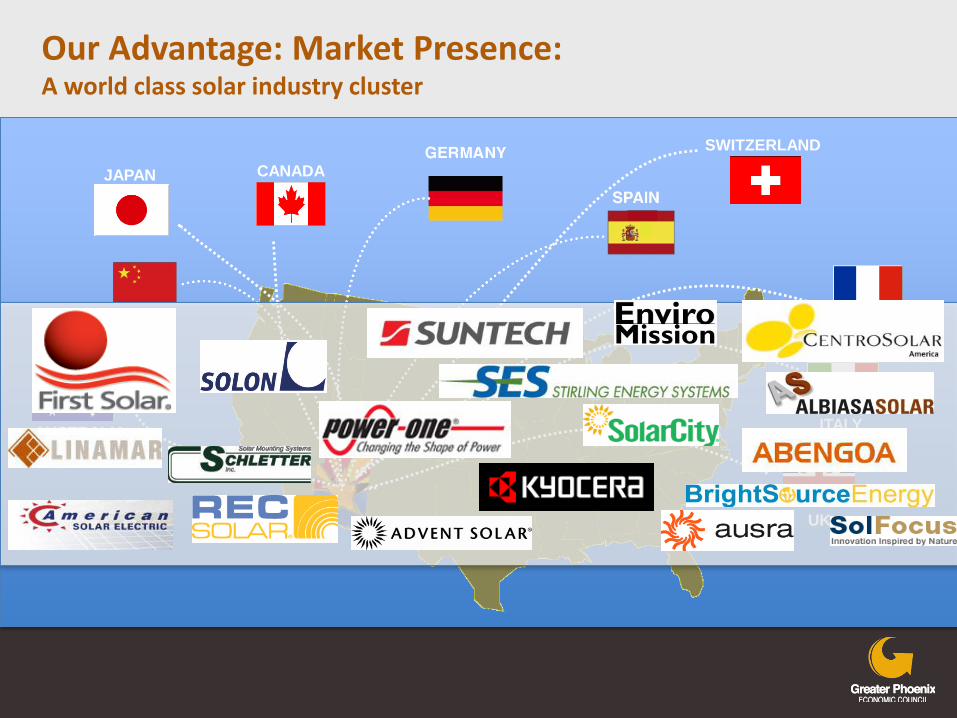
Our Advantage: Market Presence: A world class solar industry cluster

Our Advantage: Market Presence: Building an industry eco-system

Being test-ground for innovative technologies, materials and processes Arizona becomes a hotbed of research & innovation
A living laboratory… Innovation, Technology, R&D

Renewable Energy Tax Incentive Program (RETIP) Refundable corporate income tax credit for up to 10% of capital investment 75% reduction in property taxes for up to 15 years Applicable to manufacturing and headquarters operations
Foreign Trade Zone Program (FTZ) Companies qualifying for the FTZ Program can receive many incentives Merchandise may be brought in duty-free for purposes such as storage, repacking, display, assembly or manufacturing Imports may be landed and stored quickly without full customs formalities In addition, Arizona is the only state that reduces property taxes by 75% for businesses located within a Foreign Trade Zone or Sub-Zone
R&D Tax Credit Program
Corporate income tax credits for qualified R&D done in Arizona, including company funded research at a state university Credit amount is 24% of first $2.5Min qualifying expenses and plus 15% of the qualifying expenses in excess of $2.5M Qualifying small companies (less than 150 FTE) can apply to make their credit refundable (75% of nonrefundable credit value). A company can receive up to $2M in refundable credits per year
State Incentive Programs

Job Training Program Job training grants of up to $8,000 per employee for a maximum $1.5M Employers awarded grants of up to 75% of expenses incurred while providing technology skills training
Additional Depreciation
Companies not receiving property tax incentives under the RETIP, FTZ, or MRZ programs can elect to take additional depreciation on their personal property Additional depreciation encourages new capital investment by quickly reducing personal property tax liability
Private Activity Bonds
In Arizona, private activity bonds are issued through Industrial Development Authorities to finance manufacturing facilities, warehouses, office buildings etc. Interest on private activity bonds for infrastructure is exempt from federal income tax Manufacturers can utilize up to $10M in bonds
State Incentive Programs (continued)

Qualified Facility Income Tax Credit Program Tax credit equal to the less of 10% of projected capital investment or 10% of $200,000 per each net new job up to a max of $30M per company
Arizona Competes Fund Deal-closing fund of $25M to attract base industry
Arizona Quality Jobs Program
$9,000 credit over three years for new qualified jobs
Accelerated Depreciation Reduces personal property taxes on equipment and machinery
Corporate Income Tax Rate Reduction
By 2014, corporate income tax rate steadily decreases from 6.968% to 4.9%
100% Sales Factor Starting in 2014, sales factor ramps up from 80% to 100%
State Incentive Programs (continued) The New Arizona Competitiveness Package

Summary
