- r x u q d o 1 d p h - thz.yale.edu were measured in a thz-tds spectrometer as described in...
TRANSCRIPT

Journal Name
Exploring the solid state phase transition inDL-norvaline with terahertz spectroscopy†
Jens Neu,∗ Coleen T. Nemes, Kevin P. Regan, Michael R. C. Williams,‡ and Charles A.Schmuttenmaer∗
DL-norvaline is a molecular crystal at room temperature and it undergoes a phase transition whencooled below 190 K. This phase transition is believed to be Martensitic, thus making it of particularinterest for molecular machines. In this paper we investigate this phase transition by measuringits terahertz (THz) spectrum over a range of temperatures. Temperature-dependent THz time-domain spectroscopy (THz-TDS) measurements reveal that the transition temperature (Tβ→α ) is190 K. The influence of nucleation seeds was analyzed by determining the Tβ→α of molecularcrystals with varying grain size. Grains of 5 µm or less result in a lower transition temperature(Tβ→α = 180 K) compared to larger grains of 125 µm-250 µm (Tβ→α = 190 K). Additionally, we gaininsight into the physical process of the phase transition via temperature-dependent THz-TDSspectra of doped and mixed molecular crystals. The addition of molecular dopants, which differfrom DL-norvaline only at the end of the side chain which resides in the hydrophobic layers ofthe crystal, decreases Tβ→α . This is consistent with a solid-solid phase transition in which theunit cell shifts along this hydrophobic layer, and it leads us to believe that the phase transition inDL-norvaline is Martensitic in nature.
1 Introduction and motivationMost of the proteinogenic amino acids exhibit crystalline forms inthe solid state. The same is also true for other non-proteinogenicα-amino acids such as norvaline (COOHCHNH2CH2CH2CH3). Inmany cases, multiple crystalline solid phases, each with a uniquegeometry and distinct physical properties, have been identifiedfor a given material. Polymorphism occurs when different crys-talline phases (polymorphs) of the same material are thermo-dynamically accessible.1–4 Previous studies have observed phasetransitions between different polymorphs of various amino acidsas a function of temperature or pressure.5–9 In other amino acids,multiple polymorphs have been found to exist at the same tem-perature and pressure.10–12 This is possible because specific crys-tallization conditions may favor the formation of metastable poly-morphs, which are structures representing local, not global, ther-modynamic free energy minima at a given temperature and pres-sure.
Typically, solid-solid phase transitions in molecular crystals (i.e.
Yale University, Department of Chemistry, PO Box 208107, 225 Prospect St., NewHaven, CT 06520-8107, USA.E-mail: [email protected], [email protected]† Electronic Supplementary Information (ESI) available: [details of any supplemen-tary information available should be included here]. See DOI: 10.1039/b000000x/‡ Present address: Center for Integrated Nanotechnologies, Los Alamos National Labo-ratory, Los Alamos, New Mexico 87545, USA.
from one polymorph to another) are understood to take place viaa nucleation and growth mechanism.13–15 In this model, a smallnucleus of a new crystalline phase is first formed at a defect site inthe original lattice phase. The growth of the new phase proceedsas molecules from the original phase break out of their lattice po-sition and find a place in the new lattice. This rearrangement islinked with a diffusion of molecules in the newly forming lattice.In general, there is no definite relationship between the orienta-tion of the original lattice and the new lattice since the orientationof the new phase’s initial nucleus is random or at least highly id-iosyncratic.
In rare cases, the transition between two polymorphs is thoughtto take place via a concerted, diffusion-free mechanism, known asa Martensitic or displacive phase transition.16–19 The resultingprocess does not cause a randomized reorganization of the lat-tice, and therefore the lattice exhibits a memory effect.20 Molec-ular systems that undergo these concerted phase changes are ofparticular interest for the understanding and design of molecu-lar machines.21 Unlike typical solid-solid phase transitions, theconcerted motion of a displacive phase transition results in a netforce on a microscopic length scale. Therefore, progress towardsobserving, tuning, or triggering these phase transitions has appli-cations in nanoscale engineering.22,23
A standard method of studying solid-solid phase transitions istemperature-dependent X-ray diffraction, which provides essen-
Journal Name, [year], [vol.], 1–8 | 1
tial information about a molecular crystal’s time-averaged geo-metrical structure. However, since motion is the characteristicproperty of displacive phase transitions, it is naturally desirable tocomplement structural information with dynamical information.For this application, terahertz time-domain spectroscopy (THz-TDS)24–29, which allows detection of infrared-active vibrationsin the low frequency far-infrared range (typically 10–200 cm−1,and 1 THz = 33.34 cm−1) is a promising tool. Most importantly,vibrations in this frequency range can be significantly intermolec-ular in character12,30 and are therefore extremely sensitive tothe arrangement and orientation of molecules in the crystal lat-tice.11,31–33 As a result, THz-TDS measurements can easily distin-guish among different polymorphs. Furthermore, an understand-ing of the specific vibrational motion of the molecules at these lowfrequencies may provide insight into the mechanism by which aconcerted phase change occurs.
2 Experimental setup and sample prepara-tion
2.1 Sample Preparation
DL-norvaline was purchased from Alfa Aesar (purity 98%) andused without further purification. The dopant amino acids, whichare listed in the Electronic Supplementary Information(SigmaAldrich, purity 99%), were also used without further purification.100 mL solutions containing pure DL-norvaline (1.7 g) and 12%per mole of the impurity were prepared. The mixtures slowlyevaporated at 40 ◦C resulting in crystals with sub-millimeter di-mensions. The crystallites were characterized with powder XRDat room temperature (Rigaku SmartLab X-ray Diffractometer, seeElectronic Supplementary Information). The crystallized materi-als were ball-milled for 3 min resulting in a homogeneous powdercontaining grains less than 5 µm in size.
The samples used in this study are pressed pellets of a mix-ture of PTFE (Teflon, purchased from ChemCruz) and a smallamount of amino acid (typically ≈25 mg amino acid in ≈1000 mgTeflon, see Table S1 in the Electronic Supplementary Informa-tion). The amino acid crystallites are either pure DL-norvaline , orDL-norvaline crystallized from a mixed solution with the dopant.The mixtures were then pressed with an applied pressure of11 kbar, and the resulting pellets have a diameter of 13 mm andare approximately d ≈ 3.3mm thick. Reference samples of pureTeflon were pressed under the same conditions.
Teflon-mixed pellets have several advantages over pure aminoacid pellets. Thicker samples can be prepared due to the lowabsorption of Teflon in the THz range. Thicker samples have theadvantage of being less fragile and easier to handle, and they alsoallow one to remove etalon effects in the THz spectrum via trun-cation of the time-domain measurement. In addition, the fractionof amino acid in the Teflon host material can be optimized suchthat the absorption features are not saturated.
2.2 Experimental Setup
Spectra were measured in a THz-TDS spectrometer as describedin previous publications.12 For temperature controlled measure-ments, the samples were mounted in a sample-in-vapor cryostat
cooled with nitrogen gas, which allows measurements from roomtemperature down to 78 K. The cryostat was cooled in either 10 Kor 5 K increments using an adjustable nitrogen flow and resistive-heaters. The sample was allowed to reach thermal equilibriumprior to each measurement. To avoid contamination of the sam-ple, a temperature sensor was not placed directly on the sample,but rather above and below it. The average of both temperaturesensors provides an accurate approximation of the sample’s tem-perature (± 0.5 K).
THz-TDS measures the amplitude of the transmitted THz pulserather than its intensity. Thus, Fourier transformation of the mea-sured time domain traces provides information on both the spec-tral amplitude and phase of the measured electric field. Givenphase and amplitude information of the THz pulse, the real (n′)and imaginary (n′′) parts of the complex-valued refractive indexcan be obtained directly.
2.2.1 Extraction of the absorption-coefficient from the mea-sured data
The complex transmission amplitude t of the sample is describedby34:
t(ω) = t12(ω) · p2(ω) · t21(ω) (1)
where ti j(ω) =2ni(ω)
ni(ω)+n j(ω)is the Fresnel amplitude transmission
coefficient from medium i to medium j, p2 = eik0dn2 is the propa-gation operator through the sample (medium 2) where k0 =(ω/c)is the wave-vector in vacuum, and d the sample thickness. In thepresent case, the THz pulse enters the sample from air (n1 = 1),propagates through the sample, and then exits at the sample-airinterface. The pellets are d > 3mm thick, which corresponds tomore than 30 ps for the doubly-reflected pulse to emerge. There-fore, a measurement time duration of 28 ps was chosen in orderto avoid multiple pulses, and thus eliminate etalon effects in thecomplex transmission function.
The measured transmission through the sample is complex-valued and can therefore be separated into an amplitude andphase term. This allows us to rewrite eq. (1) as:
t(ω) = t12(ω) t21(ω)e−k0dn′′2 e+idk0n′2 = Ae−iφ±2mπ (2)
with the complex refractive index n = n′+ in′′. It is possible to cal-culate the real part of the refractive index based on the measuredspectral phase.35 From this refractive index it is possible to cal-culate the transmission coefficient and then solve eq. (2) for theimaginary part of the refractive index.
Effective medium theory is used to calculate the index for theamino acid. The well-known Bruggeman equation36 relates themeasured permittivity of a mixture (εm) to the permittivity of thetwo components (εh for Teflon host, and εi for amino acid inclu-sions):
fh
(εh− εm
εh +2εm
)+ fi
(εi− εm
εi +2εm
)= 0 (3)
where fh, fi are the volume fraction of the two components, h(host), and i (inclusion). The measured refractive index (nm = n2)describes the mixed pellet. The permittivity of the host materialεh = n2
Teflon is calculated from the reference measurement, and thepermittivity of the mixture εm = n2
m is calculated from the mixed
2 | 1–8Journal Name, [year], [vol.],

pellet, under the assumption that the magnetic response of themedium is negligible (relative permeability µr = 1). Therefore,eq. (3) can be solved for the complex permittivity of the aminoacid (εi). The complex refractive index of the amino acid crystal-lites is given by n =
√εi, and the absorption coefficient is deter-
mined from the imaginary part: α = 2n′′ ωc .
2.3 DFT Calculations of DL-norvaline
Calculations of the optimized structure and vibrational modes ofDL-norvaline were carried out using the SIESTA DFT softwarepackage (3.2 revision 462). We employed the vdW-DF-cx func-tional37, which is based on a generalized gradient approximation(GGA) level exchange-correlation functional, but which also ac-counts for van der Waals forces using the Lundqvist-Langreth non-local density-density interaction framework.38 Typical GGA ormeta-GGA exchange-correlation functionals are capable of mod-eling only local or semi-local forces, and this is inadequate formodeling a system with regions dominated by hydrophobic inter-actions, and therefore van der Waals (dispersion) forces, such asDL-norvaline. These DFT calculations incorporate vdW-DF func-tionals that do not require empirical correction terms. In particu-lar, the vDW-DF-cx functional aims to be nonempirical and to usethe vdW-DF scheme to calculate both correlation and exchangeterms in a self-consistent way.37
SIESTA uses periodic boundary conditions, and the basis setconsists of numerical atomic orbitals. We used a triple-zeta,doubly polarized (TZDP) basis set. Minimum energy structureswere obtained by optimizing the initial coordinates and latticecell parameters obtained by XRD measurements on single crys-tals.39 The atomic positions and unit cell parameters were simul-taneously optimized to minimize interatomic forces and unit cellstress. Details of calculating vibrational frequencies and IR in-tensities has been previously reported.12 Briefly, harmonic modeswere calculated using the force-constant matrix40 determined bydisplacing each atom 0.02 Å in each direction along the Cartesianaxes. For IR intensities, the Berry phase approach was used tocalculate macroscopic polarization41, which was then used to cal-culate the Born effective charge tensor of each atom.40 The Borneffective charge tensor of each atom was then used to calculatethe IR intensity of each mode.12,41
3 Experimental Results
3.1 Pure DL-norvaline
A Teflon/DL-norvaline pellet was cooled in 10 K increments. Atselected temperatures, the transmission though the sample pelletwas measured along with the transmission through an identicalaperture without a sample (the reference). The absorption spec-tra, calculated from these measurements, are plotted in Fig. 1.For temperatures higher than 180 K, the samples show a broad,weak absorption with a central-frequency of 1.65 THz and fullwidth at half maximum (FWHM) of about 0.8 THz. The THztransmission spectrum changes fundamentally as the sample iscooled from 190 K to 180 K. A strong and narrow peak emerges at1.55 THz with a FWHM of 0.26 THz. THz measurements are sen-sitive to collective vibrational and rotational/librational modes in
Fig. 1 Measured absorption coefficient of DL-norvaline. The absorptionspectrum changes dramatically between 190 K and 180 K, indicating thatthe crystal lattice changes at this temperature. The absorption increaseswith decreasing temperature, and reaches a maximum at 140 K. Theabsorption then decreases as the temperature is further decreased.
the crystal lattice. In general, these modes are narrower and morepronounced at lower temperatures.31 The distinct change in theabsorption mode seen here, and in particular the red-shift of thepeak with decreasing temperature, cannot be explained merely bythermal shrinkage of the lattice. Such a significant change in thetransmission spectrum can only be explained by a similarly signif-icant change of the lattice, which is a solid-solid phase transitionthat occurs between 190 K and 180 K and has also been observedin single crystal XRD measurements.39
The absorption spectrum continues to change as the tempera-ture is decreased from 180 K to 140 K. The absorption strengthincreases, and the characteristic feature becomes narrower. Fortemperatures below 140 K, however, the absorption decreaseswith decreasing temperature, and this also cannot be explainedby a simple contraction of the lattice. Although the change inthe absorption spectrum is more subtle than that between 190 Kand 180 K, it indicates a second solid-solid phase transition. Thephase transition between 190 K and 180 K is reversible, but theone starting at around 140 K is irreversible. This is in agreementwith delamination in DL-norvaline observed at these lower tem-peratures.39
3.2 Comparison of Calculated and Measured THz Spectra
The frequencies and IR intensities at 0 K were calculated after op-timizing the atomic coordinates determined crystallographicallyat −90 ◦C (183 K).39 In accordance with previous studies42 theD and L enantiomers alternate along the c axis, and are identicalalong the a and b axes.39 For the low temperature α phase, norva-line molecules adopt two conformations, denoted A and B, whereA had an abundance of 51.5%.39 The side chain can adopt transand gauche conformations upon rotation around the Cα -Cβ andCβ -Cγ bonds. The A conformer of the α phase is trans,gauche+,
Journal Name, [year], [vol.], 1–8 | 3

Fig. 2 Optimized DL-norvaline unit cell with conformer configurationAABB. Molecules in positions 1 and 3 are L, and those in positions 2and 4 are D.
and the B conformer is trans,trans.39 The reported single crys-tal x-ray diffraction data (CCSD zzzodu02) does not determinewhich molecule in the unit cell is the A conformer and which isB.39
Fig. 2 shows the optimized geometry of a 4-molecule unit cellwhere A-B neighbors are along the a axis, A-A and B-B neighborsare along the c axis, and A-A and B-B neighbors are along the baxis. We denote each type of unit cell by the sequence of con-former type in positions 1-2-3-4. For example, Fig. 2 displays theAABB unit cell. We note that the structural optimization does notresult in conformational changes of the molecules. Unit cell cal-culations included all six possible conformer configurations witha 50% abundance of each: AABB, BBAA, ABBA, BAAB, ABAB, andBABA. The results of these calculation are presented in table 1.
The initially monoclinic symmetry of the unit cell is broken dur-ing the optimization of the ABBA and BAAB configurations, andtheir minimum energy calculated structures are triclinic. Further-more, these configuration deviate strongly from the previouslyreported geometry. The a axis is significantly longer in the calcu-lation than in previously reported crystallographic data. There-fore, we conclude that these two conformer combinations are lesslikely. The remaining four unit cells (ABAB, BABA, AABB, BBAA)all optimized to axes length within ± 2% of the reported crystal-lographic dimensions. This slight discrepancy between the calcu-
lation and previous crystallographic results is to be expected, be-cause the crystallographic structure is determined at 183 K, whilethe calculation is at 0 K. The final unit cell energy of the ABABconformer is the lowest, hence the most favorable. However, theenergetic difference of 0.13 eV (3.0 kcal/mol) is not large enoughto rule out the remaining three unit cells.
The IR spectrum for all six unit cells is calculated and plot-ted in the Electronic Supplementary Information (Fig. S1 and S2).The calculated spectra all exhibit a resonance around 1.5 THz, inagreement with our experimental results. To better understandthe effect of conformer configuration on the calculated spectrum,we performed a mode character analysis, in which intermolec-ular and intramolecular contributions of each mode are quanti-fied.31 As seen in the SI Fig.S3, modes across different conformerconfigurations can be grouped according to similar frequency, in-tensity, and mode character. The intense peaks in the 1.4 THzto 1.75 THz range are mostly rotational/librational in character(blue and green squares), while those in the 2.0 THz to 2.4 THzrange have equal contributions from rotational/librational and in-tramolecular motions with almost no translational character (yel-low squares). In general, greater similarities are observed forconformer configurations with similar optimized unit cell param-eters, for example AABB and BBAA.
The spectrum calculated for the ABAB conformer combination,is plotted in Fig. 3. The calculated resonances are convoluted witha Lorentzian function with FWHM of 0.2 THz to mimic the exper-imental line width. The strong peak is very well reproduced bythe calculations. The broad minor peak close to 2 THz is also rea-sonably well reproduced.
3.3 Grain Size Dependence
A more detailed investigation of the phase change between 190 Kand 180 K can be performed by measuring the phase transitionof DL-norvaline / Teflon pellets with differing DL-norvaline grainsizes. If we assume that the defect and impurity density is inde-pendent of grain size, smaller grains will contain fewer defectsand impurities. These impurities and defects act as nucleationpoints for phase transitions. This holds true for both the nucle-ation and growth as well as Martensitic mechanisms of phasetransitions.17,43,44 A larger total number of impurities/defectswill disturb the ideal lattice to a greater extent, and the energybarrier for a phase transition will be lower.
We measured THz spectra of samples with two different grain
Geometry / Label zzzodu01 AABB BBAA ABBA BAAB ABAB BABAa [Å] 14.21 14.27 14.27 14.54 14.53 13.91 13.91b [Å] 4.76 4.86 4.86 4.88 4.88 4.87 4.87c [Å] 9.86 9.84 9.84 9.80 9.80 8.82 9.82α [◦] 90 90 90 89.66 90.35 90 90β [◦] 102.85 102.93 102.95 102.83 102.83 102.22 102.17γ [◦] 90 90 90 92.55 87.53 90 90
Volume [Å3] 649.81 665 665.41 677.19 676.90 650.42 650.41Energy [eV] -8360.06 -8360.06 -8360.03 -8360.03 -8360.16 -8360.16
Table 1 Geometry of the unit cells calculations performed with SIESTA. The labels denote the position of the conformer in the unit cell, based on thenotation defined in Fig 2.
4 | 1–8Journal Name, [year], [vol.],

Fig. 3 Calculated IR intensity of the ABAB conformer combination. Thecalculated IR resonances are broadened with a Lorentzian with FWHMof 0.2 THz. The blue dashed line is the experimentally measuredspectrum at 140 K.
sizes to investigate this. The first sample contained crystals thatwere ball-milled for 3 min to produce grains smaller than s = 5µmin diameter. For the second sample, the grains where ground us-ing a mortar and pestle and sorted by size using a micro sieve.Grain diameters of this second sample ranged from 125 µm to250 µm.
Fig. 4 Measured absorption through a sample made of pureDL-norvalinewith an average grain size s of about 5 µm. A clear changein the spectral absorption is evident when the sample is cooled from185 K to 180 K.
The results for the ball-milled sample are plotted in Fig. 4. Atemperature step size of 5K±0.5K was chosen to more accuratelydetermine the phase transition temperature. When the samplewas cooled from 185 K to 180 K, the absorption profile changedabruptly. Measurements performed on the larger grains are plot-
Fig. 5 Measured absorption through a sample made of pureDL-norvaline, with an average grain size s between 125 µm and 250 µm.A clear change in the spectral absorption is evident when the sample iscooled from 195 K to 190 K.
ted in Fig. 5. A clear change in the spectrum is visible when thesample is cooled from 195 K to 190 K, which is 10 K higher thanfor the micro-grain sample in Fig. 4. The only difference in thesesamples is their grain size, and therefore the total number ofimperfections and defects per grain. The larger grains have anabout 50,000 times larger volume, and under the assumption ofa constant imperfection density, the probability of having an im-perfection is 50,000 times higher. The resulting 10 K differencein phase transition temperature suggests that these imperfectionsare important as starting points for the phase transition, which isin agreement with a Martinsitic phase transition mechanism, butdoes not rule out nucleation and growth.
A comparison of the two different grain sizes also reveals thatthe high temperature absorption coefficient of both samples isα = 145± 15cm−1, however the low temperature absorption at175 K is different. It is α = 210±15cm−1 for the small grain size,while it is α = 310± 15cm−1 for the larger ones. This indicatesthat possibly not all grains in the micro granular sample have con-verted to the low temperature phase, even through 175 K is morethan 15 K colder than the phase transition temperature measuredfor the larger grains.
3.4 Mixed amino acid crystalsA more detailed understanding of the origin of the resonant ab-sorption and the phase transition can be gained by measuringdoped DL-norvaline crystals. The molecular dopants have similargeometries and chemical properties as the host material. A con-centration of 12 mol-% dopants in solution was chosen. This highconcentration ensures that enough material for the crystallizationprocess is present to form not only doped crystals but also mixedcrystals.45 In general, three different types of crystal can resultfrom this mixing. The first case is that the two amino acids formtwo pure crystals that are commingled. The PXRD of this crystal
Journal Name, [year], [vol.], 1–8 | 5
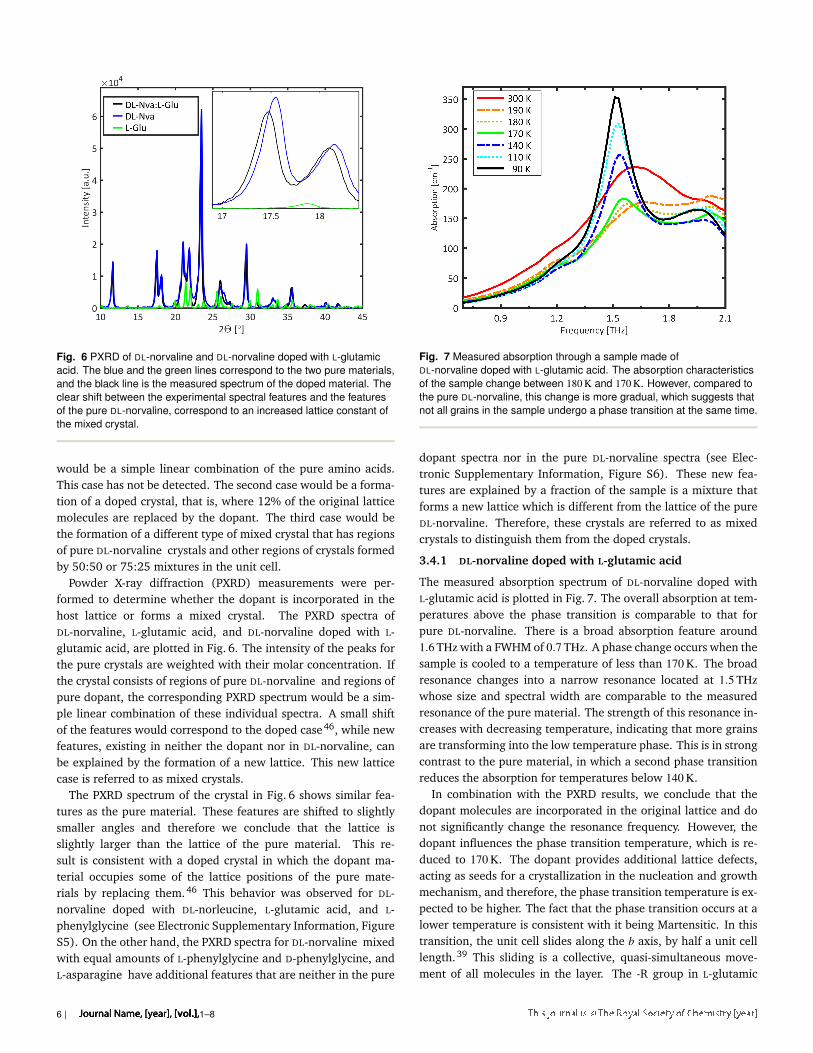
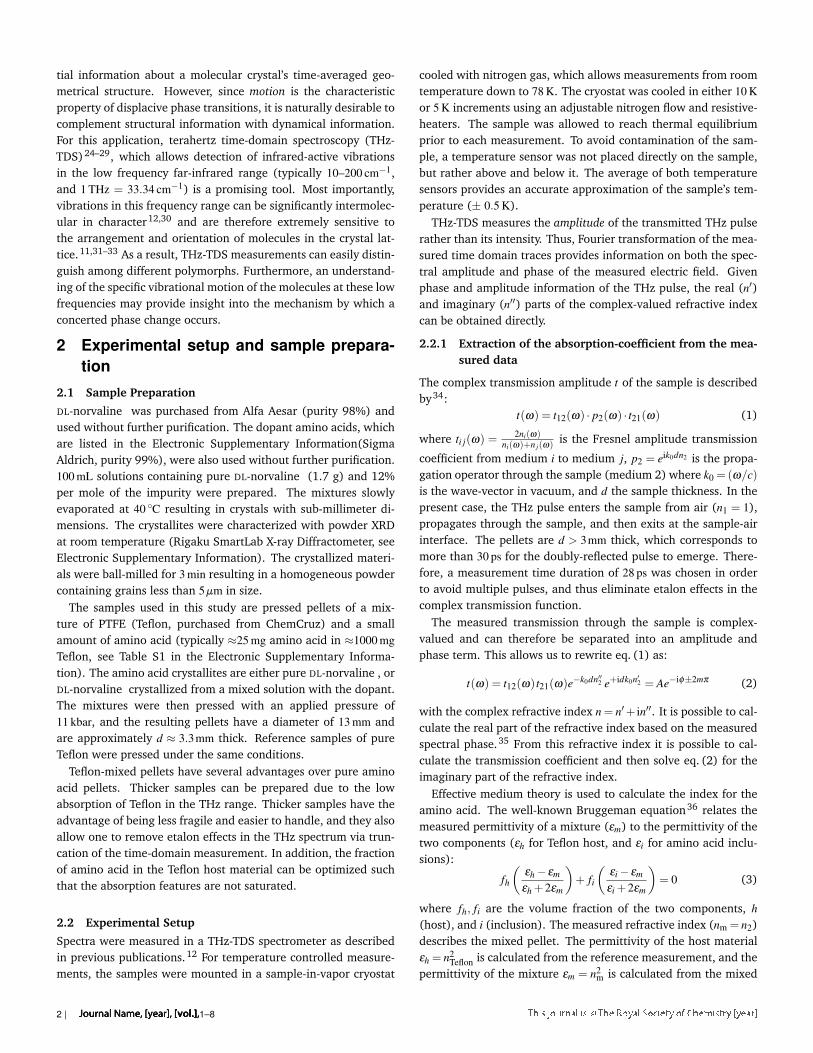
Fig. 6 PXRD of DL-norvaline and DL-norvaline doped with L-glutamicacid. The blue and the green lines correspond to the two pure materials,and the black line is the measured spectrum of the doped material. Theclear shift between the experimental spectral features and the featuresof the pure DL-norvaline, correspond to an increased lattice constant ofthe mixed crystal.
would be a simple linear combination of the pure amino acids.This case has not be detected. The second case would be a forma-tion of a doped crystal, that is, where 12% of the original latticemolecules are replaced by the dopant. The third case would bethe formation of a different type of mixed crystal that has regionsof pure DL-norvaline crystals and other regions of crystals formedby 50:50 or 75:25 mixtures in the unit cell.
Powder X-ray diffraction (PXRD) measurements were per-formed to determine whether the dopant is incorporated in thehost lattice or forms a mixed crystal. The PXRD spectra ofDL-norvaline, L-glutamic acid, and DL-norvaline doped with L-glutamic acid, are plotted in Fig. 6. The intensity of the peaks forthe pure crystals are weighted with their molar concentration. Ifthe crystal consists of regions of pure DL-norvaline and regions ofpure dopant, the corresponding PXRD spectrum would be a sim-ple linear combination of these individual spectra. A small shiftof the features would correspond to the doped case46, while newfeatures, existing in neither the dopant nor in DL-norvaline, canbe explained by the formation of a new lattice. This new latticecase is referred to as mixed crystals.
The PXRD spectrum of the crystal in Fig. 6 shows similar fea-tures as the pure material. These features are shifted to slightlysmaller angles and therefore we conclude that the lattice isslightly larger than the lattice of the pure material. This re-sult is consistent with a doped crystal in which the dopant ma-terial occupies some of the lattice positions of the pure mate-rials by replacing them.46 This behavior was observed for DL-norvaline doped with DL-norleucine, L-glutamic acid, and L-phenylglycine (see Electronic Supplementary Information, FigureS5). On the other hand, the PXRD spectra for DL-norvaline mixedwith equal amounts of L-phenylglycine and D-phenylglycine, andL-asparagine have additional features that are neither in the pure
Fig. 7 Measured absorption through a sample made ofDL-norvaline doped with L-glutamic acid. The absorption characteristicsof the sample change between 180 K and 170 K. However, compared tothe pure DL-norvaline, this change is more gradual, which suggests thatnot all grains in the sample undergo a phase transition at the same time.
dopant spectra nor in the pure DL-norvaline spectra (see Elec-tronic Supplementary Information, Figure S6). These new fea-tures are explained by a fraction of the sample is a mixture thatforms a new lattice which is different from the lattice of the pureDL-norvaline. Therefore, these crystals are referred to as mixedcrystals to distinguish them from the doped crystals.
3.4.1 DL-norvaline doped with L-glutamic acid
The measured absorption spectrum of DL-norvaline doped withL-glutamic acid is plotted in Fig. 7. The overall absorption at tem-peratures above the phase transition is comparable to that forpure DL-norvaline. There is a broad absorption feature around1.6 THz with a FWHM of 0.7 THz. A phase change occurs when thesample is cooled to a temperature of less than 170 K. The broadresonance changes into a narrow resonance located at 1.5 THzwhose size and spectral width are comparable to the measuredresonance of the pure material. The strength of this resonance in-creases with decreasing temperature, indicating that more grainsare transforming into the low temperature phase. This is in strongcontrast to the pure material, in which a second phase transitionreduces the absorption for temperatures below 140 K.
In combination with the PXRD results, we conclude that thedopant molecules are incorporated in the original lattice and donot significantly change the resonance frequency. However, thedopant influences the phase transition temperature, which is re-duced to 170 K. The dopant provides additional lattice defects,acting as seeds for a crystallization in the nucleation and growthmechanism, and therefore, the phase transition temperature is ex-pected to be higher. The fact that the phase transition occurs at alower temperature is consistent with it being Martensitic. In thistransition, the unit cell slides along the b axis, by half a unit celllength.39 This sliding is a collective, quasi-simultaneous move-ment of all molecules in the layer. The -R group in L-glutamic
6 | 1–8Journal Name, [year], [vol.],

Fig. 8 Measured absorption through a sample made ofDL-norvaline doped with L-phenylglycine. The absorption characteristicsof the sample change between 180 K and 170 K. The absorptioncharacteristic of this sample is similar to the pure DL-norvaline, howeverthe maximum absorption is weaker.
acid terminates with a carboxylic acid, but is a methyl group inDL-norvaline. This carboxylic acid group is located in the planeat which the collective displacement takes place, and will locallychange the energy profile and thereby hinder this sliding process.The larger potential barriers due to the dopants result in a loweronset temperature.
3.4.2 DL-norvaline doped with L-phenylglycine
The measured absorption spectrum for DL-norvaline doped withL-phenylglycine is plotted in Fig. 8, and is similar to the undopedDL-norvaline. The resonance frequency of the low temperaturephase is 1.5 THz, which is identical to the resonance frequency ofthe pure DL-norvaline. However, the phase transition tempera-ture in the doped sample sets in at 170 K rather than 180 K. Asthe sample is further cooled to 90 K the increase in absorption isless than that for pure DL-norvalineor DL-norvaline doped with L-glutamic acid. Similar to the sample doped with L-glutamic acid,we conclude that the dopants do not completely change the lat-tice but stabilize it with respect to the second low temperaturephase change.
As discussed with the L-glutamic acid doped case, the molecu-lar structure for L-phenylglycine is similar to DL-norvaline, exceptfor the phenyl ring at the end of the -R group which is located atthe sliding interface. As in the case for L-glutamic acid, the addi-tional disturbance along this plane, increases the energy barrierand decreases the phase transition temperature.
4 ConclusionsDL-norvaline forms a layered crystal and is suspected to undergoa Martensitic phase transition when cooled.39 This phase tran-sition has been studied with temperature-dependent THz spec-troscopy. When the pure DL-norvaline is cooled below 180 K asignificant change in the absorption spectrum is measured which
is associated with a phase-transition. A better understanding ofthe mechanism for this phase transition is gained by measuringdifferent crystal sizes since larger crystals have a higher proba-bility for containing impurities. These impurities act as seeds forphase transitions, and therefore larger crystals undergo the phasetransition at higher temperatures. For grains with an average sizebetween 125 and 250 µm, the transition temperature was 190 K,while it is 180 K for grains of 5 µm or less. This effect is consistentwith Martensitic transistions.
The phase transition mechanism was studied in more detailby doping DL-norvaline crystals with similar amino acids. Thesedopants reduced the phase transition temperature by 10 K, al-though one would expect the additional defect sites caused bythe dopants should increase the transition temperature. This isa strong indicator for a Martensitic phase transition, because thesuspected transition can be described as a sliding of neighboringunit cells. The dopants used are identical to DL-norvaline, exceptfor the end of the -R group which is found at the hydrophobiclayer where the sliding occurs. The dopants locally increase theenergy barrier for the sliding process which requires a lower tem-perature for the Martensitic transition.
AcknowledgementWe acknowledge financial support from the national science foun-dation (NSF) under grant number: NSF CHE - CSDMA 1465085.KR and CN acknowledge financial support by the U.S. Depart-ment of Energy Office of Science, Office of Basic Energy Sciences,under award no. DE-FG02-07ER15909.
References1 W. C. McCrone, in Physics and Chemistry of the Organic Solid
State. Volume 2, ed. D. Fox, M. M. Labes and A. Weissberger,Interscience Publishers, 1965, pp. 725–767.
2 J. Bernstein, Polymorphism in Molecular Crystals, OxfordUniversity Press, New York, 2002, vol. 14.
3 A. Gavezzotti, J. Pharm. Sci., 2007, 96, 2232–2241.4 A. D. Bond, Curr. Opin. Solid State Mater. Sci., 2009, 13, 91–
97.5 E. V. Boldyreva, H. Sowa, Y. V. Seryotkin, T. N. Drebushchak,
H. Ahsbahs, V. Chernyshev and V. Dmitriev, Chem. Phys. Lett.,2006, 429, 474–478.
6 A. S. Sabino, G. P. De Sousa, C. Luz-Lima, P. T. C. Freire,F. E. A. Melo and J. M. Filho, Solid State Commun., 2009,149, 1553–1556.
7 V. S. Minkov, A. S. Krylov, E. V. Boldyreva, S. V. Goryainov,S. N. Bizyaev and A. N. Vtyurin, J. Phys. Chem. B, 2008, 112,8851–8854.
8 V. S. Minkov, N. A. Tumanov, R. Q. Cabrera and E. V.Boldyreva, CrystEngComm, 2010, 12, 2551–2560.
9 E. A. Belo, J. A. Lima Jr., P. T. C. Freire, F. E. A. Melo, J. M.Filho, H. N. Bordallo and A. Polian, Vib. Spectrosc., 2010, 54,107–111.
10 H. N. Bordallo, E. V. Boldyreva, A. Buchsteiner, M. M. Kozaand S. Landsgesell, J. Phys. Chem. B, 2008, 112, 8748–8759.
11 A. B. True, K. Schroeck, T. A. French and C. A. Schmutten-
Journal Name, [year], [vol.], 1–8 | 7

maer, J. Infrared, Millimeter, Terahertz Waves, 2011, 32, 691–698.
12 M. R. C. Williams, D. J. Aschaffenburg, B. K. Ofori-Okai andC. A. Schmuttenmaer, J. Phys. Chem. B, 2013, 117, 10444–10461.
13 Y. V. Mnyukh, Mol. Cryst. Liq. Cryst., 1979, 52, 505–521.14 J. D. Dunitz, Pure Appl. Chem., 1991, 63, 177–185.15 F. H. Herbstein, Acta Crystallogr., Sect. B, 2006, 62, 341–383.16 S. C. Tuble, J. Anwar and J. D. Gale, J. Am. Chem. Soc., 2004,
126, 396–405.17 J. Anwar, S. C. Tuble and J. Kendrick, J. Am. Chem. Soc.,
2007, 129, 2542–2547.18 D. Zahn and J. Anwar, RSC Adv., 2013, 3, 12810.19 J. A. van den Ende and H. M. Cuppen, Cryst. Growth Des.,
2014, 14, 3343–3351.20 J. Mohd Jani, M. Leary, A. Subic and M. A. Gibson, Materials
& Design, 2014, 56, 1078–1113.21 K. Bhattacharya and R. D. James, Science, 2005, 307, 53–54.22 J. S. Juan, M. L. No and C. A. Schuh, Nat Nano, 2009, 4,
415–419.23 K. Kinbara and T. Aida, Chem. Rev., 2005, 105, 1377–1400.24 M. van Exter and D. Grischkowsky, Applied Physics Letters,
1990, 56, 1694–1696.25 J. Neu, R. Beigang and M. Rahm, Applied Physic Letters,
2013, 103, 041109–4.26 J. A. Zeitler, P. F. Taday, D. A. Newnham, M. Pepper, K. C. Gor-
don and T. Rades, Journal of Pharmacy and Pharmacology,2007, 59, 209–223.
27 J. Neu and M. Rahm, Optics Express, 2015, 23, 12900–12909.28 D. Grischkowsky, S. Keiding, M. van Exter and C. Fattinger, J.
Opt. Soc. Am. B, 1990, 7, 2006–2015.29 J. Neu, B. Krolla, O. Paul, B. Reinhard, R. Beigang and
M. Rahm, Optics Express, 2010, 18, 27748–27757.30 P. U. Jepsen and S. J. Clark, Chem. Phys. Lett., 2007, 442,
275–280.
31 M. R. C. Williams, A. B. True, A. F. Izmaylov, T. A. French,K. Schroeck and C. A. Schmuttenmaer, Phys. Chem. Chem.Phys., 2011, 13, 11719–11730.
32 M. D. King, W. D. Buchanan and T. M. Korter, J. Pharm. Sci.,2011, 100, 1116–1129.
33 A. M. Fedor, D. G. Allis and T. M. Korter, VibrationalSpectroscopy, 2009, 49, 124 – 132.
34 S. J. Orfanidis, Electromagnetic Waves and Antennas, RutgersUniversity, 2006.
35 This assumes that there is no phase shift at the interfaces. Thisis a valid assumption because this additional phase is roughly1000 times smaller than that from propagation through thesample, as explained in detail in the ESI of this paper.
36 T. Choy, Effective Medium Theory: Principles andApplications, Clarendon Press, 1999.
37 K. Berland and P. Hyldgaard, Phys. Rev. B, 2014, 89, 035412.38 M. Dion, H. Rydberg, E. Schröder, D. C. Langreth and B. I.
Lundqvist, Phys. Rev. Lett., 2004, 92, 246401.39 C. H. Görbitz, J. Phys. Chem. B, 2011, 115, 2447–2453.40 D. Fernández-Torre, R. Escribano, T. Archer, J. M. Pruneda
and E. Artacho, J. Phys. Chem. A, 2004, 108, 10535–10541.41 R. D. King-Smith and D. Vanderbilt, Phys. Rev. B, 1993, 47,
1651–1654.42 P. Chatzigeorgiou, N. Papakonstantopoulos, N. Tagaroulia,
E. Pollatos, P. Xynogalas and K. Viras, J. Phys. Chem. B, 2010,114, 1294–1300.
43 W. Cao, J. A. Krumhansl and R. J. Gooding, Phys. Rev. B,1990, 41, 11319–11327.
44 A. A. Boulbitch and P. Tolédano, Phys. Rev. Lett., 1998, 81,838–841.
45 J. C. Givand, A. S. Teja and R. W. Rousseau, AIChE J., 2001,47, 2705–2712.
46 H. C. Koolman and R. W. Rousseau, AIChE J., 1996, 42, 147–153.
8 | 1–8Journal Name, [year], [vol.],