read chapter 4. all living organisms are related to each other having descended from common...
TRANSCRIPT

Chapter 4 Phylogeny and evolutionary history
Read Chapter 4

Phylogeny
All living organisms are related to each other having descended from common ancestors.
Understanding the evolutionary relationships between groups enables us to reconstruct the tree of life and gain insight into history of evolutionary change.

Phylogeny
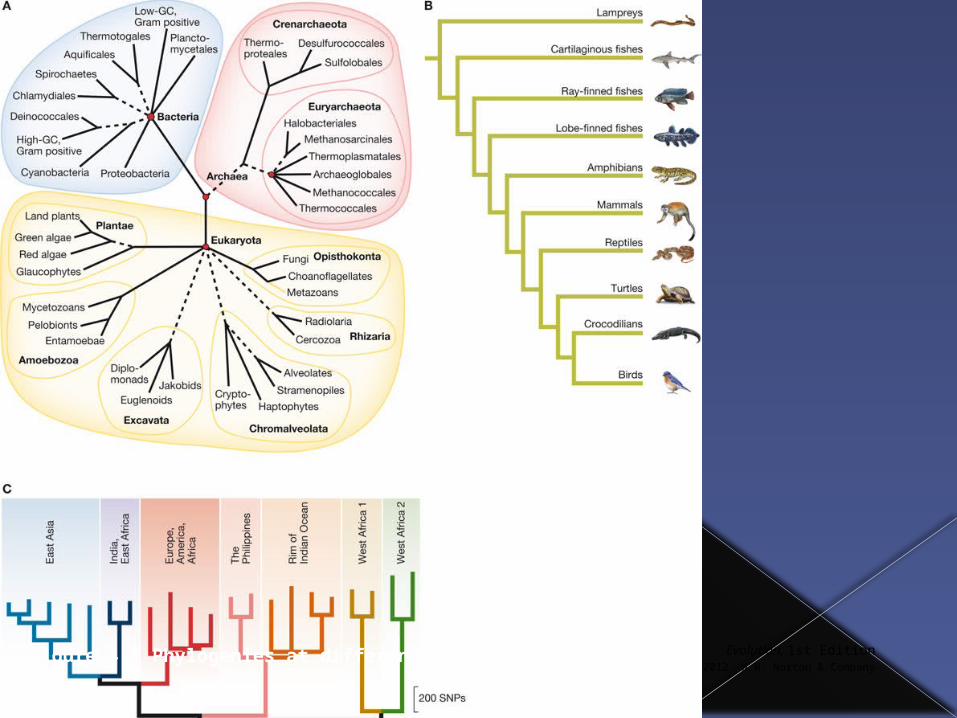
Phylogeny is the study of the branching relationships between populations over evolutionary time.
A phylogenetic tree is built up by analyzing the distribution of traits across populations.
Evolution, 1st EditionCopyright © 2012 W.W. Norton & Company
Figure 4.2 Phylogenies at different scales

Traits (characters)
A trait (or character) is any observable characteristic of an organism.
Could be anatomical features, behaviors, gene sequences, etc.
Traits
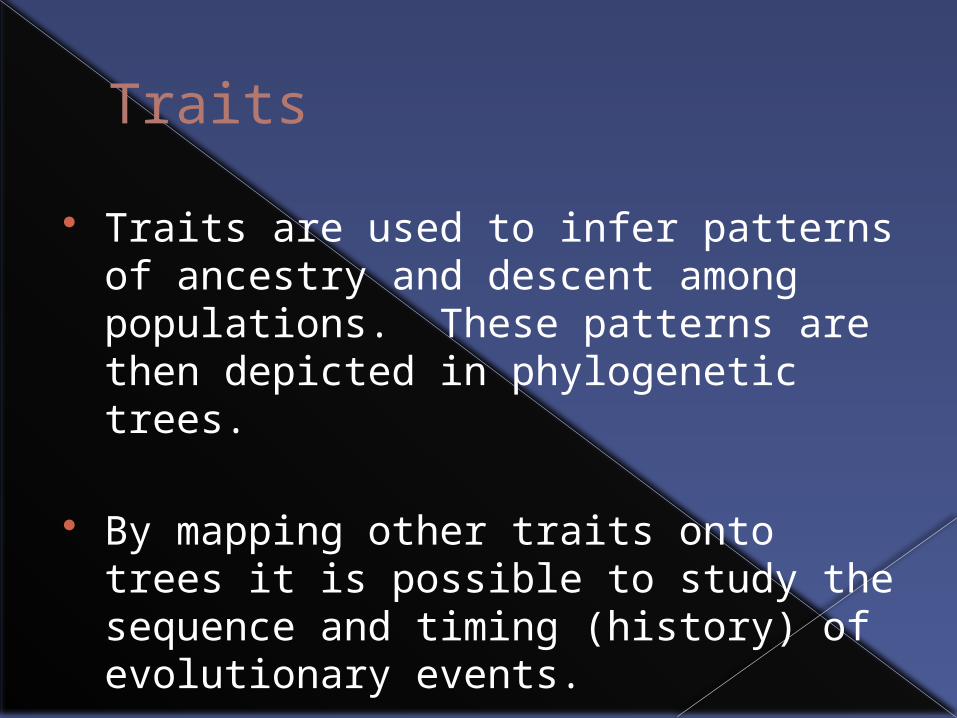
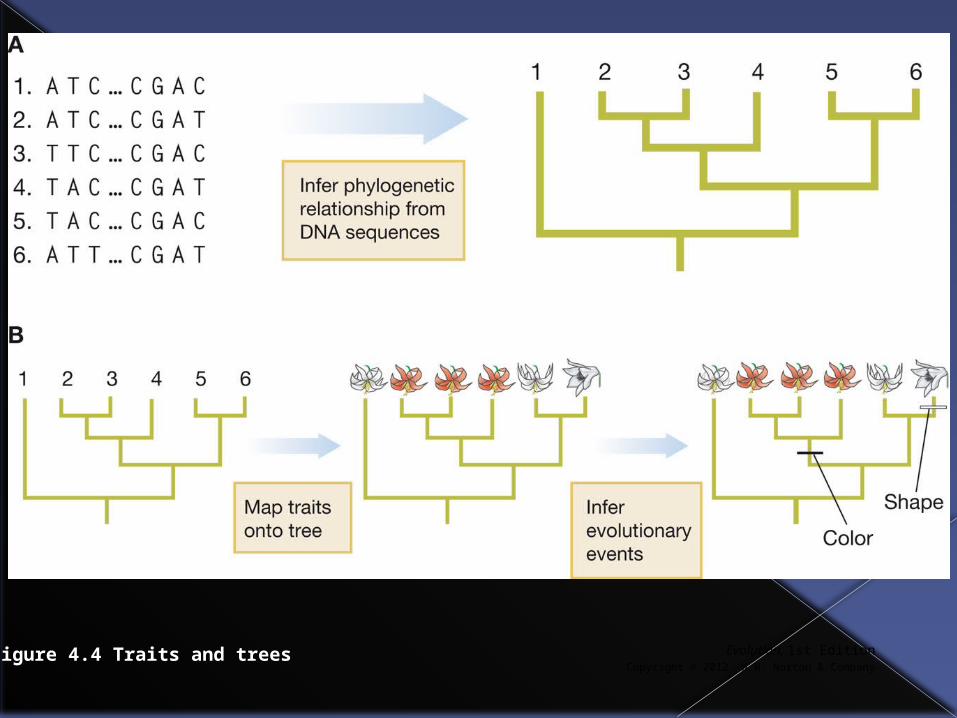
Traits are used to infer patterns of ancestry and descent among populations. These patterns are then depicted in phylogenetic trees.
By mapping other traits onto trees it is possible to study the sequence and timing (history) of evolutionary events.
Evolution, 1st EditionCopyright © 2012 W.W. Norton & Company
Figure 4.4 Traits and trees
Phylogenetic trees are hypotheses
It’s important to bear in mind that phylogenetic trees are hypotheses about the evolutionary relationships between groups.
When additional evidence is acquired it can be used to test a tree.
How to read a phylogenetic tree
Each branch tip represents a taxon (a group of related organisms).
Interior nodes (where branches meet) represent ancestral populations that are the common ancestors of the taxa at the ends of the branches.

Evolution, 1st EditionCopyright © 2012 W.W. Norton & Company
Figure 4.6 Interior nodes represent common ancestors
How to read a phylogenetic tree
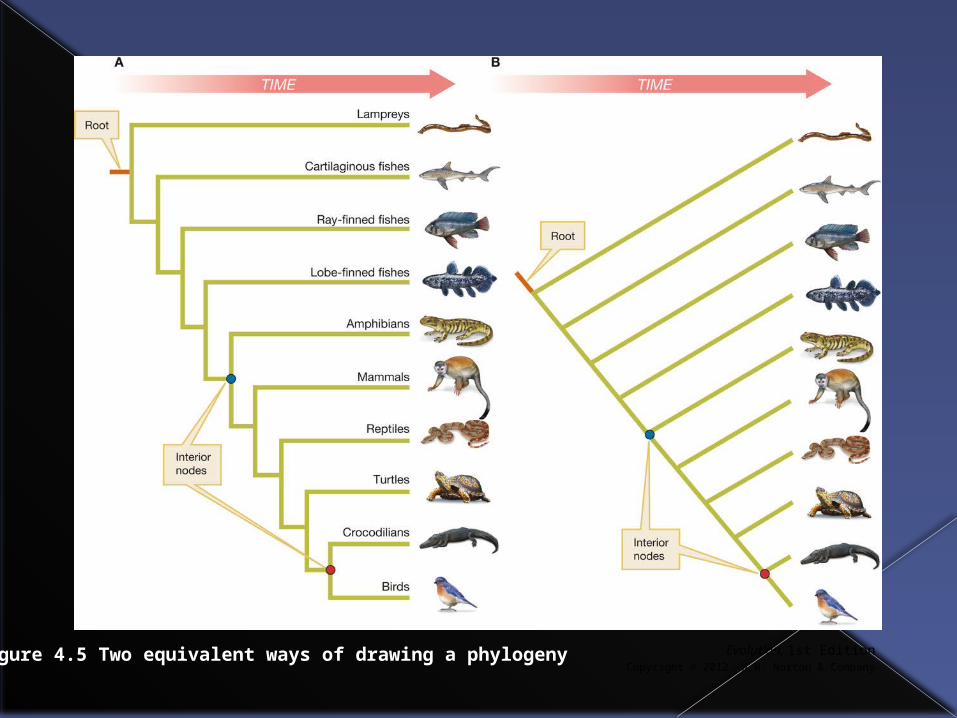
Phylogenetic trees are generally drawn in either a Tree format or a Ladder format.
They convey the same information about the relatedness of taxa
Evolution, 1st EditionCopyright © 2012 W.W. Norton & Company
Figure 4.5 Two equivalent ways of drawing a phylogeny
How to read a phylogenetic tree
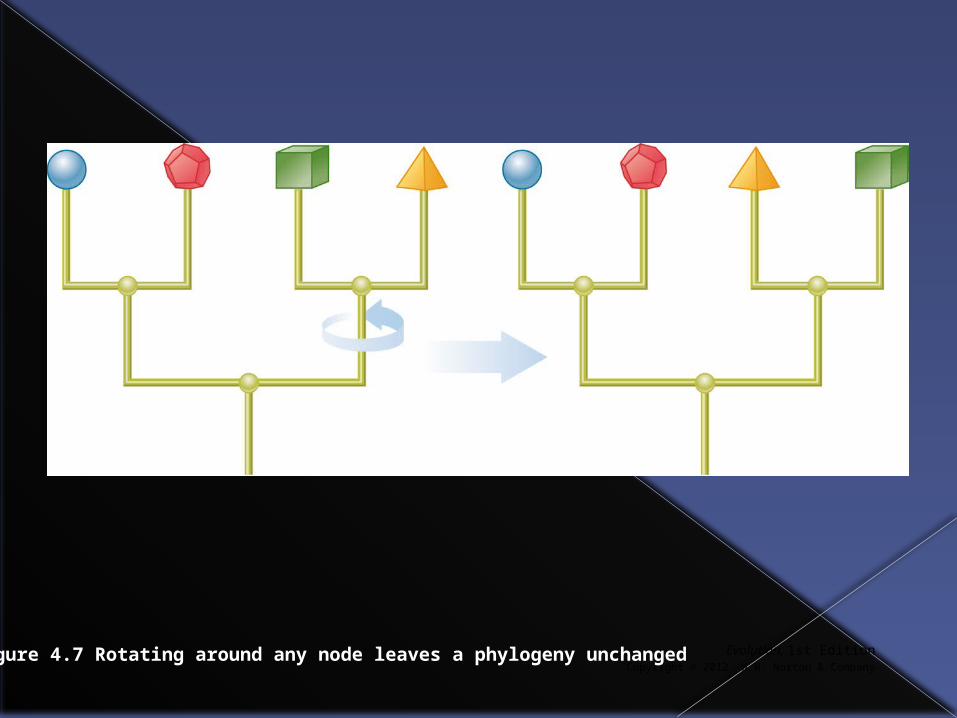
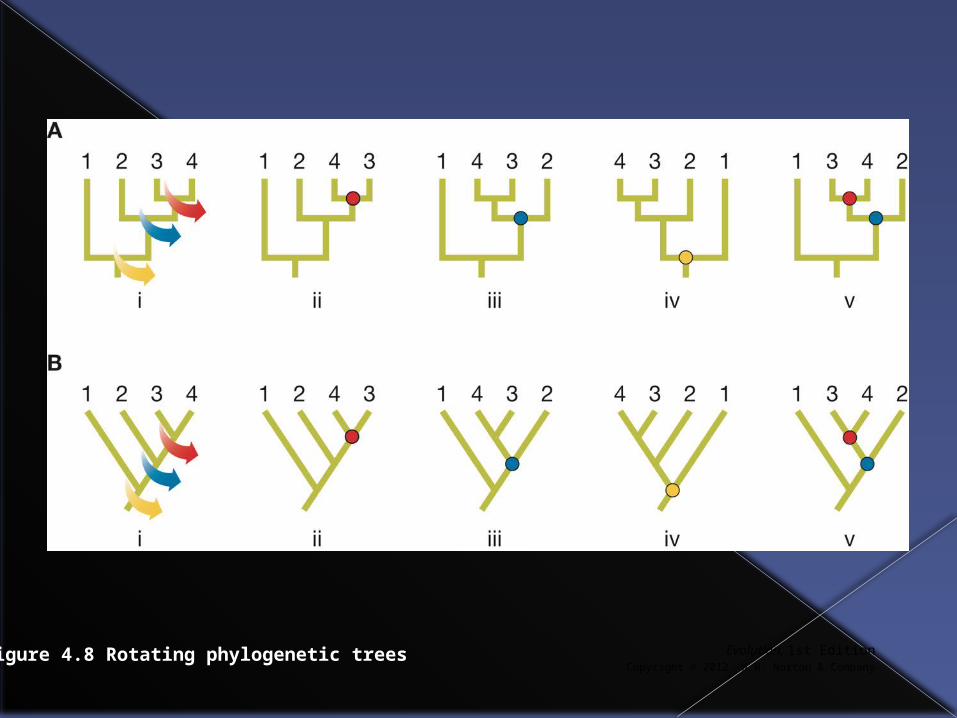
It is important to remember that a particular set of evolutionary relationships can be depicted in multiple different ways in a phylogenetic tree.
Any node in a phylogenetic tree can be rotated without altering the relationships between taxa.
Evolution, 1st EditionCopyright © 2012 W.W. Norton & Company
Figure 4.7 Rotating around any node leaves a phylogeny unchanged
Evolution, 1st EditionCopyright © 2012 W.W. Norton & Company
Figure 4.8 Rotating phylogenetic trees
How to read a phylogenetic tree
The purpose of building phylogenetic trees is to use them to figure out the evolutionary relationships between taxa and to identify “natural” groupings among taxa, those that reflect their true evolutionary relationships.
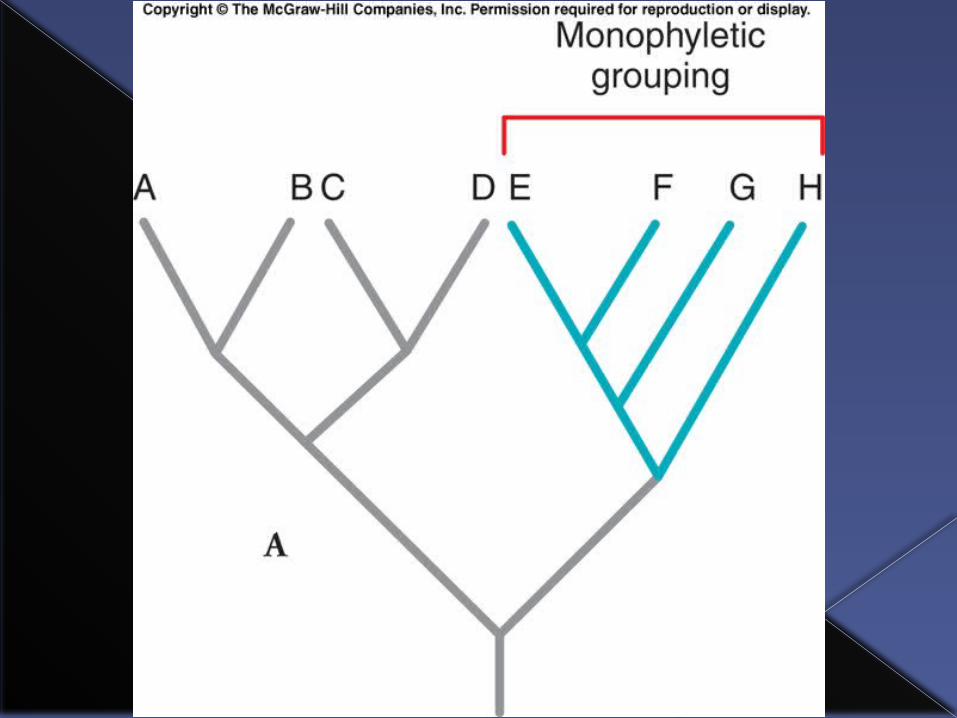
A key idea is that natural groupings called clades are monophyletic groups.
How to read a phylogenetic tree
Clade: a group of taxa that share a common ancestor.
Monophyletic group: consists of an ancestor and all of the taxa that are descendants of that ancestor.

How to read a phylogenetic tree
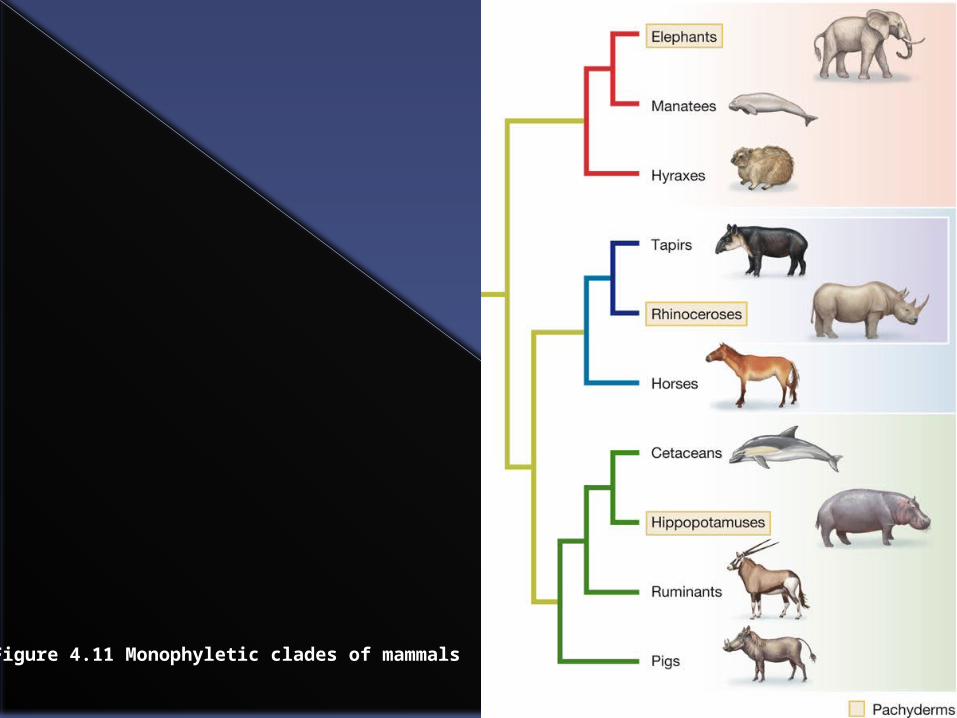
In the next slides elephants, manatees and hyraxes plus their common ancestor form a monophyletic group.
Similarly tapirs, rhinoceroses and horses plus their common ancestor form another monophyletic group.
Evolution, 1st EditionCopyright © 2012 W.W. Norton & Company
Figure 4.11 Monophyletic clades of mammals
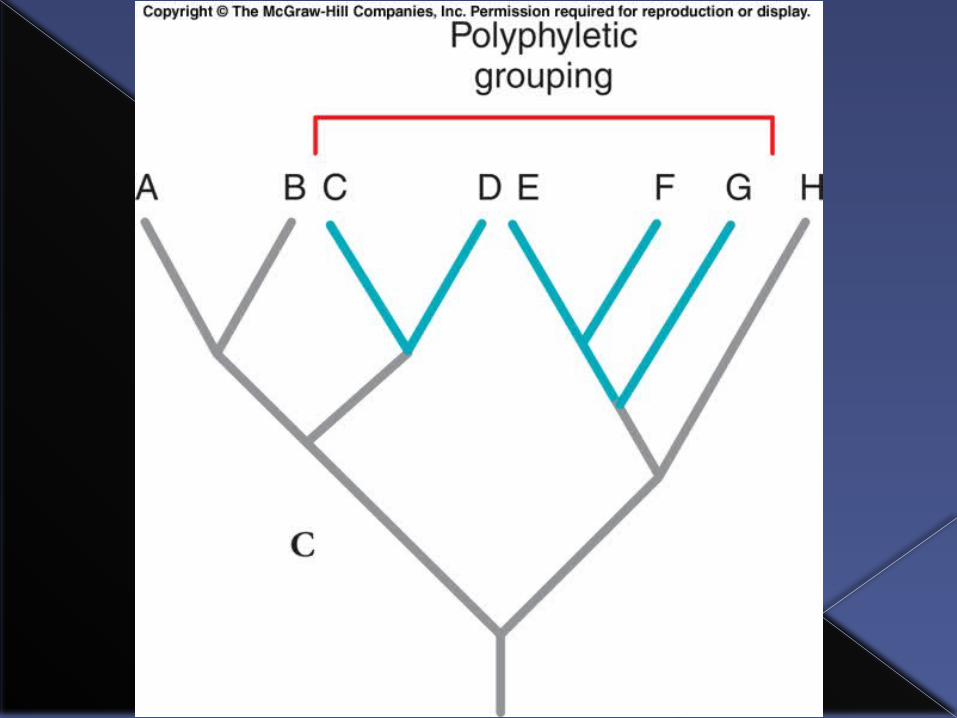
Polyphyletic group
A taxon is polyphyletic if it does not contain the most recent common ancestor of all members of the group.

Polyphyletic group
A polyphyletic group requires the group members to have each had an independent evolutionary origin of some diagnostic feature.
E.g. Referring to Elephants, rhinoceroses and hippopotamuses as “pachyderms.” Pachyderms are a polyphyletic group because each group evolved thick skin separately.

Evolution, 1st EditionCopyright © 2012 W.W. Norton & Company
Elephants, rhinos and hippos would form
polyphyletic group

Paraphyletic group
A taxon is paraphyletic if it includes the most recent common ancestor of a group and some but not all of its descendents.
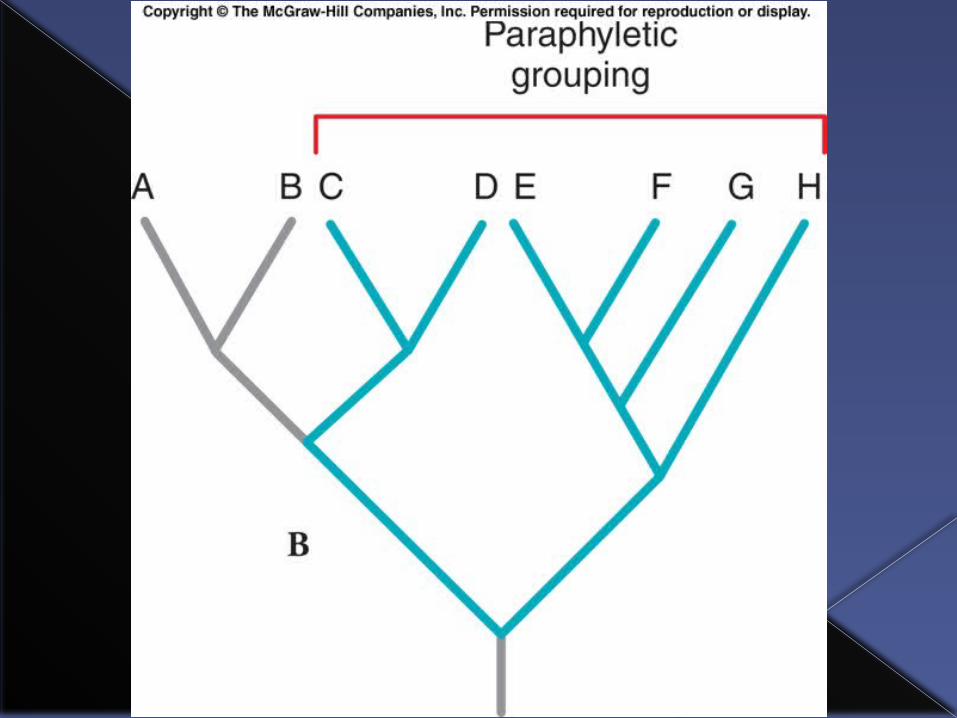
Paraphyletic group
An example of a paraphyletic group among vertebrates would be “fish.”
All of the tetrapods (four-legged animals) are descended from lobe-finned fish ancestors, but are not considered “fish” hence “fish” is a paraphyletic group because the tetrapods are excluded.

Evolution, 1st EditionCopyright © 2012 W.W. Norton & Company
Figure 4.12 Phylogenetic tree of the vertebrates
Rooted vs. unrooted trees
Trees we’ve seen so far have been rooted and these trees give a clear indication of the direction of time.
However, computer programs that produce phylogenetic trees often produce unrooted trees.

Rooted vs. unrooted trees
In an unrooted tree branch tips are more recent than interior nodes, but you cannot tell which of multiple interior nodes is more recent than others.
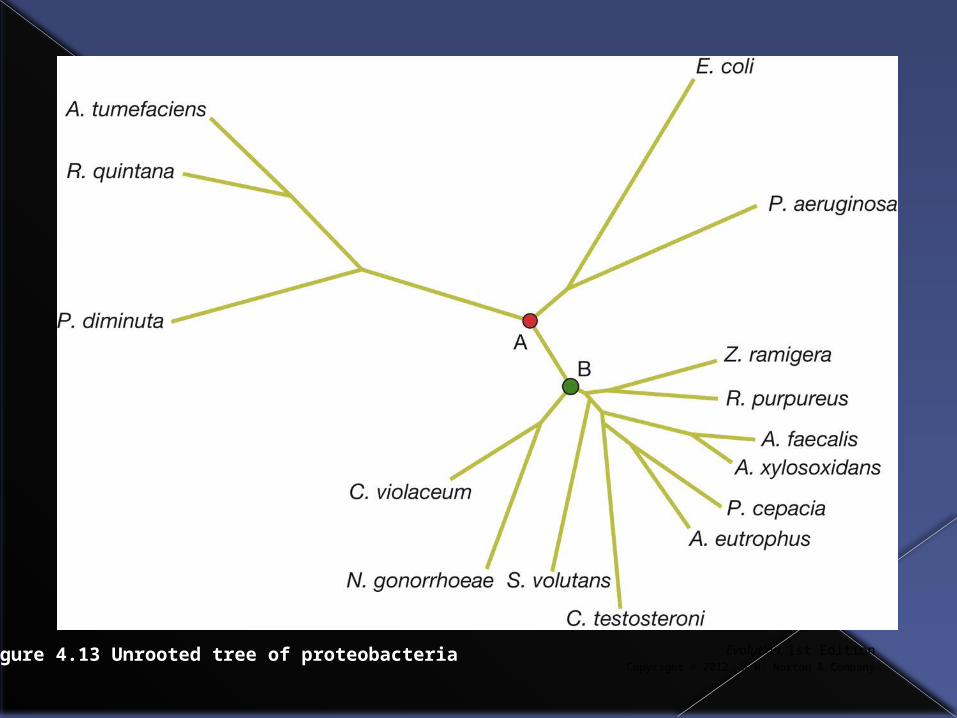
Evolution, 1st EditionCopyright © 2012 W.W. Norton & Company
Figure 4.13 Unrooted tree of proteobacteria

Rooted vs. unrooted trees
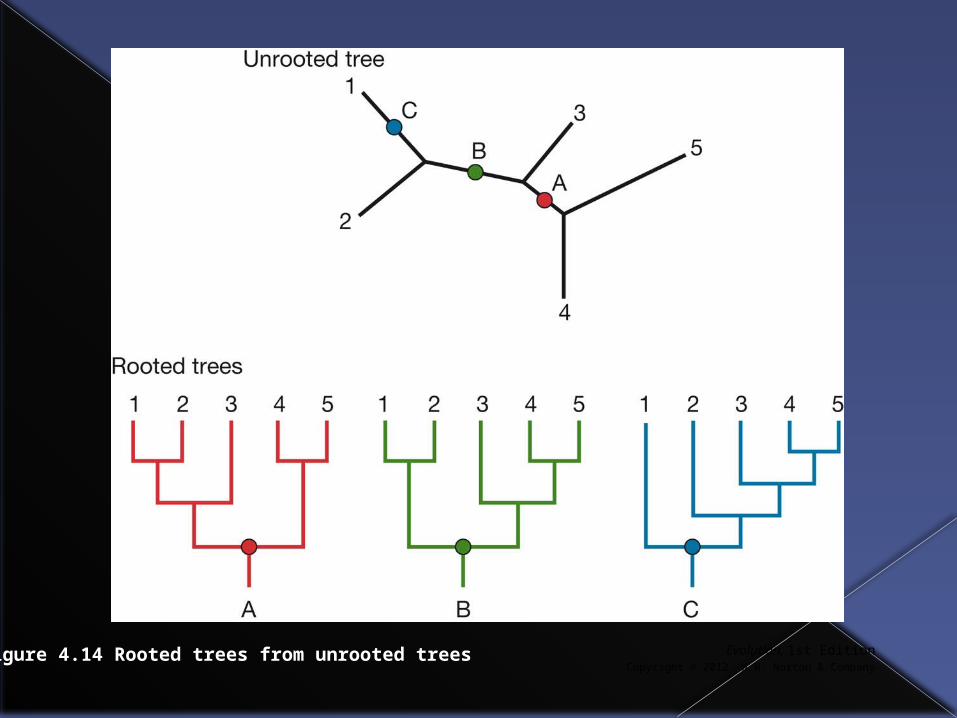
An unrooted tree can be rooted at any point and depending where it is rooted very different rooted trees will be produced.
Evolution, 1st EditionCopyright © 2012 W.W. Norton & Company
Figure 4.14 Rooted trees from unrooted trees
Rooted vs. unrooted trees
Obviously, there is only one true tree of evolutionary relationships and we would like to identify that tree.
To do that we need to root the tree correctly. One of the easiest ways to root a tree is to use an outgroup to root it.
Rooted vs. unrooted trees
An outgroup is a close relative of the members of the ingroup (the various species being studied) that provides a basis for comparison with the others.
Rooted vs. unrooted trees
The outgroup lets us know if a character state within the ingroup is ancestral or not.
If the outgroup and some of the ingroup possess a character state then that character state is considered ancestral.

Rooted vs. unrooted trees
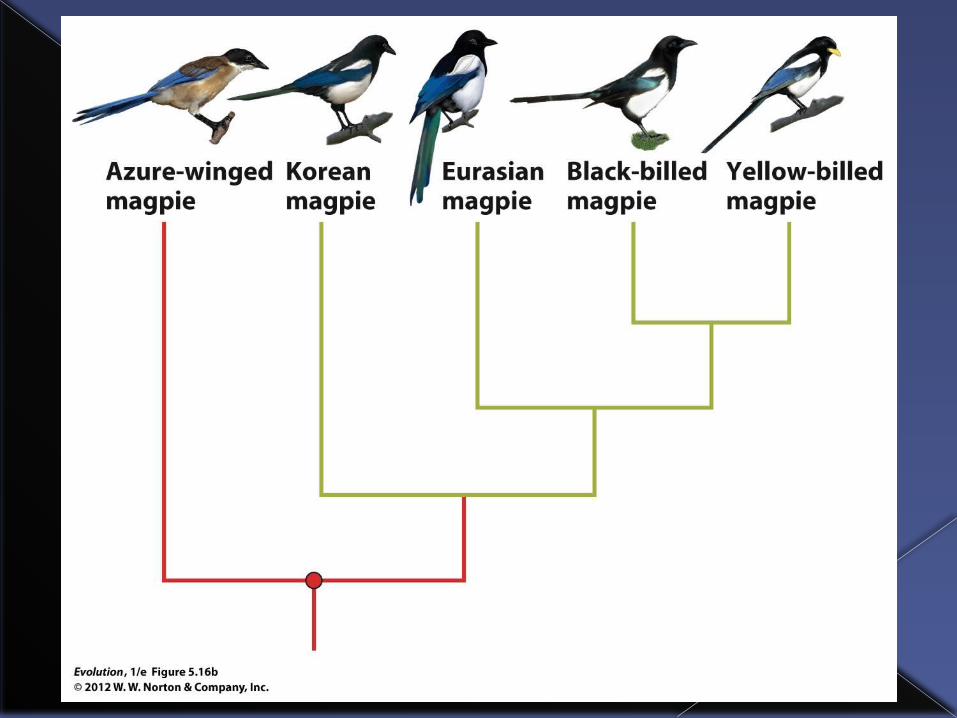
Consider an unrooted tree of four magpie species.

Rooted vs. unrooted trees
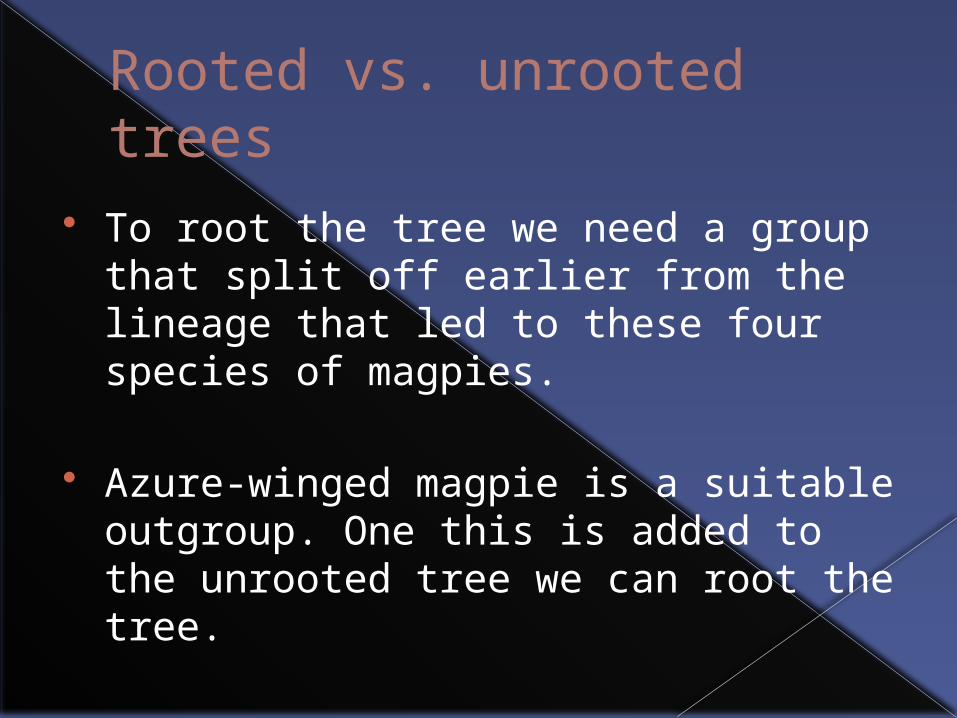
To root the tree we need a group that split off earlier from the lineage that led to these four species of magpies.
Azure-winged magpie is a suitable outgroup. One this is added to the unrooted tree we can root the tree.

Branch lengths of trees
In some phylogenetic trees branches are drawn with different lengths.
In these trees the branch lengths represent the amount of evolutionary change that has occurred in that lineage.

Evolution, 1st EditionCopyright © 2012 W.W. Norton & Company
Figure 4.15 Cladograms and phylograms

Evolution of color vision in vertebrates
Phylogenetic trees can be used to generate hypotheses about the evolution of traits.
This is done by mapping the trait states on the tree and trying to reconstruct the simplest (most parsimonious) explanation that accounts for the observed distribution of traits.
Evolution of color vision in vertebrates
Light sensitive pigments called opsins are responsible for color vision. Humans have three different cone opsins.
Other vertebrates have as many as four or as few as two opsins.
Evolution of color vision in vertebrates
By mapping the presence or absence of different opsins onto a phylogenetic tree of vertebrates we can attempt to reconstruct the evolutionary history of color vision in these vertebrates.

Evolution, 1st EditionCopyright © 2012 W.W. Norton & Company
Figure 4.20 Evolution of tetrapod visual opsins
Evolution of color vision in vertebrates
It is clear that the ancestral trait is to possess four opsins (as both birds and reptiles do).
The mammal lineage appears to have lost two opsins (probably because the animals were nocturnal) and one opsin was later re-evolved on the lineage leading to old world primates and humans.

Homologous and analagous traits
Homologous traits are those derived from a common ancestor.
E.g. all mammals possess hair. This is a homologous trait all mammals share because they inherited it from a common ancestor.
Analagous traits are shared by different species not because they were inherited from a common ancestor but because they evolved independently.

Evolution, 1st EditionCopyright © 2012 W.W. Norton & Company
Figure 4.21 Homologous and analogous traits
Divergent evolution
Divergent evolution occurs when closely related populations diverge from each other because selection operates differently on them.
Such new species will possess many homologous traits in common.

Convegent Evolution
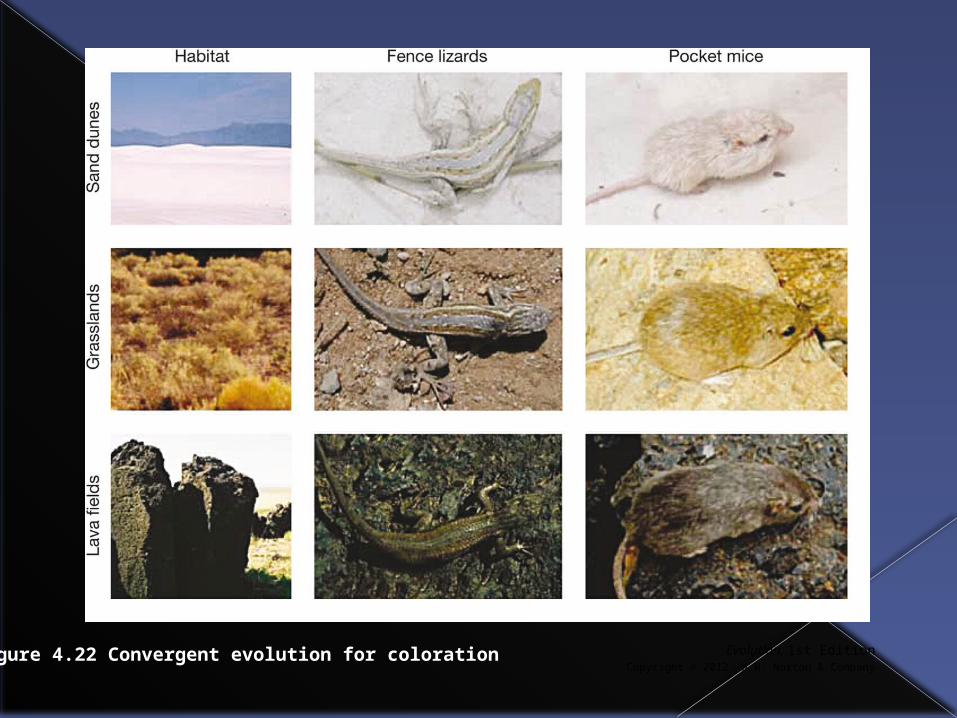
Analagous traits are the result of a process of convergent evolution whereby the same or similar solution to an evolutionary problem is converged upon by different organisms independently of each other.
Evolution, 1st EditionCopyright © 2012 W.W. Norton & Company
Figure 4.22 Convergent evolution for coloration

Evolution, 1st EditionCopyright © 2012 W.W. Norton & Company
Figure 4.23 Convergent evolution in body forms

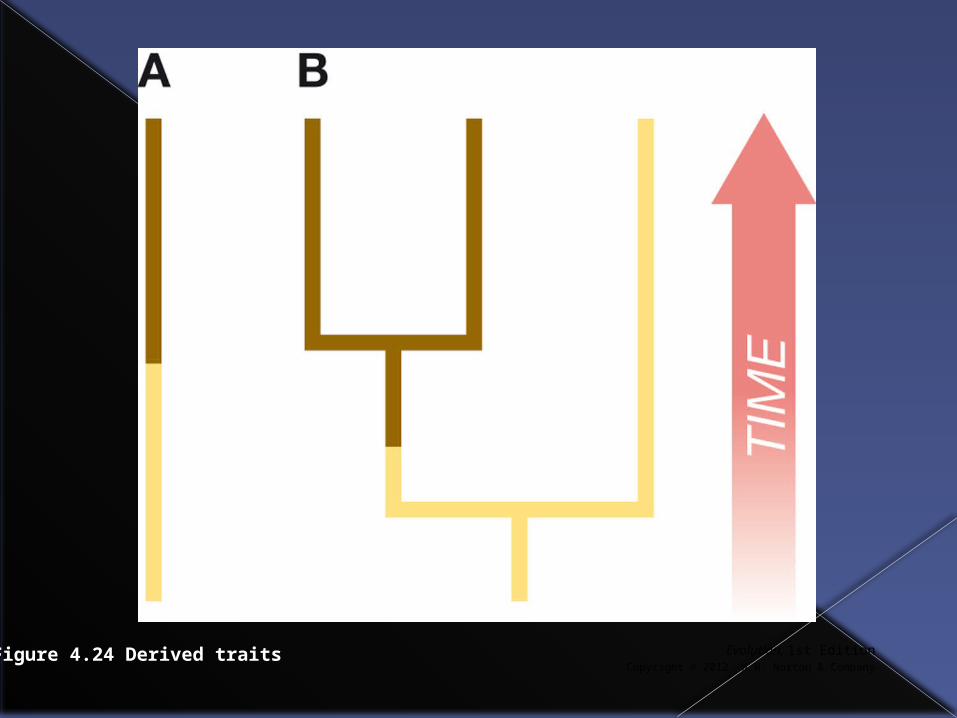
Synapomorphy
When building a phylogenetic tree we want to use characters inherited from ancestors. Such a character found in two or more taxa is referred to as a shared derived character or synapomorphy. Example B on the next slide is a synapomorphy.
Evolution, 1st EditionCopyright © 2012 W.W. Norton & Company
Figure 4.24 Derived traits
Synapomorphy
If all shared traits were shared derived traits tree-building would be straightforward.
However, many traits are not e.g. analagous traits
Homoplasy
We want to avoid including analagous traits when constructing phylogenetic trees because they can mislead us.
An analagous trait in trees is referred to as a homoplasy.

Evolution, 1st EditionCopyright © 2012 W.W. Norton & Company
Figure 4.25 An example of homoplasy
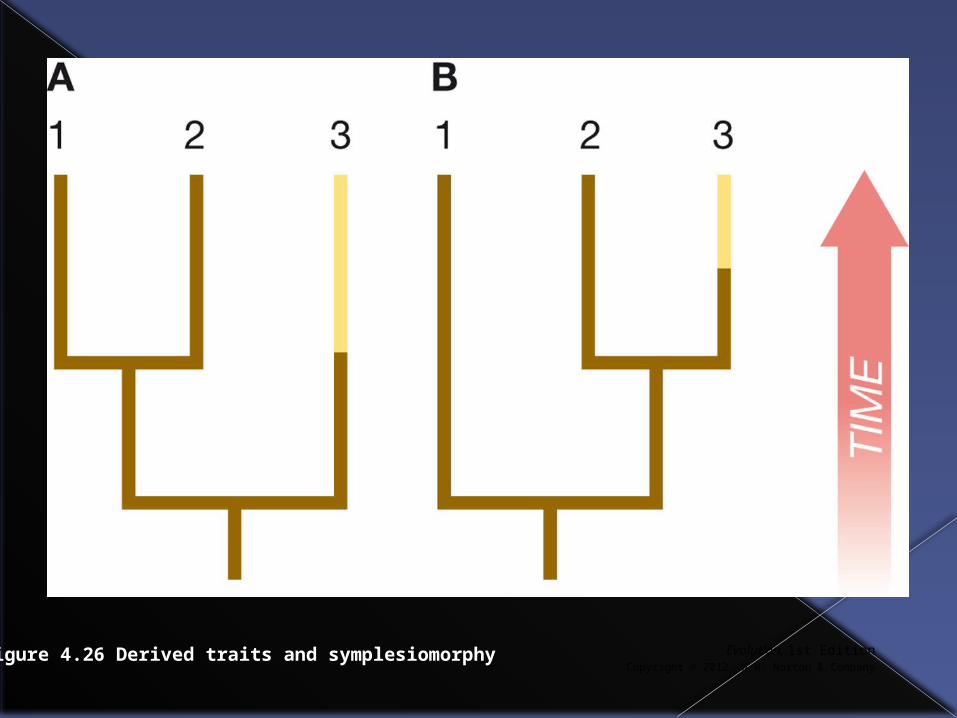
Symplesiomorphy
Another way in which we could be mistaken is if a new trait arises in a lineage and is not shared with other taxa. This is called a symplesiomorphy.
In the next slide light coloration has recently arisen in taxon 3. If we thought dark coloration was a shared derived character we would group species 1+2, but it isn’t it is an ancestral trait.
Evolution, 1st EditionCopyright © 2012 W.W. Norton & Company
Figure 4.26 Derived traits and symplesiomorphy
Strategies to avoid homoplasies and symplesiomorphies
Several strategies exist to limit homoplasies and synapomorphies.
1. use traits that change relatively slowly in evolutionary time
2. use many traits to build the tree 3. use multiple outgroups to help
identify ancestral values of traits.
Use of outgroups
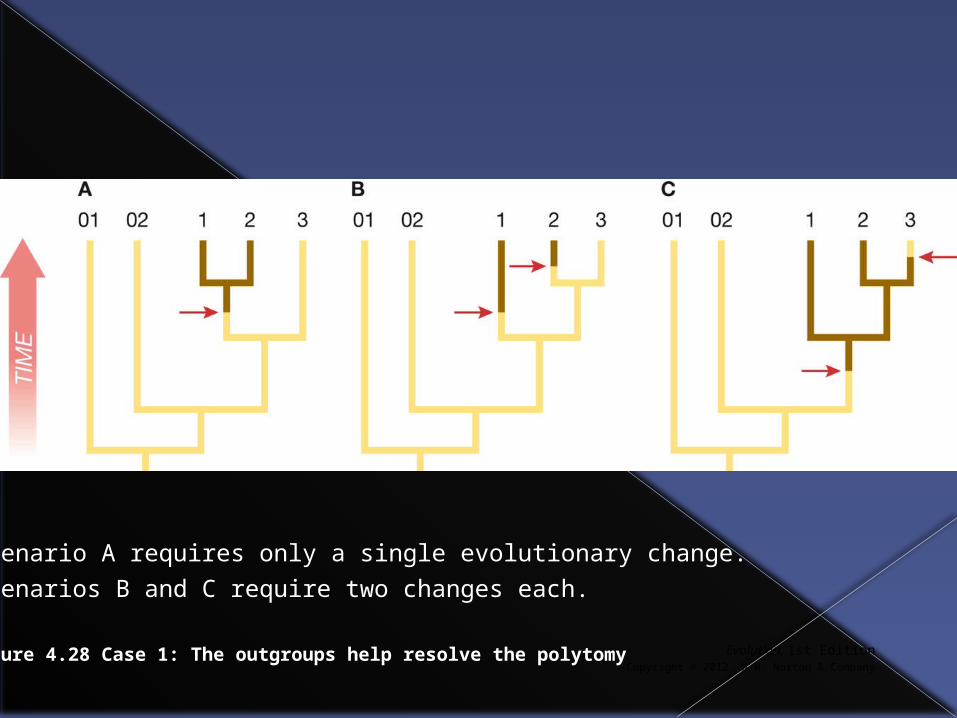
In next slide relationships between species 1,2,3 are unclear [this branching arrangement is called a polytomy]
Species 1 and 2 are dark and 3 is light. Species 01 and 02 are outgroups and
two cases (01 and 02 both dark and 01 and 02 both light) are shown.
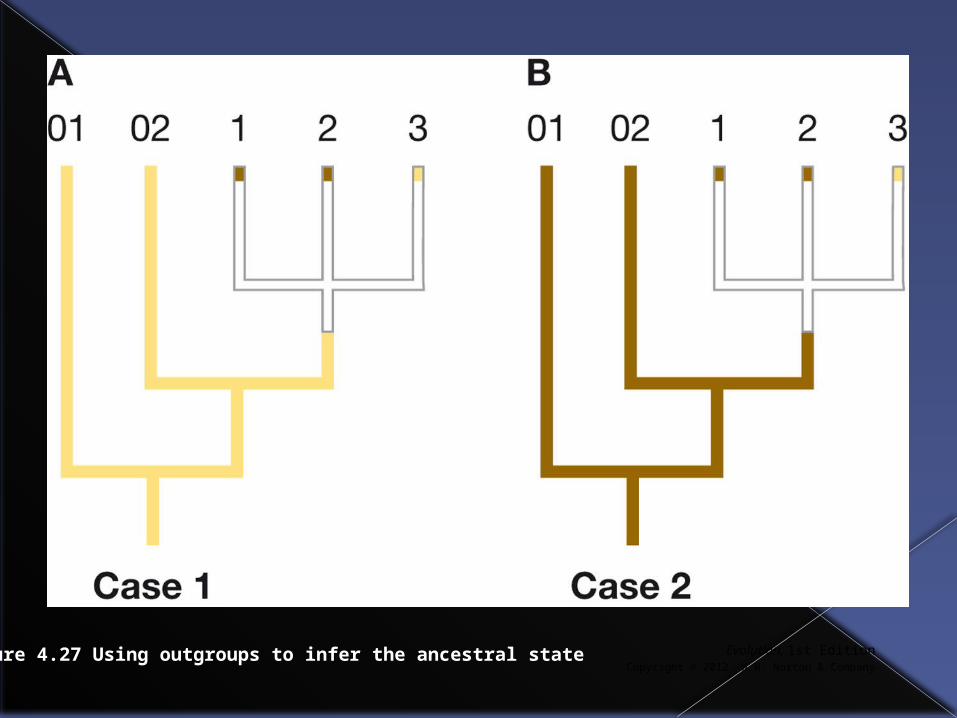
Evolution, 1st EditionCopyright © 2012 W.W. Norton & Company
Figure 4.27 Using outgroups to infer the ancestral state
Evolution, 1st EditionCopyright © 2012 W.W. Norton & Company
Figure 4.28 Case 1: The outgroups help resolve the polytomy
Scenario A requires only a single evolutionary change.
Scenarios B and C require two changes each.
Evolution, 1st EditionCopyright © 2012 W.W. Norton & Company
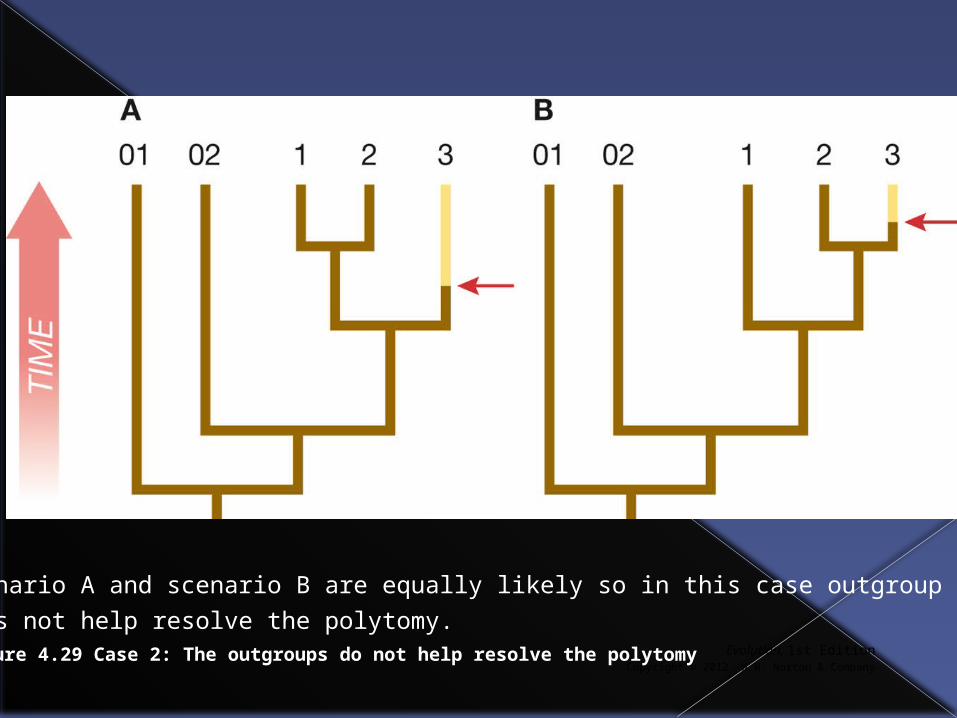
Figure 4.29 Case 2: The outgroups do not help resolve the polytomy
Scenario A and scenario B are equally likely so in this case outgroup
does not help resolve the polytomy.

Using multiple traits to resolve a polytomy
In next slide two characters with ancestral states of A and C [outgroups possess these states].
Each of the two characters is used to resolve a polytomy.

Evolution, 1st EditionCopyright © 2012 W.W. Norton & Company
Figure 4.30 Synapomorphies at different levels
Using phylogenies to generate evolutionary hypotheses
Phylogenetic trees are hypotheses about evolutionary relationships among groups .
When traits are mapped onto a phylogeny the distribution of traits can also be used to generate hypotheses about the evolution of those traits.

Evolutionary origins of snake venom
A large number of very venomous snakes possess highly developed venom delivery systems that include large grooved or hollow fangs, large venom glands, and, of course, venom.

Evolution, 1st EditionCopyright © 2012 W.W. Norton & Company
Figure 4.31 Snake fangs and venom
Evolutionary origins of snake venom
Snakes with such delivery systems belong to the families: Viperidae (e.g. vipers and rattlesnakes), the Elapidae (e.g. cobras and mambas) and include some members of the Atractaspididae (asps).
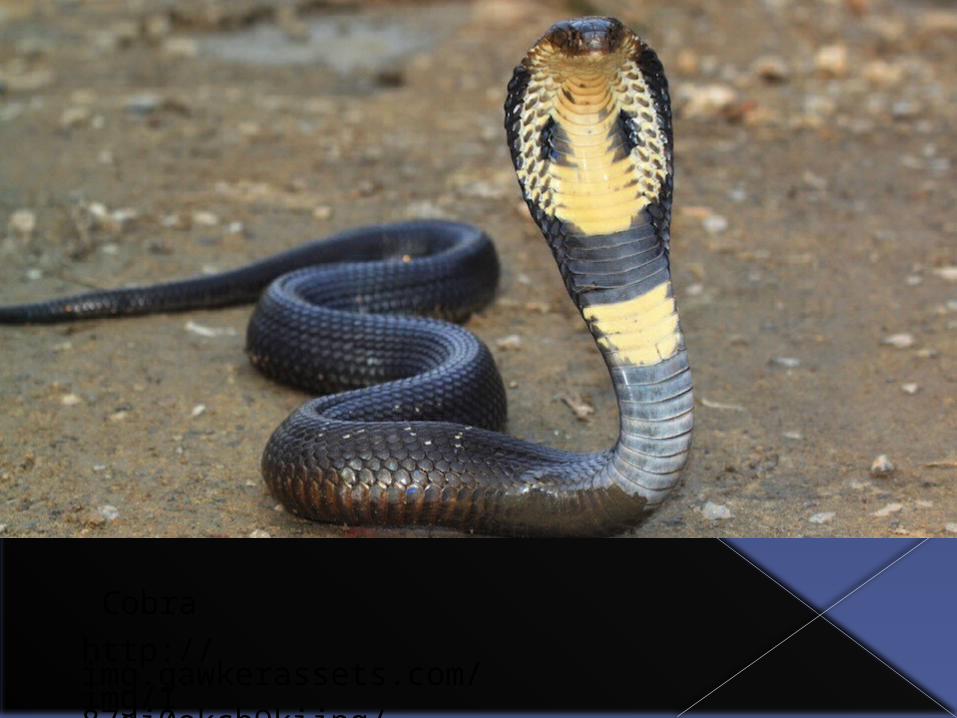
http://img.gawkerassets.com/img/187dj0ekcb9kijpg/original.jpg
Cobra
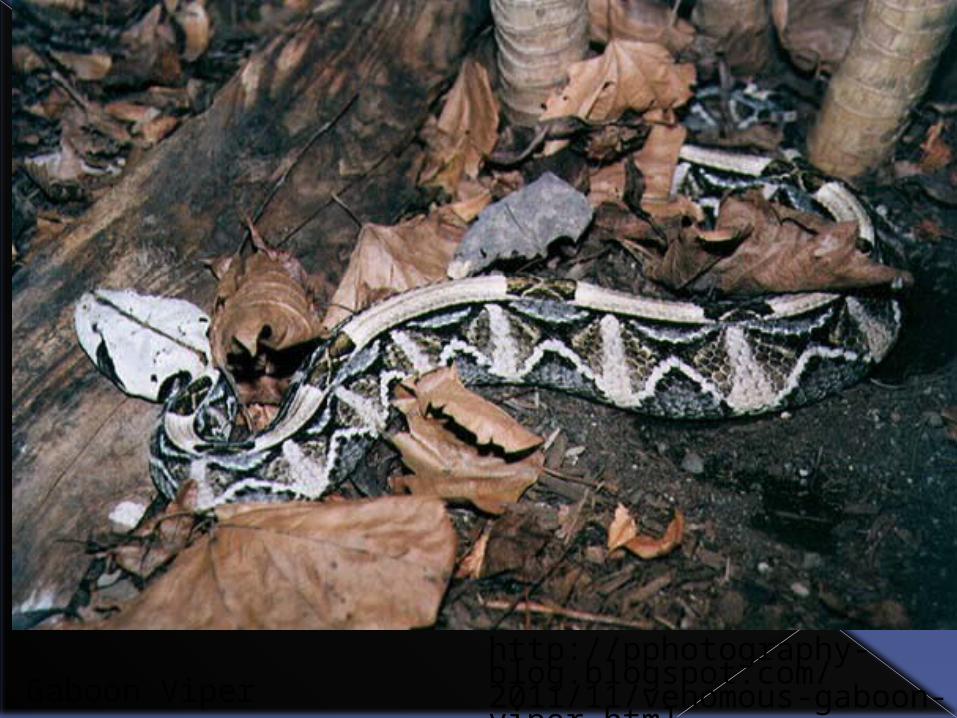
http://pphotography-blog.blogspot.com/2011/11/venomous-gaboon-viper.htmlGaboon Viper

Evolutionary origins of snake venom
For many years it was considered that advanced venom delivery systems had evolved independently in each family and thus were analagous traits.
Researchers had assumed there would be no venom without a delivery system.

Evolutionary origins of snake venom
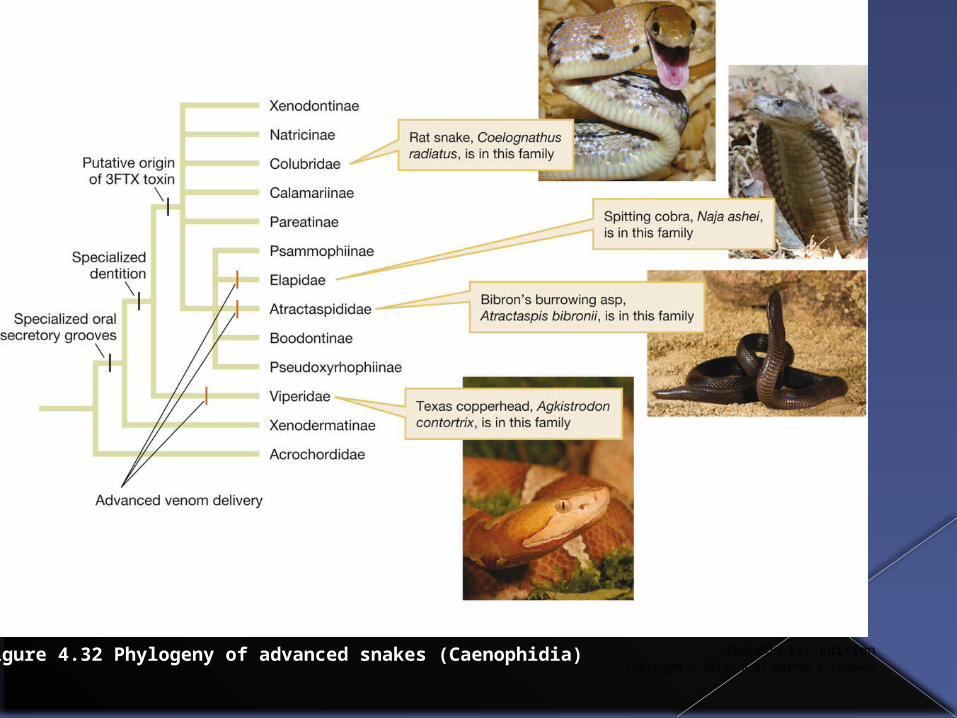
More recent phylogenetic analysis and more morphological studies however have led to this idea being reevaluated.
For example, specialized oral secretory grooves are found in many snakes and numerous snakes have been discovered to be able to produce salivary toxins in a gland called Duvernoy’s gland.
Evolution, 1st EditionCopyright © 2012 W.W. Norton & Company
Figure 4.32 Phylogeny of advanced snakes (Caenophidia)
Evolutionary origins of snake venom
Suspecting that if basic toxin production capacity is widespread in snakes Bryan Fry a herpetologist thought that toxin production might be homologous in snakes and had arisen early in the group.
If this was true, there might be many snakes capable of producing toxic venom among those that lacked a sophisticated delivery system.
Evolutionary origins of snake venom
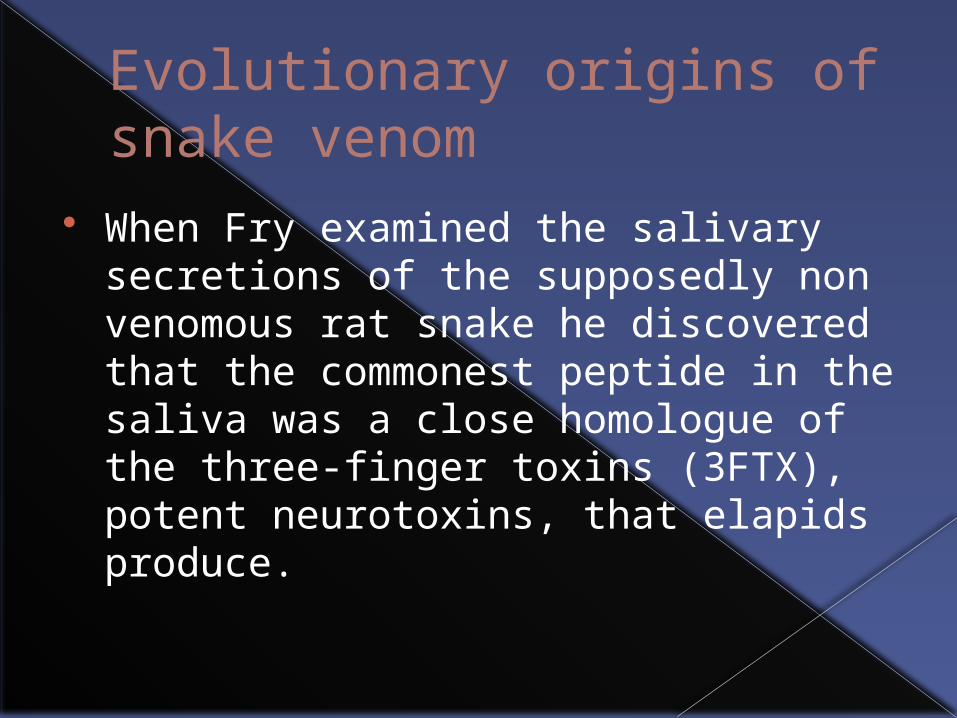
When Fry examined the salivary secretions of the supposedly non venomous rat snake he discovered that the commonest peptide in the saliva was a close homologue of the three-finger toxins (3FTX), potent neurotoxins, that elapids produce.
Evolutionary origins of venom
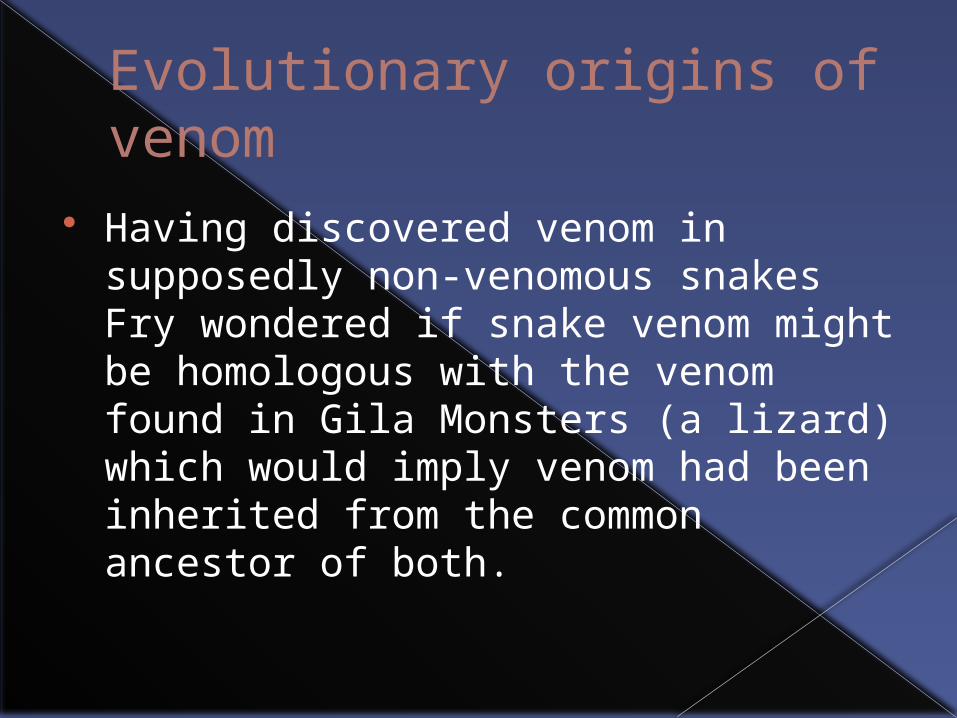
Having discovered venom in supposedly non-venomous snakes Fry wondered if snake venom might be homologous with the venom found in Gila Monsters (a lizard) which would imply venom had been inherited from the common ancestor of both.
Evolutionary origins of venom
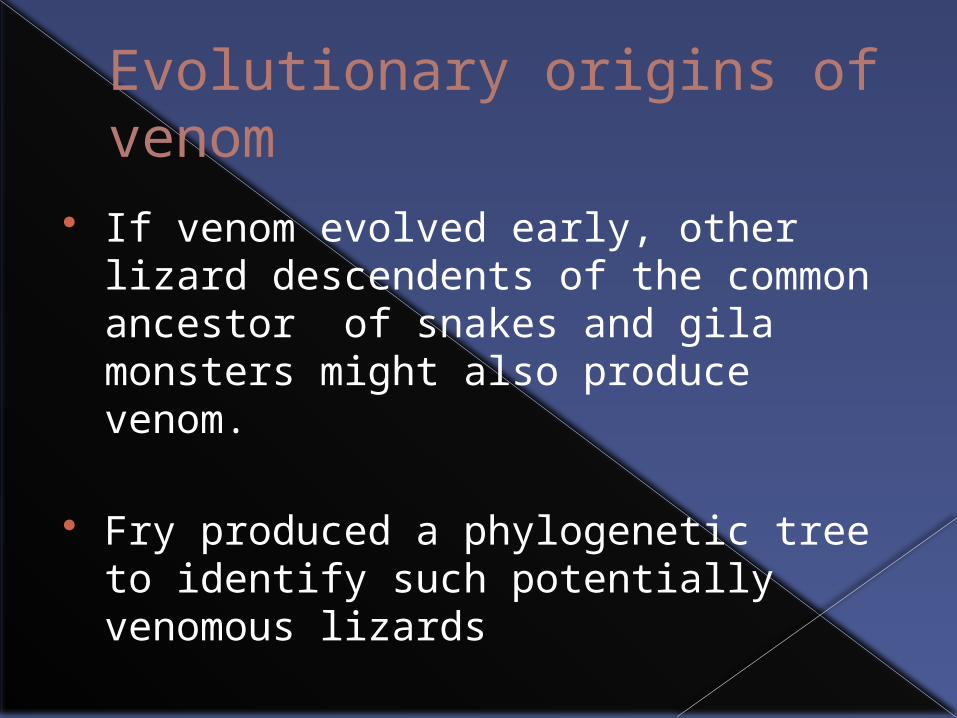
If venom evolved early, other lizard descendents of the common ancestor of snakes and gila monsters might also produce venom.
Fry produced a phylogenetic tree to identify such potentially venomous lizards
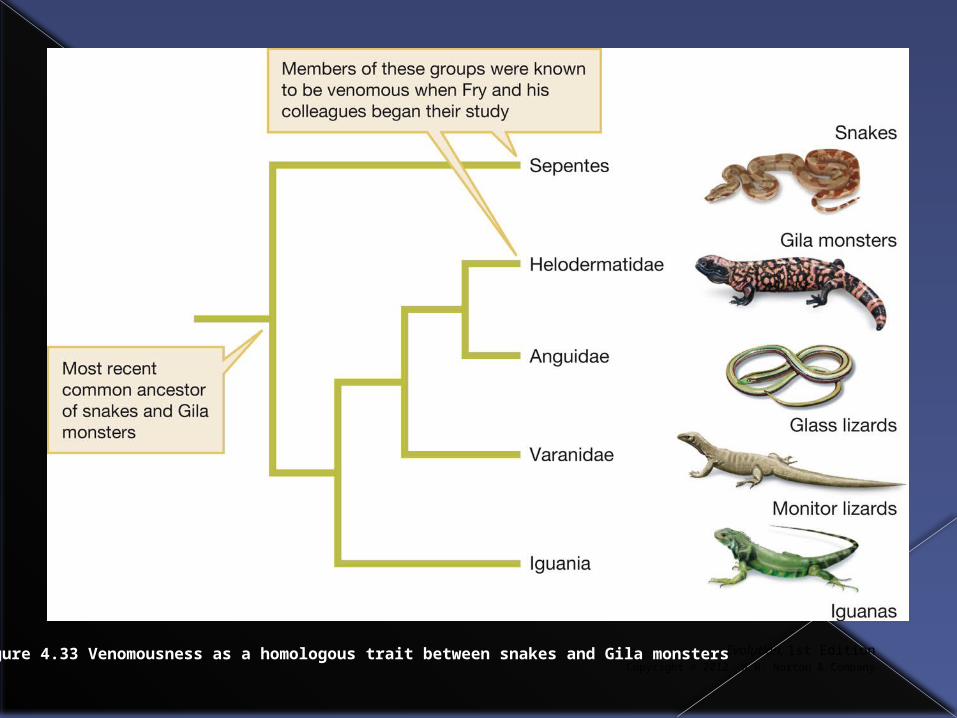
Evolution, 1st EditionCopyright © 2012 W.W. Norton & Company
Figure 4.33 Venomousness as a homologous trait between snakes and Gila monsters
Evolutionary origins of venom
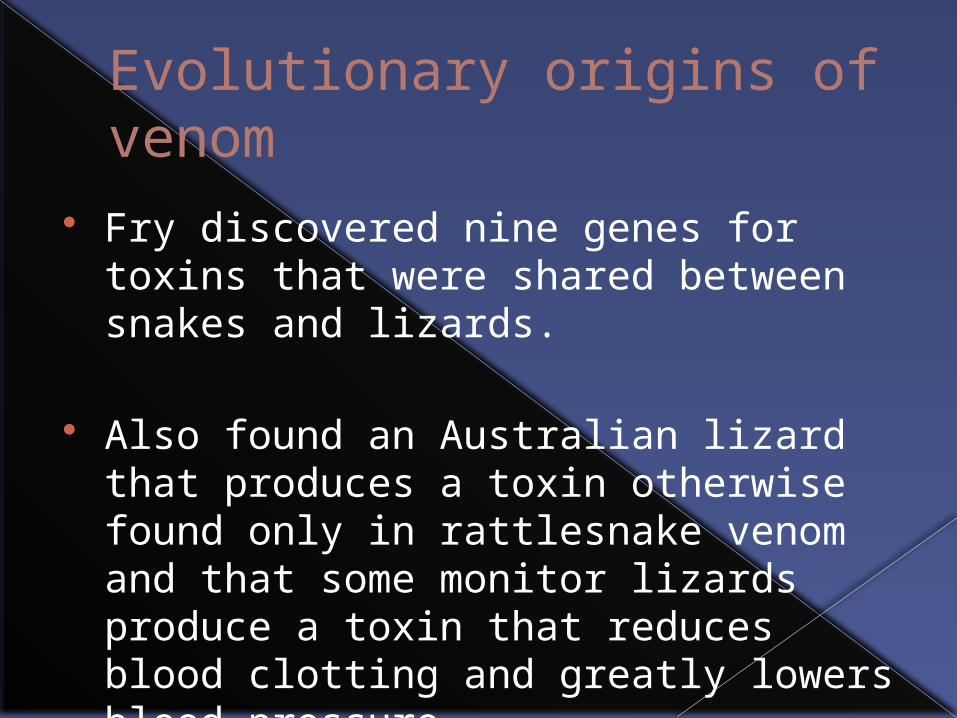
Fry discovered nine genes for toxins that were shared between snakes and lizards.
Also found an Australian lizard that produces a toxin otherwise found only in rattlesnake venom and that some monitor lizards produce a toxin that reduces blood clotting and greatly lowers blood pressure.
Evolutionary origins of venom
The significance of Fry’s work is that it shows how the mapping of traits on phylogentic trees may lead to unexpected research directions and reveal hidden characteristics of organisms.
Vestigial traits
Vestigial traits (those with no known current function but that were important in the evolutionary past) are often useful in constructing phylogenetic trees.
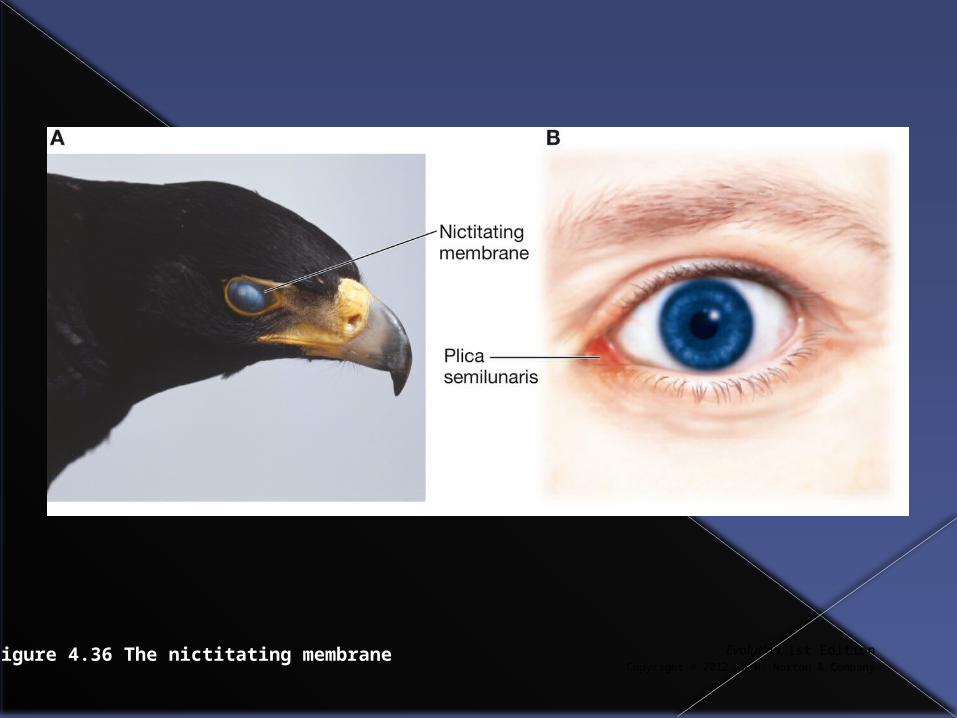
For example, the nictitating membrane in birds and the plica semilunaris indicate common descent from an ancestor that had a nictitating membrane that became vestigial in mammals.
Evolution, 1st EditionCopyright © 2012 W.W. Norton & Company
Figure 4.36 The nictitating membrane
Vestigial traits
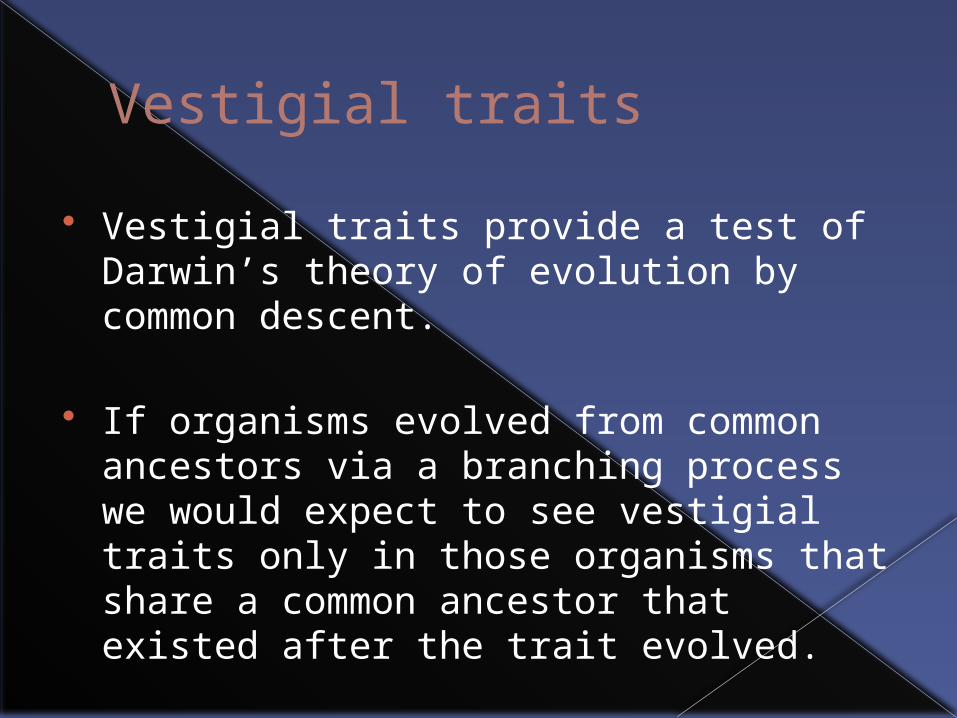
Vestigial traits provide a test of Darwin’s theory of evolution by common descent.
If organisms evolved from common ancestors via a branching process we would expect to see vestigial traits only in those organisms that share a common ancestor that existed after the trait evolved.

Vestigial traits
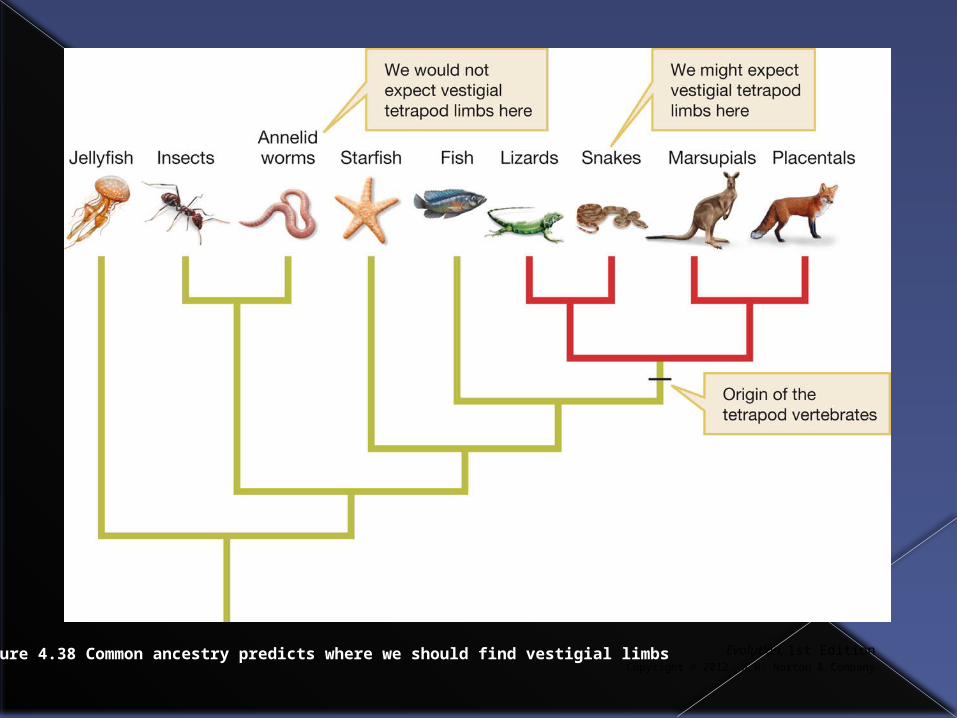
For example we would expect perhaps to find vestigial limbs in some vertebrates, but not in fish or annelid worms.
Evolution, 1st EditionCopyright © 2012 W.W. Norton & Company
Figure 4.38 Common ancestry predicts where we should find vestigial limbs

Practice problems

Evolution, 1st EditionCopyright © 2012 W.W. Norton & Company
Review Question 4.1
Find the most recent common ancestor of species 3,5 and 6

Evolution, 1st EditionCopyright © 2012 W.W. Norton & Company
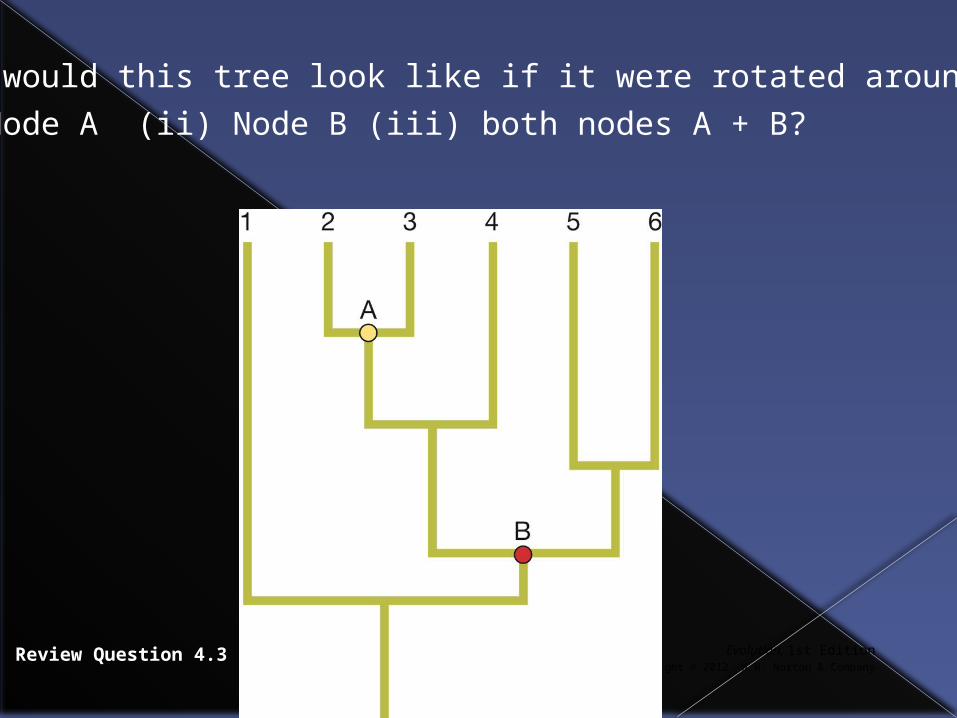
Review Question 4.3
What would this tree look like if it were rotated around
(i) Node A (ii) Node B (iii) both nodes A + B?

Answers
(i) 1, 3, 2, 4, 5, 6
(ii) 1, 6, 5, 4, 3, 2
(iii) 1, 6, 5, 4, 2, 3
Evolution, 1st EditionCopyright © 2012 W.W. Norton & Company
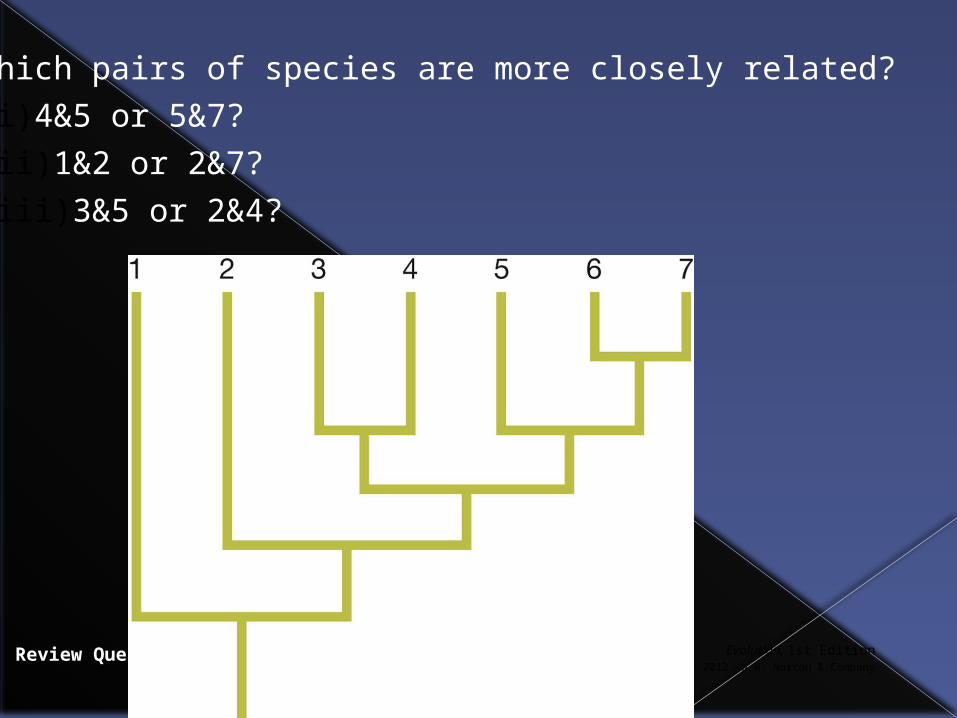
Review Question 4.5
Which pairs of species are more closely related?
(i) 4&5 or 5&7?
(ii) 1&2 or 2&7?
(iii) 3&5 or 2&4?

Answers
(i) 5&7 (ii) 2&7 (iii) 3&5
Evolution, 1st EditionCopyright © 2012 W.W. Norton & Company
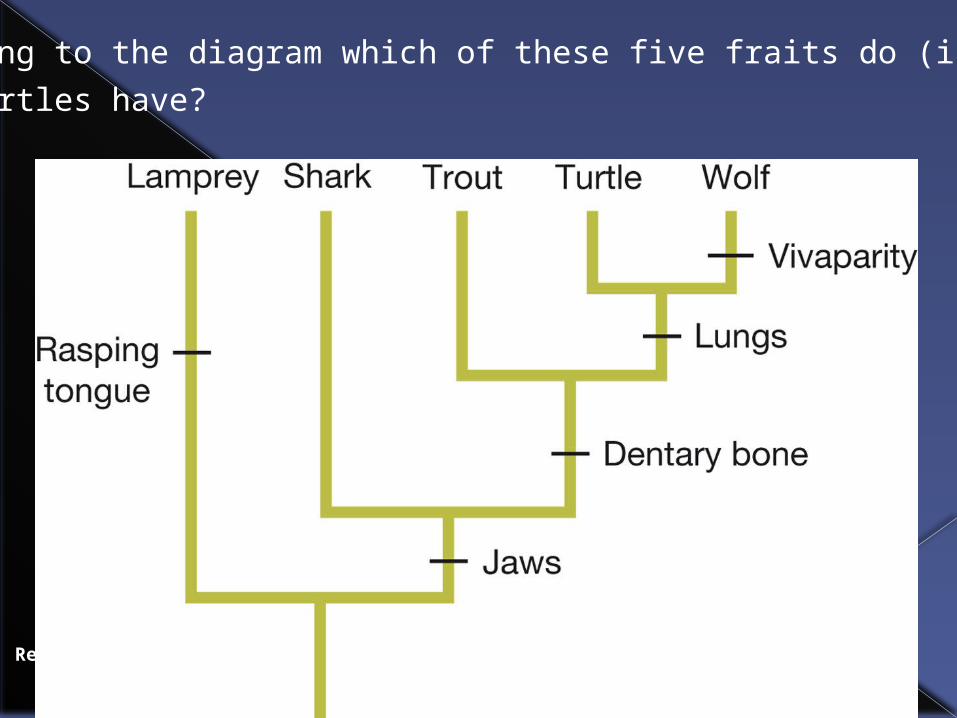
Review Question 4.10
According to the diagram which of these five fraits do (i) sharks
(ii) turtles have?
Answers
Shark : jaws
Turtle: jaws, dentary bone, lungs.

Do the other problems in your text!