recap on last week cash and profit benchmarking assessment
DESCRIPTION
Previous Session: ◦ Be able to calculate gross margins and net margins for an enterprise ◦ Know how to categorise receipts and expenditure for an enterprise Enterprises Costs (Variable, Fixed, Capital) Depreciation Receipts (Enterprise, Sundry, Capital) Margins (Gross and Net) Cash – Can you pay your bills? Profit – Can you fund private drawings and business growth? 3TRANSCRIPT


Recap on last week
Cash and Profit
Benchmarking
Assessment

Previous Session:◦ Be able to calculate gross margins and net margins for an enterprise◦ Know how to categorise receipts and expenditure for an enterprise
Enterprises Costs (Variable, Fixed, Capital) Depreciation Receipts (Enterprise, Sundry, Capital) Margins (Gross and Net)
Cash – Can you pay your bills?
Profit – Can you fund private drawings and business growth?
3

Cash Flow Budget (Liquidity) Planning A forecast of money going into and out of a
business over a specific period of time
Control
Compare actual payments with expected.
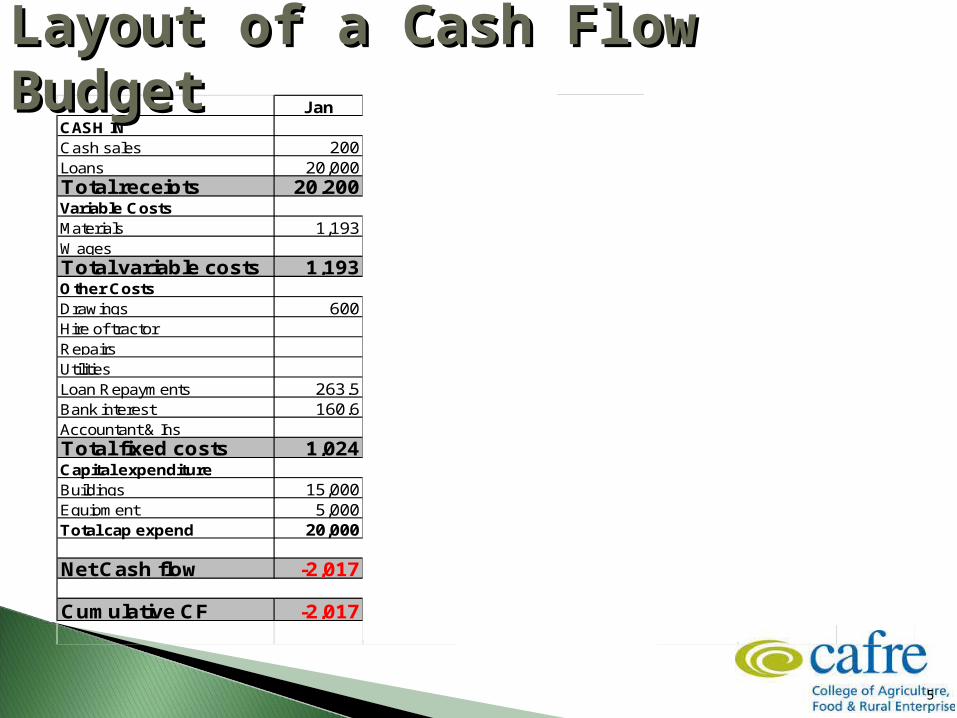
Jan Feb Mar Apr May Jun Total
Cash sales 200 350 871 6,391 5,800 2,786 16,39820,000 20,000
Total receipts 20,200 350 871 6,391 5,800 2,786 36,398Variable Costs
1,193 555 1,535 767 4,0500
Total variable costs 1,193 555 1,535 767 0 0 4,050Other Costs
600 600 600 600 600 1,000 4,000100 100 200
50 50 10050 300 50 50 150 600
Loan Repayments 263.5 263.5 263.5 263.5 263.5 263.5 1,581Bank interest 160.6 160.6 160.6 160.6 160.6 160.6 964Accountant & Ins 300 300 600Total fixed costs 1,024 1,174 1,674 1,474 1,074 1,624 8,045Capital expenditure
15,000 15,0005,000 5,000
Total cap expend 20,000 0 0 0 0 0 20,000
Net Cash flow -2,017 -1,379 -2,338 4,150 4,726 1,162 4,303
Cumulative CF -2,017 -3,396 -5,734 -1,584 3,142 4,303
Loans
MaterialsWages
DrawingsHire of tractorRepairsUtilities
BuildingsEquipment
CASH IN
Layout of a Cash Flow Layout of a Cash Flow BudgetBudget
5

Overdraft not being repaid


Not reinvesting in the operation or selling off
assets
Low drawings
◦ Off farm income reducing the need for drawings to fund
family expenses
Borrowing money
Not paying bills

An expanding business with increasing assets, but few
sales High withdrawals for family living Repaying debt rapidly Buying next year’s inputs from this years cash
◦ e.g. prepay on fertiliser
Increase in accounts receivable ◦ have not been paid yet for product sold

Vital to plan and review bank borrowing A means of adjusting the timing of payments and
income Shows if it is feasible to continue or develop the
farm business


CASHFLOW PROFIT£ £
Sales +150,000 Sales +150,000Variable costs -75,000 Variable costs -75,000Business overheads -30,000 Business overheads -30,000
Telephone bill (2/3rds to farm)
-4,000 Telephone bill (2/3rds to farm)
-2,667
Machinery purchased (no loan)
-50,000 Depreciation (buildings & machinery)
-10,000
Drawings & tax paid -20,000
CASH SURPLUS/DEFICIT (after drawings & tax)
-£29,000 PROFIT £32,333

Purpose of tax accounts - to calculate the farm business profit, which determines the amount of tax due
Purpose of management accounts – to measure efficiency of individual farm enterprises and whole farm
Neither tax or management accounts include VAT
15

“Helps farmers to assess their own business performance and
compare their physical and financial results with
other similar farms”

Collect data
Analyse data
Compare your results
Identify reasons for variation
*Formulate action plan*
*Implement plan*

Enterprise reports on Physical performance◦ Look at individual enterprises
Enterprise reports on Financial performance◦ Look at individual enterprise but can build to a
whole farm report – based on profit not cash
18

Output ◦ Sales◦ Value of product grown but not yet sold
Variable costs◦ Costs associated with production that vary depending on scale
Gross margin – (Output – Variable costs)◦ this will show how efficient you are with raw materials needed for the enterprise
e.g., Seed, fertiliser, Sprays and other variable costs
Fixed Costs – costs that do not vary with scale◦ looking at the whole business. What is needed after variable costs. The biggest
variation between farms is the amount spend on fixed costs
Labour, conacre and finance ◦ Value of your own labour, rent for land and interest and capital loan repayments
Gross Margin – (Fixed costs + LCF) = Profit!!!

Physical performance is a measure of the quantity and quality of what you produce on your farm.
These will differ between enterprises, e.g.:
◦ Grain/Crop yield Tonnes/Ha◦ Straw Yield (T/Ha)◦ Tonnes / Labour Unit◦ Seed Rate Kg/Ha◦ Fertiliser Rate Kg/Ha

Financial performance is a measure of how much money it took to achieve the quantity and quality of product sold from the farm. This financial performance will be broken down into output, variable costs, overhead costs and capital costs. This will then produce various performance indicators e.g.:
◦ Gross Margin/Ha◦ Gross Margin / Tonne◦ Total overhead costs◦ Overhead costs/Ha◦ Total cost of production/Tonne◦ Machinery Costs as a % of Total Costs

Farmer records data throughout the year Data Collector gathers data once per year Data processed Reports generated and delivered Local adviser helps interpret report and plan
for change
23

Financial Performance Measures All 19 Greenmount Your Results Your Results Your Results
2012 2013 2014 £/tonne £/Ha£/tonne £/tonne £/tonne £/Ha Average Average
Main sale £165 £151 £255 £2,465 £270 £3,234Other sales £105 £108 £120 £220 £132 £649
TOTAL OUTPUT £182 £133 £233 £2,685 £230 £3,882Pruning £1 £5 £4 £50 £3 £46Picking N/A £32 £46 £533 £31 £515
Fertiliser £5 £5 £9 £100 £9 £144Herbicide £2 £1 £3 £33 £2 £27Fungicide £17 £15 £34 £391 £29 £497
Other sprays £4 £4 £4 £49 £9 £144Other variable costs £49 £2 £0 £0 £0 £0
Total Variable Costs £76 £63 £101 £1,157 £81 £1,374
Gross Margin £106 £70 £133 £1,528 £149 £2,509Machinery costs
Specialist machinery Contractor £0.0 £1.1 £1.2 £13 £2.3 £38.9
Depreciation £0.0 £0.3 £0.0 £0 £1.1 £19.2 Total Specialist machinery costs £0.0 £1.3 £1.2 £13 £3.4 £58.1
General Overheads
Machinery £0.3 £3.0 £5.8 £67 £7.7 £129Fuel Costs £1.7 £2.9 £9.4 £108 £8.1 £136Contractor £0.1 £0.2 £1.7 £20 £0.6 £11
Machinery depreciation £2.0 £4.9 £6.8 £79 £15.7 £265Total Machinery costs £4.1 £12.3 £25.0 £287 £35.5 £600
Property £0.0 £0.8 £0.0 £0 £1.2 £21Building depreciation £0.0 £0.4 £0.0 £0 £0.6 £10
Electricity £1.4 £1.4 £0.0 £0 £2.4 £40Telephone £0.1 £0.3 £1.4 £17 £0.5 £9Insurance £1.9 £1.8 £14.2 £163 £4.0 £68
Professional fees £0.6 £1.0 £6.5 £75 £1.9 £33Miscellaneous £0.3 £1.6 £1.0 £11 £1.5 £25
Overhead costs less L,C & F £8.3 £19.5 £48.1 £553 £47.7 £806Labour £0.0 £1.1 £0.0 £0.0 £0.5 £9
Conacre £0.4 £1.4 £6.5 £75 £2.4 £41Finance £0.0 £0.0 £0.0 £0.0 £0.0 £0
Total Overheads £8.7 £22.0 £55 £628.0 £50.7 £856
TOTAL COSTS £85.2 £85.3 £155 £1,785 £132 £2,230
Net Profit £97.0 £48 £78 £900 £98 £1,653

Gross Margin - Apples
Your Results Your Results Average2013 2014 £/Ha£/tonne £/tonne £/Ha Average
Main sale £151 £255 £2,465 £3,234Other sales £108 £120 £220 £649
TOTAL OUTPUT £133 £233 £2,685 £3,882Pruning £5 £4 £50 £46Picking £32 £46 £533 £515
Fertiliser £5 £9 £100 £144Herbicide £1 £3 £33 £27Fungicide £15 £34 £391 £497
Other sprays £4 £4 £49 £144Other variable costs £2 £0 £0 £0
Total Variable Costs £63 £101 £1,157 £1,374
Gross Margin £70 £133 £1,528 £2,509

Net Profit - ApplesYour Results Your Results Average
2013 2014 £/Ha£/tonne £/tonne £/Ha Average
Gross Margin £70 £133 £1,528 £2,509Machinery costs
Specialist machinery Contractor £1.1 £1.2 £13 £38.9
Depreciation £0.3 £0.0 £0 £19.2 Total Specialist machinery costs £1.3 £1.2 £13 £58.1
General Overheads Machinery £3.0 £5.8 £67 £129Fuel Costs £2.9 £9.4 £108 £136Contractor £0.2 £1.7 £20 £11
Machinery depreciation £4.9 £6.8 £79 £265Total Machinery costs £12.3 £25.0 £287 £600
Property £0.8 £0.0 £0 £21Building depreciation £0.4 £0.0 £0 £10
Electricity £1.4 £0.0 £0 £40Telephone £0.3 £1.4 £17 £9Insurance £1.8 £14.2 £163 £68
Professional fees £1.0 £6.5 £75 £33Miscellaneous £1.6 £1.0 £11 £25
Overhead costs less L,C & F £19.5 £48.1 £553 £806Labour £1.1 £0.0 £0.0 £9
Conacre £1.4 £6.5 £75 £41
Finance £0.0 £0.0 £0.0 £0Total Overheads £22.0 £55 £628.0 £856
TOTAL COSTS £85.3 £155 £1,785 £2,230Net Profit £48 £78 £900 £1,653

Performance MeasuresYour
Results Your Results Average 2013 2014 £/Ha £/tonne £/Ha Average
Yield main crop /Ha 20.2 9.7 12.0
Yield of other/Ha 14.6 1.8 4.9
Total yield/Ha 34.8 11.5 16.9
Tonnes /labour unit 426 69 221
Total Machinery costs £12 £287 £600
Machinery cost as a % of all cost 14% 16% 27%
Physical Performance Measures

Discuss the benchmark report Compare to average figures What are the positives? What are the negatives? What could be improved?
28

• Assess your own current performance • Allocate ALL production costs• Gross margin is a good starting point• Control overhead costs• Identify strengths and weaknesses • Feeds into whole farm management accounts• Information for farm planning and decision
making
29

A process to help farmers assess their own business performance◦ Physical performance ◦ Financial performance
Benchmarking will identify areas for improvement No action, No benefit
30

Wheat
Barley Cattle
Existing land
Total Farm Gross Margin
Gros
s mar
gin

Less
Gros
s mar
gin
Wheat
Barley Cattle
Existing land
Overheads Profit
Total Farm Gross Margin
=
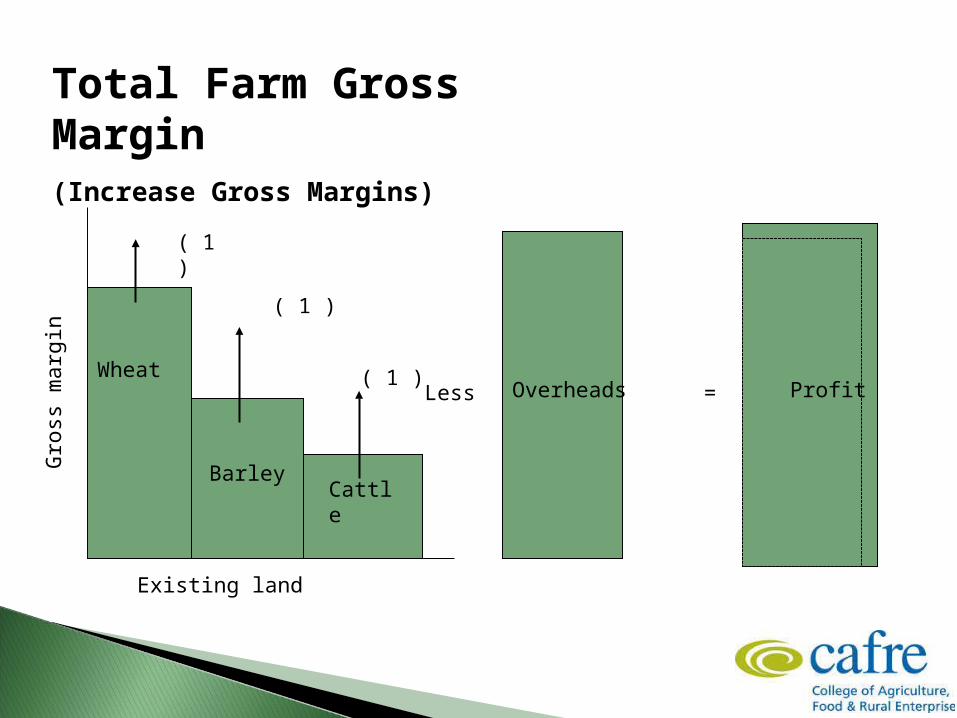
Wheat
Barley Cattle
Existing land
( 1 )
( 1 )
( 1 )
Total Farm Gross Margin(Increase Gross Margins)
=Less
Gros
s mar
gin
Overheads Profit

Wheat
Barley Cattle
Existing land
( 1 )
( 1 )
( 1 )( 2 )
( 2 )
Total Farm Gross Margin(Increase Gross Margins & Increase enterprise size)
=Less
Gros
s mar
gin
Overheads Profit

Wheat
Barley Cattle
Existing land
( 1 )
( 1 )
( 1 )
( 3 )
Total Farm Gross Margin(Increase Gross Margins, Enterprise size & Reduce overheads)
=Less
Gros
s mar
gin
Overheads Profit( 2 )
( 2 )

+ =Wheat
Barley Cattle
Existing land
Othe
r inc
ome
( 1 )
( 1 )
( 1 )
( 3 ) ( 4 )
Total Farm Gross Margin(Increase GM’s, Increase enterprise Size, Reduce Overheads and add off farm income)
Less
Gros
s mar
gin
Overheads Profit( 2 )
( 2 )