ageconsearch.umn.eduageconsearch.umn.edu/bitstream/18611/1/wp020317.pdf · the doha round of the...
TRANSCRIPT
The Doha Round of the World Trade Organization: Appraising Further Liberalization of Agricultural Markets
Food and Agricultural Policy Research Institute Iowa State University and University of Missouri-Columbia
Working Paper 02-WP 317 November 2002
Center for Agricultural and Rural Development Iowa State University
Ames, Iowa 50011-1070 www.card.iastate.edu
The authors thank participants at the World Outlook Conference, May 2002 in Washington, D.C., and at the Congress of the European Association of Agricultural Economists, August 2002 in Zaragoza, Spain, and Pierre Bascou for their comments. This publication is available online on the CARD website: www.card.iastate.edu. Permission is granted to reproduce this information with appropriate attribution to the authors and the Center for Agricultural and Rural Development, Iowa State University, Ames, Iowa 50011-1070. For questions or comments about the contents of this paper, please contact John Beghin, 568E Heady Hall, Iowa State University, Ames, IA 50011-1070; Ph: 515-294-5811; Fax: 515-294-6336; E-mail: [email protected]; or Jay Fabiosa, 579 Heady Hall, Iowa State University, Ames, IA 50011-1070; Ph: 515-294-6183; Fax: 515-294-6336; E-mail: [email protected]. Iowa State University does not discriminate on the basis of race, color, age, religion, national origin, sexual orientation, sex, marital status, disability, or status as a U.S. Vietnam Era Veteran. Any persons having inquiries concerning this may contact the Office of Equal Opportunity and Diversity, 1031 Wallace Road Office Building, Room 101, 515-294-7612.

Abstract
Using the Food and Agricultural Policy Research Institute (FAPRI) modeling system, we
investigate the multilateral removal of border taxes and farm programs and their distortion of
world agricultural markets. We find that agricultural and trade distortions have significant
terms-of-trade effects. Terms-of-trade effects caused by trade barriers are much larger than
those caused by domestic farm programs. World trade is also significantly impacted. Trade
expansion is substantial for most commodities, especially dairy, meats, and vegetable oils. Net
agricultural and food exporters, such as Brazil, Australia, and Argentina, emerge with
expanded exports, whereas net importing countries with limited distortions before liberalization
are penalized by higher world markets prices and reduced imports. The United States gains
significant export shares in livestock products and imports more dairy products. Without
protection and domestic subsidies, the European Union loses many of its livestock and dairy
export markets. The increase in world market prices would offset at least a portion of the
subsidies foregone by U.S. producers.
Keywords: Doha Round, domestic farm program, liberalization, partial equilibrium, trade
distortion, World Trade Organization.

THE DOHA ROUND OF THE WORLD TRADE ORGANIZATION: APPRAISING FURTHER LIBERALIZATION OF
AGRICULTURAL MARKETS
Introduction
Many developing countries became disappointed with the limited accomplishments
achieved by the Uruguay Round Agreement on Agriculture (URAA) of the World Trade
Organization (WTO). This disappointment led them to express their concerns during the
agricultural agenda debate preceding the Doha Declaration of the WTO (Kennedy et al.
2001; Matthews 2002; WTO 2001). These concerns were largely reflected in the policy
challenges included in the Doha Declaration. The first concern is that there is a lack of
market access in high-income countries. Tariff rate quotas (TRQs) and other trade
barriers block access to markets in which developing economies are competitive
(Anderson et al. 2001; Martin and Winters 1996). The lack of market access constrains
trading opportunities for exporting developing-country members. It is important to keep
in mind that many developing countries, especially net-importing ones, have also kept
high border distortions, a fact that is sometimes overlooked in the current policy debate.
Hence, this first contention about the lack of market access shows the heterogeneity of
interests among WTO members, and even among developing-country members.
A second contention is that agricultural subsidies in high-income countries gained
through domestic farm and trade policies depress world market prices. Exports from
some of the high-income countries are subsidized explicitly or implicitly through
production subsidies and are often “dumped” on world markets. The objective of income
transfer to domestic farmers is not in question; rather, the argument is with the way this is
accomplished using coupled policies, which frustrates the mercantilist aspirations of
competitive exporting partners on world markets. The international political economy of
these domestic programs is interesting. Many developing countries do not have the fiscal
resources to sustain such domestic farm programs; alternatively, they tend to use border

2 / FAPRI Staff
measures to protect their farmers when they are pressed to do so politically. These border
measures are blunt ways to subsidize agriculture: they harm poor consumers and
potentially depress world prices.
Among developing countries, policy interests also are heterogeneous. Some
countries, such as Brazil and Argentina, are natural exporters of many commodities; they
would benefit from trade liberalization and a multilateral removal of domestic farm
programs. By contrast, some net-importing countries, such as Egypt, actually benefit
from depressed world prices and the resulting cheaper food imports. Many countries fall
in between these two extremes, importing some commodities and exporting others with
varying degrees of domestic or border distortion. Again, the range of policy interests is
large, extending beyond a unified front against E.U. and U.S. farm policies. The Doha
Declaration was eventually agreed upon and the agricultural component of the document
includes objectives directly addressing greater market access, reductions of export
subsidies, and substantial reductions of trade-distorting domestic support (WTO 2001).
Beyond the ruckus of the negotiations, it is important to note that even with the
URAA nearly fully implemented, heterogeneous market interventions in high-income
economies still distort resource allocation and trade in agriculture. European countries
rely heavily on export subsidies and domestic support (Tangermann 2001). The United
States has been increasing domestic production subsidies to implicitly subsidize crop
exports. Both the European Union and the United States have kept prohibitive border
measures that protect domestic sugar and dairy. Net-importing, high-income Asian
countries (e.g., Korea and Japan) use prohibitive border measures to protect their
agriculture and some food sectors. Developing countries exhibit a heterogeneous set of
policies, but when they subsidize their farmers, they often rely on strict border
measures when they are less competitive but successful rent seekers. Overall, the scope
for relocation of production, efficiency gains, and terms-of-trade effects remains in
agriculture, and it is worth asking what would happen in unfettered agricultural and
food markets.
This report describes an investigation that uses the FAPRI modeling system to
analyze the impact of trade and farm policies on world trade flows, prices, and market
equilibrium. The analysis considers two scenarios. The first represents a removal of “all”

The Doha Round of the WTO: Appraising Further Liberalization of Agricultural Markets / 3
distortions directly affecting agriculture (domestic farm programs and border measures, e.g.,
TRQs and tariffs), hereafter referred to as full liberalization. In the second scenario, only trade
liberalization (the elimination of border measures) is implemented. This second scenario,
although somewhat contrived, allows us to gauge the respective contribution of each type of
distortion (domestic versus trade) on terms of trade and market outcomes (such as trade flows
and location of production). We hereafter refer to this scenario as trade-only liberalization.
With these two scenarios, we assess the policy claims mentioned in the previous
sections and elucidate on the empirical evidence contested between the developing
members and high-income members of the WTO. We also identify outcomes for clusters
of developing countries (including high-protection countries, net-importing countries, net
exporters, and low-protection importing countries). We quantify the impact of trade and
domestic agricultural distortions on terms of trade, trade flows of developing economies
and their partners, and location of production. We consider the removal of tariffs and
TRQ schemes, export subsidies, and output and input subsidies affecting production
decisions for all major players in these markets. The modeling approach covers all
temperate crops, many livestock products, poultry, and dairy products, for more than 25
countries including all major exporters and importers in these markets.
Our report contributes to the new literature analyzing agricultural negotiation issues
in the Doha Round of the WTO (Beghin, Roland-Holst, and van der Mensbrugghe
forthcoming; Burfisher 2001; Diao, Roe, and Somwaru 2002; Francois 2000; Hoekman
and Anderson 2000; and World Bank 2001). The departure of our analysis from the
literature resides in its unique coverage of countries, rich disaggregation of commodities,
and in the incorporation of the most recent policy information within a realistic baseline.
The limitations of the analysis are numerous. First, the FAPRI modeling system is not well
suited to analysis of economywide trade liberalization. The analysis does not take into account
feedback effects from potential trade liberalization in other sectors such as textiles or food
processing. Hence, the report addresses in depth a more specific but nonetheless interesting
agricultural policy question. Second, the removal of some policies tests the limits of the
modeling approach. Supply responses have to be assumed in markets currently constrained by
supply management schemes in order to show what would happen when these schemes are
removed. No one knows the “true” magnitude of these future supply responses. Furthermore,

4 / FAPRI Staff
this analysis should be viewed as an academic exercise where the objective is to observe the
results generated with the FAPRI modeling system. If FAPRI were asked to examine the same
issues for policymakers, the institute would seek further comments from industry experts and
would make appropriate revisions to the analysis in light of the information obtained. The
paper points out some of the results most likely to induce disagreement among agricultural
policy experts.
The remainder of the report presents the policy scenarios, the major assumptions
incorporated into the FAPRI model, the baseline used in the investigation, and the
simulation results. This is followed by concluding comments. Appendix A gives tables
with results under the full liberalization scenario. Appendix B gives tables with results
under the trade-only liberalization scenario.
Policy Scenarios and Baseline Assumptions
Scenarios
We start from a reference baseline or a business-as-usual scenario, which is the 2002–2011
baseline established for the FAPRI 2002 World Agricultural Outlook (FAPRI 2002). This
baseline incorporates most major actual policies and policy commitments such as the URAA,
the Berlin Accord on Agenda 2000 reforms to the E.U. Common Agricultural Policy (CAP),
the 1996 U.S. Federal Agriculture Improvement and Reform (FAIR) Act, and China’s
accession to the WTO, as will be explained in more detail. However, as the baseline was
prepared in January 2002, it does not incorporate provisions of the U.S. Food Security and
Rural Investment Act, but rather, it assumes a simple extension of 1996 farm legislation. The
baseline also includes important macro policy developments such as Argentina’s current crisis.
The FAPRI baseline assumes that all government programs and international
agreements currently in effect will remain in place over the period. The baseline includes
most major policy changes that occurred recently and are currently in place. Specifically,
China became a member of the WTO in December 2001, followed by Taiwan in January
2002. China implements a “tariff only” regime in livestock. Tariff rates for fluid milk,
skim milk powder (SMP), whole milk powder (WMP), cheese, and butter are reduced by
about 55 percent in three equal steps. For wheat, corn, and rice, in-quota tariffs are set to
1 percent throughout the baseline, while the out-of-quota rate is 71 percent in 2002/03,

The Doha Round of the WTO: Appraising Further Liberalization of Agricultural Markets / 5
decreasing to 68 percent in 2003/04. TRQs for grains increase in two equal increments
and are held constant beginning in 2004/05. TRQs for soybeans, rapeseed, and palm oil
increase annually until eliminated in 2006. The in-quota rate is 9 percent while the out-
quota rate is 52.4 percent.
The baseline also includes provisions of the 1996 FAIR Act. Although the FAIR Act
included provisions only through 2002, these provisions are extended at 2002 levels to
the end of the baseline period. Loan rates are fixed in the baseline at the maximum levels
allowed, and the Export Enhancement Program, though available, is not used in the
projection period. The baseline assumes no emergency spending package for 2002 or
thereafter. NAFTA (North American Free Trade Agreement) provisions are included in
the FAPRI baseline. Tariffs on cereals and sugar have been decreasing and will be phased
out by 2008. Mexico has been flexible with the management of its meat TRQs to
accommodate demand for imports.
Regarding the E.U. CAP, the provisions of the Agenda 2000 reforms are imple-
mented in the baseline as outlined in the Berlin Accord, including the dairy sector
reforms from 2005 to 2007. The CAP reform decreases the intervention support price for
cereals, beef, and dairy, and producers are compensated with higher direct payments.
Commercial cereal and oilseed producers are required to set aside 10 percent of their
area. The set-aside program is accompanied by intervention prices (€101.3 per metric
ton) and by compensatory payments for grains (€63 per metric ton based on reference
yields). Starting in 2002/03, the compensatory payments are the same for grains and
oilseeds. A voluntary set-aside program, in which farmers are allowed to set aside area
above the 10 percent threshold, is also accounted for in the model. Although interrupted
by the recent Bovine Spongiform Encephalopathy (BSE) crisis, Agenda 2000 reforms in
the beef regime will continue. Several temporary support schemes were introduced,
including Purchase for Destruction, which was later replaced by the Special Purchase
Scheme, in effect until the end of 2001. The Over Thirty Month Slaughter (OTMS)
Scheme in the United Kingdom is scheduled for termination by 2002. Only private
storage aid and a safety net intervention at a low price of €1,560 per metric ton is
envisioned in the long run. The pre–Berlin Accord E.U. milk quota system is retained
under the new regime. Quotas are increased by an average of 1.5 percent over the three-
6 / FAPRI Staff
year period beginning in 2005. Butter and SMP intervention prices are reduced by 15
percent in three equal steps beginning in 2005.
Among the multilateral trade agreements, the URAA of the WTO has had the largest
impact on agricultural trade, with provisions for developing members being implemented
until 2004. After 2004, all WTO provisions are held constant until 2011/12 in the
baseline run.
The two policy scenarios are then presented in deviations from this baseline. FAPRI
(2002, pp. 28-35) provides a detailed list of policies incorporated in the baseline that are
changed in the two scenarios. Tables A.1 and A.2 summarize the main policy changes
considered in both scenarios for selected countries. All policy changes are assumed to
occur simultaneously and instantaneously beginning in 2002.
The first scenario, the full liberalization scenario, investigates the removal of all
agricultural distortions: domestic farm programs and border measures—including all TRQ
schemes, tariffs, and direct export subsidies such as in the E.U. CAP. The second scenario, the
trade-only scenario, considers the removal of border measures only. With this latter scenario,
we can assess the contention that domestic programs depress world market prices. The scenario
raises the issue of how domestic programs would hold in the absence of border restrictions. For
example, dairy policies in many countries rely on border protection to maintain domestic prices
above world prices but also above some reference price floor. For the domestic program in the
European Union, we assume that with the removal of the border measures, the domestic price
floor eventually would be reached as domestic prices fall. If trade liberalization results in
market prices falling below current domestic price floors, we assume that governments would
make payments to producers in an amount equal to the difference between the current domestic
price floor and the market price (in many respects, this would be similar to the manner in which
the U.S. loan deficiency payment program operates). Again, the objective is to identify the
relative contribution of trade and farm policies. Other assumptions are also plausible.
In dairy markets, the removal of domestic policies includes the following by country: in
the European Union, elimination of intervention for butter and SMP, and the removal of
milk production quotas; in Canada, removal of milk marketing quotas and support prices
for milk, butter, and SMP; in the United States, elimination of milk support prices and
Commodity Credit Corporation (CCC) stocks for butter and SMP; in Hungary, Japan, and

The Doha Round of the WTO: Appraising Further Liberalization of Agricultural Markets / 7
Slovakia, elimination of milk marketing quotas; and in Poland, elimination of milk
marketing quotas, milk support prices, and intervention stocks for butter and SMP.
In the meat market, limited TRQs, high border duties, subsidized exports, and price
support intervention schemes are employed by many countries to protect their domestic
producers. For example, with limited productive potential in meat, many Asian countries
protect their domestic producers primarily with high border duties. All these were
dropped to zero in the full liberalization scenario, including, among others, the 38.5
percent beef duty and the specific duty implied by the “gate price” policy of pork in
Japan, and the 40 percent beef duty in South Korea and the Philippines. Accession to the
WTO by China and Taiwan is already in the 2002 baseline; their respective duties for
meats, which are dropped in the full liberalization scenario, are 12 to 20 percent and 12 to
15 percent. South America, a natural exporter of meat, has a zero duty for intra-
MERCOSUR (the Common Market of the Southern Cone of South America) trade,
which is the dominant share in their meat imports. Policy changes for the European
Union include removal of TRQ, out-quota duties, and subsidized exports. Also, the E.U.
beef intervention scheme is terminated, with its stocks released to the market.1 Canada’s
poultry TRQ and out-of-quota duties in poultry are removed.
For rapeseed production in the European Union under the full liberalization scenario, our
analysis assumes that the industrial rapeseed production on the set-aside land is cancelled and
the set-aside land is returned to regular production. Without subsidies, it is assumed that crush
demand for industrial rapeseeds is eliminated. The assumptions on the liberalization of the
domestic market for the E.U. sunflower sector are similar to those of the rapeseed sector. The
demand for sunflower oil is reduced by the quantity of oil produced from sunflowers grown on
set-aside area in the baseline. This, however, covers only about 50 percent of the industrial oil
consumption. Therefore, our analysis assumes that 50 percent of the baseline industrial oil
consumption is an unsubsidized market demand. All barrier protection and domestic support
policies that affect the world grain markets are eliminated, including the E.U. set-aside
program. We assume that the mandatory set-aside program is removed. When
exemptions for small farms are taken into account, the mandatory set-aside area
represents 7.6 percent of the total potential cereal and oilseed area that is released for
production under the no-barrier scenario. The removal of support to rice farmers also is

8 / FAPRI Staff
an important feature in our scenario. Rice is not part of the set-aside program. The E.U.
policy regime includes a mix of intervention prices, tariffs, export subsidies, and direct
payments, which results in domestic prices that can be twice as high as world prices. All
of these domestic programs, as well as border protection and export subsidies, are eliminated in
the full liberalization scenario. This results in lower returns for grains and a more
straightforward link between E.U. domestic prices and world prices. Two forces are thus at
play in the full liberalization scenario. The removal of the set-aside area leads to a significant
potential increase of the total E.U. crop area while at the same time crop returns are reduced
because of the removal of trade protection and domestic support. The set-aside area has lower
yield potential than does current planted area, thus limiting the impact on supply of the removal
of the set-aside program. Although it is difficult to get a precise idea of the magnitude of the
yield differentials, we try to capture this in the scenario by assuming lower yields (10 percent
lower than the baseline projection for all crops) on the area that returns to production.
As for grains in China, we include TRQs reaching 7.2 million metric tons (mmt) in corn,
5.3 mmt in rice, and 9.6 mmt in wheat with in-quota rates of 1 percent and out-quota rates of 68
percent. In-quota imports of wheat, corn, and rice are already subject to a low 1 percent
tariff. The elimination of the TRQ system in the full liberalization scenario thus has a
limited direct impact on Chinese grain imports. In addition to border protection,
procurement prices for wheat, corn, and rice also are eliminated. This impacts
significantly the Chinese farm price for these commodities.
Mexican corn farmers are still protected under the NAFTA regime by a combined
system of TRQ and tariff but with a phasing out of tariffs by 2007. This significantly
impacts the balance between corn and sorghum in Mexican imports, as sorghum is
already liberalized. The NAFTA tariffs are brought back to zero as of 2002.
India has used export subsidies widely in recent years to reduce its large amount of stocks.
These export subsidy programs are terminated in both scenarios, leading to higher net imports
of grains by India.
On the U.S. crop side, domestic farm policy is administered through two main channels:
price-conditioned payments (loan deficiency payments [LDPs]) and so-called fixed
(decoupled) payments based on historical production on an individual farm. Under LDP
programs, producers receive the difference between the set price (loan rate) and the actual
The Doha Round of the WTO: Appraising Further Liberalization of Agricultural Markets / 9
price. Therefore, the amount of support differs for different crops depending on the level of the
loan rate for an individual crop. In the baseline, soybeans, cotton, and rice are the only crops for
which LDP programs provided any benefits. These are the crops that experience a decrease in
area when exposed to international market prices in the full liberalization scenario given a
reduction in marginal production incentives.
The international cotton trade is relatively free, but domestic markets are distorted
in many countries. While cotton trade is relatively free, textile and clothing trade is
highly distorted. Our analysis does not consider textile and apparel liberalization. We
consider the following domestic distortions. In the European Union, under the CAP,
support payments are made to ginners who are required to pass the subsidy on in the
form of higher prices to growers. In the United States, LDPs and production flexibility
contract (PFC) payments are paid to cotton growers. Other payments to growers include
export and consumption subsidy programs known as Step 2. U.S. cotton producers are
expected to receive a total of U.S.$3.7 billion in government subsidies in 2001/02. In
Turkey, all growers are entitled to a premium payment calculated on the basis of seed
cotton deliveries to either cooperatives or private gins. The Turkish government support
was U.S.$106 million in 2000/01; it has been reduced to U.S.$59 million in 2001/02, as
the premium was lowered from U.S.$90 to $50 per metric ton of seed cotton. In Egypt,
the government disbursed U.S.$20 million in 1999/00 in order to pay for the difference
between selling and purchase prices. Support increased to U.S.$23 million in 2000/01.
It is estimated that the government of Egypt will offer the same amount of support this
season. In Brazil, for 2001/02, the government has set a support price of U.S.$.0396
cents per pound. Finally, in Mexico, assistance to growers was given in 2000/01 at a
rate of U.S.$194 per hectare, for a total of U.S.$14 million in government assistance.
Modeling Approach and Further Assumptions
The FAPRI modeling system is a multimarket, world agricultural model. The model
is extensive in terms of both its geographic and commodity coverage. Functionally, the
modeling system is organized into modules according to major commodity groupings—
grains, other crops, oilseeds, livestock, and dairy—with country submodels. The system
captures important linkages between dairy, livestock, grain, and oilseed markets. Feed
10 / FAPRI Staff
prices impact dairy and livestock supply decisions, and animal inventories have an
impact on milk and meat production. Both dairy and livestock animal numbers are used
to determine demands for feed, which ultimately influence feed prices. Oilseed markets
are linked to livestock markets through oilseed meal demand. Vegetable oils are
substitutes in consumption and compete in final consumption for consumers’ income.
The FAPRI model solves for world prices by equating excess supply and demand in
the world market. As explained in the scenario section, the FAPRI model is driven by
two major groups of exogenous shifters. First, policy instruments are parameterized in the
model and can be altered for policy analysis. Second, the model incorporates forecasts of
macroeconomic variables, such as gross domestic product, inflation rates, exchange rates,
and population. For each scenario, policy parameters are changed and a new baseline is
computed for the outlook period. The two trajectories are then compared.
Results
Results are reported as average annual changes over the outlook period (2002–2011)
in deviation from the baseline, unless otherwise noted. Tables A.3 through A.46 show the
principal results regarding prices, trade, production, and consumption for the full
liberalization scenario for each year of the outlook period. The average annual change is
reported in the last column of each table. Corresponding information for the trade-only
liberalization scenario is given in Tables B.1 through B.44.
Grains
Wheat. The wheat price (U.S FOB Gulf) is up 4.8 percent in the full liberalization
scenario (removal of all distortions) and 7.6 percent in the trade-only liberalization
scenario, relative to the baseline (Tables A.3 and A.4). World net trade increases by 7.9
percent following the removal of all distortions and by 5.0 percent with trade
liberalization alone. Under this scenario, the increase in world price is tempered by larger
E.U. and U.S. net exports and to a lesser extent by larger exports from Russia, Canada,
and Argentina. A different picture emerges with the removal of all distortions. The
removal of set-aside requirements in the European Union frees a much larger expansion
of E.U. wheat and induces a substantial increase in E.U. wheat exports of 6.4 mmt.
Russia’s export expansion under the full liberalization scenario withers to a modest 3.7

The Doha Round of the WTO: Appraising Further Liberalization of Agricultural Markets / 11
percent increase because of the more moderate relative price increase, and Canada and
Argentina still expand their wheat exports relative to the baseline. To a lesser extent,
Australia increases its exports under both scenarios.
The FAPRI baseline assumes that liberalization would force the E.U. price to follow
the world price. The reduction in trade barriers causes the E.U. price to increase,
prompting more exports. This is reinforced by a lower domestic feed demand in the
European Union. The overall E.U. grain area increase is less than the area previously put
into mandatory set-aside, suggesting that payments had been holding at least some land in
production, all else being equal.
In Eastern Europe and Other Former Soviet Union (FSU) (all except Russia), the
removal of tariffs leads to a decrease of net exports (Czech Republic, Ukraine) and an
increase in net imports (Other FSU, Poland) under both scenarios. In the baseline, wheat
imports in China were already subject to a low tariff within the TRQ, and no imports
were projected beyond the TRQ. With world prices increasing under both policy reform
scenarios, Chinese imports decrease in both scenarios.
Because of the removal of the export subsidy, Indian exports decrease and India
becomes a net importer in 2003/04 with the full removal of all distortions (a year later
with trade-only liberalization). The increase in net trade averages 3.9 mmt above baseline
levels in the full liberalization scenario.
Corn. The corn price goes up by 5.7 percent with the removal of all distortions and
goes slightly higher (6.2 percent) with trade-only liberalization relative to the baseline
(Tables A.5 and A.6). World net trade increases by 3.5 mmt with the full removal of all
distortions. With trade-only liberalization, net trade increases until 2008, and then falls
slightly below baseline levels. The decrease in world net corn trade is driven by lower
animal numbers in key countries, such as Japan, the European Union, and China. In both
scenarios, the increase in the corn price is sustained by increased demand for feed in the
United States and from other major (feed-intensive) exporters.
With trade-only liberalization, U.S. corn exports decrease but the feed content of
U.S. meat exports increases. With the full removal of all distortions, U.S. exports expand
by an average annual 2.9 mmt, with the increase peaking in 2004 at 5.7 mmt and then
decreasing progressively over the remaining period.

12 / FAPRI Staff
As for China, net corn imports increase when all distortions are removed. The world
price increases moderately, and the net effect of tariff removal and a higher world price
induces an increase in imports and a decrease in domestic production. However, net
imports decrease in the trade-only liberalization scenario. The drop in imports is due to
the already low tariff in the baseline brought about by WTO accession, a higher world
price, and lower animal numbers.
With both policy reform scenarios, and despite lower animal numbers and a higher
world price, E.U. imports increase because of a much lower return for farmers. Current
policies sustain E.U. corn prices at a greater premium compared to world prices than E.U.
prices for other grains. The average annual increase in E.U. corn imports is 1.7 mmt
under the full liberalization scenario.
The impact of this scenario on Mexican imports is the strongest in the first half of the
projection period when the NAFTA tariff is still important. As this trade barrier vanishes
over time in the baseline, Mexican trade is impacted only by the world price and
increasing animal numbers. Corn imports increase by an average of 900 thousand metric
tons (tmt) annually in the full liberalization scenario.
Rice. The increase in world rice prices is the highest among the grains. Under the full
liberalization scenario, the price for rice goes up 10.3 percent on average compared to the
baseline and it goes up a bit higher in the trade-only liberalization scenario (10.6 percent)
(Tables A.7 and A.8). This price increase can be explained by high tariffs on rice and a
thin and reactive world market.
Rice trade increases by around 29 percent in the full liberalization scenario and by 27
percent with trade-only liberalization. Trade barriers are the main driver in the rice
market. Most of this trade increase is captured by China, India, and Vietnam, followed by
Thailand. Under the full liberalization scenario, U.S. exports decrease by an average of
98.3 percent, eventually turning the United States into a net importer as domestic support
for rice vanishes.
The removal of tariffs and other trade barriers in Japan, Korea, the Philippines, and
the Rest of World (ROW) leads to higher imports despite higher world prices. Brazilian
imports decrease as a result of the higher world price. As Brazil is the main export market
for Argentine rice, Argentine exports decrease compared to the baseline in both

The Doha Round of the WTO: Appraising Further Liberalization of Agricultural Markets / 13
scenarios. The latter outcome results from the specific grain trade flow between the two
neighboring countries.
As for the European Union, the removal of border protection results in a significant
increase in both consumption and stocks. When intervention prices and direct subsidies
are still in place, consumption is driven up by the decrease in price while area remains
roughly at its baseline level. Trade-only liberalization thus results in an increase of both
stocks and imports. Imports increase by an average of 700 tmt a year while stocks range
from 1.3 mmt to 1.6 mmt (compared to below 0.8 mmt in the baseline). As rice
production is not competitive on world markets, the removal of domestic support results
in a drop in area. Rice area in the European Union thus drops dramatically from 400 to 25
thousand hectares. As a result, in the full liberalization scenario, E.U. imports range from
2.2 to 2.6 mmt, supplying most of the E.U. consumption.
Oilseeds
Soybean Complex. Soybean world price increases by an average of 3.1 percent in
the full liberalization scenario relative to the baseline (Tables A.9 through A.14). The
price increase is stronger in early years and tapers off in later years. In the trade-only
scenario, similar patterns emerge, and the average price increase is 2.8 percent for the
decade. The removal of price supports in the United States, South Korea, and Japan
boosts the price another 0.3 percent annually (relative to the trade liberalization scenario).
In the conclusion section, we revisit this last finding, which is quite important in the
context of the WTO debate.
Soybean world production remains virtually unchanged, but the full-liberalization
scenario causes shifts in production and processing locations. The liberalization of world
soybean trade causes Argentina and Brazil to expand their areas. Natural importers with
tariffs to protect domestic production, such as China, Japan, and India, reduce their
production and crush. India did not import soybeans during the baseline period.
The loss of domestic support reduces the U.S. soybean area by 4.2 percent in
2002/03. As the loan rate becomes less important relative to price, the area reduction
becomes smaller; in 2011/12 it is only 1 percent compared to the baseline. Brazil expands
its production by an average of 3.5 percent. Of this 1.8 mmt production expansion, about
1 mmt is crushed domestically and 0.8 mmt is exported. Brazil also consumes more meal

14 / FAPRI Staff
(7.3 percent); the additional domestic production does not cover this increase entirely,
and meal exports are reduced slightly (0.7 percent). Because of the increase in the
soybean oil price, domestic consumption goes down slightly (0.3 percent). Together with
the increased supply, this boosts Brazilian soybean oil exports by 11 percent.
The opening of soybean markets through trade-only liberalization has similar
impacts on the Brazilian market, with a slightly smaller impact on area and production
(2.8 percent). Hence, the multilateral elimination of farm programs has a small effect on
Brazilian production.
In contrast, in Argentina, the additional production of 1.2 mmt in the full liberaliza-
tion scenario is exported entirely. The removal of the export tax mostly boosts bean
exports in Argentina. The main policy impact in Argentina is from the tariff and export
tax removal; the domestic support removal has only a small effect. Soybean area and
exports respond only slightly to the soybean price increase caused by the reduction in
U.S. supply. Changes in utilization and trade of soybean meal and oil are also
insignificant. Comparing the impacts in Brazil and Argentina, the former would alter its
export composition in favor of value-added products (oil) while the latter would do the
opposite and export more primary commodity exports (beans).
China’s soybean production and demand from crush under the full liberalization
scenario is slightly reduced, leading to marginally lower imports of beans (down 0.1
percent). On the meal side, production is reduced and utilization expands because of lower
domestic prices, so more imports (32 percent) are needed. The Chinese oil sector exhibits
similar patterns, as domestic consumers use more of a cheaper product and oil imports are
increased (6 percent). Under the trade-only liberalization scenario, China decreases its area
by 1.7 percent and its crush consumption by 0.2 percent. The reduction in production is
larger than the slowdown in crush, leading to higher imports of beans. Soybean meal
production is reduced and use expands, so more imports (22 percent) are needed. In the
soybean oil market, more of a cheaper product is consumed and imports are increased.
The full liberalization scenario reduces the Japanese soybean production significantly
(16.3 percent), but the impact on crush consumption (down 2.4 percent) and imports (down
1.9 percent) is limited given the small level of Japanese production relative to consumption.
A higher soybean world price in the trade liberalization scenario is the dominant factor for

The Doha Round of the WTO: Appraising Further Liberalization of Agricultural Markets / 15
Japan; imports fall about 2 percent because of reduced crush demand (lower crush margin).
When Japan’s domestic subsidies are removed in the full liberalization scenario, its area is
reduced by 16.6 percent relative to the trade liberalization scenario. The main impact on the
Japanese meal sector is from the tariff reduction, which reduces livestock production and
increases meal prices so that Japanese feed demand for soybean meal is reduced by 3.8
percent and imports decline by 10.8 percent. The removal of domestic support results in
lower production and higher feed demand than in the scenario focusing only on border
measures. Trade liberalization and removal of domestic support have opposing impacts on
the Japanese soybean oil market, with trade liberalization having the dominant effect. Trade
distortion removal leads to lower prices and higher consumption and imports, but the
elimination of domestic subsidies partially reverses these changes.
Korea is the other Asian country with strong domestic support for soybeans. Overall,
production falls by 23 percent, and utilization decreases 9 percent, leading to an 11
percent increase in imports. World trade liberalization plays only a small role, decreasing
imports by 1.7 percent because of a lower crush demand (lower crush margins). The
removal of all distortions reduces domestic production (by 23 percent), leaves crush
almost constant, but increases domestic food consumption. This results in a 13 percent
increase in imports. The soybean meal and oil sectors are less affected by trade and
subsidy eliminations. Korea experiences a small substitution of domestic production with
imports of both products (3 percent).
World exports in meal decrease because the United States and Brazil consume more
domestically, and Argentina and India crush less. Consumption decreases in most
importing countries (European Union, FSU, Eastern Europe, Japan, Korea, Taiwan),
lowering their imports. Total world production and consumption increase slightly (0.4
percent). Trade-only liberalization boosts world meal production and consumption; the
removal of all distortions depresses them.
World trade in oil increases by 4.8 percent in the full liberalization scenario. China,
Japan, India, Korea, FSU, Eastern Europe, and ROW import more (due to substitution of
domestic production), while the United States and Brazil export more. Argentina’s
production and export contract, because its crushing industry loses protection from the
export tax on beans.

16 / FAPRI Staff
Rapeseed Complex. The total E.U. rapeseed area (food and industrial) decreases by 21
percent, and total crush is reduced by 25 percent in the full liberalization scenario (Tables A.15
and A.16). These changes turn the European Union into a net exporter of rapeseeds for the first
half of the outlook and reduce imports later on. In the trade-only liberalization scenario,
rapeseed prices increase 8 percent, resulting in higher production and a decrease in crush. This
reduces the European Union’s import needs. The removal of all domestic distortions has a
more severe impact on this sector. Industrial rapeseed production on the set-aside land and its
crush are eliminated; the set-aside land is returned to regular production, and area subsidies are
cancelled, decreasing returns of rapeseed by 25 percent with respect to the trade-only
liberalization scenario. These assumptions result in a 21 percent reduction in area, a 23 percent
crush decline, but a 58 percent increase in net trade (relative to the trade liberalization scenario).
Net exports expand because despite the reduction in total area, the food rapeseed area is
expanded by 1.2 percent out of the former set-aside area (relative to the trade liberalization
scenario). This increases food production relative to domestic demand.
The E.U. rapemeal sector also is severely influenced by the changes in rapeseed
because industrial crush residue that could be used as feed is no longer available. The
cancellation of the industrial oilseed program reduces E.U. rapemeal output by about 1
million tons (Tables A.17 and A.18). Trade-only liberalization causes just a moderate
reduction (3 percent) in rapemeal production. In the full liberalization scenario, meal
production is reduced by 20 percent, consumption shrinks by 1.9 percent, leaving the
need for more imports (215 percent).
On the E.U. rapeseed oil side, production is exogenously reduced by the amount
of the industrial production. Consumption is decreased by the same amount. This covers
all of the industrial oil demand in the baseline (we assume no unsubsidized industrial
demand for rapeseed oil). Since the crush margin is reduced, food oil production
decreases as well. As a result, oil exports are lowered by 11.6 percent. Trade
liberalization is the dominant influence on E.U. oil trade. Oil production falls (with a
lower crush margin because of the falling meal price) more than does utilization (higher
price), reducing exports by 13 percent in the trade-only liberalization scenario.
The removal of domestic distortions influences world price only slightly, leaving
trade almost unchanged compared to the trade-only liberalization scenario. All traditional

The Doha Round of the WTO: Appraising Further Liberalization of Agricultural Markets / 17
rapeseed exporters expand area, benefiting from the higher world market prices. The
ROW (an importer with a low tariff) has a higher domestic price and increases area. India
and China lose rapeseed acreage because of lower domestic prices.
Crush margins fall in countries that have protective tariffs on rapeseed meal and/or
oil (European Union, FSU, and Japan) and their crush consumption falls. As a result, the
FSU exports more rapeseed and the European Union and Japan import less. Canada and
Australia’s additional production goes mostly into exports. China decreases domestic
production by 0.6 percent but increases crush 0.8 percent, requiring 8.5 percent of
additional imports. India did not trade rapeseed in the baseline but averages imports of
287 tmt in the full liberalization scenario.
Domestic meal prices fall in all countries. Canada, India, and China increase their
use of rapeseed meal; all other countries decrease their use (driven by animal numbers
and cross-price effects). Rapeseed meal trade development is driven by the relative
movements of domestic crush and use in the individual countries. World trade expands
by 26 percent.
The rapeseed oil world price increases strongly (11 percent), driven by strong
demand growth in India. Domestic prices fall in the FSU, Japan, and India, boosting their
domestic consumption by 1.4 percent, 1.8 percent, and 11.9 percent, respectively (Tables
A.19 and A.20). In all the other countries, consumption shrinks because these countries’
domestic prices rise along with the world price. However, world consumption does rise
by 0.7 percent.
The increased rapeseed oil demand in India and Japan requires additional imports of
about 177 tmt and 53 tmt annually, respectively. E.U. exports shrink by 11.6 percent.
Fewer imports by the ROW and China and additional Eastern European, Australian, and
Canadian exports provide a market adjustment for rapeseed oil. The removal of
distortions has a big impact on the Indian rapeseed complex: the domestic price falls by
26 percent, production decreases by 5.2 percent, the crush margin improves, and crush
expands, resulting in imports. Domestic consumption of meal increases by 9.4 percent,
and there is a trade reversal from export to import of meal. The domestic oil price
declines 26 percent, while domestic consumption increases 12 percent. There is a small
boost in oil production, and imports increase 364 percent. Almost all of these effects are

18 / FAPRI Staff
due to trade liberalization. Elimination of domestic policies in Europe, the United States,
Japan, and South Korea amplifies the latter results slightly.
Sunflower Complex. The world sunflower price rises 4.3 percent in the full liberalization
scenario (Tables A.21 through A.26). World production responds by increasing 1.2 percent,
and crush consumption in the world rises 1.9 percent. Production and consumption locations
shift in the scenario, causing a 21.7 percent expansion of sunflower seed trade in the world.
E.U. sunflower production decreases by 4.4 percent because of the elimination of trade
and domestic distortions. Crush declines by 18 percent, reducing imports by 56 percent. The
decreases in crush and imports are caused by trade liberalization. The aggregate reduction of
tariffs is much more severe for oil than for meal, driving world oil demand up disproportion-
ately. Crush responds to this increased oil demand and, because of the fixed-proportion
technology, meal is “overproduced,” driving its price down. In the trade-only liberalization
scenario, the sunflower price inreases 4.7 percent, the oil price increases 7.3 percent, and the
meal price drops 8.7 percent. Figuring in the elimination of tariffs in the European Union, the
domestic crush margin decreases 33 percent, reducing crush by 14 percent.
As with the rapeseed sector, the elimination of domestic subsidies is assumed to result in
the elimination of the production and crush of E.U. sunflowers for industrial purposes. The
demand for oil is reduced by the resulting oil quantity, which covers only about 50 percent of
industrial oil consumption. The remaining industrial oil consumption is assumed to be
unsubsidized. While total sunflower area shrinks (4.6 percent) because of the elimination of
industrial production on set-aside land, food area expands slightly (0.3 percent) (both relative to
the trade-only liberalization scenario), because of the return of some set-aside area to regular
production. Because the reductions in supply and demand are almost equal, the removal of all
distortions does not have a significant impact on E.U. sunflower seed trade (down 0.4 percent)
or the world price (down 0.5 percent) relative to the trade-only liberalization scenario. Because
of the deterioration of the crush margin and removal of industrial production, sunflower meal
production falls by 18 percent in the European Union. The domestic price falls along with the
world price by 9.7 percent, boosting consumption by 2.9 percent. This requires 35 percent
additional net imports of sunflower meal into the European Union. The trade-only liberalization
scenario has a dominating influence in the sunflower meal market. The domestic price falls by
9 percent. Low crush margins cause production to decline by 14 percent. The elimination of

The Doha Round of the WTO: Appraising Further Liberalization of Agricultural Markets / 19
industrial oilseed production affects the sunflower meal sector less than it does the rapeseed
meal sector; less than 100 tmt are taken out of the market.
Because of the deterioration of the E.U. crush margin and the elimination of the
industrial crush, sunflower oil production falls by 18 percent. The increase in the world
price (7 percent) is almost offset by the elimination of the tariff, but the domestic price
still rises by 0.6 percent. Therefore, total E.U. consumption is reduced by the industrial
share, but food consumption remains stable. Stable demand and falling production
require imports to more than double (133 percent) in the full liberalization scenario.
Except for the reduction of about 4 percent in production and consumption due to the
elimination of the industrial support program, the elimination of domestic support
programs does not affect the sunflower oil sector significantly in the European Union.
The changes are overwhelmingly caused by the trade liberalization.
World sunflower production changes according to the resulting movements of
domestic prices. Production increases in Argentina and the FSU because of the increase
in world prices. Countries with high tariffs (Eastern Europe, China, the ROW) have lower
domestic prices and lower area when the tariff is removed. Overall, production increases
profits from the increased demand and higher prices. Production locations shift from
importers to exporters. The crush consumption increases in the ROW and Eastern Europe
because of high tariffs on seeds. All other countries decease their crush because of lower
crush margins. The counties with lower production import more (the ROW) or export less
(Canada, Eastern Europe).
Argentina and the FSU pick up the slack. These big exporters substitute raw
material exports for domestic crush. The domestic prices of sunflower meal are
depressed everywhere. Consumption expands in all countries except Eastern Europe,
where animal numbers decrease 6.4 percent. The movements in meal trade depend on
the relative magnitude of production and consumption: in Argentina, the decrease in
crush is equal to meal production; the increase in use leads to lower meal exports. As a
result, there is a shift into seed exports from meal exports. In the ROW, the
corresponding response occurs: reduced area, and increased crush and seed imports.
There is a shift into imports from domestic seed production and then fewer meal
imports as domestic crush substitutes for imported meal. In the European Union, the
20 / FAPRI Staff
markets are characterized by less crush, fewer seed imports, and higher meal use,
requiring more meal imports. This constitutes a shift into processed product imports
from raw material imports.
Domestic sunflower oil prices in Canada, Eastern Europe, and the ROW (countries
with high protection) fall, and so their domestic consumption increases. Eastern Europe
and the ROW also produce more. The production gain outweighs the consumption
increase, so they import less. China did not trade sun oil in the baseline; it becomes an
importer in the full liberalization scenario. The traditional exporters export less oil; with
reduced crush, they export more seeds. Overall, oil trade is down. Consuming countries
shift into the trade of raw material and crush.
Peanuts. All countries except India and the United States face higher domestic
prices because of the tariff elimination and domestic policy changes (Tables A.27 and
A.28). World production expands by 1.2 percent and the world price climbs 19.2 percent.
Nearly all of this rise in price is due to the tariff elimination. The termination of peanut
support in the United States boosts the world price by only 2.3 percent relative to the
trade-only liberalization scenario. World peanut area expands 0.6 percent, consumption
rises by about the same amount, but world trade falls 14.4 percent. The reduction in trade
is mainly due to the 78 percent falloff in U.S. exports (all relative to the trade-only
liberalization scenario).
In the baseline, the U.S. peanut program consists of the domestic production quota,
a high price support for the production under quota, and import restrictions
administered through a TRQ. Peanuts that can be sold for edible uses (Segregation 1
peanuts) grown under the allotted quota poundage receive a guaranteed price floor that
significantly exceeds the world price. Any peanuts grown outside of the quota
(“additional” peanuts) cannot be sold for domestic edible consumption and must be
exported or crushed to produce peanut oil or peanut meal. In the trade-only
liberalization scenario, it is assumed that only Segregation 2 and 3 peanuts (non-edible
use) can be imported. Because the domestic program targets primarily Segregation 1
(edible use) peanuts trade liberalization does not interfere with the program
administration. As a result, the U.S. peanut imports fall to zero because the price
support in the market for additional peanuts that cannot be marketed for domestic use in
The Doha Round of the WTO: Appraising Further Liberalization of Agricultural Markets / 21
food is set on par with the world price. In the trade-only liberalization scenario, this
allows the U.S. to support a domestic peanut price that is significantly higher than the
world price.
Because of higher domestic prices, all countries except India expand peanut area.
Because Argentina does not have any tariffs, it can take full advantage of the world price
increase, expanding its area by 11.2 percent. In absolute terms, China has the largest area
expansion, growing 276,000 additional hectares. The high tariffs in India lead to a
reduction in domestic price and production. Crush consumption is the dominant
component of Indian peanut demand. Therefore, despite the lower domestic price,
consumption decreases by 1.4 percent because the peanut crush margin is also reduced,
depressing crush consumption. The production reduction outweighs the consumption
decrease, resulting in lower exports (an 11.1 percent decrease).
China’s domestic price increases 3.1 percent, and area expands by 1.0 percent.
Domestic use grows 1.9 percent, resulting in a 24 percent reduction of exports. Domestic
consumption expands despite the price increase because the crush margin improves by
nearly 17 percent, boosting crush consumption by 3.4 percent. The increase in domestic
consumption is larger than the production expansion, reducing peanut exports by 24 percent.
In the trade-only liberalization scenario, Argentina is the only country that increases
exports. The other exporters, the United States, China, and India, either decrease their
domestic production or increase their domestic consumption, resulting in lower exports.
All peanut importers reduce their imports. Canada, Mexico, and the European Union
have lower consumption because the increase in world price affects them directly. The
ROW consumes more but also has a strong production increase because of the higher
prices reducing the need for imports.
Palm Oil. The world palm oil price increases by 4.6 percent because of the removal
of all distortions (Tables A.29 and A.30). Trade liberalization accounts for the entire
price change. The cancellation of domestic supports for oil crops in the European Union
and United States does not have any net impact on the palm oil price. Production expands
in the producer/exporter countries (Indonesia, 1.4 percent; Malaysia: 1.1 percent). The
consumption in these countries declines because domestic prices increase; therefore,
exports increase more than production (Indonesia, 3.4 percent; Malaysia, 1.4 percent).

22 / FAPRI Staff
Domestic prices fall in the importer countries (China, India, and the ROW).
Domestic consumption rises accordingly. The domestic price rises slightly in the
European Union. Because prices of competing oils rise significantly more, consumption
of palm oil increases marginally. Along with consumption, imports rise everywhere.
World trade volume expands 2.1 percent. India has the strongest increase in imports (6.3
percent), corresponding to its removal of a high tariff. Overall, palm oil becomes cheaper
for consumers in importing countries, and they consume more. Producers in exporting
countries realize a higher price, and they produce more, but consumers in these countries,
faced with the higher price, reduce their consumption, adding to the growth in exports.
Total world oilseed production falls by almost 900 tmt because of the elimination of
E.U. non-food oilseed production, and an exogenous reduction in rapeseed and sunflower
production. The reduction of about 2.3 mmt annually of E.U. rapeseed and sunflower
production cannot be fully compensated by production expansions in other oilseeds.
Correcting for this exogenous change, we find that the world production of soybeans,
rapeseed, and sunflowers expands by 1.5 mmt. Soybean production expands 0.3 percent
on average, accounting for about 700 tmt per year of additional production. Sunflower
food production increases 480 tmt, a 1.9 percent growth. Despite the absolute decline in
world rapeseed production of 4.5 percent, food production grows by 293 tmt, an increase
of 0.7 percent. Because of lower baseline tariffs in the soybean sector, its production and
price increase is lower than for the other seeds. Rapeseed and sunflower gain relative to
soybeans, not counting the exogenous reductions in the European Union.
Total consumption of the major vegetable oils (soybean, rapeseed, sunflower, palm)
falls nominally by 329 tmt on average. However, the exogenous elimination of the non-
food sector in the European Union accounts for 961 tmt. Vegetable oil food consumption
rises by 632 tmt, or 0.8 percent of total world consumption. This expansion of vegetable
oil consumption is driven by lower domestic prices in many importing countries caused
by tariff elimination. Palm oil captures the largest absolute increase, expanding about 247
tmt, followed by sunflower oil with 164 tmt. Soybean oil tariffs in the baseline are
relatively low, limiting the growth in this sector to 130 tmt. Total rapeseed oil
consumption falls, but food consumption rises by 90 tmt.

The Doha Round of the WTO: Appraising Further Liberalization of Agricultural Markets / 23
Cotton
With the removal of all agricultural distortions in the full liberalization scenario,
world cotton prices increase about 15 percent above baseline levels (Tables A.31 and
A.32). The United States suffers a substantial impact in this scenario as the loan program,
step 2 payments, and export subsidies are removed. U.S. cotton production, consumption,
and net export decline by 11 percent, 2 percent, and 13 percent, respectively.
The removal of all distortions also has a significant impact on E.U. cotton production and
trade. E.U. cotton production falls by about 79.0 percent, and cotton net import increases by
143.1 percent. As world cotton prices rise, Africa, a large cotton exporting region, increases its
cotton exports by 12.3 percent above baseline. Benefiting from both types of reforms, cotton
exports from Uzbekistan increase by 5 percent in the full liberalization scenario. A similar story
arises in the FSU. Both are natural exporters of cotton. In this scenario, China’s cotton imports
decline by 25 percent because of low protection assumed in the baseline with China’s WTO
accession. India cotton producers also benefit from the removal of distortions with the policy
reforms. India’s cotton net imports decline by 14 percent.
Under agricultural trade-only liberalization, nothing major happens in cotton
markets. This result is in sharp contrast to what would happen with trade liberalization in
textiles and apparel, which is a different issue. The world raw cotton market is generally
liberalized, with only 2 percent of world imports in TRQs and 2 percent purchased by
countries that apply tariffs. The world cotton price increases by about 4 percent compared
to the baseline because of the removal of trade distortions. Importing countries with
relatively higher duties removed increase their excess demand for cotton. These countries
include Brazil, India, and Other Latin America. Importing countries with relatively lower
duties removed (or duty free) slightly decrease their excess demand of cotton. These
countries include China, the European Union, Turkey, Taiwan, and Japan. Major cotton
exporting countries, such as South Africa, Uzbekistan, the United States, and Australia,
increase their exports as world cotton price rises. Pakistan suffers the largest impact from
trade liberalization because of the removal of its 15 percent duty. It becomes a net
importer. Under trade liberalization, the U.S. farm price increases slightly less than the
world cotton price. U.S. cotton exports also increase slightly.

24 / FAPRI Staff
Dairy
With the removal of all distortions in the full liberalization scenario, net trade of all
dairy products (butter, cheese, SMP, and WMP) increases relative to baseline levels.
Argentina, Australia, and New Zealand gain market share but would gain even more
under trade-only liberalization. India is likely to gain significant market share in butter
and SMP markets. The European Union loses market share in all dairy products
compared to the baseline. E.U. butter and SMP exports decrease significantly as the
elimination of milk production quotas and intervention buying results in lower milk
production, lower domestic prices, less butter and SMP production, and more domestic
consumption of all dairy products.
In the trade-only liberalization scenario, net trade increases for all dairy products
except cheese. World dairy product prices increase by 27 to 34 percent. Canada becomes
a net importer of all dairy products and is one of the countries that loses more market
share under the scenario, but its consumers benefit greatly. Similar patterns emerge in
South Korea, Japan, and Indonesia. The United States increases its imports of butter.
However, it reduces its imports of cheese significantly and increases its exports of SMP.
Still, under this trade-only liberalization scenario, the European Union loses market share
in all the dairy products except SMP, in which it increases its exports by 5 percent. E.U.
butter, cheese, and WMP exports decrease significantly because of the elimination of
export subsidies and slight increase in domestic consumption. Domestic prices of these
three products also decrease compared to the baseline, increasing domestic consumption.
E.U. SMP is more internationally competitive than other dairy products, and so E.U.
domestic SMP prices increase relative to prices for other products. The result is an
increase in E.U. production of SMP, a reduction in domestic consumption, and an
increase in E.U. SMP exports.
Butter. World butter prices increase by 39.6 percent with the removal of all distortions
(about 33.4 percent with trade-only liberalization) (Tables A.33 and A.34). World total
butter trade increases by 8.7 percent with the removal of all distortions (6.0 percent with
trade-only liberalization). E.U. net exports decrease dramatically, by 96.4 percent (107 tmt)
with some trade reversals occurring between 2003 and 2007. Trade-only liberalization also
induces a sharp drop in exports (44.9 percent) due to the elimination of export subsidies.

The Doha Round of the WTO: Appraising Further Liberalization of Agricultural Markets / 25
The United States and Canada increase their imports of butter. U.S. and Canadian imports
increase by 8.7 percent (47.8 tmt) and 2,033 percent (41.7 tmt) respectively, because of the
removal of tariffs and domestic support. Trade-only liberalization induces the largest impact
on these imports. Canadian butter imports increase as well, because of the removal of butter
support prices, while U.S. net trade increases because of the elimination of CCC stocks and
decreased domestic prices.
With the removal of all distortions, Argentina, Australia, and New Zealand
increase their net exports of butter by 128.8 percent, 27.6 percent, and 9.1 percent,
respectively. Most of the increase comes from trade liberalization (101 percent, 24.5
percent, and 6 percent, respectively), as these exporters take advantage of increased
import demand from countries where high tariffs were in place. The removal of all
distortions causes a sharp drop in E.U. butter exports and further expands trading
opportunities for other exporters.
With trade liberalization, South Korean and Indonesian butter imports increase by
565 percent and 15 percent, respectively, because of the elimination of import tariffs.
With the removal of all distortions, these imports decrease slightly because of higher
world butter prices. Japanese imports increase under both scenarios, by 15 tmt in the
removal of all distortions and by 13 tmt under trade-only liberalization. The major impact
is explained by the elimination of both import tariffs and support provided through
domestic milk marketing quotas, which accounts for the larger import penetration under
the full liberalization scenario.
India becomes a net exporter in both scenarios—a trade pattern reversal, from about
20 tmt annual net imports in the baseline to 54 tmt net exports in the full liberalization
scenario and about 17 tmt net exports for trade-only liberalization. This trend decreases
over time with the largest changes occurring in the early years. The pattern is caused by
higher world prices, decreased domestic consumption, and the European Union’s
diminished presence in the full liberalization scenario.
Under both scenarios, E.U. and U.S. butter consumers benefit from lower prices
(down 6 percent and 21 percent respectively in the main scenario) while consumers in net
exporting countries such as Australia and New Zealand are penalized by higher prices (up
27 percent in the full liberalization scenario).

26 / FAPRI Staff
Cheese. World cheese prices increase about 22 percent with full removal of trade
distortions and by 28 percent with trade-only liberalization (Tables A.35 and A.36).
World cheese trade increases 5.6 percent in the full liberalization scenario but decreases
4.7 percent in the trade-only liberalization scenario. Total trade starts to grow in 2010
under the trade-only liberalization scenario.
With trade liberalization, U.S. imports of cheese decrease by 65 percent because
of increases in world and domestic prices, which reduce domestic consumption. This
pattern is less pronounced in the full liberalization scenario, but cheese imports still
decrease. While this model result is possible under all the assumptions of this
analysis, it does not represent a consensus view on what would happen to U.S. cheese
markets under full market liberalization. Issues include policy and market responses
in the European Union and the substitutability of domestic and imported cheeses in
the United States.
With trade-only liberalization, the European Union decreases net exports by 59
percent, although it continues to be a major cheese exporter. In the trade-only
liberalization scenario, fixed milk production quotas and lower E.U. cheese prices but
fixed producer support prices for butter and SMP result in reduced E.U. cheese
production and higher E.U. cheese consumption. However, with the full removal of all
distortions, E.U. net exports decrease much less, by only 40 percent, as the European
Union uses more milk for cheese because of the elimination of intervention buying for
butter and SMP.
Exports from Eastern Europe increase for Romania, the Slovak Republic, and the
Czech Republic, while Poland’s exports decrease. The quality of dairy products in these
countries has improved, including in Poland. Hence, these predictions are tentative.
Canadian and Japanese net imports increase by 64 tmt and 11 tmt respectively in the full
liberalization scenario, because of the elimination of import tariffs. With the full removal
of all distortions, Argentina and Australia increase their exports by 258 and 13 percent
respectively because of the decreased domestic consumptions.
New Zealand exports increase by only 3 percent. Finally, the European Union cheese
price decreases by 10 percent, while U.S., Australian, and New Zealand prices increase
by about 4 percent, 13 percent, and 13 percent, respectively.

The Doha Round of the WTO: Appraising Further Liberalization of Agricultural Markets / 27
Nonfat Dry Milk. World SMP prices increase about 30 percent in the full liberaliza-
tion scenario and by 28 percent with trade-only liberalization (Tables A.37 and A.38).
World total SMP trade increases by 6 percent in the full liberalization scenario and by 12
percent with trade-only liberalization. The main source of the difference is the lower level
of E.U. exports in the full liberalization scenario, as the elimination of intervention results
in lower E.U. production and exports.
With the removal of all distortions, exports increase in Argentina (32 percent),
Australia (29 percent), New Zealand (16 percent), and the United States (62 percent).
Under trade-only liberalization, exports increase in Argentina (24 percent), Australia (26
percent), New Zealand (8 percent), and India (13 percent). Exports increase in the
European Union and the United States by 4 percent and 48 percent, respectively.
With the additional elimination of intervention, E.U. net exports disappear. The
difference in outcomes in the European Union is striking. Without domestic support and
despite higher world prices, the Europen Union becomes a marginal exporter of SMP.
Under both scenarios, Canada becomes a net importer, with import levels of about 46 tmt
in the full liberalization scenario and 30 tmt in the trade-only liberalization scenario. Brazil
decreases its net imports under trade-only liberalization by 76 percent and even becomes a
marginal exporter with the removal of all distortions. Imports in South Korea and Indonesia
increase under both scenarios (21 tmt and 14.8 tmt respectively in the full liberalization
scenario), because of the elimination of import tariffs offsetting higher world SMP prices.
Domestic prices of SMP increase in the European Union (6 percent), Australia (28
percent), and New Zealand (28 percent) in the full liberalization scenario and by comparable
magnitudes in the trade-only liberalization scenario (6.6 percent, 16.2 percent, and 16.2 percent,
respectively).
Whole Milk Powder. With the removal of all distortions, world WMP prices increase
by about 26 percent above baseline levels under both scenarios. World total WMP trade
increases by 6 percent with the full removal of all distortions while with trade-only
liberalization, aggregate WMP trade increases by 4 percent (Tables A.39 and A.40).
Under the full liberalization scenario, exports increase in Argentina (16 percent),
Australia (14 percent), and New Zealand (3 percent). Trade-only liberalization provides
comparable export outcomes.

28 / FAPRI Staff
E.U. exports decrease by 13 percent with the removal of all distortions because of
the elimination of export subsidies and intervention support for butter and SMP and other
domestic programs. China becomes a net exporter of WMP. Its 37 tmt of net imports in
the baseline become 126 tmt of net exports under full liberalization and 34 tmt of net
exports under trade-only liberalization. This obviously is a large number compared to
current levels. Future development of the Chinese dairy industry and trade negotiations
will help assess this conjecture on expansion.
The E.U. WMP price decreases by 7 percent, while Australian and New Zealand
prices increase 12 percent and 29 percent respectively under the full liberalization
scenario. Trade-only liberalization brings comparable price changes.
Livestock Markets
In livestock markets, higher prices result from both scenarios, as tariff elimination
results in an expansion in demand. Price impacts are smaller under the full liberalization
scenario than under the trade-only liberalization scenario, as the lower feed prices in the
full liberalization scenario reduce livestock production costs, stimulating livestock
production. In the full liberalization scenario, the removal of beef intervention stocks in
the European Union further limits potential livestock price increases in the short run.
Some of the beef stock ends up in the export market, increasing the excess supply of beef.
Consequently, the world beef price decreases in 2002 by 1.6 percent. This triggers a beef
price path that reflects the cycles inherent in this sector.
World trade levels in both scenarios are higher than baseline levels. Over the 2002–
2011 period, trade in all three meats increases; pork has the largest increase, at 28.4
percent, followed by poultry at 18.9 percent, and beef at 9.1 percent in the main scenario.
Average trade levels in the trade-only liberalization scenario are almost identical,
suggesting that the trade impacts of domestic programs on the meat sector are small.
Traditional exporters such as Argentina, Brazil, and the United States increase meat
exports because of higher world prices. In the full liberalization scenario, E.U. exports
increase slightly in 2002 as beef intervention stock is released to the export market.
Thereafter, E.U. exports decline by around 500 tmt annually as support both in the beef
and dairy sectors is terminated. Removing border distortions results in lower domestic
prices in most high-cost exporting countries, leading to a reduction in domestic
The Doha Round of the WTO: Appraising Further Liberalization of Agricultural Markets / 29
production and an increase in domestic consumption of meat products. Importing
countries (Japan, Korea, and the Philippines) increase their demand for meat products as
domestic production declines, while consumption increases with the decrease in domestic
prices resulting from the removal of border distortions. Some importing countries (e.g.,
Mexico and Hong Kong) with already low duties reduce their meat imports, as the
increase in world prices more than offsets the reduction of their duties.
In the full liberalization scenario, the average annual increase in the Nebraska fed
steer price is 3.8 percent, with the largest increases occurring in the early years of the
baseline because of high excess demand together with lower excess supply. In the
following years, buildup of inventory caused by the price increases eventually pushes
the beef price down below baseline levels in 2007–09. The beef price rises again and
ends at 2.8 percent above the reference level in 2011. In the trade-only liberalization
scenario, the same patterns emerge, although slightly more pronounced. The pork price
increases relative to the baseline throughout the simulation period, with an average
annual increase of 10.3 percent. The broiler price (U.S. 12-city price) also increases
throughout the simulation period, with an average annual increase of 7.46 percent
above baseline levels.
Beef. U.S. beef sector exports increase by 626 tmt (average annual increase above
baseline) (Tables A.41 and A.42). Other big “winners” are Argentina, with an expansion
of 40.3 percent (135 tmt) and Australia, whose exports increase 9.5 percent (138 tmt). In
the trade-only liberalization scenario, the export winners in the beef market remain the
same, but the magnitudes of the export expansion differ, with Argentina at 35.0 percent,
Australia at 7.9 percent, Brazil at 7.2 percent, and New Zealand at 4.4 percent. Except for
the first year (2002), the U.S. is a net exporter throughout the simulation period, reaching
a peak of 743 tmt in 2009.
The European Union loses significant market share, with a reversal of trade
pattern from exporter to major importer starting in 2004. The average annual increase
in E.U. net imports is 467 tmt above baseline levels. Under the trade-only
liberalization scenario, E.U. net exports decline on average by 55.5 percent; however,
no trade reversal occurs because only duties on imports and subsidized exports are
eliminated but domestic support remains in place for beef and dairy sectors. Without

30 / FAPRI Staff
the current large government payments, E.U. beef production falls more dramatically
in the full liberalization scenario. A significant number of beef cattle come from the
dairy sector.
Under the full liberalization scenario, China increases its imports of beef by 165 tmt
on average over the projection period. Japan and the Philippines increase imports of beef
as their respective 39 percent and 40 to 44 percent duties are removed. Japan’s imports
increase by 20 percent (21 percent for the trade-only liberalization scenario) and the
Philippines’ imports increase by 72 percent (74 percent in the trade-only liberalization
scenario). Mexico’s beef imports decline by 18 percent in the full liberalization scenario
(15 percent in the trade-only liberalizationscenario) because its beef sector is already
liberalized in the baseline and it faces a higher world beef price. The tariff-only scenario
induces higher beef prices and higher feed prices.
Pork. Under the full liberalization scenario, aggregate exports of pork increase by 28
percent. Brazil, Canada, and the United States gain market shares in this sector, as their
respective net exports increase by 61 percent, 41 percent, and 188 percent (Tables A.43
and A.44). With its very large domestic swine-pork sector, China increases its imports
significantly with removal of a modest import duty (average annual increase of 311 tmt
above baseline). This tendency is accentuated under the trade-only liberalization scenario
because feed prices are higher. Chinese pork imports reach 725 tmt in 2011 in the latter
scenario compared to 229 tmt in the baseline.
Removal of safeguard provisions limiting Japan’s pork imports results in a 26
percent increase in pork imports relative to the baseline under both scenarios. With the
removal of high tariffs, South Korea increases its imports by 77 percent above baseline
levels. Mexico’s imports decline by 11 percent as it faces higher world pork prices.
Poultry. The United States, Brazil, and Thailand make significant gains in the export
market in both scenarios. Their net exports increase by 25 percent, 24 percent, and 42
percent respectively in the full liberalization scenario (Tables A.45 and A.46). Similar
figures emerge for the trade-only scenario.
The removal of duties and subsidization results in a decline of 47 percent in net
exports from the European Union. Net exports relative to the baseline drop to 459 tmt in
2011 in the full liberalization scenario.

The Doha Round of the WTO: Appraising Further Liberalization of Agricultural Markets / 31
The removal of prohibitive duties on imports outside the NAFTA TRQ turns Canada
into a large net importer of poultry; it reaches 298 tmt in 2011 compared to 25 tmt in the
baseline. Japan’s broiler imports decline by 12 percent under both scenarios, as the
removal of its already low duties is offset by the rise in the world poultry price. Also,
much higher duties are removed in beef and pork, causing a drop in their relative prices
and hence a decrease in poultry consumption. The removal of a 45 percent duty in the
Philippines increases its imports, with totals reaching 216 tmt in the full liberalization
scenario in 2011 compared to 86 tmt in the baseline.
Conclusions
Terms-of-trade effects are quite substantial but heterogeneous, with big and small
changes. Most world prices increase under both scenarios, except for oilseed meals.
Dairy prices exhibit the highest increases, followed by those in the meat and crops
categories. A striking pattern is that the removal of domestic farm programs in aggregate
does not have much impact on world prices with the exception of butter and cotton under
free trade. Therefore, the contention that domestic farm programs depress world prices
should be qualified carefully in light of this important result (much of which is due to the
effect of set-aside on E.U. grain production).
Trade flows are significantly affected by both domestic and trade distortions.
Domestic distortions have the strongest effects in dairy markets, in which protection and
production subsidies are substantial in many countries. Other markets are also affected.
Immense changes in trade occur in highly protected markets such as oilseed and oil
markets in India and meat markets in the Philippines, resulting in big gains for
consumers.
Significant production expansions occur in countries that are natural exporters, such
as Brazil, Argentina, Australia, and other countries competing with the United States on
world markets. Under both scenarios, there is a shift from feed-grain trade to feed-
intensive, value-added product trade and to increased feed use among traditional meat
exporters. Under both scenarios, the United States emerges as a major winner in terms of
meat export markets. The removal of domestic programs mitigates the feed price increase
brought about by trade liberalization alone and provides an additional stimulus to

32 / FAPRI Staff
livestock and poultry production. In addition to the United States, Argentina, Brazil,
Canada, and Thailand expand their meat and/or poultry product and exports significantly.
Net trade of all dairy products increases under both scenarios except for cheese under
the trade-only liberalization scenario. Argentina, Australia, and New Zealand expand
exports. E.U. exports of all dairy products decrease drastically under the full removal of
all distortions. The United States reduces its imports of cheese significantly under trade
liberalization and increases its exports of SMP. Canada becomes a net importer of all
dairy products under both scenarios because of the increased consumption and decreased
milk production. Dairy producers in the European Union, Canada, and, to some extent,
the United States lose from the removal of domestic programs.
Given the computed impacts in our full liberalization scenario modeling exercise,
the U.S. livestock sector gains, as livestock prices increase (by 3.2 percent in beef, 10.3
percent in pork, and 7.5 percent in poultry) more than do feed prices (5.7 percent in
corn and 3.8 percent in soymeal). Expansion in production by 4 to 5 percent in response
to favorable prices also contributes to livestock revenue expansion. The dairy sector
also gains as the increase in world dairy product prices (at 39.5 percent in butter, 22.3
percent in cheese, 30.5 percent in nonfat dry milk, and 25.6 percent in WMP) mutes the
impact of the removal of the milk support price in the United States. The milk price
increases slightly while milk production remains almost unchanged. The higher value
of beef products coming from the dairy sector also contributes to the sector’s favorable
revenue effect. On the crop side, though, the modest price increases are not enough to
offset lost payments for most producers. The share of combined PFC and LDP
payments to revenue varies across crops, from a low 2 percent share in oats, a 6 to 10
percent share for most of the other grains and soybeans, to a high 20 to 45 percent share
in cotton and rice. As expected, total revenue drops for wheat, corn, sorghum, barley,
peanuts, soybeans, cotton, and rice. Higher prices for wheat (up 4.7 percent), corn (up
5.7 percent), sorghum (up 6.8 percent), barley (up 6.5 percent), and oats (up 4.5
percent) and production adjustments for crops less affected by the removal of program
payments increase their revenue from marketing, thereby moderating the drop in total
gross revenue in the crop sector. A major caveat is that although the direction of these
hypothetical changes in returns and income is meaningful, their magnitudes are

The Doha Round of the WTO: Appraising Further Liberalization of Agricultural Markets / 33
inadequate for policy debate purposes since our analysis does not include the provisions
of new U.S. farm legislation.
Net agricultural consumers in low-duty countries are worse off because price
increases are substantial. Their net agricultural consumption is taxed under the new terms
of trade. However, the many consumers in highly protected net-importing countries (e.g.,
the Philippines, Japan, and Korea) are better off, as the unit cost of most food items
decreases. Under full integration of food markets and trade in these countries, consumers’
gains would be even greater. However, there remain large transaction costs between
world prices and domestic prices, created by uncompetitive practices and market
structures in importing and retailing sectors.
Finally, we want to re-emphasize the “academic” nature of our modeling exercise; it
is useful primarily in identifying issues of contention for further analysis and model
development. We are posing questions to our model—about full removal of distortions—
which are much beyond the usual scope of more modest deviations implied by limited
policy changes. Thus, in the context of information provision to negotiators and other
policymakers, this report is only a first step in a larger research effort that will require
more consultation, model adjustment, and refinement.

Endnote
1. In the FAPRI 2002 baseline, public intervention stocks and special purchase scheme
in storage increased mostly in 2002, with another small increase in 2003 to offset the termination of the OTMS.

References
Anderson, K., B. Dimaran, J. Francois, T. Hertel, B. Hoekman, and W. Martin. 2001. “The Cost of Rich (and Poor) Country Protection to Developing Countries.” CIES Discussion Paper No. 136, Centre for International Economic Studies, Adelaide, September.
Beghin J., D. Roland-Holst, and D. van der Mensbrugghe. Forthcoming. “How Will Agricultural Trade Reforms in High-Income Countries Affect the Trading Relationships of Developing Countries?” In Agriculture, Trade, and Poverty: Making Policy Analysis Count. Paris: Organization for Economic Cooperation and Development Publications.
Burfisher, M.E., ed. 2001. Agricultural Policy Reform in the WTO—The Road Ahead. Washington, D.C.: U.S. Department of Agriculture, Economic Research Service, Market and Trade Economics Division, AER 802, May.
Diao, X., T. Roe, and A. Somwaru. 2002. “Developing Country Interests in Agricultural Reforms under the World Trade Organization.” TMD Discussion Paper No 85, International Food Policy Research Institute, Washington, D.C., January.
Food and Agricultural Policy Research Institute (FAPRI) 2002. FAPRI 2002 World Agricultural Outlook. Ames, IA: Iowa State University and University of Missouri-Columbia, Staff Report 1-02, January.
Francois, J. 2000. “Modelling the Impact of WTO Negotiations on EU Agriculture: An Application of the GTAP Model.” Mimeo, Erasmus University, Rotterdam, September.
Hoekman, B., and K. Anderson. 2000. “Developing Country Agriculture and the New Trade Agenda.” Economic Development and Cultural Change 48(3, April): 171-80.
Kennedy, L., J. Dyck, L. Brink, and D. MacLaren. 2001. “Domestic Support: Issues and Options in the Agricultural Negotiations.” IATRC Commissioned Paper No. 16, International Agricultural Trade Research Consortium, University of Minnesota, May.
Martin, W., and A. Winters, eds. 1996. The Uruguay Round and the Developing Countries. New York: Cambridge University Press.
Matthews, A. 2002. Les Pays en développement et les négociations de l’OMC sur la libéralisation des échanges agricoles.” Économie Rurale 267(January-February): 5-18.
Organization for Economic Cooperation and Development (OECD). 2001. Agricultural Policies in OECD Countries: Monitoring and Evaluation 2001. Paris: OECD Publications.
Tangermann, S. 2001. “L’Accord sur l’Agriculture de l’Uruguay Round fonctionne-t-il?” Economie Internationale 87(3): 15-44.
World Bank. 2001. Global Economic Prospects and the Developing Countries 2002. Washington, D.C.: The World Bank, October.

36 / FAPRI Staff
World Trade Organization (WTO) 2001. Ministerial Conference, Fourth Session, Doha, Qatar, 9–14 November 2001. Ministerial Declaration, WT/MIN(01)/DEC/120. November.
———. Various. “Notification.” Various issues (G/AG/N/series). Committee on Agriculture. http://docsonline.wto.org/ (accessed October 2002).
Appendix A
Impacts of the Full Liberalization Scenario
Tables A.1 and A.2 give selected policies in selected countries. Tables A.3 through
A.46 present the impacts of the full liberalization scenario on price, trade, production,
and consumption.
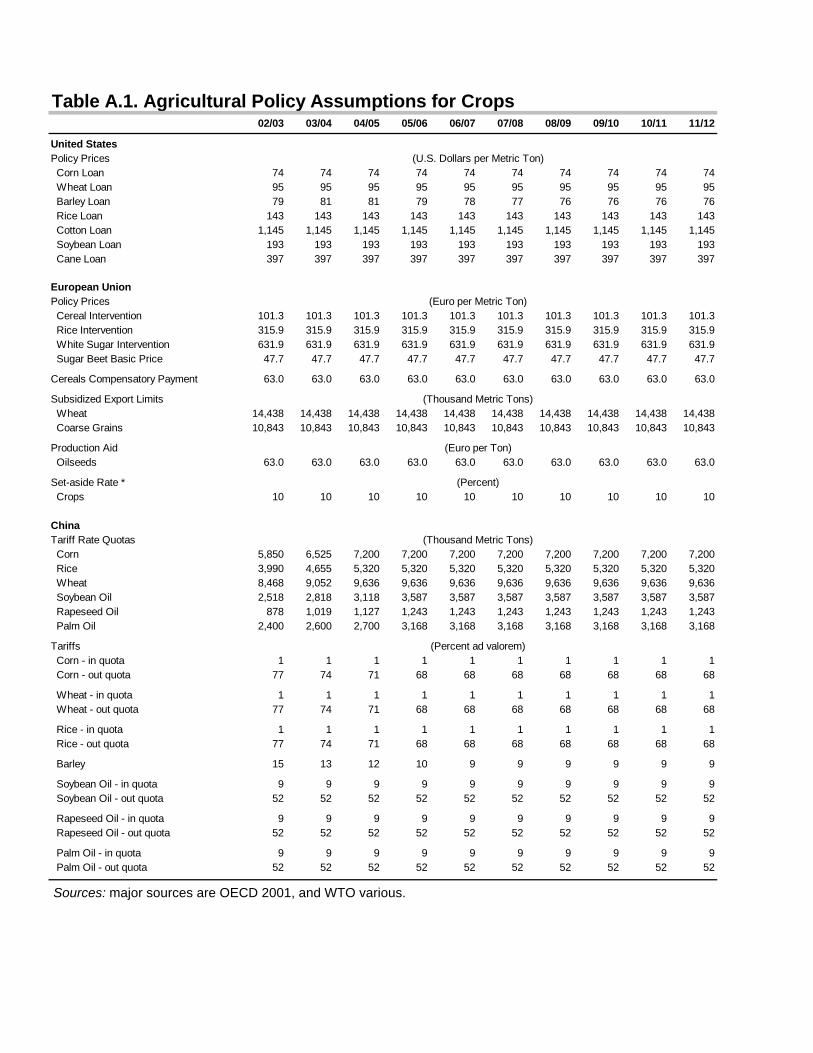
Table A.1. Agricultural Policy Assumptions for Crops02/03 03/04 04/05 05/06 06/07 07/08 08/09 09/10 10/11 11/12
United StatesPolicy Prices Corn Loan 74 74 74 74 74 74 74 74 74 74 Wheat Loan 95 95 95 95 95 95 95 95 95 95 Barley Loan 79 81 81 79 78 77 76 76 76 76 Rice Loan 143 143 143 143 143 143 143 143 143 143 Cotton Loan 1,145 1,145 1,145 1,145 1,145 1,145 1,145 1,145 1,145 1,145 Soybean Loan 193 193 193 193 193 193 193 193 193 193 Cane Loan 397 397 397 397 397 397 397 397 397 397
European UnionPolicy Prices Cereal Intervention 101.3 101.3 101.3 101.3 101.3 101.3 101.3 101.3 101.3 101.3 Rice Intervention 315.9 315.9 315.9 315.9 315.9 315.9 315.9 315.9 315.9 315.9 White Sugar Intervention 631.9 631.9 631.9 631.9 631.9 631.9 631.9 631.9 631.9 631.9 Sugar Beet Basic Price 47.7 47.7 47.7 47.7 47.7 47.7 47.7 47.7 47.7 47.7
Cereals Compensatory Payment 63.0 63.0 63.0 63.0 63.0 63.0 63.0 63.0 63.0 63.0
Subsidized Export Limits Wheat 14,438 14,438 14,438 14,438 14,438 14,438 14,438 14,438 14,438 14,438 Coarse Grains 10,843 10,843 10,843 10,843 10,843 10,843 10,843 10,843 10,843 10,843
Production Aid Oilseeds 63.0 63.0 63.0 63.0 63.0 63.0 63.0 63.0 63.0 63.0
Set-aside Rate * Crops 10 10 10 10 10 10 10 10 10 10
ChinaTariff Rate Quotas Corn 5,850 6,525 7,200 7,200 7,200 7,200 7,200 7,200 7,200 7,200 Rice 3,990 4,655 5,320 5,320 5,320 5,320 5,320 5,320 5,320 5,320 Wheat 8,468 9,052 9,636 9,636 9,636 9,636 9,636 9,636 9,636 9,636 Soybean Oil 2,518 2,818 3,118 3,587 3,587 3,587 3,587 3,587 3,587 3,587 Rapeseed Oil 878 1,019 1,127 1,243 1,243 1,243 1,243 1,243 1,243 1,243 Palm Oil 2,400 2,600 2,700 3,168 3,168 3,168 3,168 3,168 3,168 3,168
Tariffs Corn - in quota 1 1 1 1 1 1 1 1 1 1 Corn - out quota 77 74 71 68 68 68 68 68 68 68
Wheat - in quota 1 1 1 1 1 1 1 1 1 1 Wheat - out quota 77 74 71 68 68 68 68 68 68 68
Rice - in quota 1 1 1 1 1 1 1 1 1 1 Rice - out quota 77 74 71 68 68 68 68 68 68 68
Barley 15 13 12 10 9 9 9 9 9 9
Soybean Oil - in quota 9 9 9 9 9 9 9 9 9 9 Soybean Oil - out quota 52 52 52 52 52 52 52 52 52 52
Rapeseed Oil - in quota 9 9 9 9 9 9 9 9 9 9 Rapeseed Oil - out quota 52 52 52 52 52 52 52 52 52 52
Palm Oil - in quota 9 9 9 9 9 9 9 9 9 9 Palm Oil - out quota 52 52 52 52 52 52 52 52 52 52
(Percent)
(Thousand Metric Tons)
(Percent ad valorem)
(U.S. Dollars per Metric Ton)
(Euro per Metric Ton)
(Euro per Ton)
(Thousand Metric Tons)
Sources: major sources are OECD 2001, and WTO various.

Table A.2. Agricultural Policy Assumptions for Livestock and Dairy Products2002 2003 2004 2005 2006 2007 2008 2009 2010 2011
European Union Policy Prices
Safety Net Intervention 1,560 1,560 1,560 1,560 1,560 1,560 1,560 1,560 1,560 1,560 Pork Basic 1,510 1,510 1,510 1,510 1,510 1,510 1,510 1,510 1,510 1,510
Tariff Rate Quota Beef 144 144 144 144 144 144 144 144 144 144 Pork 76 76 76 76 76 76 76 76 76 76 Poultry 30 30 30 30 30 30 30 30 30 30
GATT Maximum Subsidized Exports Beef 822 822 822 822 822 822 822 822 822 822 Pork 444 444 444 444 444 444 444 444 444 444 Poultry 286 286 286 286 286 286 286 286 286 286
Milk Delivery Quota: E-15 119 119 119 119 120 120 120 120 120 120
Target Price for Milk 310 310 310 301 284 266 257 257 257 257 Intervention Price for Butter 3,282 3,282 3,282 3,118 2,954 2,790 2,790 2,790 2,790 2,790 Intervention Price for SMP 2,055 2,055 2,055 1,952 1,850 1,747 1,747 1,747 1,747 1,747
GATT Maximum
Subsidized Exports Butter 399 399 399 399 399 399 399 399 399 399 SMP 273 273 273 273 273 273 273 273 273 273 Cheese 321 321 321 321 321 321 321 321 321 321 Other Milk Products 958 958 958 958 958 958 958 958 958 958
Import TariffsJapan Beef 39 39 39 39 39 39 39 39 39 39 Pork 4 4 4 4 4 4 4 4 4 4 Poultry 9 9 9 9 9 9 9 9 9 9
China Beef 34 23 12 12 12 12 12 12 12 12 Pork 17 15 12 12 12 12 12 12 12 12 Poultry 17 13 10 10 10 10 10 10 10 10 Lamb-Mutton 20 18 15 15 15 15 15 15 15 15 Egg 23 22 20 20 20 20 20 20 20 20
South Korea Beef 41 41 40 40 40 40 40 40 40 40 Pork 25 25 25 25 25 25 25 25 25 25 Broiler 20 20 20 20 20 20 20 20 20 20
Philippines Beef 44 42 40 40 40 40 40 40 40 40 Pork 30 30 30 30 30 30 30 30 30 30 Poultry 45 45 45 45 45 45 45 45 45 45
(Percent ad valorem)
(Thousand Metric Tons)
(Euro per Metric Ton)
(Million Metric Tons)
(Euro per Metric Ton)
(Thousand Metric Tons)
Sources: major sources are OECD 2001, and WTO various.

Table A.3. Wh
World Price Baseline
Change
% chg
Total Trade Baseline
Change
% chg
Exports of Selected CouArgentina Baseline
Change
% chg
Australia Baseline
Change
% chg
Canada Baseline
Change
% chg
European Union Baseline
Change
% chg
Hungary Baseline
Change
% chg
Russia Baseline
Change
% chg
Ukraine Baseline
Change
% chg
United States Baseline
Change
% chg
Imports of Selected CouJapan Baseline
Change
% chg
China Baseline
Change
% chg
India Baseline
Change
% chg
heat Price and Trade02/03 03/04 04/05 05/06 06/07 07/08 08/09 09/10 10/11 11/12 Average
130.98 133.09 137.41 138.10 142.66 144.79 148.05 150.12 154.39 156.22
3.8 5.5 6.1 7.4 6.2 7.7 6.9 8.1 7.9 9.3 6.89
2.90% 4.16% 4.45% 5.39% 4.32% 5.34% 4.63% 5.37% 5.12% 5.97% 4.77%
89,345 91,166 94,140 97,724 100,537 103,208 105,882 108,856 112,441 115,312
5,445.0 9,539.8 8,918.7 8,257.8 8,273.9 8,149.0 8,159.7 7,995.8 7,913.4 7,634.3 8,028.73
6.09% 10.46% 9.47% 8.45% 8.23% 7.90% 7.71% 7.35% 7.04% 6.62% 7.93%
ountries
13,619 14,507 15,048 15,608 15,937 16,503 16,903 17,400 17,808 18,354
16.4 84.4 275.3 230.7 328.1 241.9 353.7 293.4 372.7 351.3 254.80
0.12% 0.58% 1.83% 1.48% 2.06% 1.47% 2.09% 1.69% 2.09% 1.91% 1.53%
16,743 16,812 17,108 17,528 17,954 18,342 18,703 19,103 19,518 19,954
47.6 2.0 92.1 79.3 94.0 78.9 96.0 86.6 94.8 91.1 76.25
0.28% 0.01% 0.54% 0.45% 0.52% 0.43% 0.51% 0.45% 0.49% 0.46% 0.41%
17,595 17,645 17,968 18,135 18,348 18,490 18,663 18,753 18,854 18,906
122.6 213.1 239.7 303.9 262.6 290.2 253.4 284.4 286.1 338.3 259.43
0.70% 1.21% 1.33% 1.68% 1.43% 1.57% 1.36% 1.52% 1.52% 1.79% 1.41%
11,525 12,727 13,691 15,749 16,586 17,574 18,478 19,944 21,519 22,756
5,225.0 6,769.1 5,925.6 5,773.6 6,383.0 6,517.9 6,912.3 6,947.6 7,055.4 6,924.1 6,443.37
45.34% 53.19% 43.28% 36.66% 38.49% 37.09% 37.41% 34.84% 32.79% 30.43% 38.95%
2,035 2,006 1,991 2,013 2,041 2,072 2,099 2,126 2,157 2,189
18.6 78.2 64.4 40.8 33.5 21.5 12.0 5.8 8.3 11.2 29.43
0.91% 3.90% 3.23% 2.03% 1.64% 1.04% 0.57% 0.27% 0.38% 0.51% 1.45%
763 695 964 990 1,184 1,291 1,451 1,527 1,693 1,742
70.5 -22.9 116.5 69.0 19.3 -13.3 -18.2 11.9 57.6 140.3 43.06
9.25% -3.30% 12.08% 6.97% 1.63% -1.03% -1.26% 0.78% 3.40% 8.05% 3.66%
2,570 2,551 2,822 3,019 3,120 3,191 3,242 3,282 3,376 3,479
-98.8 -88.4 -91.6 -127.6 -129.6 -144.2 -149.7 -152.6 -142.2 -262.6 -138.71
-3.84% -3.46% -3.24% -4.23% -4.15% -4.52% -4.62% -4.65% -4.21% -7.55% -4.45%
23,840 23,613 23,983 24,122 24,830 25,226 25,843 26,241 27,041 27,472
139.8 2,573.6 2,340.1 1,922.4 1,317.5 1,190.8 742.5 557.4 214.9 68.8 1,106.78
0.59% 10.90% 9.76% 7.97% 5.31% 4.72% 2.87% 2.12% 0.79% 0.25% 4.53%
untries
5,326 5,327 5,326 5,323 5,319 5,313 5,305 5,295 5,283 5,268
-58.8 -37.5 -67.4 -65.8 -73.4 -74.7 -77.1 -78.5 -82.4 -86.1 -70.17
-1.10% -0.70% -1.27% -1.24% -1.38% -1.41% -1.45% -1.48% -1.56% -1.63% -1.32%
1,343 2,303 4,478 5,336 5,700 5,465 5,413 5,084 5,851 5,340
-54.9 -343.9 -590.9 -701.9 -585.9 -523.9 -420.8 -345.2 -217.8 -164.1 -394.95
-4.09% -14.93% -13.20% -13.16% -10.28% -9.59% -7.77% -6.79% -3.72% -3.07% -8.66%
-3,093 -2,724 -2,449 -2,245 -1,531 -1,087 -513 122 707 1,295
2,484.2 4,782.1 4,736.9 4,406.8 4,183.4 4,019.5 3,788.8 3,618.1 3,385.8 3,161.7 3,856.73
-80.31% -175.5% -193.5% -196.3% -273.3% -369.7% -739.2% 2953.7% 479.1% 244.10% 164.90%
(U.S. Dollars per Metric Ton)
(Thousand Metric Tons)

Table A.4. Wh
ArgentinaProduction
Baseline
Change
% chg
Consumption
Baseline
Change
% chg
CanadaProduction
Baseline
Change
% chg
Consumption
Baseline
Change
% chg
European UnionProduction
Baseline
Change
% chg
Consumption
Baseline
Change
% chg
ChinaProduction
Baseline
Change
% chg
Consumption
Baseline
Change
% chg
IndiaProduction
Baseline
Change
% chg
Consumption
Baseline
Change
% chg
United StatesProduction
Baseline
Change
% chg
Consumption
Baseline
Change
% chg
heat Production and Consumption02/03 03/04 04/05 05/06 06/07 07/08 08/09 09/10 10/11 11/12 Average
17,512 18,311 18,809 19,365 19,696 20,270 20,678 21,184 21,591 22,141
0.0 53.0 234.4 182.5 283.8 194.9 307.8 241.1 315.2 283.1 209.57
0.00% 0.29% 1.25% 0.94% 1.44% 0.96% 1.49% 1.14% 1.46% 1.28% 1.02%
3,950 3,820 3,775 3,762 3,773 3,776 3,786 3,792 3,797 3,795
-5.8 -25.0 -38.5 -44.2 -47.3 -42.9 -47.9 -49.0 -57.6 -64.1 -42.24
-0.15% -0.65% -1.02% -1.17% -1.25% -1.14% -1.26% -1.29% -1.52% -1.69% -1.12%
25,745 26,338 26,933 27,402 27,535 27,862 28,068 28,323 28,491 28,823
0.0 119.0 282.4 335.7 432.2 386.0 440.8 402.8 442.2 435.5 327.67
0.00% 0.45% 1.05% 1.23% 1.57% 1.39% 1.57% 1.42% 1.55% 1.51% 1.17%
8,359 8,547 8,710 8,949 9,098 9,250 9,337 9,480 9,630 9,828
7.9 -0.2 60.1 66.2 117.8 128.6 159.6 150.9 155.9 142.1 98.88
0.09% 0.00% 0.69% 0.74% 1.29% 1.39% 1.71% 1.59% 1.62% 1.45% 1.06%
105,143 107,010 108,194 109,563 111,227 112,780 114,131 115,434 117,126 118,560
6,250.3 6,856.1 5,505.9 5,154.8 4,934.2 4,624.2 4,310.8 4,158.0 3,896.5 3,741.5 4,943.22
5.94% 6.41% 5.09% 4.70% 4.44% 4.10% 3.78% 3.60% 3.33% 3.16% 4.45%
92,729 93,049 94,613 94,341 94,588 94,758 95,336 95,424 95,479 95,579
561.6 245.8 -429.8 -592.9 -1,257.1 -1,700.8 -2,371.3 -2,636.5 -3,034.1 -3,134.3 -1,434.96
0.61% 0.26% -0.45% -0.63% -1.33% -1.79% -2.49% -2.76% -3.18% -3.28% -1.50%
105,357 105,436 107,919 110,447 111,415 112,953 113,467 114,454 115,317 116,813
0.0 255.3 708.9 567.2 617.0 408.5 474.9 354.3 373.8 257.4 401.73
0.00% 0.24% 0.66% 0.51% 0.55% 0.36% 0.42% 0.31% 0.32% 0.22% 0.36%
113,439 114,043 114,464 115,570 116,217 117,270 118,063 118,967 119,530 120,443
-48.6 -257.0 -138.7 -137.5 39.7 -17.2 70.9 73.5 190.2 156.6 -6.81
-0.04% -0.23% -0.12% -0.12% 0.03% -0.01% 0.06% 0.06% 0.16% 0.13% -0.01%
67,635 68,744 69,509 70,876 71,018 71,878 72,378 73,062 73,510 74,309
0.0 -3,101.1 -2,968.6 -2,903.5 -2,519.5 -2,612.4 -2,292.1 -2,315.3 -2,056.4 -2,003.6 -2,277.25
0.00% -4.51% -4.27% -4.10% -3.55% -3.63% -3.17% -3.17% -2.80% -2.70% -3.19%
66,049 67,193 67,919 69,254 70,187 71,415 72,465 73,734 74,775 76,095
2,137.9 1,740.3 1,805.9 1,553.4 1,657.0 1,454.4 1,495.3 1,339.8 1,339.3 1,195.3 1,571.85
3.24% 2.59% 2.66% 2.24% 2.36% 2.04% 2.06% 1.82% 1.79% 1.57% 2.24%
58,157 59,107 59,362 60,417 60,941 62,007 62,693 63,706 64,385 65,409
0.0 2,976.8 2,468.6 1,703.5 1,584.9 1,061.8 969.6 484.4 346.7 -56.1 1,154.02
0.00% 5.04% 4.16% 2.82% 2.60% 1.71% 1.55% 0.76% 0.54% -0.09% 1.91%
34,997 35,664 35,687 36,300 36,334 36,828 36,990 37,502 37,524 37,969
269.2 -70.9 132.8 -7.2 265.6 34.2 234.7 71.4 169.7 18.6 111.82
0.77% -0.20% 0.37% -0.02% 0.73% 0.09% 0.63% 0.19% 0.45% 0.05% 0.31%
(Thousand Metric Tons)
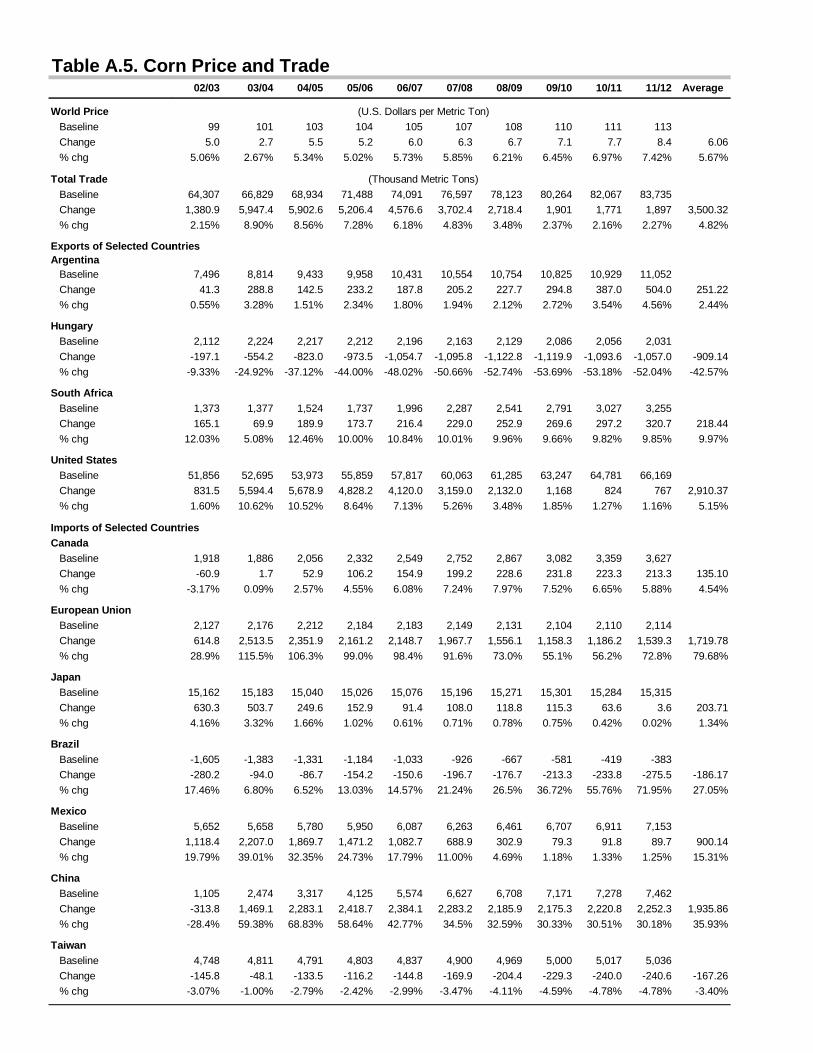
Table A.5. Cor
World Price Baseline
Change
% chg
Total Trade Baseline
Change
% chg
Exports of Selected CounArgentina Baseline
Change
% chg
Hungary Baseline
Change
% chg
South Africa Baseline
Change
% chg
United States Baseline
Change
% chg
Imports of Selected CounCanada Baseline
Change
% chg
European Union Baseline
Change
% chg
Japan Baseline
Change
% chg
Brazil Baseline
Change
% chg
Mexico Baseline
Change
% chg
China Baseline
Change
% chg
Taiwan Baseline
Change
% chg
rn Price and Trade02/03 03/04 04/05 05/06 06/07 07/08 08/09 09/10 10/11 11/12 Average
99 101 103 104 105 107 108 110 111 113
5.0 2.7 5.5 5.2 6.0 6.3 6.7 7.1 7.7 8.4 6.06
5.06% 2.67% 5.34% 5.02% 5.73% 5.85% 6.21% 6.45% 6.97% 7.42% 5.67%
64,307 66,829 68,934 71,488 74,091 76,597 78,123 80,264 82,067 83,735
1,380.9 5,947.4 5,902.6 5,206.4 4,576.6 3,702.4 2,718.4 1,901 1,771 1,897 3,500.32
2.15% 8.90% 8.56% 7.28% 6.18% 4.83% 3.48% 2.37% 2.16% 2.27% 4.82%
untries
7,496 8,814 9,433 9,958 10,431 10,554 10,754 10,825 10,929 11,052
41.3 288.8 142.5 233.2 187.8 205.2 227.7 294.8 387.0 504.0 251.22
0.55% 3.28% 1.51% 2.34% 1.80% 1.94% 2.12% 2.72% 3.54% 4.56% 2.44%
2,112 2,224 2,217 2,212 2,196 2,163 2,129 2,086 2,056 2,031
-197.1 -554.2 -823.0 -973.5 -1,054.7 -1,095.8 -1,122.8 -1,119.9 -1,093.6 -1,057.0 -909.14
-9.33% -24.92% -37.12% -44.00% -48.02% -50.66% -52.74% -53.69% -53.18% -52.04% -42.57%
1,373 1,377 1,524 1,737 1,996 2,287 2,541 2,791 3,027 3,255
165.1 69.9 189.9 173.7 216.4 229.0 252.9 269.6 297.2 320.7 218.44
12.03% 5.08% 12.46% 10.00% 10.84% 10.01% 9.96% 9.66% 9.82% 9.85% 9.97%
51,856 52,695 53,973 55,859 57,817 60,063 61,285 63,247 64,781 66,169
831.5 5,594.4 5,678.9 4,828.2 4,120.0 3,159.0 2,132.0 1,168 824 767 2,910.37
1.60% 10.62% 10.52% 8.64% 7.13% 5.26% 3.48% 1.85% 1.27% 1.16% 5.15%
ntries
1,918 1,886 2,056 2,332 2,549 2,752 2,867 3,082 3,359 3,627
-60.9 1.7 52.9 106.2 154.9 199.2 228.6 231.8 223.3 213.3 135.10
-3.17% 0.09% 2.57% 4.55% 6.08% 7.24% 7.97% 7.52% 6.65% 5.88% 4.54%
2,127 2,176 2,212 2,184 2,183 2,149 2,131 2,104 2,110 2,114
614.8 2,513.5 2,351.9 2,161.2 2,148.7 1,967.7 1,556.1 1,158.3 1,186.2 1,539.3 1,719.78
28.9% 115.5% 106.3% 99.0% 98.4% 91.6% 73.0% 55.1% 56.2% 72.8% 79.68%
15,162 15,183 15,040 15,026 15,076 15,196 15,271 15,301 15,284 15,315
630.3 503.7 249.6 152.9 91.4 108.0 118.8 115.3 63.6 3.6 203.71
4.16% 3.32% 1.66% 1.02% 0.61% 0.71% 0.78% 0.75% 0.42% 0.02% 1.34%
-1,605 -1,383 -1,331 -1,184 -1,033 -926 -667 -581 -419 -383
-280.2 -94.0 -86.7 -154.2 -150.6 -196.7 -176.7 -213.3 -233.8 -275.5 -186.17
17.46% 6.80% 6.52% 13.03% 14.57% 21.24% 26.5% 36.72% 55.76% 71.95% 27.05%
5,652 5,658 5,780 5,950 6,087 6,263 6,461 6,707 6,911 7,153
1,118.4 2,207.0 1,869.7 1,471.2 1,082.7 688.9 302.9 79.3 91.8 89.7 900.14
19.79% 39.01% 32.35% 24.73% 17.79% 11.00% 4.69% 1.18% 1.33% 1.25% 15.31%
1,105 2,474 3,317 4,125 5,574 6,627 6,708 7,171 7,278 7,462
-313.8 1,469.1 2,283.1 2,418.7 2,384.1 2,283.2 2,185.9 2,175.3 2,220.8 2,252.3 1,935.86
-28.4% 59.38% 68.83% 58.64% 42.77% 34.5% 32.59% 30.33% 30.51% 30.18% 35.93%
4,748 4,811 4,791 4,803 4,837 4,900 4,969 5,000 5,017 5,036
-145.8 -48.1 -133.5 -116.2 -144.8 -169.9 -204.4 -229.3 -240.0 -240.6 -167.26
-3.07% -1.00% -2.79% -2.42% -2.99% -3.47% -4.11% -4.59% -4.78% -4.78% -3.40%
(U.S. Dollars per Metric Ton)
(Thousand Metric Tons)

Table A.6. Cor
ArgentinaProduction
Baseline
Change
% chg
Consumption
Baseline
Change
% chg
HungaryProduction
Baseline
Change
% chg
Consumption
Baseline
Change
% chg
MexicoProduction
Baseline
Change
% chg
Consumption
Baseline
Change
% chg
European UnionProduction
Baseline
Change
% chg
Consumption
Baseline
Change
% chg
ChinaProduction
Baseline
Change
% chg
Consumption
Baseline
Change
% chg
United StatesProduction
Baseline
Change
% chg
Consumption
Baseline
Change
% chg
rn Production and Consumption02/03 03/04 04/05 05/06 06/07 07/08 08/09 09/10 10/11 11/12 Average
11,770 13,086 13,775 14,388 14,957 15,168 15,457 15,582 15,728 15,879
-15.9 272.2 172.1 351.6 387.7 468.2 515.5 570.6 623.7 693.9 403.96
-0.13% 2.08% 1.25% 2.44% 2.59% 3.09% 3.34% 3.66% 3.97% 4.37% 2.66%
4,329 4,305 4,358 4,442 4,539 4,629 4,711 4,769 4,811 4,840
-32.3 -20.6 42.3 120.9 204.9 265.7 290.9 278.7 241.0 194.4 158.57
-0.75% -0.48% 0.97% 2.72% 4.51% 5.74% 6.17% 5.84% 5.01% 4.02% 3.38%
7,571 7,735 7,804 7,817 7,823 7,824 7,828 7,831 7,841 7,849
0.0 -464.0 -763.0 -871.8 -935.1 -951.3 -956.3 -944.0 -929.0 -908.2 -772.27
0.00% -6.00% -9.78% -11.15% -11.95% -12.16% -12.22% -12.05% -11.85% -11.57% -9.87%
5,321 5,452 5,554 5,589 5,616 5,653 5,692 5,740 5,779 5,813
106.5 62.2 64.1 104.0 124.0 147.8 170.3 179.0 167.8 151.9 127.76
2.00% 1.14% 1.15% 1.86% 2.21% 2.61% 2.99% 3.12% 2.90% 2.61% 2.26%
18,860 19,374 19,739 20,029 20,340 20,674 21,019 21,313 21,660 21,981
0.0 -1,335.3 -1,196.7 -930.8 -691.8 -425.2 -158.3 120.1 128.3 141.9 -434.78
0.00% -6.89% -6.06% -4.65% -3.40% -2.06% -0.75% 0.56% 0.59% 0.65% -2.20%
24,560 25,038 25,508 25,971 26,423 26,935 27,468 28,016 28,563 29,129
922.0 896.2 720.0 577.1 429.5 299.4 179.8 200.1 221.6 233.0 467.88
3.75% 3.58% 2.82% 2.22% 1.63% 1.11% 0.65% 0.71% 0.78% 0.80% 1.81%
39,183 40,200 40,353 40,567 40,878 41,652 41,930 42,167 42,364 42,959
1,698.6 -1,367.7 -1,289.5 -1,801.5 -1,841.1 -2,291.5 -2,144.6 -2,172.3 -2,018.1 -2,326.5 -1,555.42
4.33% -3.40% -3.20% -4.44% -4.50% -5.50% -5.11% -5.15% -4.76% -5.42% -3.72%
41,351 42,085 42,505 42,859 42,856 43,396 43,774 44,184 44,231 44,325
1,857.7 1,271.0 1,031.2 448.4 324.2 -205.7 -517.4 -917.4 -843.9 -789.9 165.81
4.49% 3.02% 2.43% 1.05% 0.76% -0.47% -1.18% -2.08% -1.91% -1.78% 0.43%
119,443 122,440 124,984 129,403 131,434 133,640 136,490 138,636 141,102 143,410
0.0 -571.4 -1,614.1 -1,637.0 -1,810.0 -1,657.5 -1,704.2 -1,541.8 -1,647.6 -1,627.0 -1,381.06
0.00% -0.47% -1.29% -1.27% -1.38% -1.24% -1.25% -1.11% -1.17% -1.13% -1.03%
126,464 129,060 131,772 134,420 137,372 140,101 143,028 145,718 148,301 150,769
-404.6 759.3 671.5 761.9 576.5 635.8 500.7 619.0 562.9 625.3 530.82
-0.32% 0.59% 0.51% 0.57% 0.42% 0.45% 0.35% 0.42% 0.38% 0.41% 0.38%
250,384 256,021 261,505 265,741 270,455 275,225 280,369 284,217 289,264 292,933
0.0 13,500.6 9,147.1 10,285.2 8,630.3 8,428.3 7,156.0 6,471.3 5,725.6 5,843.1 7,518.74
0.00% 5.27% 3.50% 3.87% 3.19% 3.06% 2.55% 2.28% 1.98% 1.99% 2.77%
201,851 204,158 207,492 209,939 212,785 215,397 218,875 221,254 224,502 227,044
1,766.3 5,616.2 4,594.2 5,349.6 4,947.1 5,392.2 5,351.9 5,524.9 5,224.3 5,270.6 4,903.72
0.88% 2.75% 2.21% 2.55% 2.32% 2.50% 2.45% 2.50% 2.33% 2.32% 2.28%
(Thousand Metric Tons)
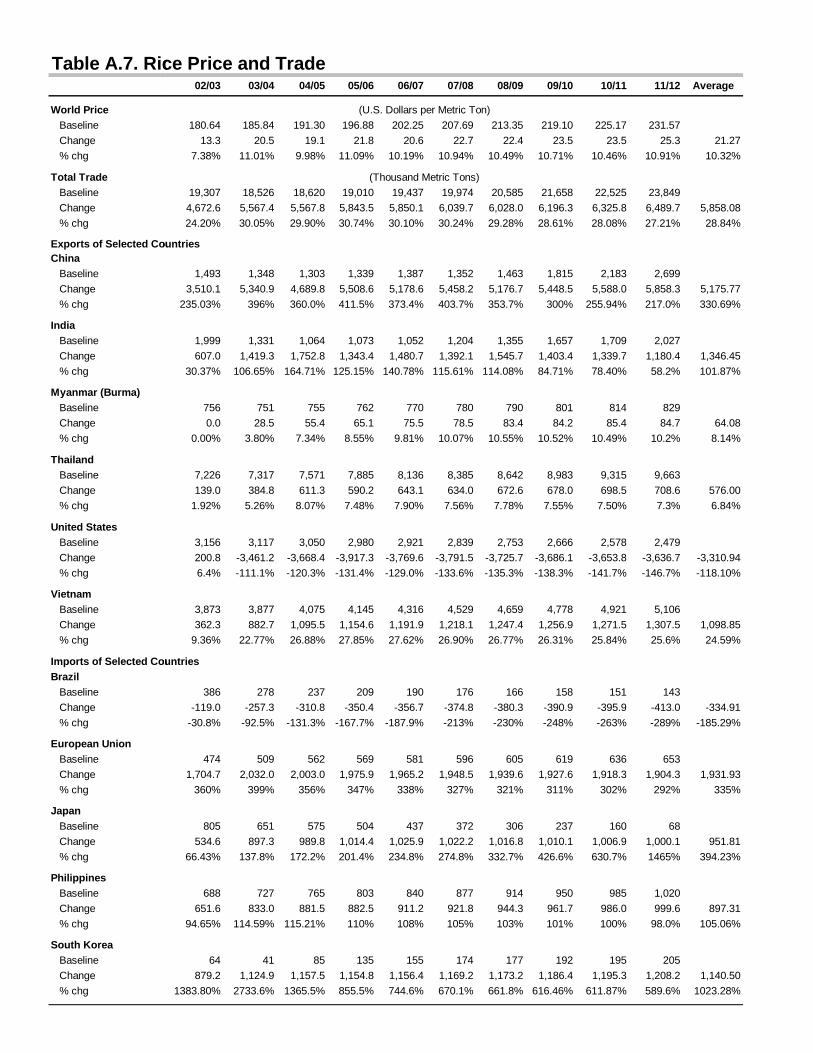
Table A.7. Ric
World Price Baseline
Change
% chg
Total Trade Baseline
Change
% chg
Exports of Selected CouChina Baseline
Change
% chg
India Baseline
Change
% chg
Myanmar (Burma) Baseline
Change
% chg
Thailand Baseline
Change
% chg
United States Baseline
Change
% chg
Vietnam Baseline
Change
% chg
Imports of Selected CouBrazil Baseline
Change
% chg
European Union Baseline
Change
% chg
Japan Baseline
Change
% chg
Philippines Baseline
Change
% chg
South Korea Baseline
Change
% chg
ce Price and Trade02/03 03/04 04/05 05/06 06/07 07/08 08/09 09/10 10/11 11/12 Average
180.64 185.84 191.30 196.88 202.25 207.69 213.35 219.10 225.17 231.57
13.3 20.5 19.1 21.8 20.6 22.7 22.4 23.5 23.5 25.3 21.27
7.38% 11.01% 9.98% 11.09% 10.19% 10.94% 10.49% 10.71% 10.46% 10.91% 10.32%
19,307 18,526 18,620 19,010 19,437 19,974 20,585 21,658 22,525 23,849
4,672.6 5,567.4 5,567.8 5,843.5 5,850.1 6,039.7 6,028.0 6,196.3 6,325.8 6,489.7 5,858.08
24.20% 30.05% 29.90% 30.74% 30.10% 30.24% 29.28% 28.61% 28.08% 27.21% 28.84%
ountries
1,493 1,348 1,303 1,339 1,387 1,352 1,463 1,815 2,183 2,699
3,510.1 5,340.9 4,689.8 5,508.6 5,178.6 5,458.2 5,176.7 5,448.5 5,588.0 5,858.3 5,175.77
235.03% 396% 360.0% 411.5% 373.4% 403.7% 353.7% 300% 255.94% 217.0% 330.69%
1,999 1,331 1,064 1,073 1,052 1,204 1,355 1,657 1,709 2,027
607.0 1,419.3 1,752.8 1,343.4 1,480.7 1,392.1 1,545.7 1,403.4 1,339.7 1,180.4 1,346.45
30.37% 106.65% 164.71% 125.15% 140.78% 115.61% 114.08% 84.71% 78.40% 58.2% 101.87%
756 751 755 762 770 780 790 801 814 829
0.0 28.5 55.4 65.1 75.5 78.5 83.4 84.2 85.4 84.7 64.08
0.00% 3.80% 7.34% 8.55% 9.81% 10.07% 10.55% 10.52% 10.49% 10.2% 8.14%
7,226 7,317 7,571 7,885 8,136 8,385 8,642 8,983 9,315 9,663
139.0 384.8 611.3 590.2 643.1 634.0 672.6 678.0 698.5 708.6 576.00
1.92% 5.26% 8.07% 7.48% 7.90% 7.56% 7.78% 7.55% 7.50% 7.3% 6.84%
3,156 3,117 3,050 2,980 2,921 2,839 2,753 2,666 2,578 2,479
200.8 -3,461.2 -3,668.4 -3,917.3 -3,769.6 -3,791.5 -3,725.7 -3,686.1 -3,653.8 -3,636.7 -3,310.94
6.4% -111.1% -120.3% -131.4% -129.0% -133.6% -135.3% -138.3% -141.7% -146.7% -118.10%
3,873 3,877 4,075 4,145 4,316 4,529 4,659 4,778 4,921 5,106
362.3 882.7 1,095.5 1,154.6 1,191.9 1,218.1 1,247.4 1,256.9 1,271.5 1,307.5 1,098.85
9.36% 22.77% 26.88% 27.85% 27.62% 26.90% 26.77% 26.31% 25.84% 25.6% 24.59%
ountries
386 278 237 209 190 176 166 158 151 143
-119.0 -257.3 -310.8 -350.4 -356.7 -374.8 -380.3 -390.9 -395.9 -413.0 -334.91
-30.8% -92.5% -131.3% -167.7% -187.9% -213% -230% -248% -263% -289% -185.29%
474 509 562 569 581 596 605 619 636 653
1,704.7 2,032.0 2,003.0 1,975.9 1,965.2 1,948.5 1,939.6 1,927.6 1,918.3 1,904.3 1,931.93
360% 399% 356% 347% 338% 327% 321% 311% 302% 292% 335%
805 651 575 504 437 372 306 237 160 68
534.6 897.3 989.8 1,014.4 1,025.9 1,022.2 1,016.8 1,010.1 1,006.9 1,000.1 951.81
66.43% 137.8% 172.2% 201.4% 234.8% 274.8% 332.7% 426.6% 630.7% 1465% 394.23%
688 727 765 803 840 877 914 950 985 1,020
651.6 833.0 881.5 882.5 911.2 921.8 944.3 961.7 986.0 999.6 897.31
94.65% 114.59% 115.21% 110% 108% 105% 103% 101% 100% 98.0% 105.06%
64 41 85 135 155 174 177 192 195 205
879.2 1,124.9 1,157.5 1,154.8 1,156.4 1,169.2 1,173.2 1,186.4 1,195.3 1,208.2 1,140.50
1383.80% 2733.6% 1365.5% 855.5% 744.6% 670.1% 661.8% 616.46% 611.87% 589.6% 1023.28%
(U.S. Dollars per Metric Ton)
(Thousand Metric Tons)

Table A.8. Ric
ChinaProduction
Baseline
Change
% chg
Consumption
Baseline
Change
% chg
ThailandProduction
Baseline
Change
% chg
Consumption
Baseline
Change
% chg
VietnamProduction
Baseline
Change
% chg
Consumption
Baseline
Change
% chg
IndiaProduction
Baseline
Change
% chg
Consumption
Baseline
Change
% chg
United StatesProduction
Baseline
Change
% chg
Consumption
Baseline
Change
% chg
ce Production and Consumption02/03 03/04 04/05 05/06 06/07 07/08 08/09 09/10 10/11 11/12 Average
130,044 131,879 133,046 134,103 134,763 135,350 135,993 136,801 137,597 138,444
1,281.3 2,060.2 1,904.8 2,210.3 2,151.0 2,276.8 2,228.6 2,356.5 2,440.3 2,565.5 1,890.99
0.99% 1.56% 1.43% 1.65% 1.60% 1.68% 1.64% 1.72% 1.77% 1.85% 1.40%
132,443 131,393 132,018 132,734 133,779 134,680 135,297 135,431 135,413 135,161
-1,698 -2,887 -2,838 -3,203 -3,121 -3,152 -3,010 -3,086 -3,172 -3,259 -2,617
-1.28% -2.20% -2.15% -2.41% -2.33% -2.34% -2.23% -2.28% -2.34% -2.41% -1.96%
17,241 17,425 17,711 18,037 18,288 18,533 18,781 19,109 19,419 19,735
0.0 179.7 427.5 379.7 448.3 419.4 465.1 462.7 486.6 484.0 326.91
0.00% 1.03% 2.41% 2.11% 2.45% 2.26% 2.48% 2.42% 2.51% 2.45% 1.77%
10,115 10,132 10,147 10,156 10,155 10,150 10,140 10,127 10,104 10,072
-128.1 -197.1 -183.3 -208.4 -195.5 -213.4 -207.8 -214.8 -212.2 -223.8 -176.07
-1.27% -1.95% -1.81% -2.05% -1.93% -2.10% -2.05% -2.12% -2.10% -2.22% -1.74%
20,925 21,253 21,582 21,869 22,214 22,600 22,969 23,308 23,649 24,008
0.0 303.6 563.0 563.8 629.9 607.8 651.3 642.2 659.1 656.1 462.07
0.00% 1.43% 2.61% 2.58% 2.84% 2.69% 2.84% 2.76% 2.79% 2.73% 2.05%
17,191 17,308 17,487 17,702 17,875 18,074 18,311 18,530 18,728 18,904
-362.3 -562.5 -523.7 -592.9 -559.3 -612.1 -594.2 -615.8 -611.8 -651.9 -503.47
-2.11% -3.25% -2.99% -3.35% -3.13% -3.39% -3.25% -3.32% -3.27% -3.45% -2.81%
89,078 89,738 90,927 91,998 93,218 94,402 95,518 96,760 97,902 99,029
0.0 135.5 1,177.3 548.5 847.6 688.3 887.0 792.9 808.6 684.5 588.57
0.00% 0.15% 1.29% 0.60% 0.91% 0.73% 0.93% 0.82% 0.83% 0.69% 0.63%
87,370 88,739 90,260 90,903 92,211 93,229 94,183 95,127 96,218 97,030
-308.8 -1,122.4 -598.6 -749.0 -667.5 -667.8 -676.4 -598.1 -539.9 -472.5 -592.84
-0.35% -1.26% -0.66% -0.82% -0.72% -0.72% -0.72% -0.63% -0.56% -0.49% -0.65%
5,855 6,001 6,034 6,073 6,119 6,141 6,166 6,192 6,215 6,229
0 -3,377 -2,584 -2,850 -2,607 -2,691 -2,621 -2,599 -2,592 -2,517 -2,192
0.0% -56.3% -42.8% -46.9% -42.6% -43.8% -42.5% -42.0% -41.7% -40.4% -35.86%
3,802 3,886 3,968 4,051 4,132 4,213 4,296 4,379 4,461 4,544
-97.6 -95.6 -90.4 -91.9 -89.3 -89.2 -88.4 -87.1 -86.7 -43.0 -81.61
-2.57% -2.46% -2.28% -2.27% -2.16% -2.12% -2.06% -1.99% -1.94% -0.95% -1.98%
(Thousand Metric Tons)

Table A.9. Soy
World Price Baseline
Change
% chg
Total Trade Baseline
Change
% chg
Exports of Selected CouArgentina Baseline
Change
% chg
Brazil Baseline
Change
% chg
Canada Baseline
Change
% chg
United States Baseline
Change
% chg
Imports of Selected CounEastern Europe Baseline
Change
% chg
Former Soviet Union Baseline
Change
% chg
Japan Baseline
Change
% chg
China Baseline
Change
% chg
India Baseline
Change
% chg
South Korea Baseline
Change
% chg
Taiwan Baseline
Change
% chg
ybean Price and Trade02/03 03/04 04/05 05/06 06/07 07/08 08/09 09/10 10/11 11/12 Average
160 163 169 174 181 188 194 199 206 211
3.7 6.2 6.7 6.8 6.3 6.1 5.7 5.2 4.9 5.7 5.74
2.31% 3.79% 3.98% 3.91% 3.49% 3.25% 2.94% 2.62% 2.39% 2.72% 3.14%
54,734 55,871 57,289 58,814 60,299 61,923 63,461 65,074 66,667 68,479
-671.4 -352.9 -368.4 -412.3 -320.5 -156.6 42.1 224.1 331.1 459.5 -122.53
-1.23% -0.63% -0.64% -0.70% -0.53% -0.25% 0.07% 0.34% 0.50% 0.67% -0.24%
untries
7,814 8,057 8,346 8,663 8,941 9,253 9,587 9,904 10,214 10,608
179.3 1,182.3 1,347.3 1,319.5 1,343.1 1,313.8 1,315.4 1,303.0 1,289.2 1,302.0 1,189.49
2.30% 14.67% 16.14% 15.23% 15.02% 14.20% 13.72% 13.16% 12.62% 12.27% 12.93%
18,734 19,281 20,054 21,109 22,080 23,189 24,295 25,357 26,394 27,504
-747.8 1,114.0 1,177.2 1,156.4 1,050.7 1,023.8 951.0 919.4 845.7 902.3 839.27
-3.99% 5.78% 5.87% 5.48% 4.76% 4.41% 3.91% 3.63% 3.20% 3.28% 3.63%
687 682 719 751 787 817 852 885 919 951
-20.2 -11.8 -12.7 -14.0 -19.2 -24.4 -31.1 -34.7 -39.5 -43.2 -25.08
-2.94% -1.73% -1.76% -1.87% -2.44% -2.99% -3.64% -3.92% -4.29% -4.54% -3.01%
27,499 27,851 28,169 28,291 28,490 28,663 28,727 28,927 29,140 29,416
-82.7 -2,637.4 -2,880.2 -2,874.2 -2,695.1 -2,469.8 -2,193.3 -1,963.6 -1,764.3 -1,701.5 -2,126.20
-0.30% -9.47% -10.22% -10.16% -9.46% -8.62% -7.63% -6.79% -6.05% -5.78% -7.45%
untries
150 160 160 162 163 163 164 166 168 172
-27.1 -46.1 -47.4 -46.4 -44.4 -40.6 -37.4 -34.8 -33.0 -30.8 -38.81
-18.02% -28.85% -29.62% -28.70% -27.27% -24.85% -22.78% -20.91% -19.60% -17.91% -23.85%
249 274 280 285 292 300 306 313 320 328
-19.6 -17.5 -19.8 -17.0 -13.5 -7.6 -2.8 1.2 4.3 7.9 -8.43
-7.88% -6.37% -7.06% -5.95% -4.61% -2.54% -0.91% 0.39% 1.35% 2.41% -3.12%
5,108 5,127 5,115 5,114 5,115 5,114 5,113 5,111 5,102 5,100
-133.3 -122.4 -117.3 -116.7 -104.3 -92.4 -79.5 -70.3 -62.5 -55.3 -95.39
-2.61% -2.39% -2.29% -2.28% -2.04% -1.81% -1.56% -1.38% -1.23% -1.09% -1.87%
15,043 15,252 16,022 16,803 17,472 18,269 18,980 19,710 20,508 21,374
-48.8 -28.3 -100.3 -62.4 -53.3 -19.4 10.6 63.3 74.0 80.0 -8.46
-0.32% -0.19% -0.63% -0.37% -0.31% -0.11% 0.06% 0.32% 0.36% 0.37% -0.08%
0 0 0 0 0 0 0 0 0 0
-39.7 468.9 366.1 327.6 265.4 236.7 201.3 186.0 180.8 180.4 237.35
N/A N/A N/A N/A N/A N/A N/A N/A N/A N/A N/A
1,452 1,461 1,444 1,443 1,450 1,458 1,464 1,471 1,474 1,485
118.8 102.4 143.0 141.5 155.3 167.5 181.1 189.9 196.9 204.9 160.14
8.18% 7.01% 9.91% 9.81% 10.71% 11.49% 12.37% 12.91% 13.35% 13.80% 10.95%
2,312 2,348 2,323 2,311 2,306 2,301 2,296 2,296 2,286 2,293
-24.8 -49.9 -33.2 -33.6 -9.4 11.1 33.9 48.8 61.3 72.6 7.69
-1.07% -2.13% -1.43% -1.45% -0.41% 0.48% 1.48% 2.12% 2.68% 3.16% 0.34%
(Thousand Metric Tons)
(U.S. Dollars per Metric Ton)

Table A.10. So
ArgentinaProduction
Baseline
Change
% chg
Consumption
Baseline
Change
% chg
BrazilProduction
Baseline
Change
% chg
Consumption
Baseline
Change
% chg
United StatesProduction
Baseline
Change
% chg
Consumption
Baseline
Change
% chg
European UnionProduction
Baseline
Change
% chg
Consumption
Baseline
Change
% chg
ChinaProduction
Baseline
Change
% chg
Consumption
Baseline
Change
% chg
IndiaProduction
Baseline
Change
% chg
Consumption
Baseline
Change
% chg
oybean Production and Consumption02/03 03/04 04/05 05/06 06/07 07/08 08/09 09/10 10/11 11/12 Average
29,406 29,899 30,368 30,889 31,399 31,939 32,484 33,012 33,536 34,073
0.0 1,055.4 1,242.3 1,228.7 1,292.4 1,306.2 1,345.2 1,359.8 1,387.5 1,429.5 1,164.71
0.00% 3.53% 4.09% 3.98% 4.12% 4.09% 4.14% 4.12% 4.14% 4.20% 3.64%
21,596 21,844 22,024 22,228 22,460 22,688 22,899 23,111 23,324 23,466
-176.5 -126.3 -104.8 -90.8 -50.7 -7.6 29.8 56.8 98.5 127.7 -24.41
-0.82% -0.58% -0.48% -0.41% -0.23% -0.03% 0.13% 0.25% 0.42% 0.54% -0.12%
44,756 45,959 47,376 49,104 50,752 52,544 54,330 56,064 57,774 59,548
0.0 1,977.4 2,079.4 2,090.9 2,027.8 2,048.2 2,014.5 2,019.0 1,983.0 2,059.8 1,830.00
0.00% 4.30% 4.39% 4.26% 4.00% 3.90% 3.71% 3.60% 3.43% 3.46% 3.50%
26,030 26,690 27,339 28,011 28,690 29,373 30,050 30,723 31,396 32,048
759.0 868.6 903.2 933.6 975.6 1,023.2 1,061.8 1,098.1 1,138.1 1,158.8 992.00
2.92% 3.25% 3.30% 3.33% 3.40% 3.48% 3.53% 3.57% 3.62% 3.62% 3.40%
79,698 80,341 81,105 82,191 83,270 84,273 85,250 86,402 87,407 88,771
0.0 -2,937.9 -2,751.3 -2,692.6 -2,275.0 -1,919.3 -1,441.1 -1,087.0 -814.3 -753.4 -1,667.19
0.00% -3.66% -3.39% -3.28% -2.73% -2.28% -1.69% -1.26% -0.93% -0.85% -2.01%
51,418 52,548 53,332 54,241 55,161 56,037 56,884 57,762 58,645 59,610
528.5 76.5 187.7 196.0 367.7 528.6 711.4 835.5 939.6 1,026.6 539.81
1.03% 0.15% 0.35% 0.36% 0.67% 0.94% 1.25% 1.45% 1.60% 1.72% 0.95%
1,012 969 964 971 979 984 992 1,000 1,006 1,011
34.5 17.2 15.6 28.2 21.6 19.1 10.2 3.2 -5.8 -11.9 13.18
3.40% 1.77% 1.61% 2.90% 2.21% 1.94% 1.02% 0.32% -0.58% -1.18% 1.34%
19,684 19,785 19,744 19,748 19,802 19,855 19,919 20,021 20,062 20,200
-168.8 -299.7 -239.9 -243.0 -139.9 -54.7 40.9 103.5 156.5 197.7 -64.74
-0.86% -1.51% -1.22% -1.23% -0.71% -0.28% 0.21% 0.52% 0.78% 0.98% -0.33%
15,024 15,515 15,438 15,387 15,450 15,398 15,444 15,543 15,598 15,635
-1.4 -94.7 6.6 -26.3 -11.2 -36.9 -53.3 -97.0 -101.4 -117.8 -53.35
-0.01% -0.61% 0.04% -0.17% -0.07% -0.24% -0.35% -0.62% -0.65% -0.75% -0.34%
30,159 30,822 31,461 32,171 32,868 33,600 34,388 35,233 36,094 36,984
-61.5 -98.1 -90.4 -90.0 -71.9 -60.4 -47.6 -38.7 -30.9 -32.9 -62.24
-0.20% -0.32% -0.29% -0.28% -0.22% -0.18% -0.14% -0.11% -0.09% -0.09% -0.19%
5,827 5,931 6,103 6,261 6,450 6,628 6,806 6,977 7,132 7,299
0.0 -555.0 -540.6 -567.0 -585.9 -622.1 -645.0 -676.4 -696.7 -726.4 -561.51
0.00% -9.36% -8.86% -9.06% -9.08% -9.39% -9.48% -9.70% -9.77% -9.95% -8.46%
5,827 5,931 6,102 6,262 6,450 6,628 6,806 6,977 7,132 7,299
-48.3 -86.0 -174.3 -239.5 -320.6 -385.4 -443.8 -490.5 -516.0 -545.9 -325.03
-0.83% -1.45% -2.86% -3.82% -4.97% -5.82% -6.52% -7.03% -7.23% -7.48% -4.80%
(Thousand Metric Tons)

Table A.11. So
World Price Baseline
Change
% chg
Total Trade Baseline
Change
% chg
Exports of Selected CouArgentina Baseline
Change
% chg
Brazil Baseline
Change
% chg
India Baseline
Change
% chg
United States Baseline
Change
% chg
Imports of Selected CounEastern Europe Baseline
Change
% chg
Former Soviet Union Baseline
Change
% chg
Japan Baseline
Change
% chg
Canada Baseline
Change
% chg
China Baseline
Change
% chg
South Korea Baseline
Change
% chg
Taiwan Baseline
Change
% chg
oybean Meal Price and Trade02/03 03/04 04/05 05/06 06/07 07/08 08/09 09/10 10/11 11/12 Average
170 176 182 187 194 201 206 211 216 220
2.5 3.9 5.3 5.4 6.4 8.1 9.7 10.6 11.6 14.1 7.77
1.44% 2.23% 2.89% 2.91% 3.30% 4.05% 4.69% 5.05% 5.37% 6.42% 3.83%
36,608 37,301 37,830 38,363 38,960 39,431 39,876 40,311 40,790 41,378
-151.5 -821.2 -1,183.4 -1,407.4 -1,452.2 -1,413.5 -1,405.7 -1,434.9 -1,432.5 -1,425.0 -1,212.73
-0.41% -2.20% -3.13% -3.67% -3.73% -3.58% -3.53% -3.56% -3.51% -3.44% -3.08%
untries
16,445 16,632 16,770 16,928 17,110 17,287 17,449 17,612 17,777 17,880
-138.1 -122.5 -110.1 -95.8 -63.3 -27.2 1.6 23.4 58.0 81.0 -39.30
-0.84% -0.74% -0.66% -0.57% -0.37% -0.16% 0.01% 0.13% 0.33% 0.45% -0.24%
10,911 10,892 10,930 10,932 10,956 10,916 10,820 10,738 10,636 10,783
296.1 143.0 49.1 11.0 -38.0 -93.5 -183.7 -248.4 -293.3 -351.2 -70.88
2.71% 1.31% 0.45% 0.10% -0.35% -0.86% -1.70% -2.31% -2.76% -3.26% -0.67%
2,434 2,555 2,668 2,802 2,928 3,054 3,172 3,280 3,393 0
-70.4 -8.0 37.8 100.9 149.1 192.8 225.8 242.6 260.0 106.2 106.25
-2.89% -0.31% 1.42% 3.60% 5.09% 6.31% 7.12% 7.40% 7.66% 3.25% -3.25%
6,883 7,343 7,575 7,835 8,091 8,299 8,554 8,789 9,098 9,322
-377.9 -912.1 -1,130.5 -1,284.7 -1,250.0 -1,143.7 -1,030.8 -984.1 -954.5 -894.8 -996.31
-5.49% -12.42% -14.92% -16.40% -15.45% -13.78% -12.05% -11.20% -10.49% -9.60% -12.18%
untries
3,037 3,079 3,120 3,137 3,178 3,214 3,245 3,288 3,333 3,387
-85.6 -213.7 -237.0 -254.1 -256.2 -279.0 -293.3 -306.0 -295.2 -289.7 -250.98
-2.82% -6.94% -7.60% -8.10% -8.06% -8.68% -9.04% -9.31% -8.85% -8.55% -7.79%
523 513 510 508 503 495 490 486 484 482
18.2 1.4 -0.4 -2.7 -5.6 -13.4 -19.9 -24.2 -23.9 -22.8 -9.32
3.49% 0.27% -0.08% -0.53% -1.10% -2.70% -4.07% -4.98% -4.94% -4.73% -1.94%
811 747 723 723 733 730 729 718 714 734
29.4 -21.0 -50.5 -56.6 -54.0 -55.7 -59.3 -70.7 -83.1 -96.1 -51.76
3.63% -2.82% -6.99% -7.83% -7.36% -7.63% -8.14% -9.85% -11.64% -13.08% -7.17%
1,157 1,176 1,200 1,230 1,301 1,355 1,398 1,401 1,427 0
15.9 -38.2 -117.1 -176.9 -195.1 -183.7 -162.4 -163.2 -174.9 -117.6 -117.57
1.37% -3.25% -9.76% -14.38% -14.99% -13.56% -11.61% -11.65% -12.26% -8.82% 8.82%
99 205 357 473 667 839 942 1,008 1,067 1,117
51.4 98.7 132.2 160.8 180.9 212.1 234.3 250.6 255.2 255.2 183.12
51.70% 48.13% 37.06% 34.03% 27.11% 25.28% 24.87% 24.85% 23.92% 22.86% 31.98%
1,320 1,255 1,283 1,343 1,403 1,469 1,528 1,583 1,626 1,670
99.9 68.5 36.7 32.7 13.4 -20.6 -53.2 -73.8 -77.3 -83.1 -5.70
7.56% 5.45% 2.86% 2.44% 0.95% -1.41% -3.48% -4.66% -4.76% -4.98% 0.00%
83 17 23 37 48 58 58 45 41 50
-0.8 11.2 -4.0 -9.7 -42.5 -75.1 -104.2 -117.3 -125.2 -139.0 -60.65
-0.9% 66.4% -17.7% -26.5% -88.8% -130.1% -178.3% -260.5% -306.0% -280.2% -122.27%
(U.S. Dollars per Metric Ton)
(Thousand Metric Tons)
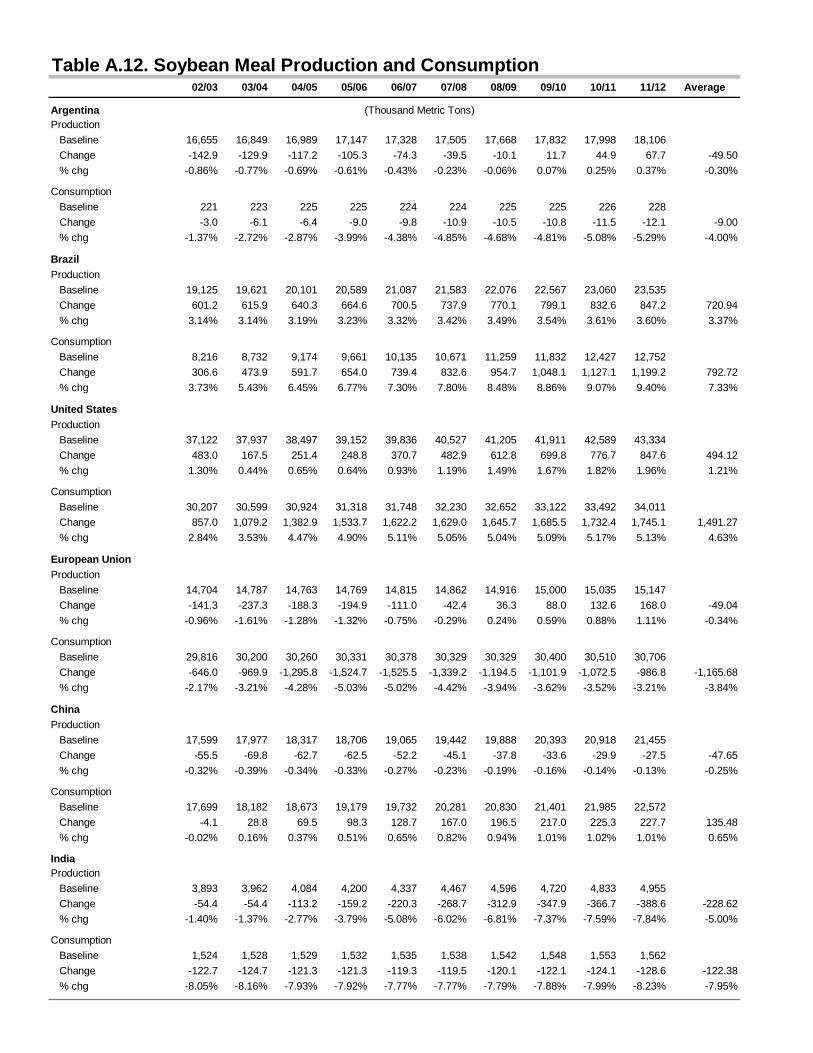
Table A.12. So
ArgentinaProduction
Baseline
Change
% chg
Consumption
Baseline
Change
% chg
BrazilProduction
Baseline
Change
% chg
Consumption
Baseline
Change
% chg
United StatesProduction
Baseline
Change
% chg
Consumption
Baseline
Change
% chg
European UnionProduction
Baseline
Change
% chg
Consumption
Baseline
Change
% chg
ChinaProduction
Baseline
Change
% chg
Consumption
Baseline
Change
% chg
IndiaProduction
Baseline
Change
% chg
Consumption
Baseline
Change
% chg
oybean Meal Production and Consumption02/03 03/04 04/05 05/06 06/07 07/08 08/09 09/10 10/11 11/12 Average
16,655 16,849 16,989 17,147 17,328 17,505 17,668 17,832 17,998 18,106
-142.9 -129.9 -117.2 -105.3 -74.3 -39.5 -10.1 11.7 44.9 67.7 -49.50
-0.86% -0.77% -0.69% -0.61% -0.43% -0.23% -0.06% 0.07% 0.25% 0.37% -0.30%
221 223 225 225 224 224 225 225 226 228
-3.0 -6.1 -6.4 -9.0 -9.8 -10.9 -10.5 -10.8 -11.5 -12.1 -9.00
-1.37% -2.72% -2.87% -3.99% -4.38% -4.85% -4.68% -4.81% -5.08% -5.29% -4.00%
19,125 19,621 20,101 20,589 21,087 21,583 22,076 22,567 23,060 23,535
601.2 615.9 640.3 664.6 700.5 737.9 770.1 799.1 832.6 847.2 720.94
3.14% 3.14% 3.19% 3.23% 3.32% 3.42% 3.49% 3.54% 3.61% 3.60% 3.37%
8,216 8,732 9,174 9,661 10,135 10,671 11,259 11,832 12,427 12,752
306.6 473.9 591.7 654.0 739.4 832.6 954.7 1,048.1 1,127.1 1,199.2 792.72
3.73% 5.43% 6.45% 6.77% 7.30% 7.80% 8.48% 8.86% 9.07% 9.40% 7.33%
37,122 37,937 38,497 39,152 39,836 40,527 41,205 41,911 42,589 43,334
483.0 167.5 251.4 248.8 370.7 482.9 612.8 699.8 776.7 847.6 494.12
1.30% 0.44% 0.65% 0.64% 0.93% 1.19% 1.49% 1.67% 1.82% 1.96% 1.21%
30,207 30,599 30,924 31,318 31,748 32,230 32,652 33,122 33,492 34,011
857.0 1,079.2 1,382.9 1,533.7 1,622.2 1,629.0 1,645.7 1,685.5 1,732.4 1,745.1 1,491.27
2.84% 3.53% 4.47% 4.90% 5.11% 5.05% 5.04% 5.09% 5.17% 5.13% 4.63%
14,704 14,787 14,763 14,769 14,815 14,862 14,916 15,000 15,035 15,147
-141.3 -237.3 -188.3 -194.9 -111.0 -42.4 36.3 88.0 132.6 168.0 -49.04
-0.96% -1.61% -1.28% -1.32% -0.75% -0.29% 0.24% 0.59% 0.88% 1.11% -0.34%
29,816 30,200 30,260 30,331 30,378 30,329 30,329 30,400 30,510 30,706
-646.0 -969.9 -1,295.8 -1,524.7 -1,525.5 -1,339.2 -1,194.5 -1,101.9 -1,072.5 -986.8 -1,165.68
-2.17% -3.21% -4.28% -5.03% -5.02% -4.42% -3.94% -3.62% -3.52% -3.21% -3.84%
17,599 17,977 18,317 18,706 19,065 19,442 19,888 20,393 20,918 21,455
-55.5 -69.8 -62.7 -62.5 -52.2 -45.1 -37.8 -33.6 -29.9 -27.5 -47.65
-0.32% -0.39% -0.34% -0.33% -0.27% -0.23% -0.19% -0.16% -0.14% -0.13% -0.25%
17,699 18,182 18,673 19,179 19,732 20,281 20,830 21,401 21,985 22,572
-4.1 28.8 69.5 98.3 128.7 167.0 196.5 217.0 225.3 227.7 135.48
-0.02% 0.16% 0.37% 0.51% 0.65% 0.82% 0.94% 1.01% 1.02% 1.01% 0.65%
3,893 3,962 4,084 4,200 4,337 4,467 4,596 4,720 4,833 4,955
-54.4 -54.4 -113.2 -159.2 -220.3 -268.7 -312.9 -347.9 -366.7 -388.6 -228.62
-1.40% -1.37% -2.77% -3.79% -5.08% -6.02% -6.81% -7.37% -7.59% -7.84% -5.00%
1,524 1,528 1,529 1,532 1,535 1,538 1,542 1,548 1,553 1,562
-122.7 -124.7 -121.3 -121.3 -119.3 -119.5 -120.1 -122.1 -124.1 -128.6 -122.38
-8.05% -8.16% -7.93% -7.92% -7.77% -7.77% -7.79% -7.88% -7.99% -8.23% -7.95%
(Thousand Metric Tons)

Table A.13. So
World Price Baseline
Change
% chg
Total Trade Baseline
Change
% chg
Exports of Selected CouArgentina Baseline
Change
% chg
Brazil Baseline
Change
% chg
United States Baseline
Change
% chg
Imports of Selected CounEastern Europe Baseline
Change
% chg
Former Soviet Union Baseline
Change
% chg
Japan Baseline
Change
% chg
China Baseline
Change
% chg
India Baseline
Change
% chg
South Korea Baseline
Change
% chg
Taiwan Baseline
Change
% chg
oybean Oil Price and Trade02/03 03/04 04/05 05/06 06/07 07/08 08/09 09/10 10/11 11/12 Average
347 348 356 364 373 383 396 408 422 437
28.8 32.4 33.1 33.1 30.7 26.7 23.1 20.1 17.9 15.6 26.16
8.30% 9.32% 9.30% 9.07% 8.25% 6.97% 5.85% 4.91% 4.23% 3.56% 6.98%
7,118 7,253 7,376 7,508 7,647 7,781 7,903 8,027 8,157 8,287
356.7 277.8 302.2 306.1 341.1 368.6 404.2 429.4 456.1 474.1 371.62
5.01% 3.83% 4.10% 4.08% 4.46% 4.74% 5.11% 5.35% 5.59% 5.72% 4.80%
untries
3,549 3,590 3,620 3,654 3,694 3,732 3,768 3,804 3,841 3,863
-31.2 -27.4 -25.3 -22.5 -16.5 -9.0 -3.2 1.4 8.3 13.3 -11.21
-0.88% -0.76% -0.70% -0.61% -0.45% -0.24% -0.08% 0.04% 0.22% 0.34% -0.31%
1,366 1,430 1,502 1,571 1,643 1,716 1,786 1,856 1,926 1,974
175.9 172.3 176.8 179.2 181.1 183.1 185.2 187.6 191.5 193.5 182.61
12.88% 12.05% 11.77% 11.41% 11.02% 10.67% 10.37% 10.11% 9.94% 9.80% 11.00%
1,032 1,094 1,138 1,187 1,224 1,253 1,274 1,289 1,321 1,371
243.0 175.3 185.4 184.1 198.2 205.9 222.4 233.1 243.5 249.9 214.09
23.54% 16.02% 16.29% 15.51% 16.19% 16.42% 17.46% 18.08% 18.44% 18.23% 17.62%
untries
188 191 195 199 203 208 213 217 222 227
4.5 3.8 3.9 3.8 3.9 3.9 4.0 4.0 4.1 4.1 4.01
2.39% 2.01% 2.01% 1.93% 1.94% 1.86% 1.87% 1.83% 1.85% 1.80% 1.95%
360 365 371 378 385 393 401 409 419 428
10.6 7.1 7.8 7.4 7.8 7.8 8.2 8.2 8.5 8.6 8.20
2.93% 1.94% 2.11% 1.95% 2.04% 1.99% 2.04% 2.00% 2.04% 2.00% 2.10%
1 0 2 3 4 4 4 4 3 5
50.6 39.6 39.2 38.4 38.4 37.9 37.6 37.1 36.8 35.8 39.14
3665% 15018% 1782% 1141% 1004% 1050% 840% 982% 1085% 726% 2729.28%
451 500 566 637 720 802 869 931 997 1,061
36.8 20.4 28.7 27.9 38.2 45.1 55.8 62.2 70.4 76.0 46.15
8.16% 4.08% 5.08% 4.37% 5.31% 5.62% 6.42% 6.68% 7.06% 7.17% 6.00%
1,339 1,408 1,459 1,509 1,557 1,609 1,663 1,722 1,786 1,853
40.1 27.6 40.8 50.0 68.0 82.3 98.0 109.3 118.1 126.3 76.08
3.00% 1.96% 2.80% 3.32% 4.37% 5.12% 5.90% 6.35% 6.61% 6.82% 4.62%
144 159 172 182 192 200 209 217 225 232
7.9 9.1 7.3 7.6 6.1 5.1 3.8 3.1 2.5 1.6 5.41
5.47% 5.74% 4.25% 4.19% 3.18% 2.57% 1.81% 1.44% 1.10% 0.68% 3.04%
69 68 73 81 87 91 96 99 103 105
-0.7 3.9 2.2 2.7 0.0 -2.0 -4.9 -6.6 -8.3 -9.7 -2.33
-1.08% 5.71% 3.02% 3.38% 0.03% -2.14% -5.08% -6.68% -8.02% -9.23% -2.01%
(U.S. Dollars per Metric Ton)
(Thousand Metric Tons)

Table A.14. So
ArgentinaProduction
Baseline
Change
% chg
Consumption
Baseline
Change
% chg
BrazilProduction
Baseline
Change
% chg
Consumption
Baseline
Change
% chg
United StatesProduction
Baseline
Change
% chg
Consumption
Baseline
Change
% chg
European UnionProduction
Baseline
Change
% chg
Consumption
Baseline
Change
% chg
ChinaProduction
Baseline
Change
% chg
Consumption
Baseline
Change
% chg
IndiaProduction
Baseline
Change
% chg
Consumption
Baseline
Change
% chg
oybean Oil Production and Consumption02/03 03/04 04/05 05/06 06/07 07/08 08/09 09/10 10/11 11/12 Average
3,701 3,744 3,775 3,810 3,851 3,890 3,926 3,963 4,000 4,024
-31.8 -28.9 -26.1 -23.4 -16.5 -8.8 -2.2 2.6 10.0 15.1 -11.00
-0.86% -0.77% -0.69% -0.61% -0.43% -0.23% -0.06% 0.07% 0.25% 0.37% -0.30%
153 154 155 156 157 158 159 159 159 161
0.0 -1.3 -0.7 -1.0 -0.2 0.1 0.8 1.1 1.6 1.7 0.20
-0.02% -0.87% -0.47% -0.64% -0.13% 0.06% 0.50% 0.66% 1.00% 1.05% 0.12%
4,600 4,719 4,834 4,952 5,072 5,191 5,309 5,428 5,546 5,660
144.6 148.1 154.0 159.8 168.5 177.5 185.2 192.2 200.2 203.8 173.39
3.14% 3.14% 3.19% 3.23% 3.32% 3.42% 3.49% 3.54% 3.61% 3.60% 3.37%
3,238 3,290 3,336 3,385 3,433 3,481 3,530 3,579 3,628 3,689
-20.0 -22.9 -22.8 -20.3 -14.9 -8.3 -2.3 2.7 7.2 9.5 -9.20
-0.62% -0.70% -0.68% -0.60% -0.43% -0.24% -0.06% 0.08% 0.20% 0.26% -0.28%
8,785 8,982 9,118 9,278 9,444 9,612 9,777 9,949 10,114 10,296
114.3 39.7 59.5 59.0 87.9 114.5 145.4 166.1 184.4 201.4 117.22
1.30% 0.44% 0.65% 0.64% 0.93% 1.19% 1.49% 1.67% 1.82% 1.96% 1.21%
7,710 7,856 7,963 8,075 8,201 8,343 8,491 8,649 8,784 8,917
-110.2 -125.4 -127.1 -125.6 -116.5 -100.9 -86.7 -74.6 -65.4 -56.2 -98.85
-1.43% -1.60% -1.60% -1.56% -1.42% -1.21% -1.02% -0.86% -0.74% -0.63% -1.21%
3,308 3,327 3,322 3,323 3,333 3,344 3,356 3,375 3,383 3,408
-31.8 -53.4 -42.4 -43.9 -25.0 -9.6 8.2 19.8 29.8 37.8 -11.04
-0.96% -1.61% -1.28% -1.32% -0.75% -0.29% 0.24% 0.59% 0.88% 1.11% -0.34%
2,137 2,187 2,206 2,227 2,248 2,265 2,282 2,298 2,313 2,329
-0.5 -10.9 -7.7 -9.1 -3.4 1.5 8.1 12.3 16.9 20.3 2.76
-0.02% -0.50% -0.35% -0.41% -0.15% 0.06% 0.36% 0.54% 0.73% 0.87% 0.11%
3,520 3,595 3,663 3,741 3,813 3,888 3,978 4,079 4,184 4,291
-11.1 -14.0 -12.5 -12.5 -10.4 -9.0 -7.6 -6.7 -6.0 -5.5 -9.53
-0.32% -0.39% -0.34% -0.33% -0.27% -0.23% -0.19% -0.16% -0.14% -0.13% -0.25%
3,976 4,097 4,228 4,376 4,527 4,685 4,844 5,009 5,179 5,351
24.9 7.6 16.2 15.1 26.9 34.8 47.2 54.6 63.8 69.9 36.09
0.63% 0.18% 0.38% 0.34% 0.59% 0.74% 0.97% 1.09% 1.23% 1.31% 0.75%
898 914 943 969 1,001 1,031 1,061 1,089 1,115 1,143
-12.6 -12.5 -26.1 -36.7 -50.8 -62.0 -72.2 -80.3 -84.6 -89.7 -52.76
-1.40% -1.37% -2.77% -3.79% -5.08% -6.02% -6.81% -7.37% -7.59% -7.84% -5.00%
2,237 2,323 2,401 2,478 2,557 2,639 2,723 2,811 2,902 2,996
27.6 15.1 14.7 13.3 17.2 20.3 25.8 29.1 33.5 36.6 23.32
1.23% 0.65% 0.61% 0.54% 0.67% 0.77% 0.95% 1.03% 1.15% 1.22% 0.88%
(Thousand Metric Tons)

Table A.15. Ra
World Price Baseline
Change
% chg
Total Trade Baseline
Change
% chg
Exports of Selected CouAustralia Baseline
Change
% chg
Canada Baseline
Change
% chg
Eastern Europe Baseline
Change
% chg
Former Soviet Union Baseline
Change
% chg
Imports of Selected CounChina Baseline
Change
% chg
European Union Baseline
Change
% chg
India Baseline
Change
% chg
Japan Baseline
Change
% chg
Rest of World Baseline
Change
% chg
apeseed Price and Trade02/03 03/04 04/05 05/06 06/07 07/08 08/09 09/10 10/11 11/12 Average
208 220 225 227 231 235 237 240 243 246
35.2 35.3 43.4 38.7 43.6 46.6 52.1 55.8 60.8 65.7 47.72
16.97% 16.03% 19.32% 17.01% 18.89% 19.85% 21.99% 23.24% 25.08% 26.66% 20.51%
5,968 6,074 6,338 6,497 6,656 6,800 6,937 7,096 7,255 7,420
-13.4 341.5 318.3 281.0 291.6 319.9 349.0 386.1 417.1 452.9 314.42
-0.22% 5.62% 5.02% 4.33% 4.38% 4.70% 5.03% 5.44% 5.75% 6.10% 4.62%
untries
1,353 1,368 1,394 1,408 1,442 1,468 1,485 1,508 1,533 1,560
-3.0 76.4 71.2 64.3 69.7 76.1 77.8 83.3 87.4 94.1 69.71
-0.22% 5.58% 5.11% 4.56% 4.83% 5.18% 5.24% 5.52% 5.70% 6.03% 4.75%
3,606 3,670 3,829 3,928 4,005 4,072 4,143 4,223 4,302 4,384
19.8 276.8 262.4 237.0 241.4 257.3 277.8 301.4 321.3 343.9 253.91
0.55% 7.54% 6.85% 6.03% 6.03% 6.32% 6.70% 7.14% 7.47% 7.84% 6.25%
842 861 926 958 994 1,034 1,071 1,114 1,157 1,202
-56.8 -45.9 -50.0 -52.7 -51.5 -46.5 -40.5 -34.4 -29.1 -24.5 -43.18
-6.75% -5.33% -5.40% -5.50% -5.18% -4.49% -3.78% -3.09% -2.52% -2.04% -4.41%
167 175 190 202 215 226 238 251 263 274
26.6 34.2 34.8 32.4 32.0 33.1 33.9 35.8 37.5 39.5 33.98
15.94% 19.57% 18.35% 16.00% 14.93% 14.63% 14.25% 14.28% 14.26% 14.44% 15.66%
untries
1,616 1,810 2,131 2,190 2,181 2,161 2,158 2,213 2,290 2,403
133.9 136.9 197.1 188.2 208.8 184.4 192.6 187.7 185.1 173.3 178.81
8.28% 7.56% 9.25% 8.59% 9.58% 8.54% 8.93% 8.49% 8.08% 7.21% 8.45%
286 264 233 282 373 456 545 579 621 666
-541.4 -371.2 -344.1 -452.7 -409.2 -365.9 -311.2 -264.4 -207.6 -157.1 -342.47
-189.4% -140.7% -147.9% -160.7% -109.7% -80.3% -57.1% -45.7% -33.4% -23.6% -98.85%
0 0 0 0 0 0 0 0 0 0
208.3 336.9 274.0 304.4 288.1 289.1 286.6 289.0 291.1 298.6 286.62
N/A N/A N/A N/A N/A N/A N/A N/A N/A N/A N/A
2,174 2,175 2,194 2,211 2,229 2,245 2,261 2,275 2,290 2,305
-106.1 -86.1 -92.8 -87.1 -90.5 -87.9 -88.7 -86.7 -86.5 -85.2 -89.75
-4.88% -3.96% -4.23% -3.94% -4.06% -3.91% -3.92% -3.81% -3.78% -3.70% -4.02%
1,738 1,672 1,627 1,661 1,720 1,786 1,820 1,877 1,901 1,893
291.9 325.0 284.1 328.2 294.4 300.2 269.7 260.4 235.0 223.3 281.22
16.79% 19.44% 17.46% 19.76% 17.11% 16.81% 14.82% 13.87% 12.36% 11.80% 16.02%
(Thousand Metric Tons)
(U.S. Dollars per Metric Ton)

Table A.16. Ra
AustraliaProduction
Baseline
Change
% chg
Consumption
Baseline
Change
% chg
CanadaProduction
Baseline
Change
% chg
Consumption
Baseline
Change
% chg
Eastern EuropeProduction
Baseline
Change
% chg
Consumption
Baseline
Change
% chg
ChinaProduction
Baseline
Change
% chg
Consumption
Baseline
Change
% chg
IndiaProduction
Baseline
Change
% chg
Consumption
Baseline
Change
% chg
JapanProduction
Baseline
Change
% chg
Consumption
Baseline
Change
% chg
apeseed Production and Consumption02/03 03/04 04/05 05/06 06/07 07/08 08/09 09/10 10/11 11/12 Average
1,771 1,795 1,830 1,858 1,903 1,939 1,967 2,001 2,037 2,074
0.0 79.7 74.6 67.9 73.4 79.3 80.7 86.0 90.0 96.5 72.81
0.00% 4.44% 4.08% 3.66% 3.86% 4.09% 4.10% 4.30% 4.42% 4.65% 3.76%
418 427 436 449 461 472 482 493 504 514
3.0 3.3 3.5 3.7 3.7 3.2 3.0 2.7 2.6 2.5 3.10
0.71% 0.78% 0.79% 0.81% 0.79% 0.68% 0.62% 0.55% 0.51% 0.48% 0.67%
7,333 7,354 7,551 7,699 7,823 7,942 8,077 8,206 8,337 8,465
0.0 361.8 319.5 318.8 301.2 319.3 323.8 346.1 354.5 370.8 301.59
0.00% 4.92% 4.23% 4.14% 3.85% 4.02% 4.01% 4.22% 4.25% 4.38% 3.80%
3,698 3,693 3,720 3,766 3,813 3,870 3,931 3,981 4,034 4,080
0.4 75.2 59.9 77.9 62.9 62.9 49.4 46.0 35.7 29.0 49.93
0.01% 2.04% 1.61% 2.07% 1.65% 1.63% 1.26% 1.15% 0.89% 0.71% 1.30%
2,740 2,768 2,835 2,893 2,953 3,010 3,065 3,122 3,181 3,240
0.0 31.4 20.5 23.7 19.1 22.7 22.6 26.0 26.7 29.1 22.18
0.00% 1.13% 0.72% 0.82% 0.65% 0.76% 0.74% 0.83% 0.84% 0.90% 0.74%
1,896 1,908 1,910 1,935 1,959 1,975 1,994 2,007 2,023 2,038
56.5 76.7 70.7 76.2 70.8 69.3 63.3 60.4 56.0 53.7 65.35
2.98% 4.02% 3.70% 3.94% 3.61% 3.51% 3.18% 3.01% 2.77% 2.64% 3.33%
11,953 11,748 11,983 12,087 12,188 12,289 12,463 12,646 12,815 12,952
-1.1 -32.7 -84.8 -91.5 -104.8 -83.8 -85.0 -79.1 -69.6 -54.2 -68.67
-0.01% -0.28% -0.71% -0.76% -0.86% -0.68% -0.68% -0.63% -0.54% -0.42% -0.56%
13,569 13,558 14,114 14,277 14,369 14,450 14,621 14,859 15,105 15,355
132.8 104.1 112.3 96.7 104.0 100.6 107.7 108.7 115.5 119.1 110.14
0.98% 0.77% 0.80% 0.68% 0.72% 0.70% 0.74% 0.73% 0.76% 0.78% 0.76%
4,818 4,786 4,967 4,979 5,054 5,102 5,151 5,191 5,235 5,277
0.0 -232.4 -301.9 -294.3 -315.2 -309.1 -305.2 -293.8 -287.5 -280.0 -261.94
0.00% -4.86% -6.08% -5.91% -6.24% -6.06% -5.92% -5.66% -5.49% -5.31% -5.15%
4,783 4,820 4,961 4,977 5,052 5,100 5,145 5,187 5,231 5,273
100.3 83.4 -23.0 6.2 -22.6 -18.4 -12.9 -2.1 8.0 21.8 14.06
2.10% 1.73% -0.46% 0.12% -0.45% -0.36% -0.25% -0.04% 0.15% 0.41% 0.30%
2 3 3 3 3 3 3 3 3 3
0.0 -1.0 -1.1 -1.1 -1.1 -1.1 -1.1 -1.2 -1.2 -1.2 -1.01
0.00% -38.61% -39.96% -40.35% -40.80% -41.03% -41.33% -41.39% -41.53% -41.55% -36.65%
2,161 2,181 2,194 2,210 2,228 2,244 2,259 2,274 2,289 2,306
-95.7 -92.2 -92.6 -90.2 -90.1 -88.8 -88.5 -87.5 -86.7 -85.6 -89.79
-4.43% -4.23% -4.22% -4.08% -4.05% -3.96% -3.92% -3.85% -3.79% -3.71% -4.02%
(Thousand Metric Tons)

Table A.17. Ra
World Price Baseline
Change
% chg
Total Trade Baseline
Change
% chg
Exports of Selected CouAustralia Baseline
Change
% chg
Canada Baseline
Change
% chg
Eastern Europe Baseline
Change
% chg
Former Soviet Union Baseline
Change
% chg
Imports of Selected CounChina Baseline
Change
% chg
European Union Baseline
Change
% chg
India Baseline
Change
% chg
Japan Baseline
Change
% chg
Rest of World Baseline
Change
% chg
apeseed Meal Price and Trade02/03 03/04 04/05 05/06 06/07 07/08 08/09 09/10 10/11 11/12 Average
129 136 136 139 143 147 149 151 154 156
-0.9 -4.8 -4.4 -6.0 -4.5 -2.7 -0.5 0.5 1.7 3.8 -1.78
-0.71% -3.52% -3.27% -4.34% -3.14% -1.82% -0.35% 0.35% 1.14% 2.44% -1.32%
2,438 2,473 2,607 2,580 2,499 2,387 2,332 2,319 2,320 2,326
698.3 623.8 644.2 616.3 609.8 612.1 630.8 641.3 643.5 640.6 636.08
28.65% 25.22% 24.71% 23.89% 24.40% 25.65% 27.05% 27.66% 27.74% 27.54% 26.25%
untries
0 0 0 0 0 0 0 0 0 0
-2.2 -1.9 -2.0 6.3 12.4 14.4 18.2 20.3 23.2 24.2 11.27
N/A N/A N/A N/A N/A N/A N/A N/A N/A N/A N/A
1,334 1,316 1,322 1,335 1,352 1,364 1,383 1,398 1,424 1,443
197.2 220.6 200.3 191.6 170.6 165.6 160.6 162.8 156.6 148.9 177.48
14.78% 16.76% 15.16% 14.35% 12.62% 12.14% 11.61% 11.64% 11.00% 10.32% 13.04%
446 450 434 442 445 442 442 437 434 429
55.2 81.7 83.7 87.2 87.2 92.3 93.8 95.1 91.6 90.0 85.79
12.38% 18.16% 19.30% 19.74% 19.58% 20.87% 21.22% 21.76% 21.11% 20.98% 19.51%
9 10 9 10 11 13 14 14 15 15
-13.6 -12.9 -13.3 -13.1 -13.0 -12.3 -11.8 -11.5 -11.6 -12.0 -12.51
-157.6% -124.2% -139.9% -129.8% -114.9% -95.6% -85.1% -80.2% -79.9% -80.4% -108.8%
untries
-600 -595 -772 -718 -603 -466 -390 -362 -336 -319
-510.9 -438.0 -445.9 -418.5 -440.3 -452.5 -473.9 -481.2 -494.7 -510.4 -466.63
85.11% 73.65% 57.79% 58.27% 73.02% 97.02% 121.57% 132.82% 147.02% 160.16% 100.64%
585 622 666 629 554 458 400 368 349 333
1,010.7 1,012.0 955.7 931.4 929.7 964.3 991.8 1,019.2 1,033.8 1,062.1 991.06
172.7% 162.7% 143.4% 148.1% 167.7% 210.4% 248.1% 276.9% 296.4% 319.0% 214.55%
-49 -102 -70 -74 -88 -100 -104 -107 -111 -121
131.6 174.9 202.0 219.4 219.8 214.1 203.8 192.0 178.2 159.4 189.52
-268.0% -171.8% -286.5% -296.0% -251.2% -213.2% -196.1% -180.2% -160.5% -131.8% -215.5%
86 62 69 72 77 79 83 84 86 92
44.9 41.0 35.0 36.1 35.3 34.4 32.1 28.8 24.7 22.0 33.43
52.01% 65.82% 51.06% 50.07% 45.72% 43.41% 38.52% 34.41% 28.61% 24.03% 43.37%
1,597 1,620 1,703 1,710 1,698 1,680 1,680 1,698 1,715 1,733
-439.8 -502.3 -478.0 -496.4 -487.5 -500.3 -493.0 -492.1 -482.3 -482.0 -485.36
-27.54% -31.00% -28.07% -29.03% -28.70% -29.78% -29.34% -28.99% -28.11% -27.82% -28.84%
(U.S. Dollars per Metric Ton)
(Thousand Metric Tons)
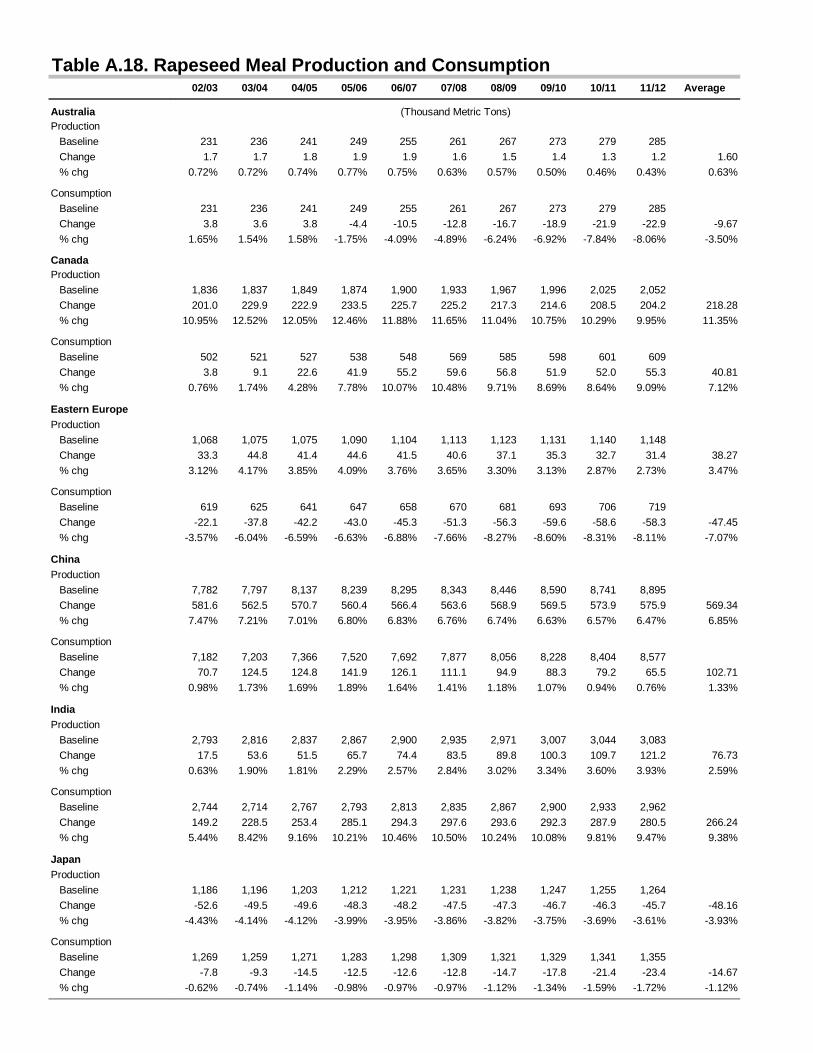
Table A.18. Ra
AustraliaProduction
Baseline
Change
% chg
Consumption
Baseline
Change
% chg
CanadaProduction
Baseline
Change
% chg
Consumption
Baseline
Change
% chg
Eastern EuropeProduction
Baseline
Change
% chg
Consumption
Baseline
Change
% chg
ChinaProduction
Baseline
Change
% chg
Consumption
Baseline
Change
% chg
IndiaProduction
Baseline
Change
% chg
Consumption
Baseline
Change
% chg
JapanProduction
Baseline
Change
% chg
Consumption
Baseline
Change
% chg
apeseed Meal Production and Consumption02/03 03/04 04/05 05/06 06/07 07/08 08/09 09/10 10/11 11/12 Average
231 236 241 249 255 261 267 273 279 285
1.7 1.7 1.8 1.9 1.9 1.6 1.5 1.4 1.3 1.2 1.60
0.72% 0.72% 0.74% 0.77% 0.75% 0.63% 0.57% 0.50% 0.46% 0.43% 0.63%
231 236 241 249 255 261 267 273 279 285
3.8 3.6 3.8 -4.4 -10.5 -12.8 -16.7 -18.9 -21.9 -22.9 -9.67
1.65% 1.54% 1.58% -1.75% -4.09% -4.89% -6.24% -6.92% -7.84% -8.06% -3.50%
1,836 1,837 1,849 1,874 1,900 1,933 1,967 1,996 2,025 2,052
201.0 229.9 222.9 233.5 225.7 225.2 217.3 214.6 208.5 204.2 218.28
10.95% 12.52% 12.05% 12.46% 11.88% 11.65% 11.04% 10.75% 10.29% 9.95% 11.35%
502 521 527 538 548 569 585 598 601 609
3.8 9.1 22.6 41.9 55.2 59.6 56.8 51.9 52.0 55.3 40.81
0.76% 1.74% 4.28% 7.78% 10.07% 10.48% 9.71% 8.69% 8.64% 9.09% 7.12%
1,068 1,075 1,075 1,090 1,104 1,113 1,123 1,131 1,140 1,148
33.3 44.8 41.4 44.6 41.5 40.6 37.1 35.3 32.7 31.4 38.27
3.12% 4.17% 3.85% 4.09% 3.76% 3.65% 3.30% 3.13% 2.87% 2.73% 3.47%
619 625 641 647 658 670 681 693 706 719
-22.1 -37.8 -42.2 -43.0 -45.3 -51.3 -56.3 -59.6 -58.6 -58.3 -47.45
-3.57% -6.04% -6.59% -6.63% -6.88% -7.66% -8.27% -8.60% -8.31% -8.11% -7.07%
7,782 7,797 8,137 8,239 8,295 8,343 8,446 8,590 8,741 8,895
581.6 562.5 570.7 560.4 566.4 563.6 568.9 569.5 573.9 575.9 569.34
7.47% 7.21% 7.01% 6.80% 6.83% 6.76% 6.74% 6.63% 6.57% 6.47% 6.85%
7,182 7,203 7,366 7,520 7,692 7,877 8,056 8,228 8,404 8,577
70.7 124.5 124.8 141.9 126.1 111.1 94.9 88.3 79.2 65.5 102.71
0.98% 1.73% 1.69% 1.89% 1.64% 1.41% 1.18% 1.07% 0.94% 0.76% 1.33%
2,793 2,816 2,837 2,867 2,900 2,935 2,971 3,007 3,044 3,083
17.5 53.6 51.5 65.7 74.4 83.5 89.8 100.3 109.7 121.2 76.73
0.63% 1.90% 1.81% 2.29% 2.57% 2.84% 3.02% 3.34% 3.60% 3.93% 2.59%
2,744 2,714 2,767 2,793 2,813 2,835 2,867 2,900 2,933 2,962
149.2 228.5 253.4 285.1 294.3 297.6 293.6 292.3 287.9 280.5 266.24
5.44% 8.42% 9.16% 10.21% 10.46% 10.50% 10.24% 10.08% 9.81% 9.47% 9.38%
1,186 1,196 1,203 1,212 1,221 1,231 1,238 1,247 1,255 1,264
-52.6 -49.5 -49.6 -48.3 -48.2 -47.5 -47.3 -46.7 -46.3 -45.7 -48.16
-4.43% -4.14% -4.12% -3.99% -3.95% -3.86% -3.82% -3.75% -3.69% -3.61% -3.93%
1,269 1,259 1,271 1,283 1,298 1,309 1,321 1,329 1,341 1,355
-7.8 -9.3 -14.5 -12.5 -12.6 -12.8 -14.7 -17.8 -21.4 -23.4 -14.67
-0.62% -0.74% -1.14% -0.98% -0.97% -0.97% -1.12% -1.34% -1.59% -1.72% -1.12%
(Thousand Metric Tons)

Table A.19. Ra
World Price Baseline
Change
% chg
Total Trade Baseline
Change
% chg
Exports of Selected CouAustralia Baseline
Change
% chg
Canada Baseline
Change
% chg
Eastern Europe Baseline
Change
% chg
European Union Baseline
WTO
Change
% chg
Imports of Selected CounChina Baseline
Change
% chg
Former Soviet Union Baseline
WTO
Change
% chg
India Baseline
Change
% chg
Japan Baseline
Change
% chg
Rest of World Baseline
Change
% chg
apeseed Oil Price and Trade02/03 03/04 04/05 05/06 06/07 07/08 08/09 09/10 10/11 11/12 Average
438 462 475 484 494 506 515 525 534 545
54.1 45.4 50.6 47.3 52.1 52.7 57.4 59.5 63.9 66.7 54.96
12.35% 9.81% 10.66% 9.78% 10.56% 10.42% 11.14% 11.34% 11.98% 12.24% 11.03%
1,346 1,329 1,335 1,380 1,442 1,508 1,561 1,596 1,630 1,659
-32.4 -4.5 -11.4 2.6 -1.8 0.5 -3.9 -4.6 -8.2 -10.2 -7.40
-2.41% -0.34% -0.85% 0.19% -0.13% 0.03% -0.25% -0.29% -0.50% -0.62% -0.52%
untries
59 60 61 66 69 70 72 74 77 79
1.1 1.2 0.9 1.3 1.3 1.2 1.2 1.3 1.4 1.4 1.25
1.96% 2.06% 1.52% 2.01% 1.93% 1.79% 1.70% 1.76% 1.79% 1.74% 1.83%
771 767 767 775 784 800 816 827 839 849
10.3 27.9 24.0 30.7 26.1 25.9 21.3 19.8 16.2 13.6 21.58
1.33% 3.64% 3.13% 3.97% 3.33% 3.24% 2.61% 2.39% 1.93% 1.60% 2.72%
74 84 82 89 94 95 97 98 99 100
24.7 31.7 28.7 30.8 29.0 29.0 27.3 26.8 25.6 25.3 27.89
33.54% 37.60% 35.13% 34.76% 30.78% 30.46% 27.98% 27.41% 25.78% 25.31% 30.88%
443 418 425 451 494 543 576 596 615 630 0
374 352 360 391 436 487 522 544 563 580 0
68.6 65.4 65.1 60.3 58.3 55.7 53.7 52.5 51.4 50.5 58.13
15.5% 15.6% 15.3% 13.4% 11.8% 10.3% 9.3% 8.8% 8.4% 8.0% 11.64%
untries
135 191 148 183 251 330 375 390 406 418
-57.1 -31.0 -35.4 -23.4 -29.1 -27.9 -33.4 -35.3 -39.4 -41.8 -35.37
-42.28% -16.23% -23.87% -12.83% -11.59% -8.43% -8.90% -9.05% -9.70% -9.98% -15.29%
120 121 127 133 139 146 154 162 171 181 0
133 134 140 146 152 159 166 174 183 193 0
-12.8 -13.2 -13.5 -13.3 -13.1 -12.8 -12.4 -12.0 -11.7 -11.3 -12.61
-10.69% -10.91% -10.64% -9.99% -9.42% -8.78% -8.09% -7.41% -6.81% -6.25% -8.90%
48 16 37 48 56 63 75 89 103 115
150.2 172.4 169.9 176.9 178.3 182.7 183.1 184.7 184.8 186.1 176.91
311.2% 1095.5% 455.4% 371.8% 320.2% 291.6% 243.2% 208.7% 179.3% 161.5% 363.8%
31 16 20 24 26 28 33 36 39 39
59.4 59.9 56.2 58.3 54.8 53.9 50.8 49.4 46.7 44.9 53.43
193.5% 366.1% 282.2% 246.1% 211.1% 192.7% 153.9% 135.7% 120.1% 115.6% 201.7%
802 775 793 784 760 732 714 708 701 695
-197.8 -219.1 -215.6 -222.5 -218.9 -221.1 -216.9 -215.4 -211.9 -210.8 -214.98
-24.65% -28.27% -27.19% -28.39% -28.82% -30.22% -30.36% -30.40% -30.25% -30.33% -28.89%
(U.S. Dollars per Metric Ton)
(Thousand Metric Tons)

Table A.20. Ra
AustraliaProduction
Baseline
Change
% chg
Consumption
Baseline
Change
% chg
CanadaProduction
Baseline
Change
% chg
Consumption
Baseline
Change
% chg
Eastern EuropeProduction
Baseline
Change
% chg
Consumption
Baseline
Change
% chg
ChinaProduction
Baseline
Change
% chg
Consumption
Baseline
Change
% chg
IndiaProduction
Baseline
Change
% chg
Consumption
Baseline
Change
% chg
JapanProduction
Baseline
Change
% chg
Consumption
Baseline
Change
% chg
apeseed Oil Production and Consumption02/03 03/04 04/05 05/06 06/07 07/08 08/09 09/10 10/11 11/12 Average
165 169 172 178 182 186 191 195 199 203
1.2 1.2 1.3 1.4 1.4 1.2 1.1 1.0 0.9 0.9 1.14
0.72% 0.72% 0.74% 0.77% 0.75% 0.63% 0.57% 0.50% 0.46% 0.43% 0.63%
107 109 111 112 114 116 118 121 122 124
0.0 0.0 0.3 0.0 0.0 -0.1 -0.1 -0.3 -0.5 -0.5 -0.11
0.04% -0.02% 0.31% 0.04% 0.03% -0.06% -0.12% -0.28% -0.39% -0.40% -0.08%
1,307 1,308 1,316 1,334 1,353 1,376 1,400 1,421 1,442 1,461
0.7 21.3 16.3 23.9 18.3 17.9 12.3 10.4 6.1 3.0 13.01
0.06% 1.63% 1.24% 1.79% 1.35% 1.30% 0.88% 0.73% 0.42% 0.20% 0.96%
536 541 549 559 568 576 585 593 602 611
-8.7 -6.8 -7.7 -6.9 -7.8 -8.0 -8.9 -9.3 -10.1 -10.6 -8.49
-1.62% -1.26% -1.40% -1.24% -1.37% -1.39% -1.52% -1.58% -1.68% -1.74% -1.48%
724 729 729 739 748 754 761 767 773 778
22.6 30.4 28.1 30.2 28.1 27.5 25.1 24.0 22.2 21.3 25.95
3.12% 4.17% 3.85% 4.09% 3.76% 3.65% 3.30% 3.13% 2.87% 2.73% 3.47%
650 645 647 650 654 659 664 669 674 678
-2.1 -1.6 -0.5 -0.7 -0.8 -1.5 -2.0 -2.8 -3.3 -4.0 -1.94
-0.33% -0.25% -0.08% -0.11% -0.12% -0.23% -0.31% -0.42% -0.49% -0.59% -0.29%
4,142 4,150 4,331 4,385 4,415 4,441 4,495 4,572 4,652 4,735
43.4 33.3 37.6 32.1 35.3 33.9 36.7 37.0 39.3 40.4 36.91
1.05% 0.80% 0.87% 0.73% 0.80% 0.76% 0.82% 0.81% 0.85% 0.85% 0.83%
4,277 4,341 4,479 4,568 4,666 4,771 4,870 4,963 5,059 5,153
-13.7 2.3 2.2 8.7 6.2 6.0 3.3 1.7 -0.1 -1.4 1.53
-0.32% 0.05% 0.05% 0.19% 0.13% 0.13% 0.07% 0.03% 0.00% -0.03% 0.03%
1,376 1,387 1,397 1,412 1,428 1,446 1,463 1,481 1,499 1,518
2.7 5.8 4.9 5.1 3.8 3.4 2.1 1.4 0.4 -0.2 2.94
0.19% 0.41% 0.35% 0.36% 0.27% 0.24% 0.14% 0.10% 0.02% -0.01% 0.21%
1,424 1,403 1,435 1,460 1,484 1,508 1,539 1,569 1,602 1,634
152.8 178.2 174.8 182.1 182.1 186.2 185.2 186.1 185.1 186.0 179.85
10.73% 12.70% 12.18% 12.47% 12.27% 12.34% 12.04% 11.86% 11.55% 11.38% 11.95%
884 892 897 903 910 917 923 929 936 942
-39.2 -36.9 -37.0 -36.0 -35.9 -35.4 -35.2 -34.8 -34.5 -34.1 -35.90
-4.43% -4.14% -4.12% -3.99% -3.95% -3.86% -3.82% -3.75% -3.69% -3.61% -3.93%
913 909 916 926 936 945 955 965 974 981
15.6 22.2 19.7 22.0 19.2 18.5 15.9 14.7 12.4 11.0 17.11
1.71% 2.44% 2.15% 2.37% 2.05% 1.96% 1.66% 1.52% 1.28% 1.12% 1.83%
(Thousand Metric Tons)

Table A.21. Su
World Price Baseline
Change
% chg
Total Trade Baseline
Change
% chg
Exports of Selected CouArgentina Baseline
Change
% chg
China Baseline
Change
% chg
Eastern Europe Baseline
Change
% chg
Former Soviet Union Baseline
Change
% chg
Imports of Selected CounEuropean Union Baseline
Change
% chg
Rest of World Baseline
Change
% chg
unflower Seed Price and Trade02/03 03/04 04/05 05/06 06/07 07/08 08/09 09/10 10/11 11/12 Average
257 254 258 260 263 266 268 271 273 276
20.5 2.8 14.0 5.5 12.0 8.2 12.6 10.4 13.9 13.1 11.30
7.99% 1.10% 5.41% 2.11% 4.55% 3.10% 4.69% 3.86% 5.10% 4.74% 4.26%
1,889 1,932 1,906 1,911 1,914 1,922 1,930 1,937 1,942 1,952
216.7 519.3 363.4 437.8 363.8 442.1 413.9 468.1 455.5 498.7 417.92
11.47% 26.88% 19.07% 22.91% 19.00% 23.00% 21.44% 24.17% 23.46% 25.55% 21.70%
untries
478 411 359 361 330 312 299 281 257 240
117.5 448.0 240.2 371.6 268.0 356.0 305.5 368.0 338.6 387.4 320.07
24.56% 108.88% 66.89% 102.91% 81.14% 113.94% 102.22% 131.06% 131.65% 161.35% 102.46%
46 38 32 28 32 26 24 24 24 22
-9.1 -30.0 -38.1 -35.2 -40.4 -37.8 -39.7 -40.0 -40.8 -40.1 -35.13
-19.90% -78.92% -119.3% -125.2% -125.7% -144.9% -166.3% -166.6% -171.4% -178.2% -129.64%
528 528 544 543 566 597 617 638 661 688
-536.1 -561.7 -508.2 -542.2 -508.1 -510.3 -483.1 -480.8 -459.6 -459.8 -504.99
-101.6% -106.3% -93.5% -99.9% -89.8% -85.4% -78.3% -75.3% -69.5% -66.8% -86.65%
837 954 971 979 986 986 991 994 1,000 1,001
644.4 662.9 669.6 643.6 644.4 634.1 631.3 620.9 617.3 611.1 637.95
77.00% 69.51% 68.95% 65.75% 65.36% 64.29% 63.73% 62.47% 61.74% 61.03% 65.98%
untries
1,199 1,130 1,108 1,091 1,068 1,047 1,029 1,005 982 968
-753.1 -607.4 -648.9 -652.8 -654.6 -606.9 -582.8 -534.3 -504.9 -464.4 -601.01
-62.83% -53.76% -58.58% -59.86% -61.30% -57.97% -56.62% -53.17% -51.39% -47.99% -56.35%
692 804 800 822 848 877 903 934 961 986
969.8 1,126.7 1,012.3 1,090.5 1,018.4 1,049.0 996.8 1,002.4 960.4 963.0 1,018.92
140.12% 140.21% 126.57% 132.62% 120.05% 119.56% 110.39% 107.32% 99.89% 97.65% 119.44%
(U.S. Dollars per Metric Ton)
(Thousand Metric Tons)

Table A.22. Su
ArgentinaProduction
Baseline
Change
% chg
Consumption
Baseline
Change
% chg
ChinaProduction
Baseline
Change
% chg
Consumption
Baseline
Change
% chg
Eastern EuropeProduction
Baseline
Change
% chg
Consumption
Baseline
Change
% chg
Former Soviet UnionProduction
Baseline
Change
% chg
Consumption
Baseline
Change
% chg
European UnionProduction
Baseline
Change
% chg
Consumption
Baseline
Change
% chg
Rest of WorldProduction
Baseline
Change
% chg
Consumption
Baseline
Change
% chg
unflower Seed Production and Consumption02/03 03/04 04/05 05/06 06/07 07/08 08/09 09/10 10/11 11/12 Average
4,435 4,405 4,429 4,515 4,567 4,638 4,711 4,780 4,844 4,917
-1.1 318.1 91.9 233.2 120.9 215.1 161.7 227.9 196.2 248.5 181.25
-0.02% 7.22% 2.07% 5.17% 2.65% 4.64% 3.43% 4.77% 4.05% 5.05% 3.90%
3,954 3,993 4,074 4,155 4,240 4,329 4,415 4,502 4,590 4,680
-92.7 -146.1 -137.8 -146.2 -140.9 -144.3 -139.6 -141.9 -139.0 -139.5 -136.81
-2.35% -3.66% -3.38% -3.52% -3.32% -3.33% -3.16% -3.15% -3.03% -2.98% -3.19%
1,982 1,981 1,986 2,002 2,042 2,053 2,074 2,099 2,122 2,142
-0.2 -24.4 -40.9 -33.3 -42.9 -36.4 -40.4 -39.2 -41.5 -39.4 -33.85
-0.01% -1.23% -2.06% -1.66% -2.10% -1.77% -1.95% -1.87% -1.96% -1.84% -1.64%
1,936 1,943 1,954 1,974 2,009 2,027 2,050 2,075 2,098 2,119
8.9 5.6 -2.8 1.9 -2.4 1.4 -0.7 0.8 -0.7 0.7 1.27
0.46% 0.29% -0.14% 0.10% -0.12% 0.07% -0.03% 0.04% -0.03% 0.03% 0.07%
2,343 2,350 2,412 2,493 2,576 2,654 2,728 2,809 2,894 2,981
0.0 10.2 -36.4 -8.6 -32.8 -14.9 -25.1 -13.9 -19.7 -11.7 -15.30
0.00% 0.43% -1.51% -0.35% -1.27% -0.56% -0.92% -0.50% -0.68% -0.39% -0.57%
1,808 1,819 1,868 1,949 2,008 2,054 2,110 2,170 2,232 2,292
531.4 567.5 474.7 531.6 477.0 494.8 459.1 466.5 440.7 448.0 489.12
29.39% 31.20% 25.42% 27.28% 23.75% 24.08% 21.76% 21.50% 19.74% 19.54% 24.37%
6,140 6,260 6,311 6,411 6,510 6,598 6,699 6,793 6,887 6,973
0.0 600.1 400.1 514.4 417.7 497.4 452.7 506.0 478.2 517.5 438.41
0.00% 9.59% 6.34% 8.02% 6.42% 7.54% 6.76% 7.45% 6.94% 7.42% 6.65%
5,304 5,305 5,340 5,432 5,524 5,611 5,708 5,798 5,887 5,971
-636.9 -65.8 -267.8 -130.6 -225.8 -137.3 -178.0 -115.3 -138.7 -93.8 -199.00
-12.01% -1.24% -5.02% -2.40% -4.09% -2.45% -3.12% -1.99% -2.36% -1.57% -3.62%
3,435 3,412 3,424 3,480 3,528 3,580 3,626 3,680 3,730 3,770
-41.3 -85.6 -157.5 -70.3 -123.6 -133.3 -187.5 -216.0 -269.8 -296.0 -158.08
-1.20% -2.51% -4.60% -2.02% -3.50% -3.72% -5.17% -5.87% -7.23% -7.85% -4.37%
4,595 4,517 4,533 4,566 4,594 4,625 4,652 4,682 4,710 4,735
-765.9 -717.9 -792.1 -734.1 -770.3 -745.0 -765.3 -753.1 -770.8 -761.6 -757.60
-16.67% -15.89% -17.47% -16.08% -16.77% -16.11% -16.45% -16.08% -16.36% -16.09% -16.40%
5,497 5,449 5,476 5,524 5,568 5,610 5,656 5,702 5,748 5,792
0.0 -82.4 -149.2 -111.2 -144.4 -117.3 -133.2 -115.2 -124.3 -111.3 -108.85
0.00% -1.51% -2.72% -2.01% -2.59% -2.09% -2.36% -2.02% -2.16% -1.92% -1.94%
6,258 6,221 6,265 6,344 6,410 6,484 6,555 6,632 6,705 6,776
925.2 1,022.9 877.8 969.7 882.5 927.7 869.2 885.2 840.4 851.1 905.18
14.78% 16.44% 14.01% 15.29% 13.77% 14.31% 13.26% 13.35% 12.53% 12.56% 14.03%
(Thousand Metric Tons)

Table A.23. Su
World Price Baseline
Change
% chg
Total Trade Baseline
Change
% chg
Exports of Selected CouArgentina Baseline
Change
% chg
China Baseline
Change
% chg
Eastern Europe Baseline
Change
% chg
Former Soviet Union Baseline
Change
% chg
Imports of Selected CounEuropean Union Baseline
Change
% chg
Rest of World Baseline
Change
% chg
unflower Seed Meal Price and Trade02/03 03/04 04/05 05/06 06/07 07/08 08/09 09/10 10/11 11/12 Average
113 122 127 129 133 136 139 141 144 147
-6.3 -15.9 -12.9 -17.2 -14.8 -15.1 -12.6 -12.8 -11.0 -9.9 -12.86
-5.61% -13.00% -10.21% -13.30% -11.13% -11.10% -9.09% -9.10% -7.65% -6.75% -9.69%
1,732 1,796 1,830 1,899 1,958 2,007 2,065 2,124 2,184 2,246
15.1 146.8 88.7 98.4 76.2 100.3 98.0 112.1 98.2 100.8 93.47
0.87% 8.18% 4.85% 5.18% 3.89% 5.00% 4.74% 5.28% 4.49% 4.49% 4.70%
untries
1,452 1,491 1,514 1,543 1,581 1,617 1,650 1,685 1,723 1,762
-59.5 -101.8 -67.8 -91.0 -71.6 -80.0 -69.9 -77.6 -70.3 -71.3 -76.07
-4.09% -6.83% -4.48% -5.89% -4.53% -4.95% -4.23% -4.61% -4.08% -4.05% -4.77%
0 0 0 0 0 0 0 0 0 0
33.2 9.2 -1.3 -16.3 -20.5 -37.5 -47.6 -57.3 -65.8 -75.9 -27.98
N/A N/A N/A N/A N/A N/A N/A N/A N/A N/A N/A
34 44 49 74 79 75 80 85 91 96
291.4 311.0 289.0 305.1 290.7 306.4 304.0 311.4 301.1 302.6 301.27
854.1% 709.9% 593.0% 411.1% 368.9% 408.5% 380.8% 367.9% 332.5% 316.1% 474.28%
246 261 267 282 299 315 335 354 370 388
-250.1 -71.6 -131.2 -99.4 -122.3 -88.5 -88.6 -64.4 -66.8 -54.6 -103.75
-101.8% -27.4% -49.1% -35.2% -41.0% -28.1% -26.4% -18.2% -18.0% -14.1% -35.9%
untries
1,420 1,425 1,408 1,427 1,429 1,425 1,429 1,436 1,446 1,459
469.1 566.3 476.6 494.5 459.3 497.5 490.6 509.3 491.9 503.2 495.84
33.03% 39.73% 33.85% 34.66% 32.14% 34.90% 34.34% 35.47% 34.01% 34.49% 34.66%
322 381 432 482 539 592 646 697 748 797
-454.0 -419.5 -387.9 -396.1 -383.1 -397.1 -392.6 -397.2 -393.7 -402.4 -402.36
-141.2% -110.2% -89.7% -82.1% -71.1% -67.1% -60.7% -56.9% -52.6% -50.5% -78.2%
(U.S. Dollars per Metric Ton)
(Thousand Metric Tons)

Table A.24. Su
ArgentinaProduction
Baseline
Change
% chg
Consumption
Baseline
Change
% chg
ChinaProduction
Baseline
Change
% chg
Consumption
Baseline
Change
% chg
Eastern EuropeProduction
Baseline
Change
% chg
Consumption
Baseline
Change
% chg
Former Soviet UnionProduction
Baseline
Change
% chg
Consumption
Baseline
Change
% chg
European UnionProduction
Baseline
Change
% chg
Consumption
Baseline
Change
% chg
Rest of WorldProduction
Baseline
Change
% chg
Consumption
Baseline
Change
% chg
unflower Seed Meal Production and Consumption02/03 03/04 04/05 05/06 06/07 07/08 08/09 09/10 10/11 11/12 Average
1,636 1,653 1,687 1,721 1,757 1,794 1,830 1,867 1,904 1,941
-38.7 -62.3 -58.0 -62.0 -59.4 -61.2 -59.0 -60.2 -58.8 -59.2 -57.88
-2.37% -3.77% -3.44% -3.60% -3.38% -3.41% -3.22% -3.22% -3.09% -3.05% -3.26%
189 183 182 184 184 184 186 187 180 183
7.8 19.6 15.9 20.1 17.2 18.1 16.0 16.9 15.3 14.3 16.11
4.12% 10.73% 8.71% 10.94% 9.33% 9.80% 8.61% 9.04% 8.49% 7.82% 8.76%
595 598 601 608 622 626 634 644 653 662
0.1 -6.8 -7.7 -7.8 -8.2 -7.4 -7.3 -7.3 -7.1 -6.7 -6.63
0.01% -1.13% -1.29% -1.28% -1.32% -1.18% -1.16% -1.13% -1.09% -1.02% -1.06%
595 598 601 608 622 626 634 644 653 662
-33.2 -15.9 -6.5 8.6 12.3 30.1 40.3 50.0 58.6 69.2 21.35
-5.57% -2.67% -1.08% 1.41% 1.97% 4.82% 6.36% 7.77% 8.97% 10.46% 3.24%
872 876 900 940 968 990 1,016 1,045 1,075 1,104
264.5 281.4 236.2 263.8 237.3 245.8 228.3 231.8 219.2 222.7 243.09
30.34% 32.10% 26.25% 28.08% 24.51% 24.83% 22.47% 22.18% 20.38% 20.17% 25.13%
837 833 851 865 889 914 936 960 984 1,008
-27.7 -30.7 -52.4 -41.7 -53.1 -60.6 -75.4 -79.6 -81.8 -79.8 -58.26
-3.31% -3.68% -6.15% -4.82% -5.97% -6.62% -8.05% -8.29% -8.31% -7.91% -6.31%
2,045 2,042 2,054 2,089 2,123 2,155 2,191 2,224 2,256 2,286
-255.3 -37.2 -114.0 -61.1 -97.2 -62.9 -78.1 -53.6 -62.1 -44.5 -86.61
-12.48% -1.82% -5.55% -2.93% -4.58% -2.92% -3.56% -2.41% -2.75% -1.95% -4.10%
1,799 1,781 1,787 1,807 1,824 1,840 1,856 1,870 1,886 1,898
-6.0 33.4 17.5 37.8 25.4 25.6 10.8 10.8 4.9 10.2 17.05
-0.33% 1.87% 0.98% 2.09% 1.39% 1.39% 0.58% 0.58% 0.26% 0.54% 0.94%
2,152 2,108 2,118 2,132 2,145 2,159 2,171 2,184 2,197 2,208
-398.6 -378.0 -407.3 -387.3 -400.0 -387.8 -393.2 -386.1 -391.0 -385.3 -391.46
-18.52% -17.93% -19.23% -18.16% -18.65% -17.96% -18.11% -17.68% -17.80% -17.45% -18.15%
3,560 3,535 3,530 3,560 3,576 3,585 3,600 3,620 3,643 3,668
60.3 174.6 74.0 101.3 63.1 109.6 101.2 123.2 103.6 119.6 103.06
1.70% 4.94% 2.10% 2.85% 1.77% 3.06% 2.81% 3.40% 2.84% 3.26% 2.87%
2,396 2,368 2,381 2,412 2,437 2,465 2,493 2,523 2,551 2,578
482.2 525.1 469.1 509.0 475.1 495.7 473.3 481.8 465.3 472.0 484.86
20.13% 22.18% 19.70% 21.10% 19.50% 20.11% 18.99% 19.10% 18.24% 18.30% 19.73%
2,717 2,749 2,814 2,894 2,976 3,057 3,139 3,220 3,299 3,375
27.5 104.9 81.4 112.6 92.2 98.6 80.9 84.6 71.7 69.7 82.42
1.01% 3.82% 2.89% 3.89% 3.10% 3.22% 2.58% 2.63% 2.17% 2.06% 2.74%
(Thousand Metric Tons)

Table A.25. Su
World Price Baseline
Change
% chg
Total Trade Baseline
Change
% chg
Exports of Selected CouArgentina Baseline
Change
% chg
China Baseline
Change
% chg
Eastern Europe Baseline
Change
% chg
Former Soviet Union Baseline
Change
% chg
Imports of Selected CounEuropean Union Baseline
Change
% chg
Rest of World Baseline
Change
% chg
unflower Seed Oil Price and Trade02/03 03/04 04/05 05/06 06/07 07/08 08/09 09/10 10/11 11/12 Average
546 529 535 539 544 551 557 563 569 576
54.3 23.3 43.0 30.4 41.2 34.3 40.8 36.9 42.3 39.8 38.61
9.94% 4.41% 8.03% 5.64% 7.56% 6.22% 7.32% 6.55% 7.43% 6.91% 7.00%
1,210 1,160 1,187 1,225 1,267 1,307 1,347 1,383 1,417 1,451
-169.0 -55.1 -76.9 -60.7 -67.0 -50.5 -46.9 -32.4 -27.3 -16.5 -60.24
-13.96% -4.75% -6.48% -4.95% -5.29% -3.87% -3.48% -2.35% -1.93% -1.14% -4.82%
untries
1,021 1,019 1,049 1,075 1,103 1,133 1,161 1,189 1,218 1,249
-5.1 -60.0 -34.8 -51.9 -37.6 -46.0 -36.4 -41.0 -34.0 -37.1 -38.40
-0.50% -5.89% -3.31% -4.83% -3.41% -4.06% -3.13% -3.45% -2.79% -2.97% -3.44%
0 0 0 0 0 0 0 0 0 0
-1.4 -13.7 -20.0 -27.6 -31.2 -39.7 -46.5 -53.4 -60.5 -68.4 -36.25
N/A N/A N/A N/A N/A N/A N/A N/A N/A N/A N/A
-121 -139 -132 -113 -104 -103 -96 -88 -79 -71
205.0 204.6 180.7 195.6 180.5 183.9 173.3 174.1 166.3 167.7 183.16
-169.3% -146.9% -136.9% -173.3% -173.3% -179.1% -180.9% -198.9% -211.0% -235.2% -180.49%
189 142 138 151 164 174 186 194 199 202
-163.8 5.0 -42.1 -8.8 -29.4 -4.5 -10.6 8.5 6.7 20.6 -21.84
-86.70% 3.50% -30.63% -5.81% -17.91% -2.58% -5.68% 4.42% 3.35% 10.22% -12.78%
untries
98 204 188 194 196 197 200 202 205 208
226.6 268.7 244.8 255.4 241.6 245.2 235.2 236.4 229.1 228.8 241.18
232.3% 131.8% 130.0% 131.9% 123.3% 124.6% 117.8% 117.1% 111.9% 110.0% 133.1%
981 806 855 908 956 997 1,041 1,083 1,122 1,161
-192.1 -132.8 -161.1 -148.1 -159.3 -151.6 -155.3 -148.2 -150.7 -146.0 -154.51
-19.58% -16.48% -18.83% -16.31% -16.66% -15.20% -14.92% -13.69% -13.43% -12.58% -15.77%
(U.S. Dollars per Metric Ton)
(Thousand Metric Tons)

Table A.26. Su
ArgentinaProduction
Baseline
Change
% chg
Consumption
Baseline
Change
% chg
ChinaProduction
Baseline
Change
% chg
Consumption
Baseline
Change
% chg
Eastern EuropeProduction
Baseline
Change
% chg
Consumption
Baseline
Change
% chg
Former Soviet UnionProduction
Baseline
Change
% chg
Consumption
Baseline
Change
% chg
European UnionProduction
Baseline
Change
% chg
Consumption
Baseline
Change
% chg
Rest of WorldProduction
Baseline
Change
% chg
Consumption
Baseline
Change
% chg
unflower Seed Oil Production and Consumption02/03 03/04 04/05 05/06 06/07 07/08 08/09 09/10 10/11 11/12 Average
1,558 1,574 1,607 1,639 1,673 1,709 1,743 1,778 1,813 1,849
-36.9 -59.4 -55.2 -59.1 -56.6 -58.2 -56.2 -57.3 -56.0 -56.4 -55.12
-2.37% -3.77% -3.44% -3.60% -3.38% -3.41% -3.22% -3.22% -3.09% -3.05% -3.26%
539 554 559 565 571 577 583 590 596 601
-23.6 -4.6 -17.1 -9.4 -17.1 -13.4 -18.7 -17.0 -21.0 -19.7 -16.16
-4.39% -0.84% -3.05% -1.66% -2.99% -2.33% -3.20% -2.88% -3.53% -3.27% -2.81%
226 227 228 231 236 237 240 244 248 251
0.0 -2.6 -2.9 -2.9 -3.1 -2.8 -2.8 -2.8 -2.7 -2.5 -2.51
0.01% -1.13% -1.29% -1.28% -1.32% -1.18% -1.16% -1.13% -1.09% -1.02% -1.06%
226 227 228 231 236 237 240 244 248 251
1.5 11.2 17.1 24.7 28.1 36.9 43.7 50.6 57.8 65.8 33.74
0.65% 4.93% 7.50% 10.70% 11.90% 15.53% 18.18% 20.74% 23.33% 26.24% 13.97%
697 701 720 752 775 792 813 836 860 883
211.6 225.1 189.0 211.1 189.8 196.6 182.7 185.5 175.3 178.2 194.47
30.34% 32.10% 26.25% 28.08% 24.51% 24.83% 22.47% 22.18% 20.38% 20.17% 25.13%
816 838 851 864 878 893 908 923 938 954
6.0 18.8 9.4 14.8 9.9 12.4 9.7 11.2 9.3 10.4 11.18
0.73% 2.24% 1.10% 1.71% 1.13% 1.39% 1.07% 1.22% 0.99% 1.09% 1.27%
2,095 2,092 2,105 2,140 2,175 2,208 2,244 2,278 2,311 2,342
-261.6 -38.1 -116.8 -62.6 -99.6 -64.4 -80.0 -54.9 -63.7 -45.6 -88.72
-12.48% -1.82% -5.55% -2.93% -4.58% -2.92% -3.56% -2.41% -2.75% -1.95% -4.10%
1,902 1,947 1,966 1,988 2,010 2,033 2,058 2,084 2,111 2,140
-91.5 -46.7 -72.6 -55.3 -69.1 -60.7 -68.9 -63.9 -69.9 -66.5 -66.51
-4.81% -2.40% -3.69% -2.78% -3.44% -2.99% -3.35% -3.07% -3.31% -3.11% -3.29%
1,739 1,702 1,710 1,722 1,732 1,744 1,754 1,764 1,774 1,783
-321.9 -305.3 -329.0 -312.8 -323.1 -313.2 -317.6 -311.9 -315.8 -311.2 -316.18
-18.52% -17.93% -19.23% -18.16% -18.65% -17.96% -18.11% -17.68% -17.80% -17.45% -18.15%
1,819 1,887 1,899 1,914 1,927 1,939 1,952 1,965 1,978 1,990
-88.0 -47.6 -77.4 -61.9 -78.0 -70.4 -80.4 -76.9 -85.1 -83.4 -74.91
-4.84% -2.52% -4.08% -3.23% -4.05% -3.63% -4.12% -3.91% -4.30% -4.19% -3.89%
2,183 2,157 2,170 2,198 2,220 2,246 2,271 2,298 2,324 2,349
366.9 402.5 348.2 382.5 349.7 366.6 344.5 350.2 333.2 337.1 358.15
16.81% 18.66% 16.05% 17.40% 15.75% 16.32% 15.17% 15.24% 14.33% 14.35% 16.01%
3,156 2,957 3,024 3,104 3,175 3,242 3,311 3,380 3,446 3,510
165.4 264.0 191.3 232.1 192.7 213.8 190.5 201.4 183.4 190.7 202.52
5.24% 8.93% 6.33% 7.48% 6.07% 6.60% 5.75% 5.96% 5.32% 5.43% 6.31%
(Thousand Metric Tons)

Table A.27. Pe
Total Trade Baseline
Change
% chg
Exports of Selected CouArgentina Baseline
Change
% chg
China Baseline
Change
% chg
India Baseline
Change
% chg
United States Baseline
Change
% chg
Imports of Selected CounCanada Baseline
Change
% chg
European Union Baseline
Change
% chg
Mexico Baseline
Change
% chg
Rest of World Baseline
Change
% chg
eanut Price and Trade02/03 03/04 04/05 05/06 06/07 07/08 08/09 09/10 10/11 11/12 Average
1,039 1,063 1,068 1,076 1,079 1,077 1,082 1,087 1,091 1,091
-89.0 -234.3 -275.4 -249.6 -267.9 -243.8 -264.1 -250.2 -266.3 -254.2 -239.47
-8.57% -22.05% -25.79% -23.20% -24.84% -22.64% -24.42% -23.00% -24.42% -23.29% -22.22%
192 218 221 226 231 236 242 247 251 255
2.9 38.7 35.3 40.4 36.1 40.2 36.1 40.3 36.5 39.8 34.63
1.49% 17.78% 15.92% 17.87% 15.62% 17.02% 14.91% 16.33% 14.54% 15.59% 14.71%
529 484 482 480 475 464 460 459 456 451
-92.5 -104.2 -91.4 -110.1 -104.5 -118.0 -115.0 -130.5 -127.6 -139.8 -113.35
-17.46% -21.53% -18.95% -22.93% -22.01% -25.42% -24.97% -28.40% -27.98% -31.00% -24.07%
116 145 150 155 159 163 167 170 173 176
173.7 40.8 -18.9 -1.7 -42.6 -35.4 -77.9 -76.8 -114.5 -120.0 -27.32
149.81% 28.14% -12.65% -1.11% -26.85% -21.67% -46.66% -45.17% -66.27% -68.13% -11.06%
202 216 214 214 214 213 212 211 210 209
-173.1 -209.6 -200.3 -178.2 -157.0 -130.7 -107.3 -83.2 -60.6 -34.2 -133.43
-85.90% -97.04% -93.44% -83.26% -73.28% -61.31% -50.60% -39.40% -28.78% -16.38% -62.94%
untries
122 123 124 125 126 127 128 129 130 131
-11.6 -7.8 -10.8 -8.8 -10.9 -9.6 -11.6 -10.6 -12.2 -11.5 -10.55
-9.58% -6.29% -8.70% -7.07% -8.68% -7.59% -9.05% -8.21% -9.40% -8.81% -8.34%
454 470 471 475 478 481 485 490 494 498
-32.3 -17.3 -27.8 -20.8 -27.8 -22.8 -28.8 -25.0 -30.0 -27.1 -25.95
-7.1% -3.7% -5.9% -4.4% -5.8% -4.7% -5.9% -5.1% -6.1% -5.4% -5.41%
104 107 111 114 116 119 122 125 128 130
-32.8 -27.9 -36.2 -31.8 -37.7 -34.8 -40.1 -38.3 -43.0 -41.9 -36.45
-31.47% -26.03% -32.60% -27.82% -32.42% -29.27% -32.94% -30.67% -33.67% -32.31% -30.92%
273 276 275 275 272 264 261 258 253 246
-12.3 -181.3 -200.6 -188.1 -191.6 -176.7 -183.6 -176.3 -181.1 -173.6 -166.52
-4.50% -65.66% -72.86% -68.39% -70.37% -66.94% -70.45% -68.29% -71.53% -70.47% -62.95%
(Thousand Metric Tons)

Table A.28. Pe
ArgentinaProduction
Baseline
Change
% chg
Consumption
Baseline
Change
% chg
ChinaProduction
Baseline
Change
% chg
Consumption
Baseline
Change
% chg
IndiaProduction
Baseline
Change
% chg
Consumption
Baseline
Change
% chg
United StatesProduction
Baseline
Change
% chg
Consumption
Baseline
Change
% chg
European UnionConsumption
Baseline
Change
% chg
Rest of WorldProduction
Baseline
Change
% chg
Consumption
Baseline
Change
% chg
eanut Production and Consumption02/03 03/04 04/05 05/06 06/07 07/08 08/09 09/10 10/11 11/12 Average
357 389 396 403 410 417 426 434 441 449
-0.3 43.4 37.1 48.8 44.2 54.6 51.3 62.1 60.2 70.4 47.17
-0.09% 11.15% 9.38% 12.12% 10.77% 13.07% 12.04% 14.32% 13.65% 15.70% 11.21%
168 172 174 177 179 181 184 187 190 194
0.3 4.0 2.8 7.9 8.7 14.0 15.9 21.6 24.4 30.5 13.02
0.18% 2.32% 1.60% 4.49% 4.88% 7.74% 8.61% 11.55% 12.79% 15.77% 6.99%
13,628 13,725 13,775 13,774 13,775 13,748 13,806 13,901 13,981 14,031
-1.3 127.7 69.2 174.2 118.1 203.8 137.7 195.6 164.7 233.6 142.34
-0.01% 0.93% 0.50% 1.26% 0.86% 1.48% 1.00% 1.41% 1.18% 1.66% 1.03%
13,098 13,241 13,292 13,294 13,301 13,284 13,345 13,441 13,525 13,580
91.2 231.9 160.6 284.3 222.6 321.8 252.7 326.1 292.3 373.4 255.69
0.70% 1.75% 1.21% 2.14% 1.67% 2.42% 1.89% 2.43% 2.16% 2.75% 1.91%
7,575 7,824 7,916 7,977 8,055 8,140 8,226 8,313 8,396 8,481
0.0 -183.7 -223.7 -157.8 -183.1 -137.3 -157.7 -116.9 -128.9 -93.4 -138.26
0.00% -2.35% -2.83% -1.98% -2.27% -1.69% -1.92% -1.41% -1.54% -1.10% -1.71%
7,459 7,679 7,767 7,822 7,896 7,977 8,060 8,143 8,223 8,304
-173.7 -224.5 -204.8 -156.1 -140.5 -101.9 -79.8 -40.1 -14.4 26.5 -110.94
-2.33% -2.92% -2.64% -2.00% -1.78% -1.28% -0.99% -0.49% -0.18% 0.32% -1.43%
1,598 1,694 1,690 1,695 1,702 1,703 1,707 1,712 1,717 1,719
0.5 -30.1 -57.7 -1.3 -18.3 28.8 24.1 63.8 61.3 100.5 17.16
0.03% -1.77% -3.41% -0.08% -1.08% 1.69% 1.41% 3.73% 3.57% 5.84% 0.99%
1,457 1,472 1,478 1,484 1,489 1,493 1,498 1,503 1,508 1,514
176.5 180.2 158.7 165.7 148.7 151.4 137.9 140.0 127.9 128.3 151.54
12.12% 12.25% 10.74% 11.17% 9.99% 10.14% 9.21% 9.31% 8.48% 8.47% 10.19%
457 469 472 476 479 483 486 491 495 499
-27.1 -18.8 -26.4 -21.6 -26.8 -23.3 -27.9 -25.4 -29.2 -27.4 -25.37
-5.92% -4.01% -5.59% -4.54% -5.58% -4.83% -5.73% -5.17% -5.90% -5.48% -5.28%
8,598 8,841 8,903 8,983 9,063 9,144 9,229 9,313 9,394 9,476
0.0 341.6 241.5 349.8 284.6 369.1 325.1 403.4 374.7 444.2 313.39
0.00% 3.86% 2.71% 3.89% 3.14% 4.04% 3.52% 4.33% 3.99% 4.69% 3.42%
8,876 9,115 9,178 9,258 9,335 9,407 9,489 9,570 9,646 9,722
-1.7 156.4 45.1 159.2 96.0 190.7 144.0 225.9 195.8 269.8 148.12
-0.02% 1.72% 0.49% 1.72% 1.03% 2.03% 1.52% 2.36% 2.03% 2.78% 1.56%
(Thousand Metric Tons)

Table A.29. Pa
World Price Baseline
Change
% chg
Total Trade Baseline
Change
% chg
Exports of Selected CouMalaysia Baseline
Change
% chg
Indonesia Baseline
Change
% chg
Imports of Selected CounChina Baseline
Change
% chg
European Union Baseline
Change
% chg
India Baseline
Change
% chg
Rest of World Baseline
Change
% chg
alm Oil Price and Trade02/03 03/04 04/05 05/06 06/07 07/08 08/09 09/10 10/11 11/12 Average
370 412 437 450 460 471 483 498 514 531
35.3 25.8 19.9 16.1 16.2 16.1 17.6 18.4 19.9 20.3 20.57
9.56% 6.27% 4.55% 3.58% 3.53% 3.41% 3.65% 3.70% 3.86% 3.82% 4.59%
15,281 15,387 15,676 16,015 16,382 16,751 17,129 17,508 17,900 18,308
200.9 245.5 324.8 352.1 370.2 374.6 382.9 390.0 401.5 411.5 345.39
1.31% 1.60% 2.07% 2.20% 2.26% 2.24% 2.24% 2.23% 2.24% 2.25% 2.06%
untries
10,498 10,548 10,753 10,991 11,247 11,494 11,737 11,969 12,202 12,442
94.1 98.4 151.5 168.8 179.2 180.1 184.0 187.3 194.2 200.7 163.83
0.90% 0.93% 1.41% 1.54% 1.59% 1.57% 1.57% 1.56% 1.59% 1.61% 1.43%
4,783 4,839 4,923 5,024 5,135 5,257 5,392 5,540 5,698 5,866
106.7 147.1 173.3 183.3 191.0 194.5 198.9 202.7 207.3 210.7 181.56
2.23% 3.04% 3.52% 3.65% 3.72% 3.70% 3.69% 3.66% 3.64% 3.59% 3.44%
untries
2,148 2,183 2,241 2,316 2,394 2,476 2,562 2,653 2,747 2,842
6.7 12.7 22.0 23.8 25.6 24.4 25.0 25.0 26.2 26.7 21.81
0.31% 0.58% 0.98% 1.03% 1.07% 0.98% 0.98% 0.94% 0.95% 0.94% 0.88%
2,527 2,544 2,562 2,599 2,640 2,677 2,714 2,748 2,784 2,822
-25.1 -6.8 4.0 5.9 6.8 5.6 4.6 3.4 3.1 2.9 0.44
-0.99% -0.27% 0.16% 0.23% 0.26% 0.21% 0.17% 0.12% 0.11% 0.10% 0.01%
4,082 4,142 4,287 4,425 4,583 4,744 4,909 5,077 5,254 5,442
290.3 257.3 269.1 279.4 286.8 292.8 300.1 309.5 319.3 329.0 293.35
7.11% 6.21% 6.28% 6.31% 6.26% 6.17% 6.11% 6.10% 6.08% 6.05% 6.27%
6,381 6,375 6,442 6,531 6,623 6,711 6,802 6,887 6,972 7,060
-71.0 -17.6 29.7 43.0 51.0 51.8 53.1 52.1 52.9 52.9 29.79
-1.11% -0.28% 0.46% 0.66% 0.77% 0.77% 0.78% 0.76% 0.76% 0.75% 0.43%
(U.S. Dollars per Metric Ton)
(Thousand Metric Tons)

Table A.30. Pa
MalaysiaProduction
Baseline
Change
% chg
Consumption
Baseline
Change
% chg
IndonesiaProduction
Baseline
Change
% chg
Consumption
Baseline
Change
% chg
ChinaConsumption
Baseline
Change
% chg
European UnionConsumption
Baseline
Change
% chg
IndiaProduction
Baseline
Change
% chg
Consumption
Baseline
Change
% chg
Rest of WorldProduction
Baseline
Change
% chg
Consumption
Baseline
Change
% chg
alm Oil Production and Consumption02/03 03/04 04/05 05/06 06/07 07/08 08/09 09/10 10/11 11/12 Average
12,089 12,225 12,458 12,781 13,100 13,398 13,683 13,963 14,250 14,545
0.0 103.5 150.1 167.0 171.0 172.9 173.2 177.6 183.3 191.4 149.01
0.00% 0.85% 1.21% 1.31% 1.30% 1.29% 1.27% 1.27% 1.29% 1.32% 1.11%
1,692 1,713 1,738 1,783 1,836 1,891 1,942 1,994 2,048 2,103
-30.1 -18.2 -12.5 -9.0 -8.8 -8.3 -9.1 -9.3 -9.8 -9.7 -12.48
-1.78% -1.06% -0.72% -0.50% -0.48% -0.44% -0.47% -0.47% -0.48% -0.46% -0.69%
8,087 8,162 8,314 8,497 8,694 8,898 9,109 9,329 9,558 9,796
0.0 73.9 113.1 131.3 139.8 145.2 148.3 152.4 156.2 160.7 122.09
0.00% 0.91% 1.36% 1.54% 1.61% 1.63% 1.63% 1.63% 1.63% 1.64% 1.36%
3,311 3,331 3,394 3,474 3,559 3,641 3,718 3,790 3,860 3,930
-96.7 -75.2 -61.4 -52.8 -51.3 -49.4 -50.4 -50.2 -50.8 -50.0 -58.83
-2.92% -2.26% -1.81% -1.52% -1.44% -1.36% -1.36% -1.33% -1.32% -1.27% -1.66%
2,148 2,183 2,241 2,316 2,394 2,476 2,562 2,653 2,747 2,842
6.7 12.7 22.0 23.8 25.6 24.4 25.0 25.0 26.2 26.7 21.81
0.31% 0.58% 0.98% 1.03% 1.07% 0.98% 0.98% 0.94% 0.95% 0.94% 0.88%
2,539 2,548 2,567 2,601 2,640 2,678 2,715 2,750 2,786 2,823
-19.5 -9.9 2.3 4.9 6.8 5.5 4.9 3.5 3.3 2.8 0.45
-0.77% -0.39% 0.09% 0.19% 0.26% 0.21% 0.18% 0.13% 0.12% 0.10% 0.01%
39 38 41 44 47 51 53 56 58 61
0.0 0.0 0.0 0.0 -3.4 -4.0 -4.3 -4.4 -4.4 -4.4 -2.49
0.00% 0.00% 0.00% 0.00% -7.12% -7.96% -8.00% -7.86% -7.54% -7.23% -4.57%
4,168 4,220 4,337 4,474 4,630 4,795 4,964 5,136 5,316 5,506
189.9 237.2 262.4 275.5 283.2 288.3 295.7 303.9 314.0 323.3 277.34
4.56% 5.62% 6.05% 6.16% 6.12% 6.01% 5.96% 5.92% 5.91% 5.87% 5.82%
4,350 4,342 4,361 4,413 4,480 4,548 4,613 4,676 4,741 4,808
0.0 2.2 1.4 -3.8 -7.4 -12.7 -17.1 -20.0 -21.3 -21.9 -10.07
0.00% 0.05% 0.03% -0.09% -0.17% -0.28% -0.37% -0.43% -0.45% -0.46% -0.22%
10,763 10,738 10,813 10,945 11,101 11,259 11,415 11,566 11,716 11,870
-66.0 -23.5 26.2 36.6 43.6 38.8 36.6 32.1 31.9 30.8 18.70
-0.61% -0.22% 0.24% 0.33% 0.39% 0.34% 0.32% 0.28% 0.27% 0.26% 0.16%
(Thousand Metric Tons)
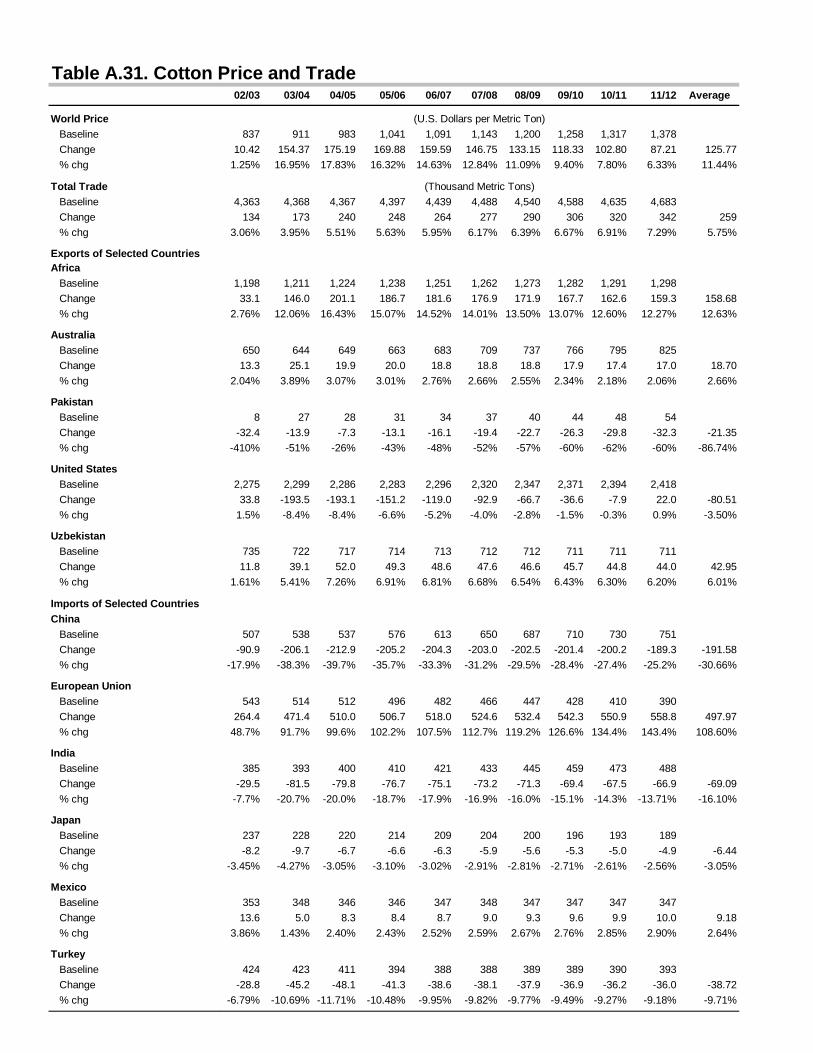
Table A.31. Cotton P
World Price Baseline
Change
% chg
Total Trade Baseline
Change
% chg
Exports of Selected CountriesAfrica Baseline
Change
% chg
Australia Baseline
Change
% chg
Pakistan Baseline
Change
% chg
United States Baseline
Change
% chg
Uzbekistan Baseline
Change
% chg
Imports of Selected CountriesChina Baseline
Change
% chg
European Union Baseline
Change
% chg
India Baseline
Change
% chg
Japan Baseline
Change
% chg
Mexico Baseline
Change
% chg
Turkey Baseline
Change
% chg
Price and Trade02/03 03/04 04/05 05/06 06/07 07/08 08/09 09/10 10/11 11/12 Average
837 911 983 1,041 1,091 1,143 1,200 1,258 1,317 1,378
10.42 154.37 175.19 169.88 159.59 146.75 133.15 118.33 102.80 87.21 125.77
1.25% 16.95% 17.83% 16.32% 14.63% 12.84% 11.09% 9.40% 7.80% 6.33% 11.44%
4,363 4,368 4,367 4,397 4,439 4,488 4,540 4,588 4,635 4,683
134 173 240 248 264 277 290 306 320 342 259
3.06% 3.95% 5.51% 5.63% 5.95% 6.17% 6.39% 6.67% 6.91% 7.29% 5.75%
1,198 1,211 1,224 1,238 1,251 1,262 1,273 1,282 1,291 1,298
33.1 146.0 201.1 186.7 181.6 176.9 171.9 167.7 162.6 159.3 158.68
2.76% 12.06% 16.43% 15.07% 14.52% 14.01% 13.50% 13.07% 12.60% 12.27% 12.63%
650 644 649 663 683 709 737 766 795 825
13.3 25.1 19.9 20.0 18.8 18.8 18.8 17.9 17.4 17.0 18.70
2.04% 3.89% 3.07% 3.01% 2.76% 2.66% 2.55% 2.34% 2.18% 2.06% 2.66%
8 27 28 31 34 37 40 44 48 54
-32.4 -13.9 -7.3 -13.1 -16.1 -19.4 -22.7 -26.3 -29.8 -32.3 -21.35
-410% -51% -26% -43% -48% -52% -57% -60% -62% -60% -86.74%
2,275 2,299 2,286 2,283 2,296 2,320 2,347 2,371 2,394 2,418
33.8 -193.5 -193.1 -151.2 -119.0 -92.9 -66.7 -36.6 -7.9 22.0 -80.51
1.5% -8.4% -8.4% -6.6% -5.2% -4.0% -2.8% -1.5% -0.3% 0.9% -3.50%
735 722 717 714 713 712 712 711 711 711
11.8 39.1 52.0 49.3 48.6 47.6 46.6 45.7 44.8 44.0 42.95
1.61% 5.41% 7.26% 6.91% 6.81% 6.68% 6.54% 6.43% 6.30% 6.20% 6.01%
507 538 537 576 613 650 687 710 730 751
-90.9 -206.1 -212.9 -205.2 -204.3 -203.0 -202.5 -201.4 -200.2 -189.3 -191.58
-17.9% -38.3% -39.7% -35.7% -33.3% -31.2% -29.5% -28.4% -27.4% -25.2% -30.66%
543 514 512 496 482 466 447 428 410 390
264.4 471.4 510.0 506.7 518.0 524.6 532.4 542.3 550.9 558.8 497.97
48.7% 91.7% 99.6% 102.2% 107.5% 112.7% 119.2% 126.6% 134.4% 143.4% 108.60%
385 393 400 410 421 433 445 459 473 488
-29.5 -81.5 -79.8 -76.7 -75.1 -73.2 -71.3 -69.4 -67.5 -66.9 -69.09
-7.7% -20.7% -20.0% -18.7% -17.9% -16.9% -16.0% -15.1% -14.3% -13.71% -16.10%
237 228 220 214 209 204 200 196 193 189
-8.2 -9.7 -6.7 -6.6 -6.3 -5.9 -5.6 -5.3 -5.0 -4.9 -6.44
-3.45% -4.27% -3.05% -3.10% -3.02% -2.91% -2.81% -2.71% -2.61% -2.56% -3.05%
353 348 346 346 347 348 347 347 347 347
13.6 5.0 8.3 8.4 8.7 9.0 9.3 9.6 9.9 10.0 9.18
3.86% 1.43% 2.40% 2.43% 2.52% 2.59% 2.67% 2.76% 2.85% 2.90% 2.64%
424 423 411 394 388 388 389 389 390 393
-28.8 -45.2 -48.1 -41.3 -38.6 -38.1 -37.9 -36.9 -36.2 -36.0 -38.72
-6.79% -10.69% -11.71% -10.48% -9.95% -9.82% -9.77% -9.49% -9.27% -9.18% -9.71%
(Thousand Metric Tons)
(U.S. Dollars per Metric Ton)

Table A.32. Cotton P
AfricaProduction
Baseline
Change
% chg
Consumption
Baseline
Change
% chg
IndiaProduction
Baseline
Change
% chg
Consumption
Baseline
Change
% chg
United StatesProduction
Baseline
Change
% chg
Consumption
Baseline
Change
% chg
Uzbekistan Production
Baseline
Change
% chg
Consumption
Baseline
Change
% chg
ChinaProduction
Baseline
Change
% chg
Consumption
Baseline
Change
% chg
European UnionProduction
Baseline
Change
% chg
Consumption
Baseline
Change
% chg
Production and Consumption02/03 03/04 04/05 05/06 06/07 07/08 08/09 09/10 10/11 11/12 Average
1,800 1,803 1,820 1,837 1,852 1,864 1,877 1,890 1,903 1,915
-9.6 80.5 151.5 138.1 134.6 131.7 128.6 126.5 123.2 120.7 112.58
-0.53% 4.46% 8.32% 7.52% 7.27% 7.06% 6.85% 6.69% 6.48% 6.30% 6.04%
596 590 588 586 587 588 590 593 597 602
-31.9 -57.8 -51.4 -49.1 -47.4 -45.6 -43.7 -41.7 -39.8 -38.8 -44.72
-5.3% -9.8% -8.7% -8.4% -8.1% -7.8% -7.4% -7.0% -6.7% -6.4% -7.56%
2,525 2,543 2,597 2,668 2,725 2,775 2,822 2,870 2,917 2,963
0.0 11.9 31.4 27.6 26.9 26.2 25.3 24.6 23.7 22.8 22.04
0.00% 0.47% 1.21% 1.03% 0.99% 0.94% 0.90% 0.86% 0.81% 0.77% 0.80%
2,904 2,931 2,984 3,058 3,128 3,192 3,253 3,314 3,375 3,436
-23.0 -59.1 -51.0 -49.7 -48.8 -47.6 -46.6 -45.4 -44.4 -44.3 -45.98
-0.79% -2.01% -1.71% -1.62% -1.56% -1.49% -1.43% -1.37% -1.32% -1.29% -1.46%
3,908 3,815 3,772 3,784 3,802 3,811 3,816 3,824 3,831 3,840
-96.5 -696.8 -403.1 -300.4 -257.3 -224.7 -195.2 -156.6 -121.8 -89.8 -254.22
-2.5% -18.3% -10.7% -7.9% -6.8% -5.9% -5.1% -4.1% -3.2% -2.3% -6.68%
1,681 1,649 1,626 1,609 1,595 1,580 1,566 1,553 1,539 1,524
-47.1 -96.8 -102.0 -100.6 -96.4 -91.8 -88.3 -85.8 -80.8 -76.6 -86.63
-2.80% -5.87% -6.27% -6.26% -6.05% -5.81% -5.64% -5.53% -5.25% -5.03% -5.45%
1,022 1,011 1,007 1,006 1,006 1,007 1,008 1,009 1,010 1,011
0.0 30.9 51.5 47.7 46.9 46.0 45.1 44.3 43.3 42.5 39.80
0.00% 3.05% 5.11% 4.74% 4.66% 4.57% 4.47% 4.39% 4.29% 4.20% 3.95%
287 289 290 292 293 295 296 297 299 300
-1.4 -2.3 -2.1 -2.1 -2.0 -2.0 -1.9 -1.9 -1.8 -1.8 -1.95
-0.50% -0.81% -0.73% -0.71% -0.70% -0.67% -0.65% -0.63% -0.61% -0.60% -0.66%
4,769 4,820 4,864 4,912 4,957 4,999 5,042 5,083 5,124 5,166
0.0 44.4 96.8 87.1 86.9 86.5 85.8 85.5 84.5 82.9 74.05
0.00% 0.92% 1.99% 1.77% 1.75% 1.73% 1.70% 1.68% 1.65% 1.61% 1.48%
5,350 5,396 5,439 5,520 5,611 5,661 5,722 5,783 5,859 5,930
-68.1 -136.4 -121.0 -118.9 -118.2 -117.5 -117.5 -117.0 -116.7 -108.9 -114.02
-1.27% -2.53% -2.22% -2.15% -2.11% -2.08% -2.05% -2.02% -1.99% -1.84% -2.03%
545 556 564 572 580 589 598 607 617 627
0.0 -430.0 -442.1 -444.4 -454.2 -461.0 -469.1 -478.4 -486.9 -495.2 -416.14
0.0% -77.4% -78.4% -77.7% -78.2% -78.3% -78.4% -78.8% -78.9% -79.0% -70.51%
1,073 1,056 1,062 1,054 1,048 1,041 1,031 1,022 1,013 1,002
67.0 63.3 64.2 64.4 64.5 64.7 64.9 65.0 65.2 65.3 64.85
6.24% 6.00% 6.05% 6.11% 6.16% 6.22% 6.29% 6.37% 6.44% 6.51% 6.24%
(Thousand Metric Tons)

Table A.33. B
World Price Baseline
Change
% chg
Total Trade Baseline
Change
% chg
Exports of Selected CoArgentina Baseline
Change
% chg
Australia Baseline
Change
% chg
European Union Baseline
Change
% chg
New Zealand Baseline
Change
% chg
Imports of Selected CoBrazil Baseline
Change
% chg
Canada Baseline
Change
% chg
India Baseline
Change
% chg
Indonesia Baseline
Change
% chg
Japan Baseline
Change
% chg
Russia Baseline
Change
% chg
United States Baseline
Change
% chg
Butter Price and Trade2002 2003 2004 2005 2006 2007 2008 2009 2010 2011 Average
1,393 1,456 1,498 1,559 1,585 1,629 1,690 1,765 1,836 1,911
736.6 643.0 613.2 588.3 613.1 626.3 633.9 640.5 636.9 654.0 638.59
52.90% 44.16% 40.94% 37.73% 38.67% 38.45% 37.51% 36.28% 34.69% 34.22% 39.56%
630 628 638 650 668 683 691 700 709 721
131.8 86.6 80.9 52.2 58.7 43.6 37.7 30.2 18.5 30.4 57.07
20.92% 13.80% 12.68% 8.04% 8.79% 6.37% 5.46% 4.32% 2.61% 4.22% 8.72%
ountries
5 6 6 6 6 6 6 6 6 6
5.3 7.2 7.5 7.3 7.6 7.7 7.7 7.7 7.6 7.6 7.30
112% 128% 135% 127% 135% 139% 134% 130% 125% 123% 129%
119 121 119 118 121 122 121 122 122 124
20.4 24.0 32.3 34.6 38.3 39.9 40.2 40.6 33.2 30.8 33.43
17.08% 19.79% 27.03% 29.43% 31.63% 32.63% 33.13% 33.26% 27.09% 24.92% 27.60%
76 87 95 103 111 122 128 137 146 155
-29.9 -132.1 -133.1 -118.7 -133.7 -128.3 -118.9 -111.5 -96.2 -77.0 -107.94
-39% -153% -140% -115% -121% -105% -93% -82% -66% -50% -96%
341 323 326 330 334 337 340 342 344 346
20.5 30.8 32.3 31.3 31.7 32.2 32.0 31.8 31.3 31.2 30.51
6.02% 9.54% 9.91% 9.48% 9.52% 9.54% 9.39% 9.28% 9.10% 9.01% 9.08%
ountries
6 6 6 4 4 3 3 2 1 0
-5.6 -6.6 -6.4 -5.6 -6.3 -7.0 -7.5 -7.9 -8.0 -8.6 -6.95
-96% -116% -115% -127% -160% -201% -279% -453% -792% -2832% -517%
3 1 -1 -1 0 1 1 2 2 2
27.7 45.3 47.4 46.5 44.7 42.8 42.6 41.2 40.1 38.9 41.71
1051% 4413% -4325% -4546% 10585% 2867% 4101% 2550% 2002% 1637% 2033%
19 20 22 22 20 17 12 14 14 17
-135.5 -113.1 -101.5 -75.4 -83.6 -73.9 -59.6 -44.1 -23.1 -10.5 -72.04
-732% -580% -463% -341% -409% -427% -491% -322% -167% -61% -399%
14 14 15 15 15 16 16 16 16 17
1.9 2.0 2.1 2.2 2.2 2.2 2.3 2.4 2.4 2.5 2.22
13.75% 14.25% 14.33% 14.57% 14.46% 14.45% 14.50% 14.57% 14.68% 14.69% 14.42%
3 1 1 1 1 3 3 4 4 4
12.3 15.2 16.4 16.8 17.3 15.6 14.6 13.2 12.2 11.4 14.50
415% 1523% 1641% 1680% 1664% 562% 454% 349% 297% 277% 886%
112 118 125 132 141 150 158 166 174 183
-16.2 -17.2 -19.2 -16.3 -15.3 -13.3 -10.3 -6.4 -2.2 1.6 -11.48
-14.49% -14.63% -15.28% -12.32% -10.85% -8.85% -6.52% -3.87% -1.26% 0.85% -8.72%
9 9 9 9 9 9 9 9 9 9
178.6 67.9 66.9 48.0 45.0 41.9 30.7 15.4 -7.8 -8.6 47.80
2072% 787% 776% 557% 522% 486% 356% 179% -90% -100% 555%
(U.S. Dollars per Metric Ton)
(Thousand Metric Tons)

Table A.34. B
AustraliaProduction
Baseline
WTO
Change
% chg
Consumption
Baseline
WTO
Change
% chg
European UnionProduction
Baseline
WTO
Change
% chg
Consumption
Baseline
WTO
Change
% chg
New ZealandProduction
Baseline
WTO
Change
% chg
Consumption
Baseline
WTO
Change
% chg
United StatesProduction
Baseline
WTO
Change
% chg
Consumption
Baseline
WTO
Change
% chg
Butter Production and Consumption2002 2003 2004 2005 2006 2007 2008 2009 2010 2011 Average
182 182 180 179 182 184 183 184 184 186
196 212 214 214 220 224 223 224 214 216
13.6 29.6 33.3 35.0 37.9 39.6 39.7 40.0 29.3 30.2 32.82
7.47% 16.26% 18.48% 19.59% 20.81% 21.49% 21.68% 21.77% 15.93% 16.30% 17.98%
60 61 61 61 62 62 62 62 62 62
59 60 60 61 61 61 61 61 62 62
-1.2 -1.0 -0.9 -0.8 -0.9 -0.9 -0.8 -0.8 -0.8 -0.8 -0.90
-1.99% -1.63% -1.47% -1.34% -1.42% -1.42% -1.36% -1.33% -1.29% -1.31% -1.46%
1,706 1,704 1,702 1,703 1,704 1,705 1,705 1,703 1,702 1,700
1,617 1,643 1,650 1,649 1,622 1,612 1,606 1,599 1,603 1,608
-88.5 -60.8 -52.4 -53.9 -81.5 -93.5 -99.6 -104.9 -98.8 -92.4 -82.62
-5.19% -3.56% -3.08% -3.17% -4.78% -5.49% -5.84% -6.16% -5.81% -5.43% -4.85%
1,617 1,614 1,604 1,605 1,603 1,594 1,579 1,566 1,554 1,542
1,687 1,685 1,682 1,664 1,646 1,619 1,598 1,575 1,554 1,531
70.4 71.9 78.5 59.0 42.9 25.1 18.5 8.6 0.0 -11.5 36.33
4.35% 4.46% 4.90% 3.67% 2.67% 1.57% 1.17% 0.55% 0.00% -0.75% 2.26%
347 351 354 358 362 366 369 371 373 375
364 378 384 387 391 395 398 400 402 403
16.8 27.7 29.4 28.6 28.9 29.3 29.1 29.0 28.6 28.4 27.58
4.83% 7.89% 8.30% 7.97% 7.99% 8.02% 7.90% 7.80% 7.66% 7.58% 7.59%
27 28 28 28 29 29 29 29 29 29
24 25 25 26 26 26 26 26 26 27
-3.8 -3.2 -2.9 -2.7 -2.8 -2.8 -2.8 -2.8 -2.7 -2.7 -2.93
-13.76% -11.43% -10.40% -9.66% -9.85% -9.82% -9.70% -9.60% -9.34% -9.38% -10.29%
546 547 549 553 555 559 560 562 564 567
408 504 510 525 534 542 554 568 587 593
-137.2 -42.3 -39.6 -27.9 -21.5 -17.4 -6.7 5.3 22.6 26.7 -23.81
-25.1% -7.7% -7.2% -5.0% -3.9% -3.1% -1.2% 0.9% 4.0% 4.7% -4.37%
553 555 558 562 564 568 569 571 573 575
592 582 585 582 587 592 593 592 588 593
38.4 26.5 27.3 20.6 23.2 24.4 24.0 21.0 15.3 17.9 23.87
6.9% 4.8% 4.9% 3.7% 4.1% 4.3% 4.2% 3.7% 2.7% 3.1% 4.24%
(Thousand Metric Tons)

Table A.35. C
World Price Baseline
Change
% chg
Total Trade Baseline
Change
% chg
Exports of Selected CoArgentina Baseline
Change
% chg
Australia Baseline
Change
% chg
European Union Baseline
Change
% chg
New Zealand Baseline
Change
% chg
Switzerland Baseline
Change
% chg
Imports of Selected CoBrazil Baseline
Change
% chg
Canada Baseline
Change
% chg
Japan Baseline
Change
% chg
Mexico Baseline
Change
% chg
Russia Baseline
Change
% chg
United States Baseline
Change
% chg
Cheese Price and Trade2002 2003 2004 2005 2006 2007 2008 2009 2010 2011 Average
2,051 2,108 2,165 2,202 2,221 2,266 2,334 2,392 2,445 2,497
510.8 579.0 479.0 472.3 507.4 514.7 495.4 492.5 495.0 496.3 504.24
24.91% 27.47% 22.13% 21.45% 22.85% 22.71% 21.22% 20.59% 20.25% 19.88% 22.34%
863 887 891 914 946 976 995 1,016 1,034 1,057
53.4 51.7 68.7 78.4 43.8 38.7 36.7 46.0 50.5 62.6 53.05
6.19% 5.83% 7.71% 8.58% 4.63% 3.96% 3.69% 4.52% 4.89% 5.93% 5.59%
ountries
12 24 18 16 12 9 9 8 6 4
7.1 25.5 24.3 24.0 27.4 28.4 26.8 25.9 24.9 24.0 23.82
59% 104% 139% 154% 228% 300% 292% 325% 402% 579% 258%
185 181 191 195 206 213 217 225 232 240
34.2 22.6 19.3 26.3 27.0 28.3 27.9 28.7 29.0 29.4 27.26
18.43% 12.46% 10.12% 13.47% 13.07% 13.32% 12.86% 12.74% 12.49% 12.24% 13.12%
281 288 277 287 301 316 321 327 334 343
-56.5 -72.9 -84.8 -107.5 -161.5 -175.8 -166.6 -150.8 -140.3 -132.7 -124.94
-20.12% -25.32% -30.63% -37.45% -53.61% -55.63% -51.90% -46.06% -42.00% -38.73% -40.14%
271 277 293 305 315 327 336 342 346 349
13.9 2.3 2.1 6.1 10.1 12.4 12.8 13.1 12.8 12.5 9.81
5.15% 0.83% 0.70% 2.00% 3.20% 3.80% 3.82% 3.84% 3.69% 3.57% 3.06%
60 57 52 46 43 41 40 40 39 39
7.6 14.1 19.0 19.5 20.4 20.7 20.3 19.8 19.3 18.7 17.94
12.67% 24.69% 36.39% 42.24% 47.57% 50.43% 51.11% 50.06% 49.03% 47.71% 41.19%
ountries
5 -3 -7 -6 -2 0 1 3 6 9
22.8 47.3 57.3 55.0 51.8 51.4 53.4 54.3 55.1 55.9 50.42
506% -1653% -809% -982% -3010% 110667% 4859% 1937% 944% 600% 11306%
11 11 10 10 8 8 8 8 8 8
68.3 62.3 66.9 67.5 66.6 65.2 63.9 62.5 61.0 59.7 64.39
649% 587% 646% 680% 820% 811% 799% 783% 764% 746% 728%
200 206 210 216 222 228 234 239 244 249
46.0 36.7 30.1 22.4 14.6 6.5 -0.8 -8.0 -15.1 -22.4 11.02
22.97% 17.77% 14.33% 10.39% 6.58% 2.87% -0.32% -3.36% -6.20% -8.97% 5.61%
60 58 57 57 56 51 49 45 39 31
-21.0 -41.1 -52.7 -57.8 -62.7 -65.9 -67.0 -67.0 -66.6 -66.1 -56.80
-35% -71% -92% -102% -112% -129% -137% -150% -170% -210% -121%
108 113 118 125 133 140 147 153 161 169
-31.3 -54.5 -56.8 -51.8 -49.3 -45.7 -41.2 -36.2 -31.5 -26.6 -42.49
-28.92% -48.25% -48.02% -41.29% -37.08% -32.68% -28.09% -23.57% -19.56% -15.80% -32.33%
138 138 137 137 137 137 137 137 137 137
-88.7 -66.6 -51.8 -53.8 -60.6 -66.7 -69.3 -72.1 -72.3 -79.2 -68.11
-64.10% -48% -38% -39% -44% -49% -50% -52% -53% -58% -49.50%
(U.S. Dollars per Metric Ton)
(Thousand Metric Tons)

Table A.36. C
AustraliaProduction
Baseline
Change
% chg
Consumption
Baseline
Change
% chg
European UnionProduction
Baseline
Change
% chg
Consumption
Baseline
Change
% chg
New ZealandProduction
Baseline
Change
% chg
Consumption
Baseline
Change
% chg
United StatesProduction
Baseline
Change
% chg
Consumption
Baseline
Change
% chg
Cheese Production and Consumption2002 2003 2004 2005 2006 2007 2008 2009 2010 2011 Average
363 376 389 401 413 425 437 449 461 473
21.9 16.0 14.0 15.6 17.0 18.2 19.1 19.8 20.3 20.8 18.26
6.02% 4.26% 3.61% 3.88% 4.13% 4.28% 4.36% 4.40% 4.41% 4.39% 4.37%
183 191 198 205 207 212 218 223 228 232
-7.7 -8.5 -5.8 -9.2 -10.0 -10.0 -9.1 -8.9 -8.7 -8.6 -8.64
-4.19% -4.44% -2.91% -4.5% -4.8% -4.7% -4.2% -4.0% -3.8% -3.7% -4.13%
6,273 6,304 6,354 6,434 6,496 6,560 6,577 6,612 6,652 6,693
197.4 7.3 105.5 -17.6 -101.6 -139.3 -117.7 -110.0 -110.1 -112.7 -39.89
3.1% 0.1% 1.7% -0.3% -1.6% -2.1% -1.8% -1.7% -1.7% -1.7% -0.58%
5,977 6,032 6,079 6,136 6,188 6,237 6,267 6,297 6,328 6,359
116.2 88.4 141.4 116.0 88.5 62.7 56.2 48.9 39.9 30.4 78.86
1.94% 1.47% 2.33% 1.89% 1.43% 1.01% 0.90% 0.78% 0.63% 0.48% 1.28%
296 305 322 335 346 359 368 375 380 384
11.7 -0.1 0.1 4.1 8.0 10.4 10.9 11.2 10.9 10.6 7.78
3.96% -0.03% 0.02% 1.24% 2.32% 2.90% 2.95% 2.99% 2.86% 2.75% 2.20%
27 28 29 30 31 31 32 33 34 35
-2.2 -2.4 -2.0 -1.9 -2.0 -2.0 -2.0 -1.9 -1.9 -1.9 -2.03
-8.3% -8.6% -7.0% -6.6% -6.7% -6.5% -6.1% -5.9% -5.7% -5.5% -6.67%
3,898 4,026 4,141 4,249 4,358 4,463 4,574 4,686 4,803 4,913
98 -10 -7 -11 -12 -11 -15 -17 -22 -17 -2.49
2.5% -0.3% -0.2% -0.3% -0.3% -0.2% -0.3% -0.4% -0.5% -0.3% -0.02%
4,022 4,137 4,248 4,358 4,467 4,572 4,683 4,796 4,913 5,023
13 -32 -35 -41 -50 -55 -61 -66 -71 -75 -47.18
0% -1% -1% -1% -1% -1% -1% -1% -1% -1% -1.01%
(Thousand Metric Tons)

Table A.37. N
World Price Baseline
Change
% chg
Total Trade Baseline
Change
% chg
Exports of Selected CoArgentina Baseline
Change
% chg
Australia Baseline
Change
% chg
Canada Baseline
Change
% chg
European Union Baseline
Change
% chg
New Zealand Baseline
Change
% chg
United States Baseline
Change
% chg
Imports of Selected CoBrazil Baseline
Change
% chg
Indonesia Baseline
Change
% chg
Japan Baseline
Change
% chg
Mexico Baseline
Change
% chg
Russia Baseline
Change
% chg
Nonfat Dry Milk Price and Trade2002 2003 2004 2005 2006 2007 2008 2009 2010 2011 Average
1,739 1,772 1,788 1,813 1,843 1,880 1,932 1,963 1,993 2,021
289.9 693.9 635.4 598.8 602.6 595.7 575.6 569.0 575.3 571.1 570.72
16.67% 39.17% 35.53% 33.02% 32.69% 31.68% 29.79% 29.00% 28.86% 28.26% 30.47%
965 954 959 971 986 997 1,001 1,010 1,021 1,033
106.0 32.4 45.7 51.2 59.6 63.3 66.7 68.6 66.7 69.5 62.96
10.99% 3.39% 4.76% 5.27% 6.04% 6.35% 6.66% 6.79% 6.53% 6.73% 6.35%
ountries
21 22 22 23 23 23 24 24 25 25
3.3 8.1 8.3 7.9 8.1 8.1 7.9 7.8 7.8 7.7 7.50
15.17% 36.50% 37.37% 34.94% 34.99% 34.62% 33.06% 32.16% 31.33% 30.64% 32.08%
222 227 222 217 222 224 221 220 219 220
25.0 58.3 62.6 66.5 72.8 75.9 76.0 76.7 60.7 57.9 63.24
11.28% 25.71% 28.21% 30.66% 32.74% 33.85% 34.40% 34.88% 27.70% 26.32% 28.57%
36 35 37 37 35 32 32 31 30 29
-37.4 -71.9 -81.0 -81.1 -78.9 -76.8 -77.2 -76.4 -75.4 -74.7 -73.08
-105% -206% -216% -219% -229% -240% -241% -247% -255% -262% -222%
95 106 101 104 107 111 112 112 113 113
-35.9 -107.5 -121.5 -121.4 -126.9 -129.2 -120.5 -116.5 -106.9 -99.0 -108.53
-38% -102% -121% -116% -118% -117% -108% -104% -95% -87% -101%
198 192 196 202 208 213 218 221 224 227
12.3 35.9 39.0 36.7 36.9 37.3 36.8 36.4 35.7 35.4 34.26
6.23% 18.72% 19.92% 18.19% 17.77% 17.52% 16.91% 16.46% 15.94% 15.61% 16.33%
178 135 130 124 115 106 97 97 97 97
154.7 41.5 36.7 42.4 47.4 51.2 58.5 59.3 65.3 60.1 61.71
86.76% 30.71% 28.29% 34.23% 41.33% 48.41% 60.56% 61.36% 67.63% 62.19% 52.15%
ountries
12 12 13 13 12 12 12 12 13 13
-5.1 -15.2 -15.9 -15.3 -15.4 -15.7 -15.9 -16.2 -16.6 -17.0 -14.83
-43% -125% -123% -122% -128% -131% -135% -133% -132% -129% -120%
101 104 107 110 113 115 118 121 124 126
13.3 11.3 11.8 12.4 12.7 13.1 13.7 14.1 14.4 14.8 13.16
13.22% 10.82% 11.02% 11.25% 11.28% 11.38% 11.55% 11.63% 11.64% 11.70% 11.55%
42 30 28 31 41 46 50 53 55 57
-22.3 -16.5 -12.0 -13.0 -15.2 -19.9 -25.0 -30.6 -35.2 -39.0 -22.86
-53.02% -54.34% -43.13% -42.07% -36.97% -42.72% -50.30% -57.85% -63.48% -67.87% -51.17%
90 95 98 102 105 107 110 113 116 119
-6.0 -7.9 -8.3 -8.7 -9.3 -9.6 -9.7 -9.9 -10.1 -10.2 -8.97
-6.69% -8.33% -8.46% -8.60% -8.82% -8.95% -8.82% -8.71% -8.65% -8.56% -8.46%
42 43 42 39 36 33 30 26 22 18
-4.1 -20.8 -25.0 -22.2 -20.3 -17.6 -14.4 -10.5 -6.8 -2.7 -14.44
-9.62% -48.58% -58.97% -56.47% -56.51% -53.98% -48.88% -40.56% -30.26% -14.66% -41.85%
(Thousand Metric Tons)
(U.S. Dollars per Metric Ton)

Table A.38. N
AustraliaProduction
Baseline
Change
% chg
Consumption
Baseline
Change
% chg
European UnionProduction
Baseline
Change
% chg
Consumption
Baseline
Change
% chg
New ZealandProduction
Baseline
Change
% chg
Consumption
Baseline
Change
% chg
United StatesProduction
Baseline
Change
% chg
Consumption
Baseline
Change
% chg
Nonfat Dry Milk Production and Consumption2002 2003 2004 2005 2006 2007 2008 2009 2010 2011 Average
264 262 256 251 256 258 255 254 253 254
23.4 55.2 62.6 65.5 71.0 74.0 74.2 74.6 54.0 55.7 61.02
8.88% 21.06% 24.40% 26.10% 27.69% 28.67% 29.13% 29.41% 21.35% 21.94% 23.86%
33 34 34 34 34 34 34 34 34 33
-1.6 -3.7 -3.2 -2.9 -2.9 -2.9 -2.6 -2.5 -2.5 -2.4 -2.73
-4.88% -10.94% -9.40% -8.40% -8.72% -8.53% -7.80% -7.53% -7.45% -7.35% -8.10%
972 961 946 931 922 911 907 896 884 873
-206.4 -122.3 -120.9 -105.5 -107.8 -105.3 -100.0 -91.2 -78.7 -65.1 -110.33
-21.22% -12.74% -12.78% -11.33% -11.69% -11.55% -11.03% -10.18% -8.90% -7.46% -11.89%
861 853 845 838 828 818 802 789 776 763
65.3 -13.0 1.2 5.2 4.9 7.1 13.6 20.4 24.2 30.6 15.94
7.59% -1.53% 0.14% 0.62% 0.59% 0.87% 1.69% 2.59% 3.12% 4.01% 1.97%
198 203 207 214 219 225 230 233 236 239
11.6 34.2 37.5 35.4 35.5 36.0 35.6 35.2 34.5 34.2 32.97
5.86% 16.85% 18.10% 16.56% 16.20% 16.01% 15.49% 15.10% 14.61% 14.32% 14.91%
11 11 11 12 12 12 12 12 12 12
-0.7 -1.7 -1.5 -1.4 -1.4 -1.3 -1.3 -1.2 -1.2 -1.2 -1.28
-6.61% -14.98% -13.02% -11.83% -11.65% -11.24% -10.61% -10.22% -10.05% -9.71% -10.99%
623 608 592 576 555 539 515 494 472 454
-254.4 -66.8 -58.6 -39.6 -23.2 -13.7 8.8 31.8 63.3 74.3 -27.80
-41% -11% -10% -7% -4% -3% 2% 6% 13% 16% -3.74%
403 406 409 399 402 402 406 408 410 410
-15.0 -40.4 -42.9 -30.0 -34.1 -35.3 -38.2 -38.8 -38.4 -40.1 -35.33
-3.7% -10.0% -10.5% -7.5% -8.5% -8.8% -9.4% -9.5% -9.4% -9.8% -8.70%
(Thousand Metric Tons)

Table A.39. W
World Price Baseline
Change
% chg
Total Trade Baseline
Change
% chg
Exports of Selected CoArgentina Baseline
Change
% chg
Australia Baseline
Change
% chg
European Union Baseline
Change
% chg
New Zealand Baseline
Change
% chg
Imports of Selected CoBrazil Baseline
Change
% chg
China Baseline
Change
% chg
Indonesia Baseline
Change
% chg
Malaysia Baseline
Change
% chg
Mexico Baseline
Change
% chg
Russia Baseline
Change
% chg
South Korea Baseline
Change
% chg
Whole Milk Powder Price and Trade2002 2003 2004 2005 2006 2007 2008 2009 2010 2011 Average
1,788 1,826 1,847 1,870 1,892 1,924 1,964 1,998 2,030 2,064
458.2 577.3 512.1 495.5 492.6 480.3 470.6 466.4 473.8 469.7 489.64
25.63% 31.61% 27.73% 26.50% 26.04% 24.96% 23.96% 23.34% 23.33% 22.76% 25.59%
1,277 1,293 1,304 1,326 1,345 1,356 1,368 1,377 1,385 1,393
76.3 35.8 69.5 75.3 83.5 94.1 99.1 106.4 108.6 118.7 86.72
5.98% 2.77% 5.33% 5.68% 6.21% 6.94% 7.24% 7.73% 7.84% 8.52% 6.42%
ountries
100 104 107 108 109 111 113 116 118 120
20.8 18.3 16.7 17.9 17.6 16.9 16.9 16.7 17.1 16.5 17.56
20.92% 17.58% 15.68% 16.53% 16.18% 15.17% 14.90% 14.45% 14.54% 13.74% 15.97%
193 197 200 201 202 203 205 206 206 207
12.3 18.9 24.5 28.5 33.2 35.9 36.7 37.7 23.9 25.7 27.74
6.36% 9.58% 12.25% 14.14% 16.46% 17.64% 17.92% 18.35% 11.58% 12.44% 13.67%
476 478 471 478 484 480 479 478 478 478
9.2 -53.8 -48.9 -72.7 -84.1 -82.5 -78.8 -75.4 -68.4 -65.6 -62.10
1.94% -11.26% -10.38% -15.23% -17.39% -17.20% -16.47% -15.76% -14.31% -13.73% -12.98%
508 513 526 539 550 562 571 577 583 588
34.0 16.3 10.6 15.1 15.8 15.5 16.3 16.5 17.2 15.9 17.33
6.69% 3.17% 2.02% 2.81% 2.88% 2.75% 2.86% 2.86% 2.95% 2.71% 3.17%
ountries
23 21 21 23 24 24 26 30 33 37
-0.7 6.6 12.1 10.4 12.9 15.7 16.5 17.2 16.3 18.1 12.50
-3.11% 30.72% 56.39% 44.63% 54.86% 64.70% 62.45% 58.36% 49.18% 48.50% 46.67%
25 12 8 21 29 39 52 59 63 64
7.8 -47.6 -74.4 -107.2 -130.0 -147.1 -160.0 -170.1 -181.4 -190.5 -120.06
31% -413% -947% -519% -446% -380% -307% -287% -290% -296% -385%
12 12 13 13 13 14 14 14 15 15
2.8 2.8 2.9 3.0 3.1 3.2 3.3 3.4 3.4 3.5 3.13
23.71% 22.93% 23.09% 23.24% 23.23% 23.31% 23.43% 23.49% 23.48% 23.52% 23.34%
47 48 50 51 53 55 57 59 61 63
-0.5 -0.7 -0.6 -0.6 -0.6 -0.6 -0.6 -0.6 -0.6 -0.6 -0.60
-1.13% -1.36% -1.18% -1.11% -1.12% -1.08% -1.03% -1.01% -1.01% -1.00% -1.10%
23 25 26 27 30 31 31 32 33 34
4.9 4.0 1.4 0.6 0.2 0.0 0.0 0.3 0.7 1.2 1.33
21.10% 15.89% 5.49% 2.12% 0.64% 0.16% 0.10% 1.04% 2.17% 3.55% 5.23%
23 23 22 21 20 19 17 15 13 12
-0.4 -7.1 -7.7 -6.2 -6.1 -5.5 -4.2 -2.8 -1.4 -0.2 -4.15
-1.72% -30.83% -34.41% -29.60% -30.52% -29.47% -24.54% -18.53% -10.40% -1.65% -21.17%
0 0 0 0 1 1 1 1 1 1
2.7 3.0 3.0 3.0 3.0 3.0 3.1 3.1 3.1 3.1 3.01
559% 646% 720% 831% 530% 471% 523% 501% 473% 426% 568%
(Thousand Metric Tons)
(U.S. Dollars per Metric Ton)
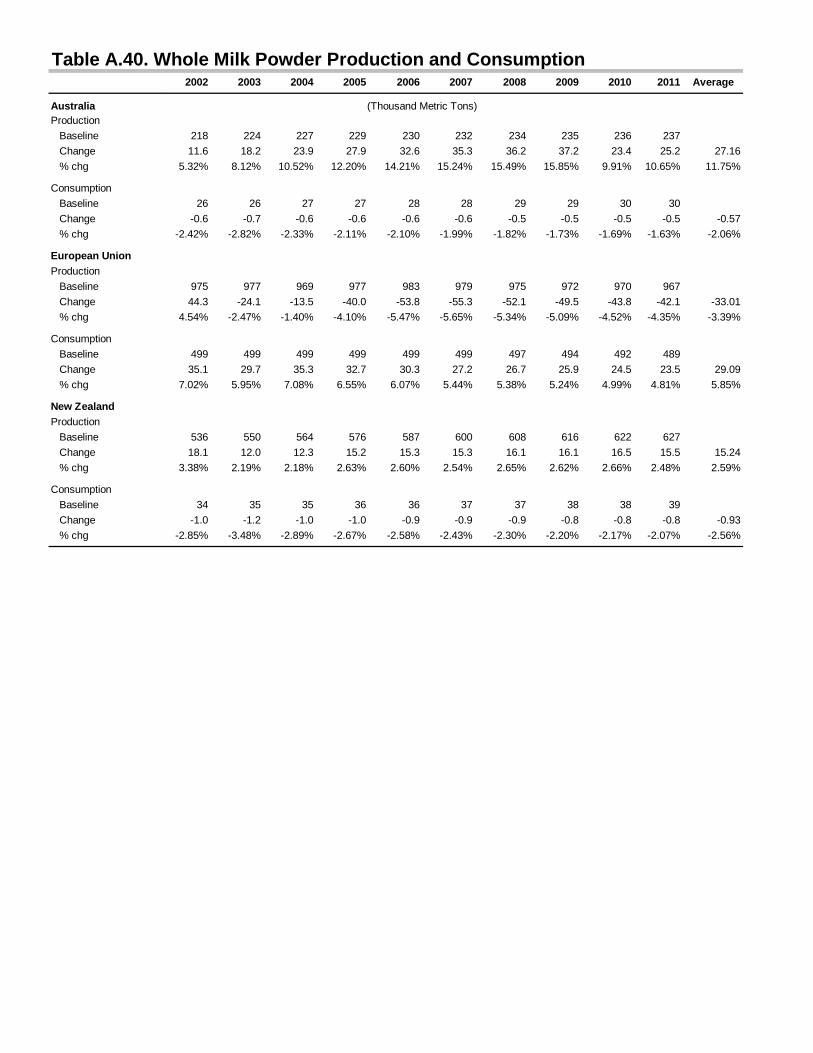
Table A.40. W
AustraliaProduction
Baseline
Change
% chg
Consumption
Baseline
Change
% chg
European UnionProduction
Baseline
Change
% chg
Consumption
Baseline
Change
% chg
New ZealandProduction
Baseline
Change
% chg
Consumption
Baseline
Change
% chg
Whole Milk Powder Production and Consumption2002 2003 2004 2005 2006 2007 2008 2009 2010 2011 Average
218 224 227 229 230 232 234 235 236 237
11.6 18.2 23.9 27.9 32.6 35.3 36.2 37.2 23.4 25.2 27.16
5.32% 8.12% 10.52% 12.20% 14.21% 15.24% 15.49% 15.85% 9.91% 10.65% 11.75%
26 26 27 27 28 28 29 29 30 30
-0.6 -0.7 -0.6 -0.6 -0.6 -0.6 -0.5 -0.5 -0.5 -0.5 -0.57
-2.42% -2.82% -2.33% -2.11% -2.10% -1.99% -1.82% -1.73% -1.69% -1.63% -2.06%
975 977 969 977 983 979 975 972 970 967
44.3 -24.1 -13.5 -40.0 -53.8 -55.3 -52.1 -49.5 -43.8 -42.1 -33.01
4.54% -2.47% -1.40% -4.10% -5.47% -5.65% -5.34% -5.09% -4.52% -4.35% -3.39%
499 499 499 499 499 499 497 494 492 489
35.1 29.7 35.3 32.7 30.3 27.2 26.7 25.9 24.5 23.5 29.09
7.02% 5.95% 7.08% 6.55% 6.07% 5.44% 5.38% 5.24% 4.99% 4.81% 5.85%
536 550 564 576 587 600 608 616 622 627
18.1 12.0 12.3 15.2 15.3 15.3 16.1 16.1 16.5 15.5 15.24
3.38% 2.19% 2.18% 2.63% 2.60% 2.54% 2.65% 2.62% 2.66% 2.48% 2.59%
34 35 35 36 36 37 37 38 38 39
-1.0 -1.2 -1.0 -1.0 -0.9 -0.9 -0.9 -0.8 -0.8 -0.8 -0.93
-2.85% -3.48% -2.89% -2.67% -2.58% -2.43% -2.30% -2.20% -2.17% -2.07% -2.56%
(Thousand Metric Tons)

Table A.41. B
World Price Baseline
Change
% chg
Total Trade Baseline
Change
% chg
Exports of Selected CArgentina Baseline
Change
% chg
Australia Baseline
Change
% chg
Brazil Baseline
Change
% chg
Canada Baseline
Change
% chg
European Union * Baseline
Change
% chg
New Zealand Baseline
Change
% chg
United States Baseline
Change
% chg
Imports of Selected CJapan Baseline
Change
% chg
Mexico Baseline
Change
% chg
Philippines Baseline
Change
% chg
South Korea Baseline
Change
% chg
* Includes meat and me
Beef Price and Trade2002 2003 2004 2005 2006 2007 2008 2009 2010 2011 Average
1,641 1,684 1,730 1,681 1,613 1,545 1,506 1,481 1,507 1,543
145.6 162.5 183.5 126.6 36.4 -16.2 -34.1 -19.3 8.0 43.8 63.68
8.87% 9.65% 10.61% 7.54% 2.26% -1.05% -2.26% -1.30% 0.53% 2.84% 3.77%
2,906 3,218 3,484 3,726 3,990 4,123 4,171 4,233 4,171 4,158
361 432 387 385 381 323 278 254 270 309 337.95
12.42% 13.42% 11.10% 10.35% 9.54% 7.84% 6.67% 6.00% 6.47% 7.44% 9.12%
Countries
194 280 330 322 323 326 347 362 408 438
115.5 77.4 89.5 76.0 78.0 115.5 159.6 198.8 218.7 223.0 135.20
59.62% 27.62% 27.15% 23.59% 24.17% 35.37% 45.96% 55.01% 53.66% 50.86% 40.30%
1,370 1,421 1,478 1,484 1,539 1,526 1,478 1,450 1,433 1,404
62.3 25.9 51.5 84.5 126.5 178.3 204.3 216.5 219.2 214.2 138.31
4.55% 1.82% 3.48% 5.69% 8.22% 11.68% 13.82% 14.93% 15.30% 15.26% 9.47%
510 575 607 752 825 841 839 820 838 854
94.4 111.7 155.3 135.6 72.4 24.1 -2.2 4.1 24.4 54.7 67.43
18.51% 19.44% 25.57% 18.04% 8.78% 2.86% -0.26% 0.50% 2.91% 6.40% 10.27%
250 274 310 332 376 411 451 478 499 504
55.1 28.3 25.2 22.0 26.9 43.6 52.4 49.4 34.5 15.2 35.25
22.05% 10.32% 8.13% 6.62% 7.16% 10.61% 11.63% 10.33% 6.91% 3.01% 9.68%
369 370 420 418 413 411 410 409 410 411
18.4 -153.3 -511.6 -525.4 -461.5 -550.6 -603.4 -636.7 -633.9 -614.7 -467.29
5% -41% -122% -126% -112% -134% -147% -156% -155% -150% -114%
538 570 600 591 584 570 568 570 593 612
50.7 33.0 40.4 30.9 16.3 12.7 14.1 24.6 35.6 45.2 30.35
9.41% 5.79% 6.74% 5.23% 2.79% 2.23% 2.48% 4.32% 5.99% 7.38% 5.24%
-497 -495 -507 -348 -151 30 127 239 67 -3
341.1 507.4 623.4 709.7 725.0 744.1 720.8 670.4 623.4 595.3 626.06
-69% -102% -123% -204% -479% 2479% 569% 280% 931% -18673% -1539%
Countries
912 919 930 961 997 1,031 1,059 1,082 1,096 1,104
213.5 201.4 189.8 200.4 222.0 225.7 217.9 200.3 185.8 172.0 202.87
23.40% 21.92% 20.42% 20.86% 22.26% 21.90% 20.58% 18.51% 16.95% 15.57% 20.24%
473 593 645 693 742 681 595 546 511 539
-102.1 53.7 62.8 44.9 -40.0 -164.1 -238.2 -251.5 -210.4 -147.3 -99.22
-21.58% 9.06% 9.74% 6.47% -5.39% -24.08% -40.00% -46.03% -41.18% -27.36% -18.03%
90 99 102 113 125 136 143 148 144 138
80.5 57.7 47.9 62.7 86.9 107.4 119.2 120.9 115.0 107.5 90.58
89.58% 58.06% 47.13% 55.54% 69.77% 79.05% 83.37% 81.46% 80.05% 77.66% 72.17%
232 250 265 284 303 321 336 349 356 361
48.5 47.9 43.3 45.5 52.5 60.0 66.3 70.4 72.7 74.0 58.11
20.89% 19.20% 16.32% 16.04% 17.33% 18.70% 19.72% 20.19% 20.42% 20.50% 18.93%
eat equivalent of live cattle trade.
(U.S. Dollars per Metric Ton)
(Thousand Metric Tons)

Table A.42. B
ArgentinaProduction
Baseline
Change
% chg
Consumption
Baseline
Change
% chg
AustraliaProduction
Baseline
Change
% chg
Consumption
Baseline
Change
% chg
BrazilProduction
Baseline
Change
% chg
Consumption
Baseline
Change
% chg
China - MainlandProduction
Baseline
Change
% chg
Consumption
Baseline
Change
% chg
European Union *Production
Baseline
Change
% chg
Consumption
Baseline
Change
% chg
MexicoProduction
Baseline
Change
% chg
Consumption
Baseline
Change
% chg
* Includes meat and me
Beef Production and Consumption2002 2003 2004 2005 2006 2007 2008 2009 2010 2011 Average
2,902 2,946 3,010 3,045 3,096 3,152 3,221 3,280 3,356 3,416
77.3 40.0 49.8 46.5 66.9 117.9 167.8 204.3 217.1 212.3 119.97
2.7% 1.4% 1.7% 1.5% 2.2% 3.7% 5.2% 6.2% 6.5% 6.2% 3.72%
2,709 2,665 2,680 2,723 2,773 2,826 2,873 2,918 2,949 2,977
-38.1 -37.4 -39.8 -29.5 -11.1 2.4 8.2 5.5 -1.7 -10.7 -15.23
-1.4% -1.4% -1.5% -1.1% -0.4% 0.1% 0.3% 0.2% -0.1% -0.4% -0.56%
2,038 2,099 2,165 2,188 2,255 2,260 2,233 2,221 2,208 2,179
54.3 16.1 40.0 75.3 124.7 182.7 212.5 223.1 221.3 211.2 136.11
2.7% 0.8% 1.8% 3.4% 5.5% 8.1% 9.5% 10.0% 10.0% 9.7% 6.16%
668 678 687 704 716 733 755 770 775 775
-7.7 -9.8 -11.5 -9.3 -2.0 4.3 8.1 6.7 2.2 -2.8 -2.18
-1.2% -1.4% -1.7% -1.3% -0.3% 0.6% 1.1% 0.9% 0.3% -0.4% -0.34%
6,883 7,089 7,220 7,520 7,767 7,966 8,134 8,278 8,417 8,545
61.2 66.5 99.7 106.8 94.9 87.7 80.5 79.7 78.6 81.5 83.72
0.9% 0.9% 1.4% 1.4% 1.2% 1.1% 1.0% 1.0% 0.9% 1.0% 1.08%
6,373 6,515 6,613 6,768 6,942 7,125 7,296 7,458 7,578 7,691
-33.1 -45.2 -55.6 -28.9 22.5 63.6 82.7 75.6 54.3 26.9 16.29
-0.5% -0.7% -0.8% -0.4% 0.3% 0.9% 1.1% 1.0% 0.7% 0.3% 0.20%
5,847 6,103 6,374 6,650 6,963 7,276 7,613 8,000 8,432 8,899
-158.0 -70.2 -45.0 -91.5 -116.7 -119.2 -114.9 -109.5 -106.7 -101.4 -103.32
-2.7% -1.2% -0.7% -1.4% -1.7% -1.6% -1.5% -1.4% -1.3% -1.1% -1.45%
5,819 6,071 6,348 6,642 6,979 7,322 7,693 8,115 8,574 9,067
168.8 107.0 32.8 37.5 46.6 50.7 49.9 45.8 41.2 35.2 61.53
2.9% 1.8% 0.5% 0.6% 0.7% 0.7% 0.6% 0.6% 0.5% 0.4% 0.92%
7,271 7,492 7,438 7,397 7,377 7,322 7,281 7,254 7,231 7,205
-206.6 -157.4 -202.7 -258.1 -303.9 -331.7 -355.6 -389.1 -414.5 -431.0 -305.05
-2.8% -2.1% -2.7% -3.5% -4.1% -4.5% -4.9% -5.4% -5.7% -6.0% -4.18%
6,827 7,099 7,340 7,258 7,014 6,961 6,921 6,895 6,870 6,844
150.3 19.3 -12.8 -11.6 107.6 169.1 198.2 197.9 169.6 133.7 112.13
2.2% 0.3% -0.2% -0.2% 1.5% 2.4% 2.9% 2.9% 2.5% 2.0% 1.63%
1,887 1,776 1,756 1,773 1,797 1,917 2,057 2,154 2,227 2,234
48.4 -87.6 -102.3 -69.9 43.3 190.3 276.0 287.0 234.5 155.7 97.53
3% -5% -6% -4% 2% 10% 13% 13% 11% 7% 4.44%
2,360 2,369 2,401 2,467 2,539 2,598 2,653 2,701 2,738 2,773
-53.8 -33.9 -39.5 -25.1 3.4 26.2 37.8 35.4 24.1 8.3 -1.69
-2% -1% -2% -1% 0% 1% 1% 1% 1% 0% -0.13%
eat equivalent of live cattle trade.
(Thousand Metric Tons)
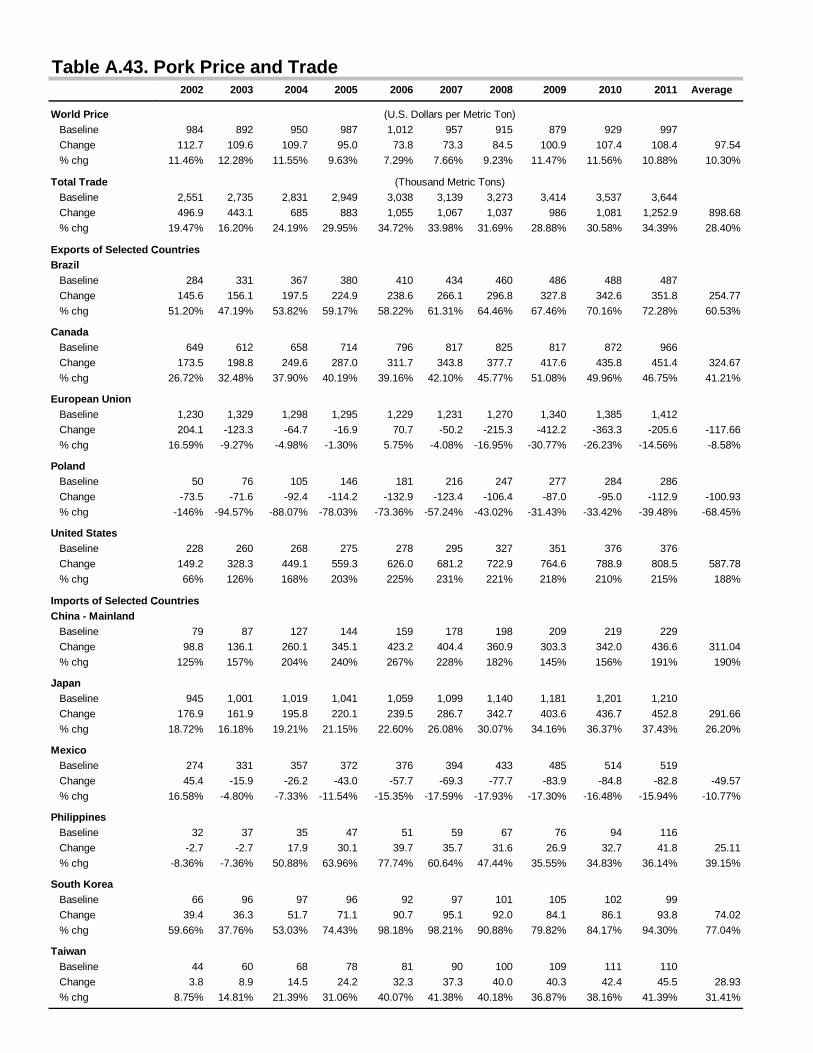
Table A.43. P
World Price Baseline
Change
% chg
Total Trade Baseline
Change
% chg
Exports of Selected CBrazil Baseline
Change
% chg
Canada Baseline
Change
% chg
European Union Baseline
Change
% chg
Poland Baseline
Change
% chg
United States Baseline
Change
% chg
Imports of Selected CChina - Mainland Baseline
Change
% chg
Japan Baseline
Change
% chg
Mexico Baseline
Change
% chg
Philippines Baseline
Change
% chg
South Korea Baseline
Change
% chg
Taiwan Baseline
Change
% chg
Pork Price and Trade2002 2003 2004 2005 2006 2007 2008 2009 2010 2011 Average
984 892 950 987 1,012 957 915 879 929 997
112.7 109.6 109.7 95.0 73.8 73.3 84.5 100.9 107.4 108.4 97.54
11.46% 12.28% 11.55% 9.63% 7.29% 7.66% 9.23% 11.47% 11.56% 10.88% 10.30%
2,551 2,735 2,831 2,949 3,038 3,139 3,273 3,414 3,537 3,644
496.9 443.1 685 883 1,055 1,067 1,037 986 1,081 1,252.9 898.68
19.47% 16.20% 24.19% 29.95% 34.72% 33.98% 31.69% 28.88% 30.58% 34.39% 28.40%
Countries
284 331 367 380 410 434 460 486 488 487
145.6 156.1 197.5 224.9 238.6 266.1 296.8 327.8 342.6 351.8 254.77
51.20% 47.19% 53.82% 59.17% 58.22% 61.31% 64.46% 67.46% 70.16% 72.28% 60.53%
649 612 658 714 796 817 825 817 872 966
173.5 198.8 249.6 287.0 311.7 343.8 377.7 417.6 435.8 451.4 324.67
26.72% 32.48% 37.90% 40.19% 39.16% 42.10% 45.77% 51.08% 49.96% 46.75% 41.21%
1,230 1,329 1,298 1,295 1,229 1,231 1,270 1,340 1,385 1,412
204.1 -123.3 -64.7 -16.9 70.7 -50.2 -215.3 -412.2 -363.3 -205.6 -117.66
16.59% -9.27% -4.98% -1.30% 5.75% -4.08% -16.95% -30.77% -26.23% -14.56% -8.58%
50 76 105 146 181 216 247 277 284 286
-73.5 -71.6 -92.4 -114.2 -132.9 -123.4 -106.4 -87.0 -95.0 -112.9 -100.93
-146% -94.57% -88.07% -78.03% -73.36% -57.24% -43.02% -31.43% -33.42% -39.48% -68.45%
228 260 268 275 278 295 327 351 376 376
149.2 328.3 449.1 559.3 626.0 681.2 722.9 764.6 788.9 808.5 587.78
66% 126% 168% 203% 225% 231% 221% 218% 210% 215% 188%
Countries
79 87 127 144 159 178 198 209 219 229
98.8 136.1 260.1 345.1 423.2 404.4 360.9 303.3 342.0 436.6 311.04
125% 157% 204% 240% 267% 228% 182% 145% 156% 191% 190%
945 1,001 1,019 1,041 1,059 1,099 1,140 1,181 1,201 1,210
176.9 161.9 195.8 220.1 239.5 286.7 342.7 403.6 436.7 452.8 291.66
18.72% 16.18% 19.21% 21.15% 22.60% 26.08% 30.07% 34.16% 36.37% 37.43% 26.20%
274 331 357 372 376 394 433 485 514 519
45.4 -15.9 -26.2 -43.0 -57.7 -69.3 -77.7 -83.9 -84.8 -82.8 -49.57
16.58% -4.80% -7.33% -11.54% -15.35% -17.59% -17.93% -17.30% -16.48% -15.94% -10.77%
32 37 35 47 51 59 67 76 94 116
-2.7 -2.7 17.9 30.1 39.7 35.7 31.6 26.9 32.7 41.8 25.11
-8.36% -7.36% 50.88% 63.96% 77.74% 60.64% 47.44% 35.55% 34.83% 36.14% 39.15%
66 96 97 96 92 97 101 105 102 99
39.4 36.3 51.7 71.1 90.7 95.1 92.0 84.1 86.1 93.8 74.02
59.66% 37.76% 53.03% 74.43% 98.18% 98.21% 90.88% 79.82% 84.17% 94.30% 77.04%
44 60 68 78 81 90 100 109 111 110
3.8 8.9 14.5 24.2 32.3 37.3 40.0 40.3 42.4 45.5 28.93
8.75% 14.81% 21.39% 31.06% 40.07% 41.38% 40.18% 36.87% 38.16% 41.39% 31.41%
(Thousand Metric Tons)
(U.S. Dollars per Metric Ton)

Table A.44. P
BrazilProduction
Baseline
Change
% chg
Consumption
Baseline
Change
% chg
CanadaProduction
Baseline
Change
% chg
Consumption
Baseline
Change
% chg
European UnionProduction
Baseline
Change
% chg
Consumption
Baseline
Change
% chg
China - MainlandProduction
Baseline
Change
% chg
Consumption
Baseline
Change
% chg
JapanProduction
Baseline
Change
% chg
Consumption
Baseline
Change
% chg
Pork Production and Consumption2002 2003 2004 2005 2006 2007 2008 2009 2010 2011 Average
2,235 2,337 2,425 2,488 2,561 2,630 2,707 2,786 2,857 2,929
123.9 137.2 181.9 208.5 218.8 236.9 257.3 282.0 298.0 312.9 225.72
5.5% 5.9% 7.5% 8.4% 8.5% 9.0% 9.5% 10.1% 10.4% 10.7% 8.56%
1,951 2,006 2,058 2,108 2,151 2,196 2,246 2,300 2,369 2,442
-21.7 -18.9 -15.6 -16.3 -19.8 -29.2 -39.5 -45.8 -44.7 -38.9 -29.05
-1.1% -0.9% -0.8% -0.8% -0.9% -1.3% -1.8% -2.0% -1.9% -1.6% -1.31%
1,762 1,783 1,837 1,900 1,987 2,041 2,082 2,106 2,163 2,254
114.2 127.3 180.2 222.1 253.0 276.1 297.1 321.9 342.2 364.8 249.87
6.5% 7.1% 9.8% 11.7% 12.7% 13.5% 14.3% 15.3% 15.8% 16.2% 12.29%
1,113 1,171 1,178 1,186 1,191 1,224 1,256 1,289 1,291 1,288
-59.3 -71.5 -69.4 -64.9 -58.7 -67.7 -80.6 -95.7 -93.6 -86.7 -74.80
-5.3% -6.1% -5.9% -5.5% -4.9% -5.5% -6.4% -7.4% -7.3% -6.7% -6.11%
17,804 17,964 18,009 18,060 18,121 18,196 18,294 18,414 18,533 18,635
20.5 -6.3 -59.2 -93.2 -98.5 -130.8 -213.6 -330.4 -410.3 -407.0 -172.88
0.1% 0.0% -0.3% -0.5% -0.5% -0.7% -1.2% -1.8% -2.2% -2.2% -0.94%
16,569 16,635 16,709 16,765 16,892 16,965 17,024 17,074 17,148 17,223
-182.4 112.2 6.5 -75.4 -169.3 -82.8 0.1 80.6 -44.8 -198.8 -55.41
-1.1% 0.7% 0.0% -0.4% -1.0% -0.5% 0.0% 0.5% -0.3% -1.2% -0.33%
29,880 30,550 31,189 31,897 32,696 33,512 34,309 35,088 35,838 36,556
-192.6 -253.2 -305.6 -353.0 -404.4 -421.1 -412.4 -382.6 -373.3 -388.4 -348.65
-0.6% -0.8% -1.0% -1.1% -1.2% -1% -1.2% -1.1% -1.0% -1% -1.04%
29,959 30,636 31,316 32,040 32,854 33,690 34,506 35,297 36,057 36,785
-93.8 -117.1 -45.5 -7.9 18.8 -16.7 -51.6 -79.3 -31.3 48.2 -37.61
-0.3% -0.4% -0.1% 0.0% 0.1% 0% -0.1% -0.2% -0.1% 0% -0.12%
1,248 1,228 1,221 1,216 1,217 1,214 1,207 1,198 1,198 1,204
-100.9 -98.6 -120.8 -138.5 -151.7 -165.2 -176.6 -187.0 -193.8 -198.5 -153.16
-8.1% -8.0% -9.9% -11.4% -12.5% -13.6% -14.6% -15.6% -16.2% -16.5% -12.64%
2,193 2,228 2,240 2,256 2,277 2,312 2,346 2,379 2,398 2,414
68.4 62.6 74.6 81.3 87.2 120.4 165.1 215.8 242.8 254.6 137.29
3.1% 2.8% 3.3% 3.6% 3.8% 5.2% 7.0% 9.1% 10.1% 10.5% 5.87%
(Thousand Metric Tons)

Table A.45. B
World Price Baseline
Change
% chg
Total Trade Baseline
Change
% chg
Exports of Selected CBrazil Baseline
Change
% chg
European Union Baseline
Change
% chg
Thailand Baseline
Change
% chg
United States Baseline
Change
% chg
Imports of Selected CCanada Baseline
Change
% chg
China - Mainland Baseline
Change
% chg
Japan Baseline
Change
% chg
Mexico Baseline
Change
% chg
Philippines Baseline
Change
% chg
Saudi Arabia Baseline
Change
% chg
South Korea Baseline
Change
% chg
Broiler Price and Trade2002 2003 2004 2005 2006 2007 2008 2009 2010 2011 Average
1,306 1,315 1,323 1,325 1,320 1,317 1,330 1,339 1,353 1,365
104.5 102.1 105.5 101.1 88.4 86.8 89.5 97.0 104.3 112.8 99.22
8.00% 7.76% 7.98% 7.64% 6.69% 6.59% 6.73% 7.25% 7.71% 8.27% 7.46%
5,165 5,435 5,683 5,929 6,176 6,419 6,614 6,797 6,991 7,220
985 1,196 1,170 1,176 1,172 1,172 1,190 1,215 1,229 1,239.5 1,174.47
19.06% 22.01% 20.59% 19.84% 18.97% 18.26% 17.99% 17.87% 17.58% 17.17% 18.93%
Countries
1,300 1,524 1,683 1,842 1,951 2,045 2,186 2,297 2,393 2,464
442.8 485.5 492.9 477.3 454.4 454.3 443.8 439 437.1 440.3 456.76
34.06% 31.85% 29.29% 25.92% 23.29% 22.21% 20.30% 19.12% 18.26% 17.87% 24.22%
552 559 556 564 570 577 587 596 606 615
41.6 17.0 -182.4 -257.0 -317.2 -357.3 -373.8 -387.1 -419.8 -458.9 -269.49
7.53% 3.04% -32.81% -45.53% -55.62% -61.88% -63.67% -64.91% -69.28% -74.67% -45.78%
409 416 419 429 430 428 419 413 402 399
142.1 148.8 158.7 164.8 170.5 176.6 185.4 194.6 203.3 210.1 175.49
34.77% 35.74% 37.88% 38.37% 39.66% 41.27% 44.23% 47.16% 50.64% 52.68% 42.24%
2,869 2,919 3,029 3,098 3,226 3,371 3,423 3,489 3,583 3,731
385.7 573.5 728.9 820.6 893.1 927.1 963.3 998.4 1,040.9 1,082.2 841.38
13.44% 19.65% 24.06% 26.49% 27.69% 27.51% 28.14% 28.62% 29.05% 29.00% 25.37%
Countries
10 11 14 16 17 19 20 21 22 25
108.1 145.7 171.4 192.7 205.2 221.4 235.0 248.8 260.8 272.8 206.19
1081% 1296% 1224% 1182% 1207% 1188% 1202% 1191% 1177% 1102% 1185%
505 512 569 640 727 838 951 1,041 1,106 1,172
365.2 390.7 313.8 286.8 271.7 264.0 263.0 262.0 253.8 243.9 291.49
72.36% 76.32% 55.12% 44.80% 37.37% 31.51% 27.65% 25.16% 22.95% 20.80% 41.40%
680 699 716 733 753 772 787 803 818 833
-83.3 -88.8 -92.6 -91.1 -90.6 -90.6 -89.9 -88.8 -87.4 -85.6 -88.86
-12.24% -12.71% -12.92% -12.42% -12.04% -11.73% -11.42% -11.06% -10.67% -10.28% -11.75%
245 262 296 323 350 345 338 327 337 352
-52.6 -44.9 -54.3 -64.0 -74.3 -81.0 -83.4 -82.9 -85.6 -90.0 -71.31
-21.45% -17.16% -18.37% -19.81% -21.23% -23.49% -24.69% -25.34% -25.42% -25.57% -22.25%
11 19 23 26 34 45 53 62 73 86
98.7 127.0 137.2 135.8 132.6 129.3 128.2 128.8 129.5 129.6 127.68
935% 654% 594% 530% 394% 290% 242% 206% 177% 151% 417%
386 406 432 453 477 502 525 549 574 600
77.0 84.8 93.9 99.2 101.1 95.0 90.0 86.9 94.8 104.9 92.76
19.95% 20.86% 21.73% 21.90% 21.21% 18.90% 17.13% 15.84% 16.53% 17.48% 19.15%
82 91 97 102 107 111 114 117 120 123
34.8 48.5 52.0 54.5 57.6 60.3 63.5 65.6 65.7 64.5 56.71
42.29% 53.34% 53.30% 53.36% 53.97% 54.22% 55.60% 56.06% 54.82% 52.36% 52.93%
(Thousand Metric Tons)
(U.S. Dollars per Metric Ton)

Table A.46. B
BrazilProduction
Baseline
Change
% chg
Consumption
Baseline
Change
% chg
European UnionProduction
Baseline
Change
% chg
Consumption
Baseline
Change
% chg
ThailandProduction
Baseline
Change
% chg
Consumption
Baseline
Change
% chg
CanadaProduction
Baseline
Change
% chg
Consumption
Baseline
Change
% chg
China - MainlandProduction
Baseline
Change
% chg
Consumption
Baseline
Change
% chg
Broiler Production and Consumption2002 2003 2004 2005 2006 2007 2008 2009 2010 2011 Average
6,693 7,062 7,370 7,641 7,884 8,119 8,402 8,680 8,965 9,243
383.3 442.9 455.2 425.3 377.9 358.4 344.2 347 354.2 365.6 385.37
6% 6% 6% 6% 5% 4% 4% 4% 4% 4% 4.89%
5,397 5,539 5,688 5,800 5,933 6,074 6,216 6,383 6,573 6,779
-58.1 -42.7 -37.7 -52.2 -76.7 -96.0 -99.7 -92 -82.8 -74.7 -71.29
-1% -1% -1% -1% -1% -2% -2% -1% -1% -1% -1.17%
6,815 6,923 6,988 7,065 7,161 7,226 7,292 7,360 7,426 7,484
1.3 -21.5 -153.2 -216.6 -301.7 -372.2 -412.6 -436.6 -450.8 -462.9 -282.68
0% 0% -2% -3% -4% -5% -6% -6% -6% -6% -3.88%
6,262 6,363 6,432 6,500 6,591 6,648 6,705 6,764 6,820 6,869
-40.4 -38.8 28.2 40.1 15.0 -15.1 -38.9 -49.4 -30.9 -4.0 -13.42
-1% -1% 0% 1% 0% 0% -1% -1% 0% 0% -0.20%
1,264 1,296 1,327 1,356 1,378 1,395 1,407 1,423 1,444 1,479
52.8 63.5 71.4 68.0 61.0 56.9 55.9 58.2 61.7 66.1 61.55
4% 5% 5% 5% 4% 4% 4% 4% 4% 4% 4.48%
855 880 908 927 948 968 988 1,011 1,043 1,080
-89.3 -85.3 -87.3 -96.8 -109.5 -119.7 -129.5 -136.4 -141.7 -144.0 -113.94
-10% -10% -10% -10% -12% -12% -13% -13% -14% -13% -11.76%
924 928 945 956 973 976 983 992 1,013 1,036
-60.5 -89.9 -109.0 -126.6 -139.2 -152.6 -163.3 -172.8 -181.3 -189.8 -138.51
-7% -10% -12% -13% -14% -16% -17% -17% -18% -18% -14.12%
934 939 959 972 990 994 1,003 1,012 1,035 1,061
47.6 55.8 62.4 66.1 65.9 68.8 71.7 76.0 79.5 83.0 67.68
5% 6% 7% 7% 7% 7% 7% 8% 8% 8% 6.81%
4,687 4,774 4,852 4,951 5,075 5,188 5,293 5,403 5,512 5,612
-274.2 -295.0 -253.7 -244.9 -247.7 -244.1 -237.9 -231.0 -225.0 -218.9 -247.23
-6% -6% -5% -5% -5% -5% -4% -4% -4% -4% -4.85%
5,192 5,286 5,422 5,591 5,802 6,026 6,244 6,444 6,618 6,784
-362.9 -388.2 -330.8 -312.5 -305.1 -286.7 -264.6 -249.0 -239.8 -230.7 -297.04
-7% -7% -6% -6% -5% -5% -4% -4% -4% -3% -5.12%
(Thousand Metric Tons)

Appendix B
Impacts of the Trade-Only Liberalization Scenario
Tables B.1 through B.44 present the impacts of the trade-only liberalization scenario
on price, trade, production, and consumption.
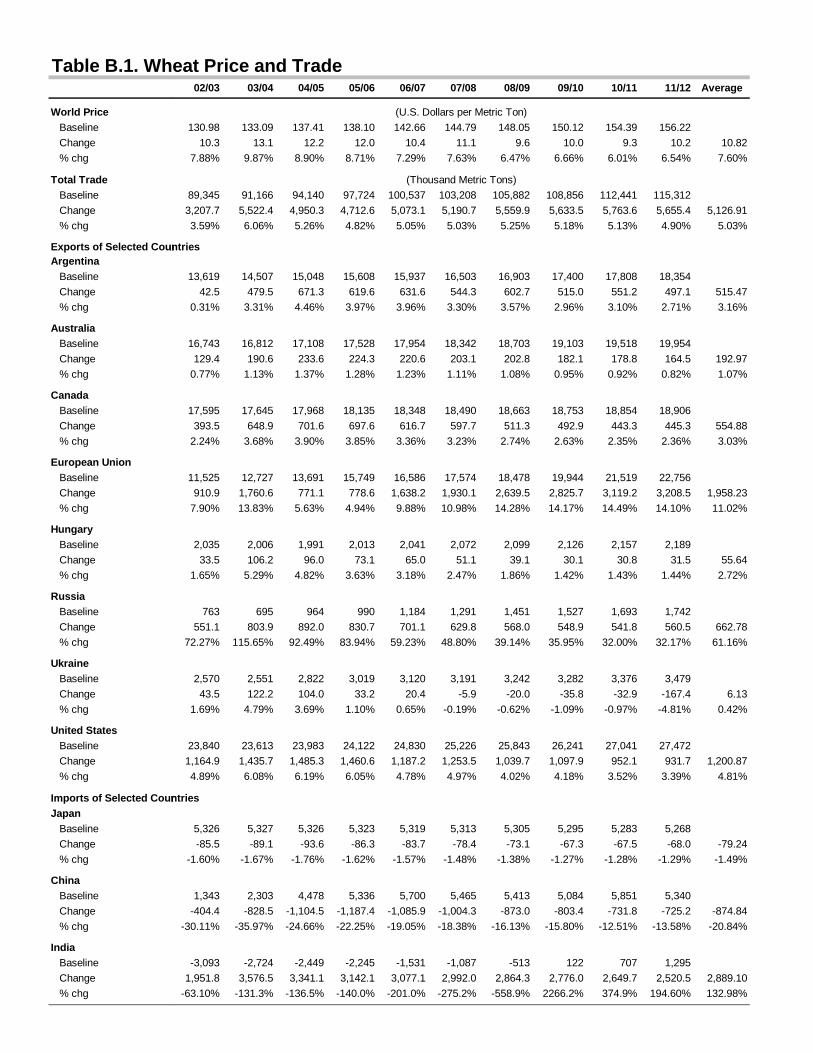
Table B.1. Wh
World Price Baseline
Change
% chg
Total Trade Baseline
Change
% chg
Exports of Selected CounArgentina Baseline
Change
% chg
Australia Baseline
Change
% chg
Canada Baseline
Change
% chg
European Union Baseline
Change
% chg
Hungary Baseline
Change
% chg
Russia Baseline
Change
% chg
Ukraine Baseline
Change
% chg
United States Baseline
Change
% chg
Imports of Selected CounJapan Baseline
Change
% chg
China Baseline
Change
% chg
India Baseline
Change
% chg
eat Price and Trade02/03 03/04 04/05 05/06 06/07 07/08 08/09 09/10 10/11 11/12 Average
130.98 133.09 137.41 138.10 142.66 144.79 148.05 150.12 154.39 156.22
10.3 13.1 12.2 12.0 10.4 11.1 9.6 10.0 9.3 10.2 10.82
7.88% 9.87% 8.90% 8.71% 7.29% 7.63% 6.47% 6.66% 6.01% 6.54% 7.60%
89,345 91,166 94,140 97,724 100,537 103,208 105,882 108,856 112,441 115,312
3,207.7 5,522.4 4,950.3 4,712.6 5,073.1 5,190.7 5,559.9 5,633.5 5,763.6 5,655.4 5,126.91
3.59% 6.06% 5.26% 4.82% 5.05% 5.03% 5.25% 5.18% 5.13% 4.90% 5.03%
untries
13,619 14,507 15,048 15,608 15,937 16,503 16,903 17,400 17,808 18,354
42.5 479.5 671.3 619.6 631.6 544.3 602.7 515.0 551.2 497.1 515.47
0.31% 3.31% 4.46% 3.97% 3.96% 3.30% 3.57% 2.96% 3.10% 2.71% 3.16%
16,743 16,812 17,108 17,528 17,954 18,342 18,703 19,103 19,518 19,954
129.4 190.6 233.6 224.3 220.6 203.1 202.8 182.1 178.8 164.5 192.97
0.77% 1.13% 1.37% 1.28% 1.23% 1.11% 1.08% 0.95% 0.92% 0.82% 1.07%
17,595 17,645 17,968 18,135 18,348 18,490 18,663 18,753 18,854 18,906
393.5 648.9 701.6 697.6 616.7 597.7 511.3 492.9 443.3 445.3 554.88
2.24% 3.68% 3.90% 3.85% 3.36% 3.23% 2.74% 2.63% 2.35% 2.36% 3.03%
11,525 12,727 13,691 15,749 16,586 17,574 18,478 19,944 21,519 22,756
910.9 1,760.6 771.1 778.6 1,638.2 1,930.1 2,639.5 2,825.7 3,119.2 3,208.5 1,958.23
7.90% 13.83% 5.63% 4.94% 9.88% 10.98% 14.28% 14.17% 14.49% 14.10% 11.02%
2,035 2,006 1,991 2,013 2,041 2,072 2,099 2,126 2,157 2,189
33.5 106.2 96.0 73.1 65.0 51.1 39.1 30.1 30.8 31.5 55.64
1.65% 5.29% 4.82% 3.63% 3.18% 2.47% 1.86% 1.42% 1.43% 1.44% 2.72%
763 695 964 990 1,184 1,291 1,451 1,527 1,693 1,742
551.1 803.9 892.0 830.7 701.1 629.8 568.0 548.9 541.8 560.5 662.78
72.27% 115.65% 92.49% 83.94% 59.23% 48.80% 39.14% 35.95% 32.00% 32.17% 61.16%
2,570 2,551 2,822 3,019 3,120 3,191 3,242 3,282 3,376 3,479
43.5 122.2 104.0 33.2 20.4 -5.9 -20.0 -35.8 -32.9 -167.4 6.13
1.69% 4.79% 3.69% 1.10% 0.65% -0.19% -0.62% -1.09% -0.97% -4.81% 0.42%
23,840 23,613 23,983 24,122 24,830 25,226 25,843 26,241 27,041 27,472
1,164.9 1,435.7 1,485.3 1,460.6 1,187.2 1,253.5 1,039.7 1,097.9 952.1 931.7 1,200.87
4.89% 6.08% 6.19% 6.05% 4.78% 4.97% 4.02% 4.18% 3.52% 3.39% 4.81%
ntries
5,326 5,327 5,326 5,323 5,319 5,313 5,305 5,295 5,283 5,268
-85.5 -89.1 -93.6 -86.3 -83.7 -78.4 -73.1 -67.3 -67.5 -68.0 -79.24
-1.60% -1.67% -1.76% -1.62% -1.57% -1.48% -1.38% -1.27% -1.28% -1.29% -1.49%
1,343 2,303 4,478 5,336 5,700 5,465 5,413 5,084 5,851 5,340
-404.4 -828.5 -1,104.5 -1,187.4 -1,085.9 -1,004.3 -873.0 -803.4 -731.8 -725.2 -874.84
-30.11% -35.97% -24.66% -22.25% -19.05% -18.38% -16.13% -15.80% -12.51% -13.58% -20.84%
-3,093 -2,724 -2,449 -2,245 -1,531 -1,087 -513 122 707 1,295
1,951.8 3,576.5 3,341.1 3,142.1 3,077.1 2,992.0 2,864.3 2,776.0 2,649.7 2,520.5 2,889.10
-63.10% -131.3% -136.5% -140.0% -201.0% -275.2% -558.9% 2266.2% 374.9% 194.60% 132.98%
(U.S. Dollars per Metric Ton)
(Thousand Metric Tons)

Table B.2. Wh
ArgentinaProduction
Baseline
Change
% chg
Consumption
Baseline
Change
% chg
CanadaProduction
Baseline
Change
% chg
Consumption
Baseline
Change
% chg
European UnionProduction
Baseline
Change
% chg
Consumption
Baseline
Change
% chg
ChinaProduction
Baseline
Change
% chg
Consumption
Baseline
Change
% chg
IndiaProduction
Baseline
Change
% chg
Consumption
Baseline
Change
% chg
United StatesProduction
Baseline
Change
% chg
Consumption
Baseline
Change
% chg
eat Production and Consumption02/03 03/04 04/05 05/06 06/07 07/08 08/09 09/10 10/11 11/12 Average
17,512 18,311 18,809 19,365 19,696 20,270 20,678 21,184 21,591 22,141
0.0 402.5 578.1 521.9 540.7 455.1 519.0 430.7 467.8 409.2 432.51
0.00% 2.20% 3.07% 2.69% 2.75% 2.25% 2.51% 2.03% 2.17% 1.85% 2.15%
3,950 3,820 3,775 3,762 3,773 3,776 3,786 3,792 3,797 3,795
-13.7 -65.2 -94.1 -98.3 -95.5 -87.8 -87.6 -83.5 -85.3 -85.4 -79.66
-0.35% -1.71% -2.49% -2.61% -2.53% -2.33% -2.31% -2.20% -2.25% -2.25% -2.10%
25,745 26,338 26,933 27,402 27,535 27,862 28,068 28,323 28,491 28,823
0.0 412.6 728.7 742.5 750.9 667.8 664.3 589.9 582.7 542.5 568.19
0.00% 1.57% 2.71% 2.71% 2.73% 2.40% 2.37% 2.08% 2.05% 1.88% 2.05%
8,359 8,547 8,710 8,949 9,098 9,250 9,337 9,480 9,630 9,828
-38.6 -74.4 -18.6 3.3 54.0 67.3 103.6 102.5 120.6 125.8 44.55
-0.46% -0.87% -0.21% 0.04% 0.59% 0.73% 1.11% 1.08% 1.25% 1.28% 0.45%
105,143 107,010 108,194 109,563 111,227 112,780 114,131 115,434 117,126 118,560
277.8 583.7 -18.5 224.2 342.5 404.8 512.3 610.1 575.2 633.0 414.50
0.26% 0.55% -0.02% 0.20% 0.31% 0.36% 0.45% 0.53% 0.49% 0.53% 0.37%
92,729 93,049 94,613 94,341 94,588 94,758 95,336 95,424 95,479 95,579
-525.5 -917.5 -953.6 -661.8 -1,143.5 -1,409.9 -1,948.7 -2,126.9 -2,464.0 -2,566.7 -1,471.79
-0.57% -0.99% -1.01% -0.70% -1.21% -1.49% -2.04% -2.23% -2.58% -2.69% -1.55%
105,357 105,436 107,919 110,447 111,415 112,953 113,467 114,454 115,317 116,813
0.0 477.8 758.7 671.8 666.0 508.4 541.2 414.2 451.6 387.4 487.70
0.00% 0.45% 0.70% 0.61% 0.60% 0.45% 0.48% 0.36% 0.39% 0.33% 0.44%
113,439 114,043 114,464 115,570 116,217 117,270 118,063 118,967 119,530 120,443
-420.8 -623.9 -557.7 -538.5 -399.6 -420.9 -306.7 -327.0 -268.7 -313.5 -417.74
-0.37% -0.55% -0.49% -0.47% -0.34% -0.36% -0.26% -0.27% -0.22% -0.26% -0.36%
67,635 68,744 69,509 70,876 71,018 71,878 72,378 73,062 73,510 74,309
0.0 -2,287.6 -1,989.2 -1,933.6 -1,767.6 -1,883.5 -1,670.7 -1,751.0 -1,574.8 -1,596.1 -1,645.41
0.00% -3.33% -2.86% -2.73% -2.49% -2.62% -2.31% -2.40% -2.14% -2.15% -2.30%
66,049 67,193 67,919 69,254 70,187 71,415 72,465 73,734 74,775 76,095
1,737.6 1,370.4 1,361.5 1,223.8 1,294.3 1,136.2 1,179.9 1,046.2 1,074.2 952.1 1,237.62
2.63% 2.04% 2.00% 1.77% 1.84% 1.59% 1.63% 1.42% 1.44% 1.25% 1.76%
58,157 59,107 59,362 60,417 60,941 62,007 62,693 63,706 64,385 65,409
0.0 461.1 949.9 758.0 811.8 577.5 717.2 541.4 634.2 400.3 585.14
0.00% 0.78% 1.60% 1.25% 1.33% 0.93% 1.14% 0.85% 0.99% 0.61% 0.95%
34,997 35,664 35,687 36,300 36,334 36,828 36,990 37,502 37,524 37,969
-706.3 -859.2 -661.4 -697.7 -460.8 -619.2 -405.0 -520.9 -363.1 -454.6 -574.83
-2.02% -2.41% -1.85% -1.92% -1.27% -1.68% -1.09% -1.39% -0.97% -1.20% -1.58%
(Thousand Metric Tons)

Table B.3. Cor
World Price Baseline
Change
% chg
Total Trade Baseline
Change
% chg
Exports of Selected CounArgentina Baseline
Change
% chg
Hungary Baseline
Change
% chg
South Africa Baseline
Change
% chg
United States Baseline
Change
% chg
Imports of Selected CounCanada Baseline
Change
% chg
European Union Baseline
Change
% chg
Japan Baseline
Change
% chg
Brazil Baseline
Change
% chg
Mexico Baseline
Change
% chg
China Baseline
Change
% chg
Taiwan Baseline
Change
% chg
rn Price and Trade02/03 03/04 04/05 05/06 06/07 07/08 08/09 09/10 10/11 11/12 Average
99 101 103 104 105 107 108 110 111 113
7.3 6.9 7.2 6.6 6.6 6.4 6.2 5.9 6.2 6.5 6.59
7.35% 6.85% 7.06% 6.39% 6.29% 5.95% 5.71% 5.35% 5.59% 5.78% 6.23%
64,307 66,829 68,934 71,488 74,091 76,597 78,123 80,264 82,067 83,735
1,410.0 2,805.7 2,477.4 1,702.4 1,258.9 588.3 -76.4 -688 -844 -868 776.61
2.19% 4.20% 3.59% 2.38% 1.70% 0.77% -0.10% -0.86% -1.03% -1.04% 1.18%
untries
7,496 8,814 9,433 9,958 10,431 10,554 10,754 10,825 10,929 11,052
59.8 491.5 525.4 490.0 392.9 348.7 322.1 321.1 337.0 402.7 369.11
0.80% 5.58% 5.57% 4.92% 3.77% 3.30% 3.00% 2.97% 3.08% 3.64% 3.66%
2,112 2,224 2,217 2,212 2,196 2,163 2,129 2,086 2,056 2,031
-175.9 -473.3 -718.5 -872.5 -966.9 -1,028.5 -1,079.1 -1,100.3 -1,094.5 -1,073.5 -858.31
-8.33% -21.29% -32.40% -39.44% -44.03% -47.55% -50.69% -52.76% -53.23% -52.86% -40.26%
1,373 1,377 1,524 1,737 1,996 2,287 2,541 2,791 3,027 3,255
239.9 203.0 238.5 229.4 242.0 238.9 237.7 229.2 244.1 253.5 235.62
17.48% 14.74% 15.65% 13.21% 12.12% 10.44% 9.36% 8.21% 8.06% 7.79% 11.71%
51,856 52,695 53,973 55,859 57,817 60,063 61,285 63,247 64,781 66,169
771.7 1,980.7 1,732.3 979.2 581.8 -37.5 -620.6 -1,237 -1,497 -1,630 102.39
1.49% 3.76% 3.21% 1.75% 1.01% -0.06% -1.01% -1.96% -2.31% -2.46% 0.34%
ntries
1,918 1,886 2,056 2,332 2,549 2,752 2,867 3,082 3,359 3,627
-75.9 -85.0 -23.9 60.5 134.7 191.6 240.4 266.3 281.1 300.4 129.01
-3.96% -4.50% -1.16% 2.59% 5.28% 6.96% 8.38% 8.64% 8.37% 8.28% 3.89%
2,127 2,176 2,212 2,184 2,183 2,149 2,131 2,104 2,110 2,114
2,194.8 3,028.0 2,765.1 2,281.2 2,204.2 1,919.6 1,466.7 970.6 846.3 961.5 1,863.79
103.2% 139.1% 125.0% 104.5% 101.0% 89.3% 68.8% 46.1% 40.1% 45.5% 86.26%
15,162 15,183 15,040 15,026 15,076 15,196 15,271 15,301 15,284 15,315
573.4 410.6 221.7 122.0 70.4 92.4 117.6 128.8 86.4 34.4 185.77
3.78% 2.70% 1.47% 0.81% 0.47% 0.61% 0.77% 0.84% 0.57% 0.22% 1.22%
-1,605 -1,383 -1,331 -1,184 -1,033 -926 -667 -581 -419 -383
-445.8 -389.1 -190.5 -84.1 -15.0 -1.8 57.1 60.5 34.0 -37.6 -101.21
27.77% 28.13% 14.31% 7.10% 1.45% 0.19% -8.6% -10.41% -8.12% 9.81% 6.17%
5,652 5,658 5,780 5,950 6,087 6,263 6,461 6,707 6,911 7,153
1,078.8 2,080.2 1,773.7 1,419.5 1,056.5 688.2 324.1 122.0 147.9 152.1 884.30
19.09% 36.76% 30.69% 23.86% 17.36% 10.99% 5.02% 1.82% 2.14% 2.13% 14.98%
1,105 2,474 3,317 4,125 5,574 6,627 6,708 7,171 7,278 7,462
-1,323.8 -959.1 -768.1 -876.0 -945.9 -977.2 -942.5 -911.7 -890.8 -858.9 -945.40
-119.8% -38.77% -23.16% -21.24% -16.97% -14.7% -14.05% -12.71% -12.24% -11.51% -28.52%
4,748 4,811 4,791 4,803 4,837 4,900 4,969 5,000 5,017 5,036
-189.9 -111.3 -127.3 -137.8 -164.0 -190.8 -212.9 -224.8 -227.8 -218.8 -180.55
-4.00% -2.31% -2.66% -2.87% -3.39% -3.89% -4.28% -4.50% -4.54% -4.34% -3.68%
(Thousand Metric Tons)
(U.S. Dollars per Metric Ton)

Table B.4. Cor
ArgentinaProduction
Baseline
Change
% chg
Consumption
Baseline
Change
% chg
HungaryProduction
Baseline
Change
% chg
Consumption
Baseline
Change
% chg
MexicoProduction
Baseline
Change
% chg
Consumption
Baseline
Change
% chg
European UnionProduction
Baseline
Change
% chg
Consumption
Baseline
Change
% chg
ChinaProduction
Baseline
Change
% chg
Consumption
Baseline
Change
% chg
United StatesProduction
Baseline
Change
% chg
Consumption
Baseline
Change
% chg
rn Production and Consumption02/03 03/04 04/05 05/06 06/07 07/08 08/09 09/10 10/11 11/12 Average
11,770 13,086 13,775 14,388 14,957 15,168 15,457 15,582 15,728 15,879
-25.5 440.9 564.6 616.7 587.3 580.3 559.4 538.6 516.3 546.8 492.54
-0.22% 3.37% 4.10% 4.29% 3.93% 3.83% 3.62% 3.46% 3.28% 3.44% 3.31%
4,329 4,305 4,358 4,442 4,539 4,629 4,711 4,769 4,811 4,840
-49.2 -41.3 43.3 125.0 194.0 230.3 235.9 215.7 180.5 146.1 128.04
-1.14% -0.96% 0.99% 2.82% 4.27% 4.98% 5.01% 4.52% 3.75% 3.02% 2.73%
7,571 7,735 7,804 7,817 7,823 7,824 7,828 7,831 7,841 7,849
0.0 -447.8 -703.6 -826.8 -897.5 -930.0 -947.7 -950.9 -950.5 -940.8 -759.56
0.00% -5.79% -9.02% -10.58% -11.47% -11.89% -12.11% -12.14% -12.12% -11.99% -9.71%
5,321 5,452 5,554 5,589 5,616 5,653 5,692 5,740 5,779 5,813
91.2 3.5 14.8 45.8 71.4 100.1 133.4 150.8 146.1 135.1 89.23
1.71% 0.06% 0.27% 0.82% 1.27% 1.77% 2.34% 2.63% 2.53% 2.32% 1.57%
18,860 19,374 19,739 20,029 20,340 20,674 21,019 21,313 21,660 21,981
0.0 -1,294.3 -1,126.8 -900.7 -666.6 -415.4 -158.5 106.5 100.6 107.8 -424.75
0.00% -6.68% -5.71% -4.50% -3.28% -2.01% -0.75% 0.50% 0.46% 0.49% -2.15%
24,560 25,038 25,508 25,971 26,423 26,935 27,468 28,016 28,563 29,129
890.6 817.2 685.0 554.3 425.5 306.9 198.7 227.2 249.2 260.5 461.52
3.63% 3.26% 2.69% 2.13% 1.61% 1.14% 0.72% 0.81% 0.87% 0.89% 1.78%
39,183 40,200 40,353 40,567 40,878 41,652 41,930 42,167 42,364 42,959
-36.3 -1,934.8 -1,288.7 -1,434.6 -1,251.5 -1,522.7 -1,250.9 -1,132.4 -880.8 -1,016.1 -1,174.90
-0.09% -4.81% -3.19% -3.54% -3.06% -3.66% -2.98% -2.69% -2.08% -2.37% -2.85%
41,351 42,085 42,505 42,859 42,856 43,396 43,774 44,184 44,231 44,325
1,817.3 1,250.3 1,386.3 918.0 949.2 493.0 266.1 -88.3 -50.9 -62.6 687.86
4.39% 2.97% 3.26% 2.14% 2.21% 1.14% 0.61% -0.20% -0.11% -0.14% 1.63%
119,443 122,440 124,984 129,403 131,434 133,640 136,490 138,636 141,102 143,410
0.0 127.0 -118.1 -30.0 -86.3 45.0 -23.8 55.5 -39.9 14.2 -5.63
0.00% 0.10% -0.09% -0.02% -0.07% 0.03% -0.02% 0.04% -0.03% 0.01% 0.00%
126,464 129,060 131,772 134,420 137,372 140,101 143,028 145,718 148,301 150,769
-1,167.3 -833.8 -879.7 -926.6 -1,039.0 -946.6 -977.9 -872.4 -932.6 -852.5 -942.83
-0.92% -0.65% -0.67% -0.69% -0.76% -0.68% -0.68% -0.60% -0.63% -0.57% -0.68%
250,384 256,021 261,505 265,741 270,455 275,225 280,369 284,217 289,264 292,933
0.0 6,365.1 5,720.8 6,091.1 5,523.0 5,695.5 5,420.4 5,340.2 4,564.4 4,644.6 4,936.51
0.00% 2.49% 2.19% 2.29% 2.04% 2.07% 1.93% 1.88% 1.58% 1.59% 1.81%
201,851 204,158 207,492 209,939 212,785 215,397 218,875 221,254 224,502 227,044
1,737.4 3,699.9 4,074.8 4,859.4 4,976.5 5,619.4 5,987.8 6,474.6 6,266.7 6,384.4 5,008.08
0.86% 1.81% 1.96% 2.31% 2.34% 2.61% 2.74% 2.93% 2.79% 2.81% 2.32%
(Thousand Metric Tons)

Table B.5. Rice
World Price Baseline
Change
% chg
Total Trade Baseline
Change
% chg
Exports of Selected CountChina Baseline
Change
% chg
India Baseline
Change
% chg
Myanmar (Burma) Baseline
Change
% chg
Thailand Baseline
Change
% chg
United States Baseline
Change
% chg
Vietnam Baseline
Change
% chg
Imports of Selected CountBrazil Baseline
Change
% chg
European Union Baseline
Change
% chg
Japan Baseline
Change
% chg
Philippines Baseline
Change
% chg
South Korea Baseline
Change
% chg
e Price and Trade02/03 03/04 04/05 05/06 06/07 07/08 08/09 09/10 10/11 11/12 Average
180.64 185.84 191.30 196.88 202.25 207.69 213.35 219.10 225.17 231.57
19.0 23.3 22.2 22.4 21.4 22.1 21.2 21.6 21.6 22.8 21.75
10.51% 12.56% 11.62% 11.36% 10.57% 10.64% 9.93% 9.87% 9.57% 9.84% 10.65%
19,307 18,526 18,620 19,010 19,437 19,974 20,585 21,658 22,525 23,849
4,345.2 5,544.3 5,446.2 5,509.7 5,514.9 5,591.3 5,559.8 5,617.1 5,655.5 5,752.2 5,453.61
22.51% 29.93% 29.25% 28.98% 28.37% 27.99% 27.01% 25.94% 25.11% 24.12% 26.92%
ntries
1,493 1,348 1,303 1,339 1,387 1,352 1,463 1,815 2,183 2,699
3,345.1 3,605.9 3,071.9 3,146.3 2,958.8 2,995.7 2,784.5 2,868.4 2,841.2 3,001.2 3,061.89
223.99% 267% 235.8% 235.1% 213.4% 221.6% 190.3% 158% 130.13% 111.2% 198.69%
1,999 1,331 1,064 1,073 1,052 1,204 1,355 1,657 1,709 2,027
293.4 449.6 613.9 600.9 803.4 851.0 1,040.7 1,036.5 1,094.3 1,011.3 779.51
14.68% 33.79% 57.69% 55.98% 76.38% 70.67% 76.81% 62.56% 64.04% 49.9% 56.25%
756 751 755 762 770 780 790 801 814 829
0.0 40.6 67.0 77.4 83.5 85.0 86.6 84.9 83.7 81.6 69.04
0.00% 5.41% 8.87% 10.17% 10.84% 10.90% 10.97% 10.61% 10.29% 9.8% 8.79%
7,226 7,317 7,571 7,885 8,136 8,385 8,642 8,983 9,315 9,663
197.9 484.1 621.4 622.7 635.7 630.1 644.5 640.9 657.8 664.9 580.01
2.74% 6.62% 8.21% 7.90% 7.81% 7.51% 7.46% 7.13% 7.06% 6.9% 6.93%
3,156 3,117 3,050 2,980 2,921 2,839 2,753 2,666 2,578 2,479
104.1 -6.8 -55.9 -59.2 -62.0 -49.4 -54.9 -43.1 -45.5 -51.1 -32.37
3.3% -0.2% -1.8% -2.0% -2.1% -1.7% -2.0% -1.6% -1.8% -2.1% -1.20%
3,873 3,877 4,075 4,145 4,316 4,529 4,659 4,778 4,921 5,106
516.0 1,096.6 1,251.1 1,252.6 1,231.4 1,222.1 1,202.4 1,179.6 1,175.8 1,195.2 1,132.28
13.32% 28.29% 30.70% 30.22% 28.53% 26.98% 25.81% 24.69% 23.89% 23.4% 25.58%
ntries
386 278 237 209 190 176 166 158 151 143
-169.5 -314.2 -366.2 -381.4 -375.8 -377.0 -368.9 -367.6 -366.0 -376.0 -346.25
-43.9% -112.9% -154.7% -182.5% -198.0% -214% -223% -233% -243% -264% -186.84%
474 509 562 569 581 596 605 619 636 653
1,215.9 836.7 696.3 639.1 623.1 611.4 609.7 603.3 597.8 587.1 702.05
256.66% 164.23% 123.90% 112.40% 107.17% 102.67% 100.82% 97.41% 93.98% 89.9% 124.91%
805 651 575 504 437 372 306 237 160 68
244.6 408.0 451.1 476.7 498.8 507.8 518.2 523.6 528.0 526.7 468.35
30.39% 62.6% 78.5% 94.7% 114.2% 136.5% 169.5% 221.2% 330.7% 771% 200.97%
688 727 765 803 840 877 914 950 985 1,020
594.1 783.4 837.1 865.0 901.1 925.6 958.7 984.7 1,012.8 1,031.7 889.43
86.30% 107.77% 109.41% 108% 107% 106% 105% 104% 103% 101.1% 103.65%
64 41 85 135 155 174 177 192 195 205
579.6 858.3 875.8 871.4 866.0 869.8 865.5 868.5 867.4 871.3 839.35
912.25% 2085.8% 1033.1% 645.5% 557.6% 498.5% 488.3% 451.27% 444.06% 425.2% 754.16%
(U.S. Dollars per Metric Ton)
(Thousand Metric Tons)

Table B.6. Rice
ChinaProduction
Baseline
Change
% chg
Consumption
Baseline
Change
% chg
ThailandProduction
Baseline
Change
% chg
Consumption
Baseline
Change
% chg
VietnamProduction
Baseline
Change
% chg
Consumption
Baseline
Change
% chg
IndiaProduction
Baseline
Change
% chg
Consumption
Baseline
Change
% chg
United StatesProduction
Baseline
Change
% chg
Consumption
Baseline
Change
% chg
e Production and Consumption02/03 03/04 04/05 05/06 06/07 07/08 08/09 09/10 10/11 11/12 Average
130,044 131,879 133,046 134,103 134,763 135,350 135,993 136,801 137,597 138,444
1,122.7 1,370.1 1,247.9 1,275.3 1,223.7 1,247.4 1,195.4 1,224.2 1,218.1 1,282.6 1,112.48
0.86% 1.04% 0.94% 0.95% 0.91% 0.92% 0.88% 0.89% 0.89% 0.93% 0.83%
132,443 131,393 132,018 132,734 133,779 134,680 135,297 135,431 135,413 135,161
-1,430 -1,951 -1,870 -1,901 -1,825 -1,778 -1,676 -1,662 -1,652 -1,701 -1,575
-1.08% -1.48% -1.42% -1.43% -1.36% -1.32% -1.24% -1.23% -1.22% -1.26% -1.18%
17,241 17,425 17,711 18,037 18,288 18,533 18,781 19,109 19,419 19,735
0.0 252.5 407.7 409.4 433.9 422.4 448.8 443.1 464.0 462.6 328.18
0.00% 1.45% 2.30% 2.27% 2.37% 2.28% 2.39% 2.32% 2.39% 2.34% 1.78%
10,115 10,132 10,147 10,156 10,155 10,150 10,140 10,127 10,104 10,072
-182.5 -224.8 -213.4 -213.4 -202.8 -207.7 -196.7 -198.0 -194.2 -201.8 -183.36
-1.80% -2.22% -2.10% -2.10% -2.00% -2.05% -1.94% -1.96% -1.92% -2.00% -1.81%
20,925 21,253 21,582 21,869 22,214 22,600 22,969 23,308 23,649 24,008
0.0 431.6 636.4 647.2 651.6 628.0 639.5 613.6 615.7 608.1 486.36
0.00% 2.03% 2.95% 2.96% 2.93% 2.78% 2.78% 2.63% 2.60% 2.53% 2.17%
17,191 17,308 17,487 17,702 17,875 18,074 18,311 18,530 18,728 18,904
-516.0 -641.5 -609.4 -607.3 -580.3 -595.6 -562.6 -567.7 -560.1 -587.7 -524.04
-3.00% -3.71% -3.49% -3.43% -3.25% -3.30% -3.07% -3.06% -2.99% -3.11% -2.93%
89,078 89,738 90,927 91,998 93,218 94,402 95,518 96,760 97,902 99,029
0.0 323.0 647.3 519.8 650.2 635.1 760.8 696.2 737.2 649.7 496.96
0.00% 0.36% 0.71% 0.56% 0.70% 0.67% 0.80% 0.72% 0.75% 0.66% 0.53%
87,370 88,739 90,260 90,903 92,211 93,229 94,183 95,127 96,218 97,030
131.2 -27.2 17.1 -95.0 -182.4 -209.8 -309.4 -340.4 -368.1 -347.1 -138.39
0.15% -0.03% 0.02% -0.10% -0.20% -0.22% -0.33% -0.36% -0.38% -0.36% -0.15%
5,855 6,001 6,034 6,073 6,119 6,141 6,166 6,192 6,215 6,229
0 -68 -63 -60 -56 -51 -52 -45 -49 -59 -44
0.0% -1.1% -1.0% -1.0% -0.9% -0.8% -0.8% -0.7% -0.8% -0.9% -0.72%
3,802 3,886 3,968 4,051 4,132 4,213 4,296 4,379 4,461 4,544
-18.1 -21.4 -20.2 -19.9 -18.7 -19.0 -17.9 -18.1 -18.2 -19.1 -17.15
-0.47% -0.55% -0.51% -0.49% -0.45% -0.45% -0.42% -0.41% -0.41% -0.42% -0.42%
(Thousand Metric Tons)

Table B.7. Soy
World Price Baseline
Change
% chg
Total Trade Baseline
Change
% chg
Exports of Selected CouArgentina Baseline
Change
% chg
Brazil Baseline
Change
% chg
Canada Baseline
Change
% chg
United States Baseline
Change
% chg
Imports of Selected CounEastern Europe Baseline
Change
% chg
Former Soviet Union Baseline
Change
% chg
Japan Baseline
Change
% chg
China Baseline
Change
% chg
India Baseline
Change
% chg
South Korea Baseline
Change
% chg
Taiwan Baseline
Change
% chg
ybean Price and Trade02/03 03/04 04/05 05/06 06/07 07/08 08/09 09/10 10/11 11/12 Average
160 163 169 174 181 188 194 199 206 211
5.9 3.9 5.8 5.7 5.5 5.5 5.6 5.2 4.5 3.9 5.15
3.71% 2.38% 3.46% 3.28% 3.07% 2.91% 2.89% 2.60% 2.17% 1.84% 2.83%
54,734 55,871 57,289 58,814 60,299 61,923 63,461 65,074 66,667 68,479
-843.2 103.7 98.3 -6.6 8.2 37.5 107.7 167.9 267.8 418.4 35.96
-1.54% 0.19% 0.17% -0.01% 0.01% 0.06% 0.17% 0.26% 0.40% 0.61% 0.03%
untries
7,814 8,057 8,346 8,663 8,941 9,253 9,587 9,904 10,214 10,608
143.4 1,062.5 1,142.0 1,177.7 1,244.2 1,260.5 1,310.9 1,346.5 1,370.5 1,374.7 1,143.30
1.84% 13.19% 13.68% 13.60% 13.92% 13.62% 13.67% 13.60% 13.42% 12.96% 12.35%
18,734 19,281 20,054 21,109 22,080 23,189 24,295 25,357 26,394 27,504
-773.1 843.0 559.8 590.9 547.5 597.4 627.5 688.8 655.3 650.9 498.79
-4.13% 4.37% 2.79% 2.80% 2.48% 2.58% 2.58% 2.72% 2.48% 2.37% 2.10%
687 682 719 751 787 817 852 885 919 951
-23.0 -34.4 -34.7 -30.0 -31.5 -32.7 -35.0 -35.2 -37.7 -40.7 -33.49
-3.35% -5.04% -4.82% -3.99% -4.00% -4.00% -4.11% -3.97% -4.10% -4.28% -4.17%
27,499 27,851 28,169 28,291 28,490 28,663 28,727 28,927 29,140 29,416
-190.6 -1,767.5 -1,568.8 -1,745.3 -1,752.0 -1,787.8 -1,795.7 -1,832.2 -1,720.3 -1,566.5 -1,572.65
-0.69% -6.35% -5.57% -6.17% -6.15% -6.24% -6.25% -6.33% -5.90% -5.33% -5.50%
untries
150 160 160 162 163 163 164 166 168 172
-25.7 -39.5 -39.7 -40.2 -39.7 -37.8 -36.5 -35.3 -34.4 -32.6 -36.15
-17.12% -24.69% -24.81% -24.85% -24.39% -23.15% -22.23% -21.22% -20.40% -18.96% -22.18%
249 274 280 285 292 300 306 313 320 328
-17.4 -5.0 -6.0 -5.5 -4.8 -2.3 -1.0 0.3 1.8 4.3 -3.56
-6.97% -1.82% -2.13% -1.94% -1.65% -0.77% -0.33% 0.10% 0.55% 1.33% -1.36%
5,108 5,127 5,115 5,114 5,115 5,114 5,113 5,111 5,102 5,100
-132.1 -106.4 -112.3 -108.7 -102.2 -96.8 -92.0 -86.8 -81.4 -75.5 -99.43
-2.59% -2.08% -2.20% -2.13% -2.00% -1.89% -1.80% -1.70% -1.60% -1.48% -1.94%
15,043 15,252 16,022 16,803 17,472 18,269 18,980 19,710 20,508 21,374
-101.7 146.7 194.7 195.1 218.1 222.2 245.8 247.6 287.0 317.4 197.28
-0.68% 0.96% 1.22% 1.16% 1.25% 1.22% 1.30% 1.26% 1.40% 1.48% 1.06%
0 0 0 0 0 0 0 0 0 0
-38.0 459.8 398.2 340.6 283.4 243.2 209.1 182.0 177.4 174.3 243.01
N/A N/A N/A N/A N/A N/A N/A N/A N/A N/A N/A
1,452 1,461 1,444 1,443 1,450 1,458 1,464 1,471 1,474 1,485
-49.0 -35.5 -34.4 -35.5 -28.2 -23.2 -17.7 -13.6 -9.4 -3.7 -25.02
-3.38% -2.43% -2.38% -2.46% -1.95% -1.59% -1.21% -0.93% -0.64% -0.25% -1.72%
2,312 2,348 2,323 2,311 2,306 2,301 2,296 2,296 2,286 2,293
-19.4 9.4 4.7 4.3 17.1 25.9 34.4 42.3 51.4 61.9 23.21
-0.84% 0.40% 0.20% 0.19% 0.74% 1.13% 1.50% 1.84% 2.25% 2.70% 1.01%
(Thousand Metric Tons)
(U.S. Dollars per Metric Ton)

Table B.8. Soy
ArgentinaProduction
Baseline
Change
% chg
Consumption
Baseline
Change
% chg
BrazilProduction
Baseline
Change
% chg
Consumption
Baseline
Change
% chg
United StatesProduction
Baseline
Change
% chg
Consumption
Baseline
Change
% chg
European UnionProduction
Baseline
Change
% chg
Consumption
Baseline
Change
% chg
ChinaProduction
Baseline
Change
% chg
Consumption
Baseline
Change
% chg
IndiaProduction
Baseline
Change
% chg
Consumption
Baseline
Change
% chg
ybean Production and Consumption02/03 03/04 04/05 05/06 06/07 07/08 08/09 09/10 10/11 11/12 Average
29,406 29,899 30,368 30,889 31,399 31,939 32,484 33,012 33,536 34,073
0.0 969.6 1,064.7 1,105.4 1,192.5 1,228.8 1,297.1 1,340.6 1,376.2 1,389.0 1,096.38
0.00% 3.24% 3.51% 3.58% 3.80% 3.85% 3.99% 4.06% 4.10% 4.08% 3.42%
21,596 21,844 22,024 22,228 22,460 22,688 22,899 23,111 23,324 23,466
-140.9 -92.8 -77.0 -72.3 -51.7 -31.6 -13.8 -6.0 5.6 14.2 -46.64
-0.65% -0.42% -0.35% -0.33% -0.23% -0.14% -0.06% -0.03% 0.02% 0.06% -0.21%
44,756 45,959 47,376 49,104 50,752 52,544 54,330 56,064 57,774 59,548
0.0 1,722.1 1,452.1 1,514.4 1,505.7 1,594.6 1,658.7 1,752.9 1,748.2 1,752.1 1,470.07
0.00% 3.75% 3.06% 3.08% 2.97% 3.03% 3.05% 3.13% 3.03% 2.94% 2.80%
26,030 26,690 27,339 28,011 28,690 29,373 30,050 30,723 31,396 32,048
780.1 878.8 895.5 922.8 957.7 997.2 1,030.6 1,062.0 1,090.5 1,100.2 971.53
3.00% 3.29% 3.28% 3.29% 3.34% 3.39% 3.43% 3.46% 3.47% 3.43% 3.34%
79,698 80,341 81,105 82,191 83,270 84,273 85,250 86,402 87,407 88,771
0.0 -1,109.7 -1,105.2 -1,157.5 -1,071.3 -1,067.5 -1,033.7 -978.9 -758.7 -604.9 -888.74
0.00% -1.38% -1.36% -1.41% -1.29% -1.27% -1.21% -1.13% -0.87% -0.68% -1.06%
51,418 52,548 53,332 54,241 55,161 56,037 56,884 57,762 58,645 59,610
658.9 581.9 610.3 585.9 659.1 707.5 765.3 814.4 888.3 959.9 723.15
1.28% 1.11% 1.14% 1.08% 1.19% 1.26% 1.35% 1.41% 1.51% 1.61% 1.30%
1,012 969 964 971 979 984 992 1,000 1,006 1,011
0.0 11.8 8.5 11.5 10.2 10.1 7.7 6.2 3.9 3.5 7.35
0.00% 1.21% 0.89% 1.18% 1.05% 1.03% 0.78% 0.62% 0.39% 0.34% 0.75%
19,684 19,785 19,744 19,748 19,802 19,855 19,919 20,021 20,062 20,200
-174.0 -60.1 -80.6 -90.0 -31.1 7.5 44.1 79.8 124.3 175.8 -0.44
-0.88% -0.30% -0.41% -0.46% -0.16% 0.04% 0.22% 0.40% 0.62% 0.87% -0.01%
15,024 15,515 15,438 15,387 15,450 15,398 15,444 15,543 15,598 15,635
12.2 -184.2 -289.8 -266.9 -279.1 -276.6 -298.2 -287.6 -314.2 -336.4 -252.09
0.08% -1.19% -1.88% -1.73% -1.81% -1.80% -1.93% -1.85% -2.01% -2.15% -1.63%
30,159 30,822 31,461 32,171 32,868 33,600 34,388 35,233 36,094 36,984
-77.8 -59.9 -76.7 -75.0 -64.5 -57.1 -52.6 -44.5 -33.8 -24.0 -56.58
-0.26% -0.19% -0.24% -0.23% -0.20% -0.17% -0.15% -0.13% -0.09% -0.06% -0.17%
5,827 5,931 6,103 6,261 6,450 6,628 6,806 6,977 7,132 7,299
0.0 -539.8 -570.6 -577.8 -602.9 -628.3 -653.8 -673.5 -694.9 -722.8 -566.45
0.00% -9.10% -9.35% -9.23% -9.35% -9.48% -9.61% -9.65% -9.74% -9.90% -8.54%
5,827 5,931 6,102 6,262 6,450 6,628 6,806 6,977 7,132 7,299
-46.4 -80.5 -172.1 -237.3 -319.6 -385.1 -444.7 -491.6 -517.6 -548.5 -324.32
-0.80% -1.36% -2.82% -3.79% -4.96% -5.81% -6.53% -7.05% -7.26% -7.51% -4.79%
(Thousand Metric Tons)

Table B.9. Soy
World Price Baseline
Change
% chg
Total Trade Baseline
Change
% chg
Exports of Selected CouArgentina Baseline
Change
% chg
Brazil Baseline
Change
% chg
India Baseline
Change
% chg
United States Baseline
Change
% chg
Imports of Selected CounEastern Europe Baseline
Change
% chg
Former Soviet Union Baseline
Change
% chg
Japan Baseline
Change
% chg
China Baseline
Change
% chg
Canada Baseline
Change
% chg
South Korea Baseline
Change
% chg
Taiwan Baseline
Change
% chg
ybean Meal Price and Trade02/03 03/04 04/05 05/06 06/07 07/08 08/09 09/10 10/11 11/12 Average
170 176 182 187 194 201 206 211 216 220
6.1 5.3 7.7 7.5 8.1 8.8 9.7 9.8 9.6 9.8 8.23
3.56% 3.00% 4.26% 4.00% 4.17% 4.37% 4.70% 4.64% 4.43% 4.44% 4.16%
36,608 37,301 37,830 38,363 38,960 39,431 39,876 40,311 40,790 41,378
-5.1 -483.3 -757.5 -1,039.5 -1,193.6 -1,326.8 -1,477.8 -1,640.5 -1,789.4 -1,922.2 -1,163.57
-0.01% -1.30% -2.00% -2.71% -3.06% -3.36% -3.71% -4.07% -4.39% -4.65% -2.93%
untries
16,445 16,632 16,770 16,928 17,110 17,287 17,449 17,612 17,777 17,880
-108.5 -93.5 -82.4 -78.2 -63.1 -46.8 -34.9 -30.1 -21.4 -13.9 -57.27
-0.66% -0.56% -0.49% -0.46% -0.37% -0.27% -0.20% -0.17% -0.12% -0.08% -0.34%
10,911 10,892 10,930 10,932 10,956 10,916 10,820 10,738 10,636 10,783
328.2 191.1 96.6 19.5 -66.2 -161.0 -283.8 -380.6 -463.9 -531.5 -125.16
3.01% 1.75% 0.88% 0.18% -0.60% -1.48% -2.62% -3.54% -4.36% -4.93% -1.17%
2,369 2,434 2,555 2,668 2,802 2,928 3,054 3,172 3,280 3,393 0
71.3 72.8 12.0 -33.1 -94.6 -143.1 -186.0 -219.6 -237.4 -257.7 -101.53
3.01% 2.99% 0.47% -1.24% -3.38% -4.89% -6.09% -6.92% -7.24% -7.60% -3.09%
6,883 7,343 7,575 7,835 8,091 8,299 8,554 8,789 9,098 9,322
-296.3 -653.8 -783.7 -947.6 -969.7 -975.8 -973.1 -1,010.3 -1,066.8 -1,119.0 -879.60
-4.30% -8.90% -10.35% -12.09% -11.98% -11.76% -11.38% -11.49% -11.73% -12.00% -10.60%
untries
3,037 3,079 3,120 3,137 3,178 3,214 3,245 3,288 3,333 3,387
-81.3 -194.0 -220.8 -241.9 -251.3 -276.8 -294.7 -308.1 -297.9 -290.2 -245.71
-2.68% -6.30% -7.08% -7.71% -7.91% -8.61% -9.08% -9.37% -8.94% -8.57% -7.62%
523 513 510 508 503 495 490 486 484 482
16.6 1.6 -1.5 -4.7 -7.6 -13.9 -19.3 -22.3 -21.0 -17.1 -8.92
3.17% 0.31% -0.29% -0.92% -1.52% -2.81% -3.93% -4.59% -4.33% -3.55% -1.85%
811 747 723 723 733 730 729 718 714 734
11.1 -30.2 -70.5 -81.0 -84.4 -85.4 -92.8 -105.1 -119.2 -128.4 -78.58
1.37% -4.04% -9.75% -11.20% -11.51% -11.71% -12.74% -14.65% -16.69% -17.48% -10.84%
99 205 357 473 667 839 942 1,008 1,067 1,117
79.5 99.2 95.8 89.9 81.6 86.1 82.9 84.7 77.9 66.6 84.42
80.04% 48.37% 26.85% 19.03% 12.23% 10.26% 8.80% 8.40% 7.30% 5.96% 22.73%
1,051 1,157 1,176 1,200 1,230 1,301 1,355 1,398 1,401 1,427 0
-34.2 -17.1 43.8 120.9 166.2 178.0 165.9 152.7 164.7 190.3 113.13
-3.25% -1.48% 3.72% 10.07% 13.51% 13.68% 12.25% 10.92% 11.76% 13.34% 8.45%
1,320 1,255 1,283 1,343 1,403 1,469 1,528 1,583 1,626 1,670
74.0 46.2 13.6 11.2 -7.0 -33.3 -57.9 -70.4 -66.5 -62.1 -15.23
5.60% 3.68% 1.06% 0.83% -0.50% -2.27% -3.79% -4.45% -4.09% -3.72% -0.76%
83 17 23 37 48 58 58 45 41 50
-12.2 -34.7 -47.7 -55.3 -79.7 -98.8 -112.3 -114.2 -113.7 -119.7 -78.83
-14.6% -205.2% -209.7% -151.4% -166.4% -171.2% -192.3% -253.8% -278.0% -241.1% -188.36%
(U.S. Dollars per Metric Ton)
(Thousand Metric Tons)

Table B.10. So
ArgentinaProduction
Baseline
Change
% chg
Consumption
Baseline
Change
% chg
BrazilProduction
Baseline
Change
% chg
Consumption
Baseline
Change
% chg
United StatesProduction
Baseline
Change
% chg
Consumption
Baseline
Change
% chg
European UnionProduction
Baseline
Change
% chg
Consumption
Baseline
Change
% chg
ChinaProduction
Baseline
Change
% chg
Consumption
Baseline
Change
% chg
IndiaProduction
Baseline
Change
% chg
Consumption
Baseline
Change
% chg
oybean Meal Production and Consumption02/03 03/04 04/05 05/06 06/07 07/08 08/09 09/10 10/11 11/12 Average
16,655 16,849 16,989 17,147 17,328 17,505 17,668 17,832 17,998 18,106
-114.1 -100.6 -90.1 -87.2 -72.6 -57.0 -44.1 -38.8 -30.1 -23.2 -65.77
-0.69% -0.60% -0.53% -0.51% -0.42% -0.33% -0.25% -0.22% -0.17% -0.13% -0.38%
221 223 225 225 224 224 225 225 226 228
-3.1 -6.3 -6.6 -8.8 -8.9 -9.4 -8.8 -8.7 -8.7 -9.2 -7.85
-1.40% -2.84% -2.95% -3.90% -3.96% -4.22% -3.91% -3.88% -3.85% -4.03% -3.49%
19,125 19,621 20,101 20,589 21,087 21,583 22,076 22,567 23,060 23,535
617.3 631.9 656.0 675.7 704.1 732.7 757.3 779.1 802.0 809.9 716.59
3.23% 3.22% 3.26% 3.28% 3.34% 3.39% 3.43% 3.45% 3.48% 3.44% 3.35%
8,216 8,732 9,174 9,661 10,135 10,671 11,259 11,832 12,427 12,752
291.1 441.4 560.2 656.4 770.7 894.2 1,041.5 1,159.6 1,265.8 1,341.4 842.22
3.54% 5.05% 6.11% 6.79% 7.60% 8.38% 9.25% 9.80% 10.19% 10.52% 7.72%
37,122 37,937 38,497 39,152 39,836 40,527 41,205 41,911 42,589 43,334
546.6 505.7 529.2 508.8 565.3 602.9 647.1 680.8 732.5 788.8 610.77
1.47% 1.33% 1.37% 1.30% 1.42% 1.49% 1.57% 1.62% 1.72% 1.82% 1.51%
30,207 30,599 30,924 31,318 31,748 32,230 32,652 33,122 33,492 34,011
844.2 1,159.4 1,314.9 1,456.2 1,535.9 1,579.7 1,621.4 1,691.4 1,799.6 1,907.9 1,491.05
2.79% 3.79% 4.25% 4.65% 4.84% 4.90% 4.97% 5.11% 5.37% 5.61% 4.63%
14,704 14,787 14,763 14,769 14,815 14,862 14,916 15,000 15,035 15,147
-130.9 -46.5 -59.5 -68.1 -21.0 9.8 39.8 68.2 103.5 144.0 3.93
-0.89% -0.31% -0.40% -0.46% -0.14% 0.07% 0.27% 0.45% 0.69% 0.95% 0.02%
29,816 30,200 30,260 30,331 30,378 30,329 30,329 30,400 30,510 30,706
-478.4 -507.7 -741.2 -970.5 -1,051.3 -1,054.3 -1,077.6 -1,140.4 -1,269.8 -1,363.9 -965.51
-1.60% -1.68% -2.45% -3.20% -3.46% -3.48% -3.55% -3.75% -4.16% -4.44% -3.18%
17,599 17,977 18,317 18,706 19,065 19,442 19,888 20,393 20,918 21,455
-56.0 -51.3 -52.3 -52.2 -45.6 -41.2 -37.6 -34.4 -30.7 -26.6 -42.80
-0.32% -0.29% -0.29% -0.28% -0.24% -0.21% -0.19% -0.17% -0.15% -0.12% -0.22%
17,699 18,182 18,673 19,179 19,732 20,281 20,830 21,401 21,985 22,572
23.6 47.9 43.4 37.7 36.0 44.8 45.3 50.3 47.2 39.9 41.62
0.13% 0.26% 0.23% 0.20% 0.18% 0.22% 0.22% 0.23% 0.21% 0.18% 0.21%
3,893 3,962 4,084 4,200 4,337 4,467 4,596 4,720 4,833 4,955
-52.3 -51.5 -110.5 -156.7 -218.4 -267.8 -312.8 -348.5 -368.1 -391.3 -227.79
-1.34% -1.30% -2.71% -3.73% -5.04% -6.00% -6.81% -7.38% -7.62% -7.90% -4.98%
1,524 1,528 1,529 1,532 1,535 1,538 1,542 1,548 1,553 1,562
-123.6 -124.3 -122.5 -123.6 -123.8 -124.7 -126.8 -129.0 -130.8 -133.6 -126.26
-8.11% -8.14% -8.01% -8.07% -8.07% -8.10% -8.22% -8.33% -8.42% -8.55% -8.20%
(Thousand Metric Tons)

Table B.11. So
World Price Baseline
Change
% chg
Total Trade Baseline
Change
% chg
Exports of Selected CouArgentina Baseline
Change
% chg
Brazil Baseline
Change
% chg
United States Baseline
Change
% chg
Imports of Selected CounEastern Europe Baseline
Change
% chg
Former Soviet Union Baseline
Change
% chg
Japan Baseline
Change
% chg
China Baseline
Change
% chg
India Baseline
Change
% chg
South Korea Baseline
Change
% chg
Taiwan Baseline
Change
% chg
oybean Oil Price and Trade02/03 03/04 04/05 05/06 06/07 07/08 08/09 09/10 10/11 11/12 Average
347 348 356 364 373 383 396 408 422 437
28.0 22.7 24.4 24.7 24.2 23.1 22.7 22.2 21.6 20.6 23.42
8.07% 6.54% 6.84% 6.79% 6.48% 6.03% 5.73% 5.44% 5.11% 4.71% 6.17%
7,118 7,253 7,376 7,508 7,647 7,781 7,903 8,027 8,157 8,287
362.8 330.2 347.8 350.5 372.9 390.5 409.9 426.4 445.1 461.2 389.74
5.10% 4.55% 4.71% 4.67% 4.88% 5.02% 5.19% 5.31% 5.46% 5.56% 5.04%
untries
3,549 3,590 3,620 3,654 3,694 3,732 3,768 3,804 3,841 3,863
-25.7 -22.2 -20.4 -19.4 -16.6 -13.1 -10.5 -9.3 -7.7 -6.1 -15.11
-0.73% -0.62% -0.56% -0.53% -0.45% -0.35% -0.28% -0.24% -0.20% -0.16% -0.41%
1,366 1,430 1,502 1,571 1,643 1,716 1,786 1,856 1,926 1,974
168.5 159.6 168.2 171.4 175.9 180.8 185.2 188.6 191.6 192.5 178.23
12.34% 11.16% 11.20% 10.91% 10.70% 10.53% 10.37% 10.16% 9.95% 9.75% 10.71%
1,032 1,094 1,138 1,187 1,224 1,253 1,274 1,289 1,321 1,371
251.8 206.0 218.7 216.7 224.4 228.0 236.0 242.6 251.3 257.9 233.35
24.39% 18.83% 19.22% 18.26% 18.33% 18.19% 18.53% 18.82% 19.03% 18.81% 19.24%
untries
188 191 195 199 203 208 213 217 222 227
4.5 4.0 4.3 4.1 4.2 4.1 4.1 4.0 4.1 4.0 4.14
2.42% 2.12% 2.19% 2.08% 2.06% 1.95% 1.91% 1.84% 1.84% 1.78% 2.02%
360 365 371 378 385 393 401 409 419 428
10.7 7.9 8.4 7.8 8.2 8.0 8.2 8.1 8.4 8.4 8.42
2.98% 2.16% 2.27% 2.07% 2.12% 2.04% 2.05% 1.98% 2.00% 1.96% 2.16%
1 0 2 3 4 4 4 4 3 5
50.9 41.4 40.9 40.2 39.6 39.3 38.4 37.9 37.6 37.0 40.31
3685% 15697% 1855% 1194% 1036% 1089% 859% 1003% 1108% 750% 2827.61%
451 500 566 637 720 802 869 931 997 1,061
39.6 42.1 46.2 45.5 49.7 52.6 56.4 59.9 64.6 69.1 52.56
8.78% 8.42% 8.16% 7.14% 6.91% 6.55% 6.49% 6.43% 6.48% 6.51% 7.19%
1,339 1,408 1,459 1,509 1,557 1,609 1,663 1,722 1,786 1,853
40.5 34.6 46.8 56.8 72.4 86.1 98.8 109.4 116.6 124.9 78.70
3.03% 2.46% 3.21% 3.76% 4.65% 5.35% 5.94% 6.35% 6.53% 6.74% 4.80%
144 159 172 182 192 200 209 217 225 232
6.3 6.6 5.3 5.8 4.8 4.4 3.6 3.3 2.9 2.3 4.53
4.37% 4.19% 3.07% 3.18% 2.51% 2.19% 1.75% 1.50% 1.28% 0.99% 2.50%
69 68 73 81 87 91 96 99 103 105
-1.8 -0.6 -2.5 -1.7 -3.4 -4.3 -5.6 -6.6 -7.7 -9.0 -4.32
-2.60% -0.90% -3.44% -2.10% -3.87% -4.74% -5.90% -6.66% -7.43% -8.54% -4.62%
(U.S. Dollars per Metric Ton)
(Thousand Metric Tons)

Table B.12. So
ArgentinaProduction
Baseline
Change
% chg
Consumption
Baseline
Change
% chg
BrazilProduction
Baseline
Change
% chg
Consumption
Baseline
Change
% chg
United StatesProduction
Baseline
Change
% chg
Consumption
Baseline
Change
% chg
European UnionProduction
Baseline
Change
% chg
Consumption
Baseline
Change
% chg
ChinaProduction
Baseline
Change
% chg
Consumption
Baseline
Change
% chg
IndiaProduction
Baseline
Change
% chg
Consumption
Baseline
Change
% chg
oybean Oil Production and Consumption02/03 03/04 04/05 05/06 06/07 07/08 08/09 09/10 10/11 11/12 Average
3,701 3,744 3,775 3,810 3,851 3,890 3,926 3,963 4,000 4,024
-25.4 -22.4 -20.0 -19.4 -16.1 -12.7 -9.8 -8.6 -6.7 -5.2 -14.62
-0.69% -0.60% -0.53% -0.51% -0.42% -0.33% -0.25% -0.22% -0.17% -0.13% -0.38%
153 154 155 156 157 158 159 159 159 161
0.7 -0.2 0.5 0.0 0.5 0.4 0.7 0.6 0.9 1.0 0.50
0.47% -0.13% 0.30% -0.02% 0.30% 0.23% 0.42% 0.40% 0.60% 0.60% 0.32%
4,600 4,719 4,834 4,952 5,072 5,191 5,309 5,428 5,546 5,660
148.5 152.0 157.8 162.5 169.3 176.2 182.1 187.4 192.9 194.8 172.35
3.23% 3.22% 3.26% 3.28% 3.34% 3.39% 3.43% 3.45% 3.48% 3.44% 3.35%
3,238 3,290 3,336 3,385 3,433 3,481 3,530 3,579 3,628 3,689
-12.1 -9.0 -9.9 -9.1 -7.2 -5.2 -3.5 -1.7 0.6 1.9 -5.50
-0.37% -0.27% -0.30% -0.27% -0.21% -0.15% -0.10% -0.05% 0.02% 0.05% -0.16%
8,785 8,982 9,118 9,278 9,444 9,612 9,777 9,949 10,114 10,296
129.4 119.7 125.3 120.6 134.0 143.0 153.5 161.6 174.0 187.4 144.85
1.47% 1.33% 1.37% 1.30% 1.42% 1.49% 1.57% 1.62% 1.72% 1.82% 1.51%
7,710 7,856 7,963 8,075 8,201 8,343 8,491 8,649 8,784 8,917
-107.2 -89.3 -94.8 -95.2 -92.5 -87.7 -84.9 -82.3 -78.6 -73.8 -88.63
-1.39% -1.14% -1.19% -1.18% -1.13% -1.05% -1.00% -0.95% -0.90% -0.83% -1.07%
3,308 3,327 3,322 3,323 3,333 3,344 3,356 3,375 3,383 3,408
-29.5 -10.5 -13.4 -15.3 -4.7 2.2 9.0 15.3 23.3 32.4 0.88
-0.89% -0.31% -0.40% -0.46% -0.14% 0.07% 0.27% 0.45% 0.69% 0.95% 0.02%
2,137 2,187 2,206 2,227 2,248 2,265 2,282 2,298 2,313 2,329
2.6 2.3 5.4 2.9 6.0 7.3 9.8 10.8 13.3 15.3 7.57
0.12% 0.11% 0.24% 0.13% 0.27% 0.32% 0.43% 0.47% 0.58% 0.66% 0.33%
3,520 3,595 3,663 3,741 3,813 3,888 3,978 4,079 4,184 4,291
-11.2 -10.3 -10.5 -10.4 -9.1 -8.2 -7.5 -6.9 -6.1 -5.3 -8.56
-0.32% -0.29% -0.29% -0.28% -0.24% -0.21% -0.19% -0.17% -0.15% -0.12% -0.22%
3,976 4,097 4,228 4,376 4,527 4,685 4,844 5,009 5,179 5,351
27.4 30.1 36.1 35.0 40.4 44.0 48.7 52.7 58.1 63.4 43.58
0.69% 0.73% 0.85% 0.80% 0.89% 0.94% 1.00% 1.05% 1.12% 1.18% 0.93%
898 914 943 969 1,001 1,031 1,061 1,089 1,115 1,143
-12.1 -11.9 -25.5 -36.2 -50.4 -61.8 -72.2 -80.4 -85.0 -90.3 -52.57
-1.34% -1.30% -2.71% -3.73% -5.04% -6.00% -6.81% -7.38% -7.62% -7.90% -4.98%
2,237 2,323 2,401 2,478 2,557 2,639 2,723 2,811 2,902 2,996
28.5 22.7 21.3 20.6 22.0 24.3 26.6 28.9 31.6 34.7 26.13
1.27% 0.98% 0.89% 0.83% 0.86% 0.92% 0.98% 1.03% 1.09% 1.16% 1.00%
(Thousand Metric Tons)

Table B.13. Ra
World Price Baseline
Change
% chg
Total Trade Baseline
Change
% chg
Exports of Selected CouAustralia Baseline
Change
% chg
Canada Baseline
Change
% chg
Eastern Europe Baseline
Change
% chg
Former Soviet Union Baseline
Change
% chg
Imports of Selected CounChina Baseline
Change
% chg
European Union Baseline
Change
% chg
India Baseline
Change
% chg
Japan Baseline
Change
% chg
Rest of World Baseline
Change
% chg
apeseed Price and Trade02/03 03/04 04/05 05/06 06/07 07/08 08/09 09/10 10/11 11/12 Average
208 220 225 227 231 235 237 240 243 246
42.1 39.5 51.5 46.6 49.5 52.7 55.7 58.5 61.7 65.1 52.30
20.29% 17.98% 22.91% 20.50% 21.43% 22.44% 23.53% 24.38% 25.45% 26.43% 22.53%
5,968 6,074 6,338 6,497 6,656 6,800 6,937 7,096 7,255 7,420
52.6 386.0 378.2 375.1 377.2 397.8 413.4 430.7 449.0 467.0 372.70
0.88% 6.35% 5.97% 5.77% 5.67% 5.85% 5.96% 6.07% 6.19% 6.29% 5.50%
untries
1,353 1,368 1,394 1,408 1,442 1,468 1,485 1,508 1,533 1,560
-3.0 78.3 76.3 72.6 77.7 83.0 82.4 85.6 87.8 92.1 73.28
-0.22% 5.72% 5.48% 5.15% 5.39% 5.66% 5.55% 5.67% 5.73% 5.90% 5.00%
3,606 3,670 3,829 3,928 4,005 4,072 4,143 4,223 4,302 4,384
69.3 305.4 299.2 299.5 298.0 308.0 320.5 330.5 342.2 352.0 292.46
1.92% 8.32% 7.82% 7.62% 7.44% 7.56% 7.74% 7.83% 7.96% 8.03% 7.22%
842 861 926 958 994 1,034 1,071 1,114 1,157 1,202
-42.6 -31.9 -32.3 -30.7 -33.2 -29.0 -26.5 -23.6 -20.9 -18.4 -28.91
-5.07% -3.71% -3.49% -3.20% -3.34% -2.81% -2.48% -2.12% -1.80% -1.53% -2.95%
167 175 190 202 215 226 238 251 263 274
29.0 34.2 35.0 33.8 34.6 35.9 36.9 38.2 39.8 41.3 35.87
17.39% 19.55% 18.45% 16.67% 16.13% 15.88% 15.53% 15.26% 15.11% 15.08% 16.50%
untries
1,616 1,810 2,131 2,190 2,181 2,161 2,158 2,213 2,290 2,403
149.0 190.9 309.8 281.4 301.5 294.4 296.6 290.1 298.1 299.9 271.17
9.22% 10.55% 14.54% 12.85% 13.82% 13.63% 13.74% 13.11% 13.02% 12.48% 12.70%
286 264 233 282 373 456 545 579 621 666
-369.8 -318.0 -275.7 -321.7 -319.9 -287.0 -273.9 -251.9 -239.2 -227.2 -288.42
-129.4% -120.5% -118.5% -114.2% -85.8% -63.0% -50.3% -43.5% -38.5% -34.1% -79.77%
0 0 0 0 0 0 0 0 0 0
191.0 310.1 247.7 262.6 253.4 254.0 259.0 265.7 275.3 286.1 260.50
N/A N/A N/A N/A N/A N/A N/A N/A N/A N/A N/A
2,174 2,175 2,194 2,211 2,229 2,245 2,261 2,275 2,290 2,305
-114.1 -84.9 -97.1 -89.0 -90.3 -89.1 -87.8 -86.3 -85.3 -84.0 -90.78
-5.25% -3.90% -4.43% -4.02% -4.05% -3.97% -3.88% -3.79% -3.73% -3.64% -4.07%
1,738 1,672 1,627 1,661 1,720 1,786 1,820 1,877 1,901 1,893
196.4 287.8 193.6 241.9 232.4 225.4 219.5 213.1 200.1 192.2 220.23
11.30% 17.21% 11.90% 14.56% 13.51% 12.63% 12.06% 11.36% 10.52% 10.15% 12.52%
(Thousand Metric Tons)
(U.S. Dollars per Metric Ton)
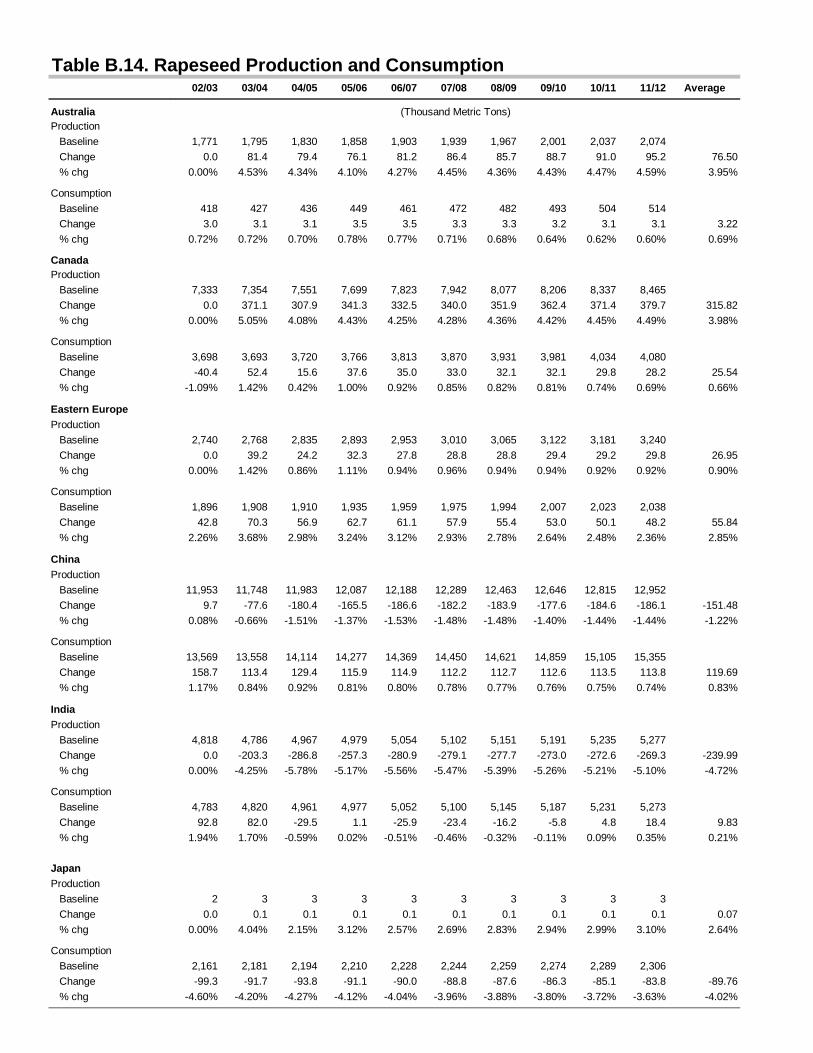
Table B.14. Ra
AustraliaProduction
Baseline
Change
% chg
Consumption
Baseline
Change
% chg
CanadaProduction
Baseline
Change
% chg
Consumption
Baseline
Change
% chg
Eastern EuropeProduction
Baseline
Change
% chg
Consumption
Baseline
Change
% chg
ChinaProduction
Baseline
Change
% chg
Consumption
Baseline
Change
% chg
IndiaProduction
Baseline
Change
% chg
Consumption
Baseline
Change
% chg
JapanProduction
Baseline
Change
% chg
Consumption
Baseline
Change
% chg
apeseed Production and Consumption02/03 03/04 04/05 05/06 06/07 07/08 08/09 09/10 10/11 11/12 Average
1,771 1,795 1,830 1,858 1,903 1,939 1,967 2,001 2,037 2,074
0.0 81.4 79.4 76.1 81.2 86.4 85.7 88.7 91.0 95.2 76.50
0.00% 4.53% 4.34% 4.10% 4.27% 4.45% 4.36% 4.43% 4.47% 4.59% 3.95%
418 427 436 449 461 472 482 493 504 514
3.0 3.1 3.1 3.5 3.5 3.3 3.3 3.2 3.1 3.1 3.22
0.72% 0.72% 0.70% 0.78% 0.77% 0.71% 0.68% 0.64% 0.62% 0.60% 0.69%
7,333 7,354 7,551 7,699 7,823 7,942 8,077 8,206 8,337 8,465
0.0 371.1 307.9 341.3 332.5 340.0 351.9 362.4 371.4 379.7 315.82
0.00% 5.05% 4.08% 4.43% 4.25% 4.28% 4.36% 4.42% 4.45% 4.49% 3.98%
3,698 3,693 3,720 3,766 3,813 3,870 3,931 3,981 4,034 4,080
-40.4 52.4 15.6 37.6 35.0 33.0 32.1 32.1 29.8 28.2 25.54
-1.09% 1.42% 0.42% 1.00% 0.92% 0.85% 0.82% 0.81% 0.74% 0.69% 0.66%
2,740 2,768 2,835 2,893 2,953 3,010 3,065 3,122 3,181 3,240
0.0 39.2 24.2 32.3 27.8 28.8 28.8 29.4 29.2 29.8 26.95
0.00% 1.42% 0.86% 1.11% 0.94% 0.96% 0.94% 0.94% 0.92% 0.92% 0.90%
1,896 1,908 1,910 1,935 1,959 1,975 1,994 2,007 2,023 2,038
42.8 70.3 56.9 62.7 61.1 57.9 55.4 53.0 50.1 48.2 55.84
2.26% 3.68% 2.98% 3.24% 3.12% 2.93% 2.78% 2.64% 2.48% 2.36% 2.85%
11,953 11,748 11,983 12,087 12,188 12,289 12,463 12,646 12,815 12,952
9.7 -77.6 -180.4 -165.5 -186.6 -182.2 -183.9 -177.6 -184.6 -186.1 -151.48
0.08% -0.66% -1.51% -1.37% -1.53% -1.48% -1.48% -1.40% -1.44% -1.44% -1.22%
13,569 13,558 14,114 14,277 14,369 14,450 14,621 14,859 15,105 15,355
158.7 113.4 129.4 115.9 114.9 112.2 112.7 112.6 113.5 113.8 119.69
1.17% 0.84% 0.92% 0.81% 0.80% 0.78% 0.77% 0.76% 0.75% 0.74% 0.83%
4,818 4,786 4,967 4,979 5,054 5,102 5,151 5,191 5,235 5,277
0.0 -203.3 -286.8 -257.3 -280.9 -279.1 -277.7 -273.0 -272.6 -269.3 -239.99
0.00% -4.25% -5.78% -5.17% -5.56% -5.47% -5.39% -5.26% -5.21% -5.10% -4.72%
4,783 4,820 4,961 4,977 5,052 5,100 5,145 5,187 5,231 5,273
92.8 82.0 -29.5 1.1 -25.9 -23.4 -16.2 -5.8 4.8 18.4 9.83
1.94% 1.70% -0.59% 0.02% -0.51% -0.46% -0.32% -0.11% 0.09% 0.35% 0.21%
2 3 3 3 3 3 3 3 3 3
0.0 0.1 0.1 0.1 0.1 0.1 0.1 0.1 0.1 0.1 0.07
0.00% 4.04% 2.15% 3.12% 2.57% 2.69% 2.83% 2.94% 2.99% 3.10% 2.64%
2,161 2,181 2,194 2,210 2,228 2,244 2,259 2,274 2,289 2,306
-99.3 -91.7 -93.8 -91.1 -90.0 -88.8 -87.6 -86.3 -85.1 -83.8 -89.76
-4.60% -4.20% -4.27% -4.12% -4.04% -3.96% -3.88% -3.80% -3.72% -3.63% -4.02%
(Thousand Metric Tons)
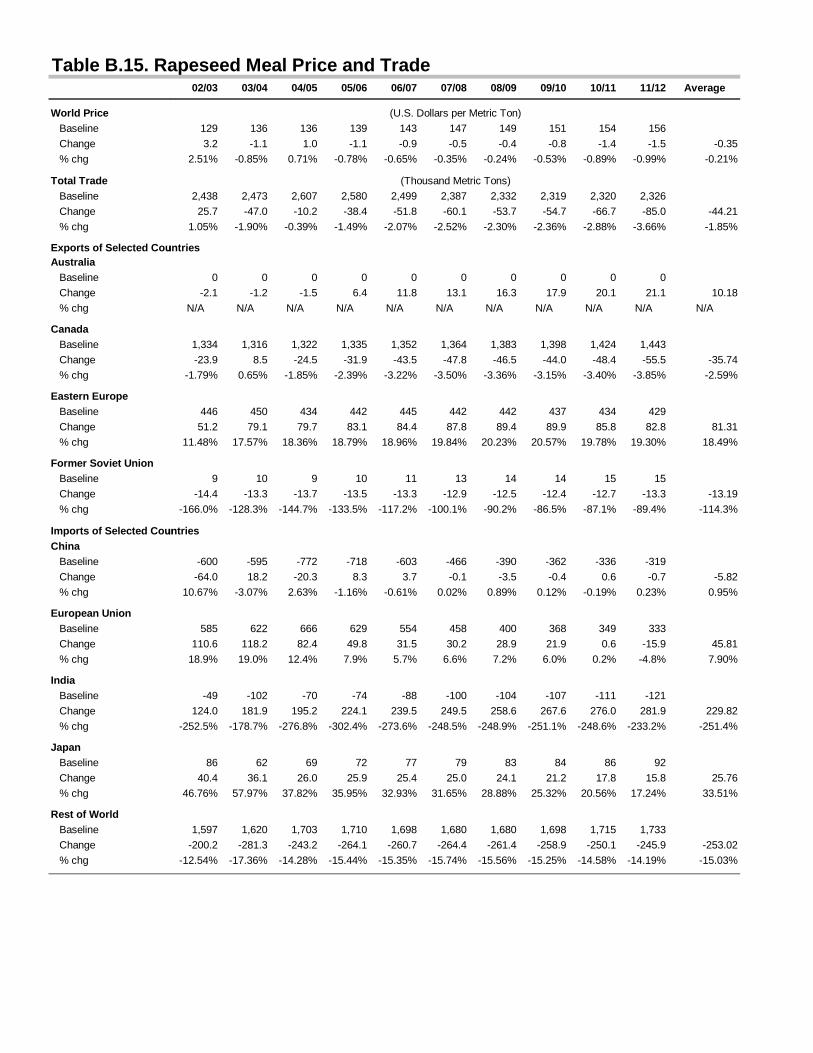
Table B.15. Ra
World Price Baseline
Change
% chg
Total Trade Baseline
Change
% chg
Exports of Selected CouAustralia Baseline
Change
% chg
Canada Baseline
Change
% chg
Eastern Europe Baseline
Change
% chg
Former Soviet Union Baseline
Change
% chg
Imports of Selected CounChina Baseline
Change
% chg
European Union Baseline
Change
% chg
India Baseline
Change
% chg
Japan Baseline
Change
% chg
Rest of World Baseline
Change
% chg
apeseed Meal Price and Trade02/03 03/04 04/05 05/06 06/07 07/08 08/09 09/10 10/11 11/12 Average
129 136 136 139 143 147 149 151 154 156
3.2 -1.1 1.0 -1.1 -0.9 -0.5 -0.4 -0.8 -1.4 -1.5 -0.35
2.51% -0.85% 0.71% -0.78% -0.65% -0.35% -0.24% -0.53% -0.89% -0.99% -0.21%
2,438 2,473 2,607 2,580 2,499 2,387 2,332 2,319 2,320 2,326
25.7 -47.0 -10.2 -38.4 -51.8 -60.1 -53.7 -54.7 -66.7 -85.0 -44.21
1.05% -1.90% -0.39% -1.49% -2.07% -2.52% -2.30% -2.36% -2.88% -3.66% -1.85%
untries
0 0 0 0 0 0 0 0 0 0
-2.1 -1.2 -1.5 6.4 11.8 13.1 16.3 17.9 20.1 21.1 10.18
N/A N/A N/A N/A N/A N/A N/A N/A N/A N/A N/A
1,334 1,316 1,322 1,335 1,352 1,364 1,383 1,398 1,424 1,443
-23.9 8.5 -24.5 -31.9 -43.5 -47.8 -46.5 -44.0 -48.4 -55.5 -35.74
-1.79% 0.65% -1.85% -2.39% -3.22% -3.50% -3.36% -3.15% -3.40% -3.85% -2.59%
446 450 434 442 445 442 442 437 434 429
51.2 79.1 79.7 83.1 84.4 87.8 89.4 89.9 85.8 82.8 81.31
11.48% 17.57% 18.36% 18.79% 18.96% 19.84% 20.23% 20.57% 19.78% 19.30% 18.49%
9 10 9 10 11 13 14 14 15 15
-14.4 -13.3 -13.7 -13.5 -13.3 -12.9 -12.5 -12.4 -12.7 -13.3 -13.19
-166.0% -128.3% -144.7% -133.5% -117.2% -100.1% -90.2% -86.5% -87.1% -89.4% -114.3%
untries
-600 -595 -772 -718 -603 -466 -390 -362 -336 -319
-64.0 18.2 -20.3 8.3 3.7 -0.1 -3.5 -0.4 0.6 -0.7 -5.82
10.67% -3.07% 2.63% -1.16% -0.61% 0.02% 0.89% 0.12% -0.19% 0.23% 0.95%
585 622 666 629 554 458 400 368 349 333
110.6 118.2 82.4 49.8 31.5 30.2 28.9 21.9 0.6 -15.9 45.81
18.9% 19.0% 12.4% 7.9% 5.7% 6.6% 7.2% 6.0% 0.2% -4.8% 7.90%
-49 -102 -70 -74 -88 -100 -104 -107 -111 -121
124.0 181.9 195.2 224.1 239.5 249.5 258.6 267.6 276.0 281.9 229.82
-252.5% -178.7% -276.8% -302.4% -273.6% -248.5% -248.9% -251.1% -248.6% -233.2% -251.4%
86 62 69 72 77 79 83 84 86 92
40.4 36.1 26.0 25.9 25.4 25.0 24.1 21.2 17.8 15.8 25.76
46.76% 57.97% 37.82% 35.95% 32.93% 31.65% 28.88% 25.32% 20.56% 17.24% 33.51%
1,597 1,620 1,703 1,710 1,698 1,680 1,680 1,698 1,715 1,733
-200.2 -281.3 -243.2 -264.1 -260.7 -264.4 -261.4 -258.9 -250.1 -245.9 -253.02
-12.54% -17.36% -14.28% -15.44% -15.35% -15.74% -15.56% -15.25% -14.58% -14.19% -15.03%
(U.S. Dollars per Metric Ton)
(Thousand Metric Tons)
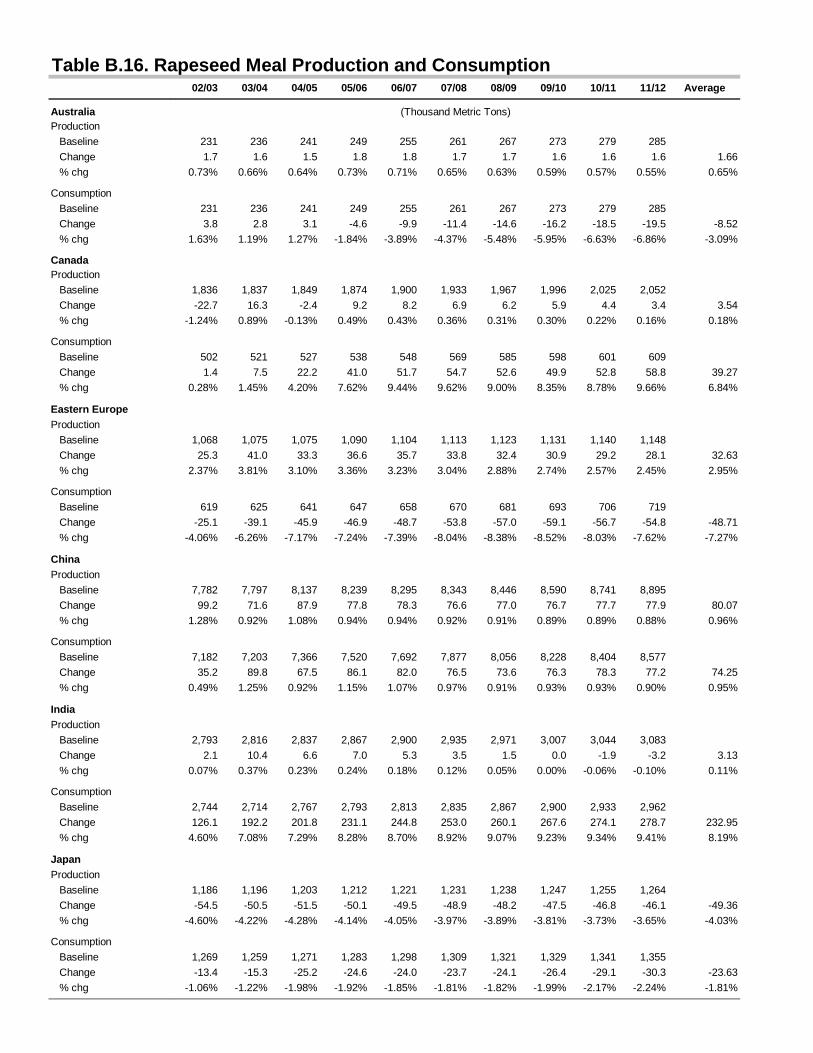
Table B.16. Ra
AustraliaProduction
Baseline
Change
% chg
Consumption
Baseline
Change
% chg
CanadaProduction
Baseline
Change
% chg
Consumption
Baseline
Change
% chg
Eastern EuropeProduction
Baseline
Change
% chg
Consumption
Baseline
Change
% chg
ChinaProduction
Baseline
Change
% chg
Consumption
Baseline
Change
% chg
IndiaProduction
Baseline
Change
% chg
Consumption
Baseline
Change
% chg
JapanProduction
Baseline
Change
% chg
Consumption
Baseline
Change
% chg
apeseed Meal Production and Consumption02/03 03/04 04/05 05/06 06/07 07/08 08/09 09/10 10/11 11/12 Average
231 236 241 249 255 261 267 273 279 285
1.7 1.6 1.5 1.8 1.8 1.7 1.7 1.6 1.6 1.6 1.66
0.73% 0.66% 0.64% 0.73% 0.71% 0.65% 0.63% 0.59% 0.57% 0.55% 0.65%
231 236 241 249 255 261 267 273 279 285
3.8 2.8 3.1 -4.6 -9.9 -11.4 -14.6 -16.2 -18.5 -19.5 -8.52
1.63% 1.19% 1.27% -1.84% -3.89% -4.37% -5.48% -5.95% -6.63% -6.86% -3.09%
1,836 1,837 1,849 1,874 1,900 1,933 1,967 1,996 2,025 2,052
-22.7 16.3 -2.4 9.2 8.2 6.9 6.2 5.9 4.4 3.4 3.54
-1.24% 0.89% -0.13% 0.49% 0.43% 0.36% 0.31% 0.30% 0.22% 0.16% 0.18%
502 521 527 538 548 569 585 598 601 609
1.4 7.5 22.2 41.0 51.7 54.7 52.6 49.9 52.8 58.8 39.27
0.28% 1.45% 4.20% 7.62% 9.44% 9.62% 9.00% 8.35% 8.78% 9.66% 6.84%
1,068 1,075 1,075 1,090 1,104 1,113 1,123 1,131 1,140 1,148
25.3 41.0 33.3 36.6 35.7 33.8 32.4 30.9 29.2 28.1 32.63
2.37% 3.81% 3.10% 3.36% 3.23% 3.04% 2.88% 2.74% 2.57% 2.45% 2.95%
619 625 641 647 658 670 681 693 706 719
-25.1 -39.1 -45.9 -46.9 -48.7 -53.8 -57.0 -59.1 -56.7 -54.8 -48.71
-4.06% -6.26% -7.17% -7.24% -7.39% -8.04% -8.38% -8.52% -8.03% -7.62% -7.27%
7,782 7,797 8,137 8,239 8,295 8,343 8,446 8,590 8,741 8,895
99.2 71.6 87.9 77.8 78.3 76.6 77.0 76.7 77.7 77.9 80.07
1.28% 0.92% 1.08% 0.94% 0.94% 0.92% 0.91% 0.89% 0.89% 0.88% 0.96%
7,182 7,203 7,366 7,520 7,692 7,877 8,056 8,228 8,404 8,577
35.2 89.8 67.5 86.1 82.0 76.5 73.6 76.3 78.3 77.2 74.25
0.49% 1.25% 0.92% 1.15% 1.07% 0.97% 0.91% 0.93% 0.93% 0.90% 0.95%
2,793 2,816 2,837 2,867 2,900 2,935 2,971 3,007 3,044 3,083
2.1 10.4 6.6 7.0 5.3 3.5 1.5 0.0 -1.9 -3.2 3.13
0.07% 0.37% 0.23% 0.24% 0.18% 0.12% 0.05% 0.00% -0.06% -0.10% 0.11%
2,744 2,714 2,767 2,793 2,813 2,835 2,867 2,900 2,933 2,962
126.1 192.2 201.8 231.1 244.8 253.0 260.1 267.6 274.1 278.7 232.95
4.60% 7.08% 7.29% 8.28% 8.70% 8.92% 9.07% 9.23% 9.34% 9.41% 8.19%
1,186 1,196 1,203 1,212 1,221 1,231 1,238 1,247 1,255 1,264
-54.5 -50.5 -51.5 -50.1 -49.5 -48.9 -48.2 -47.5 -46.8 -46.1 -49.36
-4.60% -4.22% -4.28% -4.14% -4.05% -3.97% -3.89% -3.81% -3.73% -3.65% -4.03%
1,269 1,259 1,271 1,283 1,298 1,309 1,321 1,329 1,341 1,355
-13.4 -15.3 -25.2 -24.6 -24.0 -23.7 -24.1 -26.4 -29.1 -30.3 -23.63
-1.06% -1.22% -1.98% -1.92% -1.85% -1.81% -1.82% -1.99% -2.17% -2.24% -1.81%
(Thousand Metric Tons)

Table B.17. Ra
World Price Baseline
Change
% chg
Total Trade Baseline
Change
% chg
Exports of Selected CouAustralia Baseline
Change
% chg
Canada Baseline
Change
% chg
Eastern Europe Baseline
Change
% chg
European Union Baseline
Change
% chg
Imports of Selected CounChina Baseline
Change
% chg
Former Soviet Union Baseline
Change
% chg
India Baseline
Change
% chg
Japan Baseline
Change
% chg
Rest of World Baseline
Change
% chg
apeseed Oil Price and Trade02/03 03/04 04/05 05/06 06/07 07/08 08/09 09/10 10/11 11/12 Average
438 462 475 484 494 506 515 525 534 545
62.2 49.0 58.6 55.8 58.4 60.9 63.5 65.7 68.9 71.6 61.45
14.20% 10.59% 12.35% 11.53% 11.84% 12.05% 12.33% 12.53% 12.91% 13.14% 12.35%
1,346 1,329 1,335 1,380 1,442 1,508 1,561 1,596 1,630 1,659
-57.7 -18.7 -38.2 -22.8 -21.2 -19.1 -17.8 -15.7 -15.8 -14.9 -24.19
-4.29% -1.40% -2.86% -1.65% -1.47% -1.27% -1.14% -0.98% -0.97% -0.90% -1.69%
untries
59 60 61 66 69 70 72 74 77 79
1.1 1.2 0.9 1.3 1.4 1.3 1.3 1.3 1.4 1.4 1.26
1.81% 2.06% 1.51% 2.03% 1.99% 1.84% 1.75% 1.78% 1.81% 1.75% 1.83%
771 767 767 775 784 800 816 827 839 849
-4.9 19.3 7.9 15.3 15.0 14.6 14.4 14.5 14.0 13.6 12.38
-0.64% 2.52% 1.03% 1.98% 1.92% 1.82% 1.77% 1.76% 1.67% 1.61% 1.54%
74 84 82 89 94 95 97 98 99 100
21.7 30.6 25.8 28.3 27.1 26.8 25.6 25.3 24.2 24.0 25.94
29.49% 36.32% 31.56% 31.92% 28.71% 28.13% 26.26% 25.81% 24.43% 23.99% 28.66%
443 418 425 451 494 543 576 596 615 630 0
-75.6 -69.8 -72.9 -67.8 -64.7 -61.8 -59.0 -56.8 -55.5 -53.9 -63.77
-17.1% -16.7% -17.1% -15.0% -13.1% -11.4% -10.2% -9.5% -9.0% -8.5% -12.78%
untries
135 191 148 183 251 330 375 390 406 418
-85.0 -46.0 -64.4 -51.3 -50.1 -49.4 -48.8 -48.2 -48.9 -48.6 -54.07
-62.97% -24.08% -43.43% -28.08% -19.92% -14.95% -13.03% -12.35% -12.03% -11.62% -24.25%
120 121 127 133 139 146 154 162 171 181 0
12.2 12.6 12.8 12.4 12.5 12.1 11.9 11.5 11.3 11.0 12.03
10.19% 10.47% 10.08% 9.33% 8.97% 8.27% 7.76% 7.12% 6.60% 6.07% 8.49%
48 16 37 48 56 63 75 89 103 115
140.9 167.7 160.0 167.7 170.5 174.5 176.6 179.2 180.2 182.7 170.00
292.0% 1065.5% 428.9% 352.3% 306.3% 278.5% 234.5% 202.5% 174.9% 158.5% 349.4%
31 16 20 24 26 28 33 36 39 39
54.9 56.9 50.9 53.2 51.3 49.9 48.5 47.3 45.5 43.8 50.21
178.8% 347.8% 255.3% 224.7% 197.6% 178.2% 146.9% 130.0% 117.0% 112.7% 188.9%
802 775 793 784 760 732 714 708 701 695
-180.7 -210.0 -197.4 -204.9 -205.5 -206.2 -205.9 -205.5 -203.9 -203.7 -202.37
-22.53% -27.10% -24.90% -26.15% -27.05% -28.19% -28.83% -29.01% -29.10% -29.30% -27.21%
(U.S. Dollars per Metric Ton)
(Thousand Metric Tons)

Table B.18. Ra
AustraliaProduction
Baseline
Change
% chg
Consumption
Baseline
Change
% chg
CanadaProduction
Baseline
Change
% chg
Consumption
Baseline
Change
% chg
Eastern EuropeProduction
Baseline
Change
% chg
Consumption
Baseline
Change
% chg
ChinaProduction
Baseline
Change
% chg
Consumption
Baseline
Change
% chg
IndiaProduction
Baseline
Change
% chg
Consumption
Baseline
Change
% chg
JapanProduction
Baseline
Change
% chg
Consumption
Baseline
Change
% chg
apeseed Oil Production and Consumption02/03 03/04 04/05 05/06 06/07 07/08 08/09 09/10 10/11 11/12 Average
165 169 172 178 182 186 191 195 199 203
1.2 1.1 1.1 1.3 1.3 1.2 1.2 1.2 1.1 1.1 1.18
0.73% 0.66% 0.64% 0.73% 0.71% 0.65% 0.63% 0.59% 0.57% 0.55% 0.65%
107 109 111 112 114 116 118 121 122 124
0.1 -0.1 0.2 0.0 -0.1 -0.1 -0.1 -0.2 -0.3 -0.3 -0.08
0.14% -0.11% 0.17% -0.04% -0.06% -0.06% -0.06% -0.14% -0.22% -0.22% -0.06%
1,307 1,308 1,316 1,334 1,353 1,376 1,400 1,421 1,442 1,461
-16.1 11.6 -1.7 6.5 5.9 4.9 4.4 4.2 3.2 2.4 2.52
-1.24% 0.89% -0.13% 0.49% 0.43% 0.36% 0.31% 0.30% 0.22% 0.16% 0.18%
536 541 549 559 568 576 585 593 602 611
-10.2 -8.0 -9.5 -8.8 -9.2 -9.6 -10.0 -10.3 -10.8 -11.2 -9.77
-1.91% -1.47% -1.74% -1.58% -1.61% -1.67% -1.71% -1.74% -1.80% -1.84% -1.71%
724 729 729 739 748 754 761 767 773 778
17.1 27.8 22.6 24.8 24.2 22.9 21.9 21.0 19.8 19.0 22.12
2.37% 3.81% 3.10% 3.36% 3.23% 3.04% 2.88% 2.74% 2.57% 2.45% 2.95%
650 645 647 650 654 659 664 669 674 678
-4.4 -3.2 -3.0 -3.6 -2.8 -3.8 -3.6 -4.3 -4.4 -4.9 -3.80
-0.67% -0.50% -0.47% -0.55% -0.43% -0.58% -0.54% -0.64% -0.65% -0.73% -0.58%
4,142 4,150 4,331 4,385 4,415 4,441 4,495 4,572 4,652 4,735
52.8 38.1 46.8 41.4 41.7 40.8 41.0 40.8 41.3 41.5 42.62
1.28% 0.92% 1.08% 0.94% 0.94% 0.92% 0.91% 0.89% 0.89% 0.88% 0.96%
4,277 4,341 4,479 4,568 4,666 4,771 4,870 4,963 5,059 5,153
-32.2 -7.8 -17.6 -9.8 -8.4 -8.6 -7.8 -7.4 -7.5 -7.1 -11.45
-0.75% -0.18% -0.39% -0.22% -0.18% -0.18% -0.16% -0.15% -0.15% -0.14% -0.25%
1,376 1,387 1,397 1,412 1,428 1,446 1,463 1,481 1,499 1,518
1.0 5.1 3.3 3.5 2.6 1.7 0.7 0.0 -0.9 -1.6 1.54
0.07% 0.37% 0.23% 0.24% 0.18% 0.12% 0.05% 0.00% -0.06% -0.10% 0.11%
1,424 1,403 1,435 1,460 1,484 1,508 1,539 1,569 1,602 1,634
141.9 172.8 163.2 171.1 173.2 176.3 177.3 179.2 179.3 181.1 171.54
9.96% 12.32% 11.38% 11.72% 11.67% 11.69% 11.53% 11.42% 11.19% 11.09% 11.40%
884 892 897 903 910 917 923 929 936 942
-40.6 -37.6 -38.4 -37.4 -36.9 -36.4 -35.9 -35.4 -34.9 -34.4 -36.80
-4.60% -4.22% -4.28% -4.14% -4.05% -3.97% -3.89% -3.81% -3.73% -3.65% -4.03%
913 909 916 926 936 945 955 965 974 981
10.4 18.0 13.2 15.5 14.5 13.5 12.7 12.0 10.7 9.6 13.03
1.14% 1.98% 1.44% 1.68% 1.55% 1.43% 1.33% 1.24% 1.10% 0.98% 1.39%
(Thousand Metric Tons)

Table B.19. Su
World Price Baseline
Change
% chg
Total Trade Baseline
Change
% chg
Exports of Selected CouArgentina Baseline
Change
% chg
China Baseline
Change
% chg
Eastern Europe Baseline
Change
% chg
Former Soviet Union Baseline
Change
% chg
Imports of Selected CounEuropean Union Baseline
Change
% chg
Rest of World Baseline
Change
% chg
unflower Seed Price and Trade02/03 03/04 04/05 05/06 06/07 07/08 08/09 09/10 10/11 11/12 Average
257 254 258 260 263 266 268 271 273 276
23.9 4.2 18.1 7.8 14.1 9.7 13.2 10.4 12.7 11.1 12.53
9.32% 1.67% 6.99% 3.00% 5.37% 3.66% 4.90% 3.85% 4.66% 4.03% 4.74%
1,889 1,932 1,906 1,911 1,914 1,922 1,930 1,937 1,942 1,952
247.6 522.7 346.4 461.2 367.6 444.8 405.1 448.2 423.5 451.5 411.86
13.11% 27.06% 18.18% 24.13% 19.20% 23.14% 20.99% 23.14% 21.81% 23.13% 21.39%
untries
478 411 359 361 330 312 299 281 257 240
115.8 451.5 215.3 385.8 269.7 358.1 304.9 359.2 327.5 365.9 315.38
24.20% 109.74% 59.96% 106.86% 81.68% 114.61% 102.01% 127.94% 127.33% 152.38% 100.67%
46 38 32 28 32 26 24 24 24 22
-7.3 -34.8 -48.3 -42.8 -51.6 -47.7 -51.6 -50.0 -53.2 -53.2 -44.05
-15.99% -91.60% -151.2% -152.5% -160.5% -182.8% -215.9% -207.8% -223.8% -236.3% -163.85%
528 528 544 543 566 597 617 638 661 688
-515.1 -562.2 -499.0 -533.6 -501.6 -502.9 -478.9 -478.1 -460.4 -460.9 -499.26
-97.6% -106.4% -91.8% -98.3% -88.6% -84.2% -77.6% -74.9% -69.7% -67.0% -85.61%
837 954 971 979 986 986 991 994 1,000 1,001
654.3 668.2 678.4 651.8 651.0 637.3 630.8 617.0 609.6 599.6 639.79
78.19% 70.06% 69.86% 66.59% 66.04% 64.61% 63.68% 62.08% 60.97% 59.88% 66.20%
untries
1,199 1,130 1,108 1,091 1,068 1,047 1,029 1,005 982 968
-675.7 -601.0 -637.0 -609.2 -633.0 -591.2 -588.3 -557.3 -551.0 -531.3 -597.50
-56.37% -53.18% -57.50% -55.86% -59.27% -56.48% -57.15% -55.45% -56.10% -54.91% -56.23%
692 804 800 822 848 877 903 934 961 986
923.3 1,123.6 983.4 1,070.4 1,000.6 1,036.1 993.4 1,005.5 974.5 982.8 1,009.36
133.41% 139.83% 122.95% 130.17% 117.95% 118.09% 110.02% 107.66% 101.36% 99.66% 118.11%
(U.S. Dollars per Metric Ton)
(Thousand Metric Tons)

Table B.20. Su
ArgentinaProduction
Baseline
Change
% chg
Consumption
Baseline
Change
% chg
ChinaProduction
Baseline
Change
% chg
Consumption
Baseline
Change
% chg
Eastern EuropeProduction
Baseline
Change
% chg
Consumption
Baseline
Change
% chg
Former Soviet UnionProduction
Baseline
Change
% chg
Consumption
Baseline
Change
% chg
European UnionProduction
Baseline
Change
% chg
Consumption
Baseline
Change
% chg
Rest of WorldProduction
Baseline
Change
% chg
Consumption
Baseline
Change
% chg
unflower Seed Production and Consumption02/03 03/04 04/05 05/06 06/07 07/08 08/09 09/10 10/11 11/12 Average
4,435 4,405 4,429 4,515 4,567 4,638 4,711 4,780 4,844 4,917
-1.7 326.9 71.8 253.6 126.8 220.7 163.5 220.6 185.4 225.2 179.28
-0.04% 7.42% 1.62% 5.62% 2.78% 4.76% 3.47% 4.61% 3.83% 4.58% 3.86%
3,954 3,993 4,074 4,155 4,240 4,329 4,415 4,502 4,590 4,680
-88.5 -142.6 -130.5 -141.7 -137.0 -141.4 -138.0 -141.1 -139.9 -142.0 -134.27
-2.24% -3.57% -3.20% -3.41% -3.23% -3.27% -3.13% -3.13% -3.05% -3.03% -3.13%
1,982 1,981 1,986 2,002 2,042 2,053 2,074 2,099 2,122 2,142
1.6 -30.7 -55.7 -44.2 -58.9 -50.8 -57.5 -53.6 -59.1 -57.9 -46.68
0.08% -1.55% -2.81% -2.21% -2.88% -2.48% -2.77% -2.55% -2.78% -2.70% -2.27%
1,936 1,943 1,954 1,974 2,009 2,027 2,050 2,075 2,098 2,119
8.9 4.1 -7.4 -1.4 -7.3 -3.2 -5.9 -3.7 -5.9 -4.7 -2.62
0.46% 0.21% -0.38% -0.07% -0.36% -0.16% -0.29% -0.18% -0.28% -0.22% -0.13%
2,343 2,350 2,412 2,493 2,576 2,654 2,728 2,809 2,894 2,981
0.0 13.7 -39.7 -1.1 -29.2 -10.7 -22.0 -12.5 -18.8 -13.0 -13.33
0.00% 0.58% -1.65% -0.04% -1.14% -0.40% -0.81% -0.44% -0.65% -0.44% -0.50%
1,808 1,819 1,868 1,949 2,008 2,054 2,110 2,170 2,232 2,292
511.3 571.0 462.8 530.1 474.0 491.3 457.8 465.2 442.2 447.6 485.33
28.28% 31.39% 24.78% 27.20% 23.60% 23.92% 21.70% 21.44% 19.81% 19.53% 24.16%
6,140 6,260 6,311 6,411 6,510 6,598 6,699 6,793 6,887 6,973
0.0 593.2 364.1 522.2 415.4 497.8 452.3 500.3 472.6 503.8 432.17
0.00% 9.48% 5.77% 8.14% 6.38% 7.54% 6.75% 7.37% 6.86% 7.22% 6.55%
5,304 5,305 5,340 5,432 5,524 5,611 5,708 5,798 5,887 5,971
-646.3 -78.2 -312.2 -131.2 -234.8 -140.2 -178.1 -117.1 -136.7 -96.1 -207.10
-12.19% -1.47% -5.85% -2.42% -4.25% -2.50% -3.12% -2.02% -2.32% -1.61% -3.77%
3,435 3,412 3,424 3,480 3,528 3,580 3,626 3,680 3,730 3,770
0.0 73.8 -14.5 52.7 25.7 26.5 2.5 -2.9 -23.4 -24.6 11.59
0.00% 2.16% -0.42% 1.51% 0.73% 0.74% 0.07% -0.08% -0.63% -0.65% 0.34%
4,595 4,517 4,533 4,566 4,594 4,625 4,652 4,682 4,710 4,735
-642.4 -554.9 -633.8 -569.9 -599.6 -570.4 -581.9 -563.7 -571.9 -558.0 -584.64
-13.98% -12.29% -13.98% -12.48% -13.05% -12.33% -12.51% -12.04% -12.14% -11.78% -12.66%
5,497 5,449 5,476 5,524 5,568 5,610 5,656 5,702 5,748 5,792
0.0 -84.4 -160.4 -106.2 -143.5 -115.3 -131.6 -115.6 -124.6 -114.3 -109.59
0.00% -1.55% -2.93% -1.92% -2.58% -2.05% -2.33% -2.03% -2.17% -1.97% -1.95%
6,258 6,221 6,265 6,344 6,410 6,484 6,555 6,632 6,705 6,776
883.3 1,015.1 841.0 952.2 865.4 916.0 866.4 887.3 853.0 867.1 894.67
14.11% 16.32% 13.42% 15.01% 13.50% 14.13% 13.22% 13.38% 12.72% 12.80% 13.86%
(Thousand Metric Tons)

Table B.21. Su
World Price Baseline
Change
% chg
Total Trade Baseline
Change
% chg
Exports of Selected CouArgentina Baseline
Change
% chg
China Baseline
Change
% chg
Eastern Europe Baseline
Change
% chg
Former Soviet Union Baseline
Change
% chg
Imports of Selected CounEuropean Union Baseline
Change
% chg
Rest of World Baseline
Change
% chg
unflower Seed Meal Price and Trade02/03 03/04 04/05 05/06 06/07 07/08 08/09 09/10 10/11 11/12 Average
113 122 127 129 133 136 139 141 144 147
-3.4 -12.7 -8.2 -13.3 -11.5 -13.3 -12.3 -13.9 -13.8 -14.7 -11.70
-3.01% -10.42% -6.44% -10.28% -8.66% -9.81% -8.88% -9.87% -9.55% -9.96% -8.69%
1,732 1,796 1,830 1,899 1,958 2,007 2,065 2,124 2,184 2,246
20.5 158.7 103.0 123.5 97.1 111.5 100.6 105.5 81.8 69.9 97.21
1.19% 8.84% 5.63% 6.50% 4.96% 5.55% 4.87% 4.97% 3.75% 3.11% 4.94%
untries
1,452 1,491 1,514 1,543 1,581 1,617 1,650 1,685 1,723 1,762
-48.2 -95.4 -55.0 -85.8 -67.1 -79.6 -71.6 -80.9 -76.4 -80.6 -74.06
-3.32% -6.40% -3.63% -5.56% -4.24% -4.92% -4.34% -4.80% -4.44% -4.58% -4.62%
0 0 0 0 0 0 0 0 0 0
34.6 11.1 2.1 -12.4 -16.8 -33.9 -44.6 -54.2 -63.7 -74.4 -25.22
N/A N/A N/A N/A N/A N/A N/A N/A N/A N/A N/A
34 44 49 74 79 75 80 85 91 96
285.1 316.2 292.6 312.1 297.5 309.8 305.0 309.2 296.5 293.6 301.77
835.6% 721.7% 600.5% 420.5% 377.7% 413.0% 382.1% 365.2% 327.5% 306.7% 475.05%
246 261 267 282 299 315 335 354 370 388
-251.0 -73.2 -136.7 -90.4 -116.6 -84.8 -88.2 -68.7 -74.6 -68.8 -105.28
-102.2% -28.0% -51.2% -32.1% -39.0% -26.9% -26.3% -19.4% -20.1% -17.7% -36.3%
untries
1,420 1,425 1,408 1,427 1,429 1,425 1,429 1,436 1,446 1,459
381.7 498.8 408.5 438.0 395.0 416.1 396.0 399.6 367.2 355.5 405.64
26.87% 34.99% 29.01% 30.70% 27.64% 29.19% 27.71% 27.83% 25.39% 24.36% 28.37%
322 381 432 482 539 592 646 697 748 797
-361.1 -340.1 -305.5 -314.5 -297.9 -304.6 -295.4 -294.1 -285.4 -285.6 -308.42
-112.3% -89.3% -70.7% -65.2% -55.3% -51.5% -45.7% -42.2% -38.1% -35.9% -60.6%
(U.S. Dollars per Metric Ton)
(Thousand Metric Tons)

Table B.22. Su
ArgentinaProduction
Baseline
Change
% chg
Consumption
Baseline
Change
% chg
ChinaProduction
Baseline
Change
% chg
Consumption
Baseline
Change
% chg
Eastern EuropeProduction
Baseline
Change
% chg
Consumption
Baseline
Change
% chg
Former Soviet UnionProduction
Baseline
Change
% chg
Consumption
Baseline
Change
% chg
European UnionProduction
Baseline
Change
% chg
Consumption
Baseline
Change
% chg
Rest of WorldProduction
Baseline
Change
% chg
Consumption
Baseline
Change
% chg
unflower Seed Meal Production and Consumption02/03 03/04 04/05 05/06 06/07 07/08 08/09 09/10 10/11 11/12 Average
1,636 1,653 1,687 1,721 1,757 1,794 1,830 1,867 1,904 1,941
-36.9 -60.9 -54.8 -60.2 -57.8 -59.9 -58.3 -59.8 -59.1 -60.2 -56.80
-2.26% -3.68% -3.25% -3.50% -3.29% -3.34% -3.19% -3.20% -3.11% -3.10% -3.19%
189 183 182 184 184 184 186 187 180 183
4.3 15.2 9.5 15.0 13.0 15.8 15.4 17.7 17.6 18.5 14.20
2.28% 8.32% 5.23% 8.16% 7.05% 8.55% 8.28% 9.47% 9.75% 10.12% 7.72%
595 598 601 608 622 626 634 644 653 662
1.0 -7.0 -8.8 -8.6 -9.9 -9.1 -9.7 -9.4 -10.0 -9.9 -8.14
0.17% -1.18% -1.46% -1.41% -1.59% -1.46% -1.53% -1.46% -1.53% -1.50% -1.29%
595 598 601 608 622 626 634 644 653 662
-33.6 -18.1 -10.9 3.8 6.9 24.8 34.9 44.8 53.7 64.4 17.08
-5.64% -3.03% -1.81% 0.63% 1.11% 3.96% 5.51% 6.95% 8.22% 9.74% 2.56%
872 876 900 940 968 990 1,016 1,045 1,075 1,104
254.7 283.2 230.5 263.1 235.8 244.1 227.7 231.1 219.9 222.4 241.25
29.22% 32.31% 25.62% 28.00% 24.36% 24.66% 22.40% 22.11% 20.45% 20.14% 24.93%
837 833 851 865 889 914 936 960 984 1,008
-30.8 -34.1 -61.6 -49.5 -61.5 -65.8 -77.2 -78.2 -76.6 -71.2 -60.64
-3.68% -4.09% -7.23% -5.72% -6.92% -7.19% -8.25% -8.14% -7.78% -7.06% -6.61%
2,045 2,042 2,054 2,089 2,123 2,155 2,191 2,224 2,256 2,286
-258.8 -42.0 -131.0 -61.3 -100.6 -63.9 -78.0 -54.2 -61.3 -45.4 -89.65
-12.65% -2.06% -6.37% -2.94% -4.74% -2.97% -3.56% -2.44% -2.72% -1.98% -4.24%
1,799 1,781 1,787 1,807 1,824 1,840 1,856 1,870 1,886 1,898
-8.2 30.2 6.3 28.6 16.1 20.7 10.3 14.3 13.3 23.3 15.49
-0.45% 1.69% 0.35% 1.58% 0.89% 1.12% 0.56% 0.77% 0.70% 1.23% 0.84%
2,152 2,108 2,118 2,132 2,145 2,159 2,171 2,184 2,197 2,208
-324.2 -292.0 -321.7 -297.0 -308.3 -294.8 -298.1 -289.3 -291.5 -284.8 -300.18
-15.06% -13.86% -15.19% -13.93% -14.37% -13.66% -13.73% -13.24% -13.27% -12.90% -13.92%
3,560 3,535 3,530 3,560 3,576 3,585 3,600 3,620 3,643 3,668
52.0 193.0 93.9 133.7 89.6 119.0 99.7 108.4 76.2 69.8 103.53
1.46% 5.46% 2.66% 3.76% 2.50% 3.32% 2.77% 2.99% 2.09% 1.90% 2.89%
2,396 2,368 2,381 2,412 2,437 2,465 2,493 2,523 2,551 2,578
385.2 438.8 367.4 412.7 376.9 397.7 377.0 385.3 370.9 376.6 388.86
16.08% 18.54% 15.43% 17.11% 15.47% 16.13% 15.12% 15.27% 14.54% 14.61% 15.83%
2,717 2,749 2,814 2,894 2,976 3,057 3,139 3,220 3,299 3,375
23.6 98.1 62.3 97.9 79.1 92.9 81.7 91.1 85.6 91.0 80.32
0.87% 3.57% 2.21% 3.38% 2.66% 3.04% 2.60% 2.83% 2.59% 2.70% 2.65%
(Thousand Metric Tons)

Table B.23. Su
World Price Baseline
Change
% chg
Total Trade Baseline
Change
% chg
Exports of Selected CouArgentina Baseline
Change
% chg
China Baseline
Change
% chg
Eastern Europe Baseline
Change
% chg
Former Soviet Union Baseline
Change
% chg
Imports of Selected CounEuropean Union Baseline
Change
% chg
Rest of World Baseline
Change
% chg
unflower Seed Oil Price and Trade02/03 03/04 04/05 05/06 06/07 07/08 08/09 09/10 10/11 11/12 Average
546 529 535 539 544 551 557 563 569 576
58.2 23.2 46.6 31.2 42.2 35.6 41.7 38.1 42.8 40.8 40.05
10.65% 4.39% 8.71% 5.79% 7.76% 6.46% 7.49% 6.77% 7.52% 7.08% 7.26%
1,210 1,160 1,187 1,225 1,267 1,307 1,347 1,383 1,417 1,451
-162.3 -55.8 -80.1 -56.1 -65.0 -48.1 -45.9 -33.0 -29.1 -19.9 -59.53
-13.41% -4.81% -6.75% -4.58% -5.13% -3.68% -3.40% -2.38% -2.06% -1.37% -4.76%
untries
1,021 1,019 1,049 1,075 1,103 1,133 1,161 1,189 1,218 1,249
0.6 -57.7 -27.2 -48.7 -34.3 -43.6 -35.3 -40.4 -35.0 -38.3 -35.99
0.06% -5.66% -2.59% -4.53% -3.11% -3.84% -3.04% -3.40% -2.87% -3.07% -3.21%
0 0 0 0 0 0 0 0 0 0
-0.8 -13.8 -20.1 -27.9 -31.7 -40.3 -47.3 -54.3 -61.6 -69.7 -36.75
N/A N/A N/A N/A N/A N/A N/A N/A N/A N/A N/A
-121 -139 -132 -113 -104 -103 -96 -88 -79 -71
197.8 205.8 177.3 194.3 179.2 182.0 172.2 172.9 166.0 166.8 181.43
-163.5% -147.7% -134.3% -172.1% -172.0% -177.2% -179.7% -197.5% -210.7% -234.0% -178.89%
189 142 138 151 164 174 186 194 199 202
-162.9 1.9 -52.9 -7.4 -30.8 -4.5 -10.5 7.4 5.9 18.5 -23.54
-86.22% 1.35% -38.47% -4.92% -18.72% -2.59% -5.67% 3.83% 2.95% 9.16% -13.93%
untries
98 204 188 194 196 197 200 202 205 208
224.6 267.1 239.1 254.2 239.5 244.3 235.0 236.5 230.2 230.1 240.07
230.2% 131.1% 127.0% 131.3% 122.3% 124.2% 117.7% 117.2% 112.4% 110.7% 132.4%
981 806 855 908 956 997 1,041 1,083 1,122 1,161
-189.9 -130.8 -162.1 -144.0 -157.0 -150.7 -156.0 -150.9 -154.9 -152.9 -154.93
-19.36% -16.23% -18.95% -15.86% -16.42% -15.12% -14.99% -13.94% -13.80% -13.16% -15.78%
(U.S. Dollars per Metric Ton)
(Thousand Metric Tons)

Table B.24. Su
ArgentinaProduction
Baseline
Change
% chg
Consumption
Baseline
Change
% chg
ChinaProduction
Baseline
Change
% chg
Consumption
Baseline
Change
% chg
Eastern EuropeProduction
Baseline
Change
% chg
Consumption
Baseline
Change
% chg
Former Soviet UnionProduction
Baseline
Change
% chg
Consumption
Baseline
Change
% chg
European UnionProduction
Baseline
Change
% chg
Consumption
Baseline
Change
% chg
Rest of WorldProduction
Baseline
Change
% chg
Consumption
Baseline
Change
% chg
unflower Seed Oil Production and Consumption02/03 03/04 04/05 05/06 06/07 07/08 08/09 09/10 10/11 11/12 Average
1,558 1,574 1,607 1,639 1,673 1,709 1,743 1,778 1,813 1,849
-35.2 -58.0 -52.2 -57.3 -55.0 -57.1 -55.5 -57.0 -56.3 -57.3 -54.09
-2.26% -3.68% -3.25% -3.50% -3.29% -3.34% -3.19% -3.20% -3.11% -3.10% -3.19%
539 554 559 565 571 577 583 590 596 601
-27.0 -6.3 -21.0 -11.3 -18.8 -14.7 -19.1 -17.2 -20.5 -19.3 -17.52
-5.01% -1.14% -3.75% -2.00% -3.29% -2.55% -3.28% -2.92% -3.44% -3.22% -3.06%
226 227 228 231 236 237 240 244 248 251
0.4 -2.7 -3.3 -3.3 -3.7 -3.5 -3.7 -3.6 -3.8 -3.8 -3.09
0.17% -1.18% -1.46% -1.41% -1.59% -1.46% -1.53% -1.46% -1.53% -1.50% -1.29%
226 227 228 231 236 237 240 244 248 251
1.2 11.1 16.7 24.7 27.9 36.9 43.7 50.7 57.9 65.9 33.66
0.52% 4.89% 7.34% 10.69% 11.83% 15.53% 18.17% 20.76% 23.35% 26.27% 13.94%
697 701 720 752 775 792 813 836 860 883
203.7 226.5 184.4 210.5 188.6 195.3 182.1 184.9 175.9 178.0 193.00
29.22% 32.31% 25.62% 28.00% 24.36% 24.66% 22.40% 22.11% 20.45% 20.14% 24.93%
816 838 851 864 878 893 908 923 938 954
5.5 18.9 8.5 15.4 10.1 13.0 10.3 11.9 10.1 11.0 11.45
0.67% 2.25% 1.00% 1.78% 1.15% 1.45% 1.13% 1.28% 1.08% 1.16% 1.29%
2,095 2,092 2,105 2,140 2,175 2,208 2,244 2,278 2,311 2,342
-265.1 -43.0 -134.1 -62.8 -103.1 -65.5 -79.9 -55.5 -62.8 -46.5 -91.84
-12.65% -2.06% -6.37% -2.94% -4.74% -2.97% -3.56% -2.44% -2.72% -1.98% -4.24%
1,902 1,947 1,966 1,988 2,010 2,033 2,058 2,084 2,111 2,140
-95.5 -49.0 -78.7 -57.1 -71.2 -61.7 -68.9 -63.4 -68.3 -65.2 -67.91
-5.02% -2.52% -4.00% -2.87% -3.54% -3.04% -3.35% -3.04% -3.24% -3.05% -3.37%
1,739 1,702 1,710 1,722 1,732 1,744 1,754 1,764 1,774 1,783
-261.8 -235.9 -259.8 -239.9 -249.0 -238.1 -240.7 -233.7 -235.5 -230.1 -242.45
-15.06% -13.86% -15.19% -13.93% -14.37% -13.66% -13.73% -13.24% -13.27% -12.90% -13.92%
1,819 1,887 1,899 1,914 1,927 1,939 1,952 1,965 1,978 1,990
-28.5 18.7 -12.6 8.9 -5.9 3.8 -3.9 1.5 -3.9 -0.7 -2.25
-1.56% 0.99% -0.67% 0.47% -0.31% 0.20% -0.20% 0.08% -0.20% -0.04% -0.12%
2,183 2,157 2,170 2,198 2,220 2,246 2,271 2,298 2,324 2,349
351.0 399.8 334.7 376.0 343.4 362.3 343.5 351.1 337.9 343.2 354.30
16.08% 18.54% 15.43% 17.11% 15.47% 16.13% 15.12% 15.27% 14.54% 14.61% 15.83%
3,156 2,957 3,024 3,104 3,175 3,242 3,311 3,380 3,446 3,510
152.5 262.5 177.6 229.0 188.6 210.3 188.7 199.5 183.9 189.9 198.27
4.83% 8.88% 5.87% 7.38% 5.94% 6.49% 5.70% 5.90% 5.34% 5.41% 6.17%
(Thousand Metric Tons)
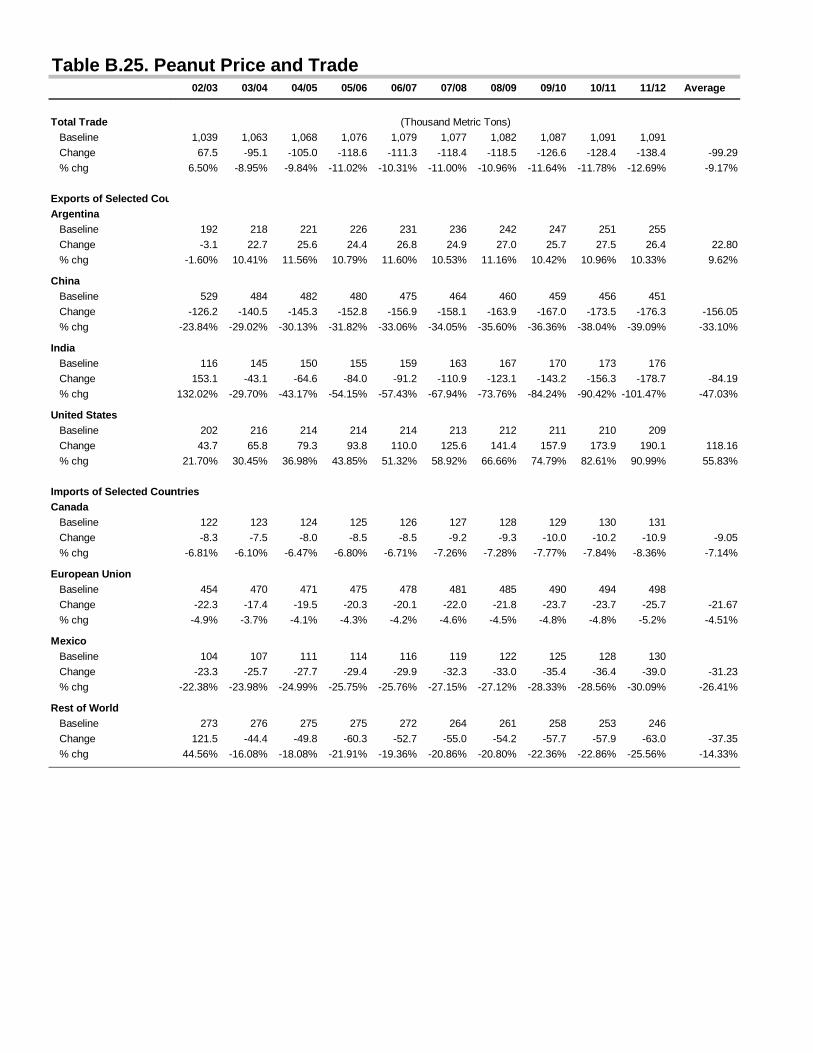
Table B.25. Pe
Total Trade Baseline
Change
% chg
Exports of Selected CouArgentina Baseline
Change
% chg
China Baseline
Change
% chg
India Baseline
Change
% chg
United States Baseline
Change
% chg
Imports of Selected CounCanada Baseline
Change
% chg
European Union Baseline
Change
% chg
Mexico Baseline
Change
% chg
Rest of World Baseline
Change
% chg
eanut Price and Trade02/03 03/04 04/05 05/06 06/07 07/08 08/09 09/10 10/11 11/12 Average
1,039 1,063 1,068 1,076 1,079 1,077 1,082 1,087 1,091 1,091
67.5 -95.1 -105.0 -118.6 -111.3 -118.4 -118.5 -126.6 -128.4 -138.4 -99.29
6.50% -8.95% -9.84% -11.02% -10.31% -11.00% -10.96% -11.64% -11.78% -12.69% -9.17%
192 218 221 226 231 236 242 247 251 255
-3.1 22.7 25.6 24.4 26.8 24.9 27.0 25.7 27.5 26.4 22.80
-1.60% 10.41% 11.56% 10.79% 11.60% 10.53% 11.16% 10.42% 10.96% 10.33% 9.62%
529 484 482 480 475 464 460 459 456 451
-126.2 -140.5 -145.3 -152.8 -156.9 -158.1 -163.9 -167.0 -173.5 -176.3 -156.05
-23.84% -29.02% -30.13% -31.82% -33.06% -34.05% -35.60% -36.36% -38.04% -39.09% -33.10%
116 145 150 155 159 163 167 170 173 176
153.1 -43.1 -64.6 -84.0 -91.2 -110.9 -123.1 -143.2 -156.3 -178.7 -84.19
132.02% -29.70% -43.17% -54.15% -57.43% -67.94% -73.76% -84.24% -90.42% -101.47% -47.03%
202 216 214 214 214 213 212 211 210 209
43.7 65.8 79.3 93.8 110.0 125.6 141.4 157.9 173.9 190.1 118.16
21.70% 30.45% 36.98% 43.85% 51.32% 58.92% 66.66% 74.79% 82.61% 90.99% 55.83%
untries
122 123 124 125 126 127 128 129 130 131
-8.3 -7.5 -8.0 -8.5 -8.5 -9.2 -9.3 -10.0 -10.2 -10.9 -9.05
-6.81% -6.10% -6.47% -6.80% -6.71% -7.26% -7.28% -7.77% -7.84% -8.36% -7.14%
454 470 471 475 478 481 485 490 494 498
-22.3 -17.4 -19.5 -20.3 -20.1 -22.0 -21.8 -23.7 -23.7 -25.7 -21.67
-4.9% -3.7% -4.1% -4.3% -4.2% -4.6% -4.5% -4.8% -4.8% -5.2% -4.51%
104 107 111 114 116 119 122 125 128 130
-23.3 -25.7 -27.7 -29.4 -29.9 -32.3 -33.0 -35.4 -36.4 -39.0 -31.23
-22.38% -23.98% -24.99% -25.75% -25.76% -27.15% -27.12% -28.33% -28.56% -30.09% -26.41%
273 276 275 275 272 264 261 258 253 246
121.5 -44.4 -49.8 -60.3 -52.7 -55.0 -54.2 -57.7 -57.9 -63.0 -37.35
44.56% -16.08% -18.08% -21.91% -19.36% -20.86% -20.80% -22.36% -22.86% -25.56% -14.33%
(Thousand Metric Tons)

Table B.26. Pe
ArgentinaProduction
Baseline
Change
% chg
Consumption
Baseline
Change
% chg
ChinaProduction
Baseline
Change
% chg
Consumption
Baseline
Change
% chg
IndiaProduction
Baseline
Change
% chg
Consumption
Baseline
Change
% chg
United StatesProduction
Baseline
Change
% chg
Consumption
Baseline
Change
% chg
European UnionConsumption
Baseline
Change
% chg
Rest of WorldProduction
Baseline
Change
% chg
Consumption
Baseline
Change
% chg
eanut Production and Consumption02/03 03/04 04/05 05/06 06/07 07/08 08/09 09/10 10/11 11/12 Average
357 389 396 403 410 417 426 434 441 449
-0.5 28.9 33.9 35.2 41.1 41.9 48.3 50.4 57.1 60.1 39.64
-0.15% 7.42% 8.57% 8.74% 10.03% 10.04% 11.34% 11.61% 12.94% 13.38% 9.39%
168 172 174 177 179 181 184 187 190 194
5.2 6.3 8.6 11.0 14.4 17.3 21.4 25.0 29.7 34.0 17.29
3.07% 3.66% 4.91% 6.22% 8.05% 9.56% 11.64% 13.35% 15.61% 17.58% 9.36%
13,628 13,725 13,775 13,774 13,775 13,748 13,806 13,901 13,981 14,031
11.0 -142.2 -125.6 -143.4 -95.0 -103.2 -73.1 -69.2 -40.1 -38.1 -81.88
0.08% -1.04% -0.91% -1.04% -0.69% -0.75% -0.53% -0.50% -0.29% -0.27% -0.59%
13,098 13,241 13,292 13,294 13,301 13,284 13,345 13,441 13,525 13,580
137.2 -1.7 19.7 9.4 61.9 54.9 90.8 97.8 133.5 138.2 74.18
1.05% -0.01% 0.15% 0.07% 0.47% 0.41% 0.68% 0.73% 0.99% 1.02% 0.55%
7,575 7,824 7,916 7,977 8,055 8,140 8,226 8,313 8,396 8,481
0.0 -256.9 -238.2 -222.2 -200.6 -193.5 -173.6 -165.2 -143.9 -133.3 -172.72
0.00% -3.28% -3.01% -2.78% -2.49% -2.38% -2.11% -1.99% -1.71% -1.57% -2.13%
7,459 7,679 7,767 7,822 7,896 7,977 8,060 8,143 8,223 8,304
-153.1 -213.8 -173.6 -138.1 -109.4 -82.7 -50.5 -22.0 12.4 45.3 -88.54
-2.05% -2.78% -2.24% -1.77% -1.39% -1.04% -0.63% -0.27% 0.15% 0.55% -1.15%
1,598 1,694 1,690 1,695 1,702 1,703 1,707 1,712 1,717 1,719
0.0 54.9 64.7 74.1 90.1 103.3 117.5 131.7 142.3 153.8 93.25
0.00% 3.24% 3.83% 4.37% 5.30% 6.07% 6.88% 7.69% 8.29% 8.94% 5.46%
1,457 1,472 1,478 1,484 1,489 1,493 1,498 1,503 1,508 1,514
-14.4 -13.2 -14.6 -17.6 -19.3 -21.4 -23.3 -26.6 -31.3 -36.3 -21.80
-0.99% -0.90% -0.99% -1.19% -1.30% -1.43% -1.55% -1.77% -2.08% -2.40% -1.46%
457 469 472 476 479 483 486 491 495 499
-18.6 -17.6 -19.1 -20.1 -20.1 -21.7 -21.8 -23.3 -23.6 -25.3 -21.12
-4.08% -3.76% -4.05% -4.23% -4.19% -4.49% -4.47% -4.75% -4.77% -5.06% -4.39%
8,598 8,841 8,903 8,983 9,063 9,144 9,229 9,313 9,394 9,476
0.0 210.3 218.3 241.0 264.4 271.7 305.2 315.4 351.0 366.7 254.40
0.00% 2.38% 2.45% 2.68% 2.92% 2.97% 3.31% 3.39% 3.74% 3.87% 2.77%
8,876 9,115 9,178 9,258 9,335 9,407 9,489 9,570 9,646 9,722
127.8 165.9 169.4 181.3 211.8 217.7 251.2 258.7 293.5 304.8 218.22
1.44% 1.82% 1.85% 1.96% 2.27% 2.31% 2.65% 2.70% 3.04% 3.14% 2.32%
(Thousand Metric Tons)

Table B.27. Pa
World Price Baseline
Change
% chg
Total Trade Baseline
Change
% chg
Exports of Selected CouMalaysia Baseline
Change
% chg
Indonesia Baseline
Change
% chg
Imports of Selected CounChina Baseline
Change
% chg
European Union Baseline
Change
% chg
India Baseline
Change
% chg
Rest of World Baseline
Change
% chg
alm Oil Price and Trade02/03 03/04 04/05 05/06 06/07 07/08 08/09 09/10 10/11 11/12 Average
370 412 437 450 460 471 483 498 514 531
36.0 25.3 19.8 16.3 16.2 16.6 18.0 19.1 20.3 20.8 20.82
9.73% 6.14% 4.52% 3.61% 3.52% 3.52% 3.73% 3.83% 3.94% 3.92% 4.65%
15,281 15,387 15,676 16,015 16,382 16,751 17,129 17,508 17,900 18,308
204.1 244.5 325.1 352.1 369.9 376.6 385.7 394.9 407.0 418.1 347.80
1.34% 1.59% 2.07% 2.20% 2.26% 2.25% 2.25% 2.26% 2.27% 2.28% 2.08%
untries
10,498 10,548 10,753 10,991 11,247 11,494 11,737 11,969 12,202 12,442
95.9 97.6 152.1 168.8 178.9 181.2 185.4 190.2 197.5 204.9 165.26
0.91% 0.93% 1.41% 1.54% 1.59% 1.58% 1.58% 1.59% 1.62% 1.65% 1.44%
4,783 4,839 4,923 5,024 5,135 5,257 5,392 5,540 5,698 5,866
108.2 146.8 173.1 183.3 190.9 195.4 200.2 204.7 209.4 213.2 182.54
2.26% 3.03% 3.52% 3.65% 3.72% 3.72% 3.71% 3.70% 3.68% 3.63% 3.46%
untries
2,148 2,183 2,241 2,316 2,394 2,476 2,562 2,653 2,747 2,842
6.4 12.4 21.6 23.9 25.1 24.8 25.1 25.6 26.6 27.5 21.90
0.30% 0.57% 0.96% 1.03% 1.05% 1.00% 0.98% 0.97% 0.97% 0.97% 0.88%
2,527 2,544 2,562 2,599 2,640 2,677 2,714 2,748 2,784 2,822
-24.2 -7.1 4.3 5.7 6.9 5.8 5.2 4.2 4.1 3.9 0.89
-0.96% -0.28% 0.17% 0.22% 0.26% 0.22% 0.19% 0.15% 0.15% 0.14% 0.03%
4,082 4,142 4,287 4,425 4,583 4,744 4,909 5,077 5,254 5,442
289.4 258.3 268.6 280.2 286.6 293.5 300.2 310.4 319.8 330.2 293.73
7.09% 6.24% 6.26% 6.33% 6.25% 6.19% 6.12% 6.11% 6.09% 6.07% 6.27%
6,381 6,375 6,442 6,531 6,623 6,711 6,802 6,887 6,972 7,060
-67.5 -19.2 30.7 42.4 51.2 52.5 55.2 54.7 56.4 56.5 31.28
-1.06% -0.30% 0.48% 0.65% 0.77% 0.78% 0.81% 0.79% 0.81% 0.80% 0.45%
(U.S. Dollars per Metric Ton)
(Thousand Metric Tons)

Table B.28. Pa
MalaysiaProduction
Baseline
Change
% chg
Consumption
Baseline
Change
% chg
IndonesiaProduction
Baseline
Change
% chg
Consumption
Baseline
Change
% chg
ChinaConsumption
Baseline
Change
% chg
European UnionConsumption
Baseline
Change
% chg
IndiaProduction
Baseline
Change
% chg
Consumption
Baseline
Change
% chg
Rest of WorldProduction
Baseline
Change
% chg
Consumption
Baseline
Change
% chg
alm Oil Production and Consumption02/03 03/04 04/05 05/06 06/07 07/08 08/09 09/10 10/11 11/12 Average
12,089 12,225 12,458 12,781 13,100 13,398 13,683 13,963 14,250 14,545
0.0 105.4 149.9 166.5 171.1 172.8 174.6 179.9 186.7 195.1 150.22
0.00% 0.86% 1.20% 1.30% 1.31% 1.29% 1.28% 1.29% 1.31% 1.34% 1.12%
1,692 1,713 1,738 1,783 1,836 1,891 1,942 1,994 2,048 2,103
-30.7 -17.7 -12.5 -9.1 -8.7 -8.6 -9.4 -9.7 -10.0 -9.9 -12.63
-1.81% -1.03% -0.72% -0.51% -0.47% -0.46% -0.48% -0.49% -0.49% -0.47% -0.69%
8,087 8,162 8,314 8,497 8,694 8,898 9,109 9,329 9,558 9,796
0.0 74.9 113.0 131.0 139.8 145.2 149.0 153.4 157.9 162.5 122.67
0.00% 0.92% 1.36% 1.54% 1.61% 1.63% 1.64% 1.64% 1.65% 1.66% 1.36%
3,311 3,331 3,394 3,474 3,559 3,641 3,718 3,790 3,860 3,930
-98.0 -74.1 -61.3 -53.1 -51.2 -50.3 -51.0 -51.2 -51.4 -50.7 -59.22
-2.96% -2.22% -1.80% -1.53% -1.44% -1.38% -1.37% -1.35% -1.33% -1.29% -1.67%
2,148 2,183 2,241 2,316 2,394 2,476 2,562 2,653 2,747 2,842
6.4 12.4 21.6 23.9 25.1 24.8 25.1 25.6 26.6 27.5 21.90
0.30% 0.57% 0.96% 1.03% 1.05% 1.00% 0.98% 0.97% 0.97% 0.97% 0.88%
2,539 2,548 2,567 2,601 2,640 2,678 2,715 2,750 2,786 2,823
-18.5 -10.4 2.7 4.8 6.8 5.8 5.4 4.3 4.3 3.9 0.90
-0.73% -0.41% 0.11% 0.18% 0.26% 0.21% 0.20% 0.16% 0.15% 0.14% 0.03%
39 38 41 44 47 51 53 56 58 61
0.0 0.0 0.0 0.0 -3.4 -4.1 -4.3 -4.4 -4.4 -4.4 -2.49
0.00% 0.00% 0.00% 0.00% -7.10% -7.98% -8.00% -7.86% -7.54% -7.21% -4.57%
4,168 4,220 4,337 4,474 4,630 4,795 4,964 5,136 5,316 5,506
189.3 237.7 262.1 276.4 282.9 289.3 295.8 305.0 314.4 324.5 277.75
4.54% 5.63% 6.04% 6.18% 6.11% 6.03% 5.96% 5.94% 5.91% 5.89% 5.82%
4,350 4,342 4,361 4,413 4,480 4,548 4,613 4,676 4,741 4,808
0.0 2.4 1.4 -3.9 -7.3 -12.8 -17.1 -19.8 -21.0 -21.4 -9.94
0.00% 0.06% 0.03% -0.09% -0.16% -0.28% -0.37% -0.42% -0.44% -0.45% -0.21%
10,763 10,738 10,813 10,945 11,101 11,259 11,415 11,566 11,716 11,870
-62.1 -25.7 27.6 36.0 43.7 39.7 38.7 35.1 35.6 34.9 20.35
-0.58% -0.24% 0.26% 0.33% 0.39% 0.35% 0.34% 0.30% 0.30% 0.29% 0.18%
(Thousand Metric Tons)

Table B.29. Cotton P
World Price Baseline
Change
% chg
Total Trade Baseline
Change
% chg
Exports of Selected CountriesAfrica Baseline
Change
% chg
Australia Baseline
Change
% chg
Pakistan Baseline
Change
% chg
United States Baseline
Change
% chg
Uzbekistan Baseline
Change
% chg
Imports of Selected CountriesChina Baseline
Change
% chg
European Union Baseline
Change
% chg
India Baseline
Change
% chg
Japan Baseline
Change
% chg
Mexico Baseline
Change
% chg
Turkey Baseline
Change
% chg
Price and Trade02/03 03/04 04/05 05/06 06/07 07/08 08/09 09/10 10/11 11/12 Average
837 911 983 1,041 1,091 1,143 1,200 1,258 1,317 1,378
11.57 21.82 28.28 32.59 35.36 37.34 39.00 41.50 43.38 43.50 33.43
1.38% 2.40% 2.88% 3.13% 3.24% 3.27% 3.25% 3.30% 3.29% 3.16% 2.93%
4,363 4,368 4,367 4,397 4,439 4,488 4,540 4,588 4,635 4,683
-28 -34 -35 -39 -41 -42 -42 -44 -45 -43 -39
-0.63% -0.78% -0.80% -0.89% -0.93% -0.94% -0.92% -0.96% -0.96% -0.92% -0.87%
1,198 1,211 1,224 1,238 1,251 1,262 1,273 1,282 1,291 1,298
3.7 22.8 25.1 25.7 26.7 27.1 27.3 27.6 28.1 28.4 24.25
0.31% 1.88% 2.05% 2.07% 2.13% 2.14% 2.15% 2.15% 2.18% 2.19% 1.93%
650 644 649 663 683 709 737 766 795 825
5.2 5.4 5.4 5.8 5.7 5.9 6.0 6.1 6.1 6.1 5.75
0.80% 0.83% 0.83% 0.87% 0.83% 0.83% 0.81% 0.79% 0.77% 0.74% 0.81%
8 27 28 31 34 37 40 44 48 54
-62.7 -97.6 -100.2 -101.5 -102.5 -103.9 -105.6 -107.1 -108.6 -110.3 -100.01
-793% -361% -352% -329% -302% -280% -264% -245% -224% -203% -335.21%
2,275 2,299 2,286 2,283 2,296 2,320 2,347 2,371 2,394 2,418
22.7 14.7 10.2 9.7 8.8 8.0 9.0 8.0 8.0 10.9 10.99
1.0% 0.6% 0.4% 0.4% 0.4% 0.3% 0.4% 0.3% 0.3% 0.4% 0.47%
735 722 717 714 713 712 712 711 711 711
4.6 12.9 14.0 14.4 14.9 15.0 15.0 15.1 15.3 15.3 13.67
0.63% 1.79% 1.96% 2.02% 2.09% 2.10% 2.11% 2.13% 2.15% 2.16% 1.91%
507 538 537 576 613 650 687 710 730 751
-8.4 -16.0 -17.8 -20.6 -22.4 -23.5 -24.0 -25.5 -26.6 -25.6 -21.02
-1.7% -3.0% -3.3% -3.6% -3.6% -3.6% -3.5% -3.6% -3.6% -3.4% -3.29%
543 514 512 496 482 466 447 428 410 390
-4.7 -9.5 -10.7 -11.0 -11.7 -11.9 -12.1 -12.4 -12.8 -12.9 -10.99
-0.9% -1.9% -2.1% -2.2% -2.4% -2.6% -2.7% -2.9% -3.1% -3.3% -2.41%
385 393 400 410 421 433 445 459 473 488
10.5 9.6 9.0 8.0 7.6 7.5 7.7 7.5 7.5 7.7 8.27
2.7% 2.4% 2.3% 2.0% 1.8% 1.7% 1.7% 1.6% 1.6% 1.59% 1.95%
237 228 220 214 209 204 200 196 193 189
-3.3 -2.3 -2.1 -2.2 -2.1 -2.0 -2.0 -2.0 -1.9 -1.8 -2.16
-1.38% -0.99% -0.95% -1.01% -1.01% -1.00% -0.98% -1.00% -0.98% -0.96% -1.03%
353 348 346 346 347 348 347 347 347 347
-1.5 -1.1 -1.0 -1.2 -1.2 -1.2 -1.2 -1.2 -1.2 -1.2 -1.20
-0.43% -0.32% -0.29% -0.34% -0.34% -0.34% -0.33% -0.35% -0.35% -0.35% -0.34%
424 423 411 394 388 388 389 389 390 393
-17.3 -22.2 -24.4 -18.9 -17.0 -17.2 -17.8 -17.6 -17.6 -17.9 -18.80
-4.09% -5.25% -5.94% -4.80% -4.38% -4.45% -4.59% -4.52% -4.51% -4.55% -4.71%
(Thousand Metric Tons)
(U.S. Dollars per Metric Ton)

Table B.30. Cotton P
AfricaProduction
Baseline
Change
% chg
Consumption
Baseline
Change
% chg
IndiaProduction
Baseline
Change
% chg
Consumption
Baseline
Change
% chg
United StatesProduction
Baseline
Change
% chg
Consumption
Baseline
Change
% chg
Uzbekistan Production
Baseline
Change
% chg
Consumption
Baseline
Change
% chg
ChinaProduction
Baseline
Change
% chg
Consumption
Baseline
Change
% chg
European UnionProduction
Baseline
Change
% chg
Consumption
Baseline
Change
% chg
Production and Consumption02/03 03/04 04/05 05/06 06/07 07/08 08/09 09/10 10/11 11/12 Average
1,800 1,803 1,820 1,837 1,852 1,864 1,877 1,890 1,903 1,915
0.0 21.3 23.8 24.2 25.3 25.7 26.0 26.3 26.8 27.1 22.65
0.00% 1.18% 1.31% 1.32% 1.37% 1.38% 1.39% 1.39% 1.41% 1.42% 1.22%
596 590 588 586 587 588 590 593 597 602
-1.2 -1.3 -1.3 -1.3 -1.3 -1.3 -1.3 -1.3 -1.3 -1.3 -1.31
-0.2% -0.2% -0.2% -0.2% -0.2% -0.2% -0.2% -0.2% -0.2% -0.2% -0.22%
2,525 2,543 2,597 2,668 2,725 2,775 2,822 2,870 2,917 2,963
0.0 -4.2 -3.2 -3.2 -2.8 -2.7 -2.6 -2.7 -2.6 -2.6 -2.66
0.00% -0.17% -0.12% -0.12% -0.10% -0.10% -0.09% -0.09% -0.09% -0.09% -0.10%
2,904 2,931 2,984 3,058 3,128 3,192 3,253 3,314 3,375 3,436
8.2 6.0 5.9 5.1 4.9 4.9 5.1 4.9 4.9 5.1 5.49
0.28% 0.20% 0.20% 0.17% 0.16% 0.15% 0.16% 0.15% 0.15% 0.15% 0.18%
3,908 3,815 3,772 3,784 3,802 3,811 3,816 3,824 3,831 3,840
-96.5 -113.9 -114.1 -113.3 -111.7 -112.1 -112.5 -116.3 -114.8 -110.3 -111.55
-2.5% -3.0% -3.0% -3.0% -2.9% -2.9% -2.9% -3.0% -3.0% -2.9% -2.92%
1,681 1,649 1,626 1,609 1,595 1,580 1,566 1,553 1,539 1,524
-34.4 -36.7 -40.5 -43.7 -44.3 -44.5 -45.7 -48.7 -48.9 -49.0 -43.65
-2.05% -2.22% -2.49% -2.71% -2.78% -2.82% -2.92% -3.14% -3.18% -3.22% -2.75%
1,022 1,011 1,007 1,006 1,006 1,007 1,008 1,009 1,010 1,011
0.0 12.1 13.5 13.7 14.2 14.4 14.5 14.5 14.7 14.8 12.61
0.00% 1.19% 1.34% 1.36% 1.41% 1.43% 1.44% 1.44% 1.45% 1.46% 1.25%
287 289 290 292 293 295 296 297 299 300
-0.6 -0.6 -0.6 -0.6 -0.6 -0.6 -0.6 -0.6 -0.6 -0.6 -0.62
-0.19% -0.21% -0.21% -0.22% -0.22% -0.22% -0.22% -0.22% -0.22% -0.21% -0.21%
4,769 4,820 4,864 4,912 4,957 4,999 5,042 5,083 5,124 5,166
0.0 4.0 7.1 7.3 8.7 9.2 9.6 9.7 10.4 10.5 7.65
0.00% 0.08% 0.15% 0.15% 0.17% 0.18% 0.19% 0.19% 0.20% 0.20% 0.15%
5,350 5,396 5,439 5,520 5,611 5,661 5,722 5,783 5,859 5,930
-6.3 -10.5 -10.7 -12.7 -13.5 -14.1 -14.4 -15.6 -16.2 -15.3 -12.92
-0.12% -0.19% -0.20% -0.23% -0.24% -0.25% -0.25% -0.27% -0.28% -0.26% -0.23%
545 556 564 572 580 589 598 607 617 627
0.0 7.7 9.3 9.3 10.1 10.4 10.7 10.9 11.2 11.5 9.11
0.0% 1.4% 1.6% 1.6% 1.7% 1.8% 1.8% 1.8% 1.8% 1.8% 1.54%
1,073 1,056 1,062 1,054 1,048 1,041 1,031 1,022 1,013 1,002
-1.2 -1.4 -1.4 -1.5 -1.5 -1.5 -1.5 -1.5 -1.6 -1.5 -1.47
-0.11% -0.13% -0.13% -0.14% -0.14% -0.15% -0.15% -0.15% -0.15% -0.15% -0.14%
(Thousand Metric Tons)

Table B.31. B
World Price Baseline
Change
% chg
Total Trade Baseline
Change
% chg
Exports of Selected CoArgentina Baseline
Change
% chg
Australia Baseline
Change
% chg
European Union Baseline
Change
% chg
New Zealand Baseline
Change
% chg
Imports of Selected CoBrazil Baseline
Change
% chg
Canada Baseline
Change
% chg
India Baseline
Change
% chg
Indonesia Baseline
Change
% chg
Japan Baseline
Change
% chg
Russia Baseline
Change
% chg
United States Baseline
Change
% chg
Butter Price and Trade2002 2003 2004 2005 2006 2007 2008 2009 2010 2011 Average
1,393 1,456 1,498 1,559 1,585 1,629 1,690 1,765 1,836 1,911
562.2 520.7 491.4 506.9 522.3 536.0 549.3 566.6 586.3 608.0 544.97
40.37% 35.76% 32.81% 32.51% 32.94% 32.91% 32.50% 32.09% 31.93% 31.82% 33.56%
630 628 638 650 668 683 691 700 709 721
22.4 15.8 25.1 28.0 33.7 35.8 46.8 51.4 66.5 82.0 40.77
3.56% 2.52% 3.94% 4.31% 5.05% 5.25% 6.78% 7.35% 9.38% 11.38% 5.95%
Countries
5 6 6 6 6 6 6 6 6 6
3.9 4.3 4.7 4.8 5.1 5.3 5.6 5.8 6.0 6.2 5.17
83% 77% 84% 84% 92% 96% 97% 98% 99% 100% 91%
119 121 119 118 121 122 121 122 122 124
21.0 21.3 25.4 27.2 29.0 29.7 30.0 30.6 30.9 31.2 27.64
17.56% 17.56% 21.27% 23.14% 24.00% 24.24% 24.74% 25.07% 25.27% 25.22% 22.81%
76 87 95 103 111 122 128 137 146 155
-119.7 -86.1 -66.7 -57.5 -58.9 -51.2 -36.8 -25.1 -13.3 -2.6 -51.80
-157% -100% -70% -56% -53% -42% -29% -18% -9% -2% -54%
341 323 326 330 334 337 340 342 344 346
16.8 17.3 18.6 17.9 18.8 19.5 20.4 21.0 21.6 22.0 19.40
4.93% 5.37% 5.70% 5.43% 5.62% 5.79% 6.00% 6.14% 6.28% 6.37% 5.76%
Countries
6 6 6 4 4 3 3 2 1 0
-1.9 -1.9 -1.7 -1.5 -2.0 -2.6 -3.3 -3.9 -4.6 -5.3 -2.88
-32% -33% -30% -35% -52% -76% -123% -222% -454% -1762% -282%
3 1 -1 -1 0 1 1 2 2 2
0.5 35.1 37.0 38.5 40.3 40.6 42.3 42.9 44.0 45.1 36.61
18% 3421% -3382% -3761% 9542% 2719% 4066% 2653% 2194% 1899% 1937%
19 20 22 22 20 17 12 14 14 17
-65.6 -64.0 -48.8 -41.9 -45.3 -35.8 -24.7 -14.9 -5.3 4.3 -34.19
-354% -328% -223% -189% -221% -207% -204% -109% -38% 25% -185%
14 14 15 15 15 16 16 16 16 17
2.1 2.1 2.2 2.2 2.3 2.3 2.4 2.4 2.5 2.5 2.30
14.81% 15.00% 15.07% 15.05% 15.00% 14.97% 14.97% 14.97% 14.95% 14.92% 14.97%
3 1 1 1 1 3 3 4 4 4
9.2 11.3 12.2 12.8 14.0 13.5 13.6 13.2 13.2 13.4 12.65
309% 1134% 1220% 1283% 1350% 485% 422% 351% 323% 326% 720%
112 118 125 132 141 150 158 166 174 183
-7.8 -6.8 -5.7 -3.8 -2.3 -0.3 2.0 4.5 6.6 8.9 -0.47
-6.99% -5.74% -4.53% -2.90% -1.60% -0.18% 1.24% 2.73% 3.80% 4.85% -0.93%
9 9 9 9 9 9 9 9 9 9
8.8 3.6 4.0 0.5 0.1 -3.0 -3.4 -5.3 -5.7 -7.6 -0.79
102% 41% 46% 6% 2% -35% -40% -61% -66% -88% -9%
(U.S. Dollars per Metric Ton)
(Thousand Metric Tons)

Table B.32. B
AustraliaProduction
Baseline
Change
% chg
Consumption
Baseline
Change
% chg
European UnionProduction
Baseline
Change
% chg
Consumption
Baseline
Change
% chg
New ZealandProduction
Baseline
Change
% chg
Consumption
Baseline
Change
% chg
United StatesProduction
Baseline
Change
% chg
Consumption
Baseline
Change
% chg
Butter Production and Consumption2002 2003 2004 2005 2006 2007 2008 2009 2010 2011 Average
182 182 180 179 182 184 183 184 184 186
18.1 22.9 26.5 26.7 28.6 29.0 29.7 29.9 30.3 30.4 27.21
9.96% 12.57% 14.69% 14.98% 15.70% 15.77% 16.20% 16.31% 16.43% 16.38% 14.90%
60 61 61 61 62 62 62 62 62 62
-0.9 -0.8 -0.7 -0.7 -0.7 -0.8 -0.7 -0.7 -0.7 -0.8 -0.76
-1.52% -1.32% -1.18% -1.15% -1.21% -1.22% -1.18% -1.18% -1.19% -1.22% -1.24%
1,706 1,704 1,702 1,703 1,704 1,705 1,705 1,703 1,702 1,700
-5.1 -11.0 14.4 9.8 -2.7 -11.9 -12.9 -13.7 -13.7 -14.5 -6.13
-0.30% -0.64% 0.85% 0.58% -0.16% -0.70% -0.76% -0.80% -0.80% -0.86% -0.36%
1,617 1,614 1,604 1,605 1,603 1,594 1,579 1,566 1,554 1,542
85.4 78.2 84.3 61.9 46.5 29.2 22.1 12.0 1.6 -9.4 41.17
5.28% 4.85% 5.26% 3.85% 2.90% 1.83% 1.40% 0.77% 0.10% -0.61% 2.56%
347 351 354 358 362 366 369 371 373 375
14.0 14.8 16.2 15.6 16.4 17.1 18.0 18.5 19.1 19.5 16.91
4.02% 4.21% 4.58% 4.34% 4.52% 4.67% 4.87% 4.99% 5.11% 5.19% 4.65%
27 28 28 28 29 29 29 29 29 29
-2.9 -2.6 -2.3 -2.4 -2.4 -2.4 -2.4 -2.5 -2.5 -2.6 -2.49
-10.50% -9.26% -8.33% -8.33% -8.39% -8.40% -8.41% -8.50% -8.60% -8.72% -8.74%
546 547 549 553 555 559 560 562 564 567
-5.6 6.7 4.3 10.0 9.4 15.2 15.1 18.3 18.1 20.4 11.19
-1.0% 1.2% 0.8% 1.8% 1.7% 2.7% 2.7% 3.3% 3.2% 3.6% 2.00%
553 555 558 562 564 568 569 571 573 575
2.9 9.6 8.5 10.3 9.6 12.0 11.7 13.0 12.4 12.8 10.28
0.5% 1.7% 1.5% 1.8% 1.7% 2.1% 2.1% 2.3% 2.2% 2.2% 1.82%
(Thousand Metric Tons)

Table B.33. C
World Price Baseline
Change
% chg
Total Trade Baseline
Change
% chg
Exports of Selected CoArgentina Baseline
Change
% chg
Australia Baseline
Change
% chg
European Union Baseline
Change
% chg
New Zealand Baseline
Change
% chg
Switzerland Baseline
Change
% chg
Imports of Selected CoBrazil Baseline
Change
% chg
Canada Baseline
Change
% chg
Japan Baseline
Change
% chg
Mexico Baseline
Change
% chg
Russia Baseline
Change
% chg
United States Baseline
Change
% chg
Cheese Price and Trade2002 2003 2004 2005 2006 2007 2008 2009 2010 2011 Average
2,051 2,108 2,165 2,202 2,221 2,266 2,334 2,392 2,445 2,497
755.9 731.6 699.0 662.8 660.0 617.3 597.7 578.1 565.1 549.7 641.72
36.86% 34.70% 32.29% 30.10% 29.72% 27.24% 25.60% 24.17% 23.11% 22.01% 28.58%
863 887 891 914 946 976 995 1,016 1,034 1,057
-80.9 -102.7 -105.0 -79.7 -82.6 -46.2 -26.7 -0.4 23.8 49.0 -45.14
-9.38% -11.57% -11.79% -8.72% -8.73% -4.74% -2.69% -0.04% 2.30% 4.64% -5.07%
Countries
12 24 18 16 12 9 9 8 6 4
11.6 16.5 18.9 18.3 20.3 19.0 18.7 18.2 17.8 17.0 17.62
97% 67% 108% 117% 169% 201% 204% 227% 288% 409% 189%
185 181 191 195 206 213 217 225 232 240
21.8 12.8 12.3 16.7 15.9 14.6 12.5 11.2 10.0 9.0 13.68
11.73% 7.06% 6.42% 8.58% 7.71% 6.87% 5.74% 4.99% 4.31% 3.74% 6.72%
281 288 277 287 301 316 321 327 334 343
-171.3 -214.2 -225.0 -219.0 -231.9 -197.7 -172.6 -147.2 -124.1 -100.7 -180.37
-61.03% -74.42% -81.33% -76.28% -76.96% -62.54% -53.77% -44.97% -37.15% -29.37% -59.78%
271 277 293 305 315 327 336 342 346 349
5.1 0.7 -2.1 -0.5 0.3 -0.9 -3.5 -5.0 -6.8 -8.7 -2.13
1.88% 0.25% -0.71% -0.16% 0.08% -0.28% -1.04% -1.45% -1.95% -2.48% -0.59%
60 57 52 46 43 41 40 40 39 39
11.0 16.7 19.8 20.5 21.0 20.8 20.4 20.1 20.0 19.7 18.99
18.30% 29.18% 38.00% 44.24% 48.91% 50.69% 51.33% 50.96% 50.82% 50.19% 43.26%
Countries
5 -3 -7 -6 -2 0 1 3 6 9
3.0 8.8 16.2 16.4 17.7 22.6 28.6 32.9 37.0 40.9 22.42
66% -308% -229% -293% -1028% 48703% 2603% 1174% 634% 439% 5176%
11 11 10 10 8 8 8 8 8 8
28.5 30.9 40.2 50.1 52.0 60.0 62.5 66.6 71.0 75.8 53.76
271% 291% 388% 505% 640% 746% 782% 835% 889% 947% 629%
200 206 210 216 222 228 234 239 244 249
26.7 27.4 22.8 16.2 9.2 1.6 -5.4 -12.5 -19.5 -26.6 3.97
13.30% 13.26% 10.82% 7.51% 4.12% 0.68% -2.33% -5.24% -7.98% -10.67% 2.35%
60 58 57 57 56 51 49 45 39 31
-28.4 -46.1 -59.1 -65.8 -70.9 -73.2 -74.4 -74.5 -74.2 -73.6 -64.02
-48% -79% -103% -116% -126% -144% -152% -166% -189% -234% -136%
108 113 118 125 133 140 147 153 161 169
-33.5 -35.1 -36.7 -31.3 -28.9 -25.8 -24.0 -21.1 -18.9 -16.3 -27.15
-30.94% -31.10% -31.06% -24.94% -21.73% -18.41% -16.38% -13.75% -11.74% -9.66% -20.97%
138 138 137 137 137 137 137 137 137 137
-84.9 -81.2 -84.7 -83.7 -88.8 -86.4 -92.6 -94.4 -97.3 -101.0 -89.47
-61.36% -59% -62% -61% -65% -63% -67% -69% -71% -73% -65.04%
(U.S. Dollars per Metric Ton)
(Thousand Metric Tons)

Table B.34. C
AustraliaProduction
Baseline
Change
% chg
Consumption
Baseline
Change
% chg
European UnionProduction
Baseline
Change
% chg
Consumption
Baseline
Change
% chg
New ZealandProduction
Baseline
Change
% chg
Consumption
Baseline
Change
% chg
United StatesProduction
Baseline
Change
% chg
Consumption
Baseline
Change
% chg
Cheese Production and Consumption2002 2003 2004 2005 2006 2007 2008 2009 2010 2011 Average
363 376 389 401 413 425 437 449 461 473
3.5 3.4 1.9 2.9 3.1 2.9 1.8 1.0 0.2 -0.4 2.03
0.97% 0.90% 0.48% 0.72% 0.76% 0.68% 0.41% 0.22% 0.05% -0.09% 0.51%
183 191 198 205 207 212 218 223 228 232
-13.2 -11.7 -10.2 -12.9 -13.0 -12.0 -11.0 -10.4 -9.9 -9.5 -11.40
-7.22% -6.15% -5.17% -6.3% -6.3% -5.7% -5.1% -4.7% -4.4% -4.1% -5.50%
6,273 6,304 6,354 6,434 6,496 6,560 6,577 6,612 6,652 6,693
-133.2 -220.0 -126.3 -189.1 -219.4 -192.7 -167.5 -142.0 -125.8 -108.1 -162.42
-2.1% -3.5% -2.0% -2.9% -3.4% -2.9% -2.5% -2.1% -1.9% -1.6% -2.51%
5,977 6,032 6,079 6,136 6,188 6,237 6,267 6,297 6,328 6,359
23.8 25.5 63.8 47.1 30.2 17.6 11.6 8.8 3.9 -1.4 23.10
0.40% 0.42% 1.05% 0.77% 0.49% 0.28% 0.19% 0.14% 0.06% -0.02% 0.38%
296 305 322 335 346 359 368 375 380 384
2.4 -1.8 -4.4 -2.6 -1.9 -2.9 -5.3 -6.7 -8.5 -10.3 -4.21
0.80% -0.60% -1.38% -0.79% -0.54% -0.80% -1.45% -1.80% -2.23% -2.68% -1.15%
27 28 29 30 31 31 32 33 34 35
-2.7 -2.5 -2.3 -2.2 -2.1 -2.0 -1.9 -1.8 -1.7 -1.6 -2.08
-10.1% -9.1% -8.1% -7.3% -7.0% -6.2% -5.8% -5.4% -5.0% -4.7% -6.88%
3,898 4,026 4,141 4,249 4,358 4,463 4,574 4,686 4,803 4,913
37 20 28 22 27 20 24 22 25 24 24.88
1.0% 0.5% 0.7% 0.5% 0.6% 0.5% 0.5% 0.5% 0.5% 0.5% 0.57%
4,022 4,137 4,248 4,358 4,467 4,572 4,683 4,796 4,913 5,023
-46 -57 -59 -61 -63 -65 -69 -72 -73 -77 -64.21
-1% -1% -1% -1% -1% -1% -1% -2% -1% -2% -1.41%
(Thousand Metric Tons)

Table B.35. N
World Price Baseline
Change
% chg
Total Trade Baseline
Change
% chg
Exports of Selected CoArgentina Baseline
Change
% chg
Australia Baseline
Change
% chg
Canada Baseline
Change
% chg
European Union Baseline
Change
% chg
New Zealand Baseline
Change
% chg
United States Baseline
Change
% chg
Imports of Selected CoBrazil Baseline
Change
% chg
Indonesia Baseline
Change
% chg
Japan Baseline
Change
% chg
Mexico Baseline
Change
% chg
Russia Baseline
Change
% chg
Nonfat Dry Milk Price and Trade2002 2003 2004 2005 2006 2007 2008 2009 2010 2011 Average
1,739 1,772 1,788 1,813 1,843 1,880 1,932 1,963 1,993 2,021
521.6 553.0 577.5 515.2 516.6 492.8 511.3 511.1 518.3 519.5 523.68
30.00% 31.22% 32.29% 28.41% 28.03% 26.21% 26.46% 26.04% 26.00% 25.71% 28.04%
965 954 959 971 986 997 1,001 1,010 1,021 1,033
53.9 76.7 83.3 109.7 125.2 141.5 146.0 150.2 153.7 158.0 119.80
5.59% 8.04% 8.69% 11.30% 12.69% 14.19% 14.58% 14.86% 15.06% 15.30% 12.03%
Countries
21 22 22 23 23 23 24 24 25 25
3.6 4.4 5.1 4.7 5.0 5.1 5.4 5.6 5.8 5.9 5.06
16.69% 19.63% 22.70% 20.77% 21.77% 21.82% 22.66% 22.98% 23.45% 23.63% 21.61%
222 227 222 217 222 224 221 220 219 220
39.1 45.0 52.1 52.3 56.7 57.4 59.0 59.7 60.5 60.9 54.26
17.65% 19.84% 23.48% 24.11% 25.49% 25.60% 26.72% 27.15% 27.58% 27.65% 24.53%
36 35 37 37 35 32 32 31 30 29
4.6 -50.5 -65.6 -68.7 -71.9 -72.9 -75.5 -76.8 -78.6 -80.6 -63.66
13% -145% -176% -186% -208% -227% -235% -249% -266% -283% -196%
95 106 101 104 107 111 112 112 113 113
-9.1 -6.5 -6.1 9.4 20.6 17.4 17.5 7.0 6.8 1.3 5.81
-10% -6% -6% 9% 19% 16% 16% 6% 6% 1% 5%
198 192 196 202 208 213 218 221 224 227
8.7 10.9 14.1 12.4 13.8 15.3 17.3 18.6 19.9 20.8 15.18
4.42% 5.70% 7.20% 6.11% 6.64% 7.16% 7.95% 8.40% 8.87% 9.20% 7.17%
178 135 130 124 115 106 97 97 97 97
3.8 46.9 38.0 54.0 50.9 67.9 67.5 77.2 75.4 81.2 56.29
2.16% 34.72% 29.30% 43.60% 44.32% 64.25% 69.82% 79.92% 78.08% 84.06% 53.02%
Countries
12 12 13 13 12 12 12 12 13 13
-5.7 -7.0 -8.6 -7.8 -8.3 -8.9 -10.3 -11.2 -12.3 -13.2 -9.35
-48% -58% -66% -62% -69% -74% -88% -92% -98% -100% -76%
101 104 107 110 113 115 118 121 124 126
11.9 12.1 12.1 12.9 13.2 13.8 14.0 14.4 14.7 15.1 13.44
11.83% 11.57% 11.33% 11.71% 11.74% 11.92% 11.89% 11.93% 11.93% 11.96% 11.78%
42 30 28 31 41 46 50 53 55 57
8.0 5.4 4.7 3.8 2.6 0.7 -0.8 -2.4 -2.6 -2.0 1.74
19.13% 17.76% 16.70% 12.34% 6.35% 1.60% -1.69% -4.52% -4.62% -3.50% 5.96%
90 95 98 102 105 107 110 113 116 119
-7.8 -8.9 -9.7 -10.1 -10.5 -10.6 -10.8 -10.9 -10.9 -11.0 -10.12
-8.67% -9.35% -9.87% -9.91% -10.01% -9.91% -9.76% -9.57% -9.41% -9.25% -9.57%
42 43 42 39 36 33 30 26 22 18
-5.8 -8.1 -9.9 -6.4 -4.3 -1.9 -0.3 2.1 4.0 6.2 -2.44
-13.68% -18.97% -23.45% -16.29% -11.99% -5.83% -0.97% 8.17% 17.71% 33.55% -3.17%
(Thousand Metric Tons)
(U.S. Dollars per Metric Ton)

Table B.36. N
AustraliaProduction
Baseline
Change
% chg
Consumption
Baseline
Change
% chg
European UnionProduction
Baseline
Change
% chg
Consumption
Baseline
Change
% chg
New ZealandProduction
Baseline
Change
% chg
Consumption
Baseline
Change
% chg
United StatesProduction
Baseline
Change
% chg
Consumption
Baseline
Change
% chg
Nonfat Dry Milk Production and Consumption2002 2003 2004 2005 2006 2007 2008 2009 2010 2011 Average
264 262 256 251 256 258 255 254 253 254
34.7 43.9 51.0 51.4 54.9 55.8 57.2 57.8 58.5 58.8 52.40
13.16% 16.75% 19.90% 20.46% 21.42% 21.59% 22.45% 22.78% 23.12% 23.18% 20.48%
33 34 34 34 34 34 34 34 34 33
-2.9 -2.9 -2.9 -2.5 -2.5 -2.4 -2.3 -2.3 -2.3 -2.2 -2.52
-8.78% -8.72% -8.54% -7.23% -7.47% -7.06% -6.92% -6.76% -6.72% -6.69% -7.49%
972 961 946 931 922 911 907 896 884 873
9.4 9.8 47.5 46.7 24.5 0.9 -4.7 -9.8 -11.9 -15.9 9.65
0.97% 1.02% 5.02% 5.02% 2.66% 0.10% -0.52% -1.09% -1.35% -1.82% 1.00%
861 853 845 838 828 818 802 789 776 763
24.6 20.7 40.3 37.5 13.2 -9.1 -16.9 -15.7 -16.0 -15.1 6.34
2.86% 2.43% 4.77% 4.48% 1.59% -1.11% -2.11% -1.99% -2.07% -1.98% 0.69%
198 203 207 214 219 225 230 233 236 239
7.4 9.6 12.7 11.2 12.6 14.2 16.2 17.5 18.8 19.8 14.00
3.76% 4.73% 6.15% 5.23% 5.75% 6.30% 7.06% 7.50% 7.95% 8.28% 6.27%
11 11 11 12 12 12 12 12 12 12
-1.3 -1.3 -1.4 -1.2 -1.2 -1.1 -1.1 -1.1 -1.1 -1.1 -1.18
-11.89% -11.93% -11.84% -10.17% -9.99% -9.30% -9.43% -9.18% -9.06% -8.83% -10.16%
623 608 592 576 555 539 515 494 472 454
-0.5 31.9 26.0 38.9 37.1 50.6 50.6 58.2 57.1 62.1 41.19
0% 5% 4% 7% 7% 9% 10% 12% 12% 14% 7.97%
403 406 409 399 402 402 406 408 410 410
-4.0 -14.2 -12.3 -14.9 -13.9 -17.0 -16.9 -18.9 -18.4 -19.1 -14.96
-1.0% -3.5% -3.0% -3.7% -3.5% -4.2% -4.2% -4.6% -4.5% -4.7% -3.69%
(Thousand Metric Tons)

Table B.37. W
World Price Baseline
Change
% chg
Total Trade Baseline
Change
% chg
Exports of Selected CoArgentina Baseline
Change
% chg
Australia Baseline
Change
% chg
European Union Baseline
Change
% chg
New Zealand Baseline
Change
% chg
Imports of Selected CoBrazil Baseline
Change
% chg
China Baseline
Change
% chg
Indonesia Baseline
Change
% chg
Malaysia Baseline
Change
% chg
Mexico Baseline
Change
% chg
Russia Baseline
Change
% chg
South Korea Baseline
Change
% chg
Whole Milk Powder Price and Trade2002 2003 2004 2005 2006 2007 2008 2009 2010 2011 Average
1,788 1,826 1,847 1,870 1,892 1,924 1,964 1,998 2,030 2,064
559.3 557.8 548.5 515.8 501.7 475.9 484.3 481.4 482.4 481.4 508.83
31.28% 30.54% 29.70% 27.58% 26.52% 24.73% 24.65% 24.10% 23.76% 23.33% 26.62%
1,277 1,293 1,304 1,326 1,345 1,356 1,368 1,377 1,385 1,393
-0.8 1.1 16.8 28.6 44.6 65.6 66.1 72.1 80.3 90.3 46.48
-0.06% 0.09% 1.29% 2.16% 3.32% 4.83% 4.83% 5.23% 5.80% 6.48% 3.40%
Countries
100 104 107 108 109 111 113 116 118 120
20.5 21.4 21.2 21.4 20.4 19.0 19.0 18.7 18.3 17.8 19.78
20.56% 20.56% 19.91% 19.83% 18.68% 17.06% 16.77% 16.15% 15.53% 14.83% 17.99%
193 197 200 201 202 203 205 206 206 207
15.3 20.7 24.0 26.0 29.0 30.3 30.5 31.1 31.4 32.0 27.03
7.95% 10.49% 12.00% 12.92% 14.37% 14.90% 14.89% 15.10% 15.24% 15.45% 13.33%
476 478 471 478 484 480 479 478 478 478
-68.7 -77.8 -84.2 -79.6 -65.1 -36.6 -30.2 -20.6 -12.2 -2.4 -47.74
-14.43% -16.28% -17.90% -16.66% -13.46% -7.62% -6.31% -4.30% -2.56% -0.51% -10.00%
508 513 526 539 550 562 571 577 583 588
32.2 12.1 10.4 10.6 9.8 8.2 9.0 8.3 7.6 6.5 11.46
6.33% 2.36% 1.98% 1.96% 1.77% 1.46% 1.58% 1.44% 1.30% 1.11% 2.13%
Countries
23 21 21 23 24 24 26 30 33 37
-9.3 -8.9 -6.9 -5.8 -2.2 1.5 2.4 4.0 5.7 7.5 -1.20
-41.46% -41.67% -32.09% -24.98% -9.34% 6.11% 9.28% 13.50% 17.28% 20.21% -8.32%
25 12 8 21 29 39 52 59 63 64
-6.7 -36.2 -53.2 -70.8 -79.8 -83.3 -89.8 -93.9 -98.0 -100.8 -71.25
-26% -314% -678% -343% -273% -215% -172% -158% -156% -156% -249%
12 12 13 13 13 14 14 14 15 15
2.7 2.8 2.9 3.0 3.1 3.2 3.3 3.3 3.4 3.5 3.12
23.17% 23.03% 22.91% 23.14% 23.18% 23.33% 23.37% 23.42% 23.44% 23.46% 23.25%
47 48 50 51 53 55 57 59 61 63
-0.6 -0.6 -0.6 -0.6 -0.6 -0.6 -0.6 -0.6 -0.6 -0.6 -0.62
-1.36% -1.31% -1.26% -1.16% -1.14% -1.08% -1.06% -1.04% -1.03% -1.02% -1.15%
23 25 26 27 30 31 31 32 33 34
5.7 2.9 0.8 -0.5 -1.3 -1.7 -1.6 -1.4 -1.0 -0.6 0.13
24.80% 11.60% 3.04% -2.04% -4.22% -5.54% -5.16% -4.35% -3.09% -1.93% 1.31%
23 23 22 21 20 19 17 15 13 12
-1.8 -2.1 -2.5 -1.1 -1.0 -0.3 0.5 1.4 2.0 2.8 -0.21
-7.63% -9.18% -11.11% -5.38% -4.95% -1.44% 2.81% 8.96% 14.87% 23.89% 1.09%
0 0 0 0 1 1 1 1 1 1
2.8 2.8 2.8 2.9 2.9 2.9 2.9 3.0 3.0 3.0 2.88
573% 601% 676% 783% 502% 446% 500% 481% 458% 413% 543%
(Thousand Metric Tons)
(U.S. Dollars per Metric Ton)
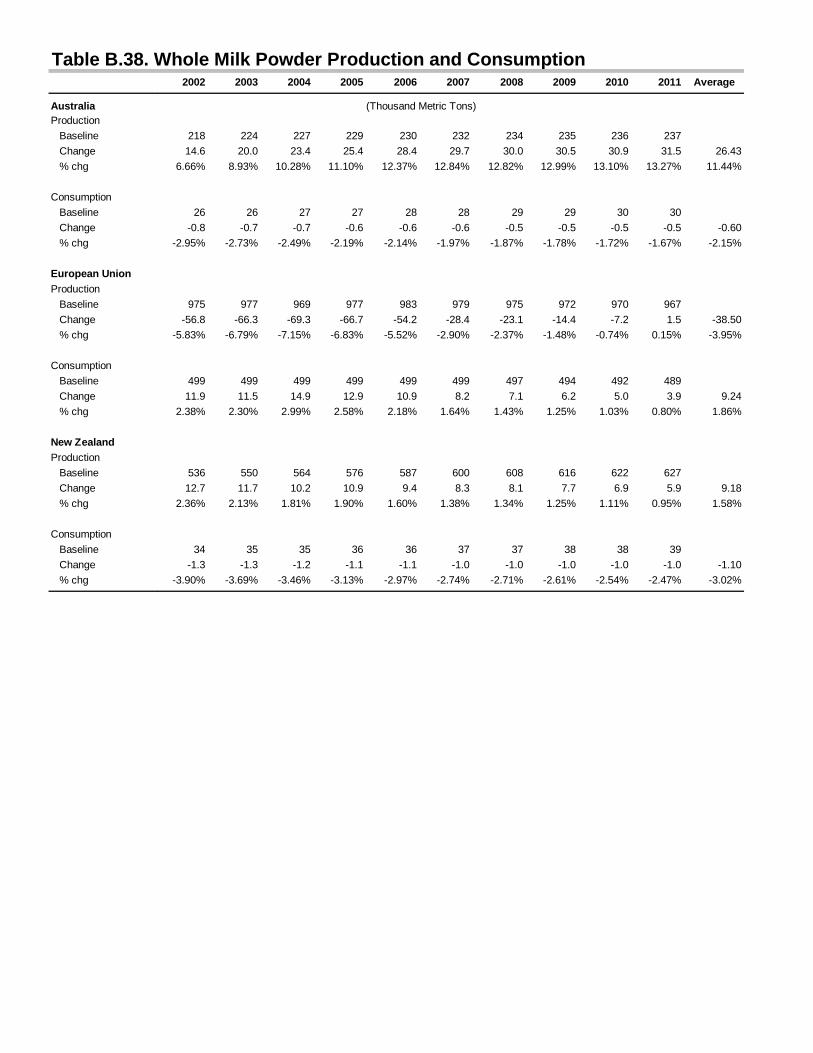
Table B.38. W
AustraliaProduction
Baseline
Change
% chg
Consumption
Baseline
Change
% chg
European UnionProduction
Baseline
Change
% chg
Consumption
Baseline
Change
% chg
New ZealandProduction
Baseline
Change
% chg
Consumption
Baseline
Change
% chg
Whole Milk Powder Production and Consumption2002 2003 2004 2005 2006 2007 2008 2009 2010 2011 Average
218 224 227 229 230 232 234 235 236 237
14.6 20.0 23.4 25.4 28.4 29.7 30.0 30.5 30.9 31.5 26.43
6.66% 8.93% 10.28% 11.10% 12.37% 12.84% 12.82% 12.99% 13.10% 13.27% 11.44%
26 26 27 27 28 28 29 29 30 30
-0.8 -0.7 -0.7 -0.6 -0.6 -0.6 -0.5 -0.5 -0.5 -0.5 -0.60
-2.95% -2.73% -2.49% -2.19% -2.14% -1.97% -1.87% -1.78% -1.72% -1.67% -2.15%
975 977 969 977 983 979 975 972 970 967
-56.8 -66.3 -69.3 -66.7 -54.2 -28.4 -23.1 -14.4 -7.2 1.5 -38.50
-5.83% -6.79% -7.15% -6.83% -5.52% -2.90% -2.37% -1.48% -0.74% 0.15% -3.95%
499 499 499 499 499 499 497 494 492 489
11.9 11.5 14.9 12.9 10.9 8.2 7.1 6.2 5.0 3.9 9.24
2.38% 2.30% 2.99% 2.58% 2.18% 1.64% 1.43% 1.25% 1.03% 0.80% 1.86%
536 550 564 576 587 600 608 616 622 627
12.7 11.7 10.2 10.9 9.4 8.3 8.1 7.7 6.9 5.9 9.18
2.36% 2.13% 1.81% 1.90% 1.60% 1.38% 1.34% 1.25% 1.11% 0.95% 1.58%
34 35 35 36 36 37 37 38 38 39
-1.3 -1.3 -1.2 -1.1 -1.1 -1.0 -1.0 -1.0 -1.0 -1.0 -1.10
-3.90% -3.69% -3.46% -3.13% -2.97% -2.74% -2.71% -2.61% -2.54% -2.47% -3.02%
(Thousand Metric Tons)

Table B.39. B
World Price Baseline
Change
% chg
Total Trade Baseline
Change
% chg
Exports of Selected CoArgentina Baseline
Change
% chg
Australia Baseline
Change
% chg
Brazil Baseline
Change
% chg
Canada Baseline
Change
% chg
European Union * Baseline
Change
% chg
New Zealand Baseline
Change
% chg
United States Baseline
Change
% chg
Imports of Selected CoJapan Baseline
Change
% chg
Mexico Baseline
Change
% chg
Philippines Baseline
Change
% chg
South Korea Baseline
Change
% chg
* Includes meat and mea
Beef Price and Trade2002 2003 2004 2005 2006 2007 2008 2009 2010 2011 Average
1,641 1,684 1,730 1,681 1,613 1,545 1,506 1,481 1,507 1,543
175.3 173.3 130.3 57.1 -2.6 -31.5 -29.3 -4.1 25.4 55.8 54.96
10.68% 10.29% 7.53% 3.40% -0.16% -2.04% -1.94% -0.28% 1.68% 3.62% 3.28%
2,906 3,218 3,484 3,726 3,990 4,123 4,171 4,233 4,171 4,158
298 454 479 462 403 362 331 329 358 401 387.58
10.24% 14.10% 13.75% 12.41% 10.11% 8.77% 7.94% 7.77% 8.58% 9.63% 10.33%
Countries
194 280 330 322 323 326 347 362 408 438
136.7 72.3 46.3 44.6 71.5 106.9 142.8 169.1 176.8 172.8 114.00
70.60% 25.82% 14.03% 13.85% 22.18% 32.73% 41.13% 46.77% 43.38% 39.41% 34.99%
1,370 1,421 1,478 1,484 1,539 1,526 1,478 1,450 1,433 1,404
74.0 20.2 28.6 73.5 122.0 155.9 168.2 173.2 171.0 162.8 114.94
5.40% 1.42% 1.93% 4.95% 7.93% 10.21% 11.38% 11.94% 11.94% 11.59% 7.87%
510 575 607 752 825 841 839 820 838 854
121.6 112.4 94.3 56.2 15.3 -16.9 -22.4 -2.5 23.4 51.9 43.34
23.85% 19.56% 15.53% 7.48% 1.86% -2.01% -2.67% -0.30% 2.79% 6.07% 7.22%
250 274 310 332 376 411 451 478 499 504
55.2 34.0 20.3 30.1 49.2 61.6 64.7 57.5 43.2 28.3 44.41
22.11% 12.41% 6.56% 9.07% 13.11% 14.98% 14.36% 12.02% 8.65% 5.60% 11.89%
369 370 420 418 413 411 410 409 410 411
-220.3 -163.4 -136.1 -128.8 -218.0 -254.5 -280.5 -290.8 -281.4 -267.0 -224.08
-60% -44% -32% -31% -53% -62% -68% -71% -69% -65% -55%
538 570 600 591 584 570 568 570 593 612
59.9 31.5 20.3 12.3 8.5 7.6 13.7 25.6 34.8 41.1 25.53
11.13% 5.54% 3.39% 2.07% 1.45% 1.33% 2.42% 4.48% 5.87% 6.72% 4.44%
-497 -495 -507 -348 -151 30 127 239 67 -3
419.4 552.2 541.6 582.3 606.6 588.7 548.1 503.7 477.5 474.9 529.48
-84% -112% -107% -167% -401% 1961% 433% 211% 713% -14896% -1245%
Countries
912 919 930 961 997 1,031 1,059 1,082 1,096 1,104
198.2 194.6 211.7 229.9 237.7 230.4 214.7 195.0 182.3 172.9 206.73
21.73% 21.18% 22.77% 23.92% 23.84% 22.35% 20.28% 18.02% 16.63% 15.66% 20.64%
473 593 645 693 742 681 595 546 511 539
-119.9 76.2 96.3 23.5 -88.6 -173.9 -209.7 -194.3 -143.1 -86.9 -82.04
-25.33% 12.85% 14.93% 3.39% -11.94% -25.53% -35.22% -35.55% -28.00% -16.13% -14.65%
90 99 102 113 125 136 143 148 144 138
74.2 57.3 59.3 77.2 96.0 112.1 118.9 118.1 112.0 105.9 93.12
82.50% 57.65% 58.39% 68.42% 77.08% 82.53% 83.17% 79.56% 77.99% 76.52% 74.38%
232 250 265 284 303 321 336 349 356 361
45.3 47.4 49.6 54.0 58.5 63.5 67.4 70.2 72.0 73.6 60.16
19.50% 19.02% 18.71% 19.03% 19.32% 19.79% 20.07% 20.13% 20.22% 20.39% 19.62%
at equivalent of live cattle trade.
(U.S. Dollars per Metric Ton)
(Thousand Metric Tons)

Table B.40. B
ArgentinaProduction
Baseline
Change
% chg
Consumption
Baseline
Change
% chg
AustraliaProduction
Baseline
Change
% chg
Consumption
Baseline
Change
% chg
BrazilProduction
Baseline
Change
% chg
Consumption
Baseline
Change
% chg
China - MainlandProduction
Baseline
Change
% chg
Consumption
Baseline
Change
% chg
European Union *Production
Baseline
Change
% chg
Consumption
Baseline
Change
% chg
MexicoProduction
Baseline
Change
% chg
Consumption
Baseline
Change
% chg
* Includes meat and mea
Beef Production and Consumption2002 2003 2004 2005 2006 2007 2008 2009 2010 2011 Average
2,902 2,946 3,010 3,045 3,096 3,152 3,221 3,280 3,356 3,416
91.8 33.6 18.2 31.1 70.9 114.2 150.5 170.8 170.7 158.8 101.07
3.2% 1.1% 0.6% 1.0% 2.3% 3.6% 4.7% 5.2% 5.1% 4.6% 3.15%
2,709 2,665 2,680 2,723 2,773 2,826 2,873 2,918 2,949 2,977
-44.9 -38.7 -28.1 -13.5 -0.7 7.3 7.7 1.7 -6.2 -14.0 -12.93
-1.7% -1.5% -1.0% -0.5% 0.0% 0.3% 0.3% 0.1% -0.2% -0.5% -0.48%
2,038 2,099 2,165 2,188 2,255 2,260 2,233 2,221 2,208 2,179
64.0 9.9 21.0 70.7 124.8 162.8 175.9 177.4 170.4 158.0 113.49
3.1% 0.5% 1.0% 3.2% 5.5% 7.2% 7.9% 8.0% 7.7% 7.3% 5.14%
668 678 687 704 716 733 755 770 775 775
-9.6 -10.3 -7.6 -3.0 2.6 6.7 7.7 4.2 -0.5 -4.6 -1.43
-1.4% -1.5% -1.1% -0.4% 0.4% 0.9% 1.0% 0.6% -0.1% -0.6% -0.23%
6,883 7,089 7,220 7,520 7,767 7,966 8,134 8,278 8,417 8,545
73.0 67.8 75.6 77.1 72.3 64.6 60.4 62.2 63.5 67.5 68.40
1.1% 1.0% 1.0% 1.0% 0.9% 0.8% 0.7% 0.8% 0.8% 0.8% 0.89%
6,373 6,515 6,613 6,768 6,942 7,125 7,296 7,458 7,578 7,691
-48.5 -44.6 -18.7 20.8 57.0 81.5 82.8 64.7 40.1 15.6 25.07
-0.8% -0.7% -0.3% 0.3% 0.8% 1.1% 1.1% 0.9% 0.5% 0.2% 0.33%
5,847 6,103 6,374 6,650 6,963 7,276 7,613 8,000 8,432 8,899
-150.8 -71.3 -59.1 -106.9 -129.6 -137.1 -138.9 -139.5 -141.3 -139.8 -121.43
-2.6% -1.2% -0.9% -1.6% -1.9% -1.9% -1.8% -1.7% -1.7% -1.6% -1.68%
5,819 6,071 6,348 6,642 6,979 7,322 7,693 8,115 8,574 9,067
159.1 105.7 49.7 58.3 59.4 56.8 50.6 43.4 37.3 31.4 65.17
2.7% 1.7% 0.8% 0.9% 0.9% 0.8% 0.7% 0.5% 0.4% 0.3% 0.97%
7,271 7,492 7,438 7,397 7,377 7,322 7,281 7,254 7,231 7,205
-139.9 -97.7 -72.1 -49.5 -39.3 -25.6 -33.5 -50.2 -70.6 -89.1 -66.75
-1.9% -1.3% -1.0% -0.7% -0.5% -0.3% -0.5% -0.7% -1.0% -1.2% -0.91%
6,827 7,099 7,340 7,258 7,014 6,961 6,921 6,895 6,870 6,844
37.6 16.8 11.8 21.2 128.7 179.1 197.3 190.9 160.9 127.9 107.23
0.6% 0.2% 0.2% 0.3% 1.8% 2.6% 2.9% 2.8% 2.3% 1.9% 1.55%
1,887 1,776 1,756 1,773 1,797 1,917 2,057 2,154 2,227 2,234
57.6 -111.2 -117.3 -22.9 109.5 209.1 247.3 223.9 159.6 89.4 84.50
3% -6% -7% -1% 6% 11% 12% 10% 7% 4% 3.94%
2,360 2,369 2,401 2,467 2,539 2,598 2,653 2,701 2,738 2,773
-62.3 -35.1 -21.1 0.6 20.9 35.2 37.6 29.6 16.5 2.5 2.46
-3% -1% -1% 0% 1% 1% 1% 1% 1% 0% 0.04%
eat equivalent of live cattle trade.
(Thousand Metric Tons)

Table B.41. P
World Price Baseline
Change
% chg
Total Trade Baseline
Change
% chg
Exports of Selected CoBrazil Baseline
Change
% chg
Canada Baseline
Change
% chg
European Union Baseline
Change
% chg
Poland Baseline
Change
% chg
United States Baseline
Change
% chg
Imports of Selected CoChina - Mainland Baseline
Change
% chg
Japan Baseline
Change
% chg
Mexico Baseline
Change
% chg
Philippines Baseline
Change
% chg
South Korea Baseline
Change
% chg
Taiwan Baseline
Change
% chg
Pork Price and Trade2002 2003 2004 2005 2006 2007 2008 2009 2010 2011 Average
984 892 950 987 1,012 957 915 879 929 997
119.6 119.1 112.3 96.5 81.1 83.1 94.1 108.1 111.0 108.1 103.31
12.16% 13.34% 11.83% 9.78% 8.02% 8.68% 10.29% 12.29% 11.95% 10.84% 10.92%
2,551 2,735 2,831 2,949 3,038 3,139 3,273 3,414 3,537 3,644
511.8 466.4 690 880 1,057 1,079 1,062 1,022 1,125 1,301.2 919.41
20.06% 17.05% 24.37% 29.84% 34.78% 34.37% 32.45% 29.93% 31.81% 35.71% 29.04%
Countries
284 331 367 380 410 434 460 486 488 487
149.5 160.7 200.7 233.2 252.8 282.3 312.9 343.6 357.9 365.8 265.95
52.58% 48.59% 54.71% 61.37% 61.69% 65.04% 67.98% 70.70% 73.29% 75.15% 63.11%
649 612 658 714 796 817 825 817 872 966
177.4 199.7 243.1 279.0 309.1 343.3 381.0 423.5 443.8 461.0 326.08
27.33% 32.62% 36.92% 39.07% 38.83% 42.05% 46.18% 51.80% 50.88% 47.74% 41.34%
1,230 1,329 1,298 1,295 1,229 1,231 1,270 1,340 1,385 1,412
205.3 -118.6 -66.3 -24.2 62.7 -53.3 -214.3 -409.5 -362.4 -207.8 -118.84
16.68% -8.93% -5.10% -1.87% 5.10% -4.33% -16.87% -30.57% -26.16% -14.72% -8.68%
50 76 105 146 181 216 247 277 284 286
-71.8 -69.7 -92.3 -114.8 -130.8 -119.9 -102.8 -84.4 -93.2 -111.9 -99.16
-143% -91.96% -87.96% -78.43% -72.20% -55.58% -41.59% -30.51% -32.78% -39.15% -67.28%
228 260 268 275 278 295 327 351 376 376
153.1 341.2 461.6 565.8 623.3 677.0 722.7 772.0 804.0 831.3 595.20
67% 131% 172% 205% 225% 229% 221% 220% 214% 221% 191%
Countries
79 87 127 144 159 178 198 209 219 229
104.5 146.6 269.4 359.3 445.8 434.7 399.2 348.8 394.7 496.3 339.93
132% 169% 211% 250% 281% 245% 202% 167% 181% 217% 205%
945 1,001 1,019 1,041 1,059 1,099 1,140 1,181 1,201 1,210
185.7 166.3 180.4 193.9 218.5 273.3 336.9 402.8 438.6 455.1 285.16
19.65% 16.62% 17.71% 18.63% 20.63% 24.86% 29.56% 34.10% 36.53% 37.61% 25.59%
274 331 357 372 376 394 433 485 514 519
46.6 -15.3 -28.7 -46.8 -60.2 -71.1 -79.0 -85.1 -86.1 -84.9 -51.06
17.04% -4.62% -8.02% -12.56% -16.02% -18.07% -18.23% -17.54% -16.75% -16.35% -11.11%
32 37 35 47 51 59 67 76 94 116
-1.9 -2.5 16.8 28.5 37.5 34.4 31.0 26.6 32.2 40.8 24.35
-5.92% -6.67% 47.77% 60.55% 73.47% 58.41% 46.48% 35.18% 34.30% 35.25% 37.88%
66 96 97 96 92 97 101 105 102 99
38.2 35.4 51.6 70.9 89.3 92.7 89.2 81.2 83.5 91.7 72.36
57.89% 36.87% 52.90% 74.15% 96.60% 95.78% 88.11% 77.13% 81.67% 92.12% 75.32%
44 60 68 78 81 90 100 109 111 110
4.1 12.2 20.3 30.8 39.2 43.1 43.8 41.9 41.7 42.5 31.96
9.29% 20.34% 29.91% 39.47% 48.64% 47.77% 44.06% 38.34% 37.48% 38.66% 35.40%
(Thousand Metric Tons)
(U.S. Dollars per Metric Ton)

Table B.42. P
BrazilProduction
Baseline
Change
% chg
Consumption
Baseline
Change
% chg
CanadaProduction
Baseline
Change
% chg
Consumption
Baseline
Change
% chg
European UnionProduction
Baseline
Change
% chg
Consumption
Baseline
Change
% chg
China - MainlandProduction
Baseline
Change
% chg
Consumption
Baseline
Change
% chg
JapanProduction
Baseline
Change
% chg
Consumption
Baseline
Change
% chg
Pork Production and Consumption2002 2003 2004 2005 2006 2007 2008 2009 2010 2011 Average
2,235 2,337 2,425 2,488 2,561 2,630 2,707 2,786 2,857 2,929
129.7 141.2 178.7 207.1 224.0 246.1 269.9 297.1 314.3 328.4 233.64
5.8% 6.0% 7.4% 8.3% 8.7% 9.4% 10.0% 10.7% 11.0% 11.2% 8.85%
1,951 2,006 2,058 2,108 2,151 2,196 2,246 2,300 2,369 2,442
-19.8 -19.5 -22.1 -26.1 -28.8 -36.2 -43.1 -46.5 -43.6 -37.4 -32.31
-1.0% -1.0% -1.1% -1.2% -1.3% -1.6% -1.9% -2.0% -1.8% -1.5% -1.46%
1,762 1,783 1,837 1,900 1,987 2,041 2,082 2,106 2,163 2,254
116.7 124.5 170.8 210.6 245.5 270.2 295.7 324.6 349.2 375.0 248.27
6.6% 7.0% 9.3% 11.1% 12.4% 13.2% 14.2% 15.4% 16.1% 16.6% 12.20%
1,113 1,171 1,178 1,186 1,191 1,224 1,256 1,289 1,291 1,288
-60.7 -75.2 -72.3 -68.4 -63.6 -73.2 -85.3 -98.8 -94.6 -86.0 -77.81
-5.5% -6.4% -6.1% -5.8% -5.3% -6.0% -6.8% -7.7% -7.3% -6.7% -6.36%
17,804 17,964 18,009 18,060 18,121 18,196 18,294 18,414 18,533 18,635
20.1 -13.8 -79.8 -126.6 -135.2 -161.0 -232.0 -337.9 -410.5 -404.2 -188.09
0.1% -0.1% -0.4% -0.7% -0.7% -0.9% -1.3% -1.8% -2.2% -2.2% -1.02%
16,569 16,635 16,709 16,765 16,892 16,965 17,024 17,074 17,148 17,223
-183.7 100.3 -12.8 -101.5 -197.8 -109.8 -19.4 70.3 -46.1 -194.0 -69.44
-1.1% 0.6% -0.1% -0.6% -1.2% -0.6% -0.1% 0.4% -0.3% -1.1% -0.41%
29,880 30,550 31,189 31,897 32,696 33,512 34,309 35,088 35,838 36,556
-192.2 -266.3 -338.0 -400.5 -457.2 -474.9 -463.9 -432.7 -424.9 -444.2 -389.48
-0.6% -0.9% -1.1% -1.3% -1.4% -1% -1.4% -1.2% -1.2% -1% -1.17%
29,959 30,636 31,316 32,040 32,854 33,690 34,506 35,297 36,057 36,785
-87.7 -119.7 -68.5 -41.3 -11.5 -40.1 -64.7 -84.0 -30.2 52.2 -49.55
-0.3% -0.4% -0.2% -0.1% 0.0% 0% -0.2% -0.2% -0.1% 0% -0.16%
1,248 1,228 1,221 1,216 1,217 1,214 1,207 1,198 1,198 1,204
-100.5 -99.7 -123.4 -140.6 -153.2 -165.9 -176.5 -186.2 -192.5 -197.0 -153.55
-8.1% -8.1% -10.1% -11.6% -12.6% -13.7% -14.6% -15.5% -16.1% -16.4% -12.67%
2,193 2,228 2,240 2,256 2,277 2,312 2,346 2,379 2,398 2,414
77.7 65.9 56.6 52.9 64.8 106.4 159.5 215.8 245.9 258.2 130.39
3.5% 3.0% 2.5% 2.3% 2.8% 4.6% 6.8% 9.1% 10.3% 10.7% 5.56%
(Thousand Metric Tons)

Table B.43. B
World Price Baseline
Change
% chg
Total Trade Baseline
Change
% chg
Exports of Selected CoBrazil Baseline
Change
% chg
European Union Baseline
Change
% chg
Thailand Baseline
Change
% chg
United States Baseline
Change
% chg
Imports of Selected CoCanada Baseline
Change
% chg
China - Mainland Baseline
Change
% chg
Japan Baseline
Change
% chg
Mexico Baseline
Change
% chg
Philippines Baseline
Change
% chg
Saudi Arabia Baseline
Change
% chg
South Korea Baseline
Change
% chg
Broiler Price and Trade2002 2003 2004 2005 2006 2007 2008 2009 2010 2011 Average
1,306 1,315 1,323 1,325 1,320 1,317 1,330 1,339 1,353 1,365
111.7 116.7 114.4 106.3 96.2 94.4 96.0 101.0 105.0 109.3 105.10
8.55% 8.88% 8.65% 8.03% 7.29% 7.16% 7.22% 7.54% 7.76% 8.01% 7.91%
5,165 5,435 5,683 5,929 6,176 6,419 6,614 6,797 6,991 7,220
975 1,174 1,141 1,150 1,150 1,161 1,191 1,226 1,253 1,270.2 1,169.04
18.87% 21.60% 20.08% 19.39% 18.61% 18.09% 18.00% 18.04% 17.93% 17.59% 18.82%
Countries
1,300 1,524 1,683 1,842 1,951 2,045 2,186 2,297 2,393 2,464
442.2 488.7 488.6 472.8 452.7 449.2 441.6 439 437.1 439.0 455.11
34.01% 32.07% 29.04% 25.67% 23.20% 21.97% 20.20% 19.12% 18.27% 17.81% 24.14%
552 559 556 564 570 577 587 596 606 615
38.0 10.5 -185.2 -261.1 -318.9 -360.0 -377.8 -393.8 -427.9 -469.6 -274.59
6.88% 1.88% -33.33% -46.26% -55.92% -62.35% -64.35% -66.03% -70.61% -76.42% -46.65%
409 416 419 429 430 428 419 413 402 399
140.8 148.4 157.4 165.2 172.4 179.3 187.7 196.7 206.0 213.7 176.76
34.44% 35.65% 37.57% 38.48% 40.11% 41.91% 44.77% 47.68% 51.30% 53.57% 42.55%
2,869 2,919 3,029 3,098 3,226 3,371 3,423 3,489 3,583 3,731
381.8 555.4 707.8 801.2 871.0 920.0 968.0 1,015.2 1,071.1 1,121.9 841.34
13.31% 19.03% 23.37% 25.86% 27.00% 27.29% 28.28% 29.10% 29.90% 30.07% 25.32%
Countries
10 11 14 16 17 19 20 21 22 25
108.2 145.3 170.3 191.7 204.1 220.8 234.7 248.9 261.2 273.4 205.87
1082% 1292% 1216% 1176% 1201% 1184% 1201% 1192% 1178% 1105% 1183%
505 512 569 640 727 838 951 1,041 1,106 1,172
356.5 387.6 318.4 298.5 285.7 281.3 282.3 283.2 277.9 270.5 304.19
70.64% 75.72% 55.92% 46.63% 39.30% 33.57% 29.67% 27.19% 25.13% 23.08% 42.69%
680 699 716 733 753 772 787 803 818 833
-81.5 -88.8 -96.4 -98.2 -96.9 -95.1 -92.4 -90.2 -88.2 -86.3 -91.39
-11.98% -12.71% -13.46% -13.39% -12.88% -12.31% -11.73% -11.23% -10.78% -10.36% -12.08%
245 262 296 323 350 345 338 327 337 352
-50.7 -47.6 -63.4 -74.7 -82.4 -86.1 -85.3 -82.5 -84.0 -87.7 -74.44
-20.68% -18.20% -21.44% -23.14% -23.54% -24.97% -25.26% -25.20% -24.93% -24.92% -23.23%
11 19 23 26 34 45 53 62 73 86
98.9 123.9 131.9 131.0 128.8 126.9 127.3 129.1 130.3 130.7 125.88
936% 638% 571% 512% 383% 284% 241% 207% 178% 152% 410%
386 406 432 453 477 502 525 549 574 600
77.4 83.1 89.6 94.3 97.1 92.3 88.7 86.6 95.0 105.3 90.93
20.04% 20.44% 20.73% 20.81% 20.38% 18.37% 16.88% 15.79% 16.56% 17.54% 18.75%
82 91 97 102 107 111 114 117 120 123
34.4 47.2 50.9 53.6 56.2 58.9 62.2 64.6 65.1 64.5 55.77
41.74% 51.92% 52.22% 52.49% 52.72% 52.97% 54.45% 55.20% 54.31% 52.35% 52.04%
(U.S. Dollars per Metric Ton)
(Thousand Metric Tons)

Table B.44. B
BrazilProduction
Baseline
Change
% chg
Consumption
Baseline
Change
% chg
European UnionProduction
Baseline
Change
% chg
Consumption
Baseline
Change
% chg
ThailandProduction
Baseline
Change
% chg
Consumption
Baseline
Change
% chg
CanadaProduction
Baseline
Change
% chg
Consumption
Baseline
Change
% chg
China - MainlandProduction
Baseline
Change
% chg
Consumption
Baseline
Change
% chg
Broiler Production and Consumption2002 2003 2004 2005 2006 2007 2008 2009 2010 2011 Average
6,693 7,062 7,370 7,641 7,884 8,119 8,402 8,680 8,965 9,243
385.7 433.1 421.3 388.3 352.7 340.9 340.4 353 363.8 374.5 375.36
6% 6% 6% 5% 4% 4% 4% 4% 4% 4% 4.76%
5,397 5,539 5,688 5,800 5,933 6,074 6,216 6,383 6,573 6,779
-55.0 -55.6 -67.4 -84.7 -100.2 -108.4 -101.2 -86 -73.3 -64.5 -79.65
-1% -1% -1% -1% -2% -2% -2% -1% -1% -1% -1.32%
6,815 6,923 6,988 7,065 7,161 7,226 7,292 7,360 7,426 7,484
0.8 -33.6 -173.6 -241.0 -318.2 -382.8 -417.8 -439.8 -453.4 -467.2 -292.66
0% 0% -2% -3% -4% -5% -6% -6% -6% -6% -4.02%
6,262 6,363 6,432 6,500 6,591 6,648 6,705 6,764 6,820 6,869
-37.2 -44.4 10.6 19.7 0.3 -23.0 -40.1 -46.0 -25.5 2.4 -18.31
-1% -1% 0% 0% 0% 0% -1% -1% 0% 0% -0.28%
1,264 1,296 1,327 1,356 1,378 1,395 1,407 1,423 1,444 1,479
52.3 61.3 64.9 62.3 58.3 57.0 58.1 62.3 67.1 72.2 61.58
4% 5% 5% 5% 4% 4% 4% 4% 5% 5% 4.47%
855 880 908 927 948 968 988 1,011 1,043 1,080
-88.4 -87.1 -92.5 -102.9 -114.2 -122.3 -129.6 -134.4 -138.9 -141.5 -115.18
-10% -10% -10% -11% -12% -13% -13% -13% -13% -13% -11.91%
924 928 945 956 973 976 983 992 1,013 1,036
-60.2 -90.1 -110.3 -128.3 -140.0 -152.7 -162.9 -172.3 -180.8 -189.5 -138.71
-7% -10% -12% -13% -14% -16% -17% -17% -18% -18% -14.14%
934 939 959 972 990 994 1,003 1,012 1,035 1,061
48.0 55.2 60.0 63.4 64.1 68.0 71.8 76.7 80.4 83.9 67.16
5% 6% 6% 7% 6% 7% 7% 8% 8% 8% 6.75%
4,687 4,774 4,852 4,951 5,075 5,188 5,293 5,403 5,512 5,612
-266.7 -295.5 -264.9 -262.8 -264.4 -259.7 -251.9 -244.7 -240.1 -236.1 -258.67
-6% -6% -5% -5% -5% -5% -5% -5% -4% -4% -5.07%
5,192 5,286 5,422 5,591 5,802 6,026 6,244 6,444 6,618 6,784
-355.1 -387.4 -341.5 -330.2 -321.9 -302.8 -279.5 -263.3 -255.1 -247.3 -308.40
-7% -7% -6% -6% -6% -5% -4% -4% -4% -4% -5.30%
(Thousand Metric Tons)