13a · the national investor private joint stock company chairman’s report and consolidated...
TRANSCRIPT


TNI ANNUAL REPORT 2014/2015 1
HH SHEIKHMOHAMMED BIN RASHID AL MAKTOUMVice President of the United Arab Emirates, Prime Minister and Ruler of Dubai
HH SHEIKHKHALIFA BIN ZAYED AL NAHYANPresident of the United Arab Emiratesand Ruler of Abu Dhabi
HH GENERAL SHEIKHMOHAMED BIN ZAYED AL NAHYANCrown Prince of Abu Dhabi and Deputy Supreme Commander of the UAE Armed Forces
HH SHEIKHZAYED BIN SULTAN AL NAHYANLate President of the United Arab Emirates

MINARET OF SHEIKH ZAYED MOSQUE
There are four minarets on the four corners of the courtyard which rise about 107 m (351 ft) in height. The courtyard, with its floral design, measures about 17,000 m2 (180,000 sq ft),and is considered to be the largest example of marble mosaic in the world.

TNI ANNUAL REPORT 2014/2015 3
BOARD MEMBERS2014/15
Abdullah M. Mazrui Chairman
Mohammed Abdulla Alqubaisi Vice Chairman
Yusuf Sami Alami Board Member
Fatima Obeid Al Jaber Board Member
Mohamad Mohamad Fadhel Al Hamli
Board Member
Saeed Al Masoud Board Member
Mohamad Rashid Al Naseri Board Member
Abubaker Seddiq AlkhooriBoard Member

GUGGENHEIM
The museum will be located on Saadiyat Island, just offshore of the city of Abu Dhabi. The island's Cultural District will house the largest cluster of world-class cultural assets in Abu Dhabi.
7chairman’s report
12consolidated statement of financial position
9independent auditors’ report
10consolidated income statement
11consolidated statement of comprehensive income
14consolidated statement of changes in equity
16consolidated statement of cash flows
18notes to the consolidated financial statements
FINANCIAL STATEMENTSthe national investor private joint stock company chairman’s report and consolidated financial statements 31 march 2015
C O N T E N T

FERRARI WORLD
Ferrari World Abu Dhabi is an amusement park located on Yas Island in Abu Dhabi. It claims to be the largest indoor theme park in the world. Formula Rossa, the world's fastest roller coaster, is located here.

TNI ANNUAL REPORT 2014/2015 7
asset management business. Investors and unit-holders re-examined their strategies and pulled out of regional markets. As a consequence, Asset Management’s performance did not have any positive contribution to this year’s bottom line.
We recorded full year revenues of AED 133.6 million while net income reached AED 15.7 million. Diligent control of costs has remained a top priority at TNI throughout the last 3 years and will continue to do so going forward. TNI’s consolidated assets stood at AED 874 million, while total consolidated liabilities declined by 22% to reach AED 92.8 million. Our shareholders’ equity declined by AED 33 million to reach AED 720 million after the dividends distribution last year.
We have taken decisive steps to emerge stronger from the prevalent market conditions, the Board of Directors and Executive Management team undertook a detailed strategic review process during their annual offsite meeting. This helped us design and embark on a clear new strategy to refocus our efforts on our profitable fee generating businesses and investing in sustainable recurring income streams in order to return to long term, sustainable profitability. We have already started implementation of our strategy and action plan and we expect to make material progress over the course of the next 2 to 3 years.
Needless to say, today we are well capitalized and backed with a liquid balance sheet, allowing us to move quickly and decisively to take advantage of investment opportunities around the region. The capital we deploy today are the seeds for future earnings.
Looking ahead
Looking ahead, we are building on a solid foundation for profitable growth. We remain committed to building shareholder value through quality revenue growth, continued enhancement of operating profitability, investment in our business, and the return of capital to shareholders.
On behalf of the Board of directors, I would like to thank you for your investment in TNI. I am optimistic about our future and confident in our ability to deliver lasting value to our shareholders.
Abdullah M.Mazrui
Chairman of the Board
CHAIRMAN'S REPORT
Dear Fellow Shareholders,
When TNI was founded in 1994, we believed that a business dedicated to the principles of excellence and integrity would distinguish us from our competitors. We were committed to providing advice that was objective and independent.
As we mark our twentieth anniversary, our adherence to these principles has served us well. We have materially expanded our merchant banking business with more focus towards M&A, equity and capital markets as well as capital fundraising. Over the years, we have grown our asset management and private equity business lines, which now manage four flagship funds with around AED 416 million in total Assets under Management.
Much has changed since our founding in 1994, but our principles and priorities remain steadfast.
In this letter, we will highlight some of the important accomplishments of our Fiscal Year 2014’15, and provide our views on the opportunities that lie ahead.
Our Clients
Our approach is to work as a trusted senior advisor to top corporate officers, Board of Directors and owners of businesses, helping them to conceive and to implement strategies for enhancing shareholder value. Our talented team and client-first culture provided us with the opportunity to lead a consortium of prominent Abu Dhabi based investors in the acquisition of a 50% equity stake in National Catering Company Limited (NCC), one of the largest private sector industrial catering and facility management businesses in the UAE.
Our Shareholders
In November 2014, TNI became the first company to have been listed on Abu Dhabi Securities Exchange as a Private Joint Stock Company, PJSC. The Securities and Commodities Authority’s initiative to allow listing of private companies was a significant step towards the development of the UAE capital markets, which is expected to bring further diversity to the ADX exchange.
We have a balanced set of businesses that complement each other through business cycles, coupled with a strong culture and enhanced risk management framework, which we believe has aligned our model with the UAE’s regulatory body requirements.
Our Performance
Low oil prices and geo-political stress dominated headlines in the second half of our fiscal year. During this period, regional equity markets witnessed low volumes and valuations and investors became increasingly hesitant about putting their money at work until market conditions stabilized. Despite these challenges, we are particularly pleased that our Merchant Banking and Principal Investment businesses produced positive contributions to the bottom line. Unsurprisingly, this year was a very challenging one throughout this difficult climate for our

[continued]Guinness World Records certified Capital Gate as the "World’s furthest leaning man-made tower. Capital Gate is thought to be the Middle East's first building to use a diagrid.
CAPITAL GATE

TNI ANNUAL REPORT 2014/2015 9
INDEPENDENT AUDITORS’ REPORTfor the year ended 31 March 2015
REPORT ON THE CONSOLIDATED FINANCIAL STATEMENT
We have audited the accompanying consolidated financial statements of The National Investor Private Joint Stock Company (the “Company”) and its subsidiaries (the “Group”), which comprise the consolidated statement of financial position as at 31 March 2015, and the consolidated income statement, consolidated statement of comprehensive income, consolidated statement of changes in equity and consolidated statement of cash flows for the year then ended, and a summary of significant accounting policies and other explanatory information.
MANAGEMENT’S RESPONSIBILITY FOR THE CONSOLIDATED FINANCIAL STATEMENTS
Management is responsible for the preparation and fair presentation of these consolidated financial statements in accordance with International Financial Reporting Standards and the applicable provisions of the articles of association of the Company and the UAE Commercial Companies Law of 1984 (as amended), and for such internal control as management determines is necessary to enable the preparation of consolidated financial statements that are free from material misstatement, whether due to fraud or error.
AUDITOR’S RESPONSIBILITY
Our responsibility is to express an opinion on these consolidated financial statements based on our audit. We conducted our audit in accordance with International Standards on Auditing. Those standards require that we comply with ethical requirements and plan and perform the audit to obtain reasonable assurance about whether the consolidated financial statements are free from material misstatement.
An audit involves performing procedures to obtain audit evidence about the amounts and disclosures in the consolidated financial statements. The procedures selected depend on the auditor’s judgement, including the assessment of the risks of material misstatement of the consolidated financial statements, whether due to fraud or error. In making those risk assessments, the auditor considers internal control relevant to the entity’s preparation and fair presentation of the consolidated financial statements in order to design audit procedures that are appropriate in the circumstances, but not for the purpose of expressing an opinion on the effectiveness of the entity’s internal control. An audit also includes evaluating the appropriateness of accounting policies used and the reasonableness of accounting estimates made by management, as well as evaluating the overall presentation of the consolidated financial statements.
We believe that the audit evidence we have obtained is sufficient and appropriate to provide a basis for our audit opinion.
OPINION
In our opinion, the consolidated financial statements present fairly, in all material respects, the financial position of the Group as of 31 March 2015, and its financial performance and cash flows for the year then ended in accordance with International Financial Reporting Standards.
REPORT ON OTHER LEGAL AND REGULATORY REQUIREMENTS
We also confirm that, in our opinion, the consolidated financial statements include, in all material respects, the applicable requirements of the UAE Commercial Companies Law of 1984 (as amended) and the articles of association of the Company; proper books of account have been kept by the Company; and the contents of the report of the Chairman relating to these consolidated financial statements are consistent with the books of account. We further report that we have obtained all the information and explanations which we required for the purpose of our audit and, to the best of our knowledge and belief, no violations of the UAE Commercial Companies Law of 1984 (as amended) or of the articles of association of the Company have occurred during the year which would have had a material effect on the business of the Company or on its financial position.
Signed by:
Raed AhmadPartner
Ernst & Young
Registration No. 811
19 MAY, 2015
Abu Dhabi

10 TNI ANNUAL REPORT 2014/2015
CONSOLIDATED INCOME STATEMENTfor the year ended 31 March 2015
The attached notes 1 to 26 form part of these consolidated financial statements.
2015 2014
Notes AED’000 AED’000
Fee and service income 3 123,640 95,282
Net (loss) income from investments carried at fair
value through profit and loss 4 (8,039) 43,355
Dividend income from investments carried at fair
value through other comprehensive income 4,576 2,595
Share of profit of associates 12 1,766 29,612
Share of (loss) profit of joint venture 13 (8,826) 2,004
Change in fair value of investment properties 14 13,500 (20,253)
Interest income 5 3,285 4,831
Other operating income 6 3,731 845
TOTAL OPERATING INCOME 133,633 158,271
Operating expenses 7 (110,734) (101,481)
Settlement of legal claims (7,325) -
Reversal of impairment of property, fixtures and equipment 9 21,719 36,692
Amortisation of intangible asset (62) (69)
Depreciation 15 (9,848) (8,427)
Interest expense 8 (3,008) (4,370)
Impairment losses on trade receivables 16 (480) (194)
TOTAL OPERATING EXPENSES (109,738) (77,849)
PROFIT FOR THE YEAR 23,895 80,422
Attributable to:
Equity holders of the parent 15,764 68,709
Non-controlling interests 8,131 11,713
23,895 80,422

TNI ANNUAL REPORT 2014/2015 11
CONSOLIDATED STATEMENT OF COMPREHENSIVE INCOMEfor the year ended 31 March 2015
The attached notes 1 to 26 form part of these consolidated financial statements.
2015 2014
AED’000 AED’000
Profit for the year 23,895 80,422
Other comprehensive (loss) income:
Items that may not be reclassified to profit
or loss in subsequent periods
Net (loss) gain on financial assets measured at fair value through
other comprehensive income (16,393) 30,526
Directors’ remuneration paid (3,613) -
Items that may not be reclassified to profit
or loss in subsequent periods (20,006) 30,526
Items that may be reclassified to profit
or loss in subsequent periods - -
Other comprehensive (loss) income (20,006) 30,526
TOTAL COMPREHENSIVE INCOME 3,889 110,948
Attributable to:
Equity holders of the parent (4,242) 99,235
Non-controlling interests 8,131 11,713
3,889 110,948

12 TNI ANNUAL REPORT 2014/2015
CONSOLIDATED STATEMENT OF FINANCIAL POSITIONAt 31 March 2015
The attached notes 1 to 26 form part of these consolidated financial statements.
31 March 31 March
2015 2014
Notes AED’000 AED’000
ASSETS
Bank balances and cash 10 192,423 241,844
Investments carried at fair value through
profit and loss 11 150,248 148,041
Investments carried at fair value through
other comprehensive income 11 115,615 100,184
Amounts due from related parties 23 635 4,457
Investment in associates 12 67,394 88,342
Investment in joint venture 13 5,550 16,804
Investment properties 14 90,000 76,500
Intangible assets 1,068 1,130
Property, fixtures and equipment 15 210,592 195,072
Other assets 16 40,815 31,520
TOTAL ASSETS 874,340 903,894
LIABILITIES
Term loans 17 62,407 74,309
Amounts due to related parties 23 1,017 1,248
Other liabilities 18 29,443 43,106
TOTAL LIABILITIES 92,867 118,663

TNI ANNUAL REPORT 2014/2015 13
CONSOLIDATED STATEMENT OF FINANCIAL POSITIONfor the year ended 31 March 2015 [continued]
The attached notes 1 to 26 form part of these consolidated financial statements.
31 March 31 March
2015 2014
Notes AED’000 AED’000
EQUITY
Share capital 19 577,500 577,500
Legal reserve 20 58,096 56,520
Statutory reserve 21 49,673 48,097
Cumulative changes in fair value 1,302 17,695
Proposed dividends - 28,875
Proposed Board of Directors’ remuneration - 3,413
Retained earnings 33,607 21,195
Equity attributable to equity holders of the parent Company 720,178 753,295
Non-controlling interests 61,295 31,936
TOTAL EQUITY 781,473 785,231
TOTAL LIABILITIES AND EQUITY 874,340 903,894
Commitments and contingent liabilities 22 108,692 147,444
Mr. Abdullah Mazrui Mr. Yasser Geissah
CHAIRMAN CHIEF EXECUTIVE OFFICER
14 TNI ANNUAL REPORT 2014/2015
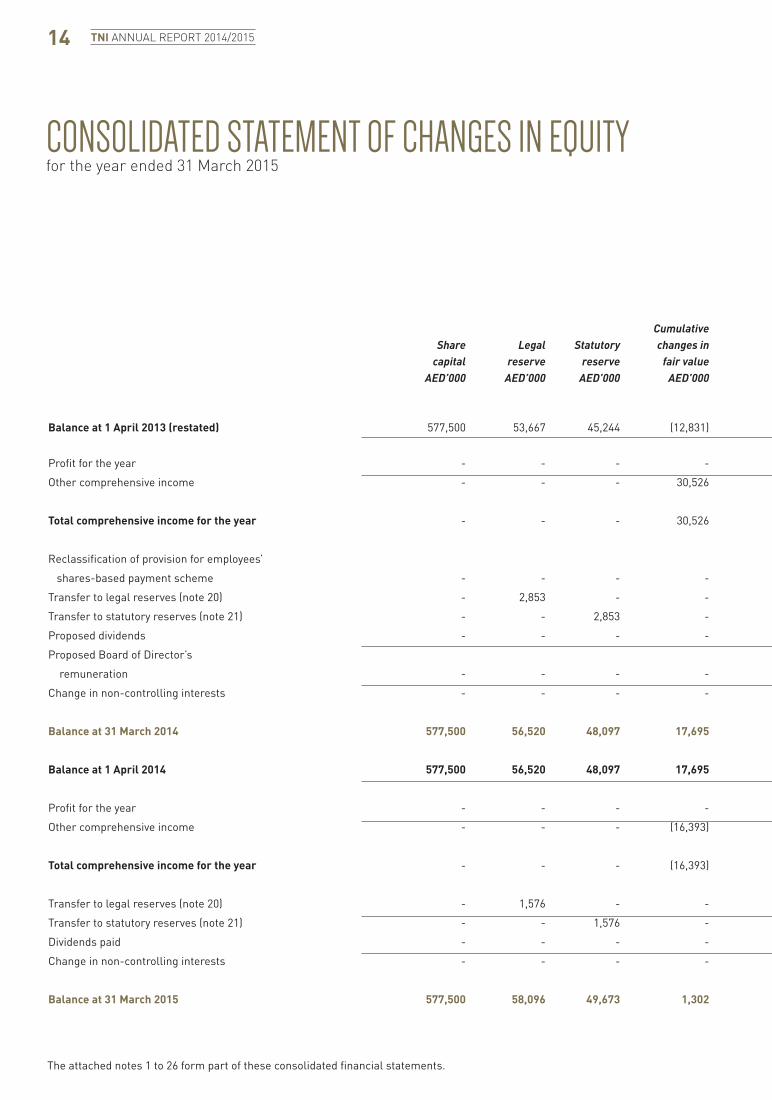
CONSOLIDATED STATEMENT OF CHANGES IN EQUITYfor the year ended 31 March 2015
The attached notes 1 to 26 form part of these consolidated financial statements.
Employees’ Retained Proposed Attributable Cumulative share - based earnings Board of to equity Non- Share Legal Statutory changes in payment (accumulated Proposed Directors’ holders of controlling capital reserve reserve fair value scheme losses) dividends remuneration parent interests Total AED’000 AED’000 AED’000 AED’000 AED’000 AED’000 AED’000 AED’000 AED’000 AED’000 AED’000
Balance at 1 April 2013 (restated) 577,500 53,667 45,244 (12,831) 4,528 (14,048) - - 654,060 6,194 660,254
Profit for the year - - - - - 68,709 - - 68,709 11,713 80,422
Other comprehensive income - - - 30,526 - - - - 30,526 - 30,526
Total comprehensive income for the year - - - 30,526 - 68,709 - - 99,235 11,713 110,948
Reclassification of provision for employees’
shares-based payment scheme - - - - (4,528) 4,528 - - - - -
Transfer to legal reserves (note 20) - 2,853 - - - (2,853) - - - - -
Transfer to statutory reserves (note 21) - - 2,853 - - (2,853) - - - - -
Proposed dividends - - - - - (28,875) 28,875 - - - -
Proposed Board of Director’s
remuneration - - - - - (3,413) - 3,413 - - -
Change in non-controlling interests - - - - - - - - - 14,029 14,029
Balance at 31 March 2014 577,500 56,520 48,097 17,695 - 21,195 28,875 3,413 753,295 31,936 785,231
Balance at 1 April 2014 577,500 56,520 48,097 17,695 - 21,195 28,875 3,413 753,295 31,936 785,231
Profit for the year - - - - - 15,764 - - 15,764 8,131 23,895
Other comprehensive income - - - (16,393) - (200) - (3,413) (20,006) - (20,006)
Total comprehensive income for the year - - - (16,393) - 15,564 - (3,413) (4,242) 8,131 3,889
Transfer to legal reserves (note 20) - 1,576 - - - (1,576) - - - - -
Transfer to statutory reserves (note 21) - - 1,576 - - (1,576) - - - - -
Dividends paid - - - - - - (28,875) - (28,875) - (28,875)
Change in non-controlling interests - - - - - - - - - 21,228 21,228
Balance at 31 March 2015 577,500 58,096 49,673 1,302 - 33,607 - - 720,178 61,295 781,473

TNI ANNUAL REPORT 2014/2015 15
[continued]CONSOLIDATED STATEMENT OF CHANGES IN EQUITYfor the year ended 31 March 2015
The attached notes 1 to 26 form part of these consolidated financial statements.
Employees’ Retained Proposed Attributable Cumulative share - based earnings Board of to equity Non- Share Legal Statutory changes in payment (accumulated Proposed Directors’ holders of controlling capital reserve reserve fair value scheme losses) dividends remuneration parent interests Total AED’000 AED’000 AED’000 AED’000 AED’000 AED’000 AED’000 AED’000 AED’000 AED’000 AED’000
Balance at 1 April 2013 (restated) 577,500 53,667 45,244 (12,831) 4,528 (14,048) - - 654,060 6,194 660,254
Profit for the year - - - - - 68,709 - - 68,709 11,713 80,422
Other comprehensive income - - - 30,526 - - - - 30,526 - 30,526
Total comprehensive income for the year - - - 30,526 - 68,709 - - 99,235 11,713 110,948
Reclassification of provision for employees’
shares-based payment scheme - - - - (4,528) 4,528 - - - - -
Transfer to legal reserves (note 20) - 2,853 - - - (2,853) - - - - -
Transfer to statutory reserves (note 21) - - 2,853 - - (2,853) - - - - -
Proposed dividends - - - - - (28,875) 28,875 - - - -
Proposed Board of Director’s
remuneration - - - - - (3,413) - 3,413 - - -
Change in non-controlling interests - - - - - - - - - 14,029 14,029
Balance at 31 March 2014 577,500 56,520 48,097 17,695 - 21,195 28,875 3,413 753,295 31,936 785,231
Balance at 1 April 2014 577,500 56,520 48,097 17,695 - 21,195 28,875 3,413 753,295 31,936 785,231
Profit for the year - - - - - 15,764 - - 15,764 8,131 23,895
Other comprehensive income - - - (16,393) - (200) - (3,413) (20,006) - (20,006)
Total comprehensive income for the year - - - (16,393) - 15,564 - (3,413) (4,242) 8,131 3,889
Transfer to legal reserves (note 20) - 1,576 - - - (1,576) - - - - -
Transfer to statutory reserves (note 21) - - 1,576 - - (1,576) - - - - -
Dividends paid - - - - - - (28,875) - (28,875) - (28,875)
Change in non-controlling interests - - - - - - - - - 21,228 21,228
Balance at 31 March 2015 577,500 58,096 49,673 1,302 - 33,607 - - 720,178 61,295 781,473

16 TNI ANNUAL REPORT 2014/2015
CONSOLIDATED STATEMENT OF CASH FLOWSfor the year ended 31 March 2015
The attached notes 1 to 26 form part of these consolidated financial statements.
2015 2014
Notes AED’000 AED’000
OPERATING ACTIVITIES
Profit for the year 23,895 80,422
Adjustments for:
Depreciation 15 9,848 8,427
Amortisation of intangible assets 62 69
Share of profit of associates 12 (1,766) (29,612)
Share of loss (profit) of joint venture 13 8,826 (2,004)
Write off of property, fixtures and equipment - 55
Net loss (income) from investments carried at
fair value through profit and loss 8,039 (43,355)
Reversal of impairment on property,
fixtures and equipment 9 (21,719) (36,692)
Change in fair value of investment properties 14 (13,500) 20,253
Impairment losses on trade receivables 480 194
Interest income 5 (3,285) (4,831)
Interest expense 8 3,008 4,370
Dividend income from investments carried at
fair value through other comprehensive income (4,576) (2,595)
9,312 (5,299)
Working capital adjustments:
Amounts due from related parties 3,822 1,807
Other assets (8,056) 1,607
Amounts due to related parties (231) (5,422)
Other liabilities (13,663) 9,675
Net cash (used in) from operating activities (8,816) 2,368
TNI ANNUAL REPORT 2014/2015 17
2015 2014
Notes AED’000 AED’000
OPERATING ACTIVITIES
Profit for the year 23,895 80,422
Adjustments for:
Depreciation 15 9,848 8,427
Amortisation of intangible assets 62 69
Share of profit of associates 12 (1,766) (29,612)
Share of loss (profit) of joint venture 13 8,826 (2,004)
Write off of property, fixtures and equipment - 55
Net loss (income) from investments carried at
fair value through profit and loss 8,039 (43,355)
Reversal of impairment on property,
fixtures and equipment 9 (21,719) (36,692)
Change in fair value of investment properties 14 (13,500) 20,253
Impairment losses on trade receivables 480 194
Interest income 5 (3,285) (4,831)
Interest expense 8 3,008 4,370
Dividend income from investments carried at
fair value through other comprehensive income (4,576) (2,595)
9,312 (5,299)
Working capital adjustments:
Amounts due from related parties 3,822 1,807
Other assets (8,056) 1,607
Amounts due to related parties (231) (5,422)
Other liabilities (13,663) 9,675
Net cash (used in) from operating activities (8,816) 2,368
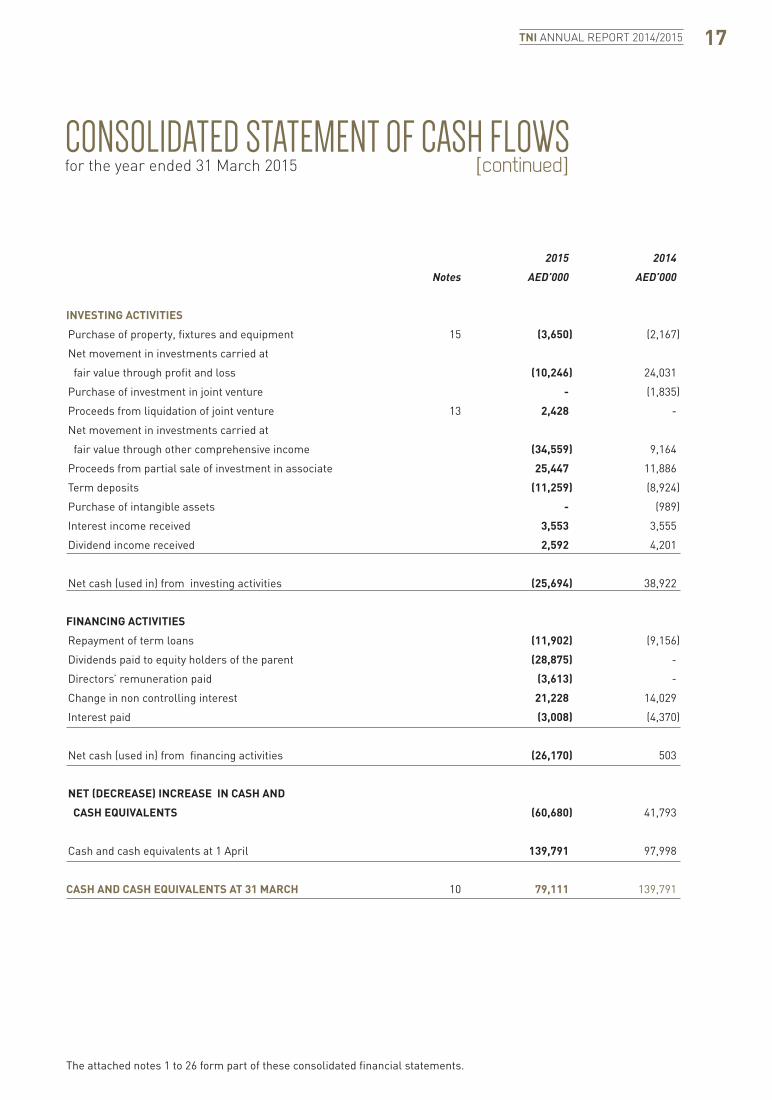
CONSOLIDATED STATEMENT OF CASH FLOWSfor the year ended 31 March 2015 [continued]
The attached notes 1 to 26 form part of these consolidated financial statements.
2015 2014
Notes AED’000 AED’000
INVESTING ACTIVITIES
Purchase of property, fixtures and equipment 15 (3,650) (2,167)
Net movement in investments carried at
fair value through profit and loss (10,246) 24,031
Purchase of investment in joint venture - (1,835)
Proceeds from liquidation of joint venture 13 2,428 -
Net movement in investments carried at
fair value through other comprehensive income (34,559) 9,164
Proceeds from partial sale of investment in associate 25,447 11,886
Term deposits (11,259) (8,924)
Purchase of intangible assets - (989)
Interest income received 3,553 3,555
Dividend income received 2,592 4,201
Net cash (used in) from investing activities (25,694) 38,922
FINANCING ACTIVITIES
Repayment of term loans (11,902) (9,156)
Dividends paid to equity holders of the parent (28,875) -
Directors’ remuneration paid (3,613) -
Change in non controlling interest 21,228 14,029
Interest paid (3,008) (4,370)
Net cash (used in) from financing activities (26,170) 503
NET (DECREASE) INCREASE IN CASH AND
CASH EQUIVALENTS (60,680) 41,793
Cash and cash equivalents at 1 April 139,791 97,998
CASH AND CASH EQUIVALENTS AT 31 MARCH 10 79,111 139,791

18 TNI ANNUAL REPORT 2014/2015
NOTES TO THE CONSOLIDATED FINANCIAL STATEMENTS31 March 2015
1 ACTIVITIESThe National Investor Private Joint Stock Company (the “Company”) is registered in Abu Dhabi, United Arab Emirates (“UAE”) and is listed on the Abu Dhabi Securities Exchange as a Private Joint Stock Company pursuant to the UAE Federal Law No.8 of 1984 (as amended). In 2001, the Company received approval from the Central Bank of the UAE to conduct financial investment business as an investment company in accordance with the Central Bank’s Board of Directors’ Resolution No. 164/8/94 dated 18 April 1995 regarding the regulations for investment companies and banking and investment consultation companies.
The principal activities of the Group are investment banking, asset management, private equity, funds and securities investment, hospitality, third party real estate and provision of consultancy.
The registered head office of the Company is at P O Box 47435, Abu Dhabi, U.A.E.
The consolidated financial statements of the Group were authorised for issue by the Board of Directors on 19 May 2015.
2.1 BASIS OF PREPARATIONThe consolidated financial statements have been prepared in accordance with International Financial Reporting Standards and applicable requirements of the laws in the U.A.E.
The consolidated financial statements have been prepared on the historical cost basis, except for certain financial instruments and properties which are carried at fair value.
The consolidated financial statements of the Group are prepared in U.A.E. Dirhams (AED) which is the presentation currency of the Group. All values are rounded to the nearest thousand (AED ‘000), except otherwise indicated.
2.2 BASIS OF CONSOLIDATIONThe accompanying consolidated financial statements comprise of the financial statements of the Company and its subsidiaries (together referred to as the “Group”). The details of the Company’s subsidiaries and their principal activities are as follows:
Ownership Country of interest incorporation % Principal activity
Operating entities Mainland Management LLC U.A.E. 67 Real estate investments Falcon Investments LLC U.A.E. 100 Property management, advisory and investment brokerage services National Investor Property Management LLC - a subsidiary of Falcon Investments LLC U.A.E. 100 Advisory and consultancy services Robert Flanagan Arabian Management Consultancy LLC - a subsidiary of Falcon Investments LLC U.A.E. 51 Management consultancy services Professional Realtors Company Ltd- a subsidiary of Falcon Investments LLC K.S.A 80 Real estate and consultancy Uptown Management LLC U.A.E. 100 Real estate investments Uptown Investment LLC U.A.E. 100 Real estate investments Mainland Investment LLC U.A.E. 100 Real estate investments Mafraq Hotel – a subsidiary of Mainland Investment LLC U.A.E. 100 Hospitality services TNI (Dubai) Limited U.A.E. 100 Investment advisory services Consolidated Fund (1) Ireland 96.90 MENA focused mutual fund Consolidated Fund (2) Bermuda 98.88 MENA hedge fund MENA Real Estate Solutions LLC U.A.E. 100 Real estate and consultancy
Special purpose entities United Capital LLC U.A.E. 100 Asset Management Fidelity Invest LLC U.A.E. 100 Asset Management Fidelity Trust LLC U.A.E. 100 Asset Management Al Dhafra Capital LLC U.A.E. 100 Asset Management TNI Capital Partners Limited Cayman Islands 100 Private Equity Funds TNI General Partners Limited Cayman Islands 100 Private Equity Funds TNIH General Partner S.a.r.l Luxembourg 100 Private Equity Funds TNI Funds Public Limited Company Ireland 100 Asset Management Blue Chip Capital LLC U.A.E. 100 Asset Management Alliance Investment LLC U.A.E. 100 Asset Management

TNI ANNUAL REPORT 2014/2015 19
[continued]NOTES TO THE CONSOLIDATED FINANCIAL STATEMENTSfor the year ended 31 March 2015
2.2 BASIS OF CONSOLIDATION [continued]Control is achieved when the Group is exposed, or has rights, to variable returns from its involvement with the investee and has the ability to affect those returns through its power over the investee. Specifically, the Group controls an investee if and only if the Group has:
• Power over the investee (i.e. existing rights that give it the current ability to direct the relevant activities of the investee);
• Exposure, or rights, to variable returns from its involvement with the investee; and
• The ability to use its power over the investee to affect its returns.
When the Group has less than a majority of the voting or similar rights of an investee, the Group considers all relevant facts and circumstances in assessing whether it has power over an investee, including:
• The contractual arrangement with the other vote holders of the investee;
• Rights arising from other contractual arrangements; and
• The Group’s voting rights and potential voting rights.
The Group re-assesses whether or not it controls an investee if facts and circumstances indicate that there are changes to one or more of the three elements of control. Consolidation of a subsidiary begins when the Group obtains control over the subsidiary and ceases when the Group loses control of the subsidiary. Assets, liabilities, income and expenses of a subsidiary acquired or disposed of during the year are included in the consolidated statement of comprehensive income from the date the Group gains control until the date the Group ceases to control the subsidiary.
Profit or loss and each component of other comprehensive income (OCI) are attributed to the equity holders of the parent of the Group and to the non-controlling interests, even if this results in the non-controlling interests having a deficit balance. When necessary, adjustments are made to the financial statements of subsidiaries to bring their accounting policies into line with the Group’s accounting policies. All intra-group assets and liabilities, equity, income, expenses and cash flows relating to transactions between members of the Group are eliminated in full on consolidation.
A change in the ownership interest of a subsidiary, without a loss of control, is accounted for as an equity transaction. If the Group loses control over a subsidiary, it:
• Derecognises the assets (including goodwill) and liabilities of the subsidiary
• Derecognises the carrying amount of any non-controlling interests
• Derecognises the cumulative translation differences recorded in equity
• Recognises the fair value of the consideration received
• Recognises the fair value of any investment retained
• Recognises any surplus or deficit in profit or loss
• Reclassifies the parent’s share of components previously recognised in OCI to profit or loss or retained earnings, as appropriate, as would be required if the Group had directly disposed of the related assets or liabilities

20 TNI ANNUAL REPORT 2014/2015
[continued]NOTES TO THE CONSOLIDATED FINANCIAL STATEMENTSfor the year ended 31 March 2015
2.3 NON-CONTROLLING INTERESTS
Financial information of subsidiaries that have material non-controlling interests are provided below:
Portion of equity interest held by non-controlling interests: 2015 2014
Mainland Management LLC 33% 33%
Accumulated balances of non-controlling interest
2015 2014
AED’000 AED’000
Mainland Management LLC 52,212 29,592
Profit/(loss) allocated to material non-controlling interests
2015 2014
AED’000 AED’000
Mainland Management LLC 6,620 10,418
The table below shows the summarised financial information of the subsidiary which have material non-controlling interest:
2015 2014
AED’000 AED’000
Total assets 182,574 134,198
Total liabilities 25,938 45,421
Total equity 156,636 88,777
Profit for the year 19,859 31,255
2.4 CHANGES IN ACCOUNTING POLICIESThe accounting policies adopted are consistent with those of the previous financial year, except for the following new and amended IFRS and IFRIC interpretations effective as of 1 April 2014:
Investment Entities (Amendments to IFRS 10, IFRS 12 and IAS 27)
These amendments provide an exception to the consolidation requirement for entities that meet the definition of an invest-ment entity under IFRS 10 Consolidated Financial Statements and must be applied retrospectively, subject to certain transi-tion relief. The exception to consolidation requires investment entities to account for subsidiaries at fair value through profit or loss. These amendments have no impact on the Group.
Novation of Derivatives and Continuation of Hedge Accounting – Amendments to IAS 39
These amendments provide relief from discontinuing hedge ac-counting when novation of a derivative designated as a hedging instrument meets certain criteria and retrospective application is required. These amendments have no impact on the Group as the Group did not have any derivatives during the current or prior periods.

TNI ANNUAL REPORT 2014/2015 21
[continued]NOTES TO THE CONSOLIDATED FINANCIAL STATEMENTSfor the year ended 31 March 2015
2.4 CHANGES IN ACCOUNTING POLICIES [continued]IFRIC 21 Levies
IFRIC 21 clarifies that an entity recognises a liability for a levy when the activity that triggers payment, as identified by the relevant legislation, occurs. For a levy that is triggered upon reaching a minimum threshold, the interpretation clarifies that no liability should be anticipated before the specified minimum threshold is reached. Retrospective application is required for IFRIC 21. This interpretation has no impact on the Group.
Recoverable Amount Disclosure for Non-Financial Assets - Amendments IAS 36 Impairment of Assets
The standard requires the disclosure of information about the recoverable amount of impaired non-financial assets, if that amount is based on fair value less costs of disposal. They also require the disclosure of additional information about that fair value measurement. In addition, if the recoverable amount of impaired assets based on fair value less costs of disposal was measured using the present value technique, the amendments also require the disclosure of the discount rates that have been used in the current and previous measurements. This amend-ment has not impact on the Group.
Annual Improvements 2010-2012 Cycle
In the 2010-2012 annual improvements cycle, the IASB issued seven amendments to six standards, which included an amend-ment to IFRS 13 Fair Value Measurement. The amendment to IFRS 13 is effective immediately and, thus, for periods beginning at 1 April 2014, and it clarifies in the Basis for Conclusions that short-term receivables and payables with no stated interest rates can be measured at invoice amounts when the effect of discounting is immaterial. This amendment to IFRS 13 has no impact on the Group.
Annual Improvements 2011-2013 Cycle
In the 2011-2013 annual improvements cycle, the IASB issued four amendments to four standards, which included an amend-ment to IFRS 1 First-time Adoption of International Financial Reporting Standards. The amendment to IFRS 1 is effective immediately and, thus, for periods beginning at 1 April 2014, and clarifies in the Basis for Conclusions that an entity may choose to apply either a current standard or a new standard that is not yet mandatory, but permits early application, provided either standard is applied consistently throughout the periods present-ed in the entity’s first IFRS financial statements. This amend-ment to IFRS 1 has no impact on the Group, since the Group is an existing IFRS preparer.
2.5 FUTURE CHANGES IN ACCOUNTING POLICIES - STANDARDS ISSUED BUT NOT YET EFFECTIVEStandards issued but not yet effective up to the date of the issuance of the Group’s consolidated financial statements are listed below. This listing is of standards and interpretations issued, which the Group reasonably expects to be applicable at a future date. The Group intends to adopt those standards when they become effective.
Regulatory Deferral Accounts - IFRS 14
This is an optional standard that allows an entity, whose activi-ties are subject to rate-regulation, to continue applying most of its existing accounting policies for regulatory deferral account balances upon its first-time adoption of IFRS. Entities that adopt IFRS 14 must present the regulatory deferral accounts as separate line items on the statement of financial position and present movements in these account balances as separate line items in the statement of profit or loss and other comprehensive income. The standard requires disclosures on the nature of, and risks associated with, the entity’s rate-regulation and the effects of that rate-regulation on its financial statements. IFRS 14 is effective for annual periods beginning on or after 1 January 2016. Since the Group is an existing IFRS preparer, this standard would not apply.
Financial Instruments - hedge accounting - Amendments to IFRS 9, IFRS 7 and IAS 39
The standard introduces new requirements for hedge accounting that align hedge accounting more closely with risk manage-ment. The requirements also establish a more principles-based approach to hedge accounting and address inconsistencies and weaknesses in the hedge accounting model in IAS 39.

22 TNI ANNUAL REPORT 2014/2015
[continued]NOTES TO THE CONSOLIDATED FINANCIAL STATEMENTSfor the year ended 31 March 2015
2.5 FUTURE CHANGES IN ACCOUNTING POLICIES - STANDARDS ISSUED BUT NOT YET EFFECTIVE [continued]
Revenue from Contracts with Customers – IFRS 15
The standard was issued in May 2014 and establishes a new five-step model that will apply to revenue arising from contracts with customers. Under IFRS 15 revenue is recognised at an amount that reflects the consideration to which an entity expects to be entitled in exchange for transferring goods or services to a customer. The principles in IFRS 15 provide a more structured approach to measuring and recognising revenue. The new revenue standard is applicable to all entities and will supersede all current revenue recognition requirements under IFRS. Either a full or modified retrospective application is required for annual periods beginning on or after 1 January 2017 with early adoption permitted.
Joint Arrangements – Amendment IFRS 11
The amendment requires that a joint operator accounting for the acquisition of an interest in a joint operation, in which the activity of the joint operation constitutes a business must apply the relevant IFRS 3 principles for business combinations accounting. The amendments also clarify that a previously held interest in a joint operation is not remeasured on the acquisition of an additional interest in the same joint operation while joint control is retained. In addition, a scope exclusion has been added to IFRS 11 to specify that the amendments do not apply when the parties sharing joint control, including the reporting entity, are under common control of the same ultimate controlling party. The amendments apply to both the acquisition of the initial interest in a joint operation and the acquisition of any additional interests in the same joint operation and are prospectively effective for annual periods beginning on or after 1 January 2016, with early adoption permitted.
IAS 16 and IAS 38 - Amendment
The amendment clarify the principle in IAS 16 and IAS 38 that revenue reflects a pattern of economic benefits that are generated from operating a business (of which the asset is part) rather than the economic benefits that are consumed through use of the asset. As a result, a revenue-based method cannot be used to depreciate property, plant and equipment and may only be used in very limited circumstances to amortise intangible assets. The amendments are effective prospectively for annual periods beginning on or after 1 January 2016, with early adoption permitted.
IAS 16 and IAS 41 - Amendment
The standard changes the accounting requirements for biological assets that meet the definition of bearer plants. Under the amendments, biological assets that meet the definition of bearer plants will no longer be within the scope of IAS 41. Instead, IAS 16 will apply. After initial recognition, bearer plants will be measured under IAS 16 at accumulated cost (before maturity) and using either the cost model or revaluation model (after maturity). The amendments also require that produce that grows on bearer plants will remain in the scope of IAS 41 measured at fair value less costs to sell. For government grants related to bearer plants, IAS 20 Accounting for Government Grants and Disclosure of Government Assistance will apply. The amendments are retrospectively effective for annual periods beginning on or after 1 January 2016, with early adoption permitted.
Separate Financial Statements – Amendment IAS 27
This amendment will allow entities to use the equity method to account for investments in subsidiaries, joint ventures and associates in their separate financial statements. Entities already applying IFRS and electing to change to the equity method in its separate financial statements will have to apply that change retrospectively. For first-time adopters of IFRS electing to use the equity method in its separate financial statements, they will be required to apply this method from the date of transition to IFRS. The amendments are effective for annual periods beginning on or after 1 January 2016, with early adoption permitted.

TNI ANNUAL REPORT 2014/2015 23
[continued]NOTES TO THE CONSOLIDATED FINANCIAL STATEMENTSfor the year ended 31 March 2015
2.6 SIGNIFICANT ACCOUNTING POLICIES
Cash and short term deposits
Cash and short-term deposits in the statement of financial position comprise cash at banks and on hand and short-term-deposits.
For the purpose of consolidated statement of cash flows, cash and cash equivalents consist of cash in hand, bank balances, and short term deposits with an original maturity of three months or less.
Investment in associates
An associate is an entity over which the Group has significant influence and that is neither a subsidiary nor an interest in a joint venture. Significant influence is the power to participate in the financial and operating policy decisions of the investee but is not control or joint control over those policies.
The results and assets and liabilities of associates are incorporated in these financial statements using the equity method of accounting except when the investment is classified as held for sale in which case, it is accounted for under IFRS 5 Non-current Assets Held for Sale and Discontinued Operation. Under the equity method, investments in associates are carried in the consolidated statement of financial position at cost as adjusted for post-acquisition changes in the Group’s share of the net assets of the associate, less any impairment in the value of individual investments.
The income statement reflects the Group’s share of the results of operations of the associate. When there has been a change recognised directly in the equity of the associate, the Group recognises its share of any changes and discloses this, when applicable, in the statement of changes in equity.
Where the Company transacts with associates, significant profits and losses are eliminated to the extent of the Company’s interest in the associates.
After application of the equity method, the Group determines whether it is necessary to recognise an additional impairment loss on its investment in its associate. The Group determines at each reporting date whether there is any objective evidence that the investment in the associate is impaired. If this is the case, the Group calculates the amount of impairment as the difference between the recoverable amount of the associate and its carrying value.
Investments in joint ventures
A joint venture is a type of joint arrangement whereby the parties that have joint control of the arrangement have rights to the net assets of the joint venture. Joint control is the contractually agreed sharing of control of an arrangement, which exists only when decisions about the relevant activities require unanimous consent of the parties sharing control.
The considerations made in determining joint control are similar to those necessary to determine control over subsidiaries. The Group’s investments in its joint ventures are accounted for using the equity method.
Under the equity method, the investment in a joint venture is initially recognised at cost. The carrying amount of the investment is adjusted to recognise changes in the Group’s share of net assets of the joint venture since the acquisition date. Goodwill relating to the joint venture is included in the carrying amount of the investment and is neither amortised nor individually tested for impairment.
The statement of profit or loss reflects the Group’s share of the results of operations of the joint venture. Any change in OCI of those investees is presented as part of the Group’s OCI. In addition, when there has been a change recognised directly in the equity of the joint venture, the Group recognises its share of any changes, when applicable, in the statement of changes in equity. Unrealised gains and losses resulting from transactions between the Group and the joint venture are eliminated to the extent of the interest in the joint venture.

24 TNI ANNUAL REPORT 2014/2015
[continued]NOTES TO THE CONSOLIDATED FINANCIAL STATEMENTSfor the year ended 31 March 2015
2.6 SIGNIFICANT ACCOUNTING POLICIES [continued]
Investments in joint ventures (continued)
The aggregate of the Group’s share of profit or loss of a joint venture is shown on the face of the statement of profit or loss outside operating profit and represents profit or loss after tax and non-controlling interests in the joint venture. The financial statements of the joint ventures are prepared for the same reporting period as the Group. When necessary, adjustments are made to bring the accounting policies in line with those of the Group.
After application of the equity method, the Group determines whether it is necessary to recognise an impairment loss on its investment in joint venture. At each reporting date, the Group determines whether there is objective evidence that the investment in the joint venture is impaired. If there is such evidence, the Group calculates the amount of impairment as the difference between the recoverable amount of the joint venture and its carrying value, then recognises the loss as ‘Share of profit of joint venture’ in the statement of profit or loss.
Upon loss of joint control over the joint venture, the Group measures and recognises any retained investment at its fair value. Any difference between the carrying amount of the joint venture upon loss of joint control and the fair value of the retained investment and proceeds from disposal is recognised in profit or loss.
Property, fixtures and equipment
Property, fixtures and equipment are stated at historical cost less accumulated depreciation and accumulated impairment losses (if any). Historical cost includes expenditure that is directly attributable to the acquisition of the asset.
The cost of property, fixtures and equipment is their purchase cost together with any incidental costs of acquisition.
Subsequent costs are included in the asset’s carrying amount or recognised as a separate asset, as appropriate, only when it is probable that future economic benefits associated with the item will flow to the Group and the cost of the item can be measured reliably. All other repairs and maintenance expenses are charged to profit or loss during the financial period in which they are incurred.
Depreciation is charged so as to write off the cost of property, fixtures and equipment on a straight-line basis over the expected useful economic lives of the assets concerned as follows:
Leasehold improvements 3 - 4 years
Buildings 30 years
Furniture and fixtures 3 - 7 years
Office equipment 2 - 10 years
Motor vehicles 3 - 5 years
The estimated useful lives, residual values and depreciation method are reviewed at the end of each reporting period, with the effect of any changes in estimate accounted for on a prospective basis.
Freehold land is not depreciated.
The gain or loss arising on the disposal or retirement of an asset is determined as the difference between the net disposal proceeds and the carrying amount of the asset and is included in the consolidated income statement when the asset is derecognized.
The carrying values of property, fixtures and equipment are reviewed for impairment when events or changes in circumstances indicate the carrying value may not be recoverable. If any such indication exists and where the carrying value exceeds the estimated recoverable amount, the assets are written down to their recoverable amount, being the higher of their fair value less costs to sell and their value in use.

TNI ANNUAL REPORT 2014/2015 25
[continued]NOTES TO THE CONSOLIDATED FINANCIAL STATEMENTSfor the year ended 31 March 2015
2.6 SIGNIFICANT ACCOUNTING POLICIES [continued]
Capital work in progress
Capital work in progress is stated at cost. When commissioned, capital work in progress is transferred to the appropriate property, fixtures and equipment category and is depreciated in accordance with the Group’s policies.
Borrowing costs
Borrowing costs directly attributable to the acquisition, construction or production of qualifying assets, which are assets that necessarily take a substantial period of time to get ready for their intended use or sale, are added to the cost of those assets, until such time as the assets are substantially ready for their intended use or sale.
Investment income earned on the temporary investment of specific borrowings pending their expenditure on qualifying assets is deducted from the borrowing costs eligible for capitalisation.
All other borrowing costs are recognised in profit or loss in the period which they are incurred.
Financial instruments
Financial instruments – initial recognition and subsequent measurement
Date of recognition
All financial assets and liabilities are initially recognised on the trade date, i.e. the date that the Group becomes a party to the contractual provisions of the instrument. This includes ‘regular way trades’: purchases or sales of financial assets that require delivery of assets within the time frame generally established by regulation or convention in the market place.
Initial measurement
All financial instruments are initially measured at their fair value plus or minus transaction costs, however for those financial assets and financial liabilities measured at fair value through profit or loss transaction costs are charged to profit and loss.
Subsequent measurement
The subsequent measurement of financial assets depends on the Company’s business model for managing those financial assets and their contractual cash flow characteristics.
Transaction costs expected to be incurred on transfer or disposal of a financial instrument are not included in the measurement of the financial instrument.
Financial assets measured at amortised cost
Financial assets are measured at amortised cost only if the asset is held within a business model whose objective is to hold the asset to collect its contractual cash flows and that the contractual terms of the financial asset give rise, on specified dates, to cash flows constituting solely principal and interest on the outstanding principal amount. An inability to meet these two criteria requires the financial asset to be subsequently measured at fair value through profit or loss. However, even where both conditions are met, the Company may elect upon initial recognition to measure the financial asset at fair value through profit or loss if doing so eliminates or significantly reduces an accounting mismatch.
Debt instruments (including derivatives embedded in financial host assets) meeting these criteria are subsequently measured at amortised cost using the effective interest rate method, adjusted for any impairment charges and transaction costs incurred upon initial recognition. The effective interest rate method calculates an interest rate which exactly discounts estimated future cash receipts through the expected life of the financial asset or a shorter period (where appropriate) to the net carrying amount of the financial asset. After initial measurement at fair value, long term receivables, short term trade and other receivables, due from related parties and bank balances are subsequently measured at amortised cost using the effective interest rate method, less allowance for impairment. Amortised cost is calculated by taking into account any discount or premium on acquisition and fees and costs that are an integral part of the effective interest rate method. The amortisation is included in interest income in the income statement. The losses arising from impairment are recognised in the income statement.

26 TNI ANNUAL REPORT 2014/2015
[continued]NOTES TO THE CONSOLIDATED FINANCIAL STATEMENTSfor the year ended 31 March 2015
2.6 SIGNIFICANT ACCOUNTING POLICIES [continued]
Financial instruments (continued)
Subsequent measurement (continued)
Financial assets measured at amortised cost continuedOther financial assets measured at fair value through profit or loss
Financial assets which do not meet the amortised cost criteria such as derivatives and financial assets held for trading are measured at fair value through profit or loss. Gains or losses arising on subsequent measurement of these financial assets are recognised in the income statement.
Financial assets or financial liabilities held-for-trading are recorded in the statement of financial position at fair value. Changes in fair value are recognised in profit or loss. Interest and dividend are recorded in profit or loss according to the terms of the contract, or when the right to the payment has been established.
Equity investments at fair value through other comprehensive income
Equity investments not held for trading can be designated as being measured at fair value through other comprehensive income at initial recognition and such an election is irrevocable. This designation is made on an instrument-by-instrument basis. Gains or losses arising on subsequent measurement of these equity investments are recognised in other comprehensive income. The gain or loss on disposal of the asset is reclassified to retained earnings and is not recycled to profit or loss. Transaction costs on disposal are taken to the income statement. Dividends received on these equity investments are recognised in the income statement unless the dividend represents recovery of the cost of the investment.
Financial assets and financial liabilities designated at fair value through profit or loss
Financial assets and financial liabilities classified in this category are those that have been designated by management at initial recognition. Management may designate a financial asset at fair value through profit or loss upon initial recognition only when the first of the following criteria are met. A financial liability may be so designated when any of the three criteria are met. Designation is determined on an instrument by instrument basis:
The designation eliminates or significantly reduces the inconsistent treatment that would otherwise arise from measuring the assets or liabilities or recognising gains or losses on them on a different basis.
The assets and liabilities are part of a group of financial assets, financial liabilities or both which are managed and their performance evaluated on a fair value basis, in accordance with a documented risk management or investment strategy.
The financial instrument contains one or more embedded derivatives which significantly modify the cash flows that otherwise would be required by the contract.
Financial assets and financial liabilities at fair value through profit or loss are recorded in the statement of financial position at fair value. Changes in fair value are recorded in net income or loss on financial assets and liabilities designated at fair value through profit or loss, except that the fair value change attributable to credit risk in respect of the financial liabilities is recognised in other comprehensive income, provided that there is no measurement mismatch arising from such recognition. Interest earned or incurred is accrued in interest income or interest expense, respectively, using the effective interest rate method, while dividend income is recorded in profit or loss when the right to the payment has been established.
Investment properties
Investment properties, which are properties held to earn rentals and/or for capital appreciation, are measured initially at cost, including transaction costs. Subsequent to initial recognition, investment properties are measured at fair value. Gains or losses arising from changes in the fair value of investment properties are included in profit or loss in the period in which they arise.
Fair values are evaluated as at statement of financial position date by applying a valuation model recommended by the International Valuation Standards Committee.
Investment properties are derecognised when either they have been disposed off or when the investment property is permanently withdrawn from use and no future economic benefit is expected from its disposal. The difference between the net disposal proceeds and the carrying amount of the asset is recognised in the income statement in the period of derecognition.

TNI ANNUAL REPORT 2014/2015 27
[continued]NOTES TO THE CONSOLIDATED FINANCIAL STATEMENTSfor the year ended 31 March 2015
2.6 SIGNIFICANT ACCOUNTING POLICIES [continued]
Trade receivables
Trade receivables are stated at original invoice amount net of provisions for amounts estimated to be impaired. A provision for doubtful debts is made when collection of the full amount is no longer possible. Bad debts are written off when there is no possibility of recovery.
Share-based payment transactions
The cost of equity-settled transactions is recognised, together with a corresponding increase in equity, over the period in which the performance and/or service conditions are fulfilled. The cumulative expense recognised for equity-settled transactions at each reporting date until the vesting date reflects the extent to which the vesting period has expired and the Group’s best estimate of the number of equity instruments that will ultimately vest. The income statement expense or credit for a period represents the movement in cumulative expense recognised as at the beginning and end of that period and is recognised in staff expenses.
Leases
Leases are classified as finance leases whenever the terms of the lease transfer substantially all the risks and rewards of ownership to the lessee. All other leases are classified as operating leases.
The Group as lessor
Rental income from operating leases is recognised on a straight-line basis over the term of the relevant lease. Initial direct costs incurred in negotiating and arranging an operating lease are added to the carrying amount of the leased asset and recognised on a straight-line basis over the lease term.
The Group as lessee
Leases payable under operating leases are charged to profit or loss on a straight-line basis over the term of the relevant lease. Benefits received and receivable as an incentive to enter into an operating lease are also spread on a straight-line basis over the lease term.
Provisions
Provisions are recognised when the Group has a present obligation (legal or constructive) as a result of a past event, it is probable that the Group will be required to settle the obligation, and a reliable estimate can be made of the amount of the obligation.
The amount recognised as a provision is the best estimate of the consideration required to settle the present obligation at end of the reporting period, taking into account the risks and uncertainties surrounding the obligation. Where a provision is measured using the cash flows estimated to settle the present obligation, its carrying amount is the present value of those cash flows. When some or all of the economic benefits required to settle a provision are expected to be recovered from a third party, the receivable is recognised as an asset if it is virtually certain that reimbursement will be received and the amount of the receivable can be measured reliably.
Accounts payable and accruals
Liabilities are recognised for amounts to be paid in the future for goods or services received, whether billed by the party or not.
Employee benefits
An accrual is made for the estimated liability for employees’ entitlement to annual leave and leave passage as a result of services rendered by eligible employees up to the end of the reporting period.
The Group provides end of service benefits for its non-local employees. The entitlement to these benefits is based upon the employees’ length of service and completion of a minimum service period. The expected costs of these benefits are accrued over the period of employment.
Pension contributions are made in respect of UAE national employees to the UAE General Pension and Social Security Authority in accordance with the UAE Federal Law No. (2), 2000 for Pension and Social Security. Such contributions are charged to profit or loss during the employees’ period of service.

28 TNI ANNUAL REPORT 2014/2015
[continued]NOTES TO THE CONSOLIDATED FINANCIAL STATEMENTSfor the year ended 31 March 2015
2.6 SIGNIFICANT ACCOUNTING POLICIES [continued]
Term loans
Term loans are initially recorded at fair value of consideration received less directly attributable transaction costs. After initial recognition, term loans are subsequently measured at amortised cost using the effective interest rate method.
Foreign currencies
Foreign currency transactions are recorded at rates of exchange ruling at the value dates of the transactions. Monetary assets and liabilities denominated in foreign currencies are translated into AED at the rates of exchange ruling at the consolidated statement of financial position date. Any resultant gains and losses are recognised in the consolidated statement of income.
Non-monetary items that are measured in terms of historical cost in a foreign currency are translated using the exchange rates as at the dates of the initial transactions. Non-monetary items measured at fair value in a foreign currency are translated using the exchange rates at the date when the fair value was determined.
Fair value measurement
The Group measures financial instruments, such as available for sale assets, and financial assets at fair value through profit and loss, at fair value at each statement of financial position date.
Fair value is the price that would be received to sell an asset or paid to transfer a liability in an orderly transaction between market participants at the measurement date. The fair value measurement is based on the presumption that the transaction to sell the asset or transfer the liability takes place either:
In the principal market for the asset or liability, or
In the absence of a principal market, in the most advantageous market for the asset or liability
The principal or the most advantageous market must be accessible to by the Group.
The fair value of an asset or a liability is measured using the assumptions that market participants would use when pricing the asset or liability, assuming that market participants act in their economic best interest.
A fair value measurement of a non-financial asset takes into account a market participant’s ability to generate economic benefits by using the asset in its highest and best use or by selling it to another market participant that would use the asset in its highest and best use.
The Group uses valuation techniques that are appropriate in the circumstances and for which sufficient data are available to measure fair value, maximising the use of relevant observable inputs and minimising the use of unobservable inputs.
The Group uses the following hierarchy for determining and disclosing fair value by valuation technique:fd
Level 1: quoted (unadjusted) prices in active markets for identical assets or liabilities
Level 2: other techniques for which all inputs which have a significant effect on the recorded fair value are observable, either directly or indirectly
Level 3: techniques which use inputs which have a significant effect on the recorded fair value that are not based on observable market data.
TNI ANNUAL REPORT 2014/2015 29
[continued]NOTES TO THE CONSOLIDATED FINANCIAL STATEMENTSfor the year ended 31 March 2015
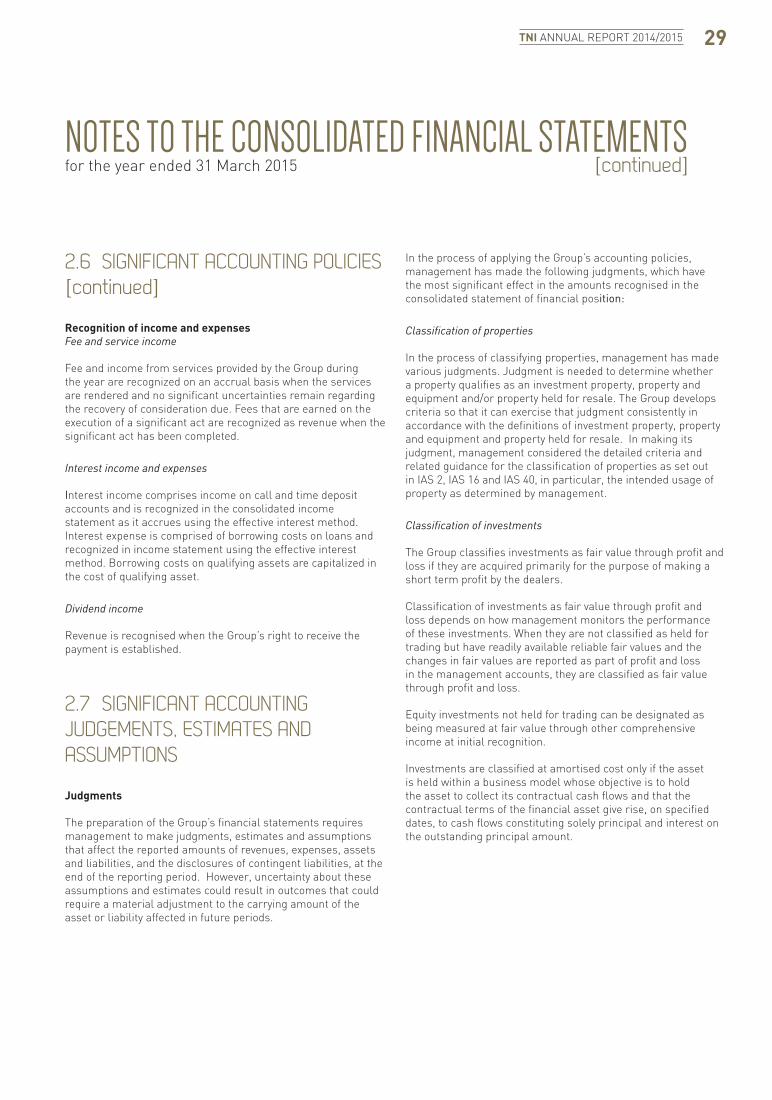
2.6 SIGNIFICANT ACCOUNTING POLICIES [continued]
Recognition of income and expensesFee and service income
Fee and income from services provided by the Group during the year are recognized on an accrual basis when the services are rendered and no significant uncertainties remain regarding the recovery of consideration due. Fees that are earned on the execution of a significant act are recognized as revenue when the significant act has been completed.
Interest income and expenses
Interest income comprises income on call and time deposit accounts and is recognized in the consolidated income statement as it accrues using the effective interest method. Interest expense is comprised of borrowing costs on loans and recognized in income statement using the effective interest method. Borrowing costs on qualifying assets are capitalized in the cost of qualifying asset.
Dividend income
Revenue is recognised when the Group’s right to receive the payment is established.
2.7 SIGNIFICANT ACCOUNTING JUDGEMENTS, ESTIMATES AND ASSUMPTIONS
Judgments
The preparation of the Group’s financial statements requires management to make judgments, estimates and assumptions that affect the reported amounts of revenues, expenses, assets and liabilities, and the disclosures of contingent liabilities, at the end of the reporting period. However, uncertainty about these assumptions and estimates could result in outcomes that could require a material adjustment to the carrying amount of the asset or liability affected in future periods.
In the process of applying the Group’s accounting policies, management has made the following judgments, which have the most significant effect in the amounts recognised in the consolidated statement of financial position:
Classification of properties
In the process of classifying properties, management has made various judgments. Judgment is needed to determine whether a property qualifies as an investment property, property and equipment and/or property held for resale. The Group develops criteria so that it can exercise that judgment consistently in accordance with the definitions of investment property, property and equipment and property held for resale. In making its judgment, management considered the detailed criteria and related guidance for the classification of properties as set out in IAS 2, IAS 16 and IAS 40, in particular, the intended usage of property as determined by management.
Classification of investments
The Group classifies investments as fair value through profit and loss if they are acquired primarily for the purpose of making a short term profit by the dealers.
Classification of investments as fair value through profit and loss depends on how management monitors the performance of these investments. When they are not classified as held for trading but have readily available reliable fair values and the changes in fair values are reported as part of profit and loss in the management accounts, they are classified as fair value through profit and loss.
Equity investments not held for trading can be designated as being measured at fair value through other comprehensive income at initial recognition.
Investments are classified at amortised cost only if the asset is held within a business model whose objective is to hold the asset to collect its contractual cash flows and that the contractual terms of the financial asset give rise, on specified dates, to cash flows constituting solely principal and interest on the outstanding principal amount.

30 TNI ANNUAL REPORT 2014/2015
[continued]NOTES TO THE CONSOLIDATED FINANCIAL STATEMENTSfor the year ended 31 March 2015
2.7 SIGNIFICANT ACCOUNTING JUDGEMENTS, EST MATES AND ASSUMPTIONS [continued]
Judgments (continued)Classification of investments in subsidiaries and associates
Management performed an assessment on the extent of control or influence over the entities considered subsidiaries and associates. Management is satisfied that the investments are appropriately classified after consideration of the Group’s control or influence over the operational and financial policies of these entities.
Estimates and assumptions
The key assumptions concerning the future and other key sources of estimation uncertainty at the reporting date that have a significant risk of causing a material adjustment to the carrying amounts of assets and liabilities within the next financial year are discussed below:
Useful lives of property, fixtures and equipment
The Group determines the estimated useful lives of its property, fixtures and equipment for calculating depreciation. This estimate is determined after considering the expected usage of the asset or physical wear and tear. Management reviews the residual value and useful lives annually and the future depreciation charge would be adjusted where management believes that the useful lives differ from previous estimates.
Impairment of investments in associates
Management regularly reviews its investments in associates for indicators of impairment. This determination of whether investments in associates are impaired entails Management’s evaluation of the specific investee’s profitability, liquidity, solvency and ability to generate operating cash flows from the date of acquisition and until the foreseeable future. The difference between the estimated recoverable amount and the carrying value of investment is recognised as an expense in profit or loss.
Impairment of trade and other receivables and due from related parties
An estimate of the collectible amount of trade and other receivables and due from related parties is made when collection of the full amount is no longer probable. This determination of whether the receivables are impaired entails Management’s evaluation of the specific credit and liquidity position of the customers and related parties and their historical recovery rates, including discussion with legal department and
review of current economic environment. Management believes that the recorded provision is sufficient to cover anticipated losses.
At the statement of financial position date, gross trade receivables and amounts due from related parties were AED 24,030 thousand and AED 635 thousand respectively (2014: AED 18,837 thousand and AED 4,457 thousand), with provision for doubtful debts amounting to AED 6,324 thousand (2014: AED 5,888 thousand). Any difference between the amounts actually collected in future periods and the amounts expected to be recovered will be recognised in the income statement.
Valuation of unquoted equity investments
Valuation of unquoted equity investments carried at fair value through other comprehensive income and carried at fair value through profit and loss are normally based on recent market transactions on an arm’s length basis, fair value of another instrument that is substantially the same, expected cash flows discounted at current rates for similar instruments or other valuation models. Management believes that the unquoted equity investments are properly stated at fair value as of 31 March 2015.
Fair value of investment properties
In order to assess the fair value of investment properties, the Group engages the services of professional appraisers. Management believes that the appraised value reflects the true fair value of properties in light of current economic situations. The total fair value of investment properties at 31 March 2015 amounted to AED 90,000 thousand (2014: AED 76,500 thousand). If fair value increases/decreases by 10%, the change in fair value of investment properties recognised in profit or loss for the year ended 31 March 2015 will increase/decrease by AED 9,000 thousand.
3 FEE AND SERVICE INCOME
2015 2014
AED’000 AED’000
Consultancy and other service income 58,436 38,614
Revenue from hotel services 35,349 31,861
Investment banking fees 13,483 1,265
Asset management fees 9,731 17,953
Leasing and brokerage income 6,641 5,589
123,640 95,282

TNI ANNUAL REPORT 2014/2015 31
[continued]NOTES TO THE CONSOLIDATED FINANCIAL STATEMENTSfor the year ended 31 March 2015
4 NET (LOSS) INCOME FROM INVESTMENTS CARRIED AT FAIR VALUE THROUGH PROFIT AND LOSS
2015 2014
AED’000 AED’000
Realised gain (loss) on disposal 13,899 (107)
Unrealised (loss) gain on revaluation (26,790) 38,027
Dividend and interest income 4,852 5,435
(8,039) 43,355
5 INTEREST INCOME
2015 2014
AED’000 AED’000
Time deposits 3,248 4,803
Call accounts 37 28
3,285 4,831
6 OTHER OPERATING INCOME
2015 2014
AED’000 AED’000
Reversal of provisions - 122
Others 3,731 723
3,731 845
7 OPERATING EXPENSES
2015 2014
AED’000 AED’000
Staff costs 61,743 62,748
Professional fees 4,028 1,856
Rent expense 2,759 2,142
Others 42,204 34,735
110,734 101,481
8 INTEREST EXPENSE
2015 2014
AED’000 AED’000
Term loans 2,488 3,788
Others 520 582
3,008 4,370
9 REVERSAL OF IMPAIRMENT OF PROPERTY, FIXTURES AND EQUIPMENT
2015 2014 AED’000 AED’000 Reversal of impairment of property,
fixtures and equipment (note 15) (21,719) (36,692)
In 2013, the Group wrote down the property, fixtures and equipment of Mafraq Hotel LLC to their recoverable amounts of AED 164,000 thousand as of 31 March 2013. As a result, an impairment loss of AED 75,857 thousand was recorded in the consolidated income statement. The recoverable amounts were determined based on a value in use calculation.
During the current year, the Group reassessed the recoverable amount of its previously impaired property, fixtures and equipment of Mafraq Hotel which resulted in a reversal of impairment charges previously recorded amounting to AED 21,719 thousand (2014: AED 36,692 thousand). The recoverable amounts were based on a value in use calculation.
32 TNI ANNUAL REPORT 2014/2015
[continued]NOTES TO THE CONSOLIDATED FINANCIAL STATEMENTSfor the year ended 31 March 2015
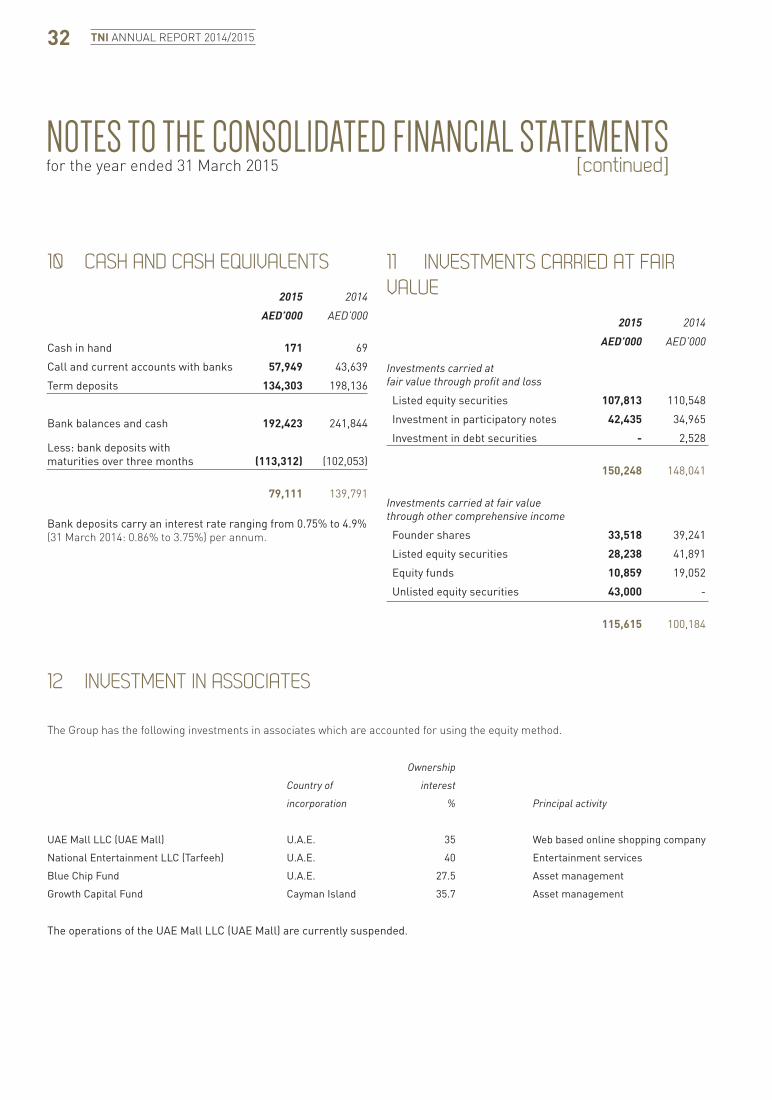
10 CASH AND CASH EQUIVALENTS
2015 2014
AED’000 AED’000
Cash in hand 171 69
Call and current accounts with banks 57,949 43,639
Term deposits 134,303 198,136
Bank balances and cash 192,423 241,844
Less: bank deposits with maturities over three months (113,312) (102,053)
79,111 139,791
Bank deposits carry an interest rate ranging from 0.75% to 4.9% (31 March 2014: 0.86% to 3.75%) per annum.
11 INVESTMENTS CARRIED AT FAIR VALUE
2015 2014
AED’000 AED’000
Investments carried at fair value through profit and loss
Listed equity securities 107,813 110,548
Investment in participatory notes 42,435 34,965
Investment in debt securities - 2,528
150,248 148,041
Investments carried at fair value through other comprehensive income
Founder shares 33,518 39,241
Listed equity securities 28,238 41,891
Equity funds 10,859 19,052
Unlisted equity securities 43,000 -
115,615 100,184
12 INVESTMENT IN ASSOCIATES
The Group has the following investments in associates which are accounted for using the equity method.
Ownership
Country of interest
incorporation % Principal activity
UAE Mall LLC (UAE Mall) U.A.E. 35 Web based online shopping company
National Entertainment LLC (Tarfeeh) U.A.E. 40 Entertainment services
Blue Chip Fund U.A.E. 27.5 Asset management
Growth Capital Fund Cayman Island 35.7 Asset management
The operations of the UAE Mall LLC (UAE Mall) are currently suspended.

TNI ANNUAL REPORT 2014/2015 33
[continued]NOTES TO THE CONSOLIDATED FINANCIAL STATEMENTSfor the year ended 31 March 2015
12 INVESTMENT IN ASSOCIATES [continued]Summarised financial information of the associates is set out below.
2015 2014
AED’000 AED’000
Associates’ statement of financial position
Assets 216,962 261,535
Liabilities (4,447) (5,707)
Net assets 212,515 255,828
Group’s share of net assets 67,394 88,342
Carrying amount of investment in associates 67,394 88,342
2015 2014
AED’000 AED’000
Associates’ revenue and profit:
Revenue 9,825 104,228
(Loss) profit for the year (1,012) 87,931
Group’s share of profit for the year 1,766 29,612
As of 31 March 2015, the Group’s share of the contingent liabilities of associates (corporate guarantees) amounted to AED nil (2014: AED Nil).
13 INVESTMENT IN JOINT VENTUREThe Group has the following investments in joint ventures which are accounted for using the equity method.
Ownership Ownership
Country of interest% interest%
incorporation 2015 2014 Principal activity
Knightsbridge Global Security LLC U.A.E. 50 50 Providing security, guarding and surveillance services for buildings and other properties.
Etqaan Shariah Fund Cayman Islands - 42.5 Asset management
As per the Board of Directors’ resolution of Etqaan Shariah Fund dated 31 August 2014, the Fund was fully liquidated and the Group’s proceeds from liquidation of the Fund amounted to AED 2.4 million.

34 TNI ANNUAL REPORT 2014/2015
[continued]NOTES TO THE CONSOLIDATED FINANCIAL STATEMENTSfor the year ended 31 March 2015
13 INVESTMENT IN JOINT VENTURE [continued]Summarised financial information of the joint ventures is set out below.
2015 2014
AED’000 AED’000
Joint venture’s statement of financial position
Assets 22,105 27,043
Liabilities (26,505) (8,018)
Net assets (4,400) 19,025
Group’s share of net assets (2,200) 9,054
Goodwill on acquisition 7,750 7,750
Carrying amount of investment in joint venture 5,550 16,804
2015 2014
AED’000 AED’000
Joint venture’s revenue and profit:
Revenue 47,190 46,335
(Loss) profit for the year (17,419) 3,883
Group’s share of (loss) profit for the year (8,826) 2,004
14 INVESTMENT PROPERTIES
2015 2014
AED’000 AED’000
Opening balance 76,500 96,753
Change in fair value 13,500 (20,253)
90,000 76,500
The Group owns two plots of land for which the Group has the intention to construct investment properties, therefore these plots of land have been classified as investment properties. Investment properties are stated at fair value, which were determined by reference to a valuation carried out by an independent valuer not related to the Group. The valuation, which conforms to the Royal Institution of Chartered Surveyors Valuation Standards, was arrived at by considering the residual method of valuation.

TNI ANNUAL REPORT 2014/2015 35
[continued]NOTES TO THE CONSOLIDATED FINANCIAL STATEMENTSfor the year ended 31 March 2015
14 INVESTMENT PROPERTIES [continued]
The following illustrates the analysis of investment properties recorded at fair value by level of hierarchy:
Date of valuation Total Level 1 Level 2 Level 3
AED’000 AED’000 AED’000 AED’000
2015
Investment properties 18 February 2015 90,000 - - 90,000
2014
Investment properties 2 April 2014 76,500 - - 76,500
Description of valuation techniques used and key inputs to valuation of investment properties:
Valuation technique Significant unobservable
inputs Range
Plot C13 - Residential Residual method Finance costs 7%
Construction time frame 30 months
Gross development area 280,989 sq ft.
Rent AED 80,000 studio /
AED 115,000 1 room /
AED 140,000 2 room /
AED 180,000 3 room
apartment
Plot C7 - Commercial Residual method Finance costs 7%
Construction time frame 30 months
Gross development area 305,495 sq ft.
Net lettable area 244,395 sq ft.
Rent AED 130/sq ft.
The residual valuation approach is the valuation method accepted by the Royal Institution of Chartered Surveyors for valuing developments and opportunities which take time to come to fruition. The residual approach works on the premise that the price a hypothetical purchaser will pay for the land or development opportunity is the surplus remaining after the costs of construction, purchase and sale costs, the cost of finance and an allowance for the profit required to undertake the project have been deducted from the sales price of the completed development.

36 TNI ANNUAL REPORT 2014/2015
[continued]NOTES TO THE CONSOLIDATED FINANCIAL STATEMENTSfor the year ended 31 March 2015
15 PROPERTY, FIXTURES AND EQUIPMENT
Furniture
Freehold Leasehold and Office Motor
land improvements Buildings fixtures equipment vehicles Total
AED’000 AED’000 AED’000 AED’000 AED’000 AED’000 AED’000
2015
Cost:
At 1 April 2014 61,506 5,802 186,207 9,195 24,125 1,170 288,005
Additions - 907 - 423 2,177 143 3,650
Disposals - - - - (6) - (6)
Write offs - (1,839) - (219) (5,160) - (7,218)
At 31 March 2015 61,506 4,870 186,207 9,399 21,136 1,313 284,431
Accumulated depreciation:
At 1 April 2014 - 4,733 25,651 6,029 16,667 688 53,768
Charge for the year - 302 6,566 1,090 1,776 114 9,848
Disposals and write offs - (1,839) - (218) (5,166) - (7,223)
At 31 March 2015 - 3,196 32,217 6,901 13,277 802 56,393
Net carrying amount before impairment:
At 31 March 2015 61,506 1,674 153,990 2,498 7,859 511 228,038
Impairment:
At 1 April 2014 9,705 139 27,116 1,303 849 53 39,165
Amounts reversed during the year (note 9) (6,050) (79) (14,959) (308) (309) (14) (21,719)
At 31 March 2015 3,655 60 12,157 995 540 39 17,446
Net carrying amount after impairment:
At 31 March 2015 57,851 1,614 141,833 1,503 7,319 472 210,592

TNI ANNUAL REPORT 2014/2015 37
[continued]NOTES TO THE CONSOLIDATED FINANCIAL STATEMENTSfor the year ended 31 March 2015
15 PROPERTY, FIXTURES AND EQUIPMENT
Furniture
Freehold Leasehold and Office Motor
land improvements Buildings fixtures equipment vehicles Total
AED’000 AED’000 AED’000 AED’000 AED’000 AED’000 AED’000
2015
Cost:
At 1 April 2014 61,506 5,802 186,207 9,195 24,125 1,170 288,005
Additions - 907 - 423 2,177 143 3,650
Disposals - - - - (6) - (6)
Write offs - (1,839) - (219) (5,160) - (7,218)
At 31 March 2015 61,506 4,870 186,207 9,399 21,136 1,313 284,431
Accumulated depreciation:
At 1 April 2014 - 4,733 25,651 6,029 16,667 688 53,768
Charge for the year - 302 6,566 1,090 1,776 114 9,848
Disposals and write offs - (1,839) - (218) (5,166) - (7,223)
At 31 March 2015 - 3,196 32,217 6,901 13,277 802 56,393
Net carrying amount before impairment:
At 31 March 2015 61,506 1,674 153,990 2,498 7,859 511 228,038
Impairment:
At 1 April 2014 9,705 139 27,116 1,303 849 53 39,165
Amounts reversed during the year (note 9) (6,050) (79) (14,959) (308) (309) (14) (21,719)
At 31 March 2015 3,655 60 12,157 995 540 39 17,446
Net carrying amount after impairment:
At 31 March 2015 57,851 1,614 141,833 1,503 7,319 472 210,592

38 TNI ANNUAL REPORT 2014/2015
[continued]NOTES TO THE CONSOLIDATED FINANCIAL STATEMENTSfor the year ended 31 March 2015
15 PROPERTY, FIXTURES AND EQUIPMENT [continued]
Furniture Capital
Freehold Leasehold and Office Motor work in
land improvements Buildings fixtures equipment vehicles progress Total
AED’000 AED’000 AED’000 AED’000 AED’000 AED’000 AED’000 AED’000
2014
Cost:
61,506 5,668 186,207 8,184 23,301 1,352 55 286,273
Additions - 134 - 1,011 890 132 - 2,167
Disposals - - - - (66) (314) - (380)
Write offs - - - - - - (55) (55)
At 31 March 2014 61,506 5,802 186,207 9,195 24,125 1,170 - 288,005
Accumulated depreciation:
At 1 April 2013 - 4,578 20,119 5,544 14,568 912 - 45,721
Charge for the year - 155 5,532 485 2,165 90 - 8,427
Disposals and write offs - - - - (66) (314) - (380)
At 31 March 2014 - 4,733 25,651 6,029 16,667 688 - 53,768
Net carrying amount before impairment:
At 31 March 2014 61,506 1,069 160,556 3,166 7,458 482 - 234,237
Impairment:
At 1 April 2013 19,452 271 52,528 2,022 1,496 88 - 75,857
Amounts reversed during the year (note 9) (9,747) (132) (25,412) (719) (647) (35) - (36,692)
At 31 March 2014 9,705 139 27,116 1,303 849 53 - 39,165
Net carrying amount after impairment:
At 31 March 2014 51,801 930 133,440 1,863 6,609 429 - 195,072
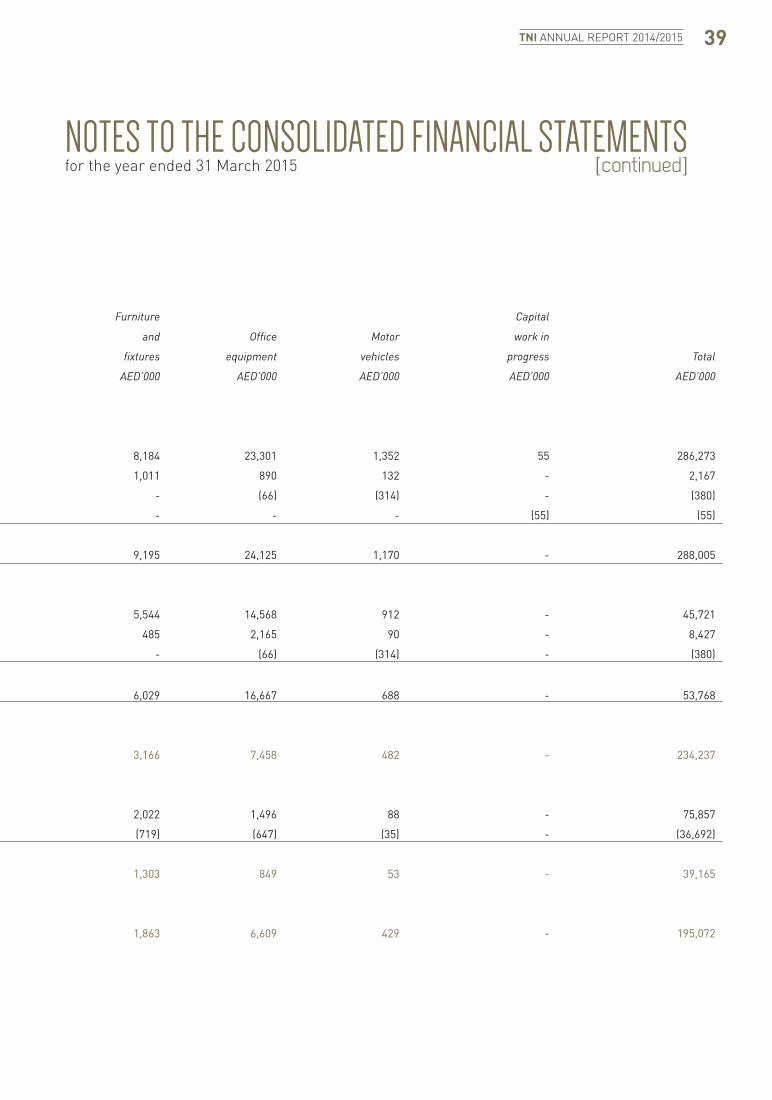
TNI ANNUAL REPORT 2014/2015 39
[continued]NOTES TO THE CONSOLIDATED FINANCIAL STATEMENTSfor the year ended 31 March 2015
15 PROPERTY, FIXTURES AND EQUIPMENT [continued]
Furniture Capital
Freehold Leasehold and Office Motor work in
land improvements Buildings fixtures equipment vehicles progress Total
AED’000 AED’000 AED’000 AED’000 AED’000 AED’000 AED’000 AED’000
2014
Cost:
61,506 5,668 186,207 8,184 23,301 1,352 55 286,273
Additions - 134 - 1,011 890 132 - 2,167
Disposals - - - - (66) (314) - (380)
Write offs - - - - - - (55) (55)
At 31 March 2014 61,506 5,802 186,207 9,195 24,125 1,170 - 288,005
Accumulated depreciation:
At 1 April 2013 - 4,578 20,119 5,544 14,568 912 - 45,721
Charge for the year - 155 5,532 485 2,165 90 - 8,427
Disposals and write offs - - - - (66) (314) - (380)
At 31 March 2014 - 4,733 25,651 6,029 16,667 688 - 53,768
Net carrying amount before impairment:
At 31 March 2014 61,506 1,069 160,556 3,166 7,458 482 - 234,237
Impairment:
At 1 April 2013 19,452 271 52,528 2,022 1,496 88 - 75,857
Amounts reversed during the year (note 9) (9,747) (132) (25,412) (719) (647) (35) - (36,692)
At 31 March 2014 9,705 139 27,116 1,303 849 53 - 39,165
Net carrying amount after impairment:
At 31 March 2014 51,801 930 133,440 1,863 6,609 429 - 195,072

40 TNI ANNUAL REPORT 2014/2015
[continued]NOTES TO THE CONSOLIDATED FINANCIAL STATEMENTSfor the year ended 31 March 2015
16 OTHER ASSETS 2015 2014
AED’000 AED’000
Trade receivables 24,030 18,837
Prepaid expenses 7,975 8,410
Accrued income 5,644 3,931
Due from employees 1,732 1,559
Deferred project costs 18,964 18,964
Others 7,758 4,671
66,103 56,372
Less: allowance for doubtful debts (6,324) (5,888)
Less: provision for deferred project costs* (18,964) (18,964)
40,815 31,520
*This item represents design costs incurred in prior years related to certain projects. During the prior year, a provision was recorded against these costs due to the suspension of the projects.
As at 31 March 2015, trade receivables at nominal value of AED 6,324 thousand (2014: AED 5,888 thousand) were impaired, and fully provided for.
The movement in the allowance for doubtful debts is as follows:
2015 2014
AED’000 AED’000
Balance at the beginning of the year 5,888 5,873
Charge for the year 480 194
Reversal during the year (44) (179)
Balance at the end of the year 6,324 5,888
As at 31 March, the ageing of unimpaired trade receivables is as follows:
Past due but not impaired Neither past
due nor 30 – 60 61 – 90 Total impaired < 30 days days days >90 days
AED’000 AED’000 AED’000 AED’000 AED’000 AED’000
2015 17,706 - 6,611 4,954 2,414 3,727
2014 12,949 - 4,952 4,150 1,340 2,507
Unimpaired receivables are expected on the basis of past experience, to be fully recoverable. It is not the practice of the Group to obtain collateral over receivables and the vast majority are therefore, unsecured.

TNI ANNUAL REPORT 2014/2015 41
[continued]NOTES TO THE CONSOLIDATED FINANCIAL STATEMENTSfor the year ended 31 March 2015
17 TERM LOANS 2015 2014
AED’000 AED’000
Term loan 1 57,674 69,576
Term loan 2 4,733 4,733
62,407 74,309
Term loan 1: During July 2012, the Group restructured its loan with National Bank of Abu Dhabi. As a result, an amount of AED 42 million was paid. The interest rate on the loan was reduced from EIBOR plus 400 basis points to EIBOR plus 300 basis points per annum with a minimum of 4.5% per annum. The loan is repayable over twenty two quarterly installments which started on 1 April 2014.
The facility is secured by a first degree mortgage amounting to AED 140 million over the land and building of Mafraq Hotel and a Corporate Guarantee of the Parent Company.
Term loan 2: Mainland Management entered into a bridge loan agreement with Finance House PJSC, a related party, on 26 March 2007, amounting to AED 17 million. In the prior year, the outstanding amount was converted into additional capital contribution to Mainland Management and subsequently an amount of AED 4.7 million was lent to Mainland Management. Interest is charged at 4% per annum (31 March 2014: 4% per annum).
18 OTHER LIABILITIES 2015 2014
AED’000 AED’000
Trade payables 6,553 10,082
Staff payables 10,224 16,345
Provision for end of service benefits 9,794 12,704
Accrued expenses 2,872 3,975
29,443 43,106
Movement in the employees’ provision for end of service benefits is as follows:
2015 2014
AED’000 AED’000
Balance at the beginning of the year 12,704 10,972
Provided during the year 2,770 3,694
Payments during the year (4,048) (1,962)
Reversal of provision (1,482) -
Transfer to due to employees (150) -
Balance at end of the year 9,794 12,704

42 TNI ANNUAL REPORT 2014/2015
[continued]NOTES TO THE CONSOLIDATED FINANCIAL STATEMENTSfor the year ended 31 March 2015
19 SHARE CAPITAL 2015 2014
AED’000 AED’000
Authorised, issued and fully paid
57,750 thousand shares (31 March 2014: 57,750 thousand shares)
of AED 10 each (31 March 2014: AED 10 each) 577,500 577,500
20 LEGAL RESERVE
As required by the UAE Commercial Company Law No. (8) of 1984 (as amended) and the Articles of Association of the Company and its subsidiaries, 10% of the profit for the year, on individual basis, must be transferred to legal reserve. The Company and its subsidiaries may resolve to discontinue such transfers when the reserve equals 50% of the share capital. The legal reserve is not available for distribution.
21 STATUTORY RESERVE
In accordance with the Company’s Articles of Association, 10% of the profit for the year shall be transferred to a statutory reserve. The Company may resolve to discontinue such transfers when the statutory reserve equals 50% of the share capital. The statutory reserve is not available for distribution.
22 COMMITMENTS AND CONTINGENT LIABILITIES 2015 2014
AED’000 AED’000
Corporate guarantees 70,720 85,006
Bank guarantees 35,868 31,243
Capital commitments 2,104 31,195
108,692 147,444
The Group is a defendant in a number of lawsuits relating to its ordinary course of business. Management believes, based on legal advice, that the likelihood of the unfavorable outcome is remote; as such, no provision has been made in the consolidated financial statements (2014: AED nil).
During the current year, one of the Group companies entered into a settlement agreement with a third party relating to a dispute over non-compliance of certain contractual terms in connection with the sale of an off-plan development in Dubai. The Group agreed to settle the claim with the third party for an amount of AED 6.8 million which was paid during the current year.

TNI ANNUAL REPORT 2014/2015 43
[continued]NOTES TO THE CONSOLIDATED FINANCIAL STATEMENTSfor the year ended 31 March 2015
23 RELATED PARTY TRANSACTIONS
Related parties represent associates, joint ventures, major shareholders, directors and key management personnel of the Group, and entities controlled, jointly controlled or significantly influenced by such parties. Pricing policies and terms of these transactions are approved by the Group’s management.
The year end balances in respect of related parties included in the consolidated statement of financial position are as follows:
2015 2014
AED’000 AED’000
Amounts due from related parties:
Associates 335 1,010
Funds under management 10 18
Others (entities under common control) 290 3,429
635 4,457
Amounts due to related parties:
Funds under management - 10
Others (entities under common control) 1,017 1,238
1,017 1,248
Term loans
Loan obtained from Finance House (note 17) 4,733 4,733
Significant transactions with related parties during the year were as follows:
2015 2014
AED’000 AED’000
Fees earned from related parties 8,546 17,707
Guarantees issued on behalf of the Company 106,588 88,128
Short term benefits of key management
personnel (salaries, benefits and bonuses) 12,766 11,176
Interest expense on loan obtained from Finance House 192 409

44 TNI ANNUAL REPORT 2014/2015
[continued]NOTES TO THE CONSOLIDATED FINANCIAL STATEMENTSfor the year ended 31 March 2015
24 FIDUCIARY ACTIVITIESAs at 31 March, the Group held-under-trust the following assets: 2015 2014
AED’000 AED’000
Shares (at market value) 47,649 38,151
Bank balances 3,992 8,546
The above assets have not been reflected in these consolidated financial statements.
25 RISK MANAGEMENT
25.1 IntroductionRisk is inherent in the Group’s activities but it is managed through a process of ongoing identification, measurement and monitoring, subject to risk limits and other controls. This process of risk management is critical to the Group’s continuing profitability and each individual within the Group is accountable for the risk exposures relating to his or her responsibilities. The Group is exposed to credit risk, liquidity risk and market risk, the latter being subdivided into trading and non-trading risks. It is also subject to operational risks.
Risk management framework
The Board of Directors has overall responsibility for the establishment and oversight of the Group’s risk management framework. The Group’s risk management policies are established to identify and analyse the risks faced by the Group, to set appropriate risk limits and controls and to monitor risk and adherence to limits. Risk management policies and systems are reviewed regularly to reflect changes in market conditions and the Group’s activities.
Board of Directors
The overall risk management responsibility lies with the Board of Directors of the Group. It provides the direction, strategy and oversight of all the activities through various committees.
Audit Committee
The Audit Committee comprises three independent members who represent the Board of Directors of the Group. The Audit Committee has the overall responsibility of assessing the internal audit findings, directing implementation of audit recommendations and overseeing the internal audit activities undertaken within the internal control environment and regulatory compliance framework of the Group. Duties and responsibilities of the Audit Committee are governed by a formally approved Audit Committee Charter which is in line with best practice and control governance.
Management Committee
The Management Committee is responsible for identifying, measuring, monitoring and controlling the risks arising out of various activities in the Group.
Internal Audit
Risk management processes throughout the Group are audited annually by the internal audit function which is outsourced and examines both the adequacy of the procedures and the Group’s compliance with the procedures. Internal Audit discusses the results of all assessments with management, and reports its findings and recommendations to the Audit Committee. The Internal Audit has direct reporting lines to the Audit Committee in order to secure independence and objectivity in all audit engagements undertaken within the Group.

TNI ANNUAL REPORT 2014/2015 45
[continued]NOTES TO THE CONSOLIDATED FINANCIAL STATEMENTSfor the year ended 31 March 2015
25 RISK MANAGEMENT [continued]
25.1 Introduction [continued]
Risk measurement and reporting systems
Monitoring and controlling risks is primarily performed based on limits established by the Group. These limits reflect the business strategy and market environment of the Group as well as the level of risk that the Group is willing to accept, with additional emphasis on selected industries. In addition, the Group monitors and measures the overall risk bearing capacity in relation to the aggregate risk exposure across all risk types and activities.
For all levels throughout the Group, specifically tailored risk reports are prepared and distributed in order to ensure that all business divisions have access to extensive, necessary and up-to-date information.
25.2 Market risk
Market risk is the risk that the fair value and future cash flows of financial instruments will fluctuate due to changes in market variables such as interest rates, foreign exchange rates, and equity prices.
Interest rate risk
Interest rate risk arises from the possibility that changes in interest rates will affect future cash flows or the fair values of financial instruments.
The Group is exposed to interest rate risk on its interest bearing assets and liabilities.
The following table demonstrates the sensitivity of the income statement to reasonably possible changes in interest rates, with all other variables held constant, of the Group’s result for the year.
The sensitivity of the income statement is the effect of the assumed changes in interest rates on the Group’s profit for one year, based on the floating rate financial assets and financial liabilities held at 31 March 2015. Effect on profit
AED’000
2015+100 increase in basis point 1,118-100 decrease in basis point (1,118)
2014+100 increase in basis point 1,413-100 decrease in basis point (1,413)
Currency risk
Currency risk is the risk that the value of a financial instrument will fluctuate due to changes in foreign exchange rates.
Foreign currency risk is limited since a significant proportion of the Group’s transactions, monetary assets and liabilities are denominated in U.A.E. Dirhams and U.S. Dollars. As the U.A.E. Dirham is pegged to the U.S. Dollar, balances in U.S. Dollars are not considered to represent significant currency risk.
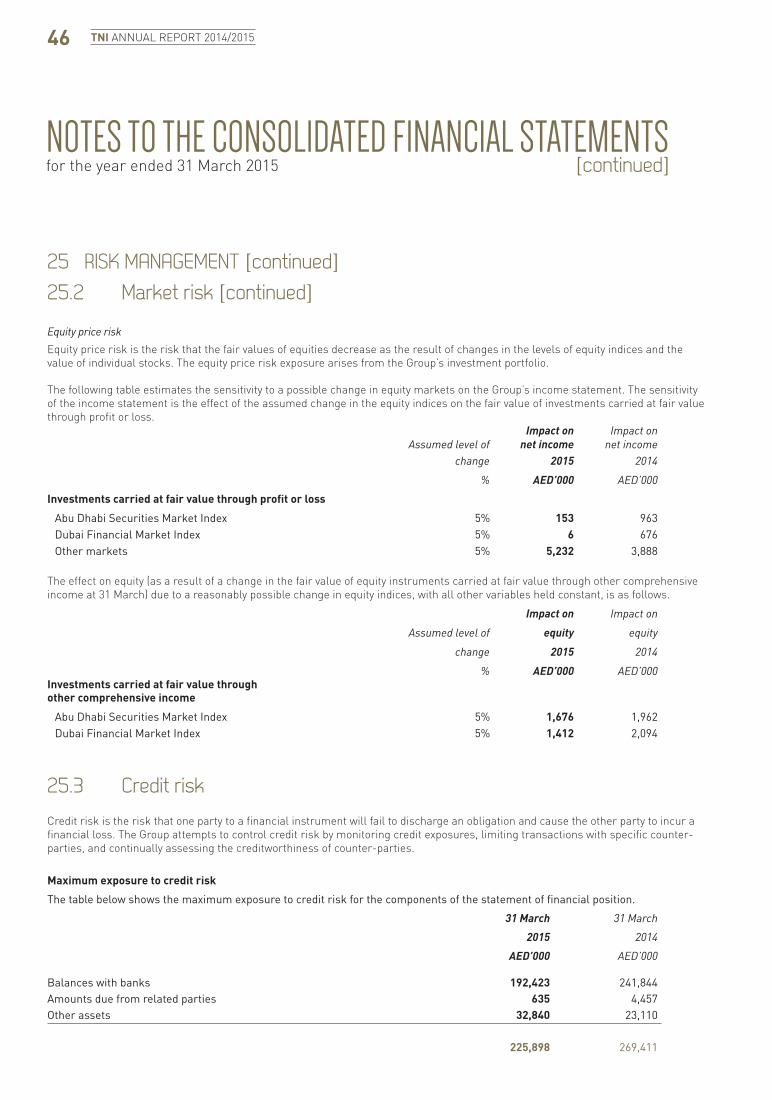
46 TNI ANNUAL REPORT 2014/2015
[continued]NOTES TO THE CONSOLIDATED FINANCIAL STATEMENTSfor the year ended 31 March 2015
25 RISK MANAGEMENT [continued]25.2 Market risk [continued]
Equity price risk
Equity price risk is the risk that the fair values of equities decrease as the result of changes in the levels of equity indices and the value of individual stocks. The equity price risk exposure arises from the Group’s investment portfolio.
The following table estimates the sensitivity to a possible change in equity markets on the Group’s income statement. The sensitivity of the income statement is the effect of the assumed change in the equity indices on the fair value of investments carried at fair value through profit or loss. Impact on Impact on Assumed level of net income net income change 2015 2014
% AED’000 AED’000
Investments carried at fair value through profit or loss
Abu Dhabi Securities Market Index 5% 153 963 Dubai Financial Market Index 5% 6 676 Other markets 5% 5,232 3,888
The effect on equity (as a result of a change in the fair value of equity instruments carried at fair value through other comprehensive income at 31 March) due to a reasonably possible change in equity indices, with all other variables held constant, is as follows.
Impact on Impact on
Assumed level of equity equity
change 2015 2014
% AED’000 AED’000Investments carried at fair value throughother comprehensive income
Abu Dhabi Securities Market Index 5% 1,676 1,962 Dubai Financial Market Index 5% 1,412 2,094
25.3 Credit risk
Credit risk is the risk that one party to a financial instrument will fail to discharge an obligation and cause the other party to incur a financial loss. The Group attempts to control credit risk by monitoring credit exposures, limiting transactions with specific counter-parties, and continually assessing the creditworthiness of counter-parties.
Maximum exposure to credit risk
The table below shows the maximum exposure to credit risk for the components of the statement of financial position.
31 March 31 March
2015 2014
AED’000 AED’000
Balances with banks 192,423 241,844Amounts due from related parties 635 4,457Other assets 32,840 23,110
225,898 269,411

[continued]Inspired by the dynamic of flight and the feathers of a falcon, the design reflects Sheikh Zayed's love of falconry and creates an iconic symbol for the nation. Cutting-edge design, materials and construction methods are combined to create a spectacular addition to the Saadiyat Island skyline.
ZAYED NATIONAL MUSEUM

48 TNI ANNUAL REPORT 2014/2015
[continued]NOTES TO THE CONSOLIDATED FINANCIAL STATEMENTSfor the year ended 31 March 2015
25 RISK MANAGEMENT [continued]
25.4 Liquidity risk and funding management
Liquidity risk is the risk that an institution will be unable to meet its funding requirements. Liquidity risk can be caused by market disruptions or a credit downgrade which may cause certain sources of funding to dry up immediately. To guard against this risk, management has diversified funding sources and assets are managed with liquidity in mind, maintaining a healthy balance of cash, cash equivalents, and readily marketable securities.
Analysis of financial assets and financial liabilities by remaining contractual maturities
The table below summarises the maturity profile of the Group’s financial assets and liabilities at 31 March 2015 based on contractual maturities. Less than 3 months 1 year to Over 3 months to 1 year 5 years 5 years Total AED’000 AED’000 AED’000 AED’000 AED’000
ASSETSBank balances and cash 79,311 113,112 - - 192,423Amounts due from related parties 568 44 23 - 635Investments, including associates and joint venture 150,248 - 188,559 - 338,807Other assets 31,393 1,447 - - 32,840
Financial assets 261,520 114,603 188,582 - 564,705
Non-financial assets 7,975 - 100,362 201,298 309,635
Total assets 269,495 114,603 288,944 201,298 874,340
LIABILITIESTerm loans 4,231 10,251 64,942 - 79,424Amounts due to related parties 1,017 - - - 1,017Other liabilities 9,425 10,224 9,794 - 29,443
Total liabilities 14,673 20,475 74,736 - 109,884

TNI ANNUAL REPORT 2014/2015 49
[continued]NOTES TO THE CONSOLIDATED FINANCIAL STATEMENTSfor the year ended 31 March 2015
25 RISK MANAGEMENT [continued]
25.4 Liquidity risk and funding management
The maturity profile of the financial assets and liabilities at 31 March 2014 was as follows:
Less than 3 months 1 year to Over
3 months to 1 year 5 years 5 years Total
AED’000 AED’000 AED’000 AED’000 AED’000
ASSETS
Bank balances and cash 139,791 102,053 - - 241,844
Amounts due from related parties 2,162 204 2,091 - 4,457
Investments, including associates and joint venture 148,041 - 205,330 - 353,371
Other assets 21,664 1,446 - - 23,110
Financial assets 311,658 103,703 207,421 - 622,782
Non-financial assets 8,410 - 87,457 185,245 281,112
Total assets 320,068 103,703 294,878 185,245 903,894
LIABILITIES
Term loans 4,384 10,618 66,948 - 81,950
Amounts due to related parties 1,248 - - - 1,248
Other liabilities 30,403 12,703 - - 43,106
Total liabilities 36,035 23,321 66,948 - 126,304
25.5 Operational risk
Operational risk is the risk of direct or indirect loss arising from inadequate or failed internal processes, systems failure, human error, fraud or external events. When required controls fail, operational risks can cause damage to reputation, have legal or regulatory implications, or lead to financial loss. While the Group cannot expect to eliminate all operational risks, through a control framework and by continuous monitoring and responding to potential risks, the Group is able to manage these risks. Controls include effective segregation of duties, appropriate access, authorisation and reconciliation procedures, staff training and robust assessment processes. The processes are reviewed on an ongoing basis.

50 TNI ANNUAL REPORT 2014/2015
[continued]NOTES TO THE CONSOLIDATED FINANCIAL STATEMENTSfor the year ended 31 March 2015
25 RISK MANAGEMENT [continued]
25.6 Capital management
Capital includes equity attributable to the equity holders of the Group. The primary objective of the Group’s capital management is to ensure that it maintains a healthy capital ratio to support its business and maximise shareholder value. The Group manages its capital structure and makes adjustments to it in light of changes in economic conditions. To maintain or adjust the capital structure, the Group may adjust the dividend payment to shareholders, return capital to shareholders or issue new shares. No changes were made in the objectives, policies or processes for managing capital during the years ended 31 March 2015 and 31 March 2014.
26 FAIR VALUE OF FINANCIAL INSTRUMENTS
Financial instruments comprise financial assets and financial liabilities.
Financial assets consist of investments carried at fair value through other comprehensive income, investments carried at fair value through profit and loss, due from related parties, bank balances and cash and some other assets. Financial liabilities consist of term loans, due to related parties and some other liabilities.
In the opinion of management, the estimated carrying values and fair values of financial assets and liabilities, that are not carried at fair value in the consolidated financial statements are not materially different, since assets and liabilities are either short term in nature or are re-priced on a frequent basis.
The following table shows the analysis of financial instruments recorded at fair value by level of the fair value hierarchy for the year ended 31 March 2015:
Level 1 Level 2 Level 3 Total AED’000 AED’000 AED’000 AED’000FINANCIAL ASSETS
Carried at fair value through profit or loss
Quoted equities 107,813 - - 107,813
Unquoted securities - 42,435 - 42,435
107,813 42,435 - 150,248
Carried at fair value through other comprehensive income
Quoted equities 61,756 - - 61,756
Unquoted equities - 10,859 43,000 53,859
61,756 10,859 43,000 115,615

TNI ANNUAL REPORT 2014/2015 51
[continued]NOTES TO THE CONSOLIDATED FINANCIAL STATEMENTSfor the year ended 31 March 2015
26 FAIR VALUE OF FINANCIAL INSTRUMENTS [continued]
The following table shows the analysis of financial instruments recorded at fair value by level of the fair value hierarchy for the year ended 31 March 2014:
Level 1 Level 2 Level 3 Total AED’000 AED’000 AED’000 AED’000
FINANCIAL ASSETS
Carried at fair value through profit or loss
Quoted equities 110,548 - - 110,548
Unquoted securities - 37,493 - 37,493
110,548 37,493 - 148,041
Carried at fair value through other comprehensive income
Quoted equities 81,132 - - 81,132
Unquoted equities - 19,052 - 19,052
81,132 19,052 - 100,184
Transfers between categories
During the reporting period ended 31 March 2015 and 31 March 2014, there were no transfers between Level 1 and Level 2 fair value measurements, and no transfers into or out of Level 3 fair value measurements.

52 TNI ANNUAL REPORT 2015/2014