· using an ac-pulsed voltage for ehd jet printing to fabricate a flexible ag grid te. figure s-1....
TRANSCRIPT
Electronic Supplementary Information
USING AN AC-PULSED VOLTAGE FOR EHD JET PRINTING TO FABRICATE A FLEXIBLE AG GRID TE.
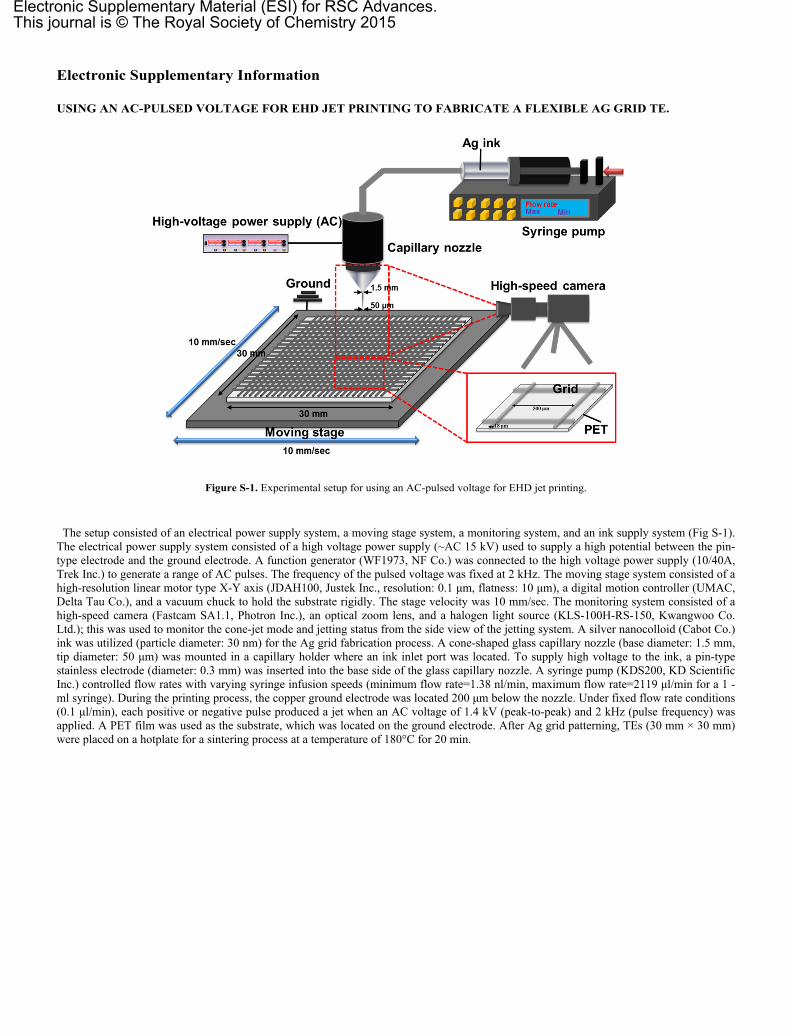
Figure S-1. Experimental setup for using an AC-pulsed voltage for EHD jet printing.
The setup consisted of an electrical power supply system, a moving stage system, a monitoring system, and an ink supply system (Fig S-1). The electrical power supply system consisted of a high voltage power supply (~AC 15 kV) used to supply a high potential between the pin-type electrode and the ground electrode. A function generator (WF1973, NF Co.) was connected to the high voltage power supply (10/40A, Trek Inc.) to generate a range of AC pulses. The frequency of the pulsed voltage was fixed at 2 kHz. The moving stage system consisted of a high-resolution linear motor type X-Y axis (JDAH100, Justek Inc., resolution: 0.1 μm, flatness: 10 μm), a digital motion controller (UMAC, Delta Tau Co.), and a vacuum chuck to hold the substrate rigidly. The stage velocity was 10 mm/sec. The monitoring system consisted of a high-speed camera (Fastcam SA1.1, Photron Inc.), an optical zoom lens, and a halogen light source (KLS-100H-RS-150, Kwangwoo Co. Ltd.); this was used to monitor the cone-jet mode and jetting status from the side view of the jetting system. A silver nanocolloid (Cabot Co.) ink was utilized (particle diameter: 30 nm) for the Ag grid fabrication process. A cone-shaped glass capillary nozzle (base diameter: 1.5 mm, tip diameter: 50 μm) was mounted in a capillary holder where an ink inlet port was located. To supply high voltage to the ink, a pin-type stainless electrode (diameter: 0.3 mm) was inserted into the base side of the glass capillary nozzle. A syringe pump (KDS200, KD Scientific Inc.) controlled flow rates with varying syringe infusion speeds (minimum flow rate=1.38 nl/min, maximum flow rate=2119 μl/min for a 1 -ml syringe). During the printing process, the copper ground electrode was located 200 μm below the nozzle. Under fixed flow rate conditions (0.1 μl/min), each positive or negative pulse produced a jet when an AC voltage of 1.4 kV (peak-to-peak) and 2 kHz (pulse frequency) was applied. A PET film was used as the substrate, which was located on the ground electrode. After Ag grid patterning, TEs (30 mm × 30 mm) were placed on a hotplate for a sintering process at a temperature of 180°C for 20 min.
Electronic Supplementary Material (ESI) for RSC Advances.This journal is © The Royal Society of Chemistry 2015
EAD JET PRINTING TO CONTROL TE METAL GRID
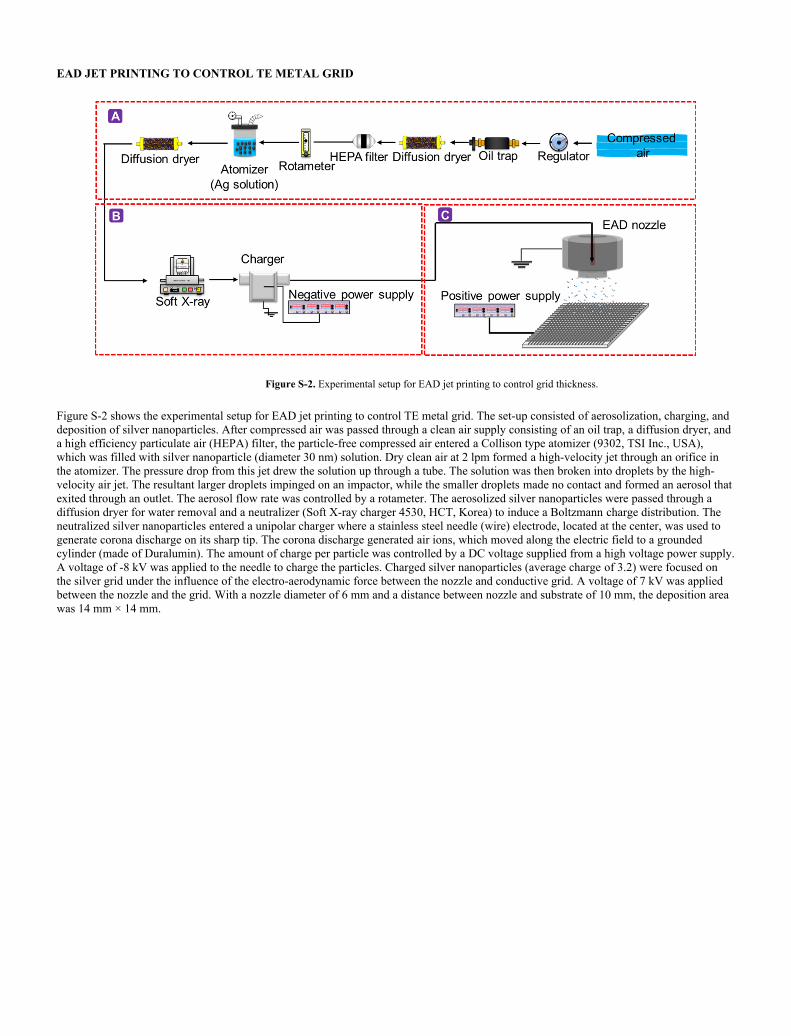
Figure S-2. Experimental setup for EAD jet printing to control grid thickness.
Figure S-2 shows the experimental setup for EAD jet printing to control TE metal grid. The set-up consisted of aerosolization, charging, and deposition of silver nanoparticles. After compressed air was passed through a clean air supply consisting of an oil trap, a diffusion dryer, and a high efficiency particulate air (HEPA) filter, the particle-free compressed air entered a Collison type atomizer (9302, TSI Inc., USA), which was filled with silver nanoparticle (diameter 30 nm) solution. Dry clean air at 2 lpm formed a high-velocity jet through an orifice in the atomizer. The pressure drop from this jet drew the solution up through a tube. The solution was then broken into droplets by the high-velocity air jet. The resultant larger droplets impinged on an impactor, while the smaller droplets made no contact and formed an aerosol that exited through an outlet. The aerosol flow rate was controlled by a rotameter. The aerosolized silver nanoparticles were passed through a diffusion dryer for water removal and a neutralizer (Soft X-ray charger 4530, HCT, Korea) to induce a Boltzmann charge distribution. The neutralized silver nanoparticles entered a unipolar charger where a stainless steel needle (wire) electrode, located at the center, was used to generate corona discharge on its sharp tip. The corona discharge generated air ions, which moved along the electric field to a grounded cylinder (made of Duralumin). The amount of charge per particle was controlled by a DC voltage supplied from a high voltage power supply. A voltage of -8 kV was applied to the needle to charge the particles. Charged silver nanoparticles (average charge of 3.2) were focused on the silver grid under the influence of the electro-aerodynamic force between the nozzle and conductive grid. A voltage of 7 kV was applied between the nozzle and the grid. With a nozzle diameter of 6 mm and a distance between nozzle and substrate of 10 mm, the deposition area was 14 mm × 14 mm.

NUMERICAL STUDY OF EAD JET PRINTING
Calculations were performed to determine the voltage applied to the substrate. FLUENT, a commercial computational fluid dynamics (CFD) software with an external user defined function (UDF) code, was used to simulate the electric field, flow field, and charged particle trajectory. FLUENT is a solver software package for various physics and engineering applications and utilizes the finite volume method (FVM). The discrete phase model (DPM) and the laminar model in FLUENT were used as the particle solver and the flow solver, respectively.First, the continuity equation and Navier-Stokes equation were solved for the flow velocity. The electric field was then obtained by solving Poisson’s equation with known particle concentration and particle charge values. Finally, the particle trajectory was calculated using the following equation:
(S1)
where is the flow velocity, is the density of air, g is the gravitational constant, dp is the particle diameter, p is the particle velocity, ρp ur
is the particle density, Cc is the Cunningham slip correction factor, and is the dynamic viscosity of air. in Eq.(S1) describes the pFr
electrostatic forces on a particle (per unit mass) and can be expressed as follows:
(S2)
where FE is the Coulombic force per unit mass that is induced by charges and electric fields, FDi is the dipole force per unit mass, and FIm is the image force acting on a particle per unit mass.Figure S-3 (a) shows numerical calculation results for particle trajectory under an electric field of 7 kV/10 mm, which suggest that EAD jet
printing allows vertical deposition of particles on the metal grid. Figure S-3 (b) shows the CFD results for the electric potential contour near the printing sites. The magnitude of the electric field was at a maximum on the grid compared to other locations and decreased gradually in the direction of the nozzle. This contour plot shows why charged particles deposited on the grid only.
pp
pp
cpp
p Fg
uuCddt
ud rrrr
r
)(
)(182

Figure S-3. (a) Charged particle trajectory in EAD jet printing. (b) Electric potential contours.
SIZE DISTRIBUTION MEASUREMENT OF SILVER AEROSOLS
Figure S-4 shows the process of aerosol size distribution measurement. Using a clean air supply system consisting of an oil trap, a diffusion dryer, and a HEPA filter, particle-free compressed air entered a Collison type atomizer. The aerosol flow rate was controlled by a rotameter. The atomizer generated Ag particle-laden droplets, which were dried using another diffusion dryer. Dried Ag particles entered the neutralizer (Soft X-ray charger) to induce a Boltzmann charge distribution. Then, a scanning mobility particle sizer (SMPS) system consisting of a differential mobility analyzer (DMA, 3081, TSI, USA) and a condensation particle counter (CPC, 3025, TSI, USA) was utilized to measure the size distribution of suspended Ag particles. The SMPS system was operated for a scan time of 180 s. SMPS measures airborne particle size distributions including electrical mobility diameter (range from 2.5 nm to 1000 nm), number concentration, and geometric standard deviation.
Figure S-4. Experimental setup for measuring particle size distribution.

Figure S-5 shows the size distribution of Ag aerosols used in the experiment. Ag particles had a modal diameter of 32 nm, with a geometric standard deviation of 1.31 and a total number concentration of 3.2 × 10⁷ #/cm3.
Figure S-5. Size distribution of Ag aerosols