… · web viewyear 2000 year 2001 year 2002 year 2003 year 2004 year 2005 year 2006 year 2007...
TRANSCRIPT

REPUBLIC OF CAMEROON PEACE-WORK-FATHERLAND -------------------
------------------
APPENDICES TO THE SETTLEMENT BILL OF THE 2015 FINANCIAL YEAR

Page 1 of 75
APPENDIX-IDEVIATIONS BETWEEN FORECASTS AND COLLECTION
PER NATURE OF REVENUE

DEVIATIONS BETWEEN FORECASTS AND COLLECTION OF REVENUEPER NATURE
Section 22 (1) of law N°2007/006 of 26 December 2007 on the financial regime of the State provides that:"…the settlement bill comes along …with the development of budget transactions submitted according to their nature, by discriminating forecasts, collections and outstanding payments… ».
The table below shows a negative change of CFA F 81 580.86 million between forecasted revenues of CFA F 3 992 600.00 million and collections worth CFA F 3 911 019.14 million for the year 2015.
(in million of CFA F)HEA DESCRIPTION BUDGET
PASSEDADJUSTEMEN
TBUDGET
AMENDED EXECUTION DEV
A- GENERATED REVENUES
3 022 483.00
30 000.00 3 052 483.003 128
204.4
3
75 721.43
I- TAX REVENUES
2 096 530.00
0 2 096 530.00 2 269 387.36
172 857.36
721 Personal income taxes 211 015.00 0 211 015.00 230 185.60 19 170.60723 Non-oil corporate income taxes 307 000.00 0 307 000.00 367 077.91 60 077.91
724Income taxes served to people living out
ofCameroon
92 500.00 0 92 500.00 84 412.26 -8 087.74
728 Transaction and transfer taxes 40 400.00 0 40 400.00 50 773.45 10 373.45730 Value added and turnover taxes 820 000.00 0 820 000.00 849 285.61 29 285.61731 Specific product taxes and excise duty 236 000.00 0 236 000.00 289 280.32 53 280.32732 Specific services taxes 2 285.00 0 2 285.00 2 491.22 206.22733 Taxes on the right to pursue a profession 10 150.00 0 10 150.00 9 633.96 -516.04
734Taxes on authorisation to use goods or to
pursuean activity
30 0 30 80.93 50.93
735 Other goods and services tax 11 920.00 0 11 920.00 10 732.17 -1 187.83736 Import duties and taxes 306 650.00 0 306 650.00 320 314.27 13 664.27
737Export duties and taxes and other taxes
onforeign trade
21 050.00 0 21 050.00 17 132.54 -3 917.46
738 Registration fee and stamp duties 37 530.00 0 37 530.00 37 987.12 457.12
II- OTHER REVENUES
925 953.00
30 000.00 955 953.00 858 817.06
-97 135.94
171 Repayments of guaranteed debts to the State 9 377.00 0 9 377.00 0.00 -9 377.00
172 Repayments of retroceded debt to the State 49 706.00 0 49 706.00 0.00
-49 706.00
201 Proceeds from conveyance of interests 0 30 000.00 30 000.00 0.00
-30 000.00
710 Administrative duties and fees 13 453.00 0 13 453.00 20 630.80 7 177.80714 Ancillary sales of goods 79 0 79 57.76 -21.24716 Earnings from provision of services 16 666.00 0 16 666.00 150 957.73 134
29
Page 2 of 75

1.73
719 Rent from buildings and proceeds from properties 3 981.00 0 3 981.00 4 042.30 61.30
741 Revenues from oil sector 774 900.00 0 774 900.00 592 722.45
-182 177.55
745 Financial proceeds receivable 17 376.00 0 17 376.00 42 154.89 24 778.89
761Contributions to pension schemes of APU governed State employees and allied personnel
39 000.00 0 39 000.00 44 674.25 5 674.25
771 Fines and financial penalties 1 415.00 0 1 415.00 3 576.88 2 161.88
B- BORROWINGS AND GRANTS
724 117.00
216 000.00 940 117.00 782 814.72
-157 302.28
150 Drawdowns on foreign direct multilateral borrowings 132 800.00 0 132 800.00 132 800.00 0.00
151 Drawdowns on foreign direct bilateral borrowings 213 117.00 0 213 117.00 171 632.78
-41 484.22
161 Issuance of higher than 2 years Treasury bills 320 000.00 216 000.00 536 000.00 460 293.30
-75 706.70
769 Special grants from international cooperation 58 200.00 0 58 200.00 18 088.63
-40 111.37
TOTAL REVENUES IN THE GENERAL BUDGET (A+B)
3 746 600.00
246 000.00 3 992 600.003 911
019.1
4
-81 580.86
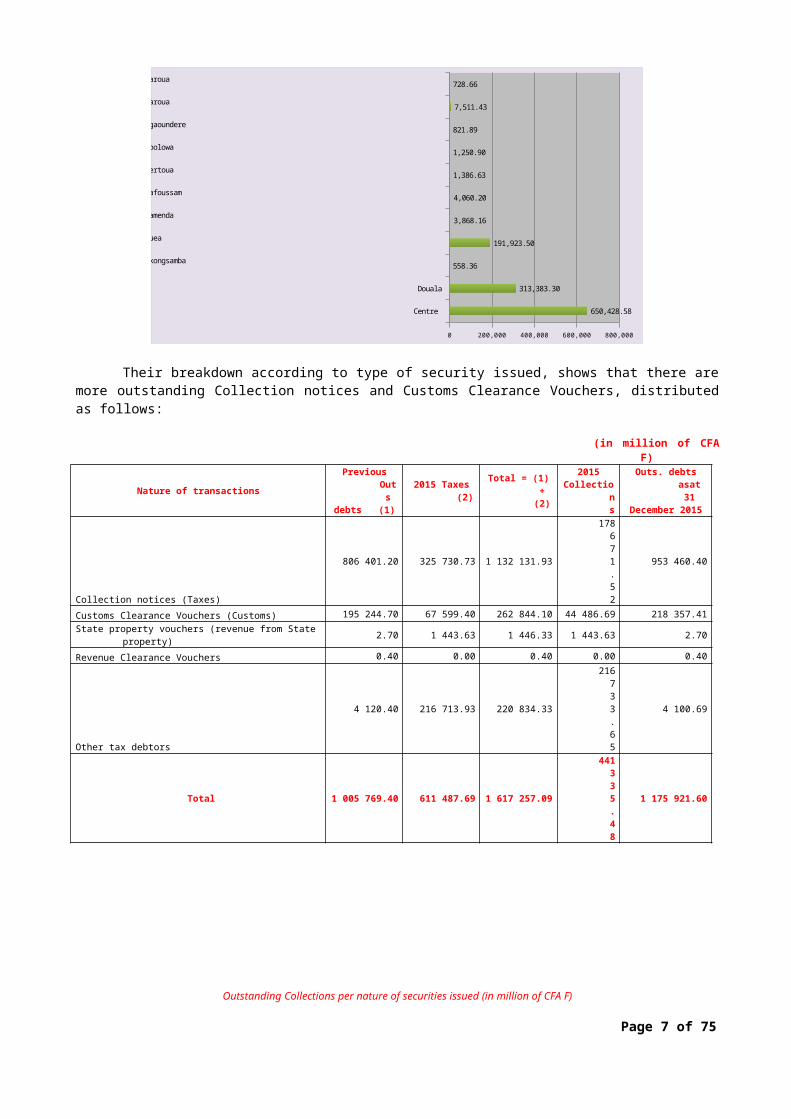
Beside this overview, the following table shows returns on Outstanding Collections/Debts(RAR) per Financial Jurisdiction as of December 2015 ending standing at a global amount of CFA F 1 175 921.60 million . Their high concentration in the Centre region is in part as a result of the volume of transactions of the Large Tax Department.
(in million of CFA F)
Financial Jurisdiction
PreviousOuts.debts
(1)2015 Taxes
(2)
Total = (1) +
(2)
2015 Collections
Outs.debts as of December
2015 endingCENTRE (PGT and TGYDE) 524 404.90 348 760.45 873 165.35 222 736.78 650 428.58Collection notices (Taxes) 524 385.20 271 556.83 795 942.03 145 554.61 650 387.42Customs Clearance Vouchers (Customs) 0.00 2 263.14 2 263.14 2 263.14 0.00State property vouchers (revenue from Stateproperty) 0.00 95.52 95.52 95.52 0.00
Revenue Clearance Vouchers 0.00 0.00 0.00 0.00 0.00Other tax debtors 19.70 74 844.96 74 864.66 74 823.51 41.16DOUALA 294 244.40 154 660.18 448 904.58 135 521.28 313 383.30
Page 3 of 75

Collection notices (Taxes) 239 310.40 48 032.25 287 342.65 28 893.35 258 449.30Customs Clearance Vouchers (Customs) 54 934.00 0.00 54 934.00 0.00 54 934.00State property vouchers (revenue from Stateproperty) 0.00 0.00 0.00 0.00 0.00
Revenue Clearance Vouchers 0.00 0.00 0.00 0.00 0.00Other tax debtors 0.00 106 627.93 106 627.93 106 627.93 0.00NKONGSAMBA 566.60 833.87 1 400.47 842.11 558.36Collection notices (Taxes) 556.10 52.58 608.68 60.81 547.86Customs Clearance Vouchers (Customs) 0.00 0.00 0.00 0.00 0.00State property vouchers (revenue from Stateproperty) 0.00 155.33 155.33 155.33 0.00
Revenue Clearance Vouchers 0.40 0.00 0.40 0.00 0.40Other tax debtors 10.10 625.97 636.07 625.97 10.10BUEA 167 320.00 34 601.00 201 921.00 9 997.50 191 923.50Collection notices (Taxes) 25 444.30 2 271.07 27 715.37 780.22 26 935.14Customs Clearance Vouchers (Customs) 140 310.70 23 112.65 163 423.35 0.00 163 423.35State property vouchers (revenue from State property) 0.00 0.00 0.00 0.00 0.00
Revenue Clearance Vouchers 0.00 0.00 0.00 0.00 0.00Other tax debtors 1 565.00 9 217.27 10 782.27 9 217.27 1 565.00BAMENDA 4 474.80 8 444.66 12 919.46 9 051.30 3 868.16Collection notices (Taxes) 4 474.80 -47.81 4 426.99 558.83 3 868.16Customs Clearance Vouchers (Customs) 0.00 291.03 291.03 291.03 0.00State property vouchers (revenue from State property) 0.00 178.72 178.72 178.72 0.00
Revenue Clearance Vouchers 0.00 0.00 0.00 0.00 0.00Other tax debtors 0.00 8 022.71 8 022.71 8 022.71 0.00BAFOUSSAM 4 430.40 7 713.10 12 143.50 8 083.30 4 060.20Collection notices (Taxes) 4 430.40 218.24 4 648.64 588.44 4 060.20Customs Clearance Vouchers (Customs) 0.00 13.62 13.62 13.62 0.00State property vouchers (revenue from State property) 0.00 321.79 321.79 321.79 0.00
Revenue Clearance Vouchers 0.00 0.00 0.00 0.00 0.00Other tax debtors 0.00 7 159.45 7 159.45 7 159.45 0.00BERTOUA 1 410.70 2 421.46 3 832.16 2 445.54 1 386.63Collection notices (Taxes) 1 366.40 642.27 2 008.67 622.00 1 386.66Customs Clearance Vouchers (Customs) 0.00 194.86 194.86 194.86 0.00State property vouchers (revenue from State property) 0.00 27.75 27.75 27.75 0.00
Revenue Clearance Vouchers 0.00 0.00 0.00 0.00 0.00Other tax debtors 44.30 1 556.58 1 600.88 1 600.92 -0.04EBOLOWA 576.40 41 351.06 41 927.46 40 676.57 1 250.90Collection notices (Taxes) 576.40 746.52 1 322.92 75.25 1 247.67Customs Clearance Vouchers (Customs) 0.00 36 243.00 36 243.00 36 242.93 0.06State property vouchers (revenue from State property) 0.00 490.60 490.60 490.60 0.00
Revenue Clearance Vouchers 0.00 0.00 0.00 0.00 0.00Other tax debtors 0.00 3 870.94 3 870.94 3 867.78 3.17NGAOUNDERE 783.00 680.18 1 463.18 641.29 821.89Collection notices (Taxes) 783.00 220.20 1 003.20 181.31 821.89Customs Clearance Vouchers (Customs) 0.00 383.63 383.63 383.63 0.00State property vouchers (revenue from State property) 0.00 0.00 0.00 0.00 0.00
Revenue Clearance Vouchers 0.00 0.00 0.00 0.00 0.00Other tax debtors 0.00 76.35 76.35 76.35 0.00GAROUA 6 891.50 10 291.50 17 183.00 9 671.57 7 511.43Collection notices (Taxes) 4 410.20 1 941.08 6 351.28 1 321.15 5 030.13Customs Clearance Vouchers (Customs) 0.00 3 543.64 3 543.64 3 543.64 0.00State property vouchers (revenue from State property) 0.00 95.02 95.02 95.02 0.00
Revenue Clearance Vouchers 0.00 0.00 0.00 0.00 0.00Other tax debtors 2 481.30 4 711.76 7 193.06 4 711.76 2 481.30MAROUA 666.70 1 730.22 2 396.92 1 668.27 728.66Collection notices (Taxes) 664.00 97.50 761.50 35.54 725.96Customs Clearance Vouchers (Customs) 0.00 1 553.83 1 553.83 1 553.83 0.00
Page 4 of 75

State property vouchers (revenue from State property) 2.70 78.90 81.60 78.90 2.70
Revenue Clearance Vouchers 0.00 0.00 0.00 0.00 0.00Other tax debtors 0.00 0.00 0.00 0.00 0.00
Grand Total1 005 769.40 611 487.69
1 617 257.09
441 335.48 1 175 921.60
Outstanding Collection per Financial Jurisdiction (in million of CFA F)
Centre
Douala
Nkongsamba
Buea
Bamenda
Bafoussam
Bertoua
Ebolowa
Ngaoundere
Garoua
Maroua
0 100,000 200,000 300,000 400,000 500,000 600,000 700,000
650,428.58
313,383.30
558.36
191,923.50
3,868.16
4,060.20
1,386.63
1,250.90
821.89
7,511.43
728.66
Their breakdown according to type of security issued, shows that there are more outstanding Collection notices and Customs Clearance Vouchers, distributed as follows:
(in million of CFA F)
Nature of transactionsPrevious
Outs
debts (1)
2015 Taxes (2)
Total = (1) + (2)
2015Collection
s
Outs. debts asat 31
December 2015Collection notices (Taxes) 806 401.20 325 730.73 1 132 131.93 178 671.52 953 460.40Customs Clearance Vouchers (Customs) 195 244.70 67 599.40 262 844.10 44 486.69 218 357.41State property vouchers (revenue from State
property) 2.70 1 443.63 1 446.33 1 443.63 2.70
Revenue Clearance Vouchers 0.40 0.00 0.40 0.00 0.40Other tax debtors 4 120.40 216 713.93 220 834.33 216 733.65 4 100.69
Total1 005
769.40
611 487.691 617
257.09
441 335.48
1 175 921.60
Outstanding Collections per nature of securities issued (in million of CFA F)
Page 5 of 75

Collection notices (Taxes)
Customs Clearance Vouchers (Customs)
State property vouchers (revenue from State property)
Revenue ClearanceVouchers
Other tax debtors
0.0 200,000.0 400,000.0 600,000.0 800,000.0 1,000,000.0 1,200,000.0
953,460.40
218,357.41
2.70
0.40
4,100.69
The overview of Outstanding Collections per financial year shows a massive concentration of Outstanding Collections in 2015 of CFA F 255 038.42 million, followed by that of Years 2014 and 2013. The following table shows the details thereof:
(in million of CFA F)
Year / nature of
securities issued
Collectionnotices
(taxes)
Customs Cleara
nceVouchers
(Customs)
State property vouchers (revenues from State-owned lands)
RevenuesClearance Vouchers
Other tax debtors
Total Proportionin %
Year 2000 19 403.86 0.00 0.00 0.00 0.00 19 403.86 1.65%
Year 2001 88.83 0.00 0.00 0.00 0.00 88.83 0.01%
Year 2002 1 978.42 0.00 0.00 0.00 0.00 1 978.42 0.17%
Year 2003 2 586.75 0.00 0.00 0.00 0.00 2 586.75 0.22%
Year 2004 2 984.64 0.00 0.00 0.00 0.00 2 984.64 0.25%
Year 2005 63 204.67 2 963.86 0.00 0.42 0.00 66 168.96 5.63%
Year 2006 16 422.55 168.37 0.00 0.00 0.00 16 590.92 1.41%
Year 2007 21 029.57 0.00 0.00 0.00 0.00 21 029.57 1.79%
Year 2008 46 827.89 0.00 0.00 0.00 0.00 46 827.89 3.98%
Year 2009 41 003.98 0.00 0.00 0.00 0.00 41 003.98 3.49%
Year 2010 61 419.41 14 002.83 0.00 0.00 0.00 75 422.24 6.41%
Year 2011 38 773.73 79 011.92 2.70 0.00 0.00 117 788.34 10.02%
Year 2012 120 078.85 25 840.27 0.00 0.00 10.08 145 929.20 12.41%
Year 2013 72 366.89 36 727.80 0.00 0.00 18.03 109 112.72 9.28%
Year 2014 213 389.39 36 529.46 0.00 0.00 1.69 249 920.54 21.25%
Year 2015 231 901.08 23 112.71 0.00 0.00 24.62 255 038.42 21.69%
Unapportioned tax -0.09 0.17 0.00 -0.02 4 046.28 4 046.34 0.34%
Total
953 460.40
218 357.41 2.70 0.40 4 100.69
1 175 921.60
100.00%
Proportion in % 81.08% 18.57% 0.00% 0.00% 0.35% 100.00%
Page 6 of 75
Outstanding Collections per Year (in million of CFA F)
Year 2000
Year 2001
Year 2002
Year 2003
Year 2004
Year 2005
Year 2006
Year 2007
Year 2008
Year 2009
Year 2010
Year 2011
Year 2012
Year 2013
Year 2014
Year 2015
Unapportioned tax
0.00 50,000.00 100,000.00 150,000.00 200,000.00 250,000.00 300,000.00
19403.86
88.83
1978.42
2586.75
2984.64
66168.96
16590.92
21029.57
46827.89
41003.98
75422.24
117788.34
145929.2
109112.72
249920.54
255038.42
4046.34
Page 7 of 75

Page 8 of 75
APPENDIX-IITRENDS IN ALLOCATIONS, PAYMENT AUTHORISATIONS,
PAYMENTS AND OUTSTANDING PAYMENTS

TRENDS IN ALLOCATIONS, PAYMENT AUTHORISATIONS, PAYMENTS AND OUTSTANDING PAYMENTS
Section 22 (1) of law N°2007/006 of 26 December 2007 on the financial regime of the State provides that: "…the settlement bill comes along …with the development of budget transactions submitted according to their nature, by discriminating forecasts, collections and outstanding payments… ».
The table below shows the execution trends of the global budget, from allocations to outstanding payments.(in million of CFA F)
DESCRIPTION FINALALLOCATIONS
PAYMENTAUTHORISATIONS PA PAYMENTS OUTSTANDING
PAYMENTSPUBLIC INVESTMENT BUDGET 1 247 300.74 1 170063.54 709563.54 460 500.00
INVESTMENT 1 018 000.00 942 293.15 649 403.15 292 890.00
PARTICIPATION 46 300.74 45 213.44 17 553.44 27 660.00REHABILITATION ANDRESTRUCTURING 30 000.00 30 000.00 28 490.00 1 510.00INVESTMENT INTERVENTION 153 000.00 152 556.95 14 116.95 138 440.00
RECURRENT BUDGET 2 158 599.26 2 098 943.55
1 934 03
3.55
164 910.00
CONSUMPTION OF GOODS AND SERVICES 965 275.26 912 137.78 786 527.78 125 610.00SALARIES 775 010.00 775 009.97 763 769.97 11 240.00PENSIONS 235 314.00 183 000.00 166 630.00 16 370.00COMMON EXPENDITURE 235 314.00 228 795.80 217 105.80 11 690.00DEBT SERVICING 586 700.00 550 710.60 550 710.60 0.00EXTERNAL PUBLIC DEBT 109 500.00 109 500.00 109 500.00 0.00DOMESTIC PUBLIC DEBT 477 200.00 441 210.60 441 210.60 0.00
Grand Total 3 992 600.00 3 819 717.69
3 194 30
7.69
625 410.00
Trends in allocations, payment authorisations (PA), payments, outstanding collections (in million of CFA F)
Final allocations
Payment authorisations pa
Payments
Outstanding payments
0.0 0 500 ,00 0.00 1 ,00 0,0 00.00 1,500,000 .00 2,000,00 0.0 0 2,5 00,000.00
1,247,300.74
1,170,063.54
709,563.54
460,500.00
2,158,599.26
2,098,943.55
1,934,033.55
164,910.00
586,700.00
550,710.60
550,710.60
0.00
Debt servicingRecurrent budget Public investment budget
The implementation of the public investment budget (PIB) brings out payment authorisations worth CFA F 1 170 063.54 million in respect of projections of CFA F 1 247 300.74 million. A while payments stand at the sum of CFA F 709 563.54million and outstanding payments of CFA F 460 500.00 million. Such investment expenses consist of the
Page 9 of 75

PIB of Ministries and institutional bodies, Participation expenses, rehabilitation and restructuring as well as investment interventions.
As concerns the PIB of institutional bodies and ministries, payment authorisations stand at CFA F 942 293.15million on forecasts of CFA F 1 018 000.00 million while payments and outstanding payments respectively stand at CFA F649 403.15 million and CFA F 292 890.00million.
Outstanding payments from participation expenses stand at the sum CFA F 27 660.00 million against authorised expenditures of CFA F 45 213.44 million and payments worth CFA F 17 553.44 million though final allocations stand at CFA F 46 300.74 million.
Outstanding payments from rehabilitation and restructuring expenses stand at the sum of CFA F 1 510.00 million against authorised expenditures of CFA F 30 000.00 million and payments of CFA F 28 490.00 million for final allocations worth CFA F 30 000.00 million.
As for investment interventions, they were paid for an amount of CFA F 14 116.95 million against CFA F 153 000.00 million forecasted. Their outstanding payments is CFA F 138 440.00 million for CFA F 152 556.95 million worth of authorised investment interventions.
The implementation of the recurrent budget shows payment authorisations worth CFA F 2098 943.55 million against final allocations of CFA F 2 158 599.26 million. Payments of these current expenditures stand at the sum of CFA F 1934 033.55 million while outstanding payments are CFA F 164 910.00 million.
The recurrent budget comprises respectively of goods and services, salaries, pensions and common expenditures.
As concerns goods and services, payments were made for a total amount of CFA F 786 527.78 million against 965 275.26 million forecasted and outstanding payments worth CFA F 125 610.00 million.
With regards to salaries, they were paid for a total amount of CFA F 763 769.97 million as against CFA F 775 010.00 million projected.
Lastly the debt service component underscores payment authorisations worth payments made in that regard of CFA F 550 710.60 million paid for final allocations of CFA F 586 700.00 million.
Page 10 of 75

Page 11 of 75
APPENDIX-IIIRETURNS ON ISSUANCE OF GOVERNEMENT SECURITIES

RETURNS ON ISSUANCE OF GOVERNMENT SECURITIES
Under the 2015 issuance programme, the Public Treasury raised the sum of CFA F 575.5 billion on the capital market, broken down as follows; CFA F 125.15 billion on the CEMAC government securities market issued via open subscription and CFA F 450.35 billion on the international financial market.
During the year under review, the sum of CFA F 234.511 billion representing securities issued previously was repaid in respect of CFA F 164.011 billion on the CEMAC government securities market issued via open subscription (CFA F 140.5 billion of Comparable Treasury Bills and CFA F 23.511 billion of Comparable Treasury Bonds) and CFA F 70 billion of Treasury bonds on the domestic financial market.
During the period from 2010 to 2015, the public Treasury raised securities worth CFA F 1 470.01 billion on capital markets as follows; CFA F 589.66 billion on the CEMAC government securities market issued via open subscription, CFA F 430 billion on the domestic financial market and CFA F 450.35 billion on the international financial market.
The outstanding amount of securities issued stands at the sum CFA F 745 billion as 31 December 2015,corresponding to CFA F 210 billion on the domestic financial market, CFA F 84.65 billion on the CEMAC government securities market issued via open subscription and CFA F 450.35 billion on the domestic financial market.
Issuances by auction in the BEAC market
Summary of issuances
Under the 2015 financing programme, the Public Treasury announced 28 issuances of public securities on BEAC market, auctioned 22 issuance lines and declared 06 lines void.
The 22 auctioned issuance lines enabled to raise the sum of CFA F 125.15 billion over CFA F 170 billion requested and CFA F 307.879 billion worth offers.
Issuance's year Amount requested Subscriptions of the SVT Amount retained2011 52 000 000 000 121 537 000 000 50 000 000 000 2012 110 000 000 000 388 367 000 000 110 000 000 000 2013 175 000 000 000 372 668 000 000 149 511 000 000 2014 161 000 000 000 472 023 000 000 155 000 000 000 2015 170 000 000 000 307 879 000 000 125 150 000 000 General total 633 000 000 000 1 622 524 000 000 589 661 000 000
Repayments
As of 31 December 2015,the Public Treasury had fulfilled its repayment obligation for a total amount of CFA F 505.011 billion.
In the year 2015, such repayments stand at CFA F 164.011 billion of public securities against CFA F 161 billion in 2014 indicating an increase of 1.87%. The package consisted of 28.96% 13-week Comparable Treasury Bills, 35.36% of 26-week Comparable Treasury Bills, 21.34% of 52-week Comparable Treasury Bills and 2-year Comparable Treasury Bonds.
Page 12 of 75

Figure 1 : Annual trend of repayments
2 0 1 2 2 0 1 3 2 0 1 4 2 0 1 50
20,000,000,000
40,000,000,000
60,000,000,000
80,000,000,000
100,000,000,000
120,000,000,000
140,000,000,000
160,000,000,000
180,000,000,000CTB-13 weeks CTB-26 weeks CTB-52 weeks
CTB-2 years Total repayments
Source: MINFI/DGTCFM/DIRTRE
Outstanding amount
The outstanding amount of securities issued by auction stand at CFA F 84.65 billion at 31 December 2015 for a year-on-year drop by 31.46%.
Figure 2: Annual trend in outstanding amount of securities issued by auction
2011 2012 2013 2014 201540000000000
50000000000
60000000000
70000000000
80000000000
90000000000
100000000000
110000000000
120000000000
130000000000
140000000000
50.00
60.00
129.51123.51
84.65
Source: MINFI/DGTCFM/DIRTRE
The previous outstanding amount consisted of 17.31% of 13-week Comparable Treasury Bills, 11.81% of 26-week Comparable Treasury Bills, 59.07% of 52-week Comparable Treasury Bills and 2-year Comparable Treasury Bonds.
Figure 3: Annual trend in the composition of the outstanding amount of securities
Page 13 of 75

2011 2012 2013 2014 2015
50%33%
21%13% 17%
50%
50%
11% 31%12%
17%
50% 28% 59%
18%27%
12%
CTB-13 weeks CTB-26 weeks CTB-52 weeks CTB-2 years
Source: MINFI/DGTCFM/DIRTREThe package of securities held by resident Primary Dealers stands at CFA F 69.955
billion against CFA F 14.695 billion worth securities held by non-residents.Compared to the previous year, resident and non-resident shares respectively
depreciated by 32.43% and26.47%.The outstanding amount of 13-week Comparable Treasury Bills dropped by 11.21% to stand at CFA F 14.65 billion. This is as result of the fact that compared to 2014. Most of the securities issued in 2015 were amortized in the course of the year. It stands at86.35% held by residents and 13.65% by non-residents.
As concerns 26-week Comparable Treasury Bills, their outstanding amount decreased by 74.03% compared to 2014 ending, to stand at CFA F 10 billion over CFA F 29.5 billion issued in 2015. The outstanding amount is 65% held by residents and 35% by non-residents.
As for 52-week Comparable Treasury Bills, their outstanding amount increased by 42.86% as compared to 31 December 2014 where it stood at CFA F 35 billion for an increase by CFA F 15 billion. Such outstanding amount is 87% held by residents and 13% by non-residents.
As concerns Comparable Treasury Bonds, their outstanding amount at the end of 2015 stands at CFA F 10 billion, following repayment of CFA F 23.511 billion made within the course of the year, for a decrease by 31.46% when compared to the end of 2014. It stands at73.05% held by residents and 26.95% by non-residents.Interest rate
Globally, the rates witnessed an increase in 2015. Regarding 13-week Comparable Treasury Bills, minimum and maximum rates, threshold and average weighted interest rate respectively increased by 45. 30. 51 and 54 base points (bp) as compared to the previous year where they stood at 1.05%, 4.70%, 2.13% and 1.93% respectively.Figure 4: Trends in 13-week CTB rates
2011 2012 2013 2014 20150%
1%
2%
3%
4%
5%
6%
7%
8%Rate min Rate max Rate limitsWMIR IRB
Source: MINFI/DGTCFM/DIRTRE
As concerns 26-week Comparable Treasury Bills, they continued their upward trend observed from 2013. Hence, minimum and maximum rates gained 35 base points each, as
Page 14 of 75

compared to 2014 where they successively stood at 1.40% and 4.70%. The threshold rate and the average weighted interest rate (TIMP) increased by 57 and 44 base points respectively as compared to 2014 where they stood at 1.82% and 1.70%.
Figure5: Trends in the 26-week CTB rates
2011 2012 2013 2014 20150%
1%
2%
3%
4%
5%
6%Rate min Rate max Rate limits WMIRIRB
Source: MINFI/DGTCFM/DIRTRE
As for 52-week Comparable Treasury Bills, after dropping in 2014, their minimum, maximum, threshold rates and the average weighted interest rate increased by 20. 200. 69 and 59 base points respectively.
Figure 6 : Trends in the 52-week CTB rates
2012 2013 2014 20150%
1%
2%
3%
4%
5%
6%
7%Rate min Rate max Rate limits WMIRIRB
Source: MINFI/DGTCFM/DIRTRE
Cost of issuances
In 2015the commitment interest in Comparable Treasury Bills stood at CFA F 1 788 908 096. When you add session fees collected by the Bank of Central African States that stood at CFA F 15 643 750,the total cost for the issuance of public securities stood at CFA F 1 804 551 846 in 2015.
Page 15 of 75

Figure 7 : Annual trends in the total cost of issuances
453
1145
1818
1439
1805
-
200
400
600
800
1 000
1 200
1 400
1 600
1 800
2 000
2011 2012 2013 2014 2015
MIL
LION
S
Source: MINFI/DGTCFM/DIRTRE
Issuances by syndication on the domestic financial market
Primary market
No issuance was made on the domestic financial market unlike the previous years when the Public Treasury raised the sum of CFA F 430 billion, for CFA F 200 billion in 2010,CFA F 80 billion in 2013 and CFA F150 billion in 2014.
Regarding the first bond issue, the last quarter maturity was amortized on 30 December 2015 for CFA F 50 billion in principal and CFA F 2.8 billion in interests.
As concerns the second bond issue, CFA F 20 billion representing the first quarter of the principal and interests worth CFA F 4.72 billion were broken down among various subscribers in proportion to the number of bonds held on 29 December 2015. As far as the last loan is concerned, only interests pertaining to the year of grace were paid, for CFA F 8.25 billion on the 28 December 2015.
The outstanding amount on the domestic financial market stands at CFA F 210 billion for CFA F 60 billion and CFA F 150 billion respectively for « ECMR 5.9% net 2013-2018 » and « ECMR 5.5% net 2014-2019 »as of 31 December 2015.
The market capitalization of Cameroon’s Public Treasury bonds at this date stood at CFA F 195 billion, broken down as follows; CFA F 45 billion for « ECMR 5.9% net 2013-2018 » and CFA F 150 billion for « ECMR 5.5 net 2014-2019 ».
Secondary market
At the close of 2015, the number of transactions recorded stands at94 for a total value of CFA F 10.038 billion broken down as follows : 56.13% for « ECMR 5.5% net 2014-2019 ». Quantities requested were 1 493 187 securities, for 68.21% ECMR 5.5% net, 30.02%ECMR 5.9% net and 1.77% ECMR 5.6% net.
On the other hand, offers were nearly 20 times higher than requests made, in respect of178 632 securities on ECMR 5.6%, 3 730 306 bonds on ECMR 5.9% net and 25 886 384 securities on ECMR 5.5% net.
Selling Investment Service Providers (PSI) consisted of EDC Investment Corporation, SCB Cameroun and Société Générale (SG) Cameroun and buyers of Afriland (AFB), BGFI Bank, EDC and SCB Cameroun.
International market
Despite a volatile market environment due to China’s slowed growth, drop in oil prices and other commodities, uncertainties associated to American monetary policy, Cameroon
Page 16 of 75

launched their first inaugural issuance internationally and raised USD 750 million in November 2015. It collected interests from 134 international investors for a book order of USD 1.2 billion.
The yield rate offered to investors stood at 9.75% per annum (equivalent to a 743-base point margin against 10-year US « Treasuries ») and the 9.5% coupon. Such yield rate is as result of the interactive process between the delegation and investors held all along the « roadshow ».
Investors estimated the price based on comparable credits proposed in Africa, namely Gabon and Angola yet better rated than Cameroon by rating agencies. Setting the coupon at 9.5% enabled reducing the amount of interests payable to investors semi-annually (9.5% instead of 9.75%). As a consideration, the issuance was not done at par value; securities were sold to investors at 98.426 rather than 100, thus reducing the amount received at closing accordingly, for USD 738.195 million making up the Gross proceeds.
The bonds will mature in November 2025 (for an average lifespan of 9 years, redeemable in three equal parts during the months of November 2023.2024 and2025). The order book and final allocations were diversified. From a geographical perspective, the Unites States represent about 31%, the United Kingdom 40%, Benelux and Scandinavia 19%, the remainder of Europe 8% and the rest of the world 2%.Figure 8 : Distribution of investors per geographical zone
Benelux and Scandinavia
19%
Remain Europe8%
Remain World2%
USA31%
UK40%
Source: MINFI/DGTCFM/DIRTRE
In conditions of distribution per type of investor, portfolio managers came first with about 78%, insurers and pension funds 5%, hedge funds 10% and private banks 7%.
Figure 9 : Distribution per type of investor
Insurers and Fund of pension
5%
Hedge Funds10%
Private Banks7%
Asset managers78%
Page 17 of 75

Source: MINFI/DGTCFM/DIRTRE
Page 18 of 75

Page 19 of 75
APPENDIX-IVRETURNS ON SPECIAL APPROPRIATIONS
ACCOUNTS/FUNDS

RETURNS ON SPECIAL APPROPRIATIONS ACCOUNTS
Section 22 (4) of law N° 2007/006 of 26 December 2007 on the financial regime of the State provides that: « the settlement bill shall come along with … explanatory appendices per annexed budget and per Appropriations Account … »
Derogating from the principle of budget universality, the practice Appropriations Accounts is fully in line with the orthodoxy of public finance management in that it fosters the implementation of public policies in specified areas.
Sections seven to twenty-one of the sixth chapter of the 2015 finance law undertook the opening of 14 special appropriations accounts (SAF) balanced in revenues and expenditures at the global sum of CFA F 106 700 000 000.
Such (SAF) and their respective allocations are broken down in the table below:
N° Special Appropriations AccountInitial
allocations
Revenues Expenditures
Realisation Overrun rate ExecutionOverrun
rate
1Relief funds to victims of natural disasters
andcatastrophes
2 000 000 0002 000 000
000
0.00% 198 520 000 0.00%
2Special Appropriations Account for the
regulation of Public Procurement
8 000 000 0007 039 122
127
0.00% 6 615 524 748 0.00%
3Special Appropriations Account for support
tocultural policy
1 000 000 0001 096 150
000
9.615% 1 096 150 000 9.615%
4 Special Appropriations Account for researchenhancement in State universities 9 600 000 000
10 000 000 00
04.17% 9 855 998 807 2.67%
5Special Appropriations Account for support
totourism
1 000 000 0001 336 128
717
33.61% 903 922 682 0.00%
6 Seed Fund 1 000 000 0001 490 776
996
49.08% 1 490 776 996 49.08%
7Special Appropriations Account for the
financing of water-related sustainable management
projects500 000 000 491 298 644 0.00% 373 119 214 0.00%
8 Special Fund for Forestry Development 2 000 000 0002 673 001
122
33.65% 1 779 339 031 0.00%
9 Road-use royalties 60 000 000 00060 000 000
000
0.00% 48 245 879 172 0.00%
10 Special Appropriations Account for thedevelopment of telecommunications 14 000 000 000
39 726 957 00
9183.76% 24 062 309 262 71.87%
11 Special fund for electronics security activities 1 000 000 000
1 500 284 04
850.03% 304 414 867 0.00%
12 Special Appropriations Account for thedevelopment of postal sector 1 000 000 000 230 708 472 0.00% 353 957 942 0.00%
13Special Appropriations Account for the
production of secure documents
3 500 000 0003 372 718
993
0.00% 2 942 515 748 0.00%
14Royalties paid by port bodies to the
National Ports Authority
2 100 000 0002 716 318
750
29.35% 2 149 080 878 2.34%
Total106 700
000 000
133 673 464 878
25.28% 100 371 509 347 0.00%
Deviation between revenues generated andexpenditures implemented 33 301 955 531
In respect of the year 2015, these accounts recorded revenue collections of CFA F 133 673 464 878 on
total forecasts of CFA F 106 700 000 000; for an implementation rate of 125.28 %.
As concerns expenditures, they were settled for CFA F 100 371 509 347 on a total Page 20 of 75

ceiling CFA F 106 700 000000; for an implementation rate of 94.068 %.The gap between the CFA F 133 673 464 878 of total revenues collected and CFA F 100 371 509 347 of expenditures settled, enabled a positive net balance of CFA F 33 301955 531. There are 8 (eight) instances of revenues overrun and 05 (instances) of expenditures overrun
The specific situation of each Special Appropriations Account is indicated below.
Page 21 of 75

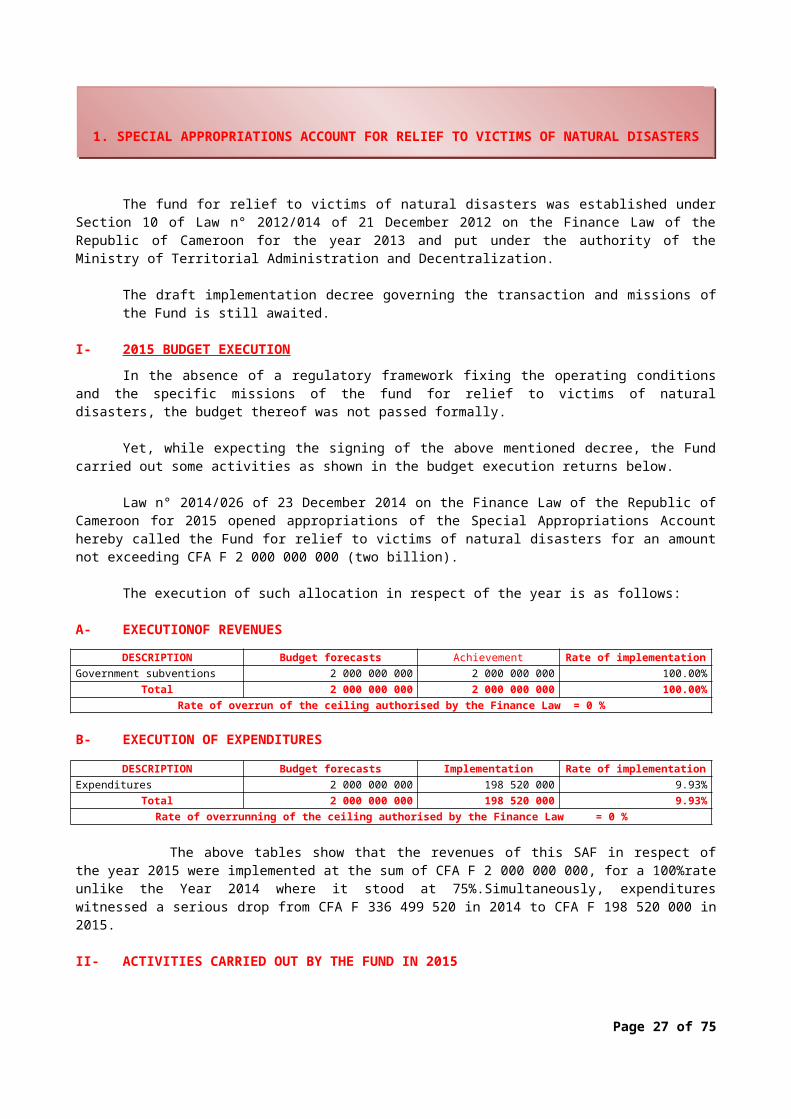
The fund for relief to victims of natural disasters was established under Section 10 of Law n° 2012/014 of 21 December 2012 on the Finance Law of the Republic of Cameroon for the year 2013 and put under the authority of the Ministry of Territorial Administration and Decentralization.
The draft implementation decree governing the transaction and missions of the Fund is still awaited.
I- 2015 BUDGET EXECUTION In the absence of a regulatory framework fixing the operating conditions and the
specific missions of the fund for relief to victims of natural disasters, the budget thereof was not passed formally.
Yet, while expecting the signing of the above mentioned decree, the Fund carried out some activities as shown in the budget execution returns below.
Law n° 2014/026 of 23 December 2014 on the Finance Law of the Republic of Cameroon for 2015 opened appropriations of the Special Appropriations Account hereby called the Fund for relief to victims of natural disasters for an amount not exceeding CFA F 2 000 000 000 (two billion).
The execution of such allocation in respect of the year is as follows:
A- EXECUTIONOF REVENUESDESCRIPTION Budget forecasts Achievement Rate of implementation
Government subventions 2 000 000 000 2 000 000 000 100.00%Total 2 000 000 000 2 000 000 000 100.00%
Rate of overrun of the ceiling authorised by the Finance Law = 0 %
B- EXECUTION OF EXPENDITURES
DESCRIPTION Budget forecasts Implementation Rate of implementationExpenditures 2 000 000 000 198 520 000 9.93%
Total 2 000 000 000 198 520 000 9.93%Rate of overrunning of the ceiling authorised by the Finance Law = 0 %
The above tables show that the revenues of this SAF in respect of the year 2015 were implemented at the sum of CFA F 2 000 000 000, for a 100%rate unlike the Year 2014 where it stood at 75%.Simultaneously, expenditures witnessed a serious drop from CFA F 336 499 520 in 2014 to CFA F 198 520 000 in 2015.
II- ACTIVITIES CARRIED OUT BY THE FUND IN 2015
Thanks to the Fund for relief to victims of natural disasters the following activities were conducted in 2015:
assumption of the activities of the Russian Ministry of Emergency Situations (EMERCOM) –International Civil Protection Organisation joint mission in Cameroon ;
emergency response in the Nde division following disasters in the locality; delivery of drugs to the Far North region population by the National Order of
Pharmacists; provision of assistance to people affected by the boat wreck on river Benue;
Page 22 of 75
1. SPECIAL APPROPRIATIONS ACCOUNT FOR RELIEF TO VICTIMS OF NATURAL DISASTERS

organisation in Yaoundé of the meeting of the African working group on disaster risk reduction;
provision of emergency relief to distressed persons; management of illegal immigrants in the Far North region; investigations for relief assistance to victims of the Mount Cameroon eruption in 1999; forwarding and supply of food items donated by the Russian Federation to the disaster-
stricken population of the Adamawa region; implementation of emergency measures to mitigate flood threats in some villages of
the Maga Sub-Division; relief to families affected by the boat wreck on the river Logone.
III- PROSPECTS OF THE FUND IN 2016
The enactment of regulations setting the organizing and recurrent modalities of the SAF is one of the major prospects for 2016. It will enable an effective monitoring and a greater coherence of the activities thereof.
This Special Appropriations Fund/Account was established by Section 13 of the Law n° 2002/014 of 30 December 2002 on Finance Law of the Republic of Cameroon for 2003.
The conditions for the functioning and organisation thereof were specified by decree n°2005/5155/PM of30 November 2005.
In the light of this decree, SAF resources consist of:
acquisition cost of tender files from Public Administrations, Regional and Local Authorities, Administrative Public Establishments, Public and Semi-public companies, and projects;
regulation duties fixed at 0.5% of the contract value or jobbing order and paid by the co-contractor or his delegate upon signing of the contract or jobbing order;
proceeds from fines and penalties on public procurements; State subventions.
While its expenditures include: ARMP recurrent and investment expenditures; honoraria of independent observers; honoraria on public procurement audits; sector surveys expenses in the field of public procurement concerning international
bodies.
I- EXECUTION OF SAF BUDGET IN 2015
Law n° 2014/026 of 23 December 2014 on the Finance Law of the Republic of Cameroon fixed the ARMP SAF budget at CFA F 8 000 000 000 (eight billion).
The following appears from the execution of SAF transactions:
A- EXECUTION OF REVENUESDESCRIPTION Budget forecasts Achievement Execution rate
A- Assigned revenue 6 750 300 000 4 912 243 369 72.77%Government subventions 1 500 000 000 1 500 000 000 100.00%2012 File TD fees 1 500 000 000 1 344 482 126 89.63%2012-2013 Ministry DRs 1 750 000 000 1 499 871 825 85.71%2014 APE&RLADRs 1 000 000 000 17 317 218 1.73%Late penalties 1 000 000 000 550 572 200 55.06%Other revenues 300 000 0 0.00%
Page 23 of 75
2. SPECIAL APPROPRIATIONS ACCOUNT FOR THE REGULATION OF PUBLIC CONTRACTS

B- Generated resources 4 246 283 000 2 126 878 758 50.09%Total (A+B) 10 996 583 000 7 039 122 127 64.01%
Rate of overrunning of the ceiling authorised by finance law= 0 %
B- EXECUTION OF EXPENSESDESCRIPTION Budget forecasts Execution Execution rate
Patent and research, software 271 748 400 179 337 940 65.99%Organisation and planning of
constructions 64 212 944 33 441 268 52.08%Office machinery 107 395 048 55448984 51.63%Office furniture 51 147 974 34 771 131 67.98%Hardware 441 656 763 68281113 15.46%Fire safety equipment 7 018 000 5 513 508 78.56%Other tangible fixed assets 25 000 000 7 113 934 28.46%
Investment 968 179 129 383 907 878 39.65%Office supplies (headquarters) 109 144 851 81742985 74.89%Stationery 19 359 063 11 316 450 58.46%Computer consumables 189 897 889 133 758 642 70.44%Printing expenses 30 000 000 4792930 15.98%Printing of regulation documentation 162 871 250 8 323 482 5.11%Subscription to publications 24 275 600 12536626 51.64%Other materials and small equipment 239 839 586 150782402 62.87%Cleaning materials 27 684 633 23326920 84.26%Electricity 96 170 000 82 081 087 85.35%Water 7 960 000 1 960 000 24.62%Fuel and lubricants 279 613 127 60988500 21.81%Transport for mission in Cameroon 135 378 500 115 908 523 85.62%Transport for mission abroad 88 600 000 8 549 100 9.65%Moving expenses 15 000 000 6 955 417 46.37%Leave transportation 30 000 000 18 686 000 62.29%Transport for assistants 97 540 000 82 160 123 84.23%Other transport expenses 1 235 000 1 235 000 100.00%Other expenses 10 000 000 8 696 654 86.97%Mail postage 30 000 000 11 145 749 37.15%Account management fees 6 115 000 6 578 806 107.58%PTT, fax, internet and website 114 916 144 58 458 101 50.87%Special duty allowances (committee) 276 845 000 188834627 68.21%Allowances for retirement/ medals 61 175 000 57179574 93.47%Domestic mission expenses 487 327 000 277695000 56.98%Mission expenses abroad 74 947 500 44 050 000 58.77%Car rental fees 15 200 000 4 600 000 30.26%Rent and rental charges 14 120 000 5 000 000 35.41%GM rent 24 000 000 19 872 000 82.80%Honoraria paid 429 800 000 28214925 6.56%Honoraria for public procurement audits 250 000 000 0 0.00%Honoraria for independent observers 512 675 000 216698178 42.27%Duty allowances 176 500 000 79521389 45.05%Miscellaneous announcements 30 100 000 731 500 2.43%Feasts and ceremonies 99 127 120 89 652 119 90.44%Maintenance of lands and open spaces 16 650 000 5105150 30.66%Maintenance of buildings 35 200 000 28 570 264 81.17%Lift maintenance 15 210 000 7 747 726 50.94%Facilities and AC maintenance 52 740 000 32092095 60.85%Vehicle maintenance 39 820 000 22633147 56.84%Maintenance of other machinery 27 240 000 15130825 55.55%Other expenses 105 000 000 69225608 65.93%Gross salaries 2 450 000 000 2312388486 94.38%Vacation pays 205 000 000 217393314 106.05%Gratuity 201464608 199426417 98.99%Performance bonuses 200 000 000 19 785 000 9.89%
Page 24 of 75

NSIF contributions (employer’s share) 200 000 000 119285148 59.64%Social debt 200 000 000 50172373 25.09%Contribution to the State (civil servants 7 500 000 2 795 291 37.27%Other employer’s contributions 60 000 000 72 486 625 120.81%Training expenses 166 842 000 44969135 26.95%Temporary and trainee staff expenses 89 660 000 59753001 66.64%Exceptional assistance and relief to staff 5 000 000 5 000 000 100.00%Other expenses 862 000 000 737888097 85.60%Regulation fees 5 000 000 0 0.00%Insurance 150 000 000 20 000 000 13.33%Motor vehicle-Insurance 50 000 000 32 361 503 64.72%Miscellaneous risk insurance policies 12 500 000 10 033 286 80.27%Mutual-Aid Fund expenses 50 000 000 7 690 000 15.38%Board Chairman fringe benefits 20 000 000 18 623 334 93.12%Press releases and adverts 92 000 000 15 848 906 17.23%Sundry expense reimbursements 30 000 000 24572969 81.91%Board Chairman monthly allowances 14 400 000 13608684 94.50%Board members’ allowances 18 750 000 19985026 106.59%Colloquia organisation expenses 373 010 000 141512651 37.94%Funeral expenses 10 000 000 3 500 000 35.00%Provisions for recurrent expenses 96 000 000 0 0.00%
Recurrent 10 028 403 871 6 231 616 870 62.14%Total 10 996 583 000 6 615 524 748 60.16%Rate of overrunning of the authorisedceilingby the Finance Law = 0 %
Ultimately, the execution of transactions in 2015 shows that the revenues collection rate stood at 64.01% as against 53.91% in 2014. Expenditures were executed at 60.16%, for an increase against 2014 where they stood at 48.63%.
Moreover, one should notice an overrunning of the ceiling authorised by the Finance law in revenues and in expenditures.
II- PROSPECTS FOR 2016
In a bid to enhance the Public Contracts Regulatory Board’s budget management and enable it to achieve their performance goals, it is envisioned that the following actions are implemented:
1) The establishment or instauration of a permanent framework for dialogue in view of strengthening synergy between MINFI officers under ARMP and those of the Administration and Finance Department in the following areas: Identification and collection of resources; The development and monitoring of periodic liquidity plans (monthly and/or
quarterly) ;
2) Stabilization by MINFI of CNE requirements for administrative Purchase Orders in order to enable a more objective and realistic assessment of budget revenues and optimize collections thereof;
3) Establishing a partnership with MINFI/DGI for an exhaustive gathering of data on registered contracts in view of a complete invoicing of regulation duties pertaining thereto.
4) Enjoin the Prime Minister, Head of Government to take legislation in view to make some Regional and Local Authorities other than those of Yaoundé and Douala fall within the scope of regulation duties.
Page 25 of 75

The Special Appropriations Account for Support to Cultural Policy in Cameroon was established by decree n° 2001/389 of 03 December 2001 of the President of the Republic.
Law n° 2014/026 of 23 December 2014 on the Finance law of the Republic of Cameroon for the year 2015 opened a Special Appropriations Account for Support to Cultural Policy within the Ministry of Arts and Culture, whose resources stand at an amount of CFA F 1 000 000 000 (one billion).
Under the aforementioned financial year, the execution of the ceiling authorised by the Finance Law stands as follows:
I- EXECUTION OF THE SAF BUDGETA- EXECUTION OF REVENUES
DESCRIPTION Budget forecasts Achievement Execution rateRecurrent subventions paid by Government 1 000 000 000 1 000 000 000 100.00%Other proceeds 100 650 000 96 150 000 95.529%
Total 1 100 650 0001 096 150
000 99.59%Rate of overrunning of the ceiling authorised by the Finance Law = 9.62 %
B- EXECUTION OF EXEPENSES
DESCRIPTION Budget forecasts Execution Execution rateReopening of the Museum 50 000 000 50 000 000 100.00%Salaries and Bonuses 20 000 000 20 000 000 100.00%Support to Hart Foundation 50 000 000 45 000 000 90.00%Social assistance to artists 20 000 000 20 500 000 102.50%Attendance to cultural events 95 000 000 95 000 000 100.00%Organisation of Cameroon-Nigeria Film 50 000 000 50 000 000 100.00%National Cultural Events 214 000 000 214 000 000 100.00%Heritage Dances 97 000 000 97 000 000 100.00%Subventions to Graphic, Audio and Visual Arts 94 000 000 94 000 000 100.00%Support to associations 12 000 000 12 000 000 100.00%Cameroon-Nigeria Film Weeks 40 000 000 40 000 000 100.00%Festivals sponsorship 120 000 000 120 000 000 100.00%SAFSPC-Staff remuneration 50 000 000 50 000 000 100.00%Heritage dances contests 30 000 000 30 000 000 100.00%National festivals 15 000 000 15 000 000 100.00%Staff remuneration 23 000 000 23 000 000 100.00%International Festivals 55 000 000 55 000 000 100.00%Subventions to associations 5 650 000 5 650 000 100.00%Distribution of royalties in the Art sector 60 000 000 60 000 000 100.00%
Total 1 100 650 000 1 096 150 000 99.59%
Rate of overrunning of the ceiling authorised by the Finance Law = 9.615 %
The Special Appropriations Account for support to cultural policy was executed in revenues at 99.59%and 99.59%in expenditures.II- SAF ACTIVITIES
Expenditures under the SAF for Support to Cultural Policy enabled conduct of the following activities:
sensitisation meeting with the private sector;
Page 26 of 75
3. SPECIAL APPROPRIATIONS ACCOUNT FOR SUPPORT TO CULTURAL POLICY
establishment of videogram and phonogram production units; commissioning of the contemporary art gallery; reopening of the national Museum and staging of ancillary activities; organisation and financing of sponsored festivals (Ecrans Noirs, ABOKI NGOMA,
FESCARHY…) ; distribution of royalties in the art sector; active participation of Cameroon in international cultural events (FESPACO, FESPAM,
Festival Nègre…); miscellaneous supports to artist associations; special assistance to families of deceased artists.
As concerns projections, the Ministry of Arts and Culture intends to reorganise the operation of the account by envisioning new sources of revenues in view of better usage of the account’s resources.
La contribution au financement des organisations de solidarité professionnelle ;
The Special Appropriations Account for the enhancement of research in State universities was established by decree n° 2009/121 of 08 April 2009.
I- FUNCTIONING CONDITION OF THE SAFThe overall objectives of the SAF include:
research enhancement in State universities; development support (Law n° 2001/005 of 16 April 2001 on higher education
directives; improvement of State universities teacher-researchers working conditions.
The SAF resources come from: various contributions of the State; cooperation funds; Grants and bequests; any other resources authorised by the finance law. Yet, the main SAF revenue since the establishment thereof remains the annual recurrent
allocation the Ministry of Finance grants it as subventions.
II- SAF BUDGET EXECUTIONThe budget was executed as follows:
A- EXECUTION OF REVENUES
DESCRIPTION Budget forecasts Achievement Execution rateRecurrent subventions 9 600 000 000 9 600 000 000 100.00%Additional subventions 400 000 000 400 000 000 0.00%
Total 10 000 000 000 10 000 000 000 100.00%Rate of overrunning of the ceiling authorised by the Finance Law = 4.17 %
B- EXECUTION OF EXPENSES
DESCRIPTION Budget forecasts Execution Execution rateResearch allocation 10 000 000 000 9 855 998 807 98.56%
Total 10 000 000 000 9 855 998 807 98.56%Rate of overrunning of the ceiling authorised by the Finance Law = 2.67 %
Page 27 of 75
4. SPECIAL APPROPRIATIONS ACCOUNT FOR THE ENHANCEMENT OF RESEARCH IN STATE UNIVERSITIES

It appears from the above tables pertaining to research upgrading in State universities that revenues were 100% achieved and expenditures 98.55% executed. It should be noted that an additional subvention of CFA F 400 000 000 was granted the SAFin2015 in order to cover the gap resulting from the recruitment of newteachers authorised by higher authorities.III- ACTIVITIES CONDUCTED BY THE SAF
The SAF budget execution enabled conduct of the following activities: payment of special financial allocation in support of research upgrading to teacher-
researchers of the 08 State universities in view of improving their working conditions; Assumption of expenses related to the transaction of the account through support to
research; support to the publication of research findings; updating of teacher-researchers digital database; optimisation of the transaction of the website created and lodged at the Digital
Governance Institute in view of making the SAF more visible nationally and internationally;
upgrading of the technical and electronic infrastructure; acquisition of office equipment and consumables; impact assessment of special financial allocation payment on research.
IV- CHALLENGES FACED BY THE SAFAmong the challenges, the substantial increase in the number teacher-researchers
recipient of the financial allocation as a result of: massive return of teacher-researchers on various campuses; recruitment of new assistant lecturers by the Public Service; non-increase of the account; functioning of newly created and /or opened institutions.
V- PROSPECTSAs prospects for 2016, the SAF intends to:
improve the university research environment; increase production of knowledge; create research and doctoral training centres.
The goal pursued is not only to upgrade academic research, but also to make it more productive, professional such as to enable Cameroonian universities be amongst the best in the sub region and world-wide.
The SAF for the framework and support to touristic activities was established by decree n° 99/111 of 27 May 1999 to implement the provisions of Law n° 98/006 of 14 April 1998 on touristic activities. The goal pursued is to promote touristic activities in Cameroon through a certain number of actions.
I– FUNCTIONING CONDITIONS OF THE SAFA- Revenues
Under Section 2 of the aforementioned decree, the resources of the SAF are essentially generated by proceeds from:
rent proceeds from hotel establishments built on public funds and entrusted in leasing-management to natural persons or legal entities whether national or foreigner;
Page 28 of 75
5. SPECIAL APPROPRIATIONS ACCOUNT FOR SUPPORT TO TOURISTIC ACTIVITIES

concession to natural or legal persons whether national or foreigner of listed touristic sites;
payment receipts from administrative fees in view of obtaining a touristic concession; royalties received for the issuance of licenses for the building or transaction of
tourism establishments, tourism bodies , and tourist guides licenses; fines and transactions ; interest quota of revenues from access rights to national parks and wildlife reserves
and from the airport stamp; grants and bequests of any origin.
B- ExpendituresExpenditures of Special Appropriations Account for the promotion of tourism essentially
consist of recurrent expenses which contribute to promotion of tourism domestically and internationally. II- SAF BUDGET EXECUTION IN 2015
Authorised in revenues and expenditures for an amount of CFA F 1 000 000 000the execution of the SAF budget appears as follows:1-EXECUTION OF REVENUES
DESCRIPTION Budget forecasts Achievement Execution rateOther revenues 0 533 843 541 0.00%Royalties on panels 40 000 000 4 512 000 11.28%Interest quota 2 000 000 132 800 6.64%Licensing fees 35 000 000 5 475 000 15.64%Rent 20 000 000 0 0.00%Rental of property built or not built 25 000 000 0 0.00%Concession 5 000 000 0 0.00%2015subventions 1 000 000 000 750 000 000 75.00%Other transfers 5 000 000 10 523 376 210.47%Late Penalties 6 000 000 452 000 7.53%Fines for missing authorisation 80 000 000 30 940 000 38.68%Fine for late submission of statistics 4 000 000 250 000 6.25%Missing stamp on panels 3 000 000 0 0.00%Other fines 25 000 000 0 0.00%
Total 1 250 000 000 1 336 128 717 106.89%
Rate of overrunning of the ceiling authorised by the Finance Law = 33.61 %
2-EXECUTION OF EXPENSES
DESCRIPTIONBudget
forecasts
Execution Execution rate
Purchase of supply and minor maintenance 43 200 000 39 994 389 92.58%Purchase of hardware and office equipment 30 000 000 27 925 479 93.08%Press conferences and trips 9 000 000 5 595 000 62.17%Users guide 25 000 000 23 655 000 94.62%Editions, promotional and electronic documents 45 000 000 25 974 301 57.72%production of documentaries 15 000 000 0 0.00%Special works, budget preparation, control, SAF audit 110 750 000 54 155 213 48:89%Purchase of service supplies 36 500 000 32 186 842 88.18%Purchase of fuel and lubricants 20 000 000 19 514 880 97.57%Purchase of air ticket /Travel fees 40 100 000 20 641 700 51.48%Attendance fees 17 000 000 0 0.00%Registration fees 300 000 0 0.00%Website 10 000 000 1 600 000 16.00%DPT 10 000 000 0 0.00%DET 21 000 000 18 494 950 88.07%
Page 29 of 75

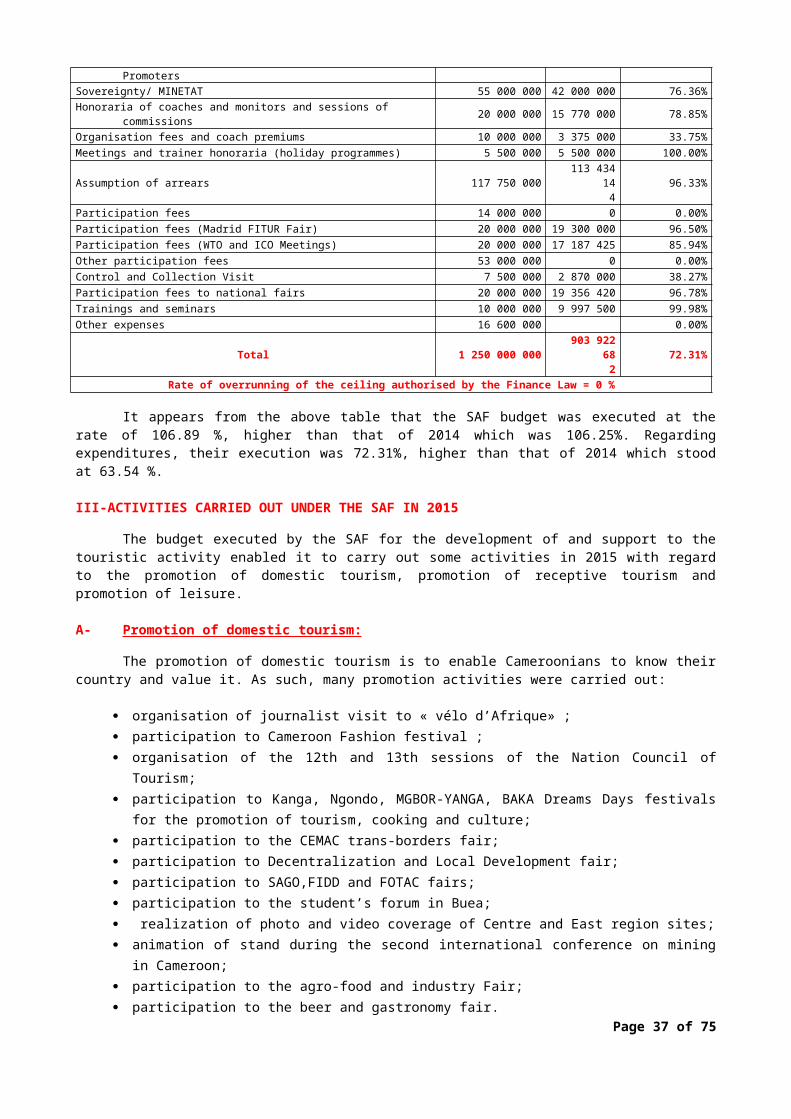
National technical commissions sessions 24 000 000 21 401 050 89.17%Domestic mission expenses 10 000 000 9 175 000 91.75%Mission expenses abroad 50 000 000 50 025 000 100.05%Assumption of delegations 20 000 000 19 967 000 99.84%Excursions and hiking trips 40 000 000 39 740 000 99.35%Committee session fees (fight against clandestine activities) 12 000 000 9 978 250 83.15%Other touristic events 42 000 000 25 744 000 61.30%Partnership and follow-up of agreements 20 000 000 15 457 645 77.29%Touristic activities in Europe 5 000 000 0 0.00%Public Relations 10 000 000 6 450 000 64.50%Touristic activities in USA 5 000 000 2 000 000 40.00%Organisation of eductours and participation to touristic events. 25 000 000 24 550 000 98.20%Touristic activities in Asia 10 000 000 8 173 825 81.74%Local transport and logistics 40 000 000 21 218 000 53.05%Assumption of reception and guidance agents 22 800 000 22 800 000 100.00%Reversal of taxes and duties 56 000 000 54 276 423 96.92%Organisation of NTC session 36 000 000 35 588 246 98.86%Financial supports to initiatives, works, NGOs and Tour Promoters 20 000 000 18 850 000 94.25%Sovereignty/ MINETAT 55 000 000 42 000 000 76.36%Honoraria of coaches and monitors and sessions of commissions 20 000 000 15 770 000 78.85%Organisation fees and coach premiums 10 000 000 3 375 000 33.75%Meetings and trainer honoraria (holiday programmes) 5 500 000 5 500 000 100.00%
Assumption of arrears 117 750 000113 434
144
96.33%
Participation fees 14 000 000 0 0.00%Participation fees (Madrid FITUR Fair) 20 000 000 19 300 000 96.50%Participation fees (WTO and ICO Meetings) 20 000 000 17 187 425 85.94%Other participation fees 53 000 000 0 0.00%Control and Collection Visit 7 500 000 2 870 000 38.27%Participation fees to national fairs 20 000 000 19 356 420 96.78%Trainings and seminars 10 000 000 9 997 500 99.98%Other expenses 16 600 000 0.00%
Total 1 250 000 000903 922
682
72.31%
Rate of overrunning of the ceiling authorised by the Finance Law = 0 %
It appears from the above table that the SAF budget was executed at the rate of 106.89 %, higher than that of 2014 which was 106.25%. Regarding expenditures, their execution was 72.31%, higher than that of 2014 which stood at 63.54 %.
III-ACTIVITIES CARRIED OUT UNDER THE SAF IN 2015
The budget executed by the SAF for the development of and support to the touristic activity enabled it to carry out some activities in 2015 with regard to the promotion of domestic tourism, promotion of receptive tourism and promotion of leisure.
A- Promotion of domestic tourism:
The promotion of domestic tourism is to enable Cameroonians to know their country and value it. As such, many promotion activities were carried out:
organisation of journalist visit to « vélo d’Afrique» ; participation to Cameroon Fashion festival ; organisation of the 12th and 13th sessions of the Nation Council of Tourism; participation to Kanga, Ngondo, MGBOR-YANGA, BAKA Dreams Days festivals for the
promotion of tourism, cooking and culture; participation to the CEMAC trans-borders fair; participation to Decentralization and Local Development fair;
Page 30 of 75

participation to SAGO,FIDD and FOTAC fairs; participation to the student’s forum in Buea; realization of photo and video coverage of Centre and East region sites; animation of stand during the second international conference on mining in Cameroon; participation to the agro-food and industry Fair; participation to the beer and gastronomy fair.
B- Promotion of receptive tourism
The promotion of receptive tourism is to awaken desire in foreigners to visit and know Cameroon. During 2015.it was done through four main activities which are:
participation to Expo of Milan, Fitur and Investoul Madrid fairs, and Durban Tourism fair in South Africa;
participation to Moussem Festival at Rabat, Morocco; participation to the Danish travel fair herning show in Denmark; Participation to the 21st edition of the MIT tourism fair.
C-Promotion of leisure activities
The promotion of leisure aims at providing youth and students with healthy and educative leisure on the one hand and at promoting leisure culture in Cameroonian on the other hand.
As such, the main activities below were carried out within the course of 2015:
organisation of pilot holiday camps in two regions of Cameroon (Southwest and Centre) ;
organisation of open-door leisure centres; organisation of strolls for young children in Nanga-Eboko and Ambam ; training of holidays monitors; participation to deaf-mutes to leisure activities.
IV- PROSPECTS IN 2016
In 2016the Special Appropriations Account pursued the following goals:
ensure compliance by establishments with regulations and global standards regarding accommodation and catering;
enhance hotel capacity and services; endow the Ministry of Tourism and Leisure with administrative procedures manual; popularize Cameroon’s potentials; advertise Cameroon through the media and improve the reception of tourist; expand to major international tourism markets; ensure consumption of local leisure products by Cameroonian youths; ensure the credibility of the Ministry of Tourism and leisure at the level of its
partners.
For that purpose, the following activities are envisioned besides those the SAF traditionally carries out:
stepping up of the fight against clandestine activities; multiplication of the sessions of the Tourism Establishments Ranking Commission; capacity-building for tourism sector stakeholders; strengthening of cooperation axis with stakeholders of the tourism sector; reinforcement of Cameroon’s presence in markets; participation in international tourist fairs; organisation of holiday’s activities.
Page 31 of 756. THE SEED FUND

The Seed Fund was established by decree n° 2005/169 of 26 May 2005 of the President of the Republic to implement law n° 2001/014 of 28 July 2001 on seed activity.
Law n° 2014/026 of 23 December 2014 on the Finance Law of the Republic of Cameroon for the year 2015 set the ceiling of the Fund at CFA F 1 000 000 000 (one billion).
Under the said year, the execution of that authorisation appears as follows:
I- EXECUTION OF THE SAF BUDGETA- Execution of revenues
DESCRIPTION Budget forecasts Achievement Execution rateMINFI subventions 1 000 000 000 1 000 000 000 100.00%MINADER subventions 50 000 000 50 000 000 100.00%Fund received from the 3-year emergency plan 300 000 000 300 000 000 100.00%Other revenues 1 419 048 960 140 776 996 9.92%
Total 2 769 048 9601 490 776
996 53.84%Rate of overrunning of the ceiling authorised by the Finance Law = 49.08 %
This additional allocation was obtained in view to enable the Seed Fund acquire class A potatoes whose productivity and resistance to MILDIOU characteristics have been proven.
B- Execution of expenses
Under the Seed Fund, two sub-programmes were established for 2015. The table below shows the main activities carried out and their financial impact.
Programme 001: Improvement of Agriculture fields productivity
ActivitiesBudget
forecasts
ExecutionExecution
rate
Support to the production of potato seeds 574 000 000550 575
000
95.92%
Support to the maintenance/reconstitution of maize stem seeds 30 000 00019 981
277
66.60%
Support to the production of composite seeds certified basic 124 640 00047 322
780
37.97%
Support to the production of maize hybrid seeds 222 460 000 5 452 000 2.45%
Financial support to IRAD for the development of production devices for hybrid maize seeds 100 000 000
100 000 000
100.00%
Support to the production of beans seeds 183 440 00066 715
000
36.37%
Support to the conservation in-situ of high-yield and disease-resistant cassava
Species113 440 000 6 090 000 5.37%
Financial support to the establishment to cocoa parks 25 000 000 0 0.00%Financial support to IRAD for the development of production devices for
plantainbanana plants through in-vitro culturing
49 750 00045 250
000
90.95%
Page 32 of 75

Support to the production of fruit tree seedlings (mangoes and citrus) 384 600 000 4 435 000 1.15%
Support to the rehabilitation of seed farms 40 000 00021 199
465
53.00%
Support to the production of palm tree 243 900 000243 900
000
100.00%
Support to the constitution of guar beans seeds 9 170 000 3 563 977 38.87%Support to the constitution of passion fruit seeds 22 536 960 9 273 739 41.15%Support to the production of Guinea sorrel seeds 16 312 000 3 135 000 19.22%Support to the reconstitution of stem groundnut seeds 5 000 000 410 000 8.20%Support to the constitution yellow-fleshed sweet potato seeds 10 000 000 1 999 436 19.99%Support to the conservation in-situ of sweet banana seeds 20 000 000 0 0.00%
Support to the production and improvement of plant seeds quality 160 000 000130 765
850
81.73%
Total 2 334 248 960
1 260 068 524
53.98%
Programme 002: Support programmeDESCRIPTION Budget forecasts Execution Execution rate
Support to the transaction of the steering committee 30 000 000 5 904 000 19.68%Support to the functioning of the authorizing officer’s office 120 000 000 78 436 438 65.36%Support to the functioning of the technical secretariat 134 500 000 40 303 636 29.97%Support to the national council of seeds and vegetal obtainments 6 900 000 4 900 000 71.01%Support to the functioning of national seed lab and regional labs 41 600 000 26 660 599 64.09%Support to the activities of plant quarantine 9 000 000 4 190 000 46.56%Support to the functioning of inspection technical services 64 900 000 55 513 799 85.54%Support to the functioning of machine pools 10 000 000 0 0.00%Support to financial and related services 17 900 000 14 800 000 82.68%
Total 434 800 000 230 708 472 53.06%
SummaryDESCRIPTION Budget forecasts Execution Execution rate
Programme 001 : Improvement of agriculture fields productivity 2 334 248 9601 260 068
524
53.98%
Programme 002 : Support programme 434 800 000230 708
472
53.06%
Total 2 769 048 9601 490 776
996
53.84%
Rate of overrunning of the ceiling authorised by the Finance Law = 49.08 %
It appears from the tables above that the grain fund budget was executed in revenues 53.84 %, less than in 2014 where the execution rate was 101.54%. As for expenses, their execution was 53.84 %, against 74.95 % in 2014.III- THE SAF ACTIVITIES
The Seed Fund achieved the following in 2015:
Potato seedsThe acquisition of 276 tons of class A potato seeds and distribution thereof to listed seed operators enabled to successfully establish 3 ha of seed farms for a production of more than 1000 tons of certified commercial seeds of potato. Maize seedsThe Seed Fund funded four components with regard to maize seeds production. Beans seeds
Page 33 of 75

The financial supports authorised by the Fund include 80 Ha of seed farms during the first campaign for the production of 25 tons of processed dry bean seeds. Cassava seedsOf 08 Ha of plots for conservation in-situ of 08 selected species of cassava, 04 Ha were actually established and 700 000 cuttings received. CCSP Cocoa SeedIn 2015, the Seed Fund supported the Cocoa and Coffee Seed Programme (CCSP) in the maintenance of its newly established seed farms. Plantain-banana in-vitro plantsThe achievement rate of financial supports for the in-vitro production of 5 000 000 plantain banana plants under the MOU entered into between MINADER and IRAD is 100%. Fruit tree seedlingsUnder the provision of high quality fruit tree seedlings to producers in view of starting the establishment of commercial orchards of fruit trees, 64 000 grafted seedlings of mangoes and citrus were produced within the course of the 2015 campaign. Rehabilitation of seed farmsDuring the 2015 campaign, efforts have been made to spread centres for processing and
packaging of seeds. Financial support to IRAD for the production of pre sprouted palm oil tree seedsCFA F 243 900 000 have been authorised in favour of IRAD under the MOU signed between MINADER and IRAD. Support to the constitution of Guarbeans seedsIn order to enhance the incorporation of cassava flower in the baking of bread in Cameroon, Guarbeans seeds were introduced and constituted in 2015. Passion fruit seeds12 000 plants of 02 species of passion fruit were produced under the supervision of MINADER and enabled the establishment of a 08 Ha lumberyard of passion fruit by 04 listed seed operators. Guinea sorrel seeds700 kg of Guinea sorrel seeds were acquired in 2015 and were subject to selection in view of obtaining Guinea sorrel of red colour calyx. Edible groundnut seedsMINADER officers started the mass selection of edible groundnut seeds from the Adamawa region. Two sequences of many plots were conducted and the purification of these seeds will continue in 2016. Yellow-fleshed sweet potatoThree tubers of three yellow-fleshed sweet potato species (one of each) were imported from Ghana, Burkina Faso and Niger. Those tubers went through all recommended plant quarantine processes before being multiplied. Sweet bananaThis activity which is part of the Seed Fund missions, that is the development and preservation of endangered local seeds, was not carried out for lack of technical expertise. Seed qualityThe Grain Fund supported the National Maize Programme in the acquiring phytosanitary revenues and bags for the packaging of maize seeds produced in the various sites in 2015.
The Special Appropriations Account for the financing of water and sanitation related sustainable development projects was established by decree n° 2001 /216 of 02 August 2001.
The goal the Account pursues is to warrant the financing of sustainable development projects in related to water and sanitation, promote the development of water resources, supplying of drinking water in urban and rural areas, the sanitation of or urban and rural areas and agro-pastoral water.
Page 34 of 75
7. SPECIAL APPROPRIATIONS ACCOUNT FOR THE FINANCING OF WATER AND SANITATION RELATED SUSTAINABLE DEVELOPMENT PROJECTS
I- FUNCTIONING CONDITIONSThe SAF resources essentially come from the proceeds of:
sanitation tax; water sampling royalties; fines and transactions ; contributions from international donors; voluntary contributions; grants and bequests.
Yet the aforementioned decree does not specify expenses eligible under that account.
II- SAF BUDGET EXECUTION
The Law n° 2014/026 of 23 December 2014 on the Finance Law of the Republic of Cameroon for 2015 set the ceiling of the resources of the SAF for the financing of water and sanitation related sustainable development projects at the amount of CFA F 500 000 000 (Five hundred million ).
Under that year, the execution of such ceiling authorised by the Finance Law appears as follows:
Page 35 of 75

A- EXECUTION OF REVENUES
DESCRIPTION Budget forecasts Achievement Execution rateAssigned revenues 500 000 000 491 298 644 98.26%
Total 500 000 000 491 298 644 98.26%Rate of overrunning of the ceiling authorised by the Finance Law = 0 %
B- EXECUTION OF EXPENSES
DESCRIPTION Budget forecasts Execution Execution rateRecurrent 105 125 667 100 712 576 95.80%Investment 394 874 333 272 406 638 68.99%
Total 500 000 000 373 119 214 74.62%Rate of overrunning of the ceiling authorised by the Finance Law = 0 %
It appears from the above tables that the revenues of the budget were executed at 98.26% against an execution rate of 88.23% in 2014. With regard to expenses, the execution rate was 74.62 %, against 88.23% in 2014.
III- SAF ACTIVITIES IN 2015
Generated revenues in 2015 and 2014 the cash surplus enabled to achieve:
water supplies in the Littoral and Centre regions; bore holes in the Centre, Littoral and West regions; supply of potable water to some rural areas of the Centre, Littoral, South and West
regions; the construction of public lavatories in South, Southwest, Littoral and West regions.
IV- PROSPECTS
In a bid to raise more resources, it is envisaged that collection and sensitisation missions be organized for Treasury accountants to ensure compliance with the legal instruments governing the new revenue recording procedures in force in the water sector.
The Special Fund for Forestry Development (SFFD) is a Special Appropriations Account established by Law n°94/01 of 20 January 1994 on forest, wildlife and fisheries regime and implemented by decree n° 96/237/PM of 10 April 1996 which lays down operating procedures thereof.
Also known as the « Special Fund », it is intended to ensure the financing of management, conservation and sustainable development of forest resources.
I- FUNCTIONING CONDITIONS
A- RESOURCES OF THE SPECIAL FUND
Pursuant to the provisions of Sections 9 to 12 of the aforementioned decree of 10 April 1996, the Fund resources consist of:
The share of revenues from:
- annual forest royalties on surface area; - felling tax on forest revenues;
Page 36 of 75
8. SPECIAL FUND FOR FORESTRY DEVELOPMENT
- forest concession transfer tax; - export duties; - export progressive surtax on unprocessed revenues; - sales price of forest revenues; - fines transactions, compensation, auction or mutual-consent sales of products and
seized objects. participation fees from licensees to development works; revenues assigned by law; subventions, contributions, grants and bequests from any natural person or legal entity.
B- EXPENSES OF THE SPECIAL FUND
The expenses of the Special Fund include:
development expenses of non-licensed forest exploitation reserves; regeneration and reforestation cost; forest inventory expenses; delimitation and establishment of infrastructure; equipment needed to carry out forest development inventory; Technical control and monitoring fees of forest development carried out in forest
concessions; extension fees of techniques and research results on concessions; sector survey expenses in forest areas especially on sustainable conservation of
biodiversity; functioning cost of Programme committees, license technical committee, Inter-
ministerial committee for the granting of forest licences; expenses for special fund audit; counterpart funds eventually; state contributions to international bodies ; bonuses to forest administration officer or any other administration officers involved
in crackdown and collection activities, within the limit of the proceeds allotted for that purpose.
II- EXECUTION OF THE SPECIAL FUND BUDGET
Law n° 2013/017 of 16 December 2013 on the Finance law of the Republic of Cameroon of the year 2014 has set the ceiling of SFFD resources at the amount of CFA F 2 000 000 000 (Two billion).
This allocation was executed in compliance with the action plan adopted by the Programme Committee of the Special Fund for the financial year as follows.
I- EXECUTION OF THE SAF BUDGET A- EXECUTION OF REVENUES
DESCRIPTION Budget forecasts Achievement Execution rateSubventions from the State 2 000 000 000 2 000 000 000 100.00%Proceeds from technical services 350 000 000 213 705 225 61.06%Other proceeds and miscellaneous earnings 472 514 910 459 295 897 97.20%
Total 2 822 514 910 2 673 001 122 94.70%Rate of overrunning of the ceiling authorised by the Finance Law = 33.65 %
B- EXECUTION OF EXPENSES
DESCRIPTION Budget forecasts ExecutionExecution
rateSubscription to publications 3 500 000 0 0.00%Legal announcements 20 000 000 11 107 018 55.54%Other expenses 104 200 000 78 594 508 75.43%
Page 37 of 75

Fuel and lubricants 109 800 000 80 290 440 73.12%
Construction of MINFOF stands 500 000 000
500 000 00
0 100.00%Consolidated short-term debts 234 477 447 0 0.00%Maintenance of rolling stock 2 360 000 1 870 189 79.25%Maintenance of rolling stock 1 200 000 1 197 997 99.83%Maintenance of rolling stock 30 000 000 11 767 002 39.22%Printing expenses 3 400 000 1 999 833 58.82%Committee members’ reception expenses 64 820 000 26 982 342 41.63%Rewards and allowances 10 000 000 10 000 000 100.00%Honoraria paid 68 265 377 46 017 092 67.41%Technical and scientific services equipment 54 000 000 37 865 792 70.12%
Domestic missions 357 100 000
198 312 00
0 55.53%
Site reforestation 200 000 000
200 000 00
0 100.00%Acquisition of software for the monitoring of budget and accounting transactions 4 000 000 0 0.00%Other financial expenses 500 000 82 283 16.46%Air tickets 15 000 000 7 648 800 50.99%Cites (Scientific Authority/ANAFOR) 10 000 000 10 000 000 100.00%COMIFAC 30 700 000 30 700 000 100.00%
Printing of the management standards procedures manual 314 996 984
164 996 98
4 52.38%Preparation of end-of –financial year reports 6 500 000 3 169 785 48.77%Plantations maintenance 70 000 000 70 000 000 100.00%Office supplies 75 650 000 46 269 711 61.16%Posts and telecommunications expenses (fax, postal mail) 5 480 000 4 480 000 81.75%Charges related to the use of bank accounts 700 000 228 602 32.66%INBAR-SNV 20 000 000 0 0.00%Recurrent allowances 13 800 000 12 488 230 90.49%
Committee members’ allowances 250 973 302
150 465 62
5 59.95%COMIFAC rent and rental charges 10 500 000 9 000 000 85.71%Office equipment 21 341 800 18 466 063 86.53%Transport equipment 21 250 000 0 0.00%Library equipment and furniture 58 000 000 14 563 346 25.11%Computer equipment 35 000 000 20 775 389 59.36%ITTO 60 000 000 0 0.00%Forest Resources Sustainable Management Programmes
(PSMNR) 10 000 000 10 000 000 100.00%ITTO-Cites Programme 10 000 000 0 0.00%RIGC project (audit) 15 000 000 0 0.00%
Total 2 822 514 910
1 779 339 03
1 63.04%Rate of overrunning of the ceiling authorised by the Finance Law = 0 %
The table below shows that the SAF revenues were executed at 94.7 % against 100% in 2014. Expenses were executed at 63.04% against 83.74 % in 2014.
III-ACTIVITIES CARRIED OUT BY THE SFFD
During the2015 financial year, the SFFD budget enabled to cover « 03 sub-programmes » and carry out the following activities:
support to the planting of forest trees in the ten regions; support to CIGs, associations and chieftaincies;
Page 38 of 75

support to the maintenance of planted forest in the ten regions; forest canopy monitoring; updating of the forest resource utilization plan; approval and follow-up of management plans implementation;
Implementation of the national strategy for forest monitoring; follow-up of forest-related litigation; follow-up of the collection of forest-related revenues; sensitisation on the sustainable management of forest resources; follow-up of community forest activities; printing and the popularization of procedures guide for the attribution and
management standards of community forest; follow-up of the establishment and functioning of peasant committees; popularization of the information brochure on communal forests; follow-up of the implementation of the joint decision on the management of revenues
from forest transactions intended to municipalities and communities; monitoring and evaluation of reforestation activities; organisation of the domestic wood market; building craftsmen’s technical and material capacity; development and mapping of timber processing unit; development of an approval plan for timber by-products; development of the wood-fuel sector; development of non-timber forest products; support to the holding of international conferences on the sustainable development
of forests.
Established by Law n°98/011 of 14 July 1998 to amend and supplement some provisions of Law n°96/07 of 08 April 1996 on the protection of the national road network, the Road Fund, in pursuance of Section 1 of Law n°99/016 of 22 December 1999 on Administrative Public Establishments and Public and Semi-public Companies, is a special Administrative Public Enterprise with regard to its management structures, remuneration and benefits of its staff and accounting rules. Placed under the financial supervisory authority of the Minister in charge of Finance and the technical authority of the Minister in charge of roads, it is governed by decree n°2005/239 of 24 June 2005 to organise and lay down its functioning conditions, as amended and supplemented by decree n°2012/ 173 of 29 March 2012.
Its mission is to ensure that programmes for the protection of the national road network, road safety and accident prevention, maintenance of the road network on the one hand, and road rehabilitation and redesigning on the other hand are funded.
It carries out its missions through two separate and independent counters; the « maintenance » counter and the « investment »counter.
II- FUNCTIONING CONDITIONS
A- THE FUND MANAGEMENT
The Road Fund is managed by two structures, the Management Committee and the Administration.
The Management Committee is responsible for reviewing all issues pertaining to the organisation and functioning of the Fund. It consists of eleven (11) members of which five (5) State representatives, one (1) representative from Regional and Local Authorities and five (05) representatives from road users.
Page 39 of 75
9. ROAD USAGE ROYALTIES(ROAD FUND)

The Fund Administration is chaired by an Administrator recruited following a public call for tender for a three-year term renewable twice. The Administrator is responsible for the implementation of actions decided by the Management Committee.
In this capacity, the Fund has a « maintenance » counter and an « investment » counter whose resources and expenses are provided for in the decrees as follows:
B- THE FUND RESOURCES
The fund resources consist of:For the « maintenance » counter:
road-usage royalties; road toll duties or in the event of road toll concession, the concession royalties budget allocations from ministries intended to supply the emergency line under
emergency interventions; resources from financial proceeds generated through the investment of any eventual
liquidity surpluses; proceeds from axle tax; proceeds from transit tax; proceeds from fines; grants, bequests, subventions and various assistances from Cameroon financial
partners; financial proceeds generated through the ploughing of any eventual liquidity surplus; all other proceeds ensuing from roads and/or road usage allocated to it by the finance
law.For the « investment »counter:
grants, bequests, subventions and various assistances from Cameroon’s financial partners;
budget allocations from ministries.C- THE FUND EXPENSES
The Fund’s expenses consist of:For the « maintenance » counter:
road maintenance work contracts on the long distance priority road network undertaken by private contractors at a rate of at least 58% of the Fund annual budget;
maintenance works on priority urban roads at a maximum budget rate of 12%; maintenance work and equipment on priority rural road at a maximum budget rate of
13.5%; road and geotechnical studies and work monitoring at a maximum budget rate of 6%; road prevention and safety at a maximum budget rate of 4% ; on-going maintenance of fixed and mobile facilities needed to protect the public road
property (rain gates, weighing stations) at a budget rate not exceeding 3%; fund recurrent and capital expenses at a rate not exceeding an annual budget rate of
2.7%; services provided by financial and accounting firms for an amount not exceeding an
annual budget rate of 0.8%.For the « Investment »counter:
expenses incurred on additional recurrent and capital expenses of the « investment countering» for a maximum 0.5% of the annual counter budget;
services specific to « the investment counter » provided by technical, financial and accounting audit firms for a maximum 0.2% of the annual counter budget;
project management and rehabilitation, reinforcement, reconstruction redesigning and suppression work contracts.
III- SAF BUDGET EXECUTION
Page 40 of 75

A- EXECUTION OF REVENUES
DESCRIPTION Budget forecasts Achievement Execution rateTSPP under Road-Usage Royalties 60 000 000 000 60 000 000
000 100.00%Other revenues 4 455 798 825 0 0.00%
Total 64 455 798 825 60 000 000 000 93.09%
Rate of overrunning of the ceiling authorised by the Finance Law = 0 %
B- EXECUTION OF EXPENSES
DESCRIPTION Budget forecasts Execution Execution rateMinistry of Public Works 50 658 615 571 42 900 000 001 84.68%Ministry of Urban Affairs and Housing 9 507 858 254 4 818 333 463 50.68%Ministry of Transport 4 289 325 000 527 545 708 12.30%
Total 64 455 798 825 48 245 879 172 74.85%Rate of overrunning of the ceiling authorised by the Finance Law = 0 %
It appears from these tables that the revenues of the Fund (maintenance counter) budget were executed at a rate of 93.09% against 100 %in 2014. As for expenses, they were executed at a rate of 74.85%, less than 89.98%in 2014.
IV- ACTIVITIES CARRIED OUT IN 2015
The execution of 2015 budget enabled the Fund to complete the following activities:
maintenance works on the classified long distance road network; maintenance works on various urban roads; completion of many road and geotechnical studies; asphalting of many roads; road works in the ten regions of the country; repair works on some engineering works of the priority road network; protection of the road heritage in the ten regions.
V- CHALLENGES AND PROSPECTS OF THE ROAD FUND The environment, in which the Road Fund operates, requires it a serious thinking about
its challenges and its prospects.
With regards to prospects, they mainly include:
The shift towards a second generation Fund, whose management will be more performance-driven.
Challenges of the Fund:
clearance of previous campaigns works under the Ministry of Public Works; development of the TOM2 PRO/FR software intended to upgrade the technical,
accounting and financial monitoring of the Road Fund-funded projects; consuming a higher rate of the PIB; establishment of internally-controlled works which would provide administrations and
Regional and Local Authorities with the relevant means of actions to perform some of their specific and urgent missions;
review of the Law on protection of the Road Heritage for a more effective protection of the national highway system.
Page 41 of 75

The Special Fund for Telecommunications (FST) is governed by decree n° 2012/308 of 26 June 2012 to implement law n° 2010/013 du 21 December 2010 governing electronic communications in Cameroon. Its primary mission is to develop telecommunications in Cameroon.
I- FUNCTIONING CONDITIONS OF THE FST
A- RevenuesPursuant to Section 3 (1) of the aforementioned decree, FST resources come mainly
from: annual contributions from electronic communications service operators not
exceeding3% of their annual pre-tax turnover; State subventions; revenues from the production and printing of the subscribers’ universal directory; budget surplus from the Telecommunications Regulatory Agency (TRA) ; share of entry and renewing duties from the sales and renewing of licenses; grants and bequests.
B- ExpensesIn accordance with Section 5 of the aforementioned decree of 26 June 2012. FST
resources are primarily intended for the financing of: universal service of telecommunications; development of telecommunication and technologies sector; information and communication all over the territory; training and capacity building of human resources in the sector; payment of Cameroon’s contributions in international organisations of the
telecommunications and information and communication technology sector.C- Interventions
The FST activities are carried out through three (03) separate and independent counters:
The universal service counter which mission is to fund projects and pay for services provided in order to supply all citizens with good quality electronic communication service in an on-going manner and at an affordable price;
The electronic communication development counter mission is to fund projects and pay for the various services provided in order to promote and develop electronic communications.
The information and communication technology development counter which mission is the financing of projects from information and communication technology national strategy and from any activity aimed at promoting information and communication technology.
II- SAF BUDGET EXECUTION A- EXECUTION OF REVENUES
DESCRIPTION Budget forecasts Execution Execution rateSubventions paid 54 295 993 978 15 331 963 040 28.24%Other revenues 24 394 993 969 0.00%
Total 54 295 993 978 39 726 957 009 73.167%Rate of overrunning of the ceiling authorised by the Finance Law = 183.76 %
Page 42 of 75
10. SPECIAL FUND FOR TELECOMMUNICATIONS

B- UNDER EXPENDITURE
DESCRIPTIONBudget
forecasts
Execution Execution rate
Study relating to the development of hardware and software 2 477 444 933252 868
929
10.21%
e-Post project management 175 000 000 0 0.00%Study relating to the development of hardware and software 1 663 479 813 34 377 325 2.07%Study relating to the development of hardware and software 99 000 000 2 546 775 2.57%Study relating to the setting up of the e-post transaction
regulatory framework 5 000 000 0 0.00%development of an e-gov website 10 000 000 0 0.00%Eviction compensation 80 000 000 0 0.00%
Construction 1 452 217 816504 853
071
34.76%
Repair and refurbishing of the tele-medicine hall 10 100 000 0 0.00%Implementation of TPCs 92 513 482 61 985 092 67.00%Solar energy acquisition 146 013 196 23 813 308 16.31%Construction/refurbishing and renewing and acquisition of
telephone networks 1 848 334 168 20 629 509 1.12%
Equipment renewal 12 670 193 010815 404
938
6.44%
Purchase of office furniture 172 980 306 0 0.00%
Acquisition of machinery 657 508 692223 000
000
33.92%
Payment of warranty on multimedia machinery 18 170 282 0 0.00%
Acquisition of platform 7 444 321 419399 490
083
5.37%
Purchase of vehicle /monitoring of the urban optic loop programme 24 000 000 0 0.00%
Purchase of supplies and minor equipment 274 083 508 75 143 569 27.42%Acquisition of scientific and technical equipment 324 093 151 32 805 367 10.12%Fuel and lubricants 208 030 000 63 092 360 30.33%Transport expenses 100 000 000 0 0.00%Transport expenses for domestic missions 14 000 000 223 900 1.60%Transport expenses for missions abroad 68 000 000 57 359 505 84.35%Water, power 46 548 005 0 0.00%Maintenance 40 000 000 0 0.00%Maintenance of telecommunication equipment 49 900 000 823 988 1.65%Maintenance, repair of vehicles 37 067 969 15 370 600 41.47%Allowances for domestic mission 139 132 500 59 470 000 42.74%Allowances for mission abroad 145 500 000 66 574 500 45.76%Teachers reception expenses 13 870 000 1 031 778 7.44%
144 200 000 52 964 159 36.73%
Connexion expenses 12 359 909 72012 309 346
166
99.59%
Communication expenses 42 100 000 35 000 000 83.14%Honoraria and allied expenses 322 688 775 76 470 350 23.70%
Training 462 888 600146 426
957
31.63%
Other remunerations and services 1 471 767 9691 471 318
757
99.97%
Committee members’ sitting allowances 1 002 347 500489 805
985
48.87%
Allowances 402 480 000278 917
150
69.299%
Page 43 of 75

Bank charges 100 000 000 0 0.00%
Transfers payable 6 487 447 1696 473 447
169
99.78%
Support to training 16 800 000 6 000 000 35.71%
Total 54 295 993 978
24 062 30
9 26
2
44.32%
Rate of overrunning of the ceiling authorised by the Finance Law = 71.87 %
III- ACTIVITIES UNDERTAKEN BY THE FUND
The expenses incurred by the fund enabled to undertake:
Construction of passive telecommunication facilities in view of the network coverage of border and remote areas (Jabane2. Pic-rio, Akwa, Bamousso) ;
Acquisition, installation and functioning of ENSPT lab equipment; Construction of urban optic loops and project management; Control and monitoring of the national broadband network project; Cameroon’s affiliation to the WACS Consortium; Payment of counterpart funds in view of the setting up of the Public key Infrastructure,
Korean grant; Setting up of an emergency power supply infrastructure at MINPOSTEL.
IV- PROSPECTS OF THE FST FOR 2016
In 2016, the FST aims at the following goals:
mobile network coverage of border and remote areas; connection works of public administrations (funds transfer CAMTEL) ; acquisition of equipment in view to secure government applications (upgrading of the i-
post bank application, supply of toolkits, tokens and securing the i-post) ; GSM mobile telephone network coverage of rural, border and remote areas.
Established by decree n° 2012/309 of 25 June 2012, the Special Fund for Electronic Security Activities « FSE » is under the authority of the Minister in charge of Telecommunications.
The 2015 finance law authorised resources not exceeding CFA F 1 000 000 000 (one billion) for the Special Fund for Electronic Security.
I- EXECUTION OF THE FUND.
Under the said year, the FSE was executed as follows:
A- EXECUTION OF REVENUES
DESCRIPTION Budget forecasts Achievement Execution rate FSE share of licence fees from MTN, ORANGE, VIETTEL 1 000 000 000 1 500 000
000 150.00%Other fees received 0 284 048 0.00%
Total 1 000 000 000 1 500 284 048 150.03%
Rate of overrunning of the ceiling authorised by the Finance Law = 50.03%
Page 44 of 75
11. SPECIAL FUND FOR ELECTRONIC SECURITY ACTIVITIES

B- EXECUTION OF EXPENSES
DESCRIPTIONBudget
forecasts
ExecutionExecution
rate
Production and translation of framework documents 6 475 000 0 0.00%Hiring of a firm to develop the national security policy 192 235 000 0 0.00%Acquisition and installation of imaging and duplication equipment,
software 70 312 000 0 0.00%Acquisition and installation of OCSP module 250 000 000 0 0.00%Purchase of computer and office equipment for the Project in charge of
the policy 4 000 000 4 000 000 100.00%Purchase of computer and office equipment for the committee 11 200 000 10 570 605 94.38%Computer equipment for the Technical Secretariat 6 500 000 6 499 027 99.99%Acquisition of servers, computers and computer equipment DGSN 10 000 000 0 0.00%
Investment 550 722 000 21 069 632 3.83%Purchase of office supply /Committee 5 000 000 4 948 875 98.98%Purchase of office supply /technical secretariat 3 000 000 3 000 000 100.00%Purchase of office supply /monitoring and processing of PSE activity
accountancies 2 000 000 2 000 000 100.00%Purchase of office supply /DGSN 2 000 000 2 000 000 100.00%Purchase of office supply/Project on the policy 5 000 000 3 499 999 70.00%Purchase of office supply (12 seminars) 3 000 000 2 991 863 99.73%Acquisition of antistatic bags/DGSN 4 000 000 0 0.00%Fuel and lubricants/ Committee 2 500 000 2 500 000 100.00%Fuel and lubricants/monitoring and processing of PSE activity
accountancies 1 500 000 1 500 000 100.00%Fuel and lubricants /Project on national security policy 3 000 000 3 000 000 100.00%Mission allowance/Committee 4 000 000 2 520 000 63.00%Food and drinks/ Committee 5 000 000 4 984 645 99.69%Food and drinks /technical secretariat sessions 3 000 000 2 999 853 100.00%Basic supply of services except office and technical supplies 2 000 000 2 000 000 100.00%Allowances of committee members and premiums 60 000 000 60 000 000 100.00%Allowances of technical secretariat members and premiums 35 000 000 34 975 000 99.93%Allowances of committee and secretariat of the policy development
projectmembers and premiums
23 175 000 0 0.00%
Allowances of monitoring committee members (12 seminars) 10 000 000 9 925 000 99.25%Committee and technical secretariat colloquium and seminar expenses 15 500 000 15 500 000 100.00%Outreach seminar for stakeholders in security domain 22 250 000 0 0.00%Restitution seminar on the situational analysis and diagnostics 15 000 000 15 000 000 100.00%Seminar on cyber security and cybercrime 77 415 000 0 0.00%Training of DGSN staff on the use of equipment 13 688 000 0 0.00%Outreach seminar for stakeholders in security domain Douala 22 250 000 0 0.00%
Organisation of twelve seminars 110 000 000110 000
000
100.00%
Functioning 449 278 000283 345
235
63.07%
Total 1 000 000 000304 414
867
30.44%
Rate of overrunning of the ceiling authorised by the Finance Law = 0 %
The revenues execution rate is 150.03% against 30.44% of expenses. For a revenue overrunning of 50.03% and a budget under-execution of 69.56% against the maximum of CFA F 1 000 000 000(one billion) authorised by the Finance Law. I- ACTIVITIES UNDERTAKEN BY FSEThe expenses incurred enabled:
calls for tenders;Page 45 of 75

review and approval of projects; monitoring and evaluation of projects; organisation of capacity-building seminars.
Established by decree n° 2004/110 of 10 May 2004, the SAF for the development of postal activity is placed under the authority of the Minister in charge of posts and telecommunications.
II- SAF BUDGET EXECUTIONLaw n° 2014/026 of 23 December 2014 on Finance Law of the Republic of Cameroon set
the maximum amount of the SAF for the Development of Postal Activity at the sum of CFA F 1000 000 000 (one billion) for 2015.
At the close of the said financial year, the execution of the SAF operations stands as follows: C- EXECUTION OF REVENUES
DESCRIPTION Budget forecasts Achievement Execution rateLevies on postal operators 100 000 000 0 0.00%Entry duties 700 000 000 28 750 000 4.11%Other proceeds from services provided 0 12 379 321 0.00%Subventions received 200 000 000 100 000 000 50.00%Other proceeds 0 212 828 621 0.00%
Total 1 000 000 000 353 957 942 35.40%Rate of overrunning of the ceiling authorised by the Finance Law = 0 %
The above table shows a revenue execution rate of 35.4%, against 120.95% in 2014. With regard to expenses, their execution rate was 35.4%against 81.30%in 2014.
D- EXECUTION OF EXPENSES
DESCRIPTION Budget forecastsExecutio
n Execution rateResearch patents, licenses, trademarks, designs, processes,
models,software 3 000 000 3 000 000 100.00%Studies for the development of an infrastructure development
masterplan 50 000 000 0 0.00%Studies on the remaining works on the Obala post office 15 000 000 0 0.00%Development of standards for addressing and coding 30 000 000 0 0.00%Technical studies for Kribi post-office 5 000 000 4 999 199 99.98%Updating of postal operators’ database 20 000 000 0 0.00%Feasibility studies 25 000 000 0 0.00%Establishment of the addressing log 20 000 000 0 0.00%Construction of the Olembe post-office 55 000 000 0 0.00%Finalisation of the Betare-Oya post-office 75 000 000 0 0.00%Office equipment and furniture 20 000 000 8 999 870 45.00% DIER hardware 5 000 000 4 999 982 100.00%Way panelling and poaching 120 000 000 0 0.00%
Investment 443 000 000
21 999 051 4.97%
Office supplies/postal regulation 10 000 000 9 999 810 100.00%Office supplies/approval review 5 000 000 4 999 509 99.99%Office supplies/legislation drafting committee 1 500 000 1 500 000 100.00%
Page 46 of 75
12. SPECIAL APPROPRIATIONS ACCOUNT FOR THE DEVELOPMENT OF POSTAL ACTIVITY

Office supplies/infrastructure work monitoring 10 000 000 8 060 896 80.61%Office supplies/addressing committee 6 000 000 5 979 581 99.66%Office supplies/Accounting unit 5 000 000 5 000 000 100.00%Office supplies/postal commission 5 000 000 4 699 870 94.00%Office supplies/monitoring and evaluation 5 000 000 4 749 995 95.00%Office supplies/support to stock accounting 4 000 000 0 0.00%Office supplies/celebration of international events 2 000 000 0 0.00%Printing expenses /postal regulation 5 000 000 4 999 023 99.98%Printing expenses/ Cameroon Participation 1 000 000 0.00%Purchase of periodicals and adverts in newspapers 30 000 000 4 999 556 16.67%
video conference bill 15 000 000
15 000 000 100.00%
Purchase of promotional items 2 000 000 0 0.00%Computer consumables 2 000 000 1 999 997 100.00%
Fuel and lubricants/postal regulation 16 000 000
14 700 000 91.88%
Fuel and lubricants/ DIER 15 500 000
13 490 000 87.03%
Fuel and lubricants/Accounting unit 4 000 000 4 000 000 100.00%Fuel and lubricants/Finance control 2 000 000 2 000 000 100.00%
Fuel and lubricants/Cabinet 15 000 000
14 780 000 98.53%
Fuel/Addressing committee 6 000 000 5 042 000 84.03%Staff transport 24 000 000 9 437 900 39.32%
Mission allowances /postal regulation 30 000 000
18 520 000 61.73%
Domestic mission allowances/ DIER 18 000 000
17 440 000 96.89%
Domestic mission / Accounting unit 2 000 000 0 0.00%Domestic mission/monitoring and evaluation 20 000 000 7 120 000 35.60%
Mission abroad 22 000 000
15 235 000 69.25%
Hall rental 1 500 000 1 500 000 100.00%Reception and reception expenses 1 500 000 1 499 649 99.98%Coffee break (operators sensitisation) 4 500 000 4 499 890 100.00%Reception expenses/legislation drafting committee 1 500 000 1 500 000 100.00%Reception expenses/steering committee 5 000 000 3 499 999 70.00%Reception expenses/commission support committee 3 000 000 0 0.00%Reception expenses/monitoring and evaluation committee 2 000 000 0 0.00%Reception expenses/cabinet 5 000 000 4 999 878 100.00%Reception expenses/ Cameroon’s Participation 5 000 000 0.00%Reception expenses/celebration of international events 23 000 000 4 996 575 21.72%Media communication in the 10 regions 10 000 000 9 996 903 99.97%Addressing advert 10 000 000 8 999 690 90.00%
Maintenance of constructions 35 000 000
18 794 623 53.70%
Maintenance of transport equipment 5 000 000 4 999 711 99.99%
Allowances of licensing approval committee members 15 000 000
15 000 000 100.00%
Page 47 of 75

Sitting allowances to legislation drafting committee members 18 000 000
17 968 180 99.82%
Sitting allowances to addressing steering committee members 20 000 000 0 0.00%
Sitting allowances to members of the support committee to the postal
commission 12 000 000
12 000 000 100.00%
Sitting allowances to the monitoring and evaluation committee 7 000 000 0 0.00%Sitting allowances for the celebration of international events 5 000 000 0 0.00%Seminars for the popularization of the legal framework 25 000 000 9 906 098 39.62%Tripartite meeting MINPOSTEL/MINFI/Operators 10 000 000 9 992 738 99.93%Staff retraining seminar 10 000 000 8 051 820 80.52%Postal codes development workshop 30 000 000 0 0.00%Restitution workshop 10 000 000 0 0.00%
Functioning 557 000 000
331 958 891 59.60%
Total 1 000 000 000
353 957 942 35.40%
Rate of overrunning of the ceiling authorised by the Finance Law = 0 %
The 2014 budget of the fund for the development of the postal sector which fall within the framework of the 2015-2017 three-year budget was executed in a context of finalisation of sector strategy of the postal area and of continuation of postal regulation activities.
III- ACTIVITIES UNDERTAKEN BY THE SAFThe expenses incurred enabled:
control of the activities of the public operator; spot review of some operators; finalisation of the sector strategy of the postal domain; sensitisation of private operators on regulation activities.
Page 48 of 75

The SAF for the production of secure transport documents was established under Section 13 of Law n° 2009/018 of 15 December 2009 on the Finance Law of the Republic of Cameroon for the year 2010.
The implementation decree thereof is decree n° 2010 /1886 /PM of 02 July 2010 on the organisation and functioning of the Special Appropriations Account for the production of secure transport documents by the Prime Minister, Head of Government. These instruments were supplemented by instruction-guide N° 026/MINFI/SG/DGTCFM/DT/DER of 06 December 2010 to lay down the functioning conditions of the SAF deposit account opened in the Public Treasury.I- SAF RESOURCES AND EXPENSES
The SAF own resources for the production of secured transport documents consist of issuance fees of the documents below:
A- For maritime transport:
tonnage certificates; crew lists Cameroonian registration deeds; navigation licenses ; circulation cards ; deletion certificates; safety visits; proficiency certificates; seaman’s registration books; sailor’s identity card; provisional authorisations; provisional registrations; seafaring profession approvals.
B- For road transports:
proficiency certificates; national and international driving licenses; car registration certificates; public road transportation cards ; transportation licenses; road transportation profession approvals.
The resources of the Special Appropriations Account provided for in Section 3 of the aforementioned decree are intended for the payment of all services pertaining to the production of secured transport documents, including:
services provided by authorised carriage dealers; project management for the production of secured transport documents; functioning of the account management unit; expertise allowances to marine staff and experts involved in the production of secured
documents pursuant to the regulations in force; performance allowances to support staff from the Ministries of Transports and Finance
involved in the production and collection of revenues.
II- BUDGET EXECUTION
The Law n° 2014/026 of 23 December 2014 on the Finance law of the Republic of Cameroon for the year 2015 set the maximum resources of the SAF for the production of
Page 49 of 75
13. SPECIAL APPROPRIATIONS ACCOUNT FOR THE PRODUCTION OF SECURE TRANSPORT DOCUMENTS
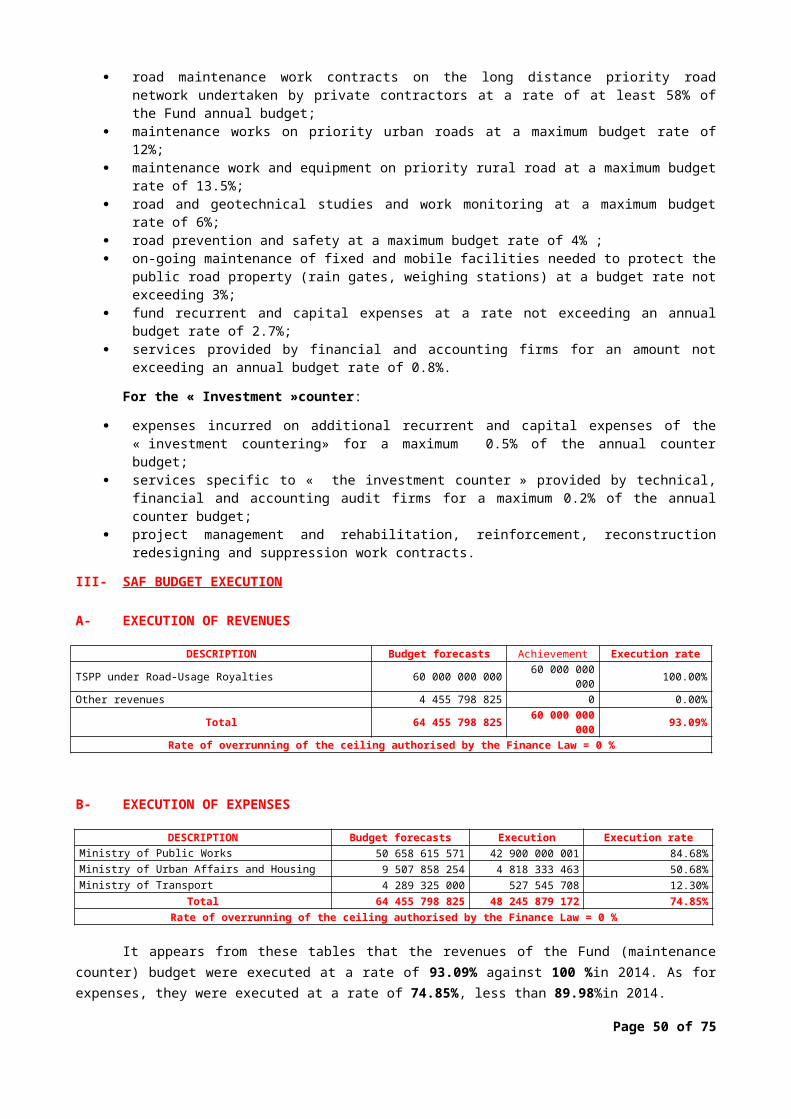
secured transport documents to the tune of CFA F 3 500 000 000(Three billion five hundred million). This allocation was executed as follows:A- EXECUTION OF REVENUES
DESCRIPTION Budget forecasts Achievement Execution rateSecured transport documents 3 500 000 000 3 372 718 993 96.36%
Total 3 500 000 000 3 372 718 993 96.36%Rate of overrunning of the ceiling authorised by the Finance Law = 0 %
B- EXECUTION OF EXPENSES DESCRIPTION Budget forecasts Execution Execution rate
Services provided by ACDs 3 318 750 000 2 761 311 262 83.20%Project Management 70 000 000 69 970 176 99.96%Independent audits 26 250 000 26 249 310 100.00%Functioning of the management unit 26 250 000 26 235 000 99.94%DAMVN allowances 8 750 000 8 750 000 100.00%Performance allowances 50 000 000 50 000 000 100.00%
Total 3 500 000 000 2 942 515 748 84.07%Rate of overrunning of the ceiling authorised by the Finance Law = 0 %
The above tables show the how the Special Appropriations Account for the production of secured transport documents was executed. The revenue execution rate in 2015 is 96.36% against 114.71% in 2014.
Expenses of the Account were executed at a rate of 84.07%. It should be noted that authorised carriage dealers (ACD) bills are submitted quarterly. The expense rate of 84.07%involves bills paid during the first and the second quarters. Third and fourth quarter bills were high and could not be assumed at the risk of exceeding the ceiling.
Revenues
Collections for 2015 show a positive balance of CFA F 3 372 718 993. Assigned revenues were not collected totally because the account « 470 571 » SAF/MINT is not set up in some Pension Offices (RF) like that of Kribi and Bafia etc. which still use class 7 accounts closed since 2011.
Expenses
The total expense amount for 2015 is CFA F 2 942 515 748 as per the above detailed table.
In view to balance the SAF/MINT, the budget ceiling should be increased to CFA F 5 000 000 000 at least with regard to the very high bill amounts submitted by ACDs.
For that purpose, it is appropriate to:
Increase the fees for the stamp to be affixed on secured documents; Reduce the production expenses thereof; Sensitize regional and divisional executive staff from the Ministry of Finance and
Transport in getting effectively involved in document production and more so in securing the assigned revenues collected;
Ensure that intermediate revenue collectors are dispatched all over the territory so as to limit their long stay at the same station, because such long stays may enable them to device strategies to siphon revenues.
Page 50 of 75

The Special Appropriations Account for the royalties paid by autonomous port authorities is lodged at the National Port Authority (NPA, an Administrative Public Establishment established by Law n° 98/021 of 24 December 1998 to organise the port sector and governed by decree n° 99/126 of 15 June 1999.
NPA ensures that the national port policy laid down by the State is implemented. Consequently, it is responsible for the:
planning of national port development; development and monitoring of safety standards and port police according to
modalities specified by special legislation; follow-up of compliance with laws and regulations pertaining to the protection of the
port environment; monitoring of port performances; monitoring of the implementation plan for the reduction of port expenses; participation eventually in negotiations of agreements related to the port domain to
be entered into by the government; drawing-up of the transfer scheme framework and the conditions of Recurrent in the
port.I- FUNCTIONING CONDITIONS
A- NPA resources
Under Section 20 of the aforementioned decree of 15 June 1999.NPA resources consist of:
royalties paid by each autonomous port agency which ceiling is specified by the Finance Law and rate decided by joint decision of the Minister responsible for port matters and the Minister in charge of finance based on NPA objectives and needs;
subventions eventually; grants and legacies; any other resources that may be assigned to it.
B- NPA expenses
Expenses incurred by NPA include recurrent expenses and capital expenditures.
II- BUDGET EXECUTIONThe budget execution appears as follows:
A- EXECUTION OF REVENUES
DESCRIPTION Budget forecasts Achievement Execution ratePort Royalties 2 100 000 000 2 100 000 000 100.00%Revenue from port tariffs approval 5 000 000 1 000 000 20.00%Payment appropriations carried over 199 050 000 199 050 000 100.00%Other revenues 410 635 081 416 268 750 101.37%
Total 2 714 685 081 2 716 318 750 100.06%
Rate of overrunning of the ceiling authorised by the Finance Law = 29.35 %
B- EXECUTION OF EXPENSES
DESCRIPTIONBudget
forecasts
Execution Execution rate
INVESTISSEMENT 1 116 912 349 666 042 21
59.63%
Page 51 of 75
14. ROYALTIES PAID BY AUTONOMOUS PORT AUTHORITIES TO THE NATIONAL PORT AUTHORITY

7Software and licenses 6 000 000 5 783 625 96.39%Architectural studies of NPA headquarters building 65 000 000 0 0.00%Drafting study of the Master Scheme for Waterways Management
andTransaction
17 350 000 0 0.00%
Drafting study of the Master Scheme for Coast Management and Protection 22 100 000 21 350 000 96.61%
Monitoring of the Kribi Deap Sea Port Project 15 000 000 1 260 000 8.40%Monitoring of the Limbe Deap Sea Port Project 3 000 000 0 0.00%Monitoring of the Garoua port activities 1 690 000 0 0.00%Monitoring of infrastructure repair and construction project 8 000 000 300 000 3.75%Other studies and capital expenses 18 500 000 3 775 000 20.41%
Capitalized training courses 126 500 000126 494
007
100.00%
ISPS code application for required investments 12 000 000 3 820 000 31.83%Preparation of national maritime and port days 120 000 000 0 0.00%Updating of port activities transfer scheme framework 5 000 000 0 0.00%Tariffs approval 23 000 000 9 168 450 39.86%Drafting of port activity procedures 2 000 000 0 0.00%Drafting of port security-safety dashboard 2 000 000 0 0.00%Monitoring of the construction project of dry ports and transit
logistic base 3 000 000 0 0.00%Monitoring of Kribi port rehabilitation 3 000 000 0 0.00%Monitoring of port and maritime concessions and activities 47 000 000 21 555 100 45.86%Monitoring of IMO activities 50 000 000 45 820 800 91.64%Monitoring of UNCTAD activities 1 660 000 725 000 43.67%Monitoring of IALA activities 24 910 000 24 909 700 100.00%Monitoring of PMAWCA activities 18 500 000 12 580 284 68.00%Monitoring of IACP activities 20 000 000 19 547 428 97.74%Monitoring of Crane Montana activities 15 000 000 14 279 577 95.20%Monitoring of FAL committee activities 3 340 000 1 740 000 52.10%Rendition of the studies performed 7 500 000 7 500 000 100.00%
Other intangible assets 361 362 349268 607
466
74.33%
Fittings and improvement to buildings 25 000 000 4 178 661 16.71%Fitting of internal road network 2 050 000 0 0.00%Refurbishment of service cars 10 000 000 7 664 886 76.65%Office equipment and furniture 30 310 000 30 300 338 99.97%Communication equipment 2 750 000 1 715 363 62.38%Hardware 23 000 000 22 960 746 99.83%Kitchen equipment and furniture 500 000 0 0.00%Library equipment and furniture, documentation (NPA News, stat
books,reports)
20 890 000 10 005 786 47.90%
RECURRENT 1 597 272 7321 483 038
661
92.85%
Office supplies 50 000 000 49 850 130 99.70%Printing cost of budget and accounting documents 382 732 0 0.00%Documents preparation expenses 400 000 0 0.00%Subscription to various periodicals 2 000 000 1 899 600 94.98%Audio-visual / cabling subscription 3 000 000 2 040 000 68.00%Advert items and fabrics 14 587 500 14 252 815 97.71%Cleaning, laundry and washing materials 500 000 0 0.00%Other materials, products and small equipment 1 000 000 890 000 89.00%Electricity 10 000 000 9 098 647 90.99%Water 1 500 000 550 753 36.72%
Fuel 124 750 000124 747
800
100.00%
Page 52 of 75

Generator fuel 5 390 000 4 677 400 86.78%Pharmaceuticals 500 000 77 275 15.46%Transportation for the Authorizing officer and Board members 500 000 0 0.00%Staff transportation 8 500 000 8 333 653 98.04%Funeral transportation 500 000 0 0.00%Posts and telecommunications 16 500 000 15 462 364 93.71%Mobile phone (MTN, Orange) 8 000 000 7 054 925 88.19%Mailing 1 000 000 0 0.00%Sitting allowance for CIPM members 25 000 000 23 273 931 93.10%Sitting allowances for internal commissions members (inventory and
reform) 15 125 000 14 775 000 97.69%Allowances of performance statement drafting committee members 16 075 000 16 075 000 100.00%Allowances of 2016-20 Performance Project Drafting Committee
members 12 525 000 12 500 000 99.80%Allowances for staff involved in the report on the situation of the
national port Sector
3 000 000 0 0.00%
Allowances for budget drafting committee members 18 375 000 18 375 000 100.00%Mission 63 412 500 63 157 500 99.60%Rents and rental charges 48 000 000 48 000 000 100.00%Honoraria paid and systematic visits 19 700 000 16 789 208 85.22%Security guard expenses 30 710 000 24 362 775 79.33%Reception, reception and snack expenses 22 000 000 20 474 300 93.07%Legal announcements and adverts 10 000 000 7 989 750 79.90%Feasts and ceremonies 29 100 000 29 077 000 99.92%Bookkeeping/Accounting expenses 2 000 000 0 0.00%Maintenance of buildings 10 000 000 5 833 331 58.33%Maintenance of transport equipment 5 000 000 2 941 627 58.83%Maintenance of photocopying machines, air conditioning, electricity 6 000 000 3 305 008 55.08%Maintenance of generator 4 000 000 1 639 687 40.99%Other equipment (telephone equipment) 5 000 000 0 0.00%
Gross basic salaries and Allowances 603 100 000560 861
118
93.00%
Gratuities to staff and various bonuses 47 300 000 45 873 729 96.98%Contributions to the NSIF 30 000 000 29 609 463 98.70%Temporary staff expenses 2 000 000 753 528 37.68%Staff medical coverage and visits and healthcare agreements 52 100 000 52 095 467 99.99%Taxes and levies 58 350 000 51 872 680 88.90%Contributions to national and international associations and bodies 21 500 000 21 451 516 99.77%Authorizing officer’s allowances 2 000 000 649 998 32.50%Fixed allowance for GM conference hall maintenance 240 000 200 000 83.33%Allowances of Board members 40 000 000 33 700 000 84.25%Auditor’s fees 150 000 150 000 100.00%Transport fees (fuel) and accommodation of Directors during board
meetings 7 500 000 3 650 400 48.67%Regulation duties 1 240 000 118 576 9.56%Insurance 22 200 000 19 537 649 88.01%Colloquia, seminars and conferences expenses 22 800 000 22 746 650 99.77%Grants and gifts 10 000 000 9 854 259 98.54%Other miscellaneous expenses 32 760 000 32 745 443 99.96%Other social security expenses (NSIF control and adjustment) 50 000 000 49 663 706 99.33%
Total 2 714 185 0812 149 080
878
79.18%
Rate of overrunning of the ceiling authorised by the Finance Law = 2.34 %
The above tables show a revenue execution rate of 100.06% higher than that of 2014 which stood at 99.29%. So it is for expenses which rate is 79.18% against 76.52%i n 2014.
III- ACTIVITIES UNDERTAKEN BY THE SAF IN 2015
Page 53 of 75

During the 2015 financial year, the NPA programme-budget execution enabled it to undertake many actions broken down as follows:
Programme n° 1: Planning of national port development and monitoring of related structural projects:
participation in the negotiation and drafting of the concession, haulage and mooring agreement at the Kribi port;
participation in the sessions of the special commission of partnership agreements in view of selecting private partners in the management, maintenance and development of the multipurpose container terminal at the Kribi port;
Participation in the sessions of commission of dialogue and short listing for the selection of the private partner responsible for the construction and management of the hydrocarbon terminal at the Kribi port;
issuance of a technical notice on the construction of a floating dock at the Limbe port proposed by the Private Partner;
monitoring of rehabilitation works on dock 51 and the oil mooring dolphin of the Douala port.
Programme n°2: Regularization of port activities, competitiveness and security/safety of Cameroonian ports:
approval of pre-tax prices for haulage and mooring at the Cap Limbo Oil Terminal; review of sanitary and phytosanitary treatment prices at the Douala port. approval of Evaluations and Safety Plans of Port Facilities: Wouri Base,
EBOME/LALOBE, Container Terminal, CNIC dock and base, Dock 52. ALUCAM, Mixed Fruit Terminal, SONARA ;
data updating on Cameroon port facilities under ISPS code, in the GISIS platform of the IMO internet site.
Programme n°3: Enhancement of production means, cooperation and strengthening of the NPA legal and institutional framework:
training in the economic and financial assessment of port projects; Working visit to the United Nations Conference for Trade and Development (UNCTAD)
in order to identify possible areas of cooperation ; Participation at the 19th conference of International Association of Marine Aids to
Navigation and Lighthouse Authorities (IALA) ; Participation in the 65th session of the Technical Cooperation Committee of the
International Maritime Organisation(IMO) ;
IV-PROSPECTS FOR 2016
During the 2016 financial year, the NPA will continue to make the port sector more dynamic, more competitive and safer. This goal which falls in line with the State strategy in the sector is seen as a major component of Cameroon’s development vision by 2035. In effect, Cameroon ports are involved in more than 95% of the external trade and are of significant importance to its economic development. For that purpose, it shall undertake the following activities which fall in line with its performance project for 2013-2015:
monitoring and implementation of the national port master scheme; study and drafting of the waterways management and transaction master scheme; study and drafting of coast management and protection master scheme; monitoring of concessions and port operators; commissioning of the port expenses and tariffs observatory; monitoring of the establishment of a maritime fund intended to fund some
transaction at national level; strengthening of the NPA legal and institutional framework; draft study of a three-year capacity building plan for NPA human resources; cooperation marked by strengthening of partnership with all national and
international organisations and bodies dealing with maritime and port issues.
Page 54 of 75

Page 55 of 75

Page 56 of 75
APPENDIX-VGOVERNMENT’S GENERAL ACCOUNT AS OF 31 DECEMBER
2015

GOVERNMENT’S GENERAL ACCOUNT AS OF31 DECEMBER 2015
Law n° 2007/006 of 26 December 2007 on the Financial Regime of the State established a renovated accounting framework when compared to the former system set up by ordinance n°62/OF/4 of 07 February 1962 on the financial regulations in the Republic of Cameroon.
In fact, Chapter VI thereof relating to State Accounting principles established a patrimonial/assets accounting system which makes extensive use of practices used in companies.
Sections 60 and 63 thereof thus provide as follows:
Section 60- « Government’s performance statements must comply with the rules and be accurate and comprehensive and present a true and fair view of assets, the financial situation. »
Section 63-
« Paragraph 1 The Government’s general accounting system is based on the principle of rights and obligations found in compliance with the general chart of accounts. Transactions are recognized under the year to which they relate, irrespective of their payment or collection date. It is described in the Government’s general account.
Paragraph 2 Rules governing government’s general accounting system only differ from those governing companies’ by virtue of the specificities of its action. »
The patrimonial accounting system thereby provides for the production of a Performance Statement at the end of year as is the case in private organisations, with the only difference that account should be taken of government specificities.
The goal pursued in this contemporary dynamics prescribed by international standards and norms pertaining thereto, IPSAS (International Public Sector Accounting Standards) and CEMAC directives, is to enable inter alia, a better State management strategy through the mastery of the trends in its properties and financial holdings, a better decision support tool on the financing of public policies, the promotion of transparency culture through the publication of thorough financial data, the setting up of a streamlined chain of control and audit and increased confidence of investors in Government’s signature.
It is therefore in a bid to meet this requirement that prior to the integral shift to the accrual accounting system, that the government’s general account is produced on an experimental basis since 2010.
With regard to the outline thereof, it should be noted that the CEMAC Directive N 03/11 – UEAC – 195 – LM -22 of 19 December 2011 relating to the State Chart of accounts adopted by the CEMAC council of Ministers has provided in its Section 7 that « Government’s general account includes the trial balance and the performance statements. »
Chapter IV of the same Directives, focusing on accounting and performance statements has provided that performance statements shall include the net position chart or balance sheet, performance statement, cash flow chart and attached statement.
In compliance with these directives, this Government’s general account which comes along with the trial balances as of December 2015 respectively include for the same period:
- provisional balance sheet,Page 57 of 75

- Performance statement,- Cash-flow chart.
The balance sheet shows a net position of CFA F 2 590.05 billion as of 31 December 2015 obtained by subtracting the total liability less net position of CFA F 6 110.86 billion from the total assets of CFA F 8700.91billion. This net position is made up 2015 financial result of CFA F 835.90 billion and previous years carried forward financial results totalling CFA F 1754.15 billion.
Notwithstanding, it should be emphasized that this is merely provisional since some heads such as the fixed assets will be exhaustive only upon completion of the physical inventory of State property assets.
The performance statement shows State financial transactions in terms of revenues and expenditure. The balance of the transactions for the year is positive by CFA F 835.90 billion obtained by subtracting the expenses worth CFA F 2 310.33 billion from revenues of CFA F 3 146.23 billion. With regard to the State specificity, it is displayed in three main items: net recurrent expenses, net intervention expenses and net financial expenses.
The cash-flow chart analyzes the change in Cash flow by discriminating between flows from activities and flows from financing. The analysis of this table as of 31 December 2015 shows a positive balance of CFA F 911.11 billion obtained from the difference between the collection of CFA F 3 146.23 billion from activities and CFA F 2 235.12 billion of disbursement related to activities.
Section 26 of CEMAC Directive N 03/11 – UEAC – 195 – LM -22 of 19 December 2011 relating to the State Chart Accounts provides that: « The net position chart or balance sheet shows State assets and liability. It separately discloses:
- on the assets side: the fixed assets, the current assets less Cash flow, the Cash flow and assets adjusting accounts,- on the liability side: financial debts, non-financial debts (less Cash flow), reserves for possible losses, liability cash flow and liability adjustment accounts ».
The contexture of the net position chart is provided for in Tome 1 of the didactic guide of the State Chart of Accounts. It provides that « the format of the net position chart or balance sheet is a specificity that takes into account the fact that the latter does not have equity and summarizes assets and liability items in the form of a single entry table ».
The positioning of carry forward and the year financial result (net position) at the bottom of the table is explained by the fact that, contrary to private enterprises, The State does not have equity. Likewise, it is more important asset which is its capability of raising taxes cannot be assessed.
That is the substance of the performance statements for the Year 2015 as described in the lines that follow.
I - STATE PROVISIONAL BALANCE SHEET AS OF 31 DECEMBER 2015 (Period from 01/01/2015 to 31/12/2015) (in billion of CFA F)
DESCRIPTION YEAR 2014 YEAR 2015FIXED ASSETS (I) 5 216.80 6 111.79
Page 58 of 75

Intangible fixed assets 459.38 513.62Tangible fixed assets 3 119.87 3 653.39Financial fixed assets 1 637.55 1 944.78NON-CASH CURRENT ASSETS (II) 1 005.74 1 175.88Taxes and Duties 810.50 957.52Customs 195.24 218.36State Properties 0.00 0.00Revenue clearance vouchers 0.00 0.00Bad debts 0.00 0.00Stock of inactive values 0.00 0.00CASH FLOW ASSETS (III) 457.27 431.16Cash in bank 362.54 409.39Cash at hand 19.67 20.90Cheques drawn and transfer for Cash 75.06 0.87DEFERRED CHARGES AND ACCRUED INCOME (IV) 328.69 316.05Expenses to be adjusted 170.18 172.60Court claims 0.22 219.75Rejects 0.02 0.05Rejection of postal files and cheques 0.00 3.85Bonuses on sale of stamp 158.13 3.23Sundry debtors 0.14 -137.21Other expenses to be budgeted 0.00 53.78ADJUSTMENT ACCOUNTS (V) 227.56 666.03Remittance of funds 0.00 321.65Suspense accounts 227.56 344.38TOTAL ASSETS VI=(I+II+III+IV+V) 7 236.06 8 700.91FINANCIAL DEBTS (VII) 3 487.38 4 241.20Domestic debt 926.98 838.50External debt 2 560.40 3 402.70NON-FINANCIAL LESS CASH DEBTS (VIII) 434.53 625.41Recurrent debts of which: 137.56 164.91Salaries 11.63 11.24Pension 14.77 16.37Other staff expenses 8.81 11.69Goods and services 102.35 125.61Capital debts of which: 215.41 372.42Investment 171.83 292.89Participation 19.06 27.66Restructuring and rehabilitation 2.55 1.51Counterpart funds 21.97 50.36Intervention debts of which: 81.56 88.08Current transfers 58.84 62.69Regional and Local Authorities transfers 16.81 18.11Subventions 5.91 7.28LIABILITIES (IX) 994.33 1 227.27Administrative Public Establishments Financial Services 569.69 625.51Regional and Local Authorities Financial Service 18.55 27.62Public Administrations Financial Service 85.70 106.62Expenditure file to be adjusted 23.31 28.70Other Financial services (misc deposits) 297.08 317.82Advances from BEAC 0.00 121.00ADJUSTMENT ACCOUNTS (X) 67.02 16.98Remittance of funds 0.00 0.01Suspense accounts 67.02 16.97TOTAL LIABILITY LESS NET POSITION (XI=VII+VIII+IX+X) 4 983.26 6 110.86Carry forward from previous years -1 060.87 -1 559.49Carry forward (Results from 2010 to 2014) 2 422.29 3 313.64Result for the financial year 891.35 835.90NET POSITION (XII=VI-XI) 2 252.80 2 590.05
Page 59 of 75

TOTAL LIABILITY (XIII=XI+XII) 7 236.06 8 700.91
Total State balance sheet as at the end of December 2015 is CFA F 8 700.91 billion. The difference between assets and liability the balance sheet less net position enables to specify the State net position. Such position posts a surplus of CFA F 2 590.05 billion as of 31 December 2015.
Year result is CFA F 835.90 billion against CFA F 891.35 billion in 2014for an increase in the State assets by CFA F 55.45 billion. Yet such increase should be considered with caution because it includes neither amortisements nor reserves.
This result cannot be regarded as surplus to be assigned such as perceived in corporate accounting (dividends, increase in capital, reserves). But, it is carried forward to be reconciled with that of the YearN-1and allow forming an opinion on the increase or decrease of State assets.
A summary presentation of the balance sheet groups the main assets and liability headings together as shown in the simplified balance sheet below.
I - 1 –STATE PROVISIONAL SIMPLIFIED BALANCE SHEET AS OF 31 DECEMBER 2015
(Period from 01/01/2015 to 31/12/2015) (in billion of CFA F)
DESCRIPTION 2014 YEARFIXED ASSETS (I) 5 216.80 6 111.79CURRENT ASSETS LESS CASH FLOW (II) 1 005.74 1 175.88CASH FLOW-ASSETS SIDE (III) 457.27 431.16ADJUSTING ACCOUNTS-ASSETS SIDE (IV) 328.69 316.05ADJUSTING ACCOUNTS (V) 227.56 666.03TOTAL ASSETS VI=(I+II+III+IV+V) 7 236.06 8 700.91FINANCIAL DEBTS (VII) 3 487.38 4 241.20NON FINANCIAL DEBTS LESS CASH FLOW (VIII) 434.53 625.41Recurrent debts 137.56 164.91Capital debts 215.41 372.42CASH FLOW-LIABILITY SIDE (IX) 994.33 1 227.27ADJUSTING ACCOUNTS (X) 67.02 16.98TOTAL LIABILITY LESS NET POSITION (XI=VII+VIII+IX+X) 4 983.26 6 110.86NET POSITION (XII=VI-XI) 2 252.80 2 590.05TOTAL LIABILITY (XIII=XI+XII) 7 236.06 8 700.91
I - 2 –BALANCE SHEET – ASSETS SIDEThe assets side of the balance sheet includes fixed assets, current assets less Cash flow,
Cash flow– assets and adjustment accounts-assets. Inventory accounts are not included because the State does not keep inventory booking yet.
Fixed assets
It is estimated at a total amount of CFA F 6 111.79 billion and divided in intangible fixed assets worth CFA F 513.62billion, tangible fixed assets worth CFA F 3 653.39 billion and financial fixed assets worth CFA F 1 944.78 billion. Yet, such fixed assets should be viewed with caution because they are not exhaustive since they only cover the period from2003 to 2015. Till date, these data are the only one available in the Treasury services database.
In order to have more reliable data on opening balance sheet, it is essential that all State fixed assets be physically identified and valued. With regard to the magnitude of such task (identification to be carried out in all the ministries), this cannot be completed in a single year. It would take many years to be completed. It therefore implies the production of a provisional fixed assets statement as it is the case this year that will be updated annually.
Page 60 of 75

Besides, the above mentioned amount of CFA F 6 111.79billion corresponds to the gross value and not to the net value that should result from amortisations due to the depreciation of goods acquired then. By memorandum N° 11/256NS/MINFI/SG/DGTCFM/DT of 02 August 2011, the Minister of Finance established a committee which responsible for the setting up of accrual-based accounting in Cameroon. The work of such committee will certainly enable to bring a solution to the above mentioned insufficiencies and concerns.
Financial fixed assets.
They consist of fixed assets on counterpart funds, securities and investments, non-distributed fixed assets and capital transfers. They globally stand at the amount of CFA F 1 944.78 billion.
Distribution of State financial fixed assets (in billion of CFA F)DESCRIPTION Amount Rate
Fixed assets on Counterpart funds 624.88 32.13%Securities and investments 211.15 10.86%Non-apportioned fixed assets 60.73 3.12%Capital transfers 1 048.02 53.89%
Total 1 944.78 100.00%Financial fixed assets (in billion of CFA F)
Fixed assets on Counterpart funds
Securities and investments
Non-apportionedfixedassets
Capital transfers
0.00 200.00 400.00 600.00 800.00 1,000.00 1,200.00
624.88
211.15
60.73
1,048.02
The above shown tangible, intangible and financial fixed assets appear as follows in the table of State fixed assets as of 31 December 2015.I - 2 – 1- TABLE OF STATE FIXED ASSETS AS OF 31 DECEMBER 2015(in billion of CFA F)
LIBELLE YEAR 2003 A 2014 YEAR 2015 TOTAL
FIXED ASSETS 5 216.80 894.99 6 111.79INTANGIBLE FIXED ASSETS 459.38 54.24 513.62PATENTS, LICENSES AND OTHERSTUDIES 459.38 54.24 513.62Patents, licenses, processes and models 2.07 0.50 2.57Studies 455.43 53.74 509.17Human resources capacity-building 1.87 0.00 1.87Other INTANGIBLE FIXED ASSETS 0.01 0.00 0.01TANGIBLE FIXED ASSETS 3 119.87 533.52 3 653.39LANDS 32.04 3.95 35.99Acquisitions, constructions, land sales 2.63 0.85 3.48Compensation for expropriation 29.41 3.10 32.51REAL
ESTATE/WORKS/ACQUISITIONS/REFURBIS3 087.83 529.57 3 617.40
Page 61 of 75

HING.Land development 181.92 59.35 241.27Acquisitions or sales of real estates 15.27 0.66 15.93Construction, expansion and rehabilitation of buildings 693.38 101.21 794.59Renovation and major maintenance of buildings 94.92 10.48 105.40Purchase, installation and renovations of building
equipment 137.31 26.56 163.87Roadways and networks, engineering works,
infrastructureworks
1 045.38 155.79 1 201.17
Purchase/sales of office equipment and furniture 54.61 4.11 58.72Acquisition and renovation / or sales of machinery andequipment 673.67 151.84 825.51Acquisition and renovation / or sales of transportationmachines 190.87 19.47 210.34Other tangible fixed assets 0.50 0.10 0.60FINANCIAL CAPITAL ASSETS 1 637.55 307.23 1 944.78CAPITAL ASSETS ON COUNTERPART FUNDS 490.43 134.45 624.88Capital assets on counterpart funds in actual expenses 360.33 125.52 485.85Capital assets on counterpart funds in taxes and duties 130.10 8.93 139.03SECURIIES AND INVESTMENTS 208.56 2.59 211.15Investment in public enterprises 77.99 0.00 77.99Investment in private/public financial institutions 100.28 2.59 102.87Investment in private enterprises or (SPE) 29.18 0.00 29.18Investment in public/private companies 1.11 0.00 1.11Privatisations 0.00 0.00 0.00NON-DISTRIBUTED CAPITAL ASSETS 60.59 0.14 60.73Capital expenditure not committed on public procurement 0.20 0.00 0.20Capital expenses on carry forwards 0.85 0.00 0.85Capital expenses on non-identified EXFIN to be assigned 0.44 0.00 0.44Capital expenses for humanitarian interventions to be
divided 0.44 0.00 0.44Non identified capital assets to be divided 58.66 0.14 58.80CAPITAL TRANSFER 877.97 170.05 1 048.02Capital transfer to local communities 57.45 5.23 62.68Capital transfer to States-owned enterprises 19.27 0.00 19.27Capital transfer to EPA and other public bodies 615.99 109.23 725.22Other capital transfers to other administrative units 38.52 26.05 64.57Capital transfer to non-financial private enterprises 1.60 0.00 1.60Capital transfer to bank institutions 11.71 0.00 11.71Capital transfer to micro-finance institutions 1.22 0.08 1.30Capital transfer to other financial institutions 0.48 25.21 25.69Capital transfer to other administrative units 31.32 0.00 31.32Capital transfer to NGOs and associations 84.51 2.78 87.29Capital transfer to cultural and sport institutions 0.17 0.00 0.17Parliamentarian micro-projects 13.17 1.44 14.61Other capital transfer to households 1.53 0.00 1.53Other transfer to households 1.03 0.00 1.03Capital transfer to private schools 0.00 0.00 0.00Capital transfers to non-financial enterprises 0.00 0.00 0.00Capital transfers to other non-profit institutions 0.00 0.00 0.00Capital transfers to international organisations 0.00 0.03 0.03TOTAL GENERAL 5 216.80 894.99 6 111.79
The capital expense portfolio moved from CFA F 5 216.80billion in 2014 end to CFA F 6 111.79 billion 2015 end, for an increase of CFA F 894.99 billion.
Yearly distribution of capital expenses from 2003 to 2015 (in billion of CFA F)03 04 05 06 07 08 09 10 11 12 13 14 15 Total
115.5 135.9 206.3 208.3 340.8 452.7 418.2 584.6 505.0 736.0 765.1 748.4 894.9 6 111.79
Page 62 of 75

Yearly trends in capital expenses from 2003 to 2015 (in billion of CFA F)
Year 2003 Year 2004 Year 2005 Year 2006 Year 2007 Year 2008 Year 2009 Year 2010 Year 2011 Year 2012 Year 2013 Year 2014 Year 20150.00
100.00
200.00
300.00
400.00
500.00
600.00
700.00
800.00
900.00
1,000.00
The current assets (less Cash flow)is the amount owed by third parties to the State and it stands at the total sum of CFA F1 175.88 billion divided among outstanding amounts to be recovered on taxes and duties, customs, worth respectively CFA F 957.52billion and CFA F 218.36billion.They are divided as shown in the table below.I - 2 – 2- TABLE OF FLOATING ASSETS (non-financial) AS OF 31 DECEMBER 2015
(in billion of CFA F)DESCRIPTION AMOUNT Rate
Taxes and Duties 957.52 81.43%Customs 218.36 18.57%State property 0.00 0.00%Revenue clearance vouchers 0.00 0.00%
Total 1 175.88 100.00%
Current assets in relative values
81.43%
18.57%
Taxes and DutiesCustomsState propertyRevenue clearance vouchers
Page 63 of 75

The adjusting accounts–assets side: They consist of non-audited accounts under the supplemental period of 2015; that is as of 28 February 2015. Their grand total is CFA F 316.05 billion, and it is divided among expenses to be adjusted, Court fees, disallowances, discounts on stamp sales, miscellaneous debtors and other spending to be budgeted among which third parties debts towards the Public Treasury.
Distribution of accounts to be adjusted-assets side (in billion of CFA F)DESCRIPTION Amount Rate
Expenses to be adjusted 172.60 54.6%Court fees 219.75 69.5%Rejects 0.05 0.0%Rejection of postal files and cheques 3.85 1.2%Bonuses on sale of stamps 3.23 1.0%Various debtors -137.21 -43.4%Other miscellaneous expenditure to be budgeted 53.78 17.0%
Total 316.05 100.0%Adjusting accounts (in billion of CFA F)
54.6%
69.5%
0.0%
1.2%
1.0%
-43.4%
17.0%
Expenses to be adjusted
Court fees
Rejects
Rejection of postal files and cheques
Bonuses on sale of stamps
Various debtors
Other miscellaneous expenditure to be budgeted
Adjustment accounts. The grand total of adjusting accounts moved from CFA F 227.56billion in 2014 to 666.03 billion in 2015.for an increase of CFA F 438.47 billion.
I - 2 – 3-CASH FLOW-ASSETS SIDE AS OF DECEMBER 2015 Cash flow-Assets side: The total amount of Cash flow on assets side is CFA F
431.16 billion and consists of Cash at bank of CFA F 409.39 billion, Cash in hand of CFA F 20.90 billion and negotiable instruments to be collected of CFA F 0.87 billion. It appears from bank statement and minutes of cash control that CFA F 603.21billion were collected whereas the amount appearing on the trial is CFA F431.16 billion, for a deviation of CFA F 172.04 billion.
Distribution of Cash accounts as of 31 December 2015 (in billion of CFA F)
Nature Amount on trialActual
amount
DeviationRate
V CASH AT BANK 409.39 582.31 -172.91 96.53%Treasury current account at BEAC 2.62 2.62 0.00 0.43%Treasury current account at BEAC) /HIPC 0.27 0.27 0.00 0.04%CCP account 1.61 1.61 0.00 0.27%Other accounting office accounts abroad 15.72 15.72 0.00 2.61%Investment at BEAC in Cameroon 97.15 97.15 0.00 16.10%Reserve account-VAT 379.40 0.00 379.40 0.00%Reserve account-Debt -193.68 0.00 -193.68 0.00%Road Fund Account - BEAC -72.69 0.00 -72.69 0.00%
Page 64 of 75

Bilateral French C2D:HIPC 163.75 0.00 163.75 0.00%Multilateral debt relief initiative 0.86 0.86 0.00 0.14% PSFE account 0.02 0.02 0.00 0.00%Treasury-Bond issue special deposit 0.00 0.00 0.00 0.00%Special Account-Bond issue amortization 0.00 0.00 0.00 0.00% Special Account–2013-2018 bond issue
amortization 0.00 0.00 0.00 0.00%Treasury-2014-2019Bond issue special deposit 14.36 14.36 0.00 2.38%Special Account – 2014-2019 bond issue
amortization 0.00 0.00 0.00 0.00%SpecialDeposit2015-2025 CameroonEurobonds 0.00 449.70 -449.70 74.55% NEGOTIABLE INSTRUMENTS FOR
COLLECTION 0.87 0.00 0.87 0.00%CASH 20.90 20.90 0.00 3.46%
Total 431.16 603.21 -172.04 100.00%
* Source actual amounts of bank statements as of December 2015 ending). Cash flow-asset side- actual amounts (in billion of CFA F)
Treasury current account at BEAC
Treasury current account at BEAC) /HIPC
CCP account
Otheraccounting office accounts abroad
Investment at BEAC in Cameroon
Reserve account-VAT
Reserve account-Debt
Road Fund Account - BEAC
Bilateral frenchC2D:HIPC
Multilatteraldebt relief initiative
PSFE account
Treasury-Bond issue special deposit
Special Account-Bond issue amortisation
Special Account–2013-2018 bond issue amortisation
Treasury-2014-2019Bond issue special deposit
Special Account – 2014-2019 bond issue amortization
SpecialDeposit2015-2025CameroonEurobonds
Negotiable instruments for collection
Cash
0.00 50.00 100.00 150.00 200.00 250.00 300.00 350.00 400.00 450.00 500.00
2.62
0.27
1.61
15.72
97.15
0.00
0.00
0.00
0.00
0.86
0.02
0.00
0.00
0.00
14.36
0.00
449.70
0.00
20.90
I – 3 –BALANCE SHEET – LIABILITY SIDEThe liability side of the balance sheet consists of four items respectively: financial debts,
non-financial debts, suspense accounts and Treasury liabilities. Financial debt: To the tune of CFA F 4 241.21 billion, it is divided into domestic debt
worth a total of CFA F 838.52 billion and an external debt of CFA F 3 402.69 billion. It moved from CFA F 3 487.38 billion in 2014 to CFA F 4 241.21 billion in 2015, showing
an increase by CFA F 753.83 billion.
The total amount of the State debt stock appears as detailed in the table below:I – 3 - 1 – TABLE OF PUBLIC DEBT STOCK AS OF 31 DECEMBER 2015Debt stock (in billion of CFA F)
Nature Amount I - EXTERNAL PUBLIC DEBT: 3 402.69Multilateral debt 1 005.57Bilateral debt 1 784.22Commercial debt 612.90II – DOMECTIC PUBLIC DEBT: 838.52A –Government Securities 294.65 - CTB 74.65 - 2-YEAR CTB 2013+2014 (10 billion) 10.00 - Bond Issues ECMR 5.6% net (residents) 2010 0.00 - Bond Issues ECMR 5.9% net (residents) 2013 60.00 - Bond Issues ECMR 5.5% net (residents) 2014 150.00
Page 65 of 75

B –Structured debt 429.91 B1 –Structured bank debt 192.83 B1-1 Securitized bank debt 86.36 B1-2 Thermal Emergency Programme (PTU1) 6.19 B1-3 – ECOBANK 35.24 - SIC-COFFOR 0.24 - EMERGENCY PLAN 35.00 B1-4 – BGFI 6.41 - EMERGENCY PLAN 5.11 - SONARA 0.00 - PROMOTE 1.30 B1-5 - CREDIT FONCIER 58.62 - LOW-COST HOUSING 22.81 - SIC STATE HEADQUARTERS 35.81 B1-6- BAC 0.00 - EMERGENCY PLAN 0.00 B2 –Structured non-bank debt 237.09 B2-1 –Securitized debt 157.67 -ASAC securitized debt 0.00 -Debt offset and securitized PTB 23.38 -Financial dues and entitlements former CAMAIR (16/09/08) 0.51 - SONARA 133.78 B2-2 –Non-securitized debt 79.42 -Non-securitized B.T.P debt 2.34 B2-3 – Debt towards Public and Semi-public enterprises 77.07 - BENEFICIAL (priva.SOCAR) 0.28 - SCDP 0.20 - CNPS 74.92 - Other conventions 1.67 C.UNSTRUCTURED DEBT 113.96 . Commercial debt (not authorised for payment) 28.16 . Rent (not authorised for payment) -2.32 . Compensation and expropriations -1.15 .Recapitalization of CAMPOST ( Postal Debt) 5.78 .Court emoluments -1.07 .Social debt 1.07 . Lease debt (credit advice notice) 1.80 .Compensations (outstanding at Treasury) 0.50 .ONADEF 0.54 .CHU 0.35 .Higher education lecturers debts 0.00 .Lecturers session bonuses 6.00 .Compagnie Nationale de Réassurance (CNR) 0.00 .SODECAO 0.35 .SUBVENTIONS 0.15 .CONTRIBUTIONS 0.90 . Counterpart funds 0.51 .Pecuniary debts (fines) 0.00 .Correspondents (Municipalities and APE) 0.03 . Diplomatic mission debts 6.63 . Arrears in memory 9.85 .Salary debt (fractions) 0.79 .Liquid assets 0.79 .Pensioners 0.16MISCELLANEOUS 54.15
TOTAL 4 241.21Source: CAA
Debt stock of 2013 and 2014 (in billion of CFA F)
Page 66 of 75

Year 2014 Year 20150.00
500.00
1,000.00
1,500.00
2,000.00
2,500.00
3,000.00
3,500.00
4,000.00
4,500.00
2,560.40
3,402.69
927.00
838.52
Domectic public debtExternal public debt
Non-financial short-term debts: They moved from CFA F 434.53billion in 2014 to CFA F 625.41billion in 2015,corresponding to an increase of CFA F 190.88 billion when compared to the 2014 financial year. They are divided into recurrent debts worth CFA F 164.91 billion, investment debts of CFA F 372.42billion and intervention debts worth CFA F 88.08 billion.
I – 3 – 2 –TABLE OF NON-FINANCIAL DEBTS AS OF 31 DECEMBER 2015 (in billion of CFA F)
DESCRIPTION Year 2014 Year 2015 deviationRecurrent debts of which: 137.56 164.91 27.35Payments 11.63 11.24 -0.39Pensions 14.77 16.37 1.60Other Staff expenses 8.81 11.69 2.88Goods and services 102.35 125.61 23.26Capital debts of which: 215.41 372.42 157.01Investment 171.83 292.89 121.06Participation 19.06 27.66 8.60Restructuring and rehabilitation 2.55 1.51 -1.04Counterpart funds 21.97 50.36 28.39Intervention debts of which 81.56 88.08 6.52Current transfers 58.84 62.69 3.85Transfers to Regional and Local Authorities 16.81 18.11 1.30Subventions 5.91 7.28 1.37
Total 434.53 625.41 190.88
2014 and 2015 non-financial debts (in CFA billion)
Page 67 of 75

Recurrent debts of which
Capital debtsof which
Intervention debts of which
0.00 50.00 100.00 150.00 200.00 250.00 300.00 350.00 400.00
137.56
215.41
81.56
164.91
372.42
88.08
Year 2015Year 2014
Liabilities: It consists of financial services provided by the Public Treasury to the typical Treasury correspondents the Administrative Public Establishments, Regional and Local Authorities, central administrations, individuals, expenditures files to be adjusted, advances received. The various commitments to be fulfilled by the Public Treasury in favor of these various depositors and correspondents stand at a grand total amount of CFA 1 227.27 billion as of 31 December 2015.
Distribution of Liabilities (in CFA billion)DESCRIPTION AMOUNT Rate
Financial Services of Administrative Public Establishments 625.51 51.0%Financial Services of Regional and Local Authorities 27.62 2.3%Financial Services of Public Administrations 106.62 8.7%Expenditure files to be adjusted 28.70 2.3%Other financial services (Misc. deposits) 317.82 25.9%Advances from BEAC 121.00 9.9%
Total 1 227.27 100.0%
Cash-flow-Liability side (in billion of CFA F)
Financial Services of Administrative PublicEstablishments
Financial Services of Regional and Local Authorities
Financial Services of Public Administrations
Expenditure files to be adjusted
OtherFinancial services (Miscdeposits)
Advances from BEAC
0.00 100.00 200.00 300.00 400.00 500.00 600.00 700.00
625.51
27.62
106.62
28.70
317.82
121.00
The suspense account: It consists of transactions awaiting final allocation of an amount of CFA F 16.98 billion.
Page 68 of 75

II- STATE PERFORMANCE STATEMENT AS OF 31 DECEMBER 2015 (Period from 01/01/2015 to 31/12/2015)
Section 27 of the CEMAC Directive N 03/11 – UEAC – 195 – LM -22 of 19 December 2011 relating to the State chart of accounts: « The annual Performance Statement shows revenues and expenses. Expenses are classified according to whether they entail recurrent, intervention and financial transactions. The difference between revenues and expenses enables ascertainment of the financial result of the financial year ».
With regard to the abovementioned provisions, the Performance Statement as of 31 December 2015 is presented as follows:(in billion of CFA F)
DESCRIPTION YEAR 2014 YEAR 2015
RECU
RREN
T EX
PEN
SES
AND
PRO
DU
CTS
Goods and services 655.46 574.95Staff expenses 835.99 900.54Taxes and Duties 29.74 126.83Total direct recurrent expenses (I) 1 521.19 1 602.32Subventions to public services 109.93 158.13Total indirect recurrent expenses (II) 109.93 158.13Total recurrent expenses (III=I+II) 1 631.12 1 760.45Sales of revenues and provision of services 34.29 175.65Taxes and Levies 1 291.79 1 421.61Customs revenues 795.92 847.77Other revenues 38.97 25.76Total excluding oil revenues (IV) 2 160.97 2 470.79Oil revenues 703.56 592.72Total oil revenues (V) 703.56 592.72Total recurrent revenues (VI)=V+IV 2 864.53 3 063.51
NET RECURRENT MARGIN EXCLUDING OIL REVENUES (VII=IV-III) 529.85 710.34NET RECURRENT MARGIN INCLUDING OIL REVENUES (VIII=VI-III) 1 233.41 1 303.06
INTE
RVEN
TIO
N E
XPEN
SES
AND
PRO
DU
CTS
Civil pensions 166.52 173.40Grants to households 42.48 7.85Legal expenses and State fines 1.06 1.21Transfers to municipalities 18.96 17.89Transfers for election governance 44.08 74.49Provisions for elections 0.00 2.50Reimbursements of VAT 0.00 15.77Transfers to other administrative units 1.20 6.04Contribution to international organisations 4.95 6.28Transfers to road fund 64.70 68.22Other transfers 42.22 79.63Total of intervention expenses (IX) 386.17 453.28Contributions received from third parties 109.30 62.77Total intervention (X) 109.30 62.77
NET INTERVENTION MARGIN (I=X-IX) -276.87 -390.51
FIN
ANCI
AL E
XPEN
SES
AND
PRO
DU
CTS Bank fees 6.77 13.23
Interests and commissions bilateral borrowings from structural adjustments 27.32 20.81Interests and commissions multilateral borrowings from structural adjustments 7.49 10.28Interests and commissions receivables outstanding for more than two years from public
enterprises 3.35 14.55Other financial expenses 30.18 37.73Total financial expenses (XI) 75.11 96.60Interests from bonds 0.00 0.00Interests from other securities 0.00 0.00Dividends from shares and investments 9.91 19.94Remuneration of bank deposits 0.01 0.01Total financial revenues (XII) 9.92 19.95
NET FINANCIAL EXPENSES MARGIN (XIII=XII-XI -65.19 -76.65TOTAL PROCEEDS (XV=VI+X+XII) 2 983.75 3 146.23TOTAL EXPENSES (XVI=III+IX+XI) 2 092.40 2 310.33
Page 69 of 75

TRANSACTIONS BALANCE OF THE FINANCIAL YEAR (XVII=XV-XVI) 891.35 835.90
The financial result displays a CFA F 835.90 billion positive transaction balance between revenues worth CFA F 3 146.23billion and expenses of CFA F 2 310.33 billion. With regard to State specificities, reconciliation between expenses and revenues cannot be interpreted as in private companies.
A summary presentation of the financial result separately shows expenses and revenues pertaining thereto such as the simplified financial result below.
II - 1 – SIMPLIFIED PERFORMANCE STATEMENT AS OF 31 DECEMBER 2015 Period from 01/01/2015 to 31/12/2015 (in billion of CFA F)
DESCRIPTION YEAR 2014 YEAR 2015Direct recurrent charges (I) 1 521.19 1 602.32Indirect recurrent charges (II) 109.93 158.13Recurrent charges (III=I+II) 1 631.12 1 760.45Non-oil earnings (IV) 2 160.97 2 470.79Oil earnings (V) 703.56 592.72Recurrent proceeds (VI)=V+IV 2 864.53 3 063.51NET RECURRENT MARGIN EXCLUDING OIL EARNINGS (VII=IV-III) 529.85 710.34NET RECURRENT MARGIN INCLUDING OIL EARNINGS (VIII=VI-III) 1 233.41 1 303.06Intervention charges (IX) 386.17 453.28Intervention proceeds (X) 109.30 62.77NET INTERVENTION MARGIN (I=X-IX) -276.87 -390.51Financial charges (XI) 75.11 96.60Financial charges (XII) 9.92 19.95NET FINANCIAL MARGIN CHARGES (XIII=XII-XI -65.19 -76.65PROCEEDS (XV=VI+X+XII) 2 983.75 3 146.23CHARGES (XVI=III+IX+XI) 2 092.40 2 310.33ANNUAL TRANSACTIONS BALANCE (XVII=XV-XVI) 891.35 835.90
Net running expenses of CFA F 1303.06billion are obtained through the difference between CFA F 3 063.51 billion from recurrent revenues and CFA F 1 760.45 billion direct and indirect running expenses. The CFA F 900.54 billion of staff expenses are the most important portion of such expenses, followed by expenses on goods and services worth CFA F 574.95 billion. As for recurrent revenues, taxes and duties come first with CFA F 1 421.61 billion, followed by customs revenues of CFA F 847.77 billion and CFA F 592.72 billion from oil revenues.
Net intervention expenses show a negative balance of CFA F 390.51billion obtained by subtracting intervention revenues worth CFA F 62.77 billion from CFA F 453.28 billion intervention expenses. He most are important portions of these expenses are civil pensions worth CFA F 173.40billion, transfers to local units of CFA F 17.89 billion, transfers for election governance of CFA F 74.49 billion, transfers to the road fund of CFA F 68.22 billion and VAT reimbursement of CFA F 15.77billion.
Net financial expenses show a negative balance of CFA F 76.65 billion obtained by subtracting financial revenues worth CFA F 19.95 billion from the CFA F 96.60 billion financial expenses.
Revenues moved from CFA 2 983.30billion in 2014 to CFA F 3 146.23billion in 2015.for an increase of CFA F 162.93 billion.
The average of State revenues from the last three years is CFA F 2 929.40 billion. It is divided in recurrent revenues of CFA F 2 847.37 billion, intervention of CFA F 75.77 billion and financial revenues of CFA F 6.27 billion.
Distribution of revenues from 2013 to 2015 (in billion of CFA F)
Page 70 of 75

DESCRIPTION 2013 2014 2015 Total Average RateRecurrent revenues 2 614.50 2 864.10 3 063.51 8 542.11 2 847.37 97.2%Intervention revenues 118.00 109.30 62.77 227.30 75.77 2.6%Financial revenues 8.90 9.90 19.95 18.80 6.27 0.2%
Total 2 741.40 2 983.30 3 146.23 8 788.21 2 929.40 100.0%
Annual Trends in State revenues from 2013 to 2015 (in billion of CFA F)
Year 2013
Year 2014
Year 2015
0.00 500.00 1,000.00 1,500.00 2,000.00 2,500.00 3,000.00 3,500.00
2,614.50
2,864.10
3,063.51
Financial revenuesIntervention revenuesRecurrent revenues
Expenses moved from CFA F 2 092.10 billion in 2014 to CFA F 2 310.33 billion in 2015, corresponding to an increase of CFA F 218.23 billion.
The average of State expenses from the last three years is CFA F 2 137.94 billion. It includes recurrent expenses worth CFA F 1 628.05 billion, intervention expenses worth CFA F 432.76 billion and financial expenses worth CFA F 77.13 billion.
Distribution of expenses from 2013 to 2015 (in billion of CFA F)DESCRIPTION 2013 2014 2015 Total Average Rate
Recurrent expenses 1 492.90 1 630.80 1 760.45 4 884.15 1 628.05 76.2%Intervention expenses 458.70 386.30 453.28 1 298.28 432.76 20.2%Financial expenses 59.80 75.00 96.60 231.40 77.13 3.6%
Total 2 011.40 2 092.10 2 310.33 6 413.83 2 137.94 100.0%
Page 71 of 75

Yearly trends in expenses from 2013 to 2015 (in billion of CFA F)
Year 2013
Year 2014
Year 2015
0.00 500.00 1,000.00 1,500.00 2,000.00 2,500.00 3,000.00 3,500.00
2,614.50
2,864.10
3,063.51
458.70
386.30
453.28
59.80
75.00
96.60
Financial expensesInterventionexpensesRecurrent expenses
Distribution of transaction expenses, revenues and balances from 2013 to 2015 (in billion of CFA F) per yearDESCRIPTION 2013 2014 2015 Total Average
Expenses 2 011.40 2 092.10 2 310.33 6 413.83 2 137.94Revenues 2 741.40 2 983.30 3 146.23 8 870.93 2 956.98Transaction balance 730.00 891.20 835.90 2 457.10 819.03
Yearly trends in State transaction expenses, revenues and balances from 2013 to 2015 (in billion of CFA F)
Year 2013
Year 2014
Year 2015
0.00 500.00 1,000.00 1,500.00 2,000.00 2,500.00 3,000.00 3,500.00
2,011.40
2,092.10
2,310.33
2,741.40
2,983.30
3,146.23
730.00
891.20
835.90
Transaction balanceRevenuesExpenses
The 2015 financial year revenues are presented as follows:II – 2 –TABLE OF REVENUES AS OF 31 DECEMBER 2015 (in billion of CFA F)Accou DESCRIPTION YEAR 2014 YEAR 2015 Dev (N-(N-1)
I RECURRENT REVENUES 2 864.53 3 063.51 198.98I RECURRENT REVENUES–FISCAL REVENUES (TAXATION AND CUSTOMS) 2 087.71 2 269.38 181.67
RECURRENT REVENUES-Taxes and Duties 1 291.79 1 421.61 129.82721 PERSONAL INCOME TAX 215.93 230.19 14.26723 NON-OIL CORPORATE INCOME TAX 297.99 367.08 69.09724 INCOME TAXES SERVED TO PEOPLE RESIDING OUT OF CAMEROON 97.51 84.41 -13.10725 CAPITAL GAINS AND TRANSFER CAPITAL GAIN TAX 0.83 1.30 0.47726 WAGE AND LABOUR TAX 0.00 0.00 0.00727 PROPERTY TAX 0.00 0.00 0.00
Page 72 of 75

728 TRANSACTIONS AND TRANSFER TAX 37.42 49.47 12.057301 Value added tax (vat) 458.03 523.74 65.717311 Special tax on petroleum products (TSPP) 118.51 103.77 -14.747312 Vignettes on tobacco and manufactured products 8.67 0.74 -7.937321 Axle tax 1.98 2.21 0.237323 Tax on insurance contracts 0.00 0.00 0.007324 Fish product inspection tax 0.04 0.04 0.007325 Veterinary inspection tax. local trade 0.43 0.24 -0.197326 Transp vehicle inspect tax. Fish products 0.00 0.00 0.007331 Annual forest royalties 8.57 8.56 -0.017332 Fisheries exploitation duties 0.00 0.01 0.017333 Duties on company formation and merger 0.00 0.00 0.007334 Authorisation of shows 0.00 0.00 0.007335 Duty of valuable substance collection 0.01 0.00 -0.017336 Area levies on mining activities 1.04 0.93 -0.117337 Animal products exploitation duties 0.02 0.04 0.027338 Gambling and entertainment tax 0.02 0.01 -0.017339 Fixed duties- attribution, renewal and transfer of mining licenses 0.02 0.09 0.077342 Stamp duty on hunting/fishing permit 0.06 0.05 -0.017343 Stamp duty– permit for the capture of non-protected animals 0.00 0.01 0.017344 Stamp duty – permit for the collection of remains/animals 0.00 0.00 0.007345 Hides and skins collection tax 0.00 0.00 0.007346 Stamp duty – scientific research 0.00 0.00 0.007347 Stamp duty - gambling machines 0.01 0.01 0.007348 Stamp duty – weapons permit 0.00 0.00 0.007349 Transport license 0.00 0.00 0.007341 Motor vehicle stamp duty 0.00 0.00 0.007351 Felling tax 5.53 6.52 0.997352 Sawmill entry tax 0.02 0.02 0.007353 Other forest duty and taxes 0.45 0.37 -0.087355 Levies on quarry extraction 0.29 0.40 0.117356 Water production royalties 0.17 0.00 -0.177357 Other mining duties and taxes 0.17 0.19 0.027358 Ad valorem tax on mining revenues 0.00 0.36 0.367380 Stamp on identity card, resident permit 2.23 0.93 -1.307381 Registration fees on deeds, patents/originals and declarations 0.23 0.25 0.027382 Sized stamp and graduated stamp 13.13 14.52 1.397383 Deficit stamps 0.03 0.01 -0.027384 Stamp duty on driving licenses 0.00 0.00 0.007385 Stamp duty on car registration document 0.01 0.01 0.007386 Passports and pass stamp duty 14.30 15.56 1.267387 Stamps duty on bill of lading transport contracts 1.43 1.67 0.247388 Airport stamp duty 4.51 4.11 -0.407389 Advertisement stamp duty 0.71 0.92 0.217391 State percentage of Add Council Tax/ VAT 0.00 0.00 0.007392 State percentage of Add Council Tax/VAT on imports 0.00 0.00 0.007397 Property/Land taxes 0.00 0.00 0.007398 State percentage of local council taxes. 0.00 0.00 0.007399 State share of additional charge on penalties, levies and duties on
imports 1.49 2.87 1.38
RECURRENT REVENUES-Customs 795.92 847.77 51.857302 VAT on import 328.67 325.54 -3.137318 Excise duty (tax) 98.33 170.16 71.837319 Excise duty (customs) 14.76 14.61 -0.157361 Deduction on import (1%) 20.95 21.41 0.467362 Import customs duties 307.96 288.21 -19.757363 Customs duties on petroleum 0.00 0.01 0.017364 Computer fees 6.88 6.25 -0.637365 Sanitary and veterinary inspection tax on import 0.58 0.61 0.037366 Meat transportation tax 1.16 0.00 -1.16
Page 73 of 75

7369 Other budget taxes on external trade. 1.53 3.83 2.307371 Single export tax on goods. Except lumber 4.37 4.74 0.377372 Single export tax on lumber 9.46 10.96 1.507373 Forest products export surtax 1.16 1.33 0.177374 Veterinary inspection tax on export 0.08 0.06 -0.027375 Computer tax customs 0.01 0.00 -0.017376 Sani and vet insp tax. Inter transit 0.02 0.05 0.037377 Packaging tax on timber 0.00 0.00 0.00
I RECURRENT REVENUES-Non fiscal revenues 776.82 794.13 17.31Revenues from properties and services 34.29 175.65 141.36
7101 Visa fees 0.15 0.15 0.007102 Fes for the issuance of judicial and extrajudicial documents 0.21 0.20 -0.017103 Processing fees 0.05 0.24 0.197104 Contributions to school fees 13.01 14.00 0.997105 Examination and competitive entrance fees 0.03 0.00 -0.037107 Import declarations 0.21 0.27 0.067109 Tuition in training schools 0.00 0.00 0.007110 Medical and legal medical certificates 0.01 0.03 0.027111 Registration and training fees in vocational training centers for clerical
and industrial trade staffs 0.00 0.00 0.007112 Contribution for placement agency licenses 0.02 0.00 -0.027113 Contribution for temporary work enterprise license 0.00 0.00 0.007115 Driving license issuance fees 0.00 0.00 0.007116 Motor vehicle registration document issuance fees 0.00 0.00 0.007117 Duties on the issuance of survey deeds 1.22 1.32 0.107118 Duties on topographic and land survey works 0.96 1.19 0.237119 Motor vehicle registration fees 0.00 0.00 0.007114 Tuition National School of Social Welfare Assistants 0.00 0.00 0.007120 Taxpayer card issuance duties 0.00 0.00 0.007121 Duties on court decisions 0.30 0.40 0.107124 Phytosanitary license fees 0.00 0.00 0.007125 Levies on honoraria of law officials 2.26 2.78 0.527126 Listing in trade register 0.06 0.05 -0.017122 Passport and pass issuance fees 0.00 0.00 0.007123 Identity card and residence permit issuance fees 0.00 0.00 0.007141 Sales of cartridge in cartridge shops 0.00 0.00 0.007145 Sales of general exchange programmes 0.00 0.00 0.007146 Proceeds from poultry farms 0.00 0.00 0.007147 Interventions in veterinary clinics 0.01 0.00 -0.017148 Immunizations (veterinary) 0.01 0.01 0.007149 Proceeds from sale of geological maps 0.00 0.00 0.007144 Aerial photography 0.00 0.00 0.007151 Revenues on oil product sales 0.00 0.00 0.007153 Auction sales of wildlife products 0.06 0.02 -0.047154 Fees on insignias and medals transfer(long-service awards) 0.01 0.01 0.007156 Proceeds from the sales of items manufactured by vocational training
units, handicraft workshops, prosthetic and orthopaedic workshops 0.01 0.01 0.007150 Proceeds from sale of gold 0.00 0.00 0.007152 Drilling revenues 0.00 0.00 0.007155 Proceeds from women empowerment center activities 0.00 0.00 0.007169 Touristic and hotel license 0.00 0.06 0.067168 Revenues from government garage 0.00 0.00 0.007170 Telecommunication business license 0.00 142.50 142.507171 Proceeds from use of penal labour 0.04 0.04 0.007172 Military hospitals services 0.00 0.00 0.007173 Museum, expositions, historic sites and monuments sites, national parks
visits 0.01 0.01 0.007174 Revenues from stadia and sports events 0.01 0.00 -0.017176 Revenues from Youth and Animation Centers 0.00 0.00 0.007177 Listing in the Import/Export file-index 0.02 0.03 0.017178 Gas pressure equipment inspection proceeds 0.64 0.40 -0.24
Page 74 of 75

7179 Revenues from environment and forestry services 0.03 0.03 0.007175 Revenues from shows and cultural events 0.00 0.00 0.007180 Ferry crossing fees 0.00 0.00 0.007181 Hospitalizations 0.00 0.00 0.007182 Consultations 0.00 0.00 0.007183 Birth deliveries 0.00 0.00 0.007184 Collection of health expenses and essential drugs 0.00 0.00 0.007185 Mortuaries 0.00 0.00 0.007187 Revenue from toll gate 6.07 5.83 -0.247188 Revenue from weighing stations 2.14 2.03 -0.117189 Technical visits 0.01 0.01 0.007186 Revenues of the National Center for the Rehabilitation of Disabled
Persons 0.00 0.00 0.007191 Revenues from rented public building 0.27 0.74 0.477192 Revenues from accommodations occupied by civil servants 2.59 0.06 -2.537193 Rental fees from equipments and machinery ( MINDEF) 0.00 0.00 0.007195 Rents from land 0.72 0.54 -0.187196 Other revenues from State properties–land royalties 3.15 2.69 -0.467194 Renting of show halls 0.00 0.00 0.00
RECURRENT REVENUES-oil revenues 703.56 592.72 -110.847411 NHC/SNH royalties 517.17 384.63 -132.547412 Pipeline crossing toll 24.67 36.20 11.537413 Tax on oil companies 161.72 171.89 10.17
RECURRENT REVENUES-Other non-oil revenues 38.97 25.76 -13.2175 WINFALL REVENUES 30.94 13.18 -17.76
7710 FINES ON DRIVING OFFENCE 0.19 0.33 0.147711 Criminal fines 0.44 0.48 0.047712 Civil fines 0.14 0.11 -0.037713 Fines on cinema production offence 0.37 0.83 0.467714 Fines on exchange regulation infringement 0.00 0.00 0.007715 Fines resulting from metrological control 0.39 0.52 0.137716 Fines resulting from phytosanitary controls 0.00 0.00 0.007717 Fines to dangerous insalubrious institutions 0.15 0.13 -0.027718 Revenues.fines, transactions.damages/compensation-MINEF 0.55 0.71 0.167719 Other fines 0.26 0.45 0.19772 Other revenues and miscellaneous earnings 5.54 9.02 3.48
II-INTERVENTION REVENUES 109.30 62.77 -46.53
761 Contributions to pension funds of civil servants and allied employees of public administrations 40.92 44.67 3.75
762 Contributions to social welfare funds of civil servants and allied employees of public administrations 0.00 0.01 0.00
763 Grants from international multilateral cooperation 0.00 0.00 0.00764 Grants from multilateral cooperation with the EU 0.00 0.00 0.00765 Grants from bilateral cooperation with the EU and other European
countries 0.00 0.00 0.00
766 Grants from bilateral cooperation with the EU and other European countries 0.00 0.00 0.00
767 Grants from bilateral cooperation with Asian countries 0.00 0.00 0.00768 Grants from bilateral cooperation with the American, Oceanian and
African countries 0.00 0.00 0.00769 Exceptional grants from international cooperation 68.38 18.09 -50.29
Financial proceeds 9.92 19.95 10.037451 Interests on bank deposits 0.01 0.01 0.007456 Dividends from shares and investments 9.91 19.94 10.037452 Bond interests 0.00 0.00 0.007454 Other interests on securities 0.00 0.00 0.00
TOTAL REVENUES (IV=I+II+III) 2 983.75 3 146.23 162.48
The related expenses appear as follows in the State cost table as of 31 December 2015.
II – 3 - EXPENSES TABLE AS OF 31 DECEMBER 2015(in billion of CFA F)ACCO DESCRIPTION 2014 2015 DEV (N-(N-1)
Page 75 of 75

UNTI RECURRENT EXPENSES 1 631.12 1 760.45 129.33I DIRECT RECURRENT EXPENSES 1 521.19 1 602.32 81.13
RECURRENT EXPENSES-GOODS AND SERVICES 655.46 574.95 -80.516100 Office supp/Minor maintenance (less fuel) 2.59 1.97 -0.626101 Supplies purchase of minor office maintenance 59.17 42.26 -16.916102 Purchase of running hardware and office equipment 13.57 13.08 -0.496103 Purchase of office furniture 43.63 4.11 -39.526104 Purchase of other running supplies. services 31.47 29.92 -1.55
- TOTAL 610 150.43 91.34 -59.096110 Technical document, subscription newspaper and books 1.17 2.40 1.236111 Supplies-service provision ,printing 5.51 8.17 2.666112 Spare parts 0.08 0.37 0.296113 Purchase of vaccines or test and other preventions 1.20 0.47 -0.736114 Teaching and learning materials and other minimum school kits 1.78 1.76 -0.026115 Special feeding expenses (welfare centers) 6.03 9.04 3.016116 Purchase of drugs and medical supplies 4.26 5.15 0.896117 Special clothing expenses. Services activities 7.34 9.83 2.496118 Purchase of agricultural input., vet products 0.48 0.44 -0.046119 Purchase of minor machinery and equipment/tech supplies 14.47 12.47 -2.00
- TOTAL 611 42.32 50.10 7.786121 Fuel/lubricants of motor vehicles 46.52 39.36 -7.166122 Fuel/lubricants of planes and aircrafts 0.37 1.85 1.486123 Fuel/lubricants of boats and speedboats 0.06 0.08 0.026125 Fuel and lubricants of machines 0.03 0.16 0.136129 Fuel/lubricants of special engines 0.01 0.50 0.49
- TOTAL 612 46.99 41.95 -5.046131 Transport expenses for employees on domestic mission 4.77 3.21 -1.566132 Transport expenses mission abroad 20.55 13.19 -7.366133 Respite expenses 2.93 2.71 -0.226135 trans/transit handling/ march coast 0.94 0.47 -0.476136 Packaging/forwarding fees of minimum school kits 0.18 0.17 -0.01
- TOTAL 613 29.37 19.75 -9.626141 Subscription/ water consumption 7.22 7.42 0.206142 Subscription and consumption of electricity 7.78 8.43 0.656143 Connection of meters 0.05 0.04 -0.016144 Consumption of gas and other energies 0.02 0.02 0.006145 Fuel-generators 0.26 0.19 -0.076146 Supplies/solar energy 0.00 0.08 0.08
- TOTAL 614 15.33 16.18 0.856152 Car rental 0.06 0.08 0.026153 Rent-public service buildings 6.28 6.14 -0.146154 Administrative leases for civil servants accommodation 2.48 3.33 0.856157 Rental of congress, conference, seminar and show halls 0.02 0.02 0.006156 Rental of technical equipment 0.00 0.00 0.00
- TOTAL 615 8.84 9.57 0.736161 Routine maintenance of buildings 3.72 4.53 0.816162 Lifts maintenance 0.83 0.58 -0.256163 Electric facilities, AC and generators maintenance 2.59 2.32 -0.276164 Care/maintenance machines, tech. equip 0.89 0.87 -0.026165 Maintenance telecommunication equipment 0.59 0.63 0.046166 Routine Maintenance/repair of running vehicles, purchase of spare parts and tyres 10.12 10.38 0.266167 Routine maintenance of planes, boats, ferries and other special vehicles 2.13 4.77 2.646168 Major repairs of buildings and industrial cleaning 2.07 1.76 -0.316169 Fire prevention 0.16 0.17 0.01
- TOTAL 616 23.10 26.01 2.916171 Domestic mission allowance 44.08 36.96 -7.126172 External mission allowance 40.84 7.56 -33.286173 Reception and butling expenses 5.90 5.93 0.03
Page 76 of 75

6174 Reception expenses 4.94 6.87 1.936175 Official feasts and ceremonies 9.22 8.54 -0.686177 Expenses for Participation in fairs, expositions and 48.12 49.77 1.65
- TOTAL 617 153.10 115.63 -37.476180 Insurance 1.94 1.69 -0.256181 Subscription to and consumption of telephone, fax, telex, handsets 16.92 24.00 7.086182 Websites; ,subscription to and consumption of internet 0.70 0.67 -0.036183 subscription to and consumption of radio-communication 0.07 0.09 0.026184 Mail delivery, diplomatic bag military mail 0.24 0.40 0.166185 Publications, press, radio, television announcements and advertisement expenses 3.96 4.30 0.346186 Honoraria and related expenses 21.81 2.48 -19.336187 Training, refresher course, and seminar organization expenses 21.10 37.97 16.876188 Outsourced guard 0.92 0.94 0.026189 Other remunerations of outsourced services 116.00 130.79 14.79
- TOTAL 618 183.66 203.33 19.676191 Road maintenance 0.45 0.41 -0.046192 Maintenance of urban road network and equipment 1.11 0.12 -0.996193 Maintenance of engineering works 0.45 0.32 -0.136197 Maintenance of hydraulic facilities 0.01 0.02 0.016198 Maintenance of port, and military airport facilities 0.26 0.18 -0.086199 Maintenance of other infrastructure 0.04 0.04 0.00
- TOTAL 619 2.32 1.09 -1.23RECURRENT EXPENSES–STAFF 835.99 900.54 64.55
6210 Gross wage of Civil Servants governed by General Statute of Civil Service 773.81 830.98 57.176217 Allowances attached to the general statute 0.00 0.02 0.026218 Benefit in kind attached to the function 0.00 0.02 0.02
- TOTAL 621 773.81 831.02 57.216227 Allowances attached to the special statute 0.03 0.04 0.016228 Benefit in kind attached to the function 0.00 0.00 0.006229 Absorbtion of new positions to be created 0.00 0.01 0.01
- TOTAL 622 0.03 0.05 0.026252 Decision-employed and auxiliary staff 0.00 0.00 0.006251 Contract employees 0.00 0.00 0.006261 Overtime 1.89 1.84 -0.056262 Gratuities 2.35 2.48 0.136263 Special Allowances 9.94 8.65 -1.296264 Fixed allowances for field visits and risks 1.99 2.22 0.236265 Cash payment/cashier allowances 0.01 0.01 0.006266 Duty allowances 0.18 0.15 -0.036267 Performance/output allowance 4.63 5.34 0.716268 Special duty allowance 20.17 19.52 -0.656269 Special allowance 5.63 12.22 6.59
- TOTAL 626 46.79 52.43 5.646271 Remuneration of foreign technicians 0.24 0.37 0.136272 Remuneration of contract employees in service abroad
(embassies, diplomatic missions) 2.98 3.02 0.046273 Special recruitments 0.19 3.29 3.106274 Remuneration of house workers 0.80 0.80 0.00
- TOTAL 627 4.21 7.48 3.276282 Absorption of teachers 1.33 0.74 -0.596287 Absorption of special temporary staff 0.94 0.72 -0.226288 Absorption of casual and seasonal staff 1.29 1.20 -0.09
- TOTAL 628 3.56 2.66 -0.906292 Funeral assistance 1.59 1.00 -0.596293 Feeding allowance for servicemen 3.90 4.18 0.286294 Exceptional assistance and relief to staff 2.10 1.72 -0.38
- TOTAL 629 7.59 6.90 -0.69RECURRENT EXPENSES -TAXES AND DUTIES 29.74 126.83 97.09
6310 Taxes and allied levies 19.03 71.90 52.87
Page 77 of 75

6312 Customs taxes 10.71 54.93 44.22- TOTAL 631 29.74 126.83 97.09
INDIRECT RECURRENT EXPENSES--SUBVENTIONS 109.93 158.13 48.206512 Subventions to State enterprises 1.83 1.55 -0.28
- TOTAL 651 1.83 1.55 -0.286521 Recurrent grants to Administrative Public Establishments and other bodies 44.31 44.71 0.406524 Recurrent grants to NGO and associations 2.24 1.69 -0.556525 Recurrent grants to health facilities 11.58 11.23 -0.356526 Recurrent grants to universities and higher schools 31.44 31.13 -0.316527 Recurrent grants to schools 3.15 3.29 0.146528 Recurrent grants to social institutions 12.62 10.00 -2.626529 Recurrent grants to cultural and sport institutions 0.90 1.00 0.10
- TOTAL 652 106.24 103.05 -3.196532 Capital Subventions to State-owned enterprises 1.71 51.45 49.746536 Capital Subventions to universities and higher schools 0.00 1.28 1.286539 Capital Subventions to cultural and sport institutions 0.15 0.80 0.656531 Capital Subventions to Administrative Public Bodies and other bodies 0.00 0.00 0.006533 Capital Subventions to private enterprises 0.00 0.00 0.006534 Capital Subventions to NGO and associations 0.00 0.00 0.00
- TOTAL 653 1.86 53.53 51.67II INTERVENTION EXPENSES 386.17 453.28 67.11
INTERVENTION EXPENSES-CURRENT TRANSFERS 313.24 378.97 65.736611 Civil pensions 166.52 173.40 6.886616 Emergency hospitalization and medical evacuation expenses 4.63 4.04 -0.596617 Assistance and relief 0.71 21.21 20.506618 Contribution to student and pupil transportation 0.17 0.14 -0.036615 Death benefits 0.00 0.00 0.00
- TOTAL 661 172.03 198.79 26.766621 Transfers to councils 18.96 17.89 -1.076622 Transfers to the Road Fund 64.70 68.22 3.526623 Transfers to Forest Fund 2.00 2.00 0.006624 Transfers to special Appropriations Accounts/Funds 4.00 4.15 0.156627 Transfers Special Funds 1.07 0.69 -0.386628 Other current transfers to other administrative units 44.08 74.49 30.416629 Transfers to other administrative units 1.20 6.04 4.84
- TOTAL 662 136.01 173.48 37.476641 Contributions to international organisations 4.95 6.28 1.336642 Contributions to the capital of international organisations 0.00 0.02 0.026643 Miscellaneous contributions 0.25 0.40 0.15
- TOTAL 664 5.20 6.70 1.50INTERVENTION EXPENSES TRANSFERS 72.93 74.31 1.38
6711 Medical repatriations 0.11 0.28 0.176712 Funeral expenses 1.38 1.79 0.416713 State litigation and pecuniary fines 1.06 1.21 0.156714 Regulation fees 1.02 3.28 2.266716 Provisions for elections 0.00 2.50 2.506717 State fines at law 1.33 0.84 -0.496718 VAT reimbursement 0.00 15.77 15.77
- TOTAL 671 4.90 25.67 20.776721 Scholarships 5.82 5.60 -0.226723 Allowance paid to counsellors 0.02 0.02 0.006724 Competitive exams, awards and medals 0.23 0.16 -0.076726 Allowances paid to court assessors 0.10 0.09 -0.016729 Grants to households 42.48 7.85 -34.63
- TOTAL 672 48.65 13.72 -34.936731 Exchange losses 0.03 0.18 0.15
- TOTAL 673 0.03 0.18 0.156901 Recurrent provisions 19.35 34.74 15.39
- TOTAL 690 19.35 34.74 15.39
Page 78 of 75

CHARGES FINANCIERES 75.11 96.60 21.49
6402 Interests and commissions of long and medium term multilateral structural adjustment borrowings 7.49 10.28 2.79
- TOTAL 640 7.49 10.28 2.796410 Bank charges 6.77 13.23 6.466411 Interests and commissions on bilateral structural adjustment borrowings 27.32 20.81 -6.516416 Interests and commissions on direct bilateral sector borrowings from other
organisations 17.20 20.75 3.55- TOTAL 641 51.29 54.79 3.50
6423 Interests and commissions on borrowings of more than two years from domestic public enterprises 3.35 14.55 11.20
- TOTAL 642 3.35 14.55 11.206431 Interests and commissions on external commercial bank debt 2.16 0.00 -2.16
- TOTAL 643 2.16 0.00 -2.166443 Interests and commissions of more than two years debts from enterprises and other
domestic economic operators 10.32 15.77 5.45
6441 Interests and commissions of LMT borrowings from financial institutions and banking system 0.50 0.00 -0.50
- TOTAL 644 10.82 15.77 4.956481 Interests and commissions from advances received 0.00 1.21 1.21
- TOTAL 648 0.00 1.21 1.21IV-AGGREGATE TOTAL OF EXPENSES 2 092.40 2 310.33 217.93
Page 79 of 75
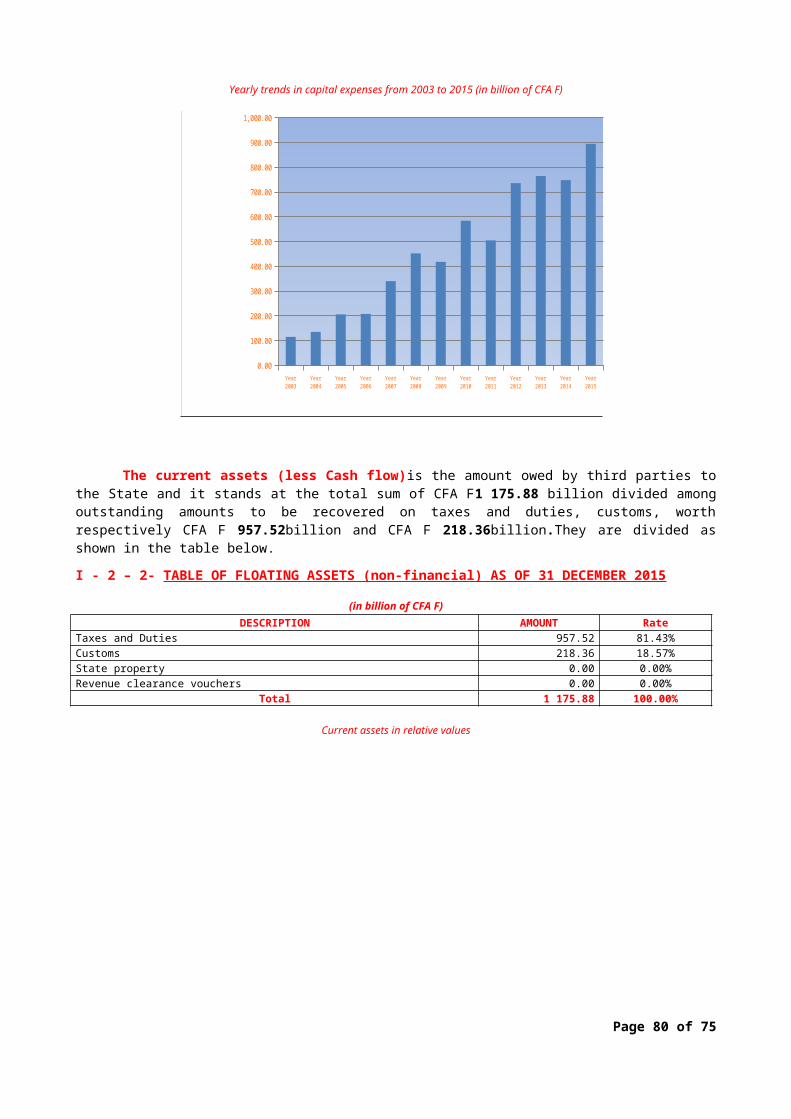
III- CASH FLOWS CHART AS OF DECEMBER 2015 Section 28 of CEMAC directive N 03/11 – UEAC – 195 – LM -22 of 19 December 2011
pertaining to the State chart of accounts provides that: « the Cash flows table reflects Cash inflows and outflows in three categories: Cash flows related to activity, Cash flows related to capital transactions, Cash flows related to financing transactions...This table enables to show the State financing requirements ».
Pursuant to the aforementioned provisions, the Cash flow table at 31 December appears as follows:
(in billion of CFA F)DESCRIPTION YEAR 2014 YEAR 2015
NET CASH FLOWS RELATED TO ACTIVITY (I) 917.27 911.11COLLECTIONS/CASH-IN 2 983.81 3 146.23Proceeds from sales and provision of services 34.31 175.65Taxes and duties revenues 1 291.82 1 421.61Customs revenues 795.92 847.77Oil revenues 703.57 592.72Other non-tax revenues 38.97 25.76Intervention proceeds 109.30 62.77Financial proceeds 9.92 19.95DISBURSEMENTS/CASH-OUT -2 066.54 -2 235.12Goods and services -551.62 -657.52Staff expenses -850.47 -902.15Other staff expenses -60.26 -65.12Intervention expenses -444.64 -499.47Restructuring and rehabilitation 0.00 56.68Financial expenses -127.56 -161.62Other expenses -24.14 0.00Expenses deferral accounts -7.85 -5.92NET CASH FLOWS ON CAPITAL TRANSACTIONS (II) -565.99 -393.40Fixed assets acquisitions -565.99 -393.40CASHFLOWS RELATED TO FINANCINGTRANSACTIONS (III) 99.20 340.05COLLECTIONS/CASH-IN 1 931.01 2 252.07Medium and long term resources account 161.00 631.93Deposits from Treasury correspondents 855.64 946.64Miscellaneous debtors and advances granted 759.40 501.91Collections to be apportioned 154.97 171.59DISBURSEMENTS/CASH-OUT -1 831.81 -1 912.02Medium and long term resources account -123.50 -383.08Withdrawals by Treasury correspondents -786.52 -860.82Miscellaneous debtors and advances received -764.41 -498.47Disbursements to be apportioned -157.38 -169.65NET FLOWS OF NON-DISAGGREGATED TRANSACTIONS (IV) -745.92 -809.68CHANGE IN CASH FLOW (V= I+II+III+IV=VII-VI) -295.44 48.08CASH POSITION AT THE START OF THE PERIOD (VI) 677.65 382.21Banks 656.93 362.54Cash 20.72 19.67CASH POSITION AT THE END OF PERIOD (VII) 382.21 430.29Banks 362.54 409.39Cash 19.67 20.90
The Cash flow table shows the Collections and Disbursements of all State liquid assets: Cash flows related to State activities, cash flows related to capital transactions, and cash flows related to financing transactions. It shows the State financing needs. Such financing is needed to cover the cash flow needs related to its running of activities, its redistribution mission and its investment policy.
Page 80 of 75

With regard to net cash flows related to State activity, there is a cash surplus of CFA F 911.11 billion ensuing from the difference between collections of 3 146.23 billion and cash-out of CFA F 2 235.12 billion.
Net cash flows related to investment show a financing requirement of CFA F 393.40 billion arising from the difference between fixed assets acquisitions worth CFA F 393.40 billion and disposal of fixed assets worth zero as at 31 December 2015.
The aforementioned Cash surplus of CFA F 911.11billion obtained on activity was used to cover up for the cash requirements on capital expenses. Notwithstanding, the sum of CFA F 517.71 billion is still required if surplus Cash from activities should cover flows needed for capital expenses.
The aforementioned CFA F 517.71 billion financing requirement accounts for all the actions undertaken under the State liquidity management. Funds were raised for a total amount of CFA F 2 252.07 billion respectively consisting of borrowings, Treasury bonds, deposits of Treasury correspondents and reimbursement of various advances granted to third parties by the State. Such reimbursements generated a cash-in of CFA F 1 912.02 billion, for CFA F 340.05 billion net cash flow related to financing transactions.
Lastly, there is an increase of CFA F 48.08 billion in State liquidity assets obtained from the difference between the Cash position at the end of December 2014 worth CFA F382.21 billion and CFA F 430.29 billion at the end of December 2015.
Page 81 of 75