parliament.nt.gov.au · web viewno 358. legislative ass. embly of the northern territory written...
TRANSCRIPT

No 358
LEGISLATIVE ASSEMBLY OF THE NORTHERN TERRITORY WRITTEN QUESTION
Mr Tollner to the Minister for Lands and Planning, in relation to the portfolio areas with Land Development Corporation
Land Development Corporation
HR Questions:
1. What is the NTG FTE Cap for your Agency?
10.9
2. At Pay day 20, 28 March 2012, what is the current FTE staffing of the department, by level?
14.58. Breakdown by level below.
Classification Classification Description Financial Quarter 3
FTE
AO3 ADMINISTRATIVE OFFICER 3 0.99
AO4 ADMINISTRATIVE OFFICER 4 0.94
AO5 ADMINISTRATIVE OFFICER 5 2.79
AO6 ADMINISTRATIVE OFFICER 6 1.00
AO7 ADMINISTRATIVE OFFICER 7 0.86
EO1C EXECUTIVE OFFICER 1 - EXECUTIVE CONTRACT
1.00
EO2C EXECUTIVE OFFICER 2 - EXECUTIVE CONTRACT
1.00
EO3C EXECUTIVE OFFICER 3 - EXECUTIVE CONTRACT
1.00
SAO1 SENIOR ADMINISTRATIVE OFFICER 1 5.00
Land Development Corporation Total14.58
3. Is this figure in line with the NTG FTE Cap? - If not, please explain.
Due to the increased work load on the Land Development Corporation, particularly
1

with respect to new residential developments, additional staffing resources have been required.
4. At Pay day 20, 28 March 2012, how many funded permanent positions are there in your department?
13 positions.
2

5. At Pay day 20, 28 March 2012, how many of these positions were nominally filled and how many were filled by persons acting in positions or are temporary appointments?- Please separate by permanent/temporary/acting by level
Classification Classification Description Permanent Employees
Held in Nominal
Positions
Permanent Employees Acting in
Temporary Positions
Temporary Employment
Contracts
AO3 ADMINISTRATIVE OFFICER 3 1 0 0
AO4 ADMINISTRATIVE OFFICER 4 1 0 0
AO5 ADMINISTRATIVE OFFICER 5 1 1 1
AO6 ADMINISTRATIVE OFFICER 6 1 0 0
AO7 ADMINISTRATIVE OFFICER 7 1 0 0
EO1C EXECUTIVE OFFICER 1 - EXECUTIVE CONTRACT
0 0 1
EO2C EXECUTIVE OFFICER 2 - EXECUTIVE CONTRACT
0 0 1
EO3C EXECUTIVE OFFICER 3 - EXECUTIVE CONTRACT
0 0 1
SAO1 SENIOR ADMINISTRATIVE OFFICER 1 5 0 0
Land Development Corporation10 1 4
6. In the period 01 July 2011 to 31 March 2012, what was the turnover rate of staff in the Agency?
25.90%
7. What is the rate per level?
Classification Classification Description Turnover Rate (%)
Z AO3 ADMINISTRATIVE OFFICER 3 100.76
Z AO4 ADMINISTRATIVE OFFICER 4 0.00
3

Z AO5 ADMINISTRATIVE OFFICER 5 0.00
Z AO6 ADMINISTRATIVE OFFICER 6 0.00
Z AO7 ADMINISTRATIVE OFFICER 7 100.00
Z EO1C EXECUTIVE OFFICER 1 - EXECUTIVE CONTRACT
0.00
Z EO2C EXECUTIVE OFFICER 2 - EXECUTIVE CONTRACT
0.00
Z EO3C EXECUTIVE OFFICER 3 - EXECUTIVE CONTRACT
0.00
Z SAO1 SENIOR ADMINISTRATIVE OFFICER 1 0.00
Z SAO2 SENIOR ADMINISTRATIVE OFFICER 2 100.00
8. At Pay day 20, 28 March 2012, how many funded positions are vacant in the Agency?
We have no vacant funded positions – however we have 2 nominal vacant positions which have staff acting in these positions.
9. How long, in total days, have funded positions been vacant since 01 July 2011?
Nil, however there are two positions which are nominally vacant with people acting in the positions.
10. At Pay day 20, 28 March 2012, how many staff are currently employed on a temporary contract?
Four staff are currently employed on a temporary contract.
Classification
Classification Description Casual Staff
Temporary Staff
AO5 ADMINISTRATIVE OFFICER 5 0 1
EO1C EXECUTIVE OFFICER 1 - EXECUTIVE CONTRACT
0 1
EO2C EXECUTIVE OFFICER 2 - EXECUTIVE CONTRACT
0 1
4

EO3C EXECUTIVE OFFICER 3 - EXECUTIVE CONTRACT
0 1
Land Development Corporation Total
0 4
11. In the period 01 July 2011 to 31 March 2012, how many temporary contracts have been extended, broken down by level and the number of times extended?
ECO2 – 1 extension
12. In the period 01 July 2011 to 31 March 2012, how many positions have been advertised by "expression of interest"?
Nil.
5
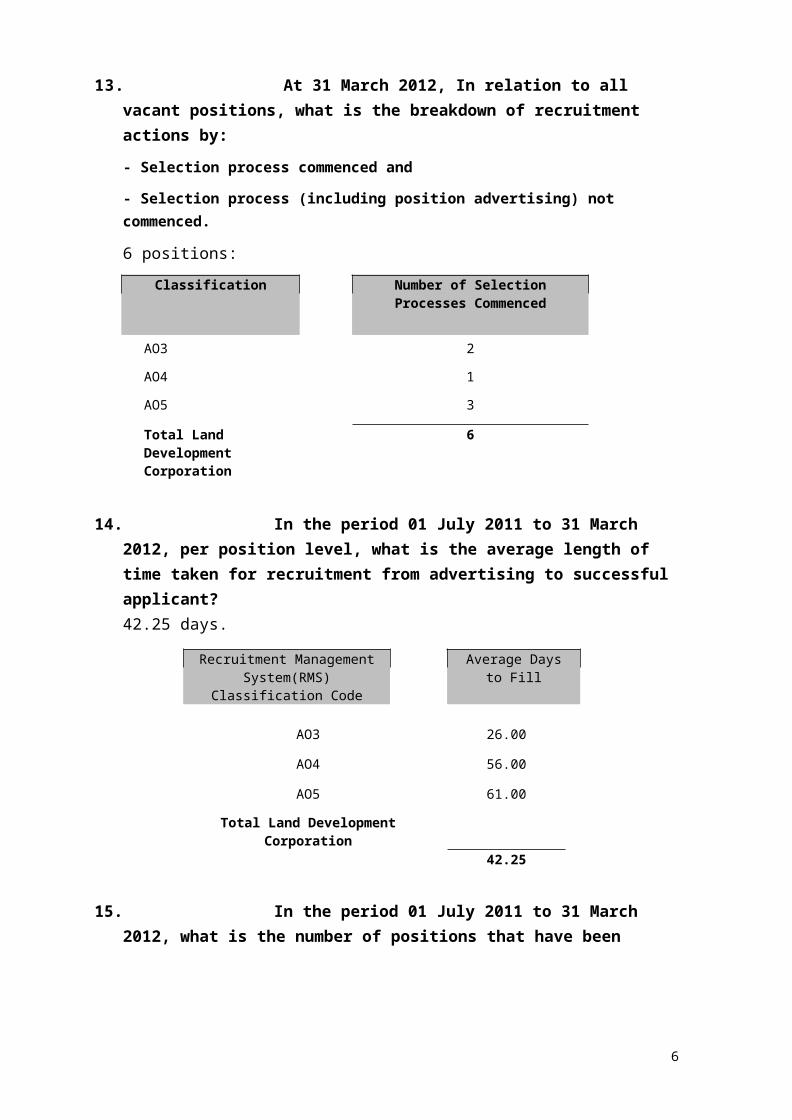
13. At 31 March 2012, In relation to all vacant positions, what is the breakdown of recruitment actions by:- Selection process commenced and
- Selection process (including position advertising) not commenced.
6 positions:
Classification Number of Selection Processes Commenced
AO3 2
AO4 1
AO5 3
Total Land Development Corporation
6
14. In the period 01 July 2011 to 31 March 2012, per position level, what is the average length of time taken for recruitment from advertising to successful applicant?42.25 days.
Recruitment Management System(RMS) Classification
Code
Average Days to Fill
AO3 26.00
AO4 56.00
AO5 61.00
Total Land Development Corporation42.25
15. In the period 01 July 2011 to 31 March 2012, what is the number of positions that have been filled by the recruitment of an existing public servant, and how many from the general public?
Of the 6 positions, 4 were filled by existing NTPS employees and 2 were filled by the general public.
16. In the period 01 July 2011 to 31 March 2012, how many positions have been reclassified in the department? What are the level of those positions?
Nil.
6

17. At Pay day 20, 28 March 2012, how many permanent supernumerary unattached employees do you have in your agency? What levels are they?
1 employee.
Classification Code
Classification Description Count
AO4 ADMINISTRATIVE OFFICER 4 1
Land Development Corporation Total 1
18. In the period 01 July 2011 to 31 March 2012, how many unattached employees have successfully gained nominal positions within the Agency or gained employment in another Agency?
2 unattached employees have successfully gained nominal positions.
19. In the period 01 July 2011 to 31 March 2012, how many unattached employees resigned?
Nil.
20. At Pay day 20, 28 March 2012, what is the average length of stay ofstaff in the department? Please break this down by position level.2.62 years.
Classification Code
Classification Description
Number of Staff Average length of Service in
Years
AO3 ADMINISTRATIVE OFFICER 3 1 0.15
AO4 ADMINISTRATIVE OFFICER 4 1 3.88
AO5 ADMINISTRATIVE OFFICER 5 3 1.93
AO6 ADMINISTRATIVE OFFICER 6 1 4.58
AO7 ADMINISTRATIVE OFFICER 7 1 0.24
EO1C EXECUTIVE OFFICER 1 - EXECUTIVE CONTRACT
1 2.72
EO2C EXECUTIVE OFFICER 2 - EXECUTIVE CONTRACT
1 0.95
7

EO3C EXECUTIVE OFFICER 3 - EXECUTIVE CONTRACT
1 3.21
SAO1 SENIOR ADMINISTRATIVE OFFICER 1
5 3.55
Land Development Corporation Total 15 2.62
8

21. In the period 01 July 2011 to 31 March 2012, how much has been spent to date on advertising employee positions, and can you provide a breakdown of these costs?
The Corporation spent $471.48 to 31 March 2012 on advertising positions locally.
22. In relation to Apprentices and Graduates, who commenced during the 2011 calendar year:- How many graduates started with the department
- How many have completed the year
- How many how won nominal positions
- How many have left the NTG, and
- What was the length of time each stayed within the NTG before leaving?
Nil as the Corporation is included within the Department of Lands and Planning graduate program.
23. At Pay day 20, 28 march 2012, In relation to Indigenous Employees: How many employees do you have in your department that recognise themselves as indigenous?- What are the levels of their positions held?
- How many at each level?
- How many are tenured and at what level?
- How many are temporary and at what levels?
- How many are acting up in positions and at what level?
- How many were still employed at 31/12/2011?
- How many have left the NTG?
Nil
9

24. In relation to NTPS staff as at 31 March 2012:- What is the total amount of accrued leave in the department, broken down by level, long service leave and recreation leave
- What is the financial value of that leave?
- What is the highest individual amount of accrued leave at each position level?
- What is the current total of sick leave entitlement of employees in the department?
- How many days sick leave were taken between 01 July 2011 and 31 March 2012, at each employee level?
Answered in conjunction with Question 25.
25. In relation to Contract (ECO1 and above) staff as of 31 March 2012:- What is the total amount of accrued leave in the department, broken down by level, long service leave and recreation leave? What is the financial value of that leave?
- What is the highest individual amount of accrued leave at each employee level?
- What is the current total of sick leave entitlement of employees in the department?
- How many days sick leave were taken between 01 July 2011 and 31 March 2012, at each employee level?
Q24 & 25 - Long Service LeaveState
Classification Q24 NTPS Staff
Accrued Long
Service Leave
(Months)
Q24 NTPS Staff
Accrued Long
Service Leave
($Value)
Q25 Contract
Staff Accrued
Long Service
Leave (Months)
Q25 Contract
Staff Accrued
Long Service
Leave ($Value)
Highest Individual
Amount Accrued (Months)
Z
AO3 0.02 $102.20 0.00 $0.00 0.02Z
AO4 1.15 $5,761.88 0.00 $0.00 1.15Z
AO5 2.22 $11,656.78 0.00 $0.00 1.57Z
AO6 2.47 $16,688.51 0.00 $0.00 2.47Z
AO7 3.60 $27,621.30 0.00 $0.00 3.60Z
EO1C 0.80 $11,906.93 0.80 $11,906.93 0.80Z
10

EO2C 0.27 $4,470.10 0.27 $4,470.10 0.27Z
EO3C 10.67 $189,183.23 10.67 $189,183.23 10.67Z
SAO1 17.22 $139,665.71 0.00 $0.00 8.42Z
Land Development Corporation
38.42 $407,056.64 11.74 $205,560.26 10.67
Q24 & 25 - Recreation LeaveState Cde
Classification Q24 NTPS Staff
Accrued Recreation
Leave (Days)
Q24 NTPS Staff
Accrued Recreation
Leave ($Value)
Q25 Contract
Staff Accrued
Recreation Leave (Days)
Q25 Contract
Staff Accrued
Recreation Leave
($Value)
Highest Individual
Amount Accrued
(Days)
Z
AO3 0.00 $0.23 0.00 $0.00 0.00Z
AO4 33.37 $7,691.66 0.00 $0.00 33.37Z
AO5 60.20 $15,974.30 0.00 $0.00 45.20Z
AO6 42.59 $13,212.18 0.00 $0.00 42.59Z
AO7 67.75 $23,913.13 0.00 $0.00 67.75Z
EO1C 46.81 $32,053.74 46.81 $32,053.74 46.81Z
EO2C 4.96 $3,705.68 4.96 $3,705.68 4.96Z
EO3C 56.28 $45,886.67 56.28 $45,886.67 56.28Z
SAO1 219.99 $82,789.14 0.00 $0.00 57.00Z
Land Development Corporation
531.95 $225,226.73 108.05 $81,646.09 67.75
Classification ClassificationDescription
Number of Staff
Q24(d)Total Sick
Leave Entitlements
in weeks
Q25 (d) Executive
Contract Staff Sick Leave
Entitlements in weeks
AO3 ADMIN OFF 3 1 3.00 -AO4 ADMIN OFF 4 1 - -AO5 ADMIN OFF 5 3 16.21 -
11

AO6 ADMIN OFF 6 1 66.77 -AO7 ADMIN OFF 7 1 61.30 -EO1C EXEC OFF 1 CNTR 1 5.80 5.80 EO2C EXEC OFF 2 CNTR 1 0.91 0.91 EO3C EXEC OFF 3 CNTR 1 94.07 94.07 SAO1 SNR ADMIN OFF 1 5 148.80 -TOTAL (Land Development Corporation)
15 396.87 100.78 Q24 & 25 - Sick Leave Entitlements
12

Q24 & 25 - Sick Leave Taken
Classification Classification Description Number of Staff
Q24NTPS Staff Days Sick Leave Taken
Q25Executive Contract
Staff Days Sick Leave
TakenAO3 ADMIN OFF 3 1 5.00 -AO4 ADMIN OFF 4 1 12.00 -AO5 ADMIN OFF 5 3 12.71 -AO6 ADMIN OFF 6 1 5.00 -AO7 ADMIN OFF 7 1 2.00 -SAO1 SNR ADMIN OFF 1 5 24.00 -TOTAL (Land Development Corporation) 13 60.71 -
26. In the period 01 July 2011 to 31 March 2012, how many employees have utilised section 52.8 Cash-out of Leave — (Recreation Leave), under the NTPS 2010-2013 Enterprise Agreement?- Break down by level and amount of leave
1 employee as detailed below.
Classification
Classification Description Number of Staff Days
NTPS EBASAO1 SNR ADMIN OFF 1 1 10
TOTAL (Land Development Corporation) 1 10
27. In the period 01 July 2011 to 31 March 2012, how many employees have utilised section 55.3 (b) Long Service Leave cash out of 10 years, under the NTPS 2010-2013 Enterprise Agreement?
- Break down by level and amount of leave
Nil.
28. During the period 01 July 2011 to 31 March 2012, did the CEO direct any employee under section 52.7 Excess Leave of the NTPS 20102013 Enterprise Agreement to take leave?- Break down by level and the amount of leave taken
Nil.
13

29. During the period 01 July 2011 to 31 March 2012, did the CEO direct any employee under section 55.3 (a) Long Service Leave to take leave?- Break down by level and the amount of leave
Nil.
30. At Pay day 20, 28 March 2012, how many workers were on workers compensation? At what level and is there an expected return date?
Nil.
31. From 01 July 2011 to 31 March 2012, how many people received workers compensation, at what position level and geographic location and how long for each person?
Nil.
32. At Pay day 20, 28 March 2012, how many workers were on sick leave or extended leave (excluding recreation leave), longer than 3 weeks, at what level, and for what reason?
Nil.
33.At Pay day 20, 28 March 2012, were there any NTPS public servants who were employed in the 80's and eligible for return flight to Adelaide every 2 years? How many and at what level?
1 eligible employee as detailed below.
Classification Classification Description Employees Eligible for Airfares
AO6 ADMINISTRATIVE OFFICER 6 1
Total for Land Development Corporation 1
34.How many complaints have been made in the Department in relation to workplace bullying and harassment?
Nil.
In relation to each output group within the Department:
35.From 01 July 2011 to 31 March 2012, how much has been spent on relocation cost for commencement of employment and either completion or termination of employment (removalists, airfares, accommodation and allowances) in the Department.
Nil.
14

36.Please provide a breakdown per business unit.
N/A.
37.How much is budgeted for relocation and other appointment and termination expenses in 2011/12.Nil.
38.How much was spent on travel from 01 July 2011 to 31 March 2012, broken down by intrastate, interstate and international fares, accommodation and other expenses?
$33,843 was spent on staff travel and $81,071 on Advisory Board travel.
Breakdown of expenditure provided below.
Staff Travel Expenditure Intra-Territory
($)
Interstate($)
Overseas($)
Total ($)
Official Duty Fares 0 18 579 564 19 143
Accommodation 114 11 577 810 12 501
Travel Allowance 0 1 960 239 2 199
Total Travel Spend as at 31 March 2012
114 32 116 1 613 33 843
Advisory Board Travel Expenditure Total ($)
Board Member – Fares 71 460
Board Member - Accommodation 9 611
Total Board Member Travel Spend as at 31 March 2012
81 071
39.How much was spent on vehicles by the Department from 01 July 2011 to 31 March 2012?
$51,762
40.How many vehicles does the Department have responsibility for?
5 vehicles.
15

41.What is the change, if any, in these vehicle numbers from the previous year?
Previous year the Corporation had 4 vehicles.
42.What proportion of those vehicles meet the emission standard of 5.5 out of 10 under the Commonwealth Government's Green Vehicle Guide?
4 of the 5 (80%) vehicles meet the emission standard.
43. How many vehicles are home garaged?5 vehicles.
44. What position levels have vehicles attached or are allowed to home garage?
1 x ECO3, 2 x ECO1, 2 x SAO1
45. How many credit cards have been issued to department staff?
4.
46. How many repayment transactions (and the value) for personal items and services are outstanding?
Nil.
47. How many reports of the improper use of Information Technology have been made?
Nil.
48. How many reports resulted in formal disciplinary action?
N/A.
49. How many staff are considered 'Essential' in your Agency, for the purposes of an Emergency eg- Cyclone- Break down by level
Depending on the size and nature of the event, and the time of year, there are a number of officers that are assigned with responsibility for support and coordination of tasks to ensure the Department is able to perform its core business functions in the event of an emergency. Particular staff are also assigned with specific responsibilities at different stages of the response and recovery phases. Additional staff may also be assigned with specific duties to assist in whole of government or internal coordination activities.
16

Marketing:
50. From 01 July 2011 to 31 March 2012, how much was spent by the Department on advertising and marketing programs?
2011/2012 Financial Year to 31 March 2012
Advertising $49,495
Marketing and Promotions $168,723
TOTAL $218,218
51. What was each of those programs and what was the cost of each of those programs?
Advertising Information
Area Consultant ValueIndustrial
Darwin Business Park South
General Land Release Advertising
Various Publications including NT News, Business Review, Minerals Council, Oil and Gas Magazines, the Palmerston Suns
$16,011
Industrial Total $16,011Residential
Bellamack Gardens
Sales Advertising Various but mainly NT News
$26,309
Johnston Advertising and promotion of the EOI
Various but mainly NT News
$7,175
Residential Total $33,484
Marketing Information
Area Item Consultant ValueCorporate Promotional items
SEAAOC Conference 2011 registration and booth and registration for 2012
Property Council Congress and event registrations
NT Major Projects conference 2011
Various
Informa conferences and Fusion Displays
Property Council
$11,490
$20,998
$8,002
17

registration and booth and registration for 2012
Banners and Signs
UDIA Dinner Sponsorship
Green Building Council Sponsorship
General Corporate Advice including the development of Strategic marketing plans, collateral, fact sheets etc
Expotrade and Fusion Displays
Various
UDIA
Green Building Council
Various
$11,460
$4,450
$2,000
$10,000
$37,778
Corporate Total $106,178Industrial Projects
Common User Area
Defence Support Hub
Darwin Business Park
Brand development, Advertisement design and marketing plans
Associated Advertising and Promotion
Industrial Total $26,959Residential Projects
Bellamack Gardens
Zuccoli Johnston
Development and production of marketing strategies, collateral, signs, documentation for EOI processes etc.
Associated Advertising and Promotion
Residential Total $35,586
Insurance:
52. From 01 July 2011 to 31 March 2012, how much was spent on insurance expenses; further broken down by worker and employee insurances, physical plant and equipment insurances and other insurances?
Property - $15,040Public Liability - $3,845Workers Compensation - $14,625Motor Vehicle - $2,955
18

53. What areas of the department are self-insured? What areas are commercially insured? If there are areas that are commercially insured, who provides this insurance, when is it due for renewal and what is the cost of this insurance provision and does it attract any thresholds under which insurance is not provided or any payments on item replacement?
A risk assessment was undertaken and the Corporation obtained commercial insurance as per above. These insurances are due for renewal on 30/06/2012.
54. What provision has been made for disaster or major catastrophe insurance?
Treasurer’s Advance is available to agencies in the event disaster costs exceed budget during the year.
The Territory does not purchase reinsurance cover for natural disasters or other insurable risks under the self insurance policy. Instead, the Territory makes provision in the Budget for disaster related events, complemented by the Natural Disaster Recovery and Relief Arrangements (NDRRA) with the Commonwealth to provide assistance for natural disaster events that are outside of the Territory’s control and where commercial insurance is not readily available or affordable.
Any whole of government insurance policy related questions should be referred to the Treasurer.
Climate Change:
55.From 01 July 2011 to 31 March 2012, how many tonnes of CO2 did the department emit?
The Corporation emitted 25.20 tonnes of emissions from the use of motor vehicles in the previous year and this figure has not changed significantly with the additional vehicle.
56.From 01 July 2011 to 31 March 2012, what programs and strategies were introduced to reduce CO2 emissions across the department?
Vehicle management programme
57.Has a target for departmental CO2 emissions been set for the coming financial year?
- If yes, what % reduction is that from the previous year?- If no, why has a target not been set?
The CO2 reduction target has been set at 2 percent for 2012-13 for the vehicle fleet.
19

The targets in the NT Government Energy Smart Buildings Policy has now been superseded by the 2009 NTG Climate Change Policy, which sets a reduction target of 33 percent in building energy intensity by 2020 from the 2004/05 base year.
Utilities:
58.From 01 July 2011 to 31 March 2012, what was the cost of power and water to the department?
$17,187
59.What is the projected cost for power and water to the department for the 2012-2013 financial year?
$20,000
Public Events:
60.From 01 July 2011 to 31 March 2012, list the public events/conferences/forums that were sponsored by the department. What are projected for the 2012-2013 financial year?
2011/12 – UDIA Annual Dinner
- Green Building Council
2012/13 – UDIA Annual Dinner
61.What is the level of sponsorship provided in terms of financial support or in kind support?
2011/12 - $12,000
2012/13 - $15,000
Advertising:
62.What is the department's budget for advertising for the 2011-2012 financial year?
$44,150
63.How much is year to date expenditure? Please breakdown into newspaper, radio and TV?
TV: NilRadio: NilNewspaper: $41,347Billboard: $8,148
20

The increased advertising expenditure compared to budget relates to the billboard advertising of the East Arm Logistics Precinct at the Airport
64.What advertising campaigns have been undertaken or will be undertaken by the department in 2011-2012 financial year?
Details provided at Question 51.
65.From 01 July 2011 to 31 March 2012, how many consultancies were let in the year, at what cost, how many were NT firms and how many interstate and what was the value of those intra-territory and those interstate?
7 consultancies have been let and the detail is provided below.
Contractor Name Title of Requisition
Contractor City
Contractor State
Contract Value
Hyder Consulting Pty Limited
Darwin - Consultancy - Feasibility and Business Case for Development of Waterfront Land at East Arm MELBOURNE VIC
$810,818
Cardno (NT) Pty Ltd
Survey, Design and Documentation for the Re-Grading and Drainage of Part Section 6117 and Part Section 6127, Berrimah Road, East Arm. (Proposed Laydown Area No 2) DARWIN NT
$42,174
Diggamen Civil Contracting Extension of Carport Berrimah NT
$30,278
Michels Warren Munday
Darwin - Maluka Community and Stakeholder Consultation PARAP NT
$32,934
Ninox Solutions
Darwin - Consultancy - Technical advice on Gas related projects Carnegie VIC
$43,754
Parsons Brinkerhoff
East Arm - Darwin Business Park North - Consultancy - Proposed Active Level Crossing of The Adelaide to Darwin Railway Woolner NT
$13,376
Place Design Maluka Concept Brisbane Qld
$11,408
21