· web viewplease use the various columns to help you guide your work. some live hyperlinks...
TRANSCRIPT

Name: Class group :Revision + course guide for SL and HL Economics 2011-2015
SYLLABUS OUTLINE1 : HL 185 Things to do!
SYLLABUS OUTLINE2 : SL 119 Things to do!How important is each topic listed in the syllabus? Weighting for items in the syllabus: read carefully! It will save you valuable time. 1 = define 2 = define + example 3 = define +example + diagram 4 = important concept requiring ability to explain + analyse 5 = critical concept requiring ability to evaluate/discuss Process Folio Completion Dates Teaching
Hours
Section 1: Microeconomics1.1 Competitive markets: demand and supply (some topics HL only) Completion Date: September 201.2 Elasticity Completion Date: September 301.3 Government intervention (some topics HL extension, plus one topic Completion Date: October 31HL only)1.4 Market failure (some topics HL only) Completion Date: November301.5 Theory of the firm and market structures (HL only) Completion Date: February 28
35 95
Section 2: Macroeconomics2.1 The level of overall economic activity (one topic HL extension) Completion Date: March 152.2 Aggregate demand and aggregate supply (one topic HL only) Completion Date: April 152.3 Macroeconomic objectives (some topics HL extension, plus one topic HL only) Completion Date: May 212.4 Fiscal policy Completion Date: August 25 (Grade 12)2.5 Monetary policy September 10 (Grade 12)2.6 Supply-side policies September 20 (Grade 12)
40 50
Section 3: International economics3.1 International trade (one topic HL extension, plus one topic HL only) September 30 (Grade 12)3.2 Exchange rates (some topics HL extension) October 15 (Grade 12)3.3 The balance of payments (one topic HL extension, plus some topics HL only) October 30 (Grade 12)3.4 Economic integration (one topic HL extension) November 15 (Grade 12)3.5 Terms of trade (HL only) January 30 (Grade 12) Syllabus read with notes and dictionary.
25 45
Section 4: Development economics4.1 Economic development Completion Date: October 84.2 Measuring development Completion Date: October 314.3 The role of domestic factors Completion Date: November 244.4 The role of international trade (one topic HL extension) Completion Date: January 304.5 The role of foreign direct investment (FDI)
30 30
1 Updated June 2011 to show links to webnotes2 Updated June 2011 to show links to webnotes
Page 1 of 91 webnote 601 (for class of 2013)
Class of 2015 + 2016 (last updated @ August 22, 2014) Webnote 601
Is a "term/ word" in the syllabus?Do a search? Select " Control f " and you can search for the "term / word".
1
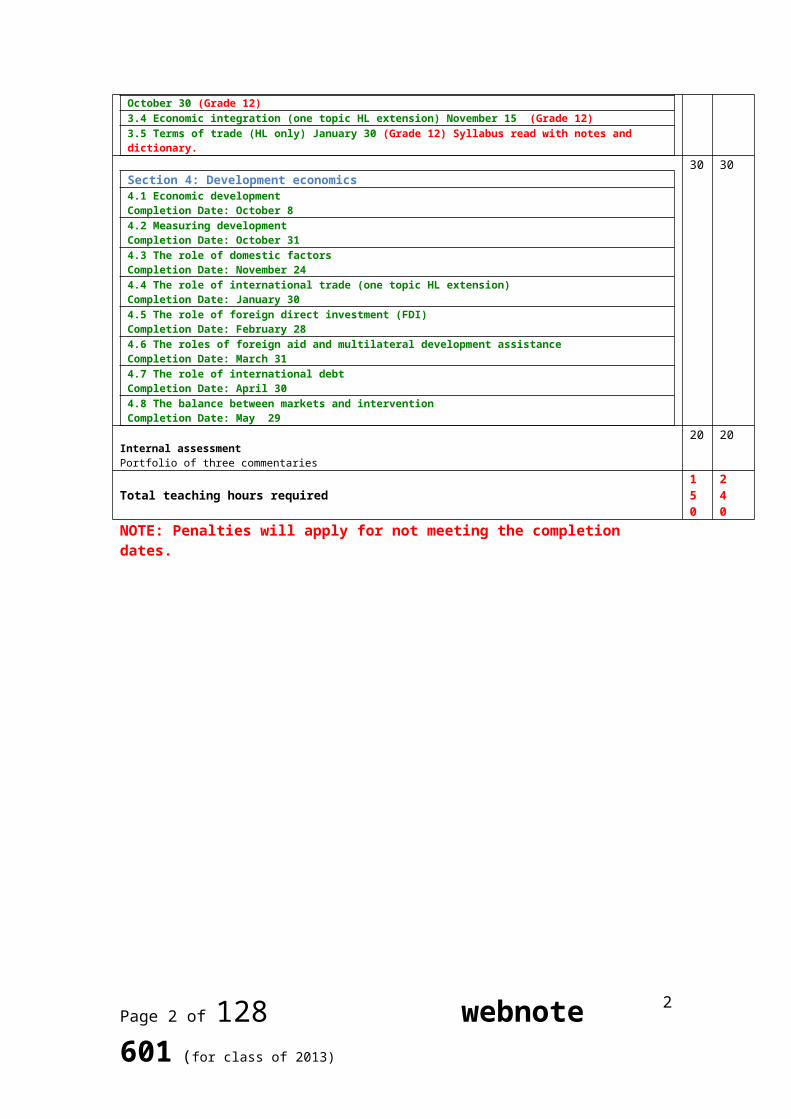
Completion Date: February 284.6 The roles of foreign aid and multilateral development assistance Completion Date: March 314.7 The role of international debt Completion Date: April 304.8 The balance between markets and intervention Completion Date: May 29
Internal assessmentPortfolio of three commentaries
20 20
Total teaching hours required150
240
NOTE: Penalties will apply for not meeting the completion dates.
2013 syllabus @ http://economics.isdedu.de
This guide will help you to work through the syllabus independently. In this you have a detailed and complete list of all the content you are required to know and understand.
Please use the various columns to help you guide your work. Some live hyperlinks links are also included (See ‘video’ column) to help you to find key parts of the syllabus for revision either for short video clips (PAJ) or for powerpoint slides (PP). Webnotes are numbered for your attention and numbers in brackets are worksheets that should also be useful for revision)
Tip! Use this document each time you do reading in the syllabus and tick of each item as you take notes!
ITEM sl hl
Must KnowMust know very well! Here are the details of what you need to know.
Reading Example U-tube W EIGHT
WEBNOTE
Section 1: Microeconomics1.1 Competitive markets: Demand and supply
1.1 Competitive markets: Demand and supply
Markets
1The nature of markets
Outline the meaning of the term market.
Blink c 1+ c2
Example U-tube 2 100-114
Demand
Page 2 of 91 webnote 601 (for class of 2013)2

2The law of demand
Explain the negative causal relationship between price and
quantity demanded. Describe the
relationship between an individual consumer’s demand and market demand.
Blink c 1+ c2
Example U-tube
PAJ3 229
3The demand curve
Explain that a demand curve represents the relationship between the price and the quantity demanded of a product, ceteris paribus.
Draw a demand curve.
Blink c 1+ c2
Example U-tube 3 110
4The non-pricedeterminants ofdemand (factors thatchange demand or shiftthe demand curve)
Explain how factors including changes in income (in the cases of normal and inferior goods), preferences, prices of related goods (in the cases of substitutes and complements) and demographic changes
may change demand.
Blink c 1+ c2
Example U-tube 3 229
229
5Movements along andshifts of the demandcurve
Distinguish betweenmovements along the demandcurve and shifts of the demandcurve. Draw diagrams to showthe difference betweenmovements along the demandcurve and shifts of the demandcurve.
Blink c 1+ c2
Example U-tube 3 229
(235) worksheetin red
ITEM sl hl Must Know Must know very well! Here are the details of what you need to know.
Reading
Example U-tube W e ight
Webnote
6
HL(only)
Linear demandfunctions (equations),demand schedules andgraphs
• Explain a demand function(equation) of the formQd = a – bP.• Plot a demand curve from alinear function(eg. Qd = 60 – 5P).• Identify the slope of thedemand curve as the slopeof the demand functionQd = a – bP, that is –b(the coefficient of P).
Blink c 3
Example U-tube
3
Page 3 of 91 webnote 601 (for class of 2013)3

• Outline why, if the “a” termchanges, there will be a shift ofthe demand curve.• Outline how a change in “b”affects the steepness of thedemand curve.
Supply7 The law of
supply Explain the positive
causalrelationship between price andquantity supplied. Describe the
relationshipbetween an individualproducer’s supply and marketsupply.
Blink c 1+ c2
Example U-tube
PAJ3
228
8 The supply curve
Explain that a supply curve
represents the relationshipbetween the price and thequantity supplied of a product,ceteris paribus. Draw a supply curve.
Blink c 1+ c2
Example U-tube
3111
9 The non-pricedeterminants of supply(factors that changesupply or shift thesupply curve)
Explain how factors including
changes in costs of factorsof production (land, labour,capital and entrepreneurship),technology, prices of relatedgoods (joint/competitivesupply), expectations, indirecttaxes and subsidies and thenumber of firms in the marketcan change supply.
Blink c 1+ c2
Example U-tube
3228
228
10Movements along andshifts of the supplycurve
• Distinguish betweenmovements along the supplycurve and shifts of the supplycurve.• Construct diagrams to showthe difference betweenmovements along the supplycurve and shifts of the supplycurve.
Blink c 1+ c2
Example U-tube
3228
(236)worksheetin red
Linear supply
Explain a supply function
Blink c 3
Example U-tube
Page 4 of 91 webnote 601 (for class of 2013)4

11
HL(only)
functions,equations and graphs
(equation) of the formQs = c + dP.• Plot a supply curve from alinear function (eg, Qs = –30 +20 P).• Identify the slope of the supplycurve as the slope of thesupply function Qs = c + dP,that is d (the coefficient of P).• Outline why, if the “c” termchanges, there will be a shift ofthe supply curve.• Outline how a change in “d”affects the steepness of thesupply curve.
3
Market equilibrium
12Equilibrium andchanges to equilibrium
Explain, using diagrams, how demand and supply interact to produce market equilibrium.
Analyse, using diagrams
and with reference to excessdemand or excess supply, howchanges in the determinants ofdemand and/or supply result ina new market equilibrium.
Blink c 1+ c2 + c3
Example U-tube
3108
(262)worksheetin red
13
HL(only)
Calculating andillustrating equilibriumusing linear equations
Calculate the equilibrium priceand equilibrium quantity fromlinear demand and supplyfunctions.• Plot demand and supplycurves from linear functions,and identify the equilibriumprice and equilibrium quantity.• State the quantity of excessdemand or excess supply inthe above diagrams.
Blink c 3
Example U-tube
3
The role of the price mechanismResource Explain why scarcity Blink Example U-tube 108
Page 5 of 91 webnote 601 (for class of 2013)5

14 allocation necessitates choices thatanswer the “What to produce?”question.• Explain why choice results inan opportunity cost.• Explain, using diagrams, thatprice has a signaling functionand an incentive function,which result in a reallocation ofresources when prices changeas a result of a change indemand or supply conditions.
c 1+ c2 4104
102
Market efficiency
15Consumer surplus
Explain the concept ofconsumer surplus. dentify consumer
surplus on a demand and supply diagram.
Blink c 1+ c2
Example U-tubePAJ
PAJ
3 106
16Producer surplus
Explain the concept ofproducer surplus. Identify producer
surplus on a demand and supply diagram.
Blink c 1+ c2
Example U-tube
PAJ3 106
17Allocative efficiency
Explain that the best allocation of resources from society’s point of view is at competitive market equilibrium, where social (community) surplus (consumer surplus and producer surplus) is maximized (marginal benefit = marginal
cost).
Blink c 1+ c2
Example U-tube 4 104
106
267
TOKTheory of knowledge: potential connectionsTo what extent is it true to say that a demand curve is a fictional entity?What assumptions underlie the law of demand? Are these assumptions likely to be true? Does itmatter if these asssumptions are actually false?
1.2 Elasticity Blink c 4
Example U-tube
Price elasticity of demand (PED)
18 Price elasticity of demand and itsdeterminants
• Explain the concept of price elasticity of demand,understanding that it involves responsiveness ofquantity demanded to a change in price, along a givendemand curve.
Blink c 4
Example U-tube
PAJ
PAJ
PP
3 201
202
Page 6 of 91 webnote 601 (for class of 2013)6

• Calculate PED using the following equation.
PED=percentage change in quantity demanded divided by percentage change in price
• State that the PED value is treated as if it were positivealthough its mathematical value is usually negative.• Explain, using diagrams and PED values, the conceptsof price elastic demand, price inelastic demand, unitelastic demand, perfectly elastic demand and perfectlyinelastic demand.• Explain the determinants of PED, including the numberand closeness of substitutes, the degree of necessity,time and the proportion of income spent on the good.• Calculate PED between two designated points on ademand curve using the PED equation above.• Explain why PED varies along a straight line demandcurve and is not represented by the slope of thedemand curve.
PAJ
PAJ
201
202
19Applications of priceelasticity of demand
• Examine the role of PED for firms in making decisionsregarding price changes and their effect on totalrevenue.• Explain why the PED for many primary commodities isrelatively low and the PED for manufactured products isrelatively high.• Examine the significance of PED for government inrelation to indirect taxes.
Blink c 4
Example U-tube 4 708
241
Page 7 of 91 webnote 601 (for class of 2013)7

Cross price elasticityof demand and its determinants
20 • Outline the concept of cross price elasticity of demand,understanding that it involves responsiveness ofdemand for one good (and hence a shifting demandcurve) to a change in the price of another good.• Calculate XED using the following equation.
XEDpercentage change in quantity demanded of good x divided bypercentage change in price of good y
• Show that substitute goods have a positive value ofXED and complementary goods have a negative valueof XED.• Explain that the (absolute) value of XED depends on thecloseness of the relationship between two goods.
Blink c 4
Example U-tube
PAJ3 204
21Applications of cross price elasticity ofdemand
• Examine the implications of XED for businesses if pricesof substitutes or complements change.
Blink c 4
Example U-tube 3 204
Income elasticity of demandand its determinants
22 • Outline the concept of income elasticity of demand,understanding that it involves responsiveness ofdemand (and hence a shifting demand curve) to achange in income.• Calculate YED using the following equation.
YED =percentage change in
Blink c 4
Example U-tube
PAJ3 204
Page 8 of 91 webnote 601 (for class of 2013)8

quantity demanded divided by percentage change in income
• Show that normal goods have a positive value of YEDand inferior goods have a negative value of YED.• Distinguish, with reference to YED, between necessity(income inelastic) goods and luxury (income elastic)goods.
23Applications of incomeelasticity of demand
• Examine the implications for producers and for theeconomy of a relatively low YED for primary products, arelatively higher YED for manufactured products and aneven higher YED for services.
Blink c 4
Example U-tube 3 204
For Revision use:
263: Worksheet: Price Elasticity of Demand (PeD) 264: Worksheet: elasticity and taxes
Price elasticity of supplyand its determinants24 • Explain the concept of
price elasticity of supply,understanding that it involves responsiveness ofquantity supplied to a change in price along a givensupply curve.• Calculate PES using the following equation.
PES=percentage change in quantity supplied divided bypercentage change in price
• Explain, using diagrams and PES values, the conceptsof elastic supply, inelastic supply, unit elastic supply,
Blink c 4
Example U-tube
PAJ3 204
Page 9 of 91 webnote 601 (for class of 2013)9

perfectly elastic supply and perfectly inelastic supply.• Explain the determinants of PES, including time,mobility of factors of production, unused capacity and ability to store stocks.
25Applications of priceelasticity of supply
• Explain why the PES for primary commodities isrelatively low and the PES for manufactured products isrelatively high.
Blink c 4
Example U-tube 3
1.3 Government intervention- 3 types
Blink c 5
Example U-tube
(1) Indirect taxes
26Specific (fixed amount)taxes and ad valorem(percentage) taxes andtheir impact on markets
• Explain why governmentsimpose indirect (excise) taxes.• Distinguish between specificand ad valorem taxes.• Draw diagrams to showspecific and ad valorem taxes,and analyse their impacts onmarket outcomes.• Discuss the consequences ofimposing an indirect tax onthe stakeholders in a market,including consumers, producers and the government.
Blink c 5
Example U-tube 4 206
255
27 HL Only
Tax incidence and priceelasticity of demand andsupply
• Explain, using diagrams, howthe incidence of indirecttaxes on consumers and firmsdiffers, depending on the priceelasticity of demand and on theprice elasticity of supply.• Plot demand and supplycurves for a product fromlinear functions and thenillustrate and/or calculate theeffects of the imposition ofa specific tax on the market(on price, quantity, consumer
Blink c 5
Example U-tube 3
3
206
255
Page 10 of 91 webnote 601 (for class of 2013)10

expenditure, producerrevenue, government revenue,consumer surplus + producersurplus).
(2) Subsidies
28 SubsidiesImpact on markets
• Explain why governmentsprovide subsidies, and describeexamples of subsidies.• Draw a diagram to showa subsidy, and analyse theimpacts of a subsidy onmarket outcomes.• Discuss the consequencesof providing a subsidy onthe stakeholders in a market,including consumers, producers+ government
Blink c 5
Example U-tube 4 206
ITEM sl hlMust Know Must know very well! Here
are the details of what you need to know.
Reading Example U-tube W e ight
Webnote
29 HL Only
SubsidiesImpact on markets
• Plot demand and supplycurves for a product fromlinear functions and thenillustrate and/or calculatethe effects of the provisionof a subsidy on the market(on price, quantity, consumerexpenditure, producerrevenue, governmentexpenditure, consumersurplus and producer surplus).
Blink c 5
Example U-tube 3 206
(3) Price Controls
Blink c 5
Example U-tube 223
30 Price ceilings (maximumprices): rationale,consequences andexamples
• Explain why governmentsimpose price ceilings, anddescribe examples of priceceilings, including food pricecontrols and rent controls.• Draw a diagram to show
Example U-tube 5 223
Page 11 of 91 webnote 601 (for class of 2013)11

aprice ceiling, and analyse theimpacts of a price ceiling onmarket outcomes.• Examine the possibleconsequences of a priceceiling, including shortages,inefficient resource allocation,welfare impacts, undergroundparallel markets and non-pricerationing mechanisms.• Discuss the consequencesof imposing a price ceilingon the stakeholders in amarket, including consumers,producers and thegovernment.
31 HL Only
Price controlsPrice ceilings (maximumprices): rationale,cons-equences andexamples
• Calculate possible effectsfrom the price ceiling diagram,including the resultingshortage and the change inconsumer expenditure (whichis equal to the change in firmrevenue).
Blink c 5
Example U-tube 3 223
32Price floors (minimumprices): rationale,consequences andexamples
• Explain why governmentsimpose price floors, anddescribe examples of pricefloors, including price supportfor agricultural products andminimum wages.• Draw a diagram of a pricefloor, and analyse the impactsof a price floor on marketoutcomes.• Examine the possibleconsequences of a pricefloor, including surplusesand government measuresto dispose of the surpluses,inefficient resource allocationand welfare impacts.• Discuss the consequencesof imposing a price flooron the stakeholders in amarket, including consumers,
Blink c 5
Example
NOTE:There is a link here with item 146 in section 3.2Take a look at web 410 and managed exchange rate systems.Same diagram for both concepts
U-tube
PAJ5 223
Page 12 of 91 webnote 601 (for class of 2013)12

producers and thegovernment.
33 HL Only
Price floors (minimumprices): rationale,consequences andexamples
• Calculate possible effectsfrom the price floor diagram,including the resultingsurplus, the change inconsumer expenditure, thechange in producer revenue,and government expenditureto purchase the surplus.
Blink c 5
Example U-tube 3 223
TOKTheory of knowledge: potential connectionsIn what sense are we morally obliged to pay taxes? Is this the result of a promise that we have made ourselves? When was this promise made? (Make a distinction here between moral and legal obligations.)To what extent is government morally obliged to provide healthcare and welfare benefits to the unemployed?
1.4 Market failure
Blink c 12
Example U-tube
The meaning of market failure
34 Market failure as a failureto allocate resourcesefficiently
• Analyse the concept of market failure as a failure of themarket to achieve allocativeefficiency, resulting in an overallocation of resources (overprovision of a good) or anunder-allocation of resources(under-provision of a good)
Blink c 12
Example U-tube 4 See the ‘blue box’ in web 224
Types of market failure
35The meaning of externalities
• Describe the concepts ofmarginal private benefits(MPB), marginal social benefits(MSB), marginal private costs(MPC) and marginal socialcosts (MSC).• Describe the meaning ofexternalities as the failure ofthe market to achieve a socialoptimum where MSB = MSC.
Blink c 12
Example U-tube
PAJ3 See
web224
36Negative externalitiesof production and
• Explain, using diagramsand examples, the conceptsof negative externalitiesof production and
Blink c 12
Example U-tube
PAJ3 253
225226
Page 13 of 91 webnote 601 (for class of 2013)13

consumption
consumption, and the welfareloss associated with theproduction or consumption ofa good or service.• Explain that demeritgoods are goods whoseconsumption creates externalcosts.• Evaluate, using diagrams,the use of policy responses,including market-basedpolicies (taxation and tradablepermits), and governmentregulations, to the problemof negative externalities ofproduction and consumption
37Positive externalitiesof production andconsumption
• Explain, using diagramsand examples, the conceptsof positive externalitiesof production andconsumption, and the welfareloss associated with theproduction or consumption ofa good or service.• Explain that merit goods aregoods whose consumptioncreates external benefits.• Evaluate, using diagrams, theuse of government responses,including subsidies,legislation, advertising toinfluence behaviour, anddirect provision of goods andservices.
Blink c 12
Example U-tube 4 252
38Lack of public goods
• Using the concepts ofrivalry and excludability,and providing examples,distinguish between publicgoods (non-rivalrous and non excludable) and private goods (rivalrous and excludable).• Explain, with reference to thefree rider problem, how thelack of public goods indicatesmarket failure.• Discuss the implications of
Blink c 12
Example U-tube 5 252
Page 14 of 91 webnote 601 (for class of 2013)14

the direct provision of publicgoods by government.
39 up dated to 39
Common accessresources and the threat to sustainability
• Describe, using examples,common access resources.• Describe sustainability.• Explain that the lack ofa pricing mechanism forcommon access resourcesmeans that these goodsmay be overused/depleted/degraded as a result ofactivities of producers andconsumers who do not pay forthe resources that they use,and that this poses a threat tosustainability.• Explain, using negativeexternalities diagrams, thateconomic activity requiringthe use of fossil fuels to satisfydemand poses a threat tosustainability.• Explain that the existence ofpoverty in economically lessdeveloped countries createsnegative externalities throughover-exploitation of land foragriculture, and that this posesa threat to sustainability.• Evaluate, using diagrams,possible governmentresponses to threats tosustainability, includinglegislation, carbon taxes,cap and trade schemes,and funding for cleantechnologies.• Explain, using examples, thatgovernment responses tothreats to sustainability arelimited by the global natureof the problems and the lackof ownership of commonaccess resources, and thateffective responses requireinternational cooperation.
Blink c 12
Example U-tube 5
5
252
40 Asymmetric information
• Explain, using examples,that market failure mayoccur when one party in
Blink c 8
Example U-tube 4
Page 15 of 91 webnote 601 (for class of 2013)15

HL Only
an economic transaction(either the buyer or the seller)possesses more informationthan the other party.• Evaluate possible governmentresponses, includinglegislation, regulation andprovision of information.
41 HL Only
Abuse of monopolypower
• Explain how monopoly powercan create a welfare loss andis therefore a type of marketfailure.• Discuss possible governmentresponses, includinglegislation, regulation,nationalization and tradeliberalization.
Blink c 8
Example U-tube 4
TOKTheory of knowledge: potential connectionsTo what extent is the obligation to seek sustainable modes of consumption a moral one?What knowledge issues are involved in assessing the role of technology in meeting future patternsof consumption and decreasingthe negative externalities of consumption associated with fossil fuels?What are the knowledge issues involved in determining what is a rational cost to pay for haltingclimate change?How could we know if economically more developed countries are morally justified in interfering inthe development of economically less developed countries on the grounds of climate change?How can we know when climate change is sufficiently serious to warrant government interfering inthe freedom of its citizens to consume?How can we calculate the external costs of producing and running items such as light bulbs or motorvehicles? For example, low energy light bulbs consume less energy but they require more energy toproduce, and some brands contain materials that are harmful to the environment such as mercury.Hybrid cars consume less energy to run but consume more energy to produce.What are the problems in knowing whether climate change is produced by human activity?
1.5 Theory of the firm and market structures (HL only)
Blink cc 6-11
Example U-tube
Production and costs42HL Only
Production in theshort run: the law ofdiminishing returns
• Distinguish between theshort run and long run in thecontext of production.• Define total product, averageproduct and marginalproduct, and construct
Blink c 6
Example U-tube 3 251
Page 16 of 91 webnote 601 (for class of 2013)16

diagrams to show theirrelationship.• Explain the law of diminishingreturns.• Calculate total, average andmarginal product from a set ofdata and/or diagrams.
43 HL Only
Costs of production:economic costs
• Explain the meaning ofeconomic costs as theopportunity cost of allresources employedby the firm (includingentrepreneurship).• Distinguish between explicitcosts and implicit costs as thetwo components of economiccosts.
Blink c 6
Example U-tube 3 211218216
44 HL Only
Costs of production inthe short run
• Explain the distinction between the short run and the long run,with reference to fixed factors and variable factors.• Distinguish between total costs, marginal costs and averagecosts.• Draw diagrams illustrating the relationship between marginalcosts and average costs, and explain the connection withproduction in the short run.
Blink c 6
Example U-tube 3 216
45 HL Only
Production in the longrun: returns to scale
• Distinguish betweenincreasing returns to scale,decreasing returns to scaleand constant returns to scale.
Blink c 6
Example U-tube 3 211
46 HL Only
Costs of production inthe long run
• Outline the relationshipbetween short-run averagecosts and long-run averagecosts.• Explain, using a diagram, thereason for the shape of thelong-run average total costcurve.• Describe factors giving rise toeconomies of scale, includingspecialization, efficiency,marketing and indivisibilities.
Blink c 6
Example U-tube 3 216
Page 17 of 91 webnote 601 (for class of 2013)17

• Describe factors givingrise to diseconomies ofscale, including problemsof coordination andcommunication.
Revenues
47 HL Only
Total revenue, averagerevenue and marginalrevenue
• Distinguish between total revenue, average revenue andmarginal revenue.• Draw diagrams illustrating the relationship between totalrevenue, average revenue and marginal revenue.• Calculate total revenue, average revenue and marginal revenuefrom a set of data and/or diagrams.
Blink c 6
Example U-tube 3 252
ITEM SL
HL
Must KnowMust know very well! Here are the details of what you need to know.
ReadingExample U-tube
W e ight
Webnote
Profit
48 HL Only
Economic profit (sometimes known asabnormal profit) and normal profit (zero economic profit at the breakevenpoint
Describe economic profit (abnormal profit) as the case wheretotal revenue exceeds economic cost.• Describe normal profit (zero economic profit) as the case where total revenue is equal to total economic costs or the situation in which the amount of revenue earned is just sufficient to keep thefirm in its current line of business.• Explain that economic profit (abnormal profit) is profit over and above normal profit (zero economic profit), and that the firm earns normal profit when economic profit (abnormal profit) is zero.• Explain why a firm will continue to operate even when it earns zero economic profit (abnormal profit).• Explain the meaning of
Blink c 6
Example U-tube 3
Page 18 of 91 webnote 601 (for class of 2013)18

loss as negative economic profit arising when total revenue is less than total cost.• Calculate different profit levels from a set of data and/or diagrams.
Goals of firms
49 HL Only
Profit maximization
• Explain the goal of profitmaximization where thedifference between totalrevenue and total cost ismaximized or where marginalrevenue equals marginal cost.
Blink c 6
Example U-tube 2
50 HL Only
Alternative goals of firms
• Describe alternative goalsof firms, including revenuemaximization, growthmaximization, satisficing andcorporate social responsibility.
Blink c 6
Example U-tube 4
Perfect competition
51 HL Only
Assumptions of themodel
• Describe, using examples,the assumed characteristicsof perfect competition: alarge number of firms; ahomogeneous product;freedom of entry and exit;perfect information; perfectresource mobility.
Blink c 7
Example U-tube 4
52 HL Only
Revenue curves
• Explain, using a diagram,the shape of the perfectlycompetitive firm’s averagerevenue and marginal revenuecurves, indicating that theassumptions of perfectcompetition imply that eachfirm is a price taker.• Explain, using a diagram, thatthe perfectly competitivefirm’s average revenue andmarginal revenue curvesare derived from marketequilibrium for the industry.
Blink c 7
Example U-tube 3
item hl sl Must Know Must know very well! Here are the details of what you need to know.
Reading Example U-tube WeI
WEB
Page 19 of 91 webnote 601 (for class of 2013)19

Ght
NOTE
53HL Only
Profit maximization inthe short run
Explain, using diagrams, that it is possible for a perfectly competitive firm to make economic profit (abnormal profit), normal profit (zero economic profit) or negative economic profit in the short run based on the marginal cost and marginal revenue profit maximization rule.
Blink c 7 Example U-tube 3
54 HL Only
Profit maximization inthe long run
Explain, using a diagram, why, in the long run, a perfectly competitive firm will make normal profit (zero economic profit).• Explain, using a diagram, how a perfectly competitive market willmove from short-run equilibrium to long-run equilibrium.
Blink c 7 Example U-tube 3
55 HL Only
Shut-down price andbreak-even price
• Distinguish between the short run shut-down price and the break-even price.• Explain, using a diagram,when a loss-making firmwould shut down in the short run.• Explain, using a diagram,when a loss-making firmwould shut down and exit the market in the long run.• Calculate the short run shutdown price and the breakeven price from a set of data
Blink c 7 Example U-tube 3
56 HL Only
Efficiency • Explain the meaning of the term allocative efficiency.• Explain that the condition for allocative efficiency isP = MC (or, with
Blink c 7 Example U-tube 3
Page 20 of 91 webnote 601 (for class of 2013)20

externalities, MSB = MSC).• Explain, using a diagram,why a perfectly competitivemarket leads to allocativeefficiency in both the shortrun and the long run.• Explain the meaning of the term productive/technicalefficiency.• Explain that the condition for productive efficiency is that production takes place at minimum average total cost.• Explain, using a diagram, why a perfectly competitive firm will be productively efficient in the long run, though not necessarily in the short run.
Monopoly
57 HL Only
Assumptions of themodel
• Describe, using examples,the assumed characteristicsof a monopoly: a singleor dominant firm in themarket; no close substitutes; significant barriers to entry.
Blink c 8 Example U-tube 3
58 HL Only
Barriers to entry
• Describe, using examples,barriers to entry, includingeconomies of scale, branding and legal barriers.
Blink c 8 Example U-tube 3
item hl sl Must Know Must know very well! Here are the details of
Reading Example U-tube We
WE
Page 21 of 91 webnote 601 (for class of 2013)21

what you need to know. IGht
BNOTE
59 HL Only
Revenue curves
• Explain that the averagerevenue curve for amonopolist is the marketdemand curve, which will be downward sloping.• Explain, using a diagram, the relationship between demand, average revenue and marginal revenue in a monopoly.• Explain why a monopolistwill never choose to operate on the inelastic portion of its average revenue curve.
Blink c 8 Example U-tube 3
60 HL Only
Profit maximization
Explain, using a diagram, the short- and long-run equilibriumoutput and pricing decision of a profit maximizing (lossminimizing) monopolist, identifying the firm’s economic profit(abnormal profit), or losses.• Explain the role of barriers to entry in permitting the firm to earneconomic profit (abnormal profit).
Blink c 8 Example U-tube 3
61HL Only
Revenue maximization
• Explain, using a diagram, the output and pricing decision of a revenue maximizing monopoly firm.• Compare and contrast, using a diagram, the equilibrium positions of a profit maximizing monopoly firm and a revenuemaximizing monopoly firm.• Calculate from a set of data and/or diagrams the revenue maximizing level of
Blink c 8 Example U-tube 3
Page 22 of 91 webnote 601 (for class of 2013)22

output.
62 HL Only
Natural monopoly
• With reference to economies of scale, and using examples, explain the meaning of the term “natural monopoly”.• Draw a diagram illustrating a natural monopoly.
Blink c 8 Example U-tube 3
63 HL Only
Monopoly and efficiency
Explain, using diagrams, why the profit maximizing choices of a monopoly firm lead to allocative inefficiency (welfare loss) andproductive inefficiency.• Explain why, despite inefficiencies, a monopoly may be considered desirable for a variety of reasons, including the ability to finance research and development (R&D) from economic profits, the need to innovate to maintain economic profit (abnormal profit), and the possibility of economies of scale.
Blink c 8 Example U-tube 3
64 HL Only
Policies to regulatemonopoly power
• Evaluate the role of legislation and regulation in reducing monopoly power.
Blink c 8 Example U-tube 5
65 HL Only
The advantages anddisadvantages ofmonopoly comparedwith perfect competition
• Draw diagrams and use them to compare and contrast a monopoly market with a perfectly competitivemarket, with reference tofactors including efficiency,price and output, researchand development (R&D) and economies of scale.
Blink cc 6+ 8
Example U-tube 4
item hl sl Must Know Must know very well! Here are the details of what you need to know.
Reading Example U-tube WeIGht
WEBNOTE
Page 23 of 91 webnote 601 (for class of 2013)23

Monopolistic competition
66 HL Only
Assumptions of themodel
• Describe, using examples, the assumed characteristics of a monopolistic competition: a large number of firms; differentiated products; absence of barriers to entryand exit.
Blink c 9 Example U-tube 3
67 HL Only
Revenue curves
• Explain that productdifferentiation leads to a small degree of monopoly power and therefore to a negatively sloping demand curve for the product.
Blink c 9 Example U-tube 3
68 HL Only
Profit maximization inthe short run
• Explain, using a diagram,the short-run equilibriumoutput and pricing decisionsof a profit maximizing(loss minimizing) firm inmonopolistic competition,identifying the firm’seconomic profit (or loss).
Blink c 9 Example U-tube 3
69 HL Only
Profit maximization inthe long run
• Explain, using diagrams,why in the long run a firm inmonopolistic competition will make normal profit.
Blink c 9 Example U-tube 3
70 HL Only
Non-price competition
• Distinguish between pricecompetition and non-pricecompetition.• Describe examples of nonprice competition, including advertising, packaging, product development andquality of service.
Blink c 9 Example U-tube 4
71 HL Only
Monopolisticcompetition andefficiency
• Explain, using a diagram, why neither allocative efficiency nor productive efficiency are achieved by monopolistically competitive firms.
Blink c 9 Example U-tube 3
item hl sl Must Know Must know very well! Reading Example U-tube W W
Page 24 of 91 webnote 601 (for class of 2013)24

Here are the details of what you need to know.
eIGht
EBNOTE
72 HL Only
Monopolisticcompetition comparedwith perfect competitionand monopoly
• Compare and contrast, using diagrams, monopolistic competition with perfect competition, and monopolistic competition with monopoly, with reference to factors including short run, long run, market power, allocative and productive efficiency, number of producers, economies ofscale, ease of entry and exit, size of firms and product differentiation.
Blink cc 6+ 9
Example U-tube 4
Oligopoly
73 HL Only
Assumptions of themodel
• Describe, using examples,the assumed characteristicsof an oligopoly: thedominance of the industryby a small number offirms; the importanceof interdependence;differentiated orhomogeneous products; high barriers to entry.• Explain why interdependence is responsible for the dilemmafaced by oligopolistic firms— whether to compete or to collude.• Explain how a concentration ratio may be used to identify an oligopoly.
Blink c 10
Example U-tube 3
74 HL Only
Game theory • Explain how game theory(the simple prisoner’s
Blink c 10
Example U-tube 3
Page 25 of 91 webnote 601 (for class of 2013)25

dilemma) can illustratestrategic interdependenceand the options available tooligopolies.
75 HL Only
Open/formal collusion
• Explain the term “collusion”, give examples, and state that it is usually (in most countries) illegal.• Explain the term “cartel”.• Explain that the primarygoal of a cartel is to limitcompetition betweenmember firms and tomaximize joint profits as ifthe firms were collectively amonopoly.• Explain the incentive of cartel members to cheat.• Analyse the conditions that make cartel structures difficult to maintain.
Blink c 10
Example U-tube 3
76 HL Only
Tacit/informal collusion
• Describe the term “tacitcollusion”, including reference to price leadership by a dominant firm.
Blink c 10
Example U-tube 3
Non-collusive oligopoly
• Explain that the behaviourof firms in a non-collusiveoligopoly is strategic in order to take account of possible actions by rivals.• Explain, using a diagram, the existence of price rigidities, with reference to the kinked demand curve.• Explain why non-pricecompetition is common inoligopolistic markets, withreference to the risk of pricewars.• Describe, using examples,types of non-price
Blink c 10
Example U-tube 4
Page 26 of 91 webnote 601 (for class of 2013)26

competition.item hl sl Must Know Must know very well!
Here are the details of what you need to know.
Reading Example U-tube WEIGht
WEBNOTE
Price discrimination77 HL Only
Necessary conditionsfor the practice of pricediscrimination
• Describe price discriminationas the practice of chargingdifferent prices to differentconsumer groups for the same product, where the price difference is not justified by differences in cost.• Explain that pricediscrimination may only take place if all of the following conditions exist: the firm must possess some degreeof market power; there must be groups of consumers with differing price elasticities of demand for the product; thefirm must be able to separate groups to ensure that no resale of the product occurs.• Draw a diagram to illustrate how a firm maximizes profit in third degree price discrimination, explaining why the higher price is set in the market with the relatively more inelastic demand.
Blink c 11
Example U-tube 4
TOKTheory of knowledge: potential connectionsIs it rational to take into account costs already incurred in deciding whether a business ventureshould be terminated or whether it should receive more funds?How can we know how to determine the balance of government policy between promotingcompetition in the interest of the consumer and allowing profitability in the interest of firms?
Page 27 of 91 webnote 601 (for class of 2013)27

Section 2: MacroeconomicsExample U-tube
2.1 The level of overall economic activity
Example U-tube
Economic activityitem hl sl Must Know Must know very well!
Here are the details of what you need to know.
Reading Example U-tube WEIGHT
WEBNOTE
78The circular flow ofincome model
• Describe, using a diagram, the circular flow of income between households and firms in a closed economy with no government.• Identify the four factorsof production and theirrespective payments (rent,wages, interest and profit) and explain that these constitute the income flow in the model.• Outline that the income flow is numerically equivalent to the expenditure flow and thevalue of output flow.• Describe, using a diagram, the circular flow of income in an open economy with government and financial markets, referring to leakages/withdrawals (savings, taxesand import expenditure)and injections (investment,government expenditure and export
Example U-tube
Link: See AAA2.1 notes section B item numbers
2 3 4
3 201
202
Page 28 of 91 webnote 601 (for class of 2013)28

revenue).• Explain how the size of the circular flow will changedepending on the relative size of injections and leakages.
79Measures of economicactivity: gross domesticproduct (GDP), and grossnational product (GNP)or gross national income(GNI)
• Distinguish between GDPand GNP/GNI as measures of economic activity.• Distinguish between thenominal value of GDP andGNP/GNI and the real value of GDP and GNP/GNI.• Distinguish between totalGDP and GNP/GNI and percapita GDP and GNP/GNI.• Examine the output approach, the income approach and the expenditure approach whenmeasuring national income.• Evaluate the use of nationalincome statistics, includingtheir use for makingcomparisons over time, their use for making comparisons between countries and theiruse for making conclusionsabout standards of living.• Explain the meaning andsignificance of “green GDP”, a measure of GDP that accounts for environmental destruction.
Example U-tube
Link: See AAA2.1 notes section B item number21
5
80 HL Only
Measures of economicactivity: gross domesticproduct (GDP), and grossnational product (GNP)or gross
• Calculate nominal GDP from sets of national income data, using the expenditure approach.• Calculate GNP/GNI from data• Calculate real GDP, using a price deflator.
Example U-tube
Link: See AAA2.1 notes section B item
3
Page 29 of 91 webnote 601 (for class of 2013)29

national income(GNI)
number14
The business cycle
81Short-term fluctuationsand long-term trend
• Explain, using a business cycle diagram, that economies typically tend to go through a cyclical pattern characterizedby the phases of the business cycle.• Explain the long-term growth trend in the business cyclediagram as the potentialoutput of the economy.• Distinguish between adecrease in GDP and adecrease in GDP growth.
Example U-tube
Link: See AAA2.1 notes section B item number23
4
TOKTheory of knowledge: potential connectionsWhat is the empirical evidence for the existence of the business cycle? How do we decide whetherthis evidence is sufficient?
2.2 Aggregate demand and aggregate supply
Example U-tube
Item hl sl Must Know Must know very well! Here are the details of what you need to know.
Reading Example U-tube WEIGHT
WEBNOTE
Aggregate demand (AD)
82The AD curve • Distinguish between
themicroeconomic concept ofdemand for a product and the macroeconomic concept of aggregate demand.• Construct an aggregatedemand curve.• Explain why the AD curve has a negative slope.
Example U-tube 3
Page 30 of 91 webnote 601 (for class of 2013)30

83The components of AD
• Describe consumption,investment, governmentspending and net exports as the components of aggregate demand.
Example U-tube 3
84The determinants of ADor causes of shifts in theAD curve
• Explain how the AD curvecan be shifted by changesin consumption due tofactors including changesin consumer confidence,interest rates, wealth, personal income taxes (and hence disposable income) and levelof household indebtedness.• Explain how the AD curvecan be shifted by changesin investment due tofactors including interestrates, business confidence,technology, business taxesand the level of corporateindebtedness.• Explain how the AD curvecan be shifted by changes in government spending due to factors including political and economic priorities.• Explain how the AD curvecan be shifted by changesin net exports due to factorsincluding the income oftrading partners, exchangerates and changes in the level of protectionism.
Example U-tube 4
Aggregate supply (AS)
85
The meaning ofaggregate supply
• Describe the term aggregate supply.• Explain, using a diagram,
Example U-tube 3
Page 31 of 91 webnote 601 (for class of 2013)31

why the short-run aggregate supply curve (SRAS curve) is upward sloping.• Explain, using a diagram, how the AS curve in the short run (SRAS) can shift due to factors including changes in resourceprices, changes in businesstaxes and subsidies andsupply shocks.
86 Alternative views ofaggregate supply
• Explain, using a diagram,that the monetarist/newclassical model of the longrun aggregate supply curve (LRAS) is vertical at the level of potential output (full employment output) because aggregate supply in the long run is independent of the price level.• Explain, using a diagram,that the Keynesian model ofthe aggregate supply curvehas three sections becauseof “wage/price” downwardinflexibility and differentlevels of spare capacity in the economy.
Example U-tube 4
87Shifting the aggregatesupply curve over thelong term
• Explain, using the two models above, how factors leading to changes in the quantity and/or quality of factors of production (including improvements in efficiency, new technology, reductions in unemployment, andinstitutional changes) can shift the aggregate supply curve over the long term.
Example U-tube 4
Page 32 of 91 webnote 601 (for class of 2013)32

Item hl sl Must Know Must know very well! Here are the details of what you need to know.
Reading Example U-tube WEIGHT
WEBNOTE
Equilibrium88 Short-run
equilibrium• Explain, using a diagram, the determination of short-run equilibrium, using the SRAS curve.• Examine, using diagrams, the impacts of changes in shortrun equilibrium.
Example U-tube 4
89Equilibrium in monetarist /new classicalmodel
• Explain, using a diagram, the determination of long-run equilibrium, indicating that long-run equilibrium occurs at the full employment level ofoutput.• Explain why, in themonetarist/new classicalapproach, while there maybe short-term fluctuationsin output, the economy willalways return to the fullemployment level of output in the long run.• Examine, using diagrams, the impacts of changes in the long-run equilibrium.
Example U-tube 4
90Equilibrium in theKeynesian model
• Explain, using the Keynesian AD/AS diagram, that the economy may be inequilibrium at any level of real output where AD intersects AS.• Explain, using a diagram,that if the economy is in
Example U-tube 5
Page 33 of 91 webnote 601 (for class of 2013)33

equilibrium at a level ofreal output below the fullemployment level of output,then there is a deflationary(recessionary) gap.• Discuss why, in contrast to the monetarist/new classical model, the economy can remain stuck in a deflationary (recessionary) gap in theKeynesian model.• Explain, using a diagram, that if AD increases in the vertical section of the AS curve, then there is an inflationary gap.• Discuss why, in contrast to the monetarist/new classical model, increases in aggregate demand in the Keynesian AD/AS model need not be inflationary, unless the economy is operating close to, or at, the level of full employment.
The Keynesian multiplier-see below
91HL Only
The Keynesian multiplier
• Explain, with reference tothe concepts of leakages(withdrawals) and injections, the nature and importance of the Keynesian multiplier.
• Calculate the multiplierusing either of the followingformulae.
11MPC
Example U-tube 3
Page 34 of 91 webnote 601 (for class of 2013)34

1MPS + MPT +
MPM• Use the multiplier to calculatethe effect on GDP of a changein an injection in investment,government spending orexports.• Draw a Keynesian AD/ASdiagram to show the impactof the multiplier.
TOKTheory of knowledge: potential connectionsBusiness confidence is a contributing factor to the level of AD. What knowledge issues arise inattempting to measure business confidence?The Keynesian and Monetarist positions differ on the shape of the AS curve. What is needed tosettle this question: empirical evidence (if so, what should be measured?), strength of theoreticalargument, or factors external to economics such as political conviction?
Item hl sl Must Know Must know very well! Here are the details of what you need to know.
ReadingExample U-tube
WEIGHT
WEBNOTE
2.3 Macroeconomic objectives
Example U-tube
Low unemployment
92The meaning ofunemployment
• Define the termunemployment.• Explain how theunemployment rate iscalculated.
Example U-tube 3
Page 35 of 91 webnote 601 (for class of 2013)35

• Explain the difficulties inmeasuring unemployment,including the existence ofhidden unemployment,the existence ofunderemployment, and thefact that it is an average and therefore ignores regional, ethnic, age and gender disparities.
93HL Only
• Calculate the unemployment rate from a set of data.
Example U-tube 3
94Consequences ofunemployment
• Discuss possible economic consequences ofunemployment, includinga loss of GDP, loss of taxrevenue, increased cost ofunemployment benefits, loss of income for individuals, and greater disparities in thedistribution of income.• Discuss possible personaland social consequences ofunemployment, includingincreased crime rates,increased stress levels,increased indebtedness,homelessness and familybreakdown.
Example U-tube 5
95Types and causes ofunemployment
• Describe, using examples,the meaning of frictional,structural, seasonal andcyclical (demand-deficient)unemployment.• Distinguish betweenthe causes of frictional,structural, seasonal and
Example U-tube 5
Page 36 of 91 webnote 601 (for class of 2013)36

cyclical (demand-deficient)unemployment.• Explain, using a diagram, that cyclical unemployment is caused by a fall in aggregate demand.• Explain, using a diagram, that structural unemployment is caused by changes in the demand for particular labour skills, changes in the geographical location ofindustries, and labour market rigidities.• Evaluate government policies to deal with the different types of unemployment.
Low and stable rate of inflation
96 The meaning of inflation,disinflation and deflation
• Distinguish between inflation,disinflation and deflation.• Explain that inflation anddeflation are typicallymeasured by calculating aconsumer price index (CPI),which measures the change in prices of a basket of goodsand services consumed by the average household.• Explain that different income earners may experience adifferent rate of inflation when their pattern of consumption is not accurately reflected bythe CPI.• Explain that inflation figures may not accurately reflect changes in consumption patterns and the quality of theproducts purchased.• Explain that economistsmeasure a core/underlying
Example U-tube 4
Page 37 of 91 webnote 601 (for class of 2013)37

rate of inflation to eliminatethe effect of sudden swings in the prices of food and oil, for example.• Explain that a producer price index measuring changes in the prices of factors of production may be useful in predicting future inflation.
97HL Only
• Construct a weighted price index, using a set of data provided.• Calculate the inflation ratefrom a set of data.
Link: See AAA2.1 notes section B item number16
3
Item hl sl Must Know Must know very well! Here are the details of what you need to know.
Reading Example U-tube WEIGHT
WEBNOTE
98Consequences ofinflation
• Discuss the possibleconsequences of a highinflation rate, includinggreater uncertainty,redistributive effects, lesssaving, and the damage toexport competitiveness.
Example U-tube 5
99Consequences ofdeflation
• Discuss the possibleconsequences of deflation,including high levels ofcyclical unemployment andbankruptcies.
Example U-tube 4
100Types and causes ofinflation
• Explain, using a diagram,that demand-pull inflationis caused by changes in thedeterminants of AD, resulting in an increase in AD.• Explain, using a diagram, that cost-push inflation is caused by an increase in the costs of factors of production, resulting in
Example U-tube 5
Page 38 of 91 webnote 601 (for class of 2013)38

a decrease in SRAS.• Evaluate government policies to deal with the different types of inflation.
101HL Only
Possible relationshipsbetween unemploymentand inflation
• Discuss, using a short-runPhillips curve diagram, theview that there is a possibletrade-off between theunemployment rate and theinflation rate in the short run.• Explain, using a diagram, that the short-run Phillips curve may shift outwards, resultingin stagflation (caused bya decrease in SRAS due tofactors including supplyshocks).• Discuss, using a diagram,the view that there is a longrun Phillips curve that is vertical at the natural rate of unemployment and therefore there is no trade-off between the unemployment rate and theinflation rate in the long run.• Explain that the natural rate of unemployment is therate of unemployment thatexists when the economyis producing at the fullemployment level of output.
Example U-tube 5
Economic growth
102 The meaning ofeconomic growth
• Define economic growth as an increase in real GDP.
Example U-tube 3
103 The meaning of
• Calculate the rate of economic growth from
Example U-tube 3
Page 39 of 91 webnote 601 (for class of 2013)39

HL Only
economic growth
a set of data.
Item hl sl Must Know Must know very well! Here are the details of what you need to know.
Reading Example U-tube WEIGHT
WEBNOTE
104Causes of economicgrowth
• Describe, using a productionpossibilities curve (PPC)diagram, economic growth as an increase in actual output caused by factors including a reduction in unemploymentand increases in productiveefficiency, leading to amovement of a point insidethe PPC to a point closer tothe PPC.• Describe, using a PPCdiagram, economic growthas an increase in production possibilities caused by factors including increases in the quantity and quality of resources, leading to outwardPPC shifts.• Describe, using an LRASdiagram, economic growth as an increase in potential output caused by factors including increases in the quantity and quality of resources, leading toa rightward shift of the LRAS curve.• Explain the importance ofinvestment for economicgrowth, referring toinvestment in physical capital, human capital and natural capital.
Example U-tube 4
104
Page 40 of 91 webnote 601 (for class of 2013)40

• Explain the importance ofimproved productivity foreconomic growth.
105Consequences ofeconomic growth
• Discuss the possibleconsequences of economicgrowth, including the possible impacts on living standards, unemployment, inflation, the distribution of income, the current account of the balance of payments, and sustainability.
Example U-tube 3
Equity in the distribution of income
106The meaning of equityin the distribution ofincome
• Explain the differencebetween equity in thedistribution of income andequality in the distribution ofincome.• Explain that due to unequal ownership of factors of production, the market system may not result in an equitable distribution of income.
Example U-tube 4
107Indicators of incomeequality/inequality
• Analyse data on relativeincome shares of givenpercentages of thepopulation, including deciles and quintiles.• Draw a Lorenz curve andexplain its significance.• Explain how the Ginicoefficient is derived andinterpreted.
Example U-tube 3
108 Poverty• Distinguish between absolute poverty and relative poverty.• Explain possible causesof poverty, including lowincomes, unemployment and lack of human capital.• Explain possibleconsequences of poverty,including low living standards,
Example U-tube 4
Page 41 of 91 webnote 601 (for class of 2013)41

and lack of access to healthcare and education
109The role of taxation inpromoting equity
• Distinguish between directand indirect taxes, providing examples of each, and explainthat direct taxes may be used as a mechanism to redistribute income.• Distinguish betweenprogressive, regressiveand proportional taxation,providing examples of each.
Example U-tube 3
Item hl sl Must Know Must know very well! Here are the details of what you need to know.
Reading Example U-tube WEIGHT
WEBNOTE
110HL Only
The role of taxation inpromoting equity
• Calculate the marginal rate of tax and the average rate of tax from a set of data.
Example U-tube 3
111Other measures topromote equity
• Explain that governmentsundertake expendituresto provide directly, or tosubsidize, a variety of socially desirable goods and services (including health care services,education, and infrastructure that includes sanitation and clean water supplies), therebymaking them available tothose on low incomes.• Explain the term transferpayments, and provideexamples, including old age
Example U-tube 4
Page 42 of 91 webnote 601 (for class of 2013)42

pensions, unemploymentbenefits and child allowances.
112The relationship betweenequity and efficiency
• Evaluate government policies to promote equity (taxation, government expenditure and transfer payments) in termsof their potential positive ornegative effects on efficiency in the allocation of resources.
Example U-tube 5
TOKTheory of knowledge: potential connectionsWhat criteria can be used to order macroeconomic objectives in terms of priority? Are such criteriaexternal to economics (that is, normative)?Is economic growth always beneficial? What could be meant by the word “beneficial”?Is there always a cost to economic growth?The notion of fairness can be approached from a number of perspectives—equality of opportunity,maximizing the income of the least well-off group, and absolute equality of income. Which of thesenotions seems to be most attractive? Why? Examine what each of these perspectives suggests is afair distribution of income.Equality of opportunity implies correcting for social advantage (for example, government mightdevote more resources to the education of a child brought up in less prosperous circumstances thanone brought up in a comfortable home whose parents are university lecturers). How far should thestate go in making such corrections? Should all parents be forced to read to their children so that nochild should be at a disadvantage? Should the state attempt to correct for the uneven distributionof natural abilities such as IQ (intelligence quotient) by devoting proportionally more resources tochildren of less than average IQ.
2.4 Fiscal policy
Example U-tube
The government budget113 Sources of
governmentrevenue
• Explain that the government earns revenue primarily from taxes (direct and indirect), as well as from the sale of goodsand services and the
Example U-tube 3
Page 43 of 91 webnote 601 (for class of 2013)43

sale of state-owned (government owned)enterprises.
Item hl sl Must Know Must know very well! Here are the details of what you need to know.
Reading Example U-tube WEIGHT
WEBNOTE
114Types of governmentexpenditures
• Explain that governmentspending can be classifiedinto current expenditures,capital expenditures andtransfer payments, providing examples of each.
Example U-tube 3
115The budget outcome
• Distinguish between a budget deficit, a budget surplus and a balanced budget.• Explain the relationshipbetween budget deficits/surpluses and the public(government) debt.
Note: Blink does not appear to cover items 115-119 effectively so I will give you additional sources here.
Example U-tube 3
The role of fiscal policy
116Fiscal policy andshort-term demandmanagement
• Explain how changes inthe level of governmentexpenditure and/or taxescan influence the level ofaggregate demand in aneconomy.• Describe the mechanismthrough which expansionary fiscal policy can help an economy close a deflationary (recessionary) gap.• Construct a diagram toshow the potential effects of expansionary fiscal
Example U-tube 4
Page 44 of 91 webnote 601 (for class of 2013)44

policy, outlining the importance ofthe shape of the aggregate supply curve.• Describe the mechanism through which contractionary fiscal policy can help an economy close an inflationary gap.• Construct a diagram toshow the potential effects of contractionary fiscal policy, outlining the importance of the shape of the aggregatesupply curve.
117The impact of automaticstabilizers
• Explain how factors including the progressive tax system and unemployment benefits, which are influenced by the level of economic activity and national income, automatically help stabilize short-term fluctuations.
Example
Portugal uses
bond market to
increase
government
spending:
Portugal held a
sale of its 10-
year bonds
today for the first
time since it
needed a bailout
in 2011.
The sale
represents a
milestone in its
efforts to regain
investor
confidence and
prove its
contested
austerity policies
are paying off.
Portugal had not
sold long-term
debt since it
needed a €78
billion rescue
two years ago.
The three major
U-tube 3
Page 45 of 91 webnote 601 (for class of 2013)45

international
ratings agencies
downgraded
Portugal's credit
worthiness to
junk status as
the debt-heavy
country fell
victim to the euro
zone financial
crisis that
unnerved
investors.
Growing
concerns that
Portugal had too
much debt and
too little growth
made markets
uneasy about
lending it money.Source: rte.ie
118 Fiscal policy and itsimpact on potentialoutput
• Explain that fiscal policy can be used to promote long-term economic growth (increases in potential output) indirectly by creating an economic environment that is favourable to private investment, anddirectly through government spending on physical capital goods and human capital formation, as well as provision of incentives for firms to invest.
Example U-tube 4
119 Evaluation of fiscal policy
• Evaluate the effectivenessof fiscal policy throughconsideration of factorsincluding the ability to target sectors of the economy, the direct impact on aggregatedemand, the effectiveness ofpromoting economic activity in a recession, time lags, political constraints, crowding
Example U-tube 5
Page 46 of 91 webnote 601 (for class of 2013)46

out, and the inability to deal with supply-side causes of instability.
Item hl sl Must Know Must know very well! Here are the details of what you need to know.
Reading Example U-tube
WEIGHT
WEBNOTE
TOKTheory of knowledge: potential connectionsIn one sense the imposition of taxes by government on individuals amounts to a restriction ofindividual freedom. How can we know when such government interference in individual freedomis justified?
2.5 Monetary policy
Example U-tube
120Interest ratedetermination and therole of a central bank
• Describe the role of central banks as regulators of commercial banks andbankers to governments.• Explain that central banks are usually made responsible for interest rates and exchangerates in order to achievemacroeconomic objectives.• Explain, using a demand and supply of money diagram, how equilibrium interest rates are determined, outliningthe role of the central bankin influencing the supply ofmoney.
Example U-tube 4
The role of monetary policy
121Monetary policy andshort-term demandmanagement
• Explain how changes ininterest rates can influence the level of aggregate demand in an economy.• Describe the mechanismthrough which easy(expansionary) monetarypolicy can help an economy
Example U-tube 5
Page 47 of 91 webnote 601 (for class of 2013)47

close a deflationary(recessionary) gap.• Construct a diagram toshow the potential effectsof easy (expansionary)monetary policy, outlining the importance of the shape of the aggregate supply curve.• Describe the mechanismthrough which tight(contractionary) monetarypolicy can help an economyclose an inflationary gap.• Construct a diagram toshow the potential effectsof tight (contractionary)monetary policy, outlining the importance of the shape of the aggregate supply curve.
122 Monetary policy andinflation targeting
• Explain that central banks of certain countries, rather than focusing on the maintenance of both full employment anda low rate of inflation, areguided in their monetarypolicy by the objective toachieve an explicit or implicit inflation rate target.
Example
May 2013
The Japanese
central bank said it
will massively
expand the
country's money
supply to spur
inflation as it strives
to get the world's
third-largest
economy out of its
slump.
The Bank of Japan
ended a two-day
policy today vowing
to achieve a 2%
inflation target at
"the earliest
possible time."
To do so, the
central bank has
launched "a new
U-tube 3
Page 48 of 91 webnote 601 (for class of 2013)48

phase of monetary
easing both in
terms of quantity
and quality" that
will double the
money supply, it
said in a statement.
Source: rte.ie
123 Evaluation of monetarypolicy
• Evaluate the effectivenessof monetary policy throughconsideration of factorsincluding the independenceof the central bank, theability to adjust interest rates incrementally, the ability to implement changes in interest rates relatively quickly, timelags, limited effectivenessin increasing aggregatedemand if the economy is in deep recession and conflict among government economic objectives.
Example U-tube 5
Item hl sl Must Know Must know very well! Here are the details of what you need to know.
Reading
Example U-tube
WEIGHT
WEBNOTE
2.6 Supply-side policies
Example U-tube
The role of supply-side policies
124Supply-side policies andthe economy
• Explain that supply-sidepolicies aim at positivelyaffecting the production side of an economy by improving the institutional framework and the capacity to produce (that is, by changing the quantity and/or
For 2.6 it is a good idea to revise the advantages + dis adv. of the market system in section 1: see webnotes 227, 231and 232.See also items 181-184 in section 2.6 re aid or trade or the market vs intervention in
Example U-tube 4
Page 49 of 91 webnote 601 (for class of 2013)49

quality offactors of production).• State that supply-side policies may be market-based or interventionist, and that in either case they aim to shift the LRAS curve to the right, achieving growth in potentialoutput.
terms of development.
Interventionist supply-side policies
125Investment in humancapital
• Explain how investment ineducation and training willraise the levels of humancapital and have a short-term impact on aggregate demand, but more importantly willincrease LRAS.
Example U-tube 3
126 Investment in newtechnology
• Explain how policies thatencourage research anddevelopment will havea short-term impact onaggregate demand, but more importantly will result in new technologies and will increase LRAS.
Example U-tube 3
127 Investment ininfrastructure
• Explain how increased and improved infrastructure will have a short-term impact on aggregate demand, but more importantly will increase LRAS.
Example U-tube 3
Item hl sl Must Know Must know very well! Here are the details of what you need to know.
Reading Example U-tubeWEIGHT
WEBNOTE
128Industrial policies
• Explain that targeting specific industries through policies including tax cuts, tax allowances and
Example U-tube 3
Page 50 of 91 webnote 601 (for class of 2013)50

subsidized lending promotes growth in key areas of the economy and will have a short-term impact on aggregate demandbut, more importantly, willincrease LRAS.
Market-based supply-side policies
129Policies to encouragecompetition
• Explain how factors including deregulation, privatization, trade liberalization and antimonopoly regulation are used to encourage competition.
See 1.5
Items 58-68
Example U-tube 3
130Labour market reforms
• Explain how factors including reducing the power of labour unions, reducing unemployment benefits and abolishing minimum wages are used to make the labour market more flexible (more responsive to supply and demand).
Example U-tube 3
131Incentive-related policies
• Explain how factors including personal income tax cuts are used to increase the incentive to work, and how cuts in business tax and capital gains tax are used to increase theincentive to invest.
Example U-tube 3
Evaluation of supply-side policies132 The strengths
andweaknesses of supplysidepolicies
• Evaluate the effectiveness of supply-side policies through consideration of factors including time lags, the ability to create employment, theability to reduce inflationarypressure, the impact oneconomic growth, the impact on the government budget, the effect on equity, and the effect on the environment.
Example U-tube 5
Item hl sl Must Know Must know very well! Here are the details of
Reading Example U-tube WE
WE
Page 51 of 91 webnote 601 (for class of 2013)51

what you need to know. IGHT
BNOTE
TOKTheory of knowledge: potential connectionsHow can we know whether government should support pure research, which might contribute tothe sum total of human knowledge but which might never have an impact on technology? Whatother knowledge issues are relevant to investment in pure research?Investment in education and training is a common supply-side policy. What other reasons couldthere be for supporting the education of the population? What knowledge issues arise in answeringthe question as to whether government should shoulder this responsibility or whether it should beleft to the market?
Section 3: International economics
Example U-tube
3.1 International trade
Example U-tube
Free trade
133The benefits of trade
• Explain that gains from trade include lower prices for consumers, greater choice for consumers, the ability of producers to benefit from economies of scale, the ability to acquire needed resources,a more efficient allocationof resources, increasedcompetition, and a source of foreign exchange.
Example U-tube 3
134HL Only
Absolute andcomparative advantage
• Explain the theory of absolute advantage.• Explain, using a diagram, the gains from trade arising from a country’s absolute advantage in the production of a good.• Explain the theory ofcomparative advantage.• Describe the sources ofcomparative advantage,
Example U-tube 4
Page 52 of 91 webnote 601 (for class of 2013)52

including the differencesbetween countries in factorendowments and the levels of technology.• Draw a diagram to showcomparative advantage.• Calculate opportunity costs from a set of data in order to identify comparative advantage.• Draw a diagram to illustrate comparative advantage froma set of data.• Discuss the real-world relevance and limitations of the theory of comparative advantage, considering factors including the assumptions on whichit rests, and the costs andbenefits of specialization (afull discussion must take into account arguments in favour and against free trade and protection—see below).
135 The World TradeOrganization (WTO
• Describe the objectives and functions of the WTO.
Example U-tube 3
Item hl sl Must Know Must know very well! Here are the details of what you need to know.
Reading Example U-tube WEIGHT
WEBNOTE
Restrictions on free trade: Trade protection
Example U-tube
136Types of trade protection
• Explain, using a tariff diagram, the effects of imposing a tariff on imported goods on different stakeholders,including domestic producers, foreign producers, consumersand the government.• Explain, using a
Example U-tube 4
Page 53 of 91 webnote 601 (for class of 2013)53

diagram, the effects of setting a quota on foreign producers on different stakeholders, including domestic producers, foreignproducers, consumers and the government.• Explain, using a diagram, the effects of giving a subsidy to domestic producers on different stakeholders, including domestic producers,foreign producers, consumers and the government.• Describe administrativebarriers that may be used as a means of protection.• Evaluate the effect of different types of trade protection.
137HL Only
Types of trade protection
• Calculate from diagrams the effects of imposing a tariff on imported goods on different stakeholders, including domestic producers, foreignproducers, consumers and the government.• Calculate from diagrams the effects of setting a quota on foreign producers on different stakeholders, including domestic producers, foreign producers, consumers and the government.• Calculate from diagrams the effects of giving a subsidy to domestic producers on different stakeholders, including domestic producers,foreign producers, consumers and the government.
Example U-tube 3
138Arguments for andagainst trade protection(arguments against andfor free trade)
• Discuss the arguments infavour of trade protection,including the protection ofdomestic jobs, national security, protection of
Example U-tube 5
Page 54 of 91 webnote 601 (for class of 2013)54

infant industries, the maintenance of health, safety and environmental standards, anti-dumping and unfair competition, a meansof overcoming a balance ofpayments deficit and a source of government revenue.• Discuss the arguments against trade protection, including a misallocation of resources, the danger of retaliation and “trade wars”, the potential for corruption, increased costs of production due to lack of competition, higher prices for domestic consumers, increasedcosts of imported factors ofproduction and reduced export competitiveness.
TOKTheory of knowledge: potential connectionsAre there moral as well as economic arguments in favour of free trade?
Item hl sl Must Know Must know very well! Here are the details of what you need to know.
Reading Example U-tube WEIGHT
WEBNOTE
3.2 Exchange rates
Example U-tube
Freely floating exchange rates
139Determination of freelyfloating exchange rates
• Explain that the value of an exchange rate in a floating system is determined by thedemand for, and supply of, a currency.• Draw a diagram to showdetermination of exchangerates in a floating exchange
Example U-tube 3
Page 55 of 91 webnote 601 (for class of 2013)55

rate system.
140HL Only
Determination of freelyfloating exchange rates
• Calculate the value of onecurrency in terms of another currency.• Calculate the exchange rate for linear demand and supply functions.• Plot demand and supplycurves for a currency fromlinear functions and identifythe equilibrium exchange rate.• Using exchange rates,calculate the price of a good in different currencies.
Example U-tube 3
141Causes of changes in theexchange rate
• Describe the factors thatlead to changes in currencydemand and supply, including foreign demand for a country’s exports, domestic demand for imports, relativeinterest rates, relative inflation rates, investment from overseas in a country’s firms (foreign direct investment and portfolio investment) and speculation.• Distinguish between adepreciation of the currencyand an appreciation of thecurrency.• Draw diagrams to showchanges in the demand for,and supply of, a currency.
Example U-tube 3
142HL Only
Causes of changes in theexchange rate
• Calculate the changes in the value of a currency from a setof data.
Example U-tube 3
Page 56 of 91 webnote 601 (for class of 2013)56

143 The effects of exchangerate changes
• Evaluate the possibleeconomic consequences ofa change in the value of acurrency, including the effects on a country’s inflation rate, employment, economic growth and current account balance.
Example U-tube 5
Item hl sl Must Know Must know very well! Here are the details of what you need to know.
Reading Example U-tube WEIGHT
WEBNOTE
Government intervention
Example U-tube
144Fixed exchange rates
• Describe a fixed exchange rate system involving commitmentto a single fixed rate.• Distinguish between adevaluation of a currency and a revaluation of a currency.• Explain, using a diagram,how a fixed exchange rate is maintained.
Example U-tube 4
145Managed exchange rates(managed float)
• Explain how a managedexchange rate operates, with reference to the fact that there is a periodic government intervention to influence the value of an exchange rate.• Examine the possibleconsequences of overvalued and undervalued currencies.
No info in Blink. Use webnotes and resources in LRC
See also PPP as this concept is relevant to PPP. See webnote 415 in Section 3
NOTE:There is a link here with item 32 in section 1.3Take a look at web 223 and buffer stock systems.Same diagram for both concepts. See item 168.
4See also Web 223.
146Evaluation of differentexchange rate systems
• Compare and contrast a fixed exchange rate system with a floating exchange rate system, with reference to factors including the degree of certainty for
Example U-tube 4
Page 57 of 91 webnote 601 (for class of 2013)57

stakeholders, ease of adjustment, the role of international reserves in theform of foreign currencies and flexibility offered to policy makers.
3.3 The balance of payments
Example U-tube
The structure of the balance of payments147 The meaning
of thebalance of payments
• Outline the role of the balance of payments.• Distinguish between debititems and credit items in the balance of payments.
Item hl sl Must Know Must know very well! Here are the details of what you need to know.
Reading Example U-tube WEIGHT
WEBNOTE
148The components of thebalance of paymentsaccounts
• Explain the four components of the current account, specifically the balance of trade in goods, the balance of trade in services, income and current transfers.• Distinguish between a current account deficit and a current account surplus.• Explain the two components of the capital account, specifically capital transfers and transaction in non produced, non-financial
Example U-tube 3
Page 58 of 91 webnote 601 (for class of 2013)58

assets.• Explain the three maincomponents of the financialaccount, specifically, directinvestment, portfolioinvestment and reserve assets.
149HL Only
The components of thebalance of paymentsaccounts
• Calculate elements of thebalance of payments from aset of data.
Example U-tube 3
150The relationshipsbetween the accounts
• Explain that the currentaccount balance is equal tothe sum of the capital account and financial account balances (see the appendix, “The balance of payments” at end of this document page 62).• Examine how the currentaccount and the financialaccount are interdependent.
Example U-tube 3
Current account deficits
151The relationship betweenthe current account andthe exchange rate
• Explain why a deficit in the current account of the balance of payments may result in downward pressure on the exchange rate of the currency.
Example U-tube 3
152HL Only
Implications of apersistent currentaccount deficit
• Discuss the implicationsof a persistent currentaccount deficit, referringto factors including foreignownership of domestic assets, exchange rates, interest rates, indebtedness, internationalcredit ratings and demandmanagement.
Example U-tube 3
153 Methods to correct
• Explain the methods that a government can 5
Page 59 of 91 webnote 601 (for class of 2013)59

HL Only
a persistent currentaccount deficit
use to correct a persistent current account deficit, including expenditure switching policies, expenditure reducing policiesand supply-side policies, toincrease competitiveness.• Evaluate the effectivenessof the policies to correct apersistent current accountdeficit.
Item hl sl Must Know Must know very well! Here are the details of what you need to know.
Reading Example U-tube WEIGHT
WEBNOTE
154HL Only
The Marshall-Lernercondition and the J-curveeffect
• State the Marshall-Lernercondition and apply itto explain the effects ofdepreciation/devaluation.• Explain the J-curve effect,with reference to the Marshall-Lerner condition.
See webnotes 414 and 417 in Section 3
Example U-tube 3
Current account surpluses
155The relationship betweenthe current account andthe exchange rate
• Explain why a surplus in the current account of the balance of payments may result in upward pressure on the exchange rate of the currency.
Example U-tube 3
156HL Only
Implications of apersistent currentaccount surplus
• Discuss the possibleconsequences of a risingcurrent account surplus,including lower domesticconsumption and investment,as well as the appreciation
Example U-tube 4
Page 60 of 91 webnote 601 (for class of 2013)60

of the domestic currencyand reduced exportcompetitiveness.3.4 Economic integration
Example U-tube
Forms of economic integration157 Preferential
tradeagreements
• Distinguish between bilateral and multilateral (WTO) trade agreements.• Explain that preferential trade agreements give preferential access to certain products from certain countries by reducing or eliminating tariffs,or by other agreementsrelating to trade.
Example U-tube 3
Item hl sl Must Know Must know very well! Here are the details of what you need to know.
Reading Example U-tube WEIGHT
WEBNOTE
158Trading blocs • Distinguish between
a freetrade area, a customs unionand a common market.• Explain that economicintegration will increasecompetition among producerswithin the trading bloc.• Compare and contrast thedifferent types of tradingblocs.
Example U-tube 3
159HL Only
Trading blocs • Explain the concepts of trade creation and trade diversion in a customs union.• Explain that different forms of economic integration allow member countries to gain from economies of scale.
Example U-tube 3
160Monetary union
• Explain that a monetary union is a common market with a
Example U-tube 4
Page 61 of 91 webnote 601 (for class of 2013)61

common currency and a common central bank.• Discuss the possibleadvantages anddisadvantages of a monetary union for its members.
TOKTheory of knowledge: potential connectionsWhat criteria can be used to assess the benefits and the costs of increased economic integration?Might increased economic integration ever be considered undesirable?
3.5 Terms of trade (HL only)
Example U-tube
The meaning of the terms of trade161HL Only
Measurement • Explain the meaning of the terms of trade.• Explain how the terms of trade are measured.• Distinguish betweenan improvement and adeterioration in the terms oftrade.• Calculate the terms of trade using the equation: Index of average export prices/index of average import prices x 100.
Example U-tube 3
Item hl sl Must Know Must know very well! Here are the details of what you need to know.
Reading Example U-tube WEIGHT
WEBNOTE
162HL Only
Causes of changes in the terms of trade
• Explain that the terms of trade may change in the short term due to changes in demand conditions for exports and imports, changes in globalsupply of key inputs (suchas oil), changes in relativeinflation rates and changes in relative exchange rates.• Explain that the terms of
Example U-tube 3
Page 62 of 91 webnote 601 (for class of 2013)62

trade may change in thelong term due to changes inworld income levels, changes in productivity within the country and technological developments.
163HL Only
Consequences ofchanges in the terms oftrade
• Explain how changes in the terms of trade in the long term may result in a global redistribution of income.• Examine the effects ofchanges in the terms oftrade on a country’s currentaccount, using the concepts of price elasticity of demand for exports and imports.• Explain the impacts ofshort-term fluctuations andlong-term deterioration in the terms of trade of economically less developed countriesthat specialize in primarycommodities, using theconcepts of price elasticityof demand and supply forprimary products and income elasticity of demand.
Reading Example U-tube 3
Section 4: Development economics
Example U-tube
4.1 Economic development
Example U-tube
The nature of economic growth and economic development
164x x Economic
growth andeconomic development
• Distinguish betweeneconomic growth andeconomic development.• Explain the multidimensional
Reading
See Blink pp 330-
Example U-tube 5
Page 63 of 91 webnote 601 (for class of 2013)63

nature of economicdevelopment in terms ofreducing widespread poverty, raising living standards, reducing income inequalities and increasing employment opportunities.• Explain that the mostimportant sources ofeconomic growth ineconomically less developed countries include increases in quantities of physical capital and human capital, the development and use of new technologies that areappropriate to the conditions of the economically lessdeveloped countries, andinstitutional changes.• Explain the relationshipbetween economic growthand economic development, noting that some limited economic development is possible in the absence of economic growth, but that over the long term economic growth is usually necessary for economic development (however, it should be understood that under certain circumstances economic growth may not lead to economic development).
334
165 x x Common characteristicsof economically lessdeveloped countries
• Explain, using examples, that economically less developed countries share certain common characteristics (noting that it is dangerous to generalize as there aremany exceptions in eachcase), including low levels of GDP per capita, high levels of
Reading
See poverty cycle in Blink p 344 or another version in webnote517
Example
UNICEF estimates that 25% of children in the world are malnourished
U-tube
5
Page 64 of 91 webnote 601 (for class of 2013)64

poverty, relatively large agricultural sectors, large urban informal sectors and high birth rates.• Explain that in some countries there may be communities caught in a poverty trap (poverty cycle) where poor communities are unable to invest in physical, human and natural capital due tolow or no savings;poverty istherefore transmitted fromgeneration to generation,and there is a need forintervention to break out ofthe cycle.
Item hl sl Must Know Must know very well! Here are the details of what you need to know.
Reading Example U-tube WEIGHT
WEBNOTE
166x x Diversity
amongeconomically lessdeveloped nations
• Explain, using examples, that economically less developed countries differ enormously from each other in terms of avariety of factors, includingresource endowments,climate, history (colonial orotherwise), political systems and degree of political stability.
Example U-tube 5
167x x International
development goals
• Outline the current status of international development goals, including the Millennium Development Goals.
Example U-tube 5
TOKTheory of knowledge: potential connectionsWhat are the knowledge issues involved in compiling a list of development goals?
Page 65 of 91 webnote 601 (for class of 2013)65

Does the term “economic development” mean different things in different cultures?Are there two ways of thinking about economics: from the point of view of an economically moredeveloped country or from that of an economically less developed country? If so, what is thedifference? Are there two different sets of values in which such a distinction is grounded?How can we decide if the distinction between economically more developed countries andeconomically less developed countries is a meaningful one given that economic development itselfmight not be so clearly defined?
4.2 Measuring development
Example U-tube
Measurement methods
168 Single indicators
• Distinguish between GDP per capita figures and GNI per capita figures.• Compare and contrast theGDP per capita figures andthe GNI per capita figures for economically more developed countries and economically less developed countries.• Distinguish between GDP per capita figures and GDP per capita figures at purchasing power parity (PPP) exchange rates.• Compare and contrast GDP per capita figures and GDP per capita figures at purchasing power parity (PPP) exchange rates for economically moredeveloped countries andeconomically less developed countries.• Compare and contrasttwo health indicators foreconomically more developed countries and economically lessdeveloped countries.• Compare and contrast twoeducation indicators foreconomically more developed countries and economically lessdeveloped countries.
PPP is covered in section 3.2 under exch. Rates. See item 145 in syllabusSee web 415.
Example U-tube 3
See web 415
Page 66 of 91 webnote 601 (for class of 2013)66

169 Composite indicators
• Explain that compositeindicators include morethan one measure and soare considered to be betterindicators of economicdevelopment.• Explain the measuresthat make up the HumanDevelopment Index (HDI).• Compare and contrast the HDIfigures for economically more developed countries and economically less developed countries.• Explain why a country’s GDP/GNI per capita global ranking may be lower, or higher, than its HDI global ranking.
Example U-tube 3
Item hl sl Must Know Must know very well! Here are the details of what you need to know.
Reading Example U-tube WEIGHT
WEBNOTE
TOKTheory of knowledge: potential connectionsWhat criteria could we use to determine whether a particular method for measuring development iseffective?What knowledge issues might be encountered in constructing a composite indicator to measuredevelopment?
4.3 The role of domestic factors
Example U-tube
Domestic factors and economic development
170Domestic factors
• With reference to a specific developing economy, andusing appropriate
Example U-tube 4
Page 67 of 91 webnote 601 (for class of 2013)67

diagramswhere relevant, examine how the following factors contribute to economic development.a. Education and healthb. The use of appropriatetechnologyc. Access to credit andmicro-creditd. The empowerment ofwomene. Income distribution4.4 The role of international trade
Example U-tube
International trade and economic development171 Trade
problems facingmany economically lessdeveloped countries
• With reference to specificexamples, explain howthe following factors arebarriers to development foreconomically less developed countries.a. Over-specializationon a narrow range ofproductsb. Price volatility of primaryproductsc. Inability to accessinternational markets
Take a look at section 3.1 for item C making a clear connection with trade protectionism e.g use of tariffs by DC’s see web 404
3
Item hl sl Must Know Must know very well! Here are the details of what you need to know.
Reading
Example U-tube
WEIGHT
WEBNOTE
Page 68 of 91 webnote 601 (for class of 2013)68

172HL only
Trade problems facingmany economically lessdeveloped countries
• With reference to specificexamples, explain how thefollowing factor is a barrier to development for economically less developed countries.a. Long-term changes inthe terms of trade
Example U-tube 3
173Trade strategies foreconomic growth andeconomic development
• With reference to specificexamples, evaluate each ofthe following as a means ofachieving economic growthand economic development.a. Import substitutionb. Export promotionc. Trade liberalizationd. The role of the WTOe. Bilateral and regionalpreferential tradeagreementsf. Diversification
Example U-tube 3
4.5 The role of foreign direct investment (FDI)
Example U-tube
Foreign direct investment and multinational corporations (MNCs)
174The meaning of FDI andMNCs
• Describe the nature of foreign direct investment (FDI) and multinational corporations (MNCs).• Explain the reasons why MNCs expand into economically less developed countries.• Describe the characteristicsof economically lessdeveloped countries that
Example U-tube 3
Page 69 of 91 webnote 601 (for class of 2013)69

attract FDI, including low cost factor inputs, a regulatory framework that favours profit repatriation and favourable tax rules.
175 Advantages anddisadvantages of FDIfor economically lessdeveloped countries
• Evaluate the impact of foreign direct investment (FDI) for economically less developed countries.
Example U-tube 5
4.6 The roles of foreign aid and multilateral development assistance
Example U-tube
Item hl sl Must Know Must know very well! Here are the details of what you need to know.
Reading Example U-tube WEIGHT
WEBNOTE
Foreign aid
176Classifications and typesof aid
• Explain that aid is extended to economically less developed countries either by governments of donor countries, in which case it is called official development assistance (ODA), or by nongovernmentalorganizations NGOs).• Explain that humanitarian aid consists of food aid, medical aid and emergency relief aid.• Explain that
Example U-tube 3
Page 70 of 91 webnote 601 (for class of 2013)70

developmentaid consists of grants,concessional long-term loans, project aid that includes support for schools and hospitals, and programme aid that includes support forsectors such as the education sector and the financial sector.• Explain that, for the mostpart, the priority of NGOsis to provide aid on a smallscale to achieve development objectives.• Explain that aid might alsocome in the form of tied aid.• Explain the motivations ofeconomically more developed countries giving aid.• Compare and contrast theextent, nature and sources of ODA to two economically less developed countries.
177Evaluation of foreign aid
• Evaluate the effectiveness of foreign aid in contributing to economic development.• Compare and contrast theroles of aid and trade ineconomic development.
Example U-tube 5
Multilateral development assistance
178The roles of theInternational MonetaryFund (IMF) and the WorldBank
• Examine the current rolesof the IMF and the WorldBank in promoting economic development.
Example U-tube 3
Page 71 of 91 webnote 601 (for class of 2013)71

4.7 The role of international debt
Example U-tube
Foreign debtItem hl sl Must Know Must know very well!
Here are the details of what you need to know.
Reading Example U-tube WEIGHT
WEBNOTE
179Foreign debt and itsconsequences
• Outline the meaning offoreign debt and explain why countries borrow from foreign creditors.• Explain that in some cases countries have become heavily indebted, requiring rescheduling of the debt payments and/or conditional assistance from international organizations, including the IMF and the World Bank.• Explain why the servicingof international debt causesbalance of paymentsproblems and has anopportunity cost in termsof foregone spending ondevelopment objectives.• Explain that the burden ofdebt has led to pressure tocancel the debt of heavilyindebted countries.
Example U-tube 3
TOKTheory of knowledge: potential connections
Page 72 of 91 webnote 601 (for class of 2013)72

For each factor, what would you consider to be sufficient evidence that it plays a role in enhancing orinhibiting development?
4.8 The balance between markets and intervention
Example U-tube
Strengths and weaknesses of market-oriented policies
180Strengths • Discuss the positive
outcomes of market-oriented policies(such as liberalized trade and capital flows, privatization andderegulation), including a more efficient allocation of resources and economic growth.
For 4.8 it is a good idea to revise the advantages + dis adv. of the market system in section 1: see webnotes 227, 231 and 232.See also items 125-133 in section 2.6 re Supply Side policies.
Example U-tube 5
181 Weaknesses• Discuss the negativeoutcomes of market-oriented strategies, including market failure, the development of a dual economy and income inequalities.
See also items 124 to 132 in the syllabus as this concept is useful
Example U-tube 5
Strengths and weaknesses of interventionist policies
Item hl sl Must Know Must know very well! Here are the details of what you need to know.
Reading Example U-tube WEIGHT
WEBNOTE
182Strengths • Discuss the strengths
ofinterventionist policies,including the provision ofinfrastructure, investment in human capital, the provision of
Example U-tube 5
Page 73 of 91 webnote 601 (for class of 2013)73

a stable macroeconomiceconomy and the provision of a social safety net.
183Weaknesses • Discuss the
limitations ofinterventionist policies,including excessivebureaucracy, poor planningand corruption.
Example U-tube 5
184
Market with governmentintervention
• Explain the importance ofgood governance in thedevelopment process.• Discuss the view thateconomic development may best be achieved through a complementary approach, involving a balance of market oriented policies and government intervention.
Example U-tube 5
TOKTheory of knowledge: potential connectionsWhat criteria can economists use to decide on the balance between markets and intervention?Is development economics dependent upon external normative notions such as what constitutes agood or fulfilled life?
Example U-tube
THE END.
….. Or maybe just the beginning!!!
Notes:
This note refers to syllabus item 150
Page 74 of 91 webnote 601 (for class of 2013)74

Structure of the balance of paymentsWhile the structure of the balance of payments may vary from country to country, a working version of the structure (and components) of the balance of payments is given below and must be used by DP economics students for the purposes of the curriculum and assessment.
Current account• Balance of trade in goods
• Balance of trade in services
• Income
• Current transfers Capital account • Capital transfers
• Transactions in non-produced, non-financial assets Financial account
• Direct investment
• Portfolio investment
• Reserve assetsCurrent account = capital account + financial account + errors and omissions
IB ASSESSMENT – OFFICIAL IB DOCUMENTATION
Note formatting is not the best but I will revise this. B
Assessment
Assessment in the Diploma ProgrammeGeneralAssessment is an integral part of teaching and learning. The most important aims of assessment in the Diploma Programme are that it should support curricular goals and encourage appropriate student learning. Both external and internal assessment are used in
Page 75 of 91 webnote 601 (for class of 2013)75

the Diploma Programme. IB examiners mark work produced for external assessment, while work produced for internal assessment is marked by teachers and externally moderated by the IB.There are two types of assessment identified by the IB.• Formative assessment informs both teaching and learning. It is concerned with providing accurate and helpful feedback to students and teachers on the kind of learning taking place and the nature of students’ strengths and weaknesses in order to help develop students’ understanding and capabilities. Formative assessment can also help to improve teaching quality, as it can provide information to monitor progress towards meeting the course aims and objectives.• Summative assessment gives an overview of previous learning and is concerned with measuring student achievement.The Diploma Programme primarily focuses on summative assessment designed to record student achievement at, or towards the end of, the course of study. However, many of the assessment instruments can also be used formatively during the course of teaching and learning, and teachers are encouraged to do this. A comprehensive assessment plan is viewed as being integral with teaching, learning and course organization. For further information, see the IB Programme standards and practices document.The approach to assessment used by the IB is criterion-related, not norm-referenced. This approach to assessment judges students’ work by their performance in relation to identified levels of attainment, and not in relation to the work of other students. For further information on assessment within the Diploma Programme please refer to the publication Diploma Programme assessment: Principles and practice.To support teachers in the planning, delivery and assessment of the Diploma Programme courses, a variety of resources can be found on the OCC or purchased from the IB store (http://store.ibo.org). Teacher support materials, subject reports, internal assessment guidance, grade descriptors, as well as resources from other teachers, can be found on the OCC. Specimen and past examination papers, as well as markschemes, can be purchased from the IB store.
Methods of assessmentThe IB uses several methods to assess work produced by students.Assessment criteriaAssessment criteria are used when the assessment task is open-ended. Each criterion concentrates on a particular skill that students are expected to demonstrate. An assessment objective describes what students should be able to do and assessment criteria describe how well they should be able to do it. Using assessment criteria allows discrimination between different answers and encourages a variety of responses.74 Economics guideEach criterion comprises a set of hierarchically ordered level descriptors. Each level descriptor is worth one or more marks. Each criterion is applied independently using a best-fit model. The maximum marks for each criterion may differ according to the criterion’s importance. The marks awarded for each criterion are added together to give the total mark for the piece of work.MarkbandsMarkbands are a comprehensive statement of expected performance against which responses are judged. They represent a single holistic criterion divided into level descriptors. Each level descriptor corresponds to a range of marks to differentiate student performance. A best-fit approach is used to ascertain which particular mark to use from the possible range for each level descriptor.MarkschemesThis generic term is used to describe analytic markschemes that are prepared for specific examination papers. Analytic markschemes are prepared for those examination questions that expect a particular kind of response and/or a given final answer from the students. They give detailed instructions to examiners on how to break down the total mark for each question for different parts of the response. A markscheme may include the content expected in the responses to questions or may be a series of marking notes giving guidance on how to apply criteria.Economics guide 75
Page 76 of 91 webnote 601 (for class of 2013)76

Assessment in the Diploma ProgrammeAssessment
Assessment outline—SLFirst examinations 2013Assessment componentWeightingExternal assessment (3 hours) Paper 1 (1 hour and 30 minutes)An extended response paper (50 marks)Assessment objectives 1, 2, 3, 4Section ASyllabus content: section 1—microeconomicsStudents answer one question from a choice of two. (25 marks) Section BSyllabus content: section 2—macroeconomicsStudents answer one question from a choice of two. (25 marks)Paper 2 (1 hour and 30 minutes)A data response paper (40 marks)Assessment objectives 1, 2, 3, 4Section ASyllabus content: section 3—international economics Students answer one question from a choice of two. (20 marks) Section BSyllabus content: section 4—development economics Students answer one question from a choice of two. (20 marks)80% 40%40%Internal assessment (20 teaching hours)This component is internally assessed by the teacher and externally moderated by the IB at the end of the course.Students produce a portfolio of three commentaries, based on different sections of the syllabus and on published extracts from the news media.Maximum 750 words x 3 (45 marks)20%76 Economics guideAssessment
Assessment outline—HLFirst examinations 2013Assessment componentWeightingExternal assessment (4 hours) Paper 1 (1 hour and 30 minutes)An extended response paper (50 marks)Assessment objectives 1, 2, 3, 4Section ASyllabus content: section 1—microeconomicsStudents answer one question from a choice of two. (25 marks) Section BSyllabus content: section 2—macroeconomicsStudents answer one question from a choice of two. (25 marks)Paper 2 (1 hour and 30 minutes)A data response paper (40 marks)Assessment objectives 1, 2, 3, 4Section ASyllabus content: section 3—international economics Students answer one question from a choice of two. (20 marks) Section BSyllabus content: section 4—development economics Students answer one question from a choice of two. (20 marks)Paper 3 (1 hour)HL extension paper (50 marks) Assessment objectives 1, 2 and 4Syllabus content, including HL extension material: sections 1 to 4—microeconomics, macroeconomics, international economics, development economicsStudents answer two questions from a choice of three. (25 marks per question)
Page 77 of 91 webnote 601 (for class of 2013)77

80% 30%30%20%Economics guide 77Assessment outline—HLAssessment componentWeightingInternal assessment (20 teaching hours)This component is internally assessed by the teacher and externally moderated by the IB at the end of the course.Students produce a portfolio of three commentaries, based on different sections of the syllabus and on published extracts from the news media.Maximum 750 words x 3 (45 marks)20%78 Economics guideAssessment
External assessmentTwo different methods are used to assess students.• Detailed markschemes specific to each examination paper• MarkbandsFor all three examination papers, there are markbands and markschemes. The markbands are related to the assessment objectives established for the economics course and the group 3 grade descriptors. The markschemes are specific to each examination paper.
Written papersThe external assessment in economics consists of two examination papers at SL and three examination papers at HL that are externally set and externally moderated. They are designed to allow students to demonstrate their competencies in relation to the economics assessment objectives and specific parts of the economics syllabus, namely the common topics and the HL extension material. All questions on the examination papers will be based on the topics in this guide.The external components contribute 80% to the final assessment at both SL and HL.In common with all examination papers, students at SL and HL are given five minutes of reading time before they begin answering the papers.Command termsTeachers must ensure that students are aware of the command terms used at each assessment objective level to understand the depth of treatment required in examination questions. There is a progression in demand from AO1 to AO3, while AO4 terms are specific to particular skills and techniques, and also to examination questions.Questions may be from the same classification as specified in the learning outcomes, or a less demanding command term from a lower classification. For example, if the command term in the learning outcome is “explain”, which is classified as AO2, an examination question could contain the command term “explain” or another command term, such as “suggest”, which is also classified as AO2. Alternatively, the examination question could contain a command term from AO1, such as “describe”. However, a more demanding command term, such as “evaluate”, from a higher classification (AO3 in this case), cannot be used.The command terms used in each question or part thereof indicate the depth required. Please refer in particular to the section “Command terms” in “Assessment objectives in practice”. See also the external assessment details below and “Glossary of command terms”.Use of diagramsStudents are expected, where appropriate, to include correctly labelled and clearly drawn diagrams. Sometimes individual questions specify that the use of diagrams is essential because more detailed information is required from the students in order to show specific knowledge and understanding.Economics guide 79External assessmentUse of examplesStudents are expected, where appropriate, to illustrate their answers with examples in order
Page 78 of 91 webnote 601 (for class of 2013)78

to reach the highest markbands. Examples should be used to highlight economic concepts, theories and relationships in the real world. When examples are used, students should not just state the example (as this is too limited), but should also offer some explanation of the example in relation to the question asked.Use of economic termsStudents are expected to demonstrate the ability to define the economic terms included in the syllabus details.Use of calculators Paper 1 and paper 2 (SL/HL)Calculators are not permitted.Paper 3 (HL only)While all questions requiring a calculator can be answered fully using a four function (plus, minus, multiply, divide) calculator, graphic display calculators (GDCs) are allowed during the examination. The graphing functions on these calculators may assist students and it is therefore recommended that all students are familiar with the use of GDCs.Teachers and schools must adhere to the regulations regarding the use of electronic calculators in examinations, and students must be made aware of these. This information can be found in the relevant section of the Handbook of procedures for the Diploma Programme.Links to the specific details in the syllabusExamination questions will be drawn from sections 1 to 4 of the syllabus, not from the foundations of economics or from any introductory section covered by the teacher (as outlined in “Approaches to the teaching of economics”). The questions will be drawn from the specific topic areas and will reflect the command terms used to describe the learning outcomes.
External assessment details—SLPaper 1Duration: 1 hour 30 minutesWeighting: 40%The structure of this paper is the same as HL paper 1 but the questions that require extended responses may be the same as, or different from, the HL paper 1 questions.• Students answer two questions in total, one from section A and one from section B.• In each section, students are required to answer one question from a choice of two.• The questions are each subdivided into two parts, (a) and (b).80Economics guideStudents are expected to demonstrate the following assessment objectives.External assessmentAssessment objectiveSections A and B: Part (a)Sections A and B: Part (b)AO1—knowledge and understandingAO2—application and analysisAO3—synthesis and evaluationAO4—selection, use and application of a variety of appropriate skills and techniquesSection A• The principal focus is on section 1 of the syllabus—microeconomics.• While the principal focus of the questions is on section 1, it is likely that students will be required to draw on other sections of the syllabus.• The command terms used in each question, or part thereof, indicate the depth required.• Part (a) of each question requires knowledge and understanding, application and analysis and the selection, use and application of a variety of appropriate skills and techniques. The maximum for this part is 10 marks.• Part (b) of each question requires knowledge and understanding, application and analysis,
Page 79 of 91 webnote 601 (for class of 2013)79

synthesis and evaluation, and the selection, use and application of a variety of appropriate skills and techniques. The maximum for this part is 15 marks.• The section A question is worth a total of 25 marks.Section B• The principal focus is on section 2 of the syllabus—macroeconomics.• While the principal focus of the questions is on section 2, it is likely that students will be required to draw on other sections of the syllabus.• The command terms used in each question, or part thereof, indicate the depth required.• Part (a) of each question requires knowledge and understanding, application and analysis, and the selection, use and application of a variety of appropriate skills and techniques. The maximum for this part is 10 marks.• Part (b) of each question requires knowledge and understanding, application and analysis, synthesis and evaluation, and the selection, use and application of a variety of appropriate skills and techniques. The maximum for this part is 15 marks.• The section B question is worth a total of 25 marks.Responses are assessed with an analytic markscheme specific to the question paper, which indicates the required responses, any particular breakdown of marks and the markbands used to allocate marks.Overall, the maximum for paper 1 is 50 marks.Economics guide 81External assessmentPaper 2Duration: 1 hour 30 minutesWeighting: 40%The structure of this paper is the same as HL paper 2. However, these data response questions may be the same as, or different from, those used for the HL paper.The text/data used may not be the same at SL and at HL.• Students answer two questions in total, one from section A and one from section B.• In each section, students are required to answer one question from a choice of two.• The questions are each subdivided into four parts, (a), (b), (c) and (d). Students are expected to demonstrate the following assessment objectives.Assessment objectiveSections A and B: Part (a)Sections A and B: Part (b)Sections A and B: Part (c)Sections A and B: Part (d)AO1—knowledge and understandingAO2—application and analysisAO3—synthesis and evaluationAO4—selection, use and applicationof a variety of appropriate skills and techniquesSection A• The principal focus is on section 3 of the syllabus—international economics.• While the principal focus of the questions is on section 3, it is likely that students will be required to draw on other sections of the syllabus.• The command terms used in each question, or part thereof, indicate the depth required.• Part (a) of each question requires knowledge and understanding. It is subdivided into (i) and (ii). The maximum for each of these is 2 marks, with a combined maximum of 4 marks.• Part (b) of each question requires knowledge and understanding, application and analysis, and selection, use and application of a variety of appropriate skills and techniques. The
Page 80 of 91 webnote 601 (for class of 2013)80

maximum for this part is 4 marks.• Part (c) of each question requires knowledge and understanding, application and analysis, and selection, use and application of a variety of appropriate skills and techniques. The maximum for this part is 4 marks.• Part (d) of each question requires knowledge and understanding, application and analysis, and synthesis and evaluation. The maximum for this part is 8 marks.• The section A question is worth a total of 20 marks.82Economics guideSection B• The principal focus is on section 4 of the syllabus—development economics.• While the principal focus of the questions is on section 4, it is likely that students will be required to draw on other sections of the syllabus.• The command terms used in each question, or part thereof, indicate the depth required.• Part (a) of each question requires knowledge and understanding. It is subdivided into (i) and (ii). The maximum for each of these is 2 marks, with a combined maximum of 4 marks.• Part (b) of each question requires knowledge and understanding, application and analysis, and selection, use and application of a variety of appropriate skills and techniques. The maximum for this part is 4 marks.• Part (c) of each question requires knowledge and understanding, application and analysis, and selection, use and application of a variety of appropriate skills and techniques. The maximum for this part is 4 marks.• Part (d) of each question requires knowledge and understanding, application and analysis, and synthesis and evaluation. The maximum for this part is 8 marks.• The section B question is worth a total of 20 marks.Responses are assessed with an analytic markscheme specific to the question paper, which indicates the required responses, any particular breakdown of marks and the markbands used to allocate marks.Overall, the maximum for paper 2 is 40 marks.
External assessment details—HLPaper 1Duration: 1 hour 30 minutesWeighting: 30%The structure of this paper is the same as SL paper 1. However, the questions that require extended responses may be the same as, or different from, the SL paper 1 questions.Please see the section “External assessment details—SL”, for further details.Paper 2Duration: 1 hour 30 minutesWeighting: 30%The structure of this paper is the same as SL paper 2. However, these data response questions may be the same as, or different from, the SL paper.The texts/data used may not be the same as at SL.Please see the section “External assessment details—SL”, for further details.Paper 3Duration: 1 hourWeighting: 20%• Students answer two questions in total, from a choice of three questions.• The questions are each subdivided into a number of parts. The number of parts will vary.Economics guide 83External assessmentExternal assessmentStudents are expected to demonstrate the following assessment objectives.Assessment objectiveAll questionsAO1—knowledge and understandingAO2—application and analysis
Page 81 of 91 webnote 601 (for class of 2013)81

AO3—synthesis and evaluationAO4—selection, use and application of a variety of appropriate skills and techniquesExamination questions• The focus of the questions is on the syllabus content from sections 1 to 4, including the HL extension material and topics studied at HL only.• The command terms used indicate the depth of response required.• Each question requires knowledge and understanding, application and analysis, and selection, use and application of a variety of appropriate skills and techniques.• Many question parts require the use of a calculator. Graphic display calculators (GDCs) are allowed during the examination, and students should be familiar with their use. Full details are given in the section “Use of calculators”.• Each question is worth 25 marks.• A question and answer booklet will be provided, and additional answer sheets may be used if necessary.Responses are assessed with an analytic markscheme specific to the question paper, which indicates the required responses and any particular breakdown of marks. A markband approach is used to allocate the marks for questions using AO2 command terms, such as “explain”. The markband descriptors will vary depending on the content of the examination. A typical example is given below.LevelLevel descriptorMarks 0–40The work does not reach a standard described by the descriptors below.01The written response is limited.1–22The written response is clear.3–4Overall, the maximum for this paper is 50 marks.84 Economics guideExternal assessment
External assessment markbands—SL and HLPaper 1 (SL/HL)Section A and section B Part (a)LevelLevel descriptorMarks 0–100The work does not reach a standard described by the descriptors below.01There is little understanding of the specific demands of the question. Relevant economic terms are not defined.There is very little knowledge of relevant economic theory.There are significant errors.1–32There is some understanding of the specific demands of the question. Some relevant economic terms are defined.There is some knowledge of relevant economic theory.There are some errors.4–63There is understanding of the specific demands of the question. Relevant economic terms are defined.
Page 82 of 91 webnote 601 (for class of 2013)82

Relevant economic theory is explained and applied.Where appropriate, diagrams are included and applied.Where appropriate, examples are used. There are few errors.7–84There is clear understanding of the specific demands of the question. Relevant economic terms are clearly defined.Relevant economic theory is clearly explained and applied.Where appropriate, diagrams are included and applied effectively. Where appropriate, examples are used effectively.There are no significant errors.9–10Economics guide 85External assessmentSection A and section B Part (b)LevelLevel descriptorMarks 0–150The work does not reach a standard described by the descriptors below.01There is little understanding of the specific demands of the question. Relevant economic terms are not defined.There is very little knowledge of relevant economic theory.There are significant errors.1–52There is some understanding of the specific demands of the question. Some relevant economic terms are defined.There is some knowledge of relevant economic theory.There are some errors.6–93There is understanding of the specific demands of the question. Relevant economic terms are defined.Relevant economic theory is explained and applied.Where appropriate, diagrams are included and applied.Where appropriate, examples are used.There is an attempt at synthesis or evaluation. There are few errors.10–124There is clear understanding of the specific demands of the question. Relevant economic terms are clearly defined.Relevant economic theory is clearly explained and applied.Where appropriate, diagrams are included and applied effectively. Where appropriate, examples are used effectively.There is evidence of appropriate synthesis or evaluation. There are no significant errors.13–1586 Economics guideExternal assessmentPaper 2 (SL/HL)Section A and section B Part (a): (i) and (ii)Part (b) and part (c)OrPart (d)LevelLevel descriptorMarks 0–20
Page 83 of 91 webnote 601 (for class of 2013)83

The work does not reach a standard described by the descriptors below.01There is limited understanding or vague definition.12There is clear understanding or accurate definition.2LevelLevel descriptorMarks 0–40The work does not reach a standard described by the descriptors below.01The written response is limited.1–22The written response is accurate.3–4LevelLevel descriptorMarks 0–40The work does not reach a standard described by the descriptors below.01There is a correct diagram or an accurate written response.1–22There is a correct diagram and an accurate written response.3–4LevelLevel descriptorMarks 0–80The work does not reach a standard described by the descriptors below.01Few relevant concepts are recognized. There is basic knowledge/understanding.1–22Relevant concepts are recognized and developed in reasonable depth. There is clear knowledge/understanding.There is some attempt at application/analysis.3–53Relevant concepts are recognized and developed in reasonable depth. There is clear knowledge/understanding.There is effective application/analysis.There is synthesis/evaluation, supported by appropriate theory and evidence.6–8Economics guide 87Assessment
Internal assessmentPurpose of internal assessmentInternal assessment is an integral part of the course and is compulsory for both SL and HL students. It enables students to demonstrate the application of their skills and knowledge, and
Page 84 of 91 webnote 601 (for class of 2013)84

to pursue their personal interests, without the time limitations and other constraints that are associated with written examinations. The internal assessment should, as far as possible, be woven into normal classroom teaching and not be a separate activity conducted after a course has been taught.The internal assessment requirements at SL and at HL are the same.
Guidance and authenticityThe portfolio submitted for internal assessment must be the student’s own work. However, it is not the intention that students should decide on the appropriate articles and then be left to work on the internally assessed component without any further support from the teacher. The teacher should play an important role during both the planning stage and the period when the student is working on the internally assessed work. It is the responsibility of the teacher to ensure that students are familiar with:• the requirements of the type of work to be internally assessed—the nature of the sources of the articles, and the formal requirements of the portfolio—and the IB’s academic honesty policy• internal deadlines• the nature of teacher support• the assessment criteria; students must understand that the work submitted for assessment must address these criteria effectively.Teachers and students must discuss the internally assessed work. Students should be encouraged to initiate discussions with the teacher to obtain advice and information, and students must not be penalized for seeking guidance. However, if a student could not have completed the work without substantial support from the teacher, this should be recorded on the appropriate form from the Handbook of procedures for the Diploma Programme.It is the responsibility of teachers to ensure that all students understand the basic meaning and significance of concepts that relate to academic honesty, especially authenticity and intellectual property. Teachers must ensure that all student work for assessment is prepared according to the requirements and must explain clearly to students that internally assessed work must be entirely their own.As part of the learning process, teachers can give advice to students on a first draft of the internally assessed work. This advice should be in terms of the way the work could be improved, but this first draft must not be heavily annotated or edited by the teacher. The next version handed to the teacher after the first draft must be the final one.All work submitted to the IB for moderation or assessment must be authenticated by a teacher, and must not include any known instances of suspected or confirmed malpractice. Each student must sign the coversheet for internal assessment to confirm that the work is his or her authentic work and constitutes the88 Economics guidefinal version of the work. Once a student has officially submitted the final version of the work to a teacher (or the coordinator) for internal assessment, together with the signed coversheet, it cannot be retracted.Authenticity may be checked by discussion with the student on the content of the work and scrutiny of one or more of the following:• the student’s initial choice of articles• the first draft of the written work• the references cited• the style of writing compared with work known to be that of the student.The requirement for teachers and students to sign the coversheet for internal assessment applies to the work of all students, not just the sample work that will be submitted to an examiner for the purpose of moderation. If the teacher and student sign a coversheet, but there is a comment to the effect that the work may not be authentic, the student will not be eligible for a mark in that component and no grade will be awarded. For further details refer to the IB publication Academic honesty and the relevant articles in the General regulations: Diploma Programme.The same piece of work cannot be submitted to meet the requirements of both the internal assessment and the extended essay.
Time allocationInternal assessment is an integral part of the economics course, contributing 20% to the final
Page 85 of 91 webnote 601 (for class of 2013)85

assessment in the SL and the HL courses. This weighting should be reflected in the time that is allocated to teaching the knowledge, skills and understanding required to undertake the work, as well as the total time allocated to carry out the work.It is recommended that a total of approximately 20 hours should be allocated to the portfolio at both SL and HL. This should include:• time for the teacher to explain to students the requirements of the internal assessment• class time for students to work on the internal assessment component• time for consultation between the teacher and each student• time to review and monitor progress and to check authenticity.
Requirements and recommendationsIt is important for the integrity of the moderation process that the internal assessment by the teacher is based on the same evidence as that available to the moderator.When there is more than one teacher teaching students in this component, internal standardization must take place.Economics guide 89Internal assessmentInternal assessment
Using assessment criteria for internal assessmentFor internal assessment, a number of assessment criteria have been identified. Each assessment criterion has level descriptors describing specific levels of achievement together with an appropriate range of marks. The level descriptors concentrate on positive achievement although, for the lower levels, failure to achieve may be included in the description.Teachers must judge the internally assessed work at SL and at HL against the criteria using the level descriptors.• The same assessment criteria are provided for SL and HL.• The aim is to find, for each criterion, the descriptor that conveys most accurately the level attained by the student, using the best-fit model. A best-fit approach means that compensation should be made when a piece of work matches different aspects of a criterion at different levels. The mark awarded should be one that most fairly reflects the balance of achievement against the criterion. It is not necessary for every single aspect of a level descriptor to be met for that mark to be awarded.• When assessing a student’s work, teachers should read the level descriptors for each criterion until they reach a descriptor that most appropriately describes the level of the work being assessed. If a piece of work seems to fall between two descriptors, both descriptors should be read again and the one that more appropriately describes the student’s work should be chosen.• Where there are two or more marks available within a level, teachers should award the upper marks if the student’s work demonstrates the qualities described to a great extent. Teachers should award the lower marks if the student’s work demonstrates the qualities described to a lesser extent.• Only whole numbers should be recorded; partial marks, that is, fractions and decimals, are not acceptable.• Teachers should not think in terms of a pass or fail boundary, but should concentrate on identifying the appropriate descriptor for each assessment criterion.• The highest level descriptors do not imply faultless performance but should be achievable by a student. Teachers should not hesitate to use the extremes if they are appropriate descriptions of the work being assessed.• A student who attains a high level of achievement in relation to one criterion will not necessarily attain high levels of achievement in relation to the other criteria. Similarly, a student who attains a low level of achievement for one criterion will not necessarily attain low achievement levels for the other criteria. Teachers should not assume that the overall assessment of the students will produce any particular distribution of marks.• It is recommended that the assessment criteria be made available to students.90Economics guide
Page 86 of 91 webnote 601 (for class of 2013)86

Internal assessment details—SL and HLPortfolioDuration: 20 hours Weighting: 20%RationaleInternal assessment in economics enables students to demonstrate the application of their knowledge and understanding of economic theory to real-world situations.RequirementsBoth SL and HL economics students produce a portfolio of three commentaries based on articles frompublished news media. Each article must be based on a different section of the syllabus (microeconomics, macroeconomics, international economics and development economics).ArticlesThe articles may be from a newspaper, a journal or the internet, but must not be from television or radio broadcasts. If a student includes a relatively lengthy article, which is very much discouraged, the student must highlight the section(s) of the article upon which the commentary is based.The article on which the commentary is based should, where possible, be in the same language as the commentary. If an extract in another language is used, the student must provide an accurate translation of the whole article. Students must also include the original article in their portfolio.Individual workStudents must select their own articles to discuss. It may happen that more than one student bases his or her commentary on the same article, but the article must not be given to the class by the teacher, and the production of the commentary must be each student’s individual work. A commentary must not be prepared collaboratively.FocusEach commentary must:• explain the linkages between the article and economic theory taken from the section of the syllabus on which the article is based• demonstrate economic insights into the implications of the article (that is, it should provide evidence of the student’s ability to discuss current events from the point of view of an economist).On each commentary students must record:• the title of the article• the source of the article (including date of access to the site if from the internet)• the date the article was published• the date the commentary was written• the word count of the commentary• the section of the syllabus to which the article relates.Each commentary in the portfolio is assessed individually against the internal assessment criteria. The teacher will initially assess each student’s work. Please note that internal standardization must take place when more than one teacher is assessing. A sample of the work will then be moderated by the IB.Economics guide 91Internal assessmentInternal assessmentPlease refer to the Handbook of procedures for the Diploma Programme for details on how to present the work for moderation.Rubric requirementsIf students do not adhere to the following requirements, they can lose marks under criterion F: Rubric requirements.1. Word limitStudents must produce a portfolio of three commentaries. Each commentary must not exceed 750 words.The following are not included in the word count.• Acknowledgments• Contents page• Diagrams
Page 87 of 91 webnote 601 (for class of 2013)87

• Labels—of five words or fewer• Headings on diagrams—of 10 words or fewer• Tables of statistical data• Equations, formulae and calculations• Citations (which, if used, must be in the body of the commentary)• References (which, if used, must be in the footnotes/endnotes)Please note that footnotes/endnotes may be used for references only. Definitions of economic terms and quotations, if used, must be in the body of the work and are included in the word count. Please note that a citation is a shorthand method of making a reference in the body of the commentary, which is then linked to the full reference in the footnotes/endnotes.2. ArticlesEach article must be based on a different section of the syllabus.3. SourcesStudents must use a different source for each commentary.4. Contemporary articlesStudents need to look for articles relating to current events and these must be published no earlier than one year before the writing of the commentary.5. ContentsEach portfolio must contain:• a summary portfolio coversheet• a commentary coversheet for each commentary• three commentaries, accompanied in each case by the relevant article.92Economics guideNote: Moderators will not read beyond 750 words for each commentary.
Internal assessment criteria—SL and HLOverviewThere are five internal assessment criteria for each commentary.Internal assessmentCriterion ADiagrams3 marksCriterion BTerminology2 marksCriterion CApplication2 marksCriterion DAnalysis3 marksCriterion EEvaluation4 marksTotal14 marksThere is one internal assessment criterion for the whole portfolio.Each commentary is assessed individually for the first five assessment criteria (criteria A–E) and then criterion F is applied to the whole portfolio.The maximum for the portfolio is 45 marks: (14 marks x 3 commentaries) + 3 marks = 42 + 3 marks. The assessment criteria are related to the assessment objectives.• Criterion A: AO2 and AO4• Criterion B: AO1• Criterion C: AO2• Criterion D: AO2• Criterion E: AO3• Criterion F: AO4Portfolio (SL/HL) Criterion A: Diagrams• This criterion assesses the extent to which the student is able to construct and use
Page 88 of 91 webnote 601 (for class of 2013)88

diagrams.Criterion FRubric requirements3 marksLevelDescriptor0The work does not reach a standard described by the descriptors below.1Relevant diagram(s) are included but not explained, or the explanations are incorrect.2Relevant, accurate and correctly labelled diagram(s) are included, with a limited explanation.3Relevant, accurate and correctly labelled diagram(s) are included, with a full explanation.Economics guide 93Internal assessmentCriterion B: Terminology• This criterion assesses the extent to which the student uses appropriate economic terminology.Criterion C: Application• This criterion assesses the extent to which the student recognizes, understands and applies economic information in the context of the article.Criterion D: Analysis• This criterion assesses the extent to which the student can explain and develop appropriate economic theories and/or concepts in the context of the article.LevelDescriptor0The work does not reach a standard described by the descriptors below.1Terminology relevant to the article is included in the commentary.2Terminology relevant to the article is used appropriately throughout the commentary.LevelDescriptor0The work does not reach a standard described by the descriptors below.1Relevant economic concepts and/or theories are applied to the article.2Relevant economic concepts and/or theories are applied to the article appropriately throughout the commentary.LevelDescriptor0The work does not reach a standard described by the descriptors below.1There is limited economic analysis relating to the article.2There is appropriate economic analysis relating to the article.3There is effective economic analysis relating to the article.Criterion E: Evaluation• This criterion assesses the extent to which the student synthesizes his or her analysis in order to make judgments that are supported by reasoned arguments.LevelDescriptor0The work does not reach a standard described by the descriptors below.1
Page 89 of 91 webnote 601 (for class of 2013)89

Judgments are made that are unsupported, or supported, by incorrect reasoning.2Judgments are made that are supported by limited reasoning.3Judgments are made that are supported by appropriate reasoning.4Judgments are made that are supported by effective and balanced reasoning.94Economics guideInternal assessmentCriterion F: Rubric requirements• This criterion assesses the extent to which the student meets the five rubric requirements for the complete portfolio.– Each commentary does not exceed 750 words.– Each article is based on a different section of the syllabus.– Each article is taken from a different and appropriate source.– Each article was published no earlier than one year before the writing of the commentary.– The summary portfolio coversheet, three commentary coversheets and the article for each commentary are included.LevelDescriptor0The work does not reach a standard described by the descriptors below.1Three rubric requirements are met.2Four rubric requirements are met.3All five rubric requirements are met.Economics guide 95Appendices
Glossary of command termsCommand terms with definitionsStudents should be familiar with the following key terms and phrases used in examination questions, which are to be understood as described below. Although these terms will be used frequently in examination questions, other terms may be used to direct students to present an argument in a specific way.The assessment objectives (AOs) listed in the table are those referred to in the economics syllabus.Command term: AnalyseApplyCalculateCommentCompareCompare and contrastConstruct ContrastDefine DeriveDescribe Determine DiscussAO2 AO2 AO4 AO2 AO3 AO3AO4 AO3AO1 AO4AO1 AO4 AO3Definition asks students to:Break down in order to bring out the essential elements or structure.Use an idea, equation, principle, theory or law in relation to a given problem or issue.Obtain a numerical answer showing the relevant stages in the working.Give a judgment based on a given statement or result of a calculation.Give an account of the similarities between two (or more) items or situations, referring to both (all) of them throughout.
Page 90 of 91 webnote 601 (for class of 2013)90

Give an account of similarities and differences between two (or more) items or situations, referring to both (all) of them throughout.Display information in a diagrammatic or logical form.Give an account of the differences between two (or more) items or situations, referring to both (all) of them throughout.Give the precise meaning of a word, phrase, concept or physical quantity.Manipulate a mathematical relationship to give a new equation or relationship.Give a detailed account.Obtain the only possible answer.Offer a considered and balanced review that includes a range of arguments, factors or hypotheses. Opinions or conclusions should be presented clearly and supported by appropriate evidence.96Economics guideDistinguish DrawEvaluate ExamineExplain Identify JustifyLabelList Measure Outline PlotShow Show thatSketchSolve StateSuggestTo what extentAO2 Make clear the differences between two or more concepts or items.AO4 Represent by means of a labelled, accurate diagram or graph, using a pencil. A ruler (straight edge) should be used for straight lines. Diagrams should be drawn to scale. Graphs should have points correctly plotted (if appropriate) and joined in a straight line or smooth curve.AO3 Make an appraisal by weighing up the strengths and limitations.AO3 Consider an argument or concept in a way that uncovers the assumptions and interrelationships of the issue.AO2 Give a detailed account including reasons or causes.AO4 Provide an answer from a number of possibilities.AO3 Give valid reasons or evidence to support an answer or conclusion.AO4 Add labels to a diagram.AO1 Give a sequence of brief answers with no explanation. AO4 Obtain a value for a quantity.AO1 Give a brief account or summary.AO4 Mark the position of points on a diagram.AO4 Give the steps in a calculation or derivation.AO4 Obtain the required result (possibly using information given) without the formality of proof. “Show that” questions do not generally require the use of a calculator.AO4 Represent by means of a diagram or graph (labelled as appropriate). The sketch should give a general idea of the required shape or relationship, and should include relevant features.AO4 Obtain the answer(s) using algebraic and/or numerical and/or graphical methods.AO1 Give a specific name, value or other brief answer without explanation or calculation.AO2 Propose a solution, hypothesis or other possible answer.
AO3 Consider the merits or otherwise of an argument or concept. Opinions and conclusions should be presented clearly and supported with appropriate evidence and sound argument.
sessment
Assessment in the Diploma Programme
Page 91 of 91 webnote 601 (for class of 2013)91